1. Introduction
Internal Solitary Waves (ISWs) are fluctuations caused by density differences within water bodies, typically occurring in the deep ocean. These waves result from a balance between nonlinear wave-steepening processes and linear wave dispersion. ISWs characterized by significant amplitudes and robust current velocities are extensively observed in regions surrounding the edge of the continental shelf, abrupt subsurface inclines of islands and seamounts, and sills within straits. Since they predominantly occur in areas where robust barotropic tidal currents traverse steep topographical features or interact with thermoclines [
1], ISWs not only alter the distribution of temperature and salinity, which impacts biological habitats, but may also threaten the stability of ecosystems [
2,
3]. Moreover, the abrupt flow changes induced by ISWs can heighten navigation risks for ships and jeopardize the stability of marine engineering structures [
4,
5,
6]. Consequently, a comprehensive understanding and precise identification of oceanic ISWs are crucial for protecting marine ecosystems and ensuring the safety of marine economic activities.
Early research on oceanic ISWs primarily relied on physical models and traditional signal processing techniques, such as the Fourier transform and wavelet transform [
7,
8]. While effective under certain conditions, these methods often fail to capture the diversity and dynamic characteristics of ISWs, due to their distinct nonlinear characteristics and the complexity of the marine environment. With advances in remote sensing technology and data acquisition methods, researchers have increasingly analyzed ISWs using satellite imagery and ocean observation data [
9,
10]. The rise of deep learning in the 21st century has brought new opportunities for this field. Researchers have found that deep learning can automatically extract features, eliminating the subjectivity of manually assigned features, thus significantly enhancing the accuracy and efficiency of ISW identification.
In recent years, Convolutional Neural Networks (CNNs) have achieved remarkable success in remote sensing image processing tasks [
11,
12]. Utilizing multi-layer convolutional and pooling operations, CNNs effectively capture local features within images, making them highly suitable for feature extraction from marine remote sensing data. Some CNN-based models analyze satellite images of the ocean surface, constructing multi-level feature representations that enable high performance when handling complex ocean data [
13]. The identification and extraction of ISWs from marine remote sensing images using CNNs primarily employ two methods: object detection and semantic segmentation. Object detection uses bounding boxes to locate ISWs. For example, Bao et al. [
14] applied the Faster R-CNN network to an automatic ISW detection in the South China Sea (SCS). Semantic segmentation involves delineating the crest lines of ISWs. For instance, Zheng et al. [
15] utilized the Mask R-CNN network to segment ISW stripes. However, current CNN-based models still face challenges in learning global features and require further development.
In addition, the U-Net architecture and its variants [
16,
17,
18], such as TransUNet [
19], have been applied to ISW identification and have become a popular choice for ISW identification due to their superior feature extraction and image segmentation capabilities. Through its encoder–decoder structure and skip connections, U-Net effectively integrates multi-level feature information, enabling the extraction of key ISW features while preserving image details [
20].
With advancements in computational power and the expansion of datasets, researchers are exploring methods that combine various deep learning techniques. For instance, combining U-Net with Long Short-Term Memory Networks (LSTMs) [
21] improves the handling of time series data, capturing the time-varying characteristics of ISWs. Additionally, some studies have introduced emerging technologies, such as Generative Adversarial Networks (GANs), to enhance model robustness by generating synthetic data [
22,
23].
Beyond model innovations, advances in data acquisition and processing technologies have also supported the research on ISW identification research. The development of drone and satellite remote sensing technologies enables researchers to obtain high-resolution ocean surface images and other relevant data [
24,
25,
26], providing a solid foundation for training deep learning models. By integrating remote sensing with deep learning models, it is possible to monitor ISWs in the ocean [
27,
28,
29], improving spatial coverage and temporal resolution for ISW identification.
Currently, most of the research work on ISW identification relies on Synthetic Aperture Radar (SAR) images; however, this method often yields suboptimal results under complex sea conditions. It is necessary to introduce ocean thermocline variabilities to resist the disturbance due to severe weather. This study uses the ocean dataset produced by a high-resolution numerical model, including but not limited to the sea surface height and three-dimensional sea temperature, while considering the slender, linear characteristics of ISWs, to achieve a precise identification in complex marine environments. The use of model data not only reduces the dependence of the identification method on SAR data but also accounts for the temperature gradient within the ocean, mitigating the effects of high sea states.
This paper is organized as follows:
Section 1 offers a comprehensive introduction to the ISWs identification.
Section 2 describes the processing of model data and the proposed ISW identification network.
Section 3 presents the experimental results and performance of the network.
Section 4 discusses the distribution characteristics of ISWs and the identification effectiveness of the model in the study area, and
Section 5 concludes the paper.
2. Materials and Methods
2.1. Study Area and Dataset Creation
The study area is located in the SCS, specifically between 115.31° E and 123.64° E longitude, and 9.89° N and 17.14° N latitude, focusing on the identification of ISWs within the Luzon Strait. The Luzon Strait region is characterized by unique topography and complex oceanic background, which make it conducive to the generation and propagation of ISWs [
30,
31]. This region provides a wealth of samples suitable for training the ISW identification network.
The data source used in this study is the LLC4320 dataset, which contains various oceanic variables, including sea surface height (SSH), flow (zonal and meridional velocities), temperature, and salinity. The LLC4320 dataset is a 1/48° global ocean model dataset produced by MITgcm, developed to support oceanographic research by providing high-resolution global ocean simulations for the upcoming Surface Water and Ocean Topography (SWOT) mission. The dataset has a spatial resolution of 2.3 km. From this source, 360 data entries, each containing different oceanic variables, were selected. We further assigned the region around Luzon Strait, extracted data and manually annotated ISWs to compile the training dataset.
Due to the subtle appearance of ISWs in the sea surface height data, labeling ISWs manually is difficult. To cope with it, we apply a central difference filter [
32] to the sea surface height to enhance the high-frequency features of ISWs so that ISWs are more distinguishable from the disturbed background. Central difference filtering is a widely used numerical method primarily employed to remove low-frequency signals while emphasizing high-frequency variations. This is achieved by calculating the difference between a data point and its neighboring points, thereby enhancing high-frequency features in the signals or data. For ISWs in sea surface height data, the wave peaks are typically characterized by prominent high-frequency fluctuations that may be obscured or difficult to detect in the raw data. By applying central difference filtering, the contrast of these wave peaks is enhanced, allowing for clearer identification of the morphology of the ISWs. Additionally, central difference filtering effectively removes low-frequency information, such as background noise or long-period fluctuations, from the smooth sections of the waveforms. This process preserves the fast-varying components of the data, which is essential for manual labeling and improving the performance of identification models. The formula for the central difference is shown in Equation (1).
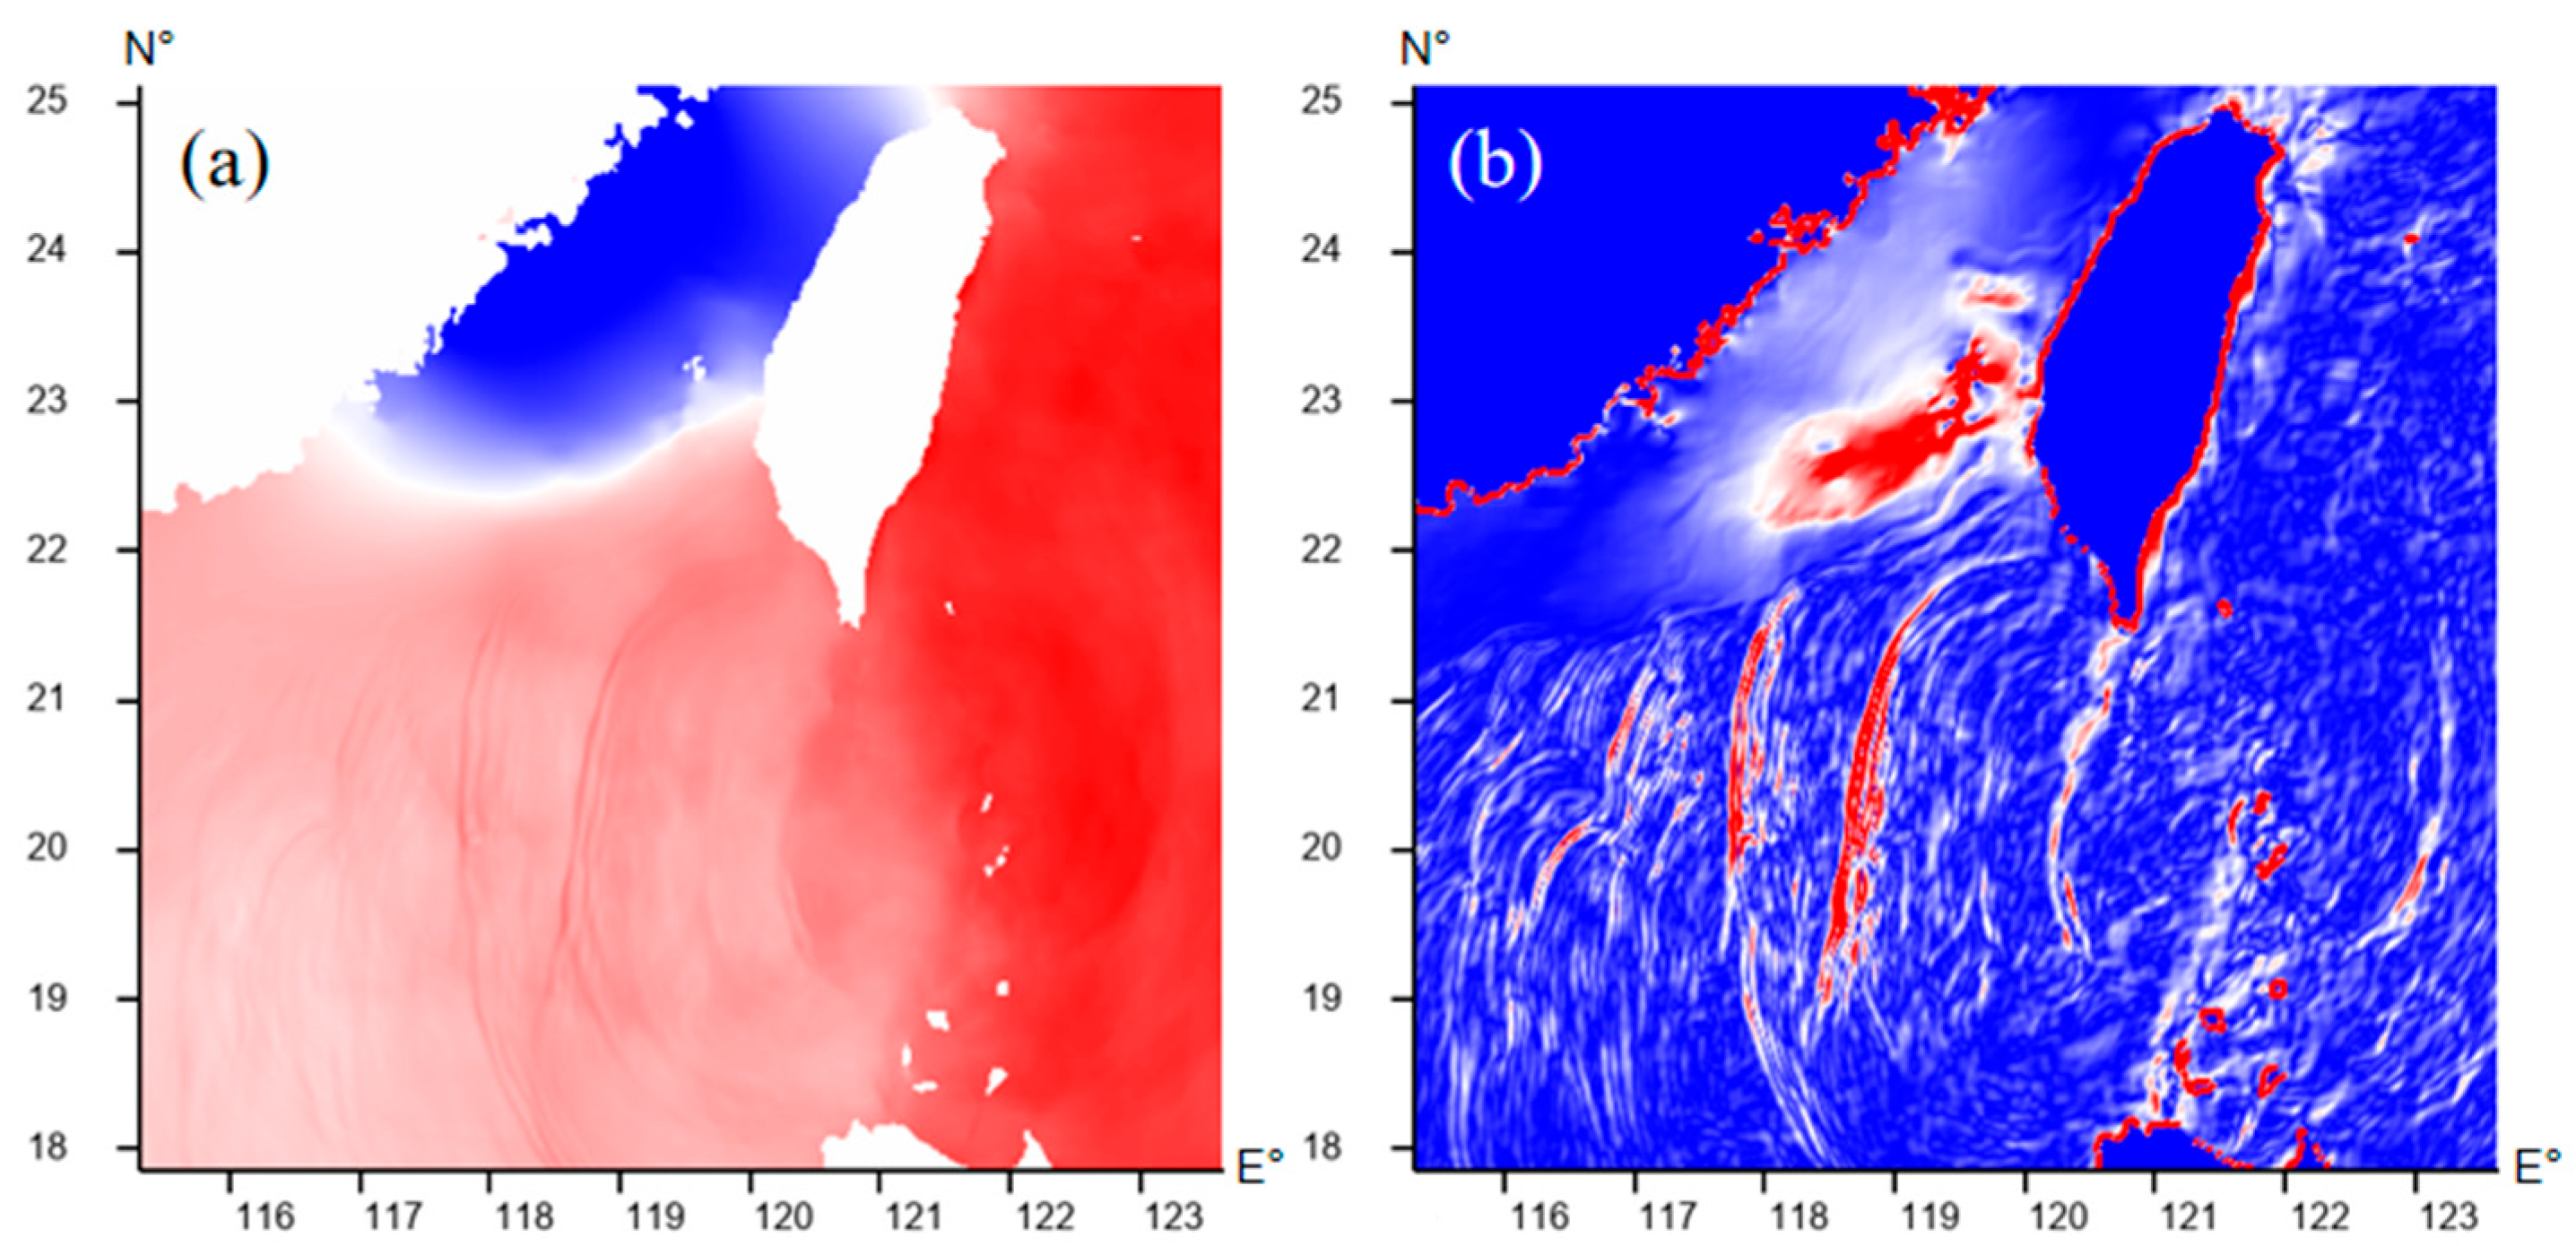
Figure 1a displays the sea surface height data in the study area before filtering, while
Figure 1b illustrates the data after filtering. After filtering, the distribution of the crest line of ISW becomes more distinct, facilitating the labeling of most ISWs. LabelMe can then be used to manually label these waves. Although manual labeling of ISWs is widely used, it has several limitations, particularly concerning labeling quality. First, in regions with low contrast and high noise, filtering may generate pseudo-wave peaks, leading to inaccurate labeling. Additionally, the characteristics and complexity of ISWs require the labeler to have a certain level of expertise to distinguish between genuine wave peaks and background noise or other fluctuations. In areas with sparse ISWs and subtle fluctuations, the model is highly sensitive to labeling quality. If the labeler fails to correctly identify these fluctuations, it may result in mislabeling or omission, which can degrade the performance of models trained with these labels. Therefore, the labeling method plays a critical role in the final identification accuracy. Our labeling process begins by locating the high-frequency line, followed by extracting the profile of the three-dimensional ocean temperature data at the same position along a direction perpendicular to the ripples. If concavity is observed in the isothermal line within the profile, it is identified as an ISW, and lines are drawn manually to label it. Using this method, ripples that are difficult to distinguish from sea surface height data alone can be accurately identified. It is a widely used technique in oceanography for ISWs, enhancing the accuracy of manual labeling and improving labeling quality. The results of the labeling are shown in
Figure 2.
2.2. Deep Learning Framework
The proposed model is developed based on the TransUNet architecture, which integrates the strengths of Transformers in capturing long-range dependencies with the advantages of U-Net in preserving fine details and high-resolution features [
33]. As shown in
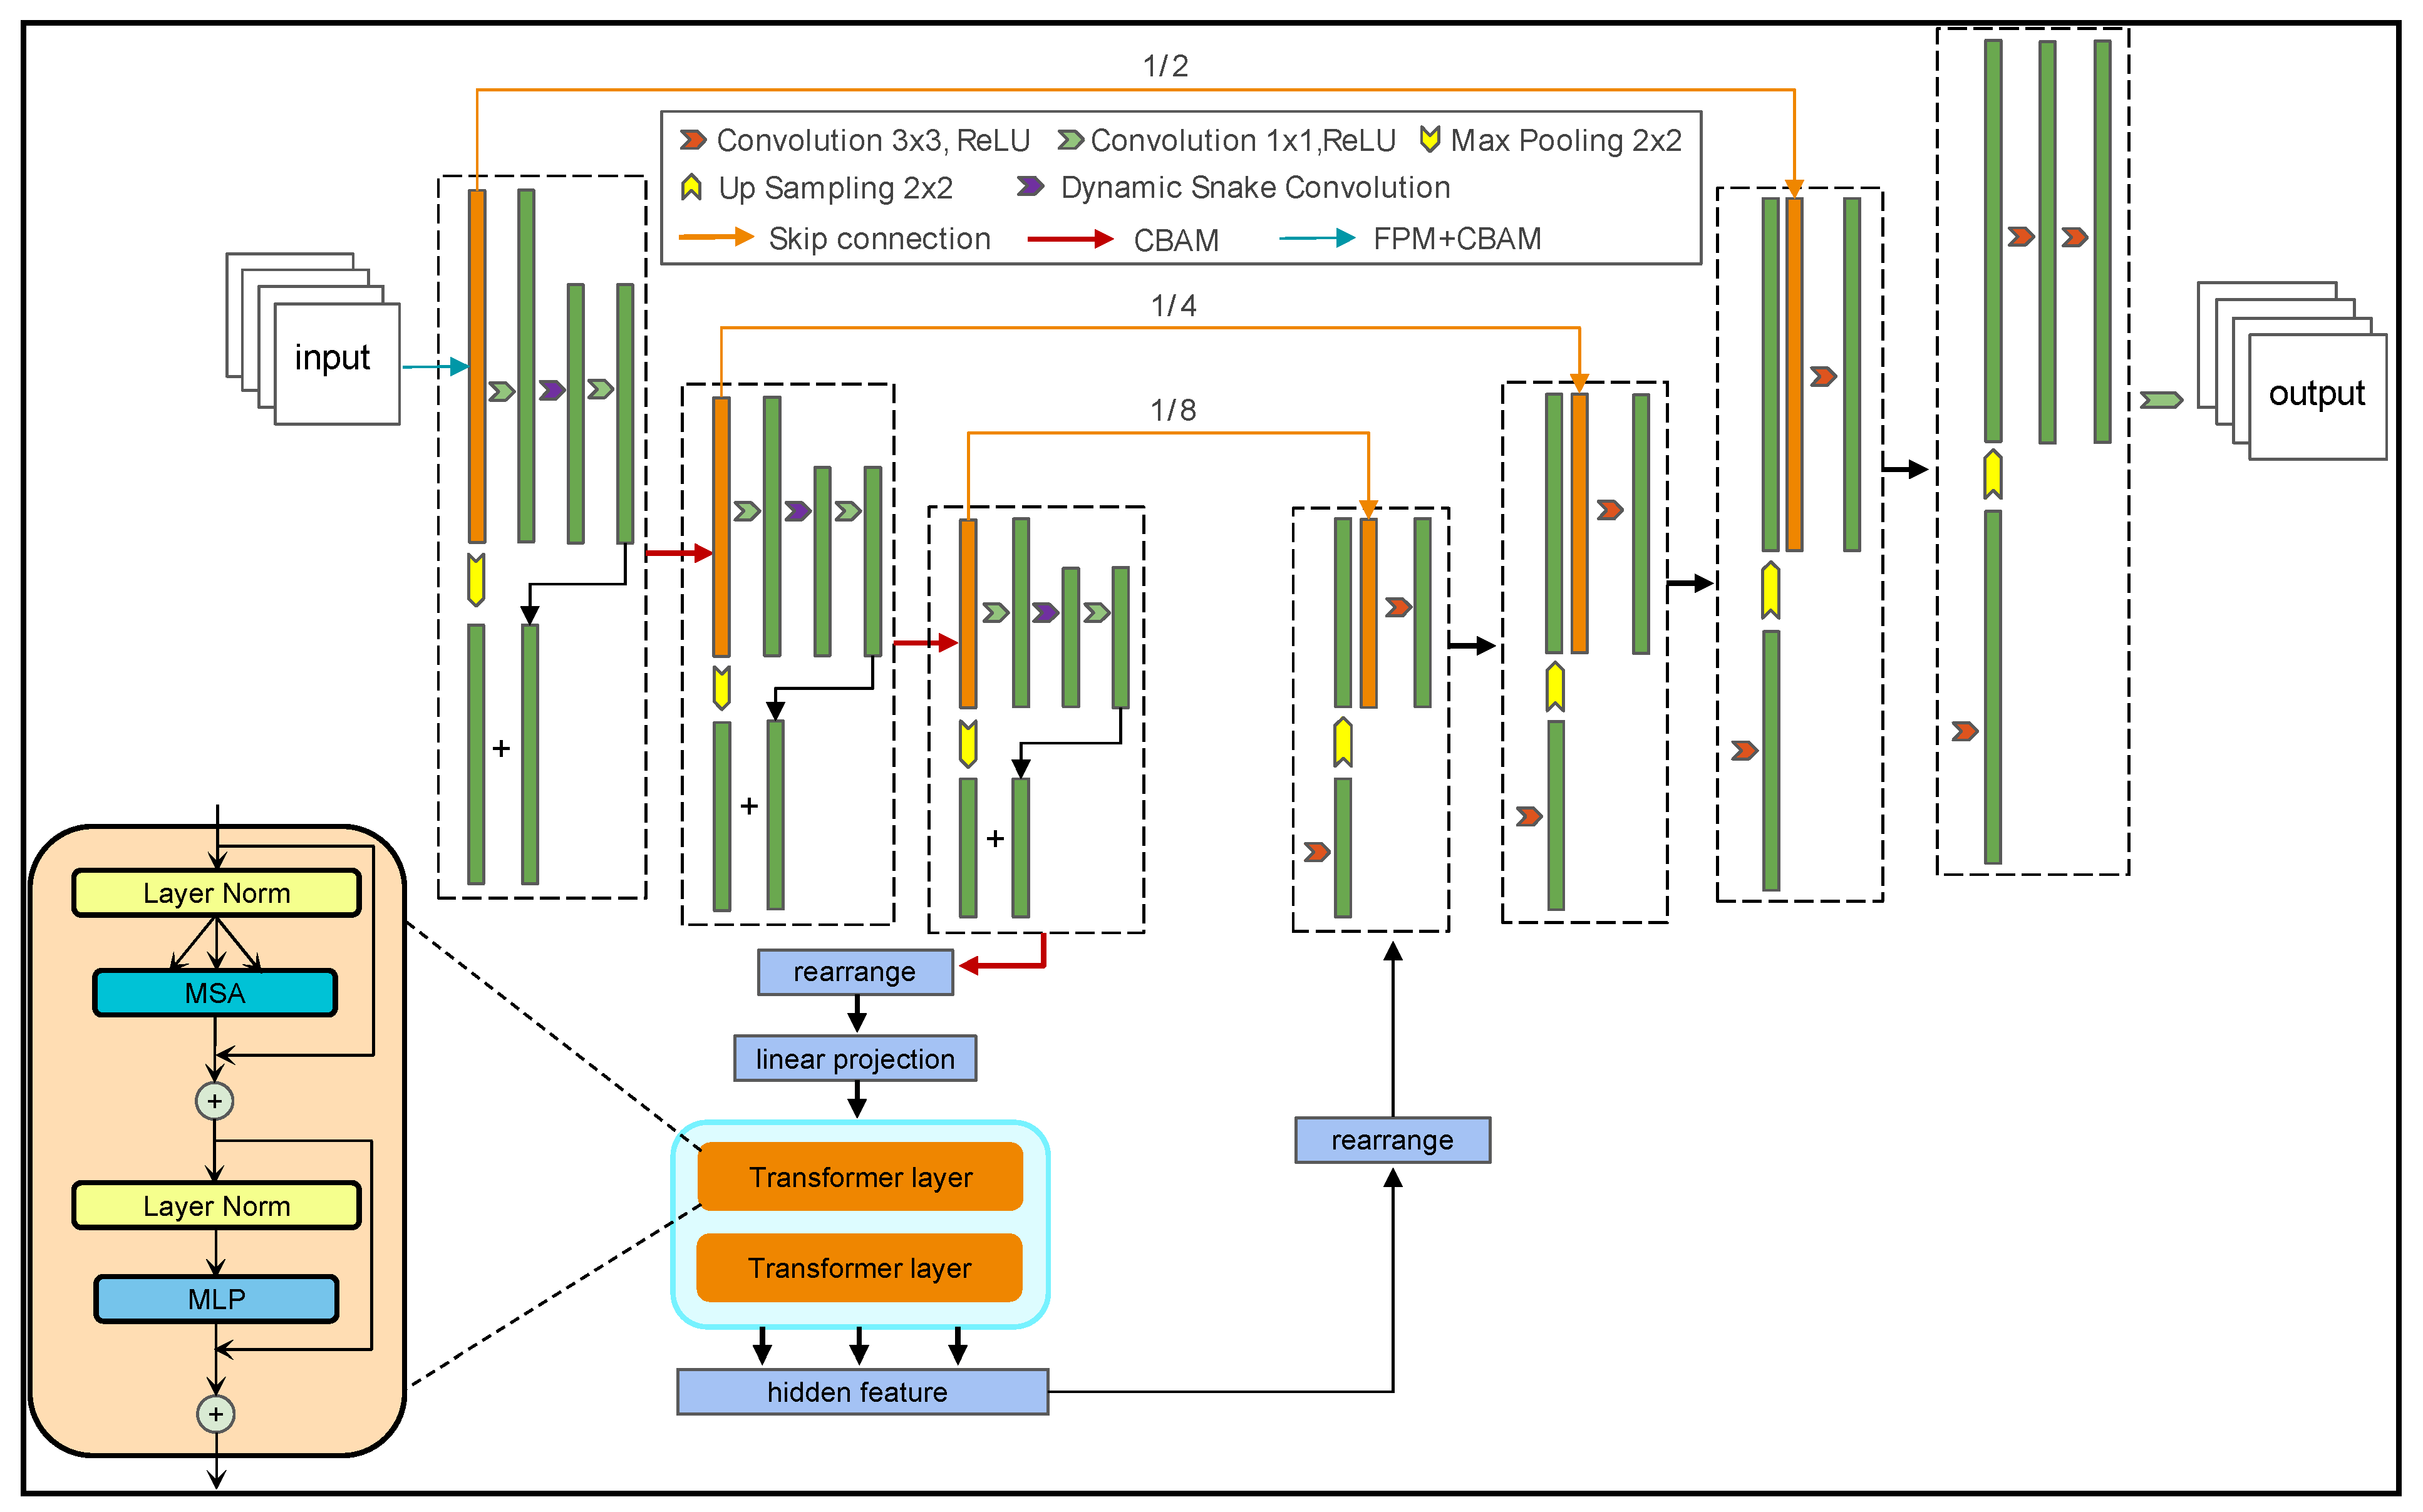
Figure 3, TransUNet consists of two main components: the encoder and decoder. The encoder utilizes convolutional layers and a Transformer encoder to progressively extract image features. In this process, convolutional layers capture local features, while the Transformer encoder acquires global context through the self-attention mechanism. This combination not only preserves U-Net’s sensitivity to local features but also improves its ability to interpret global information, thereby enhancing the model’s capacity to process complex image data. In the decoder, TransUNet adopts a structure similar to U-Net, integrating upsampling and convolutional operations to restore feature maps to the original resolution. Introducing skip connections during the decoding process allows the model to fully utilize the features extracted by the encoder, improving segmentation accuracy. Compared to the traditional U-Net, TransUNet can fuse local and global information more effectively, making it better suited for complex image segmentation tasks. In our study, several modifications have been made to the original TransUNet framework to address the specific characteristics of ISWs. The innovation to the model is shown in
Figure 4. This section presents these modifications and the rationale behind them.
2.3. Dynamic Snake Convolution
ISWs in model data manifest as elongated, curved tubular structures, and the local features of these structures are crucial for accurate ISW identification. Traditional convolution operations, with their fixed-shape kernels, struggle to capture the precise features of these complex morphologies. In contrast, Dynamic Snake Convolution (DSConv), with its adaptive kernel shape and weight adjustment mechanism, is better suited to focus on the local features of ISWs, thereby improving the accuracy and robustness of feature extraction.
The DSConv operation is inspired by serpentine curves, enabling it to focus on curved structures within images adaptively. Unlike traditional convolution kernels, which are typically rectangular or square, the shape of the DSConv kernel resembles a serpentine path, allowing for more flexible capture of complex edges and textures [
34,
35,
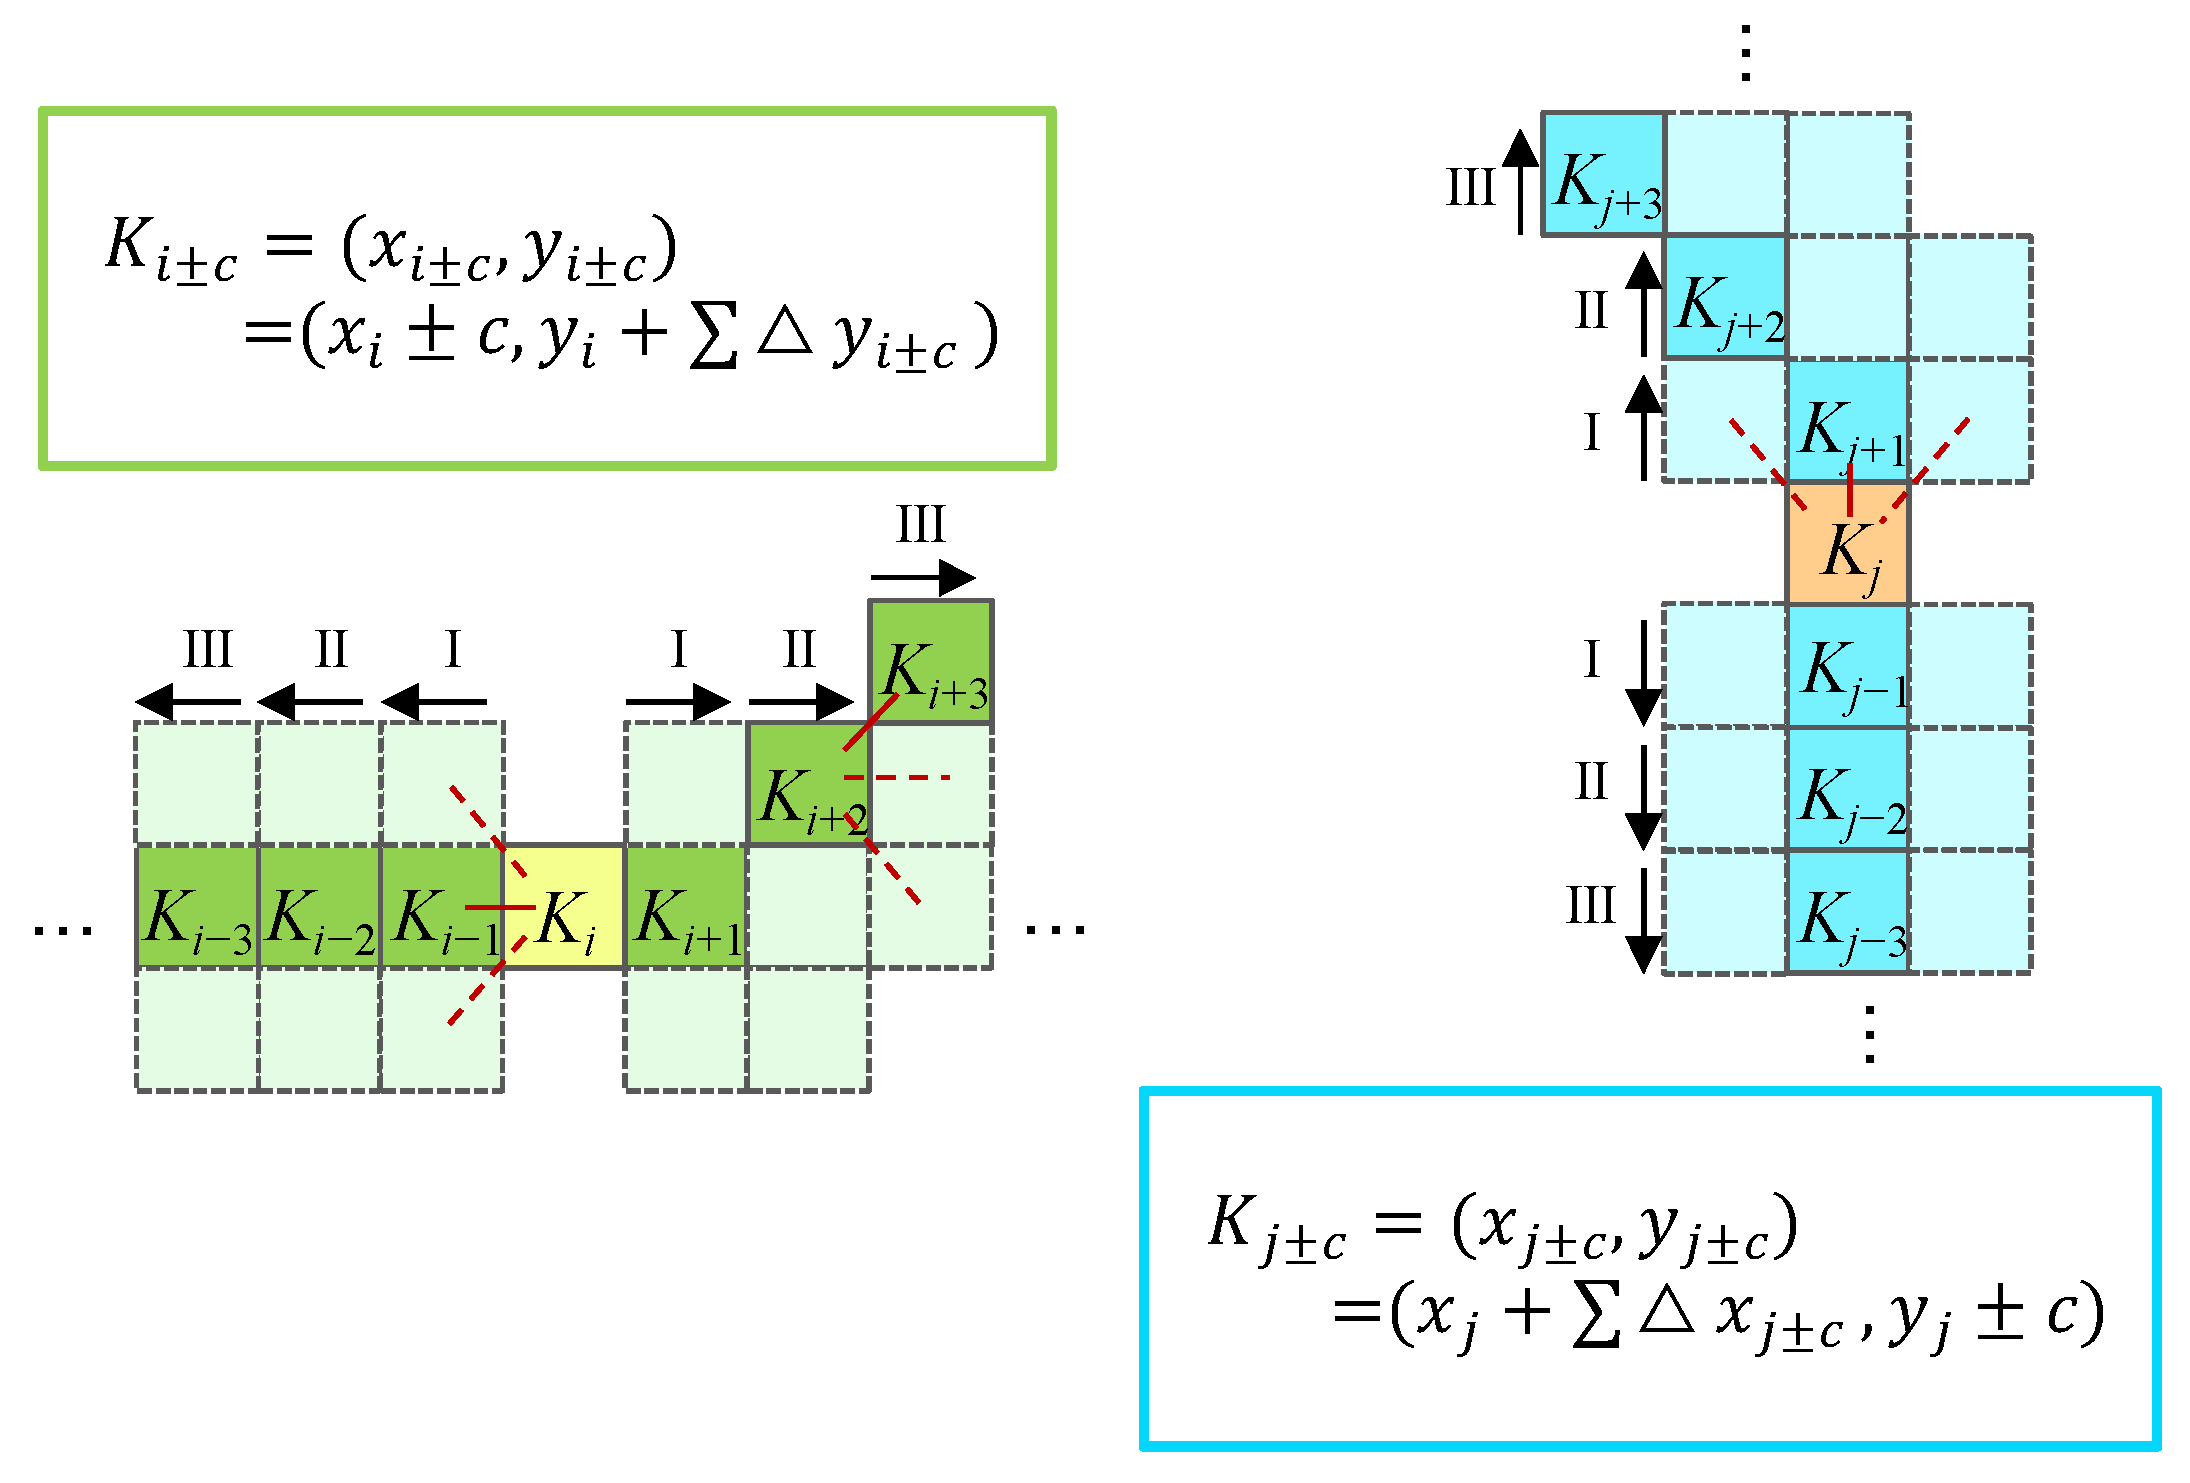
36]. The core principle of the DSConv is to maintain the continuity of the region of interest through an iterative strategy, improving both segmentation accuracy and efficiency. Specifically, the DSConv introduces deformable offsets on top of standard convolution kernels, allowing the kernel to flexibly adapt to the complex geometric features of the target. Moreover, this approach enhances the ability to extract local features of tubular structures by adaptively adjusting the weights of the convolution kernel.
Figure 5 demonstrates the working principle of the DSConv.
In the proposed TransUNet model, we integrate the DSConv into the encoding path to replace traditional convolutional layers. Specifically, the DSConv replaces the 3 × 3 convolutions in each encoding block. As shown, the ISW features primarily extend longitudinally, and the receptive field of the DSConv effectively captures longitudinal offsets, which enables the model to capture the local structural information of ISWs better while extracting image features.
2.4. Frequency Perception Module (FPM)
The Frequency Perception Module (FPM) is a network architecture designed to process information across different frequency ranges simultaneously. It typically utilizes octave convolution to automatically detect both high and low-frequency information in an end-to-end manner, extracting these features from images. Cong et al. [
37] demonstrated that the FPM enhanced the model’s ability to capture detailed information and overall structure in images, thereby improving identification performance. The detailed structure of the FPM is shown in
Figure 6.
The ripples of ISWs often share similar visual characteristics, such as color and texture, with the background, making it difficult for traditional neural networks to effectively differentiate between the two. By incorporating the FPM, the model can decompose the ISW features into high and low-frequency components. High-frequency features represent textural details or rapidly changing areas, particularly the edges of ISWs, which significantly enhance the accuracy of edge identification, while low-frequency features help outline the overall contour of the object, aiding the model in identifying the fundamental structure of ISW. In the identification model, the FPM is integrated into the feature extraction process. By introducing this module, the model can independently learn features across various frequency scales, thereby improving the efficiency and accuracy of distinguishing the wave trace from the background. Ultimately, this approach enhances the identification accuracy of ISWs and strengthens the support for subsequent image processing and analysis.
2.5. Convolutional Block Attention Module (CBAM)
ISWs may vary in scale and morphology in model data and be obscured by complex background information. Cai et al. [
38] showed that introducing the CBAM module enabled the model to focus on the relevant feature regions of ISWs more effectively during feature extraction and suppressed irrelevant background information. This improvement allows the model to extract more accurate features from ISWs of varying scales and morphologies. Additionally, the lightweight nature of the CBAM module makes it well-suited for real-time applications or resource-constrained environments, without significantly increasing computational overhead. Thus, the CBAM module is embedded in the model’s encoding path to improve its sensitivity to ISW features.
The Convolutional Block Attention Module (CBAM) is a lightweight attention mechanism that separately learns channel and spatial weights through two parallel sub-modules: channel attention module and spatial attention module [
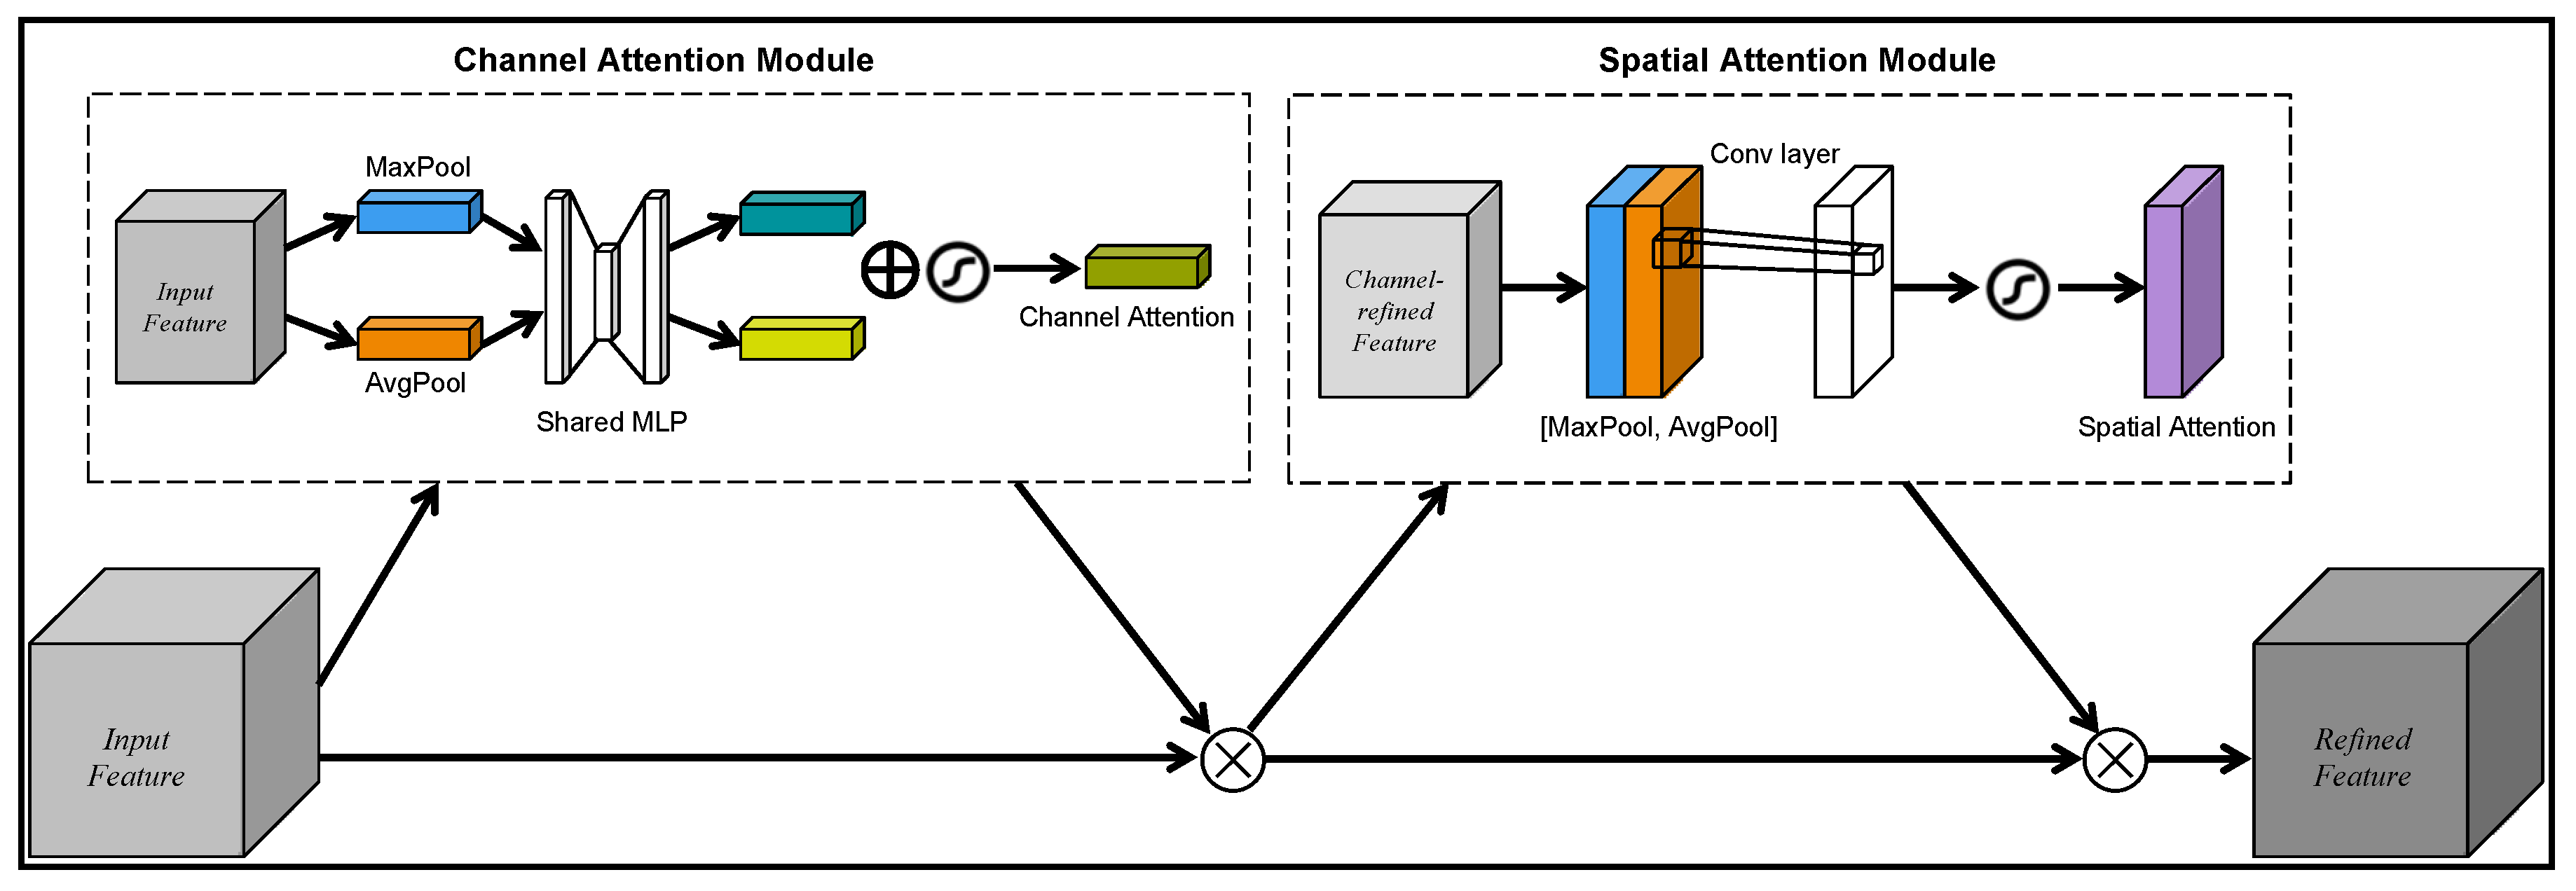
39]. As shown in
Figure 7, the channel attention module aggregates spatial information from feature maps using global average pooling and max pooling and then learns inter-channel dependencies through a shared MLP network, which in turn generates a channel weight map. These channel weights are then applied to the individual channels of the input feature maps, thereby reinforcing the model’s focus on key channels. Similarly, the spatial attention module learns spatial dependencies. Ultimately, the outputs of the channel and spatial attention modules are multiplied to generate the final attention map, which is subsequently applied to the input feature map to enhance the focus on important features.
2.6. Matthews Correlation Coefficient Loss Function
The ISW identification is a typical example of an imbalanced classification problem, where the ISW samples are relatively scarce compared to background ones. Traditional loss functions, such as cross-entropy, may perform poorly in such conditions, as they prioritize overall accuracy while neglecting the class imbalance, which results in predictions that favor the background category. By incorporating the Matthews Correlation Coefficient (MCC) loss function, the model can better address the class imbalance, thereby improving the accuracy of ISW identification [
40].
The MCC [
41] is a metric commonly used to evaluate the performance of binary classification models. It considers all four categories in the confusion matrix, true positives (TP), true negatives (TN), false positives (FP), and false negatives (FN), and provides a comprehensive assessment of model performance. The MCC value ranges from −1 to 1, where 1 indicates perfect prediction, 0 represents performance equivalent to random guessing, and −1 reflects an opposite prediction. MCC is particularly well-suited for binary classification tasks with imbalanced datasets, as it simultaneously accounts for the performance across all categories.
The formula for calculating MCC is formulated in Equation (2).
In this formula, TP represents the number of samples correctly classified as positive by the model; TN represents the number of samples correctly classified as negative; FP represents the number of samples incorrectly classified as positive; and FN represents the number of samples incorrectly classified as negative. This formula allows the MCC to reflect the model’s predictive ability for both positive and negative categories, thereby mitigating any bias arising from class imbalance and providing a more stable and reliable evaluation.
The computational process begins by calculating the confusion matrix, which compares the model’s predictions with the true labels to obtain the values of TP, TN, FP, and FN. The MCC value is then computed by substituting the confusion matrix values into the formula. If the model identifies more accurately for both ISW and background, the MCC value will approach 1. Conversely, if the model performs poorly, the MCC value will be close to 0 or negative.
To use MCC as a loss function for model optimization, the MCC values must be converted to loss values. Since most optimization algorithms aim to minimize the loss function, this conversion is typically achieved by subtracting the MCC from 1. In implementing the MCC loss function, further improvements in the model’s focus on minority class samples can be achieved through class weighting. This strategy helps the model increase the accuracy of identifying the minority class without introducing bias toward the majority class.
4. Discussion
4.1. Distribution of ISWs in the South China Sea and Model Generalization Ability
The Northern South China Sea (NSCS) is one of the regions with the highest frequency of ISW activity globally, and the distribution of ISWs in this area follows distinct patterns. According to the model identification results shown in
Figure 9a, ISW activity is particularly intense in the NSCS, especially to the west of the Luzon Strait and in the northern continental shelf region. The seabed topography in these areas is complex and varied, while the pronounced water stratification creates favorable conditions for the formation and propagation of ISWs. The identification results indicate that ISWs exhibit a high density and large amplitudes in these regions, significantly affecting the marine environment. Additionally, ISWs occurring to the west of the Luzon Strait display larger amplitudes and longer wavelengths near the strait, although they are most densely distributed further to the west. Observations also reveal that ISWs in the northern SCS experience considerable deformation and attenuation during propagation, primarily due to the complex dynamic processes and topographic effects in the ocean.
To enhance the generalization ability, the proposed model employs key techniques to improve its adaptability across different regions. When processing data with distinctive waveform features, such as ISWs, the DSConv is particularly effective in extracting slender features. The waveform characteristics of ISWs remain consistent across regions, and the adaptive nature of the DSConv allows it to adjust the convolution path according to the input signal’s morphology, ensuring efficient feature extraction across diverse regions and datasets. The CBAM further enhances the model’s ability to identify significant features by incorporating spatial and channel attention mechanisms. Spatial attention enables the model to focus on critical regions of the input image, while channel attention increases sensitivity to various features by weighting the importance of different channels. By enhancing the model’s capacity to identify locally significant features, the CBAM effectively improves the model’s adaptability to variations in data across different regions. Additionally, the model’s generalization is further strengthened by dropout regularization and normalization techniques during training. Regularization controls model complexity and mitigates overfitting, while normalization stabilizes the training process by adjusting the input distribution at each layer, preventing instability caused by significant data differences between regions. By combining these techniques, the model maintains strong identification performance across diverse datasets, enhancing its robustness and overall performance.
4.2. Comparison with Traditional Identification Methods
In this study, the proposed model employs the deep learning method to identify ISWs in the NSCS, producing accurate identification results. Compared to traditional wavelet transform-based methods, the deep learning model demonstrates superior expressiveness and accuracy. Traditional methods rely on manual feature extraction and mathematical transformations to identify ISWs. These methods typically require waveform decomposition and reconstruction. While the wavelet transform can capture local features to some extent, it is often influenced by waveform complexity and noise interference, which limits its effectiveness in edge recognition. Under severe sea conditions, traditional methods struggle to distinguish waveform features against complex backgrounds and are more prone to misidentification. In contrast, the deep learning model can automatically extract deep features from the data and integrate spatial and temporal information through an end-to-end learning process, enabling efficient identification of ISWs. The network structure adapts to various waveforms and environmental changes during training, enhancing the model’s robustness and accuracy.
The experimental results shown in
Figure 10 indicate that the proposed model significantly outperforms traditional wavelet transform methods in identification accuracy. During the experiments, we observed that the traditional method not only suffered from blurring and errors in edge recognition but also frequently failed to accurately detect ISWs or misclassified waves that were not ISWs. This issue is especially evident in environments with fluctuating waveforms and high interference, leading to substantial identification errors. In contrast, the deep learning model consistently maintained high identification accuracy in complex marine environments, effectively detecting wave edges, and overcoming common limitations of traditional methods. These results demonstrate that the deep learning model has superior adaptability when handling marine data, showcasing its enhanced performance in ISW identification tasks.
4.3. ISW Identification Under Extreme Sea States
In the context of ISW identification in the SCS under extreme sea states, we focused on the impact of input data selection on the accuracy of identification results. Traditional methods for ISW identification often rely on sea surface data, such as SAR imagery. However, wind and current fields in extreme sea states can significantly interfere with the sea surface state, obscuring the characteristics of ISWs and compromising identification accuracy. To address this challenge, we utilized three-dimensional ocean temperature data from the high-resolution LLC4320 dataset as the sole input for our identification model. Compared to the models using only sea surface height data, the proposed model is less susceptible to surface-related disturbances. As a result, we anticipate that this approach will enhance the robustness of ISW identification.
The results presented in
Figure 9b indicate that when three-dimensional ocean temperature is used as the input, the proposed model consistently maintains high performance, successfully identifying the overall distribution of ISWs. It suggests that three-dimensional ocean temperature provides reliable information for ISW identification and is minimally impacted by surface conditions. This finding is significant for practical ocean monitoring and early warning, offering a more robust method for ISW identification. However, the current approach, which does not account for sea surface conditions, still lacks detail. As shown in
Figure 9b,c, the identified ISW stripes exhibit poor performance at the boundaries, and several small targets are misidentified. Moving forward, we will explore other ISW identification methods based on three-dimensional ocean data to improve accuracy and robustness under severe sea conditions.
5. Conclusions
ISWs are a significant phenomenon in ocean dynamics and are critical to marine engineering, marine ecological protection, resource development, and navigation. Their unique propagation characteristics and complex generation mechanisms have been central topics in marine scientific research for an extended period.
To accurately identify ISWs in the ocean, we propose a semantic segmentation model based on an enhanced TransUNet. The proposed model preserves the original advantages of TransUNet and further incorporates innovative modifications tailored to the characteristics of ISWs: the DSConv to improve the model’s adaptability to waveform features, the FPM for effective differentiation of ISWs from the background, and the CBAM to enhance the model’s focus on key regions. The experimental results demonstrate that the proposed model performs exceptionally well in identifying ISWs in the SCS, achieving a Dice coefficient of 66.32%, HD95 of 5.27, MPA of 85.42%, and MIoU of 73.74%, all superior to other methods. Using both sea surface height and three-dimensional ocean temperature data as inputs, the model accurately identifies the location and morphology of ISWs. Under complex sea conditions, the model maintains high identification accuracy, even when only the three-dimensional ocean temperature data are used as input, highlighting its robustness and effectiveness.
In the future, we will explore more advanced semantic segmentation technologies and algorithms to further enhance the model’s identification and generalization capabilities. In particular, additional efforts will be dedicated to improving ISW identification under severe sea conditions, with a focus on refining the recognition of finer details. Moreover, it is also necessary to explore the influence of additional oceanic factors on ISW identification to achieve better results.
