
Optimization Control of Flexible Power Supply System Applied to Offshore Wind–Solar Coupled Hydrogen Production


Abstract
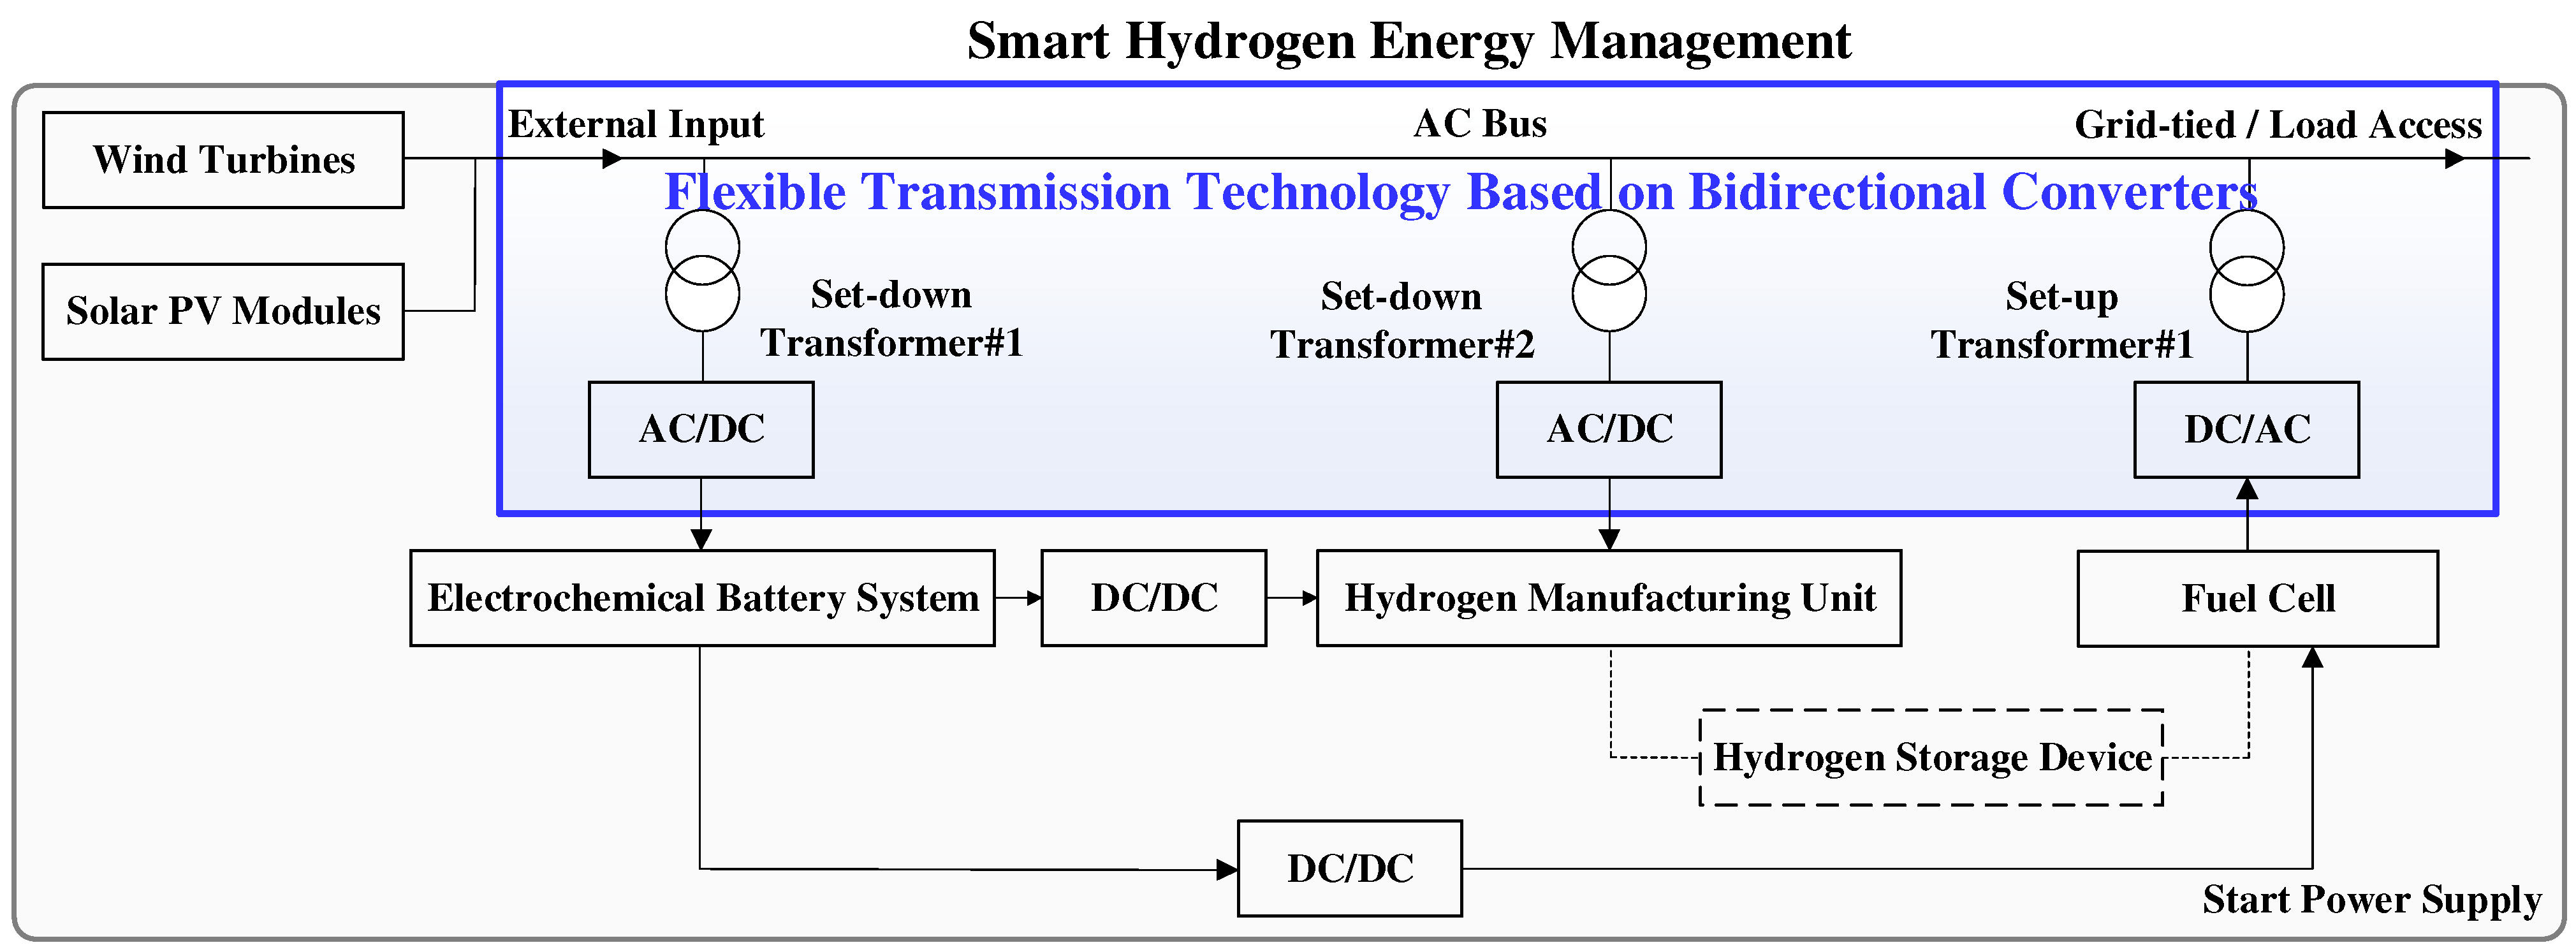
1. Introduction
2. Design Method for Integrated Filtering of Transformers
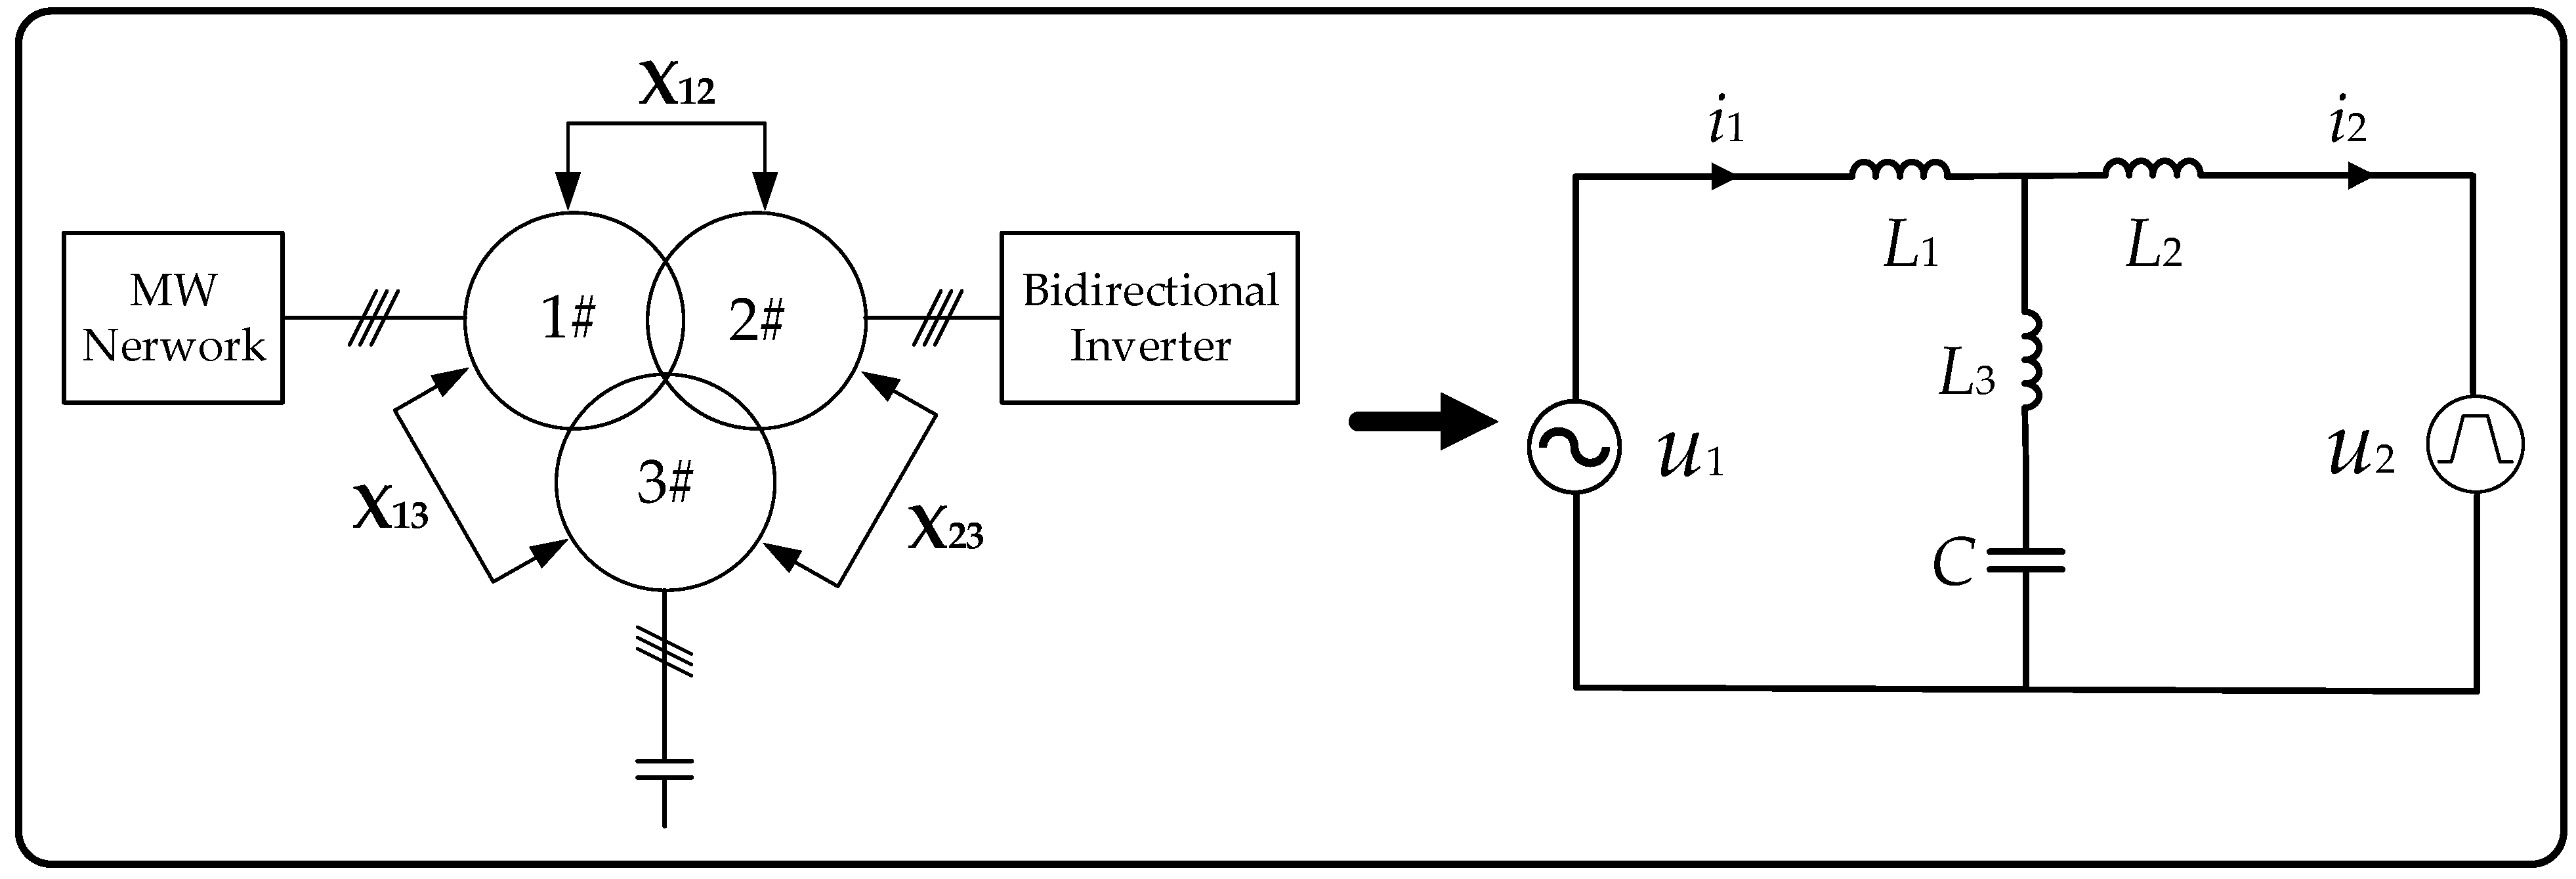
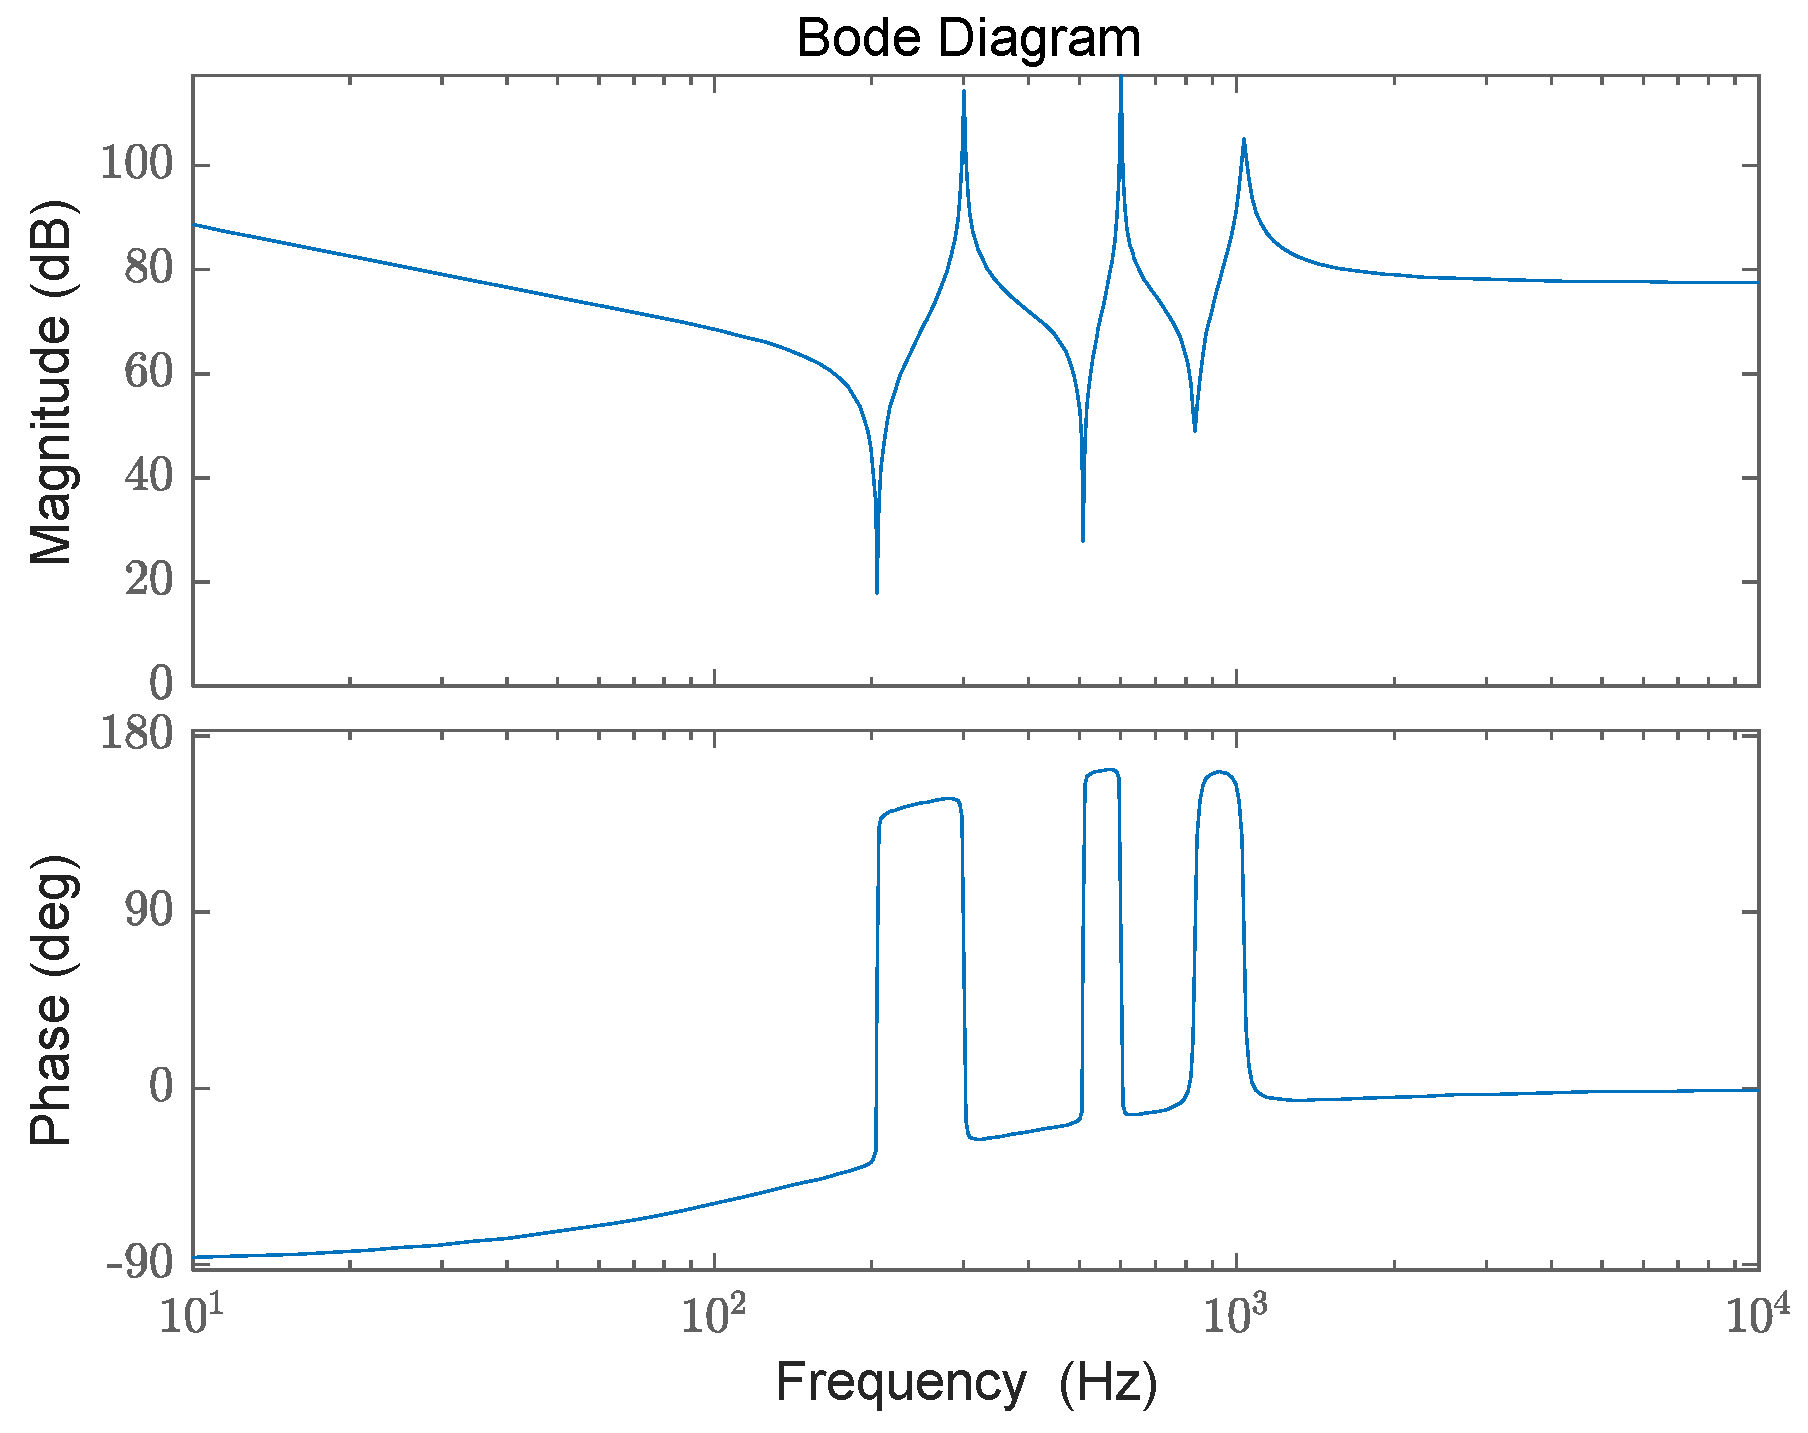
2.1. Transformer Filtering Characteristics
2.2. Parameter Design Rules
2.3. Parameter Design Constraints
| Algorithm 1. Multi-objective optimization algorithm of LLCL filter parameters based on NSGA-II |
| Input: L1∈ [L1min, L1max], step: L1step L2 ∈ [L2min, L2max], step: L2step L3 ∈ [L3min, L3max], step: L2step N: population size M: maximum number of generations Output: Pareto-optimal set of filter parameters {L1, L2, L3, C} 1: Initialize population P(0) with N individuals, each with parameters {L1, L2, L3, C} within defined bounds 2: Evaluate each individual in P(0) using the following two objectives: (a) f1: Minimize THD of output current (b) f2: Maximize system stability margin 3: t ← 0 4: while t < M do 5: Perform non-dominated sorting on P(t) to form ranked fronts F1, F2, ... 6: Compute crowding distance for individuals in each front 7: Apply binary tournament selection based on rank and crowding distance 8: Generate offspring Q(t) using simulated binary crossover and polynomial mutation 9: Evaluate f₁ and f₂ for all individuals in Q(t) as in Step 2 10: R(t) ← P(t) ∪ Q(t) 11: Perform non-dominated sorting on R(t), and select the best N individuals to form P(t+1) 12: t ← t + 1 13: end while 14: Return Pareto-optimal set obtained from final generation P(M) |
3. Closed Loop Control Strategy and Parameter Tuning Method
3.1. Comparison of Current Feedback Control Strategies
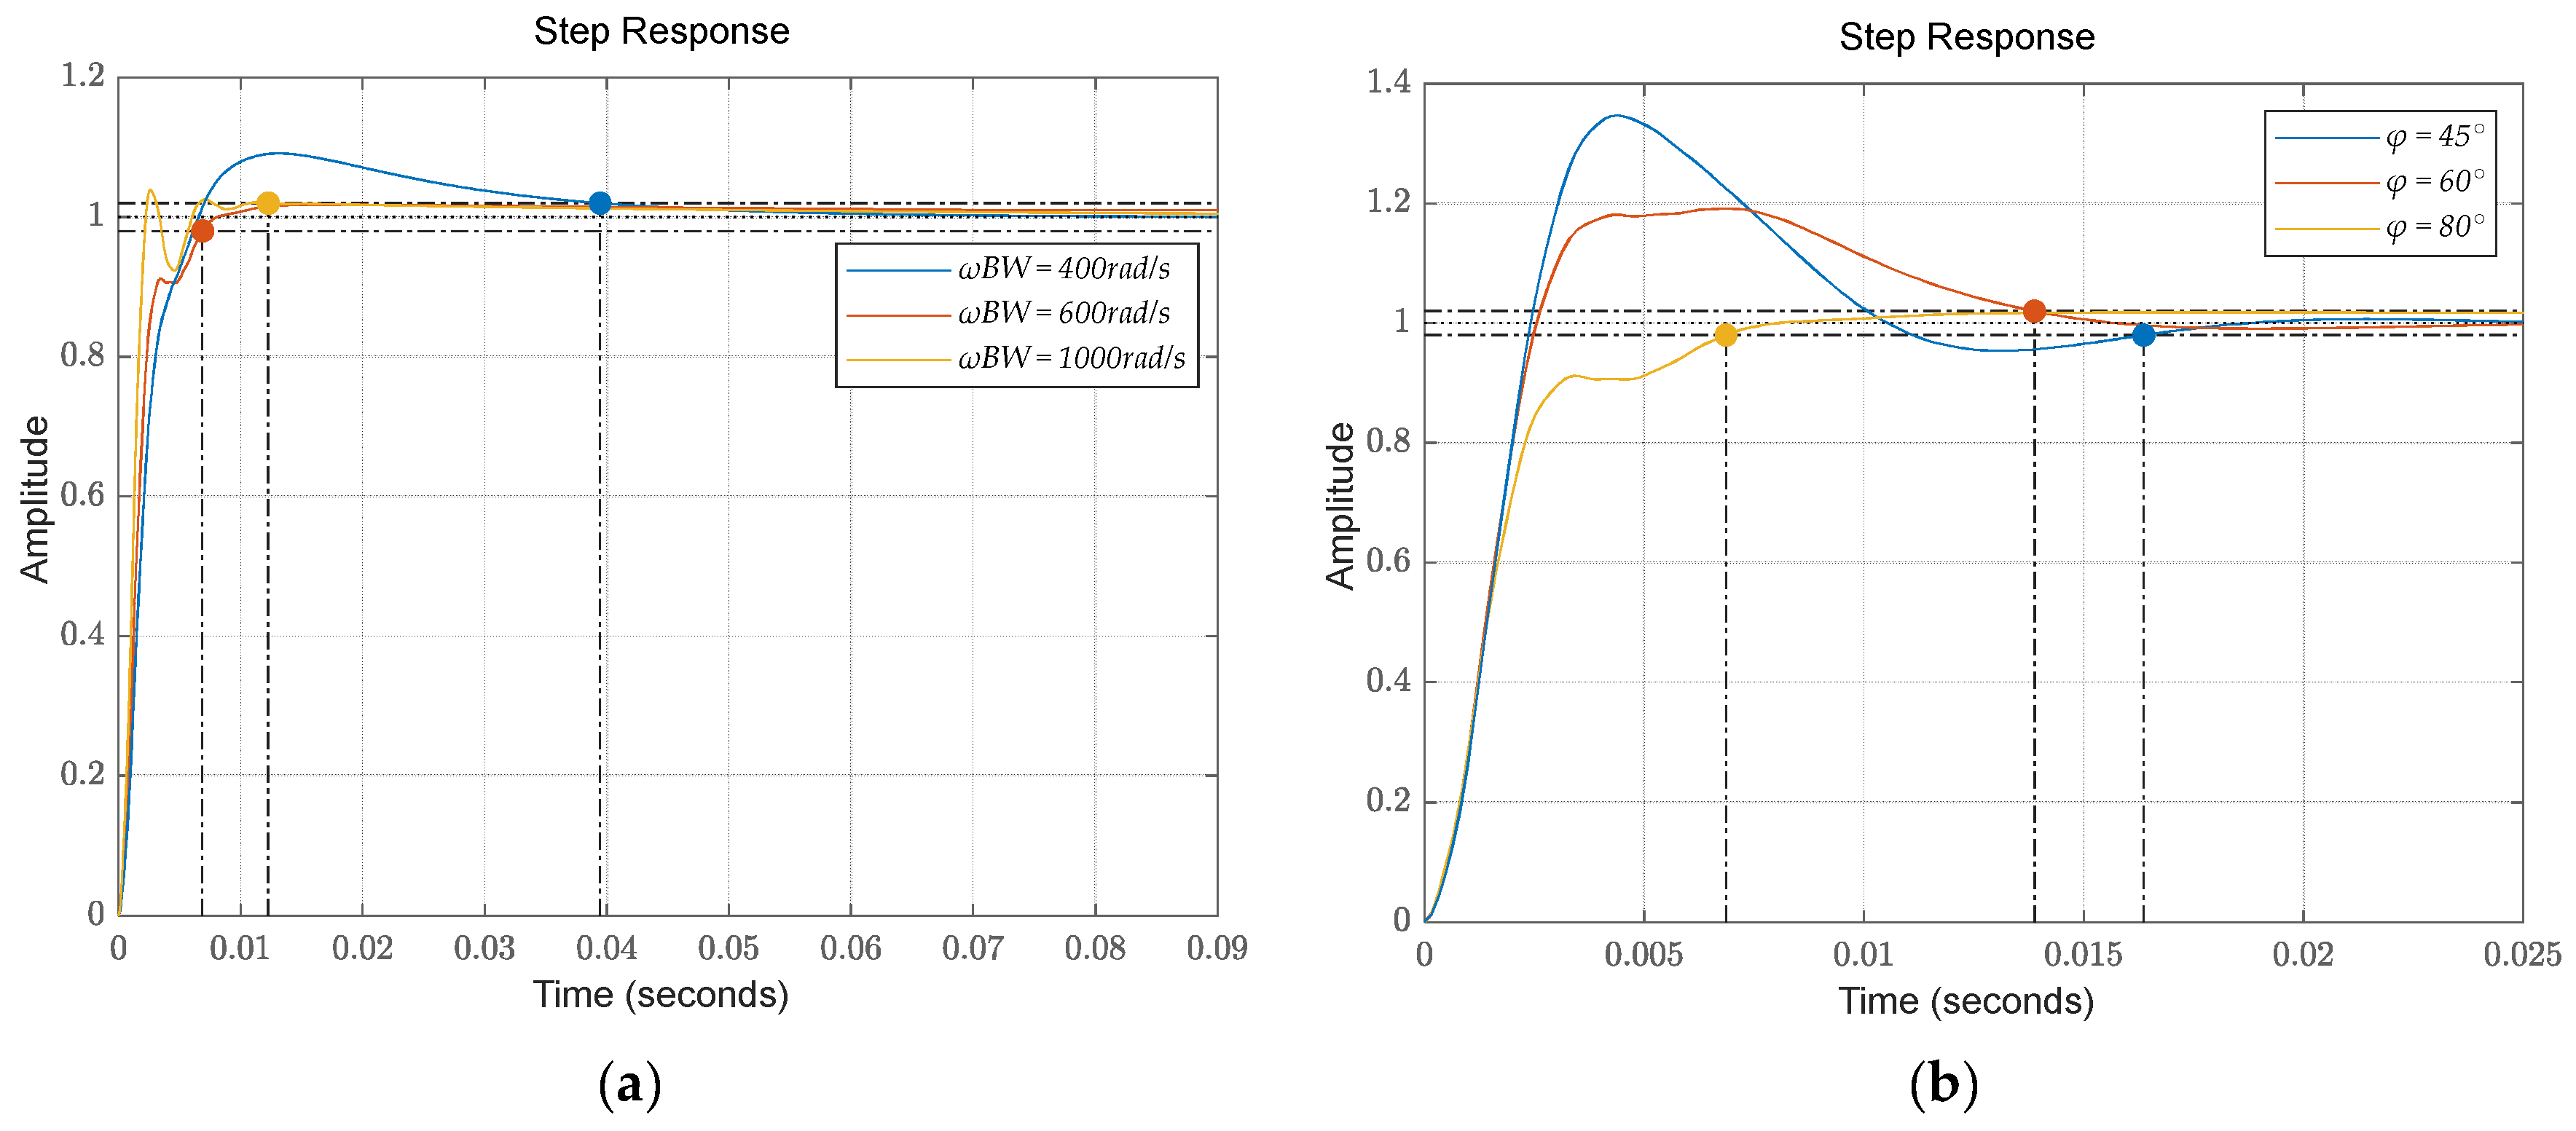
3.2. Controller Parameter Tuning Method Based on Fast Response
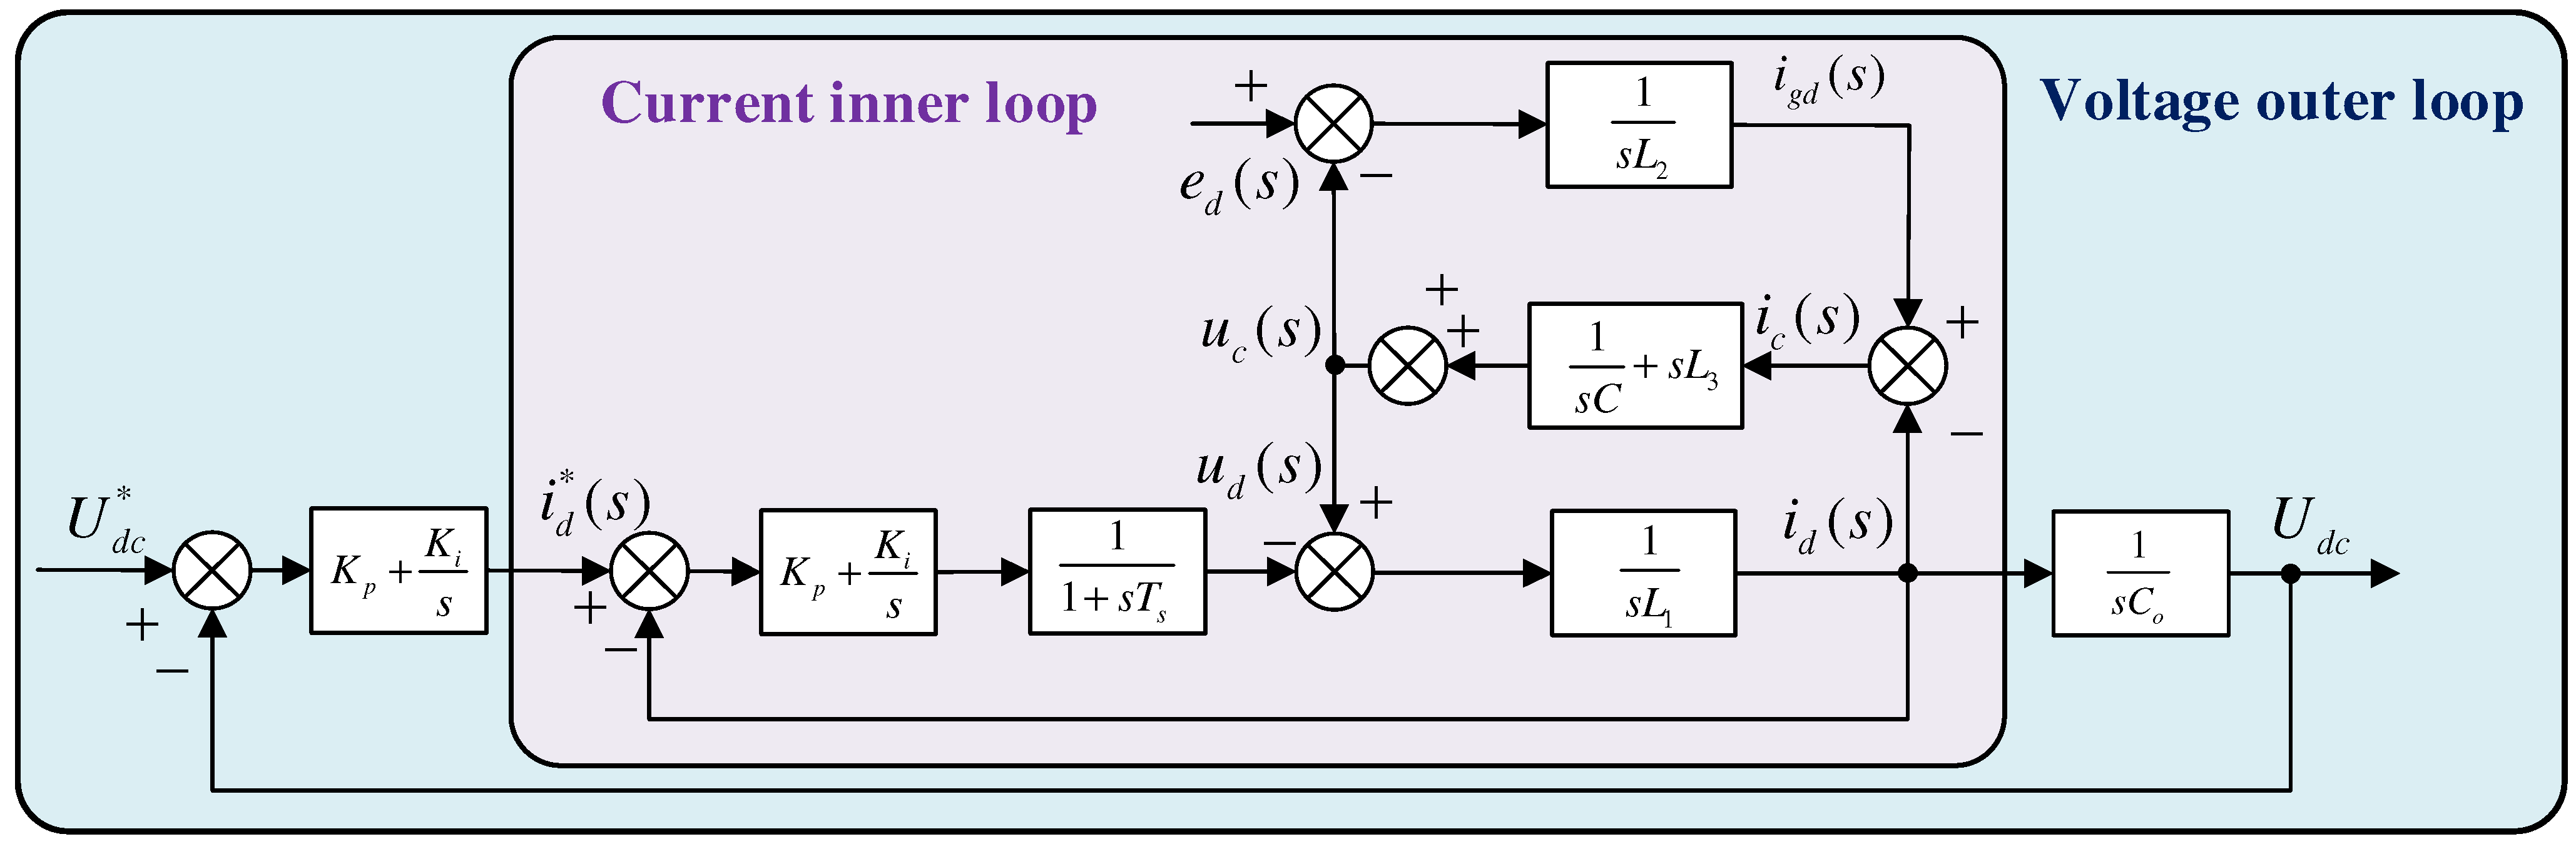
3.2.1. Double Closed-Loop Control Structure
3.2.2. Control Parameter Tuning Rules
4. Non-Static Error Current Tracking and Transient Process Optimization
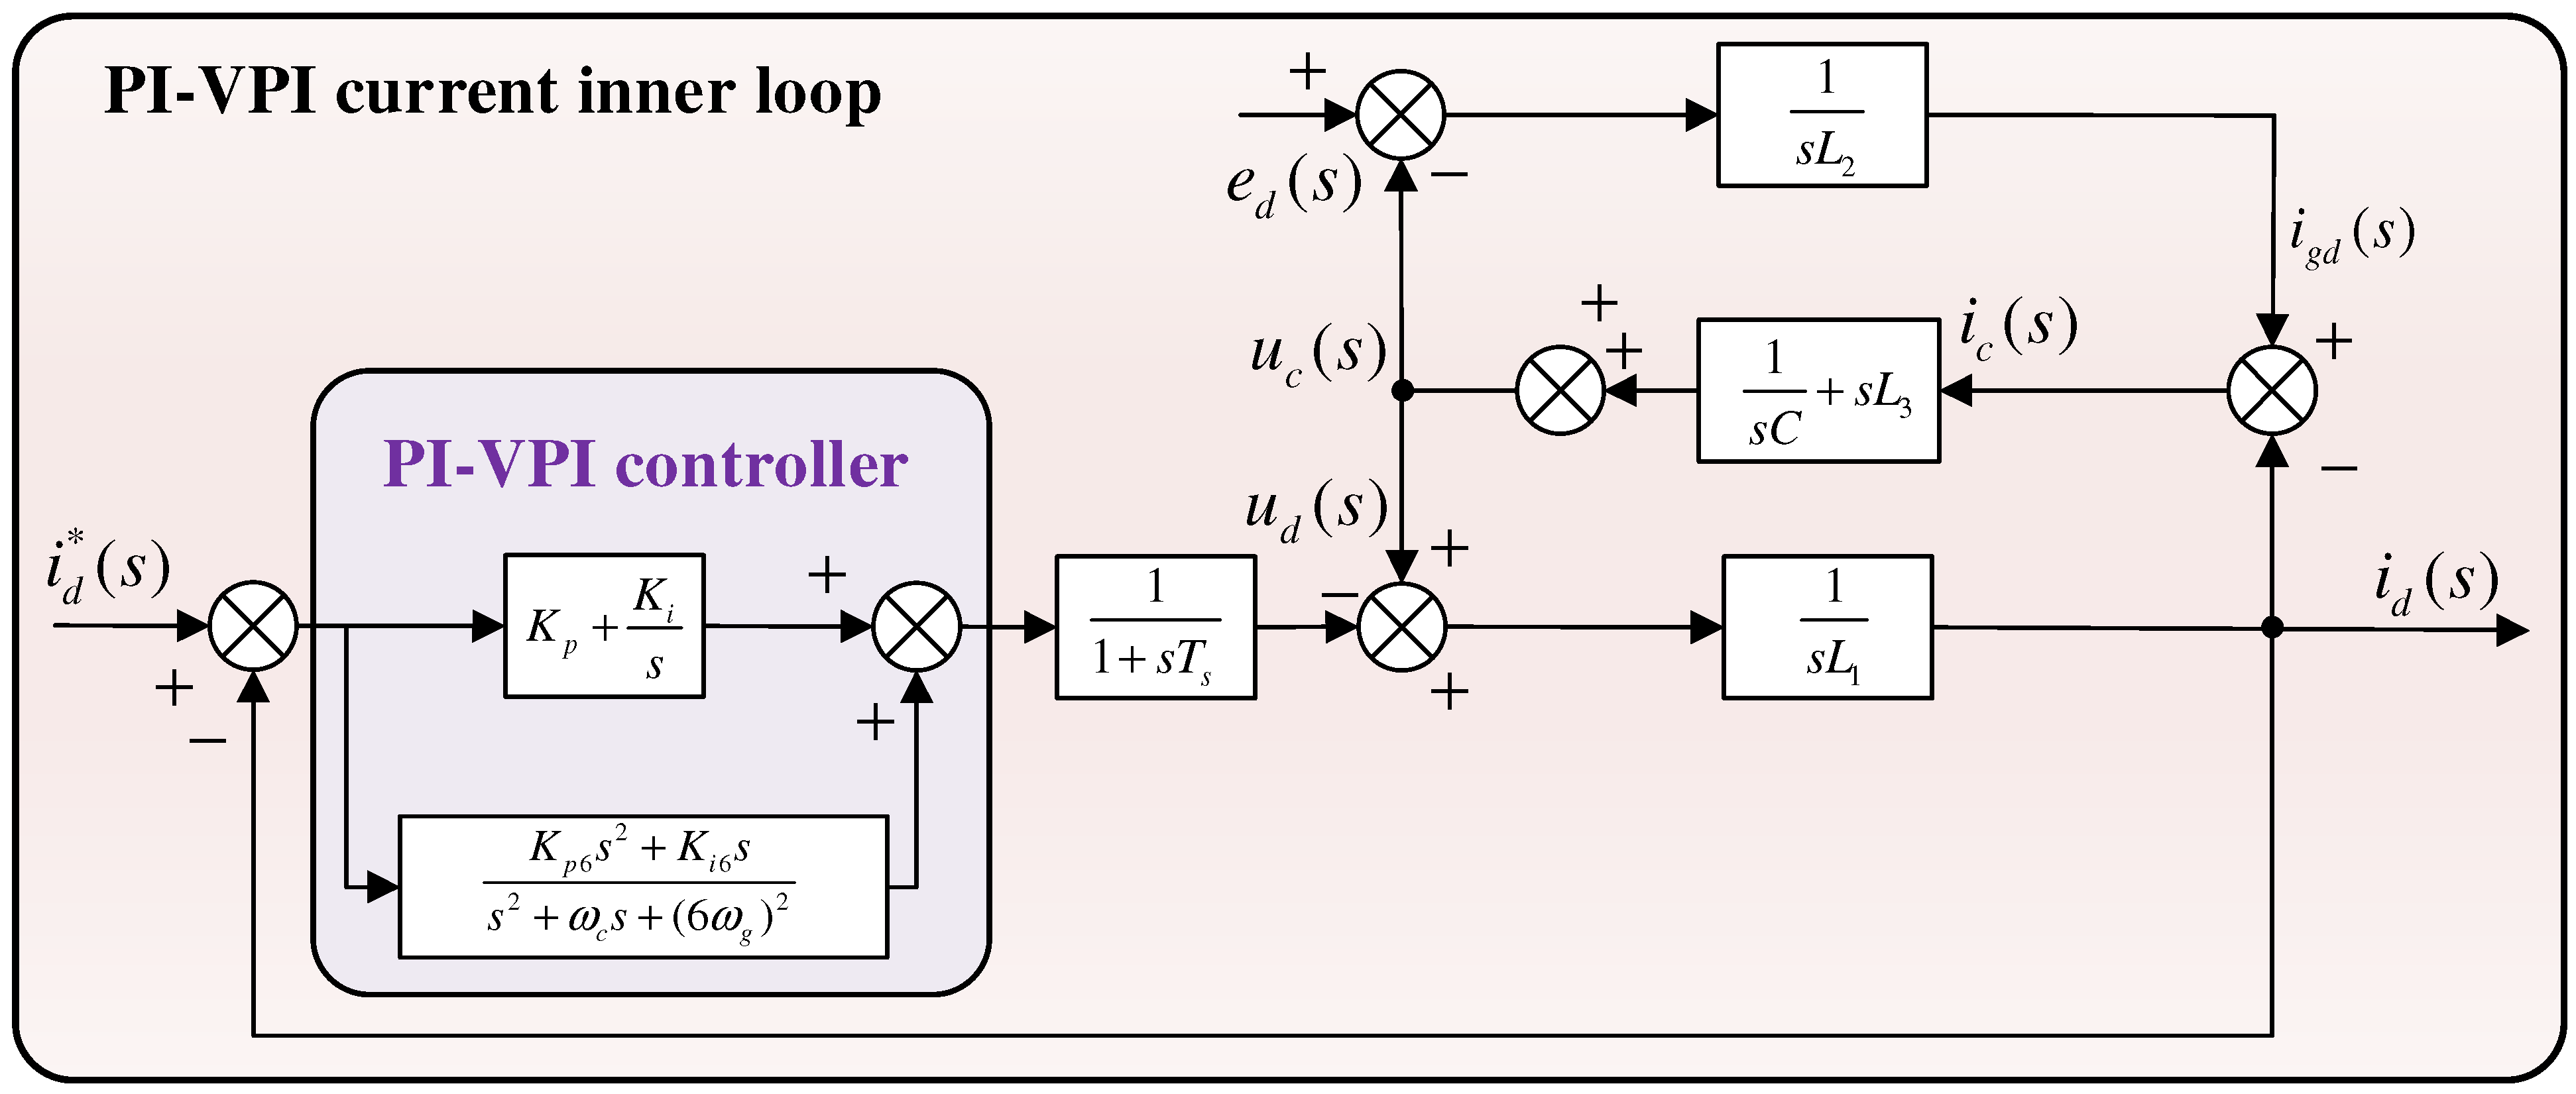
4.1. PI-VPI Low-Order Harmonic Suppression Control Algorithm
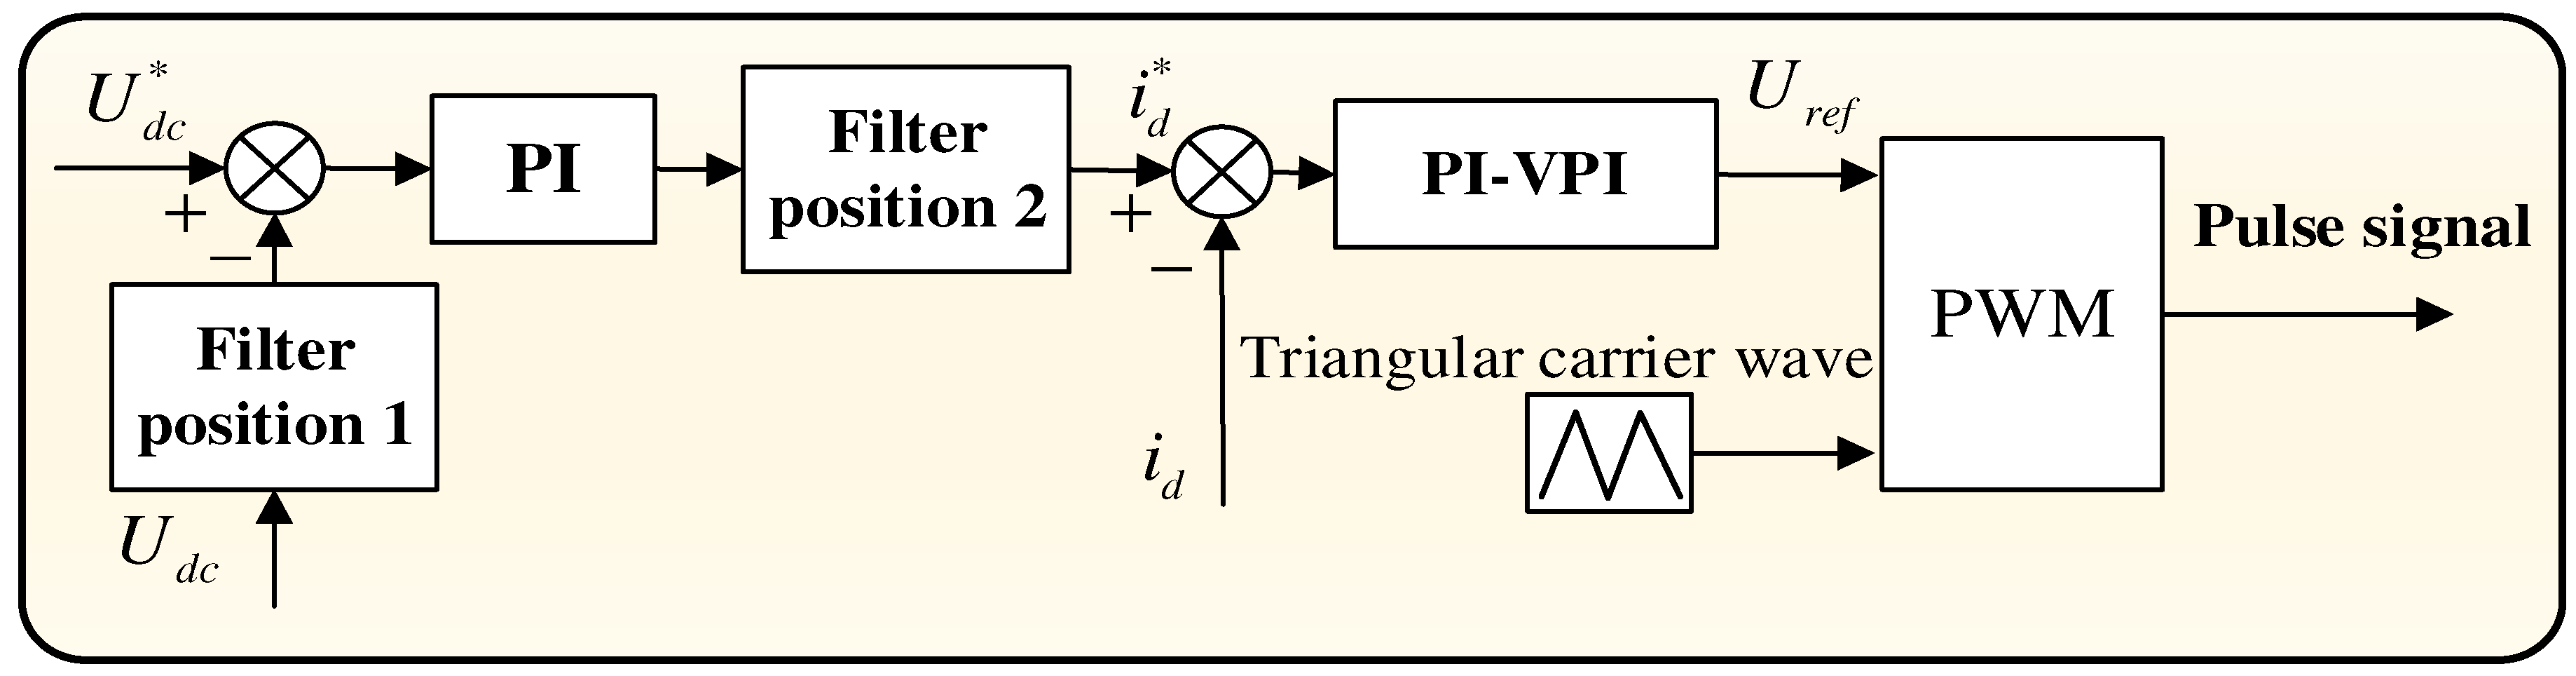
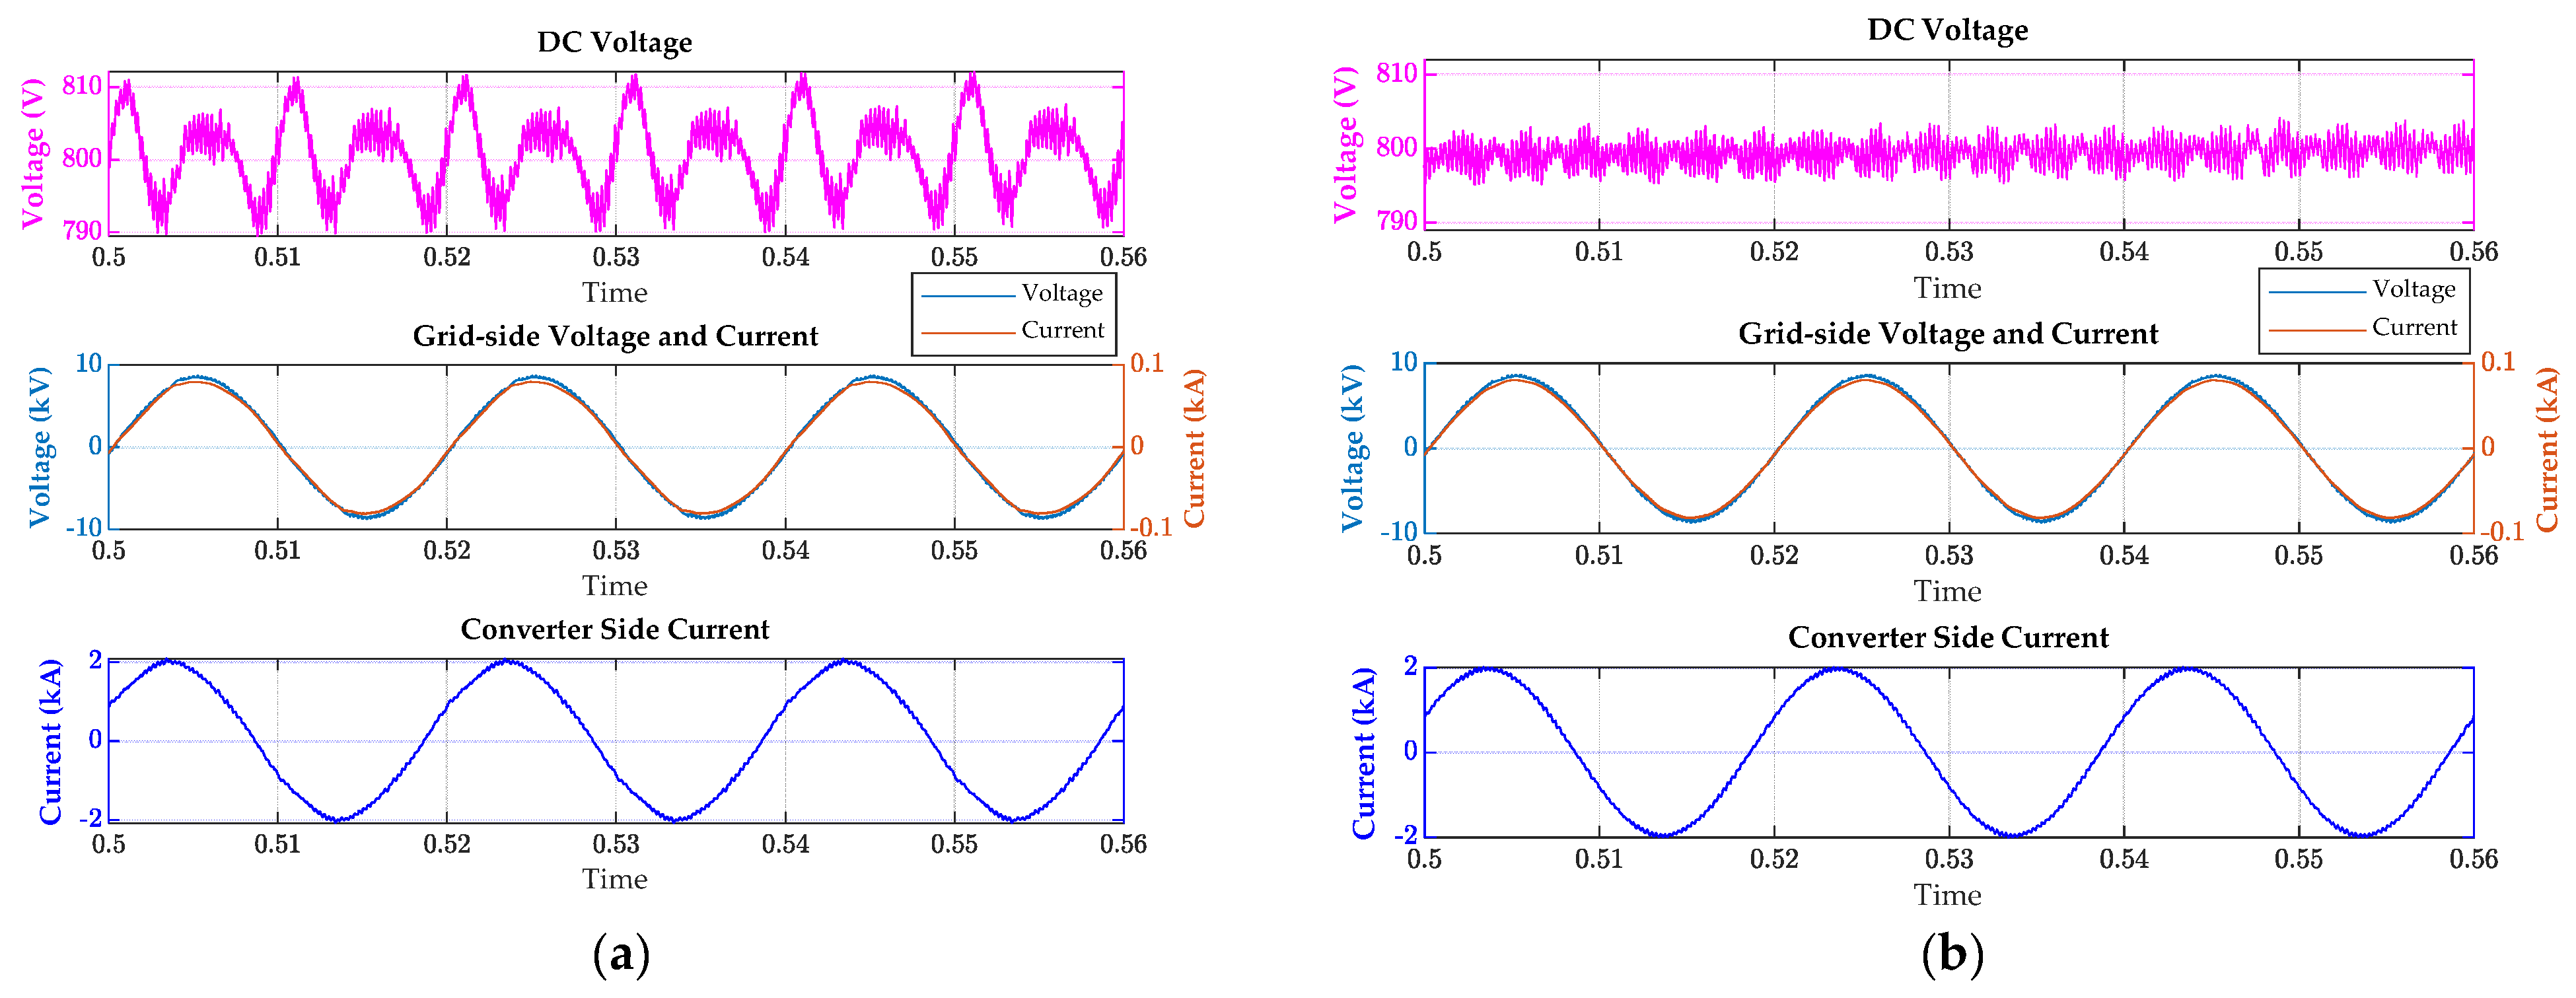
4.2. Band-Stop Filter Suppresses DC Pulsation
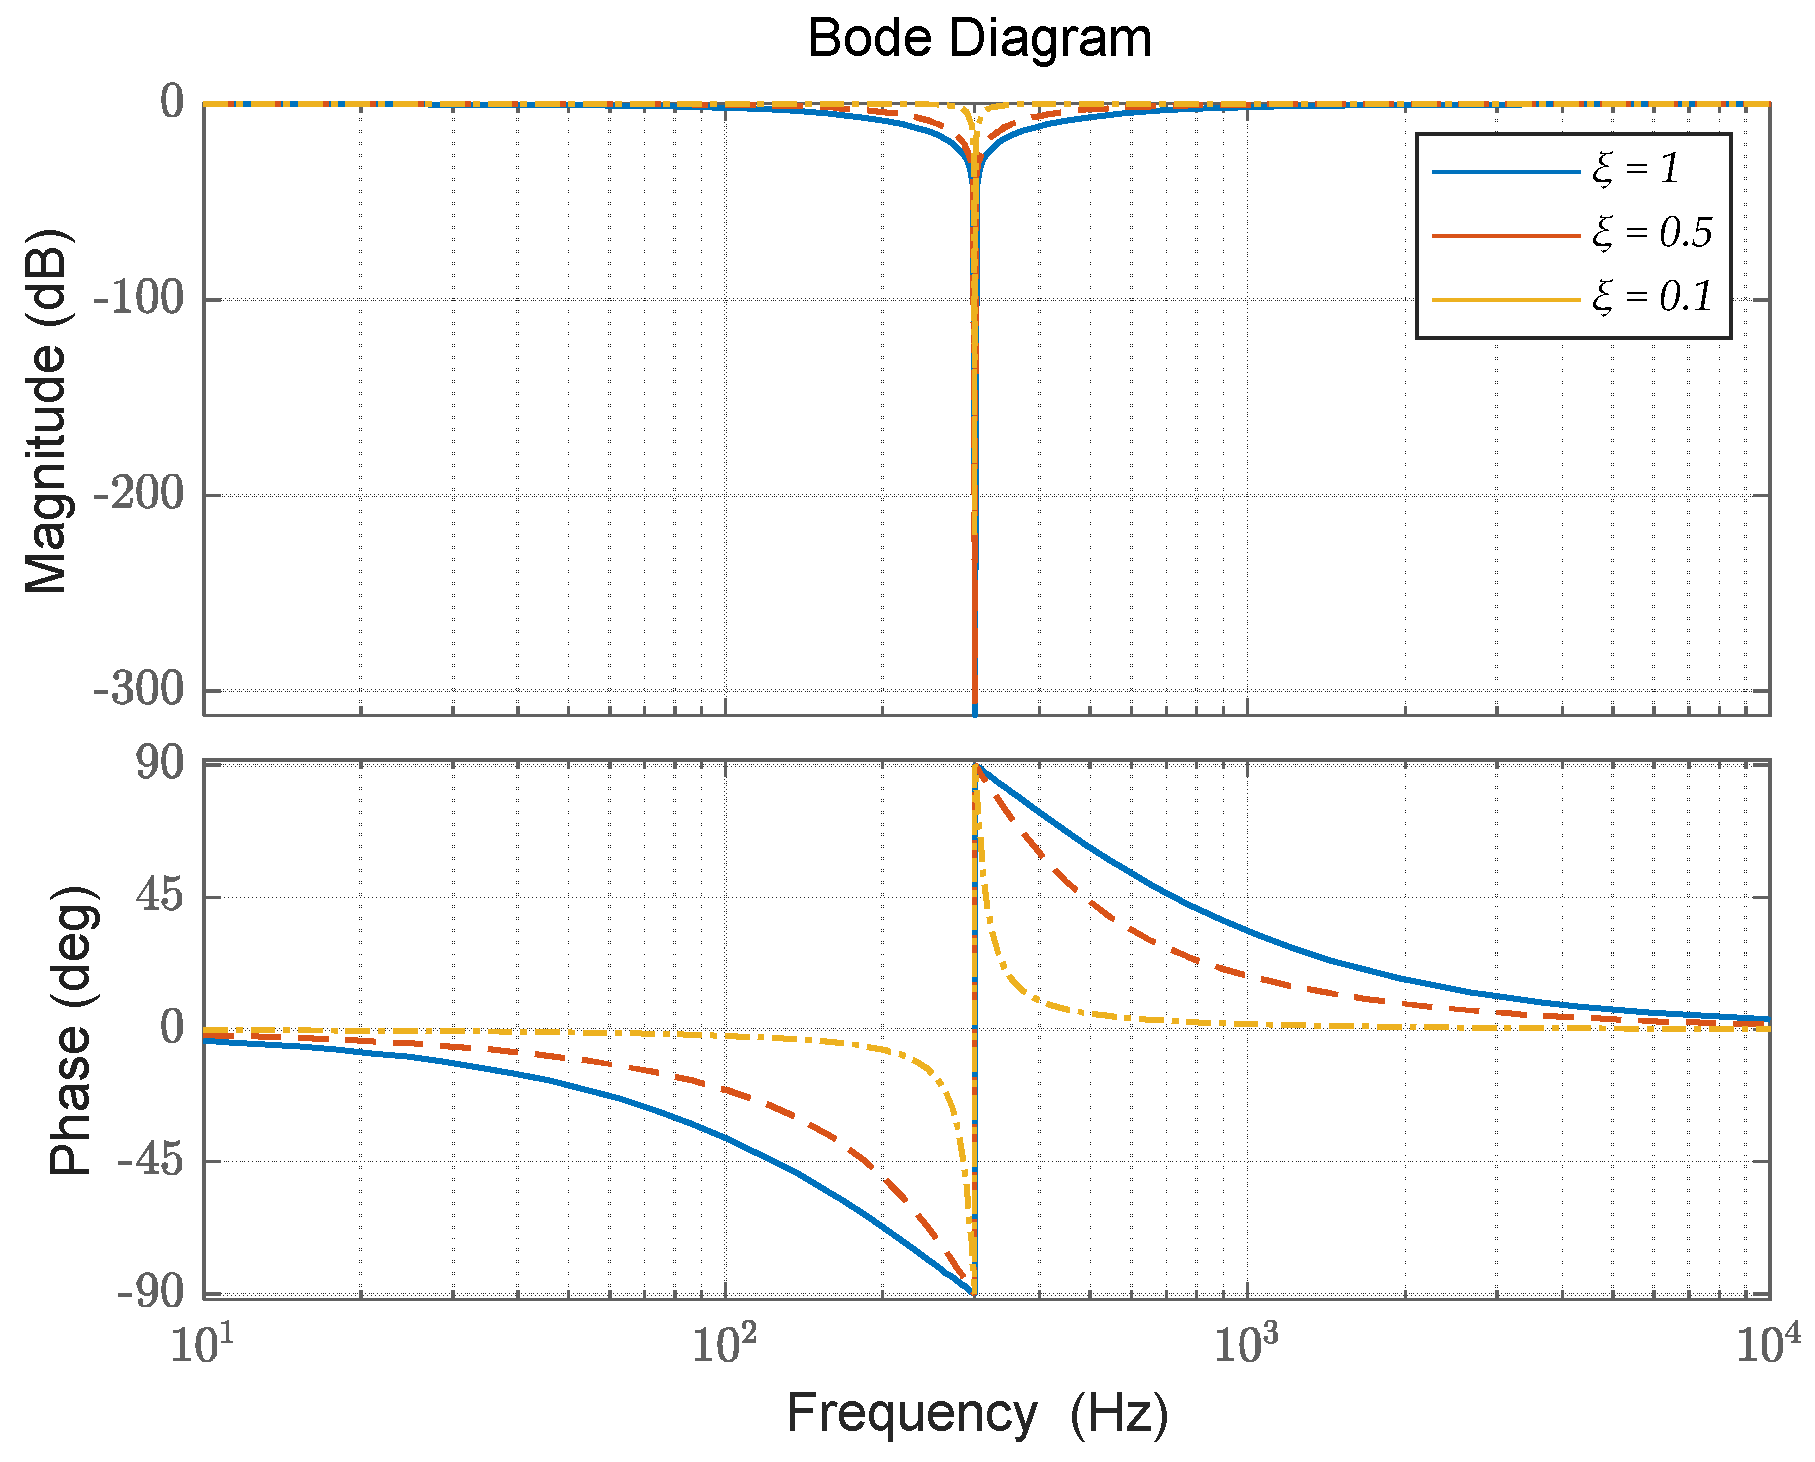
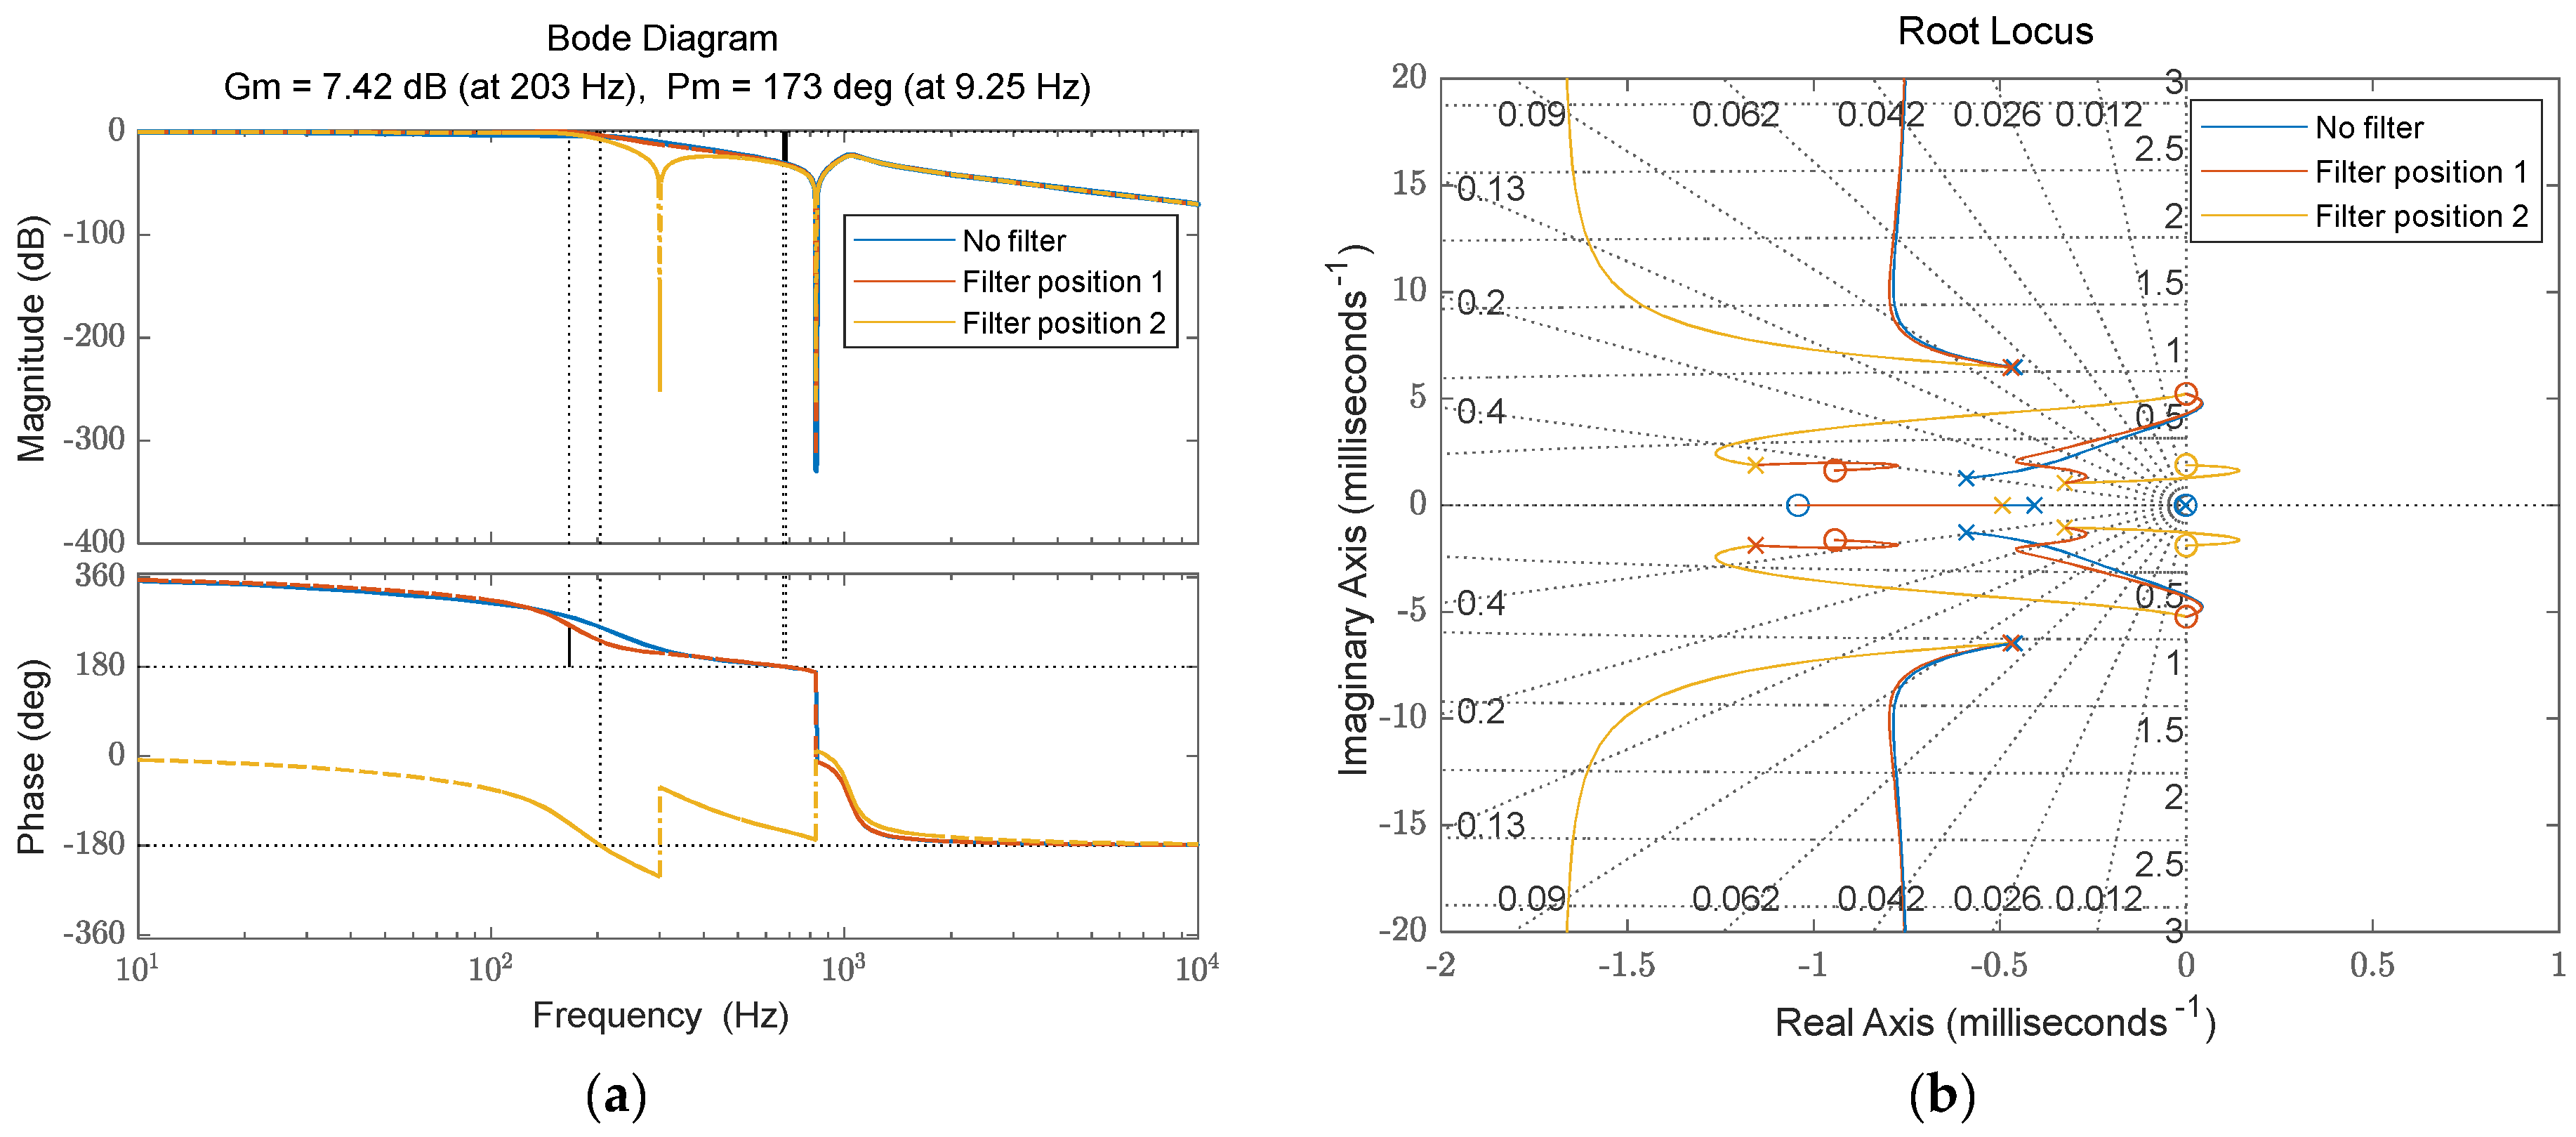
4.2.1. Improvement of Band-Stop Filter
4.2.2. Selection of Feedback Location
5. Simulation and Experimental Verification
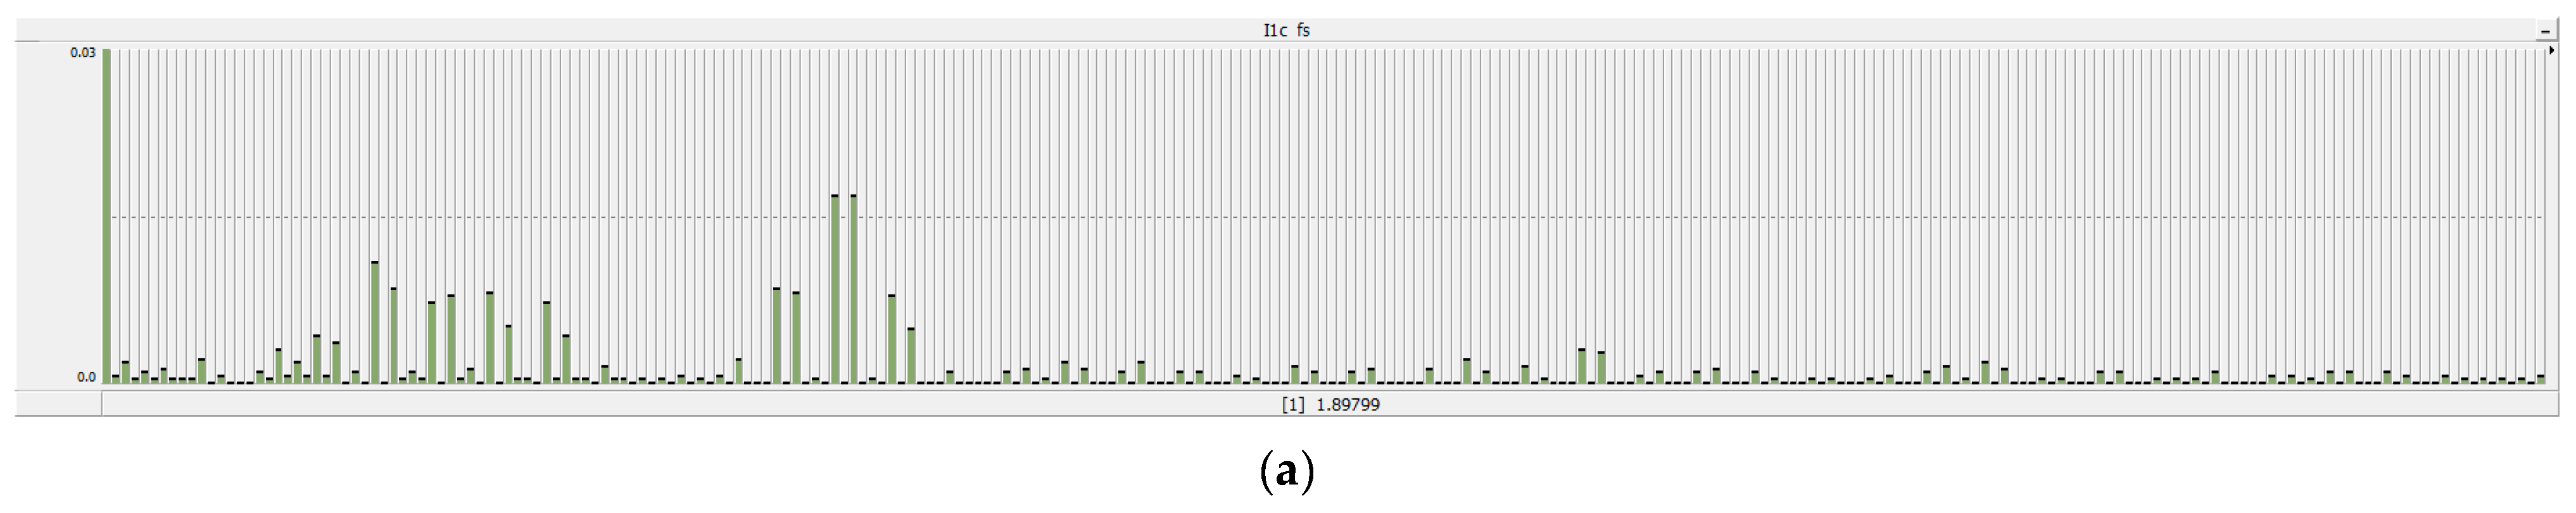
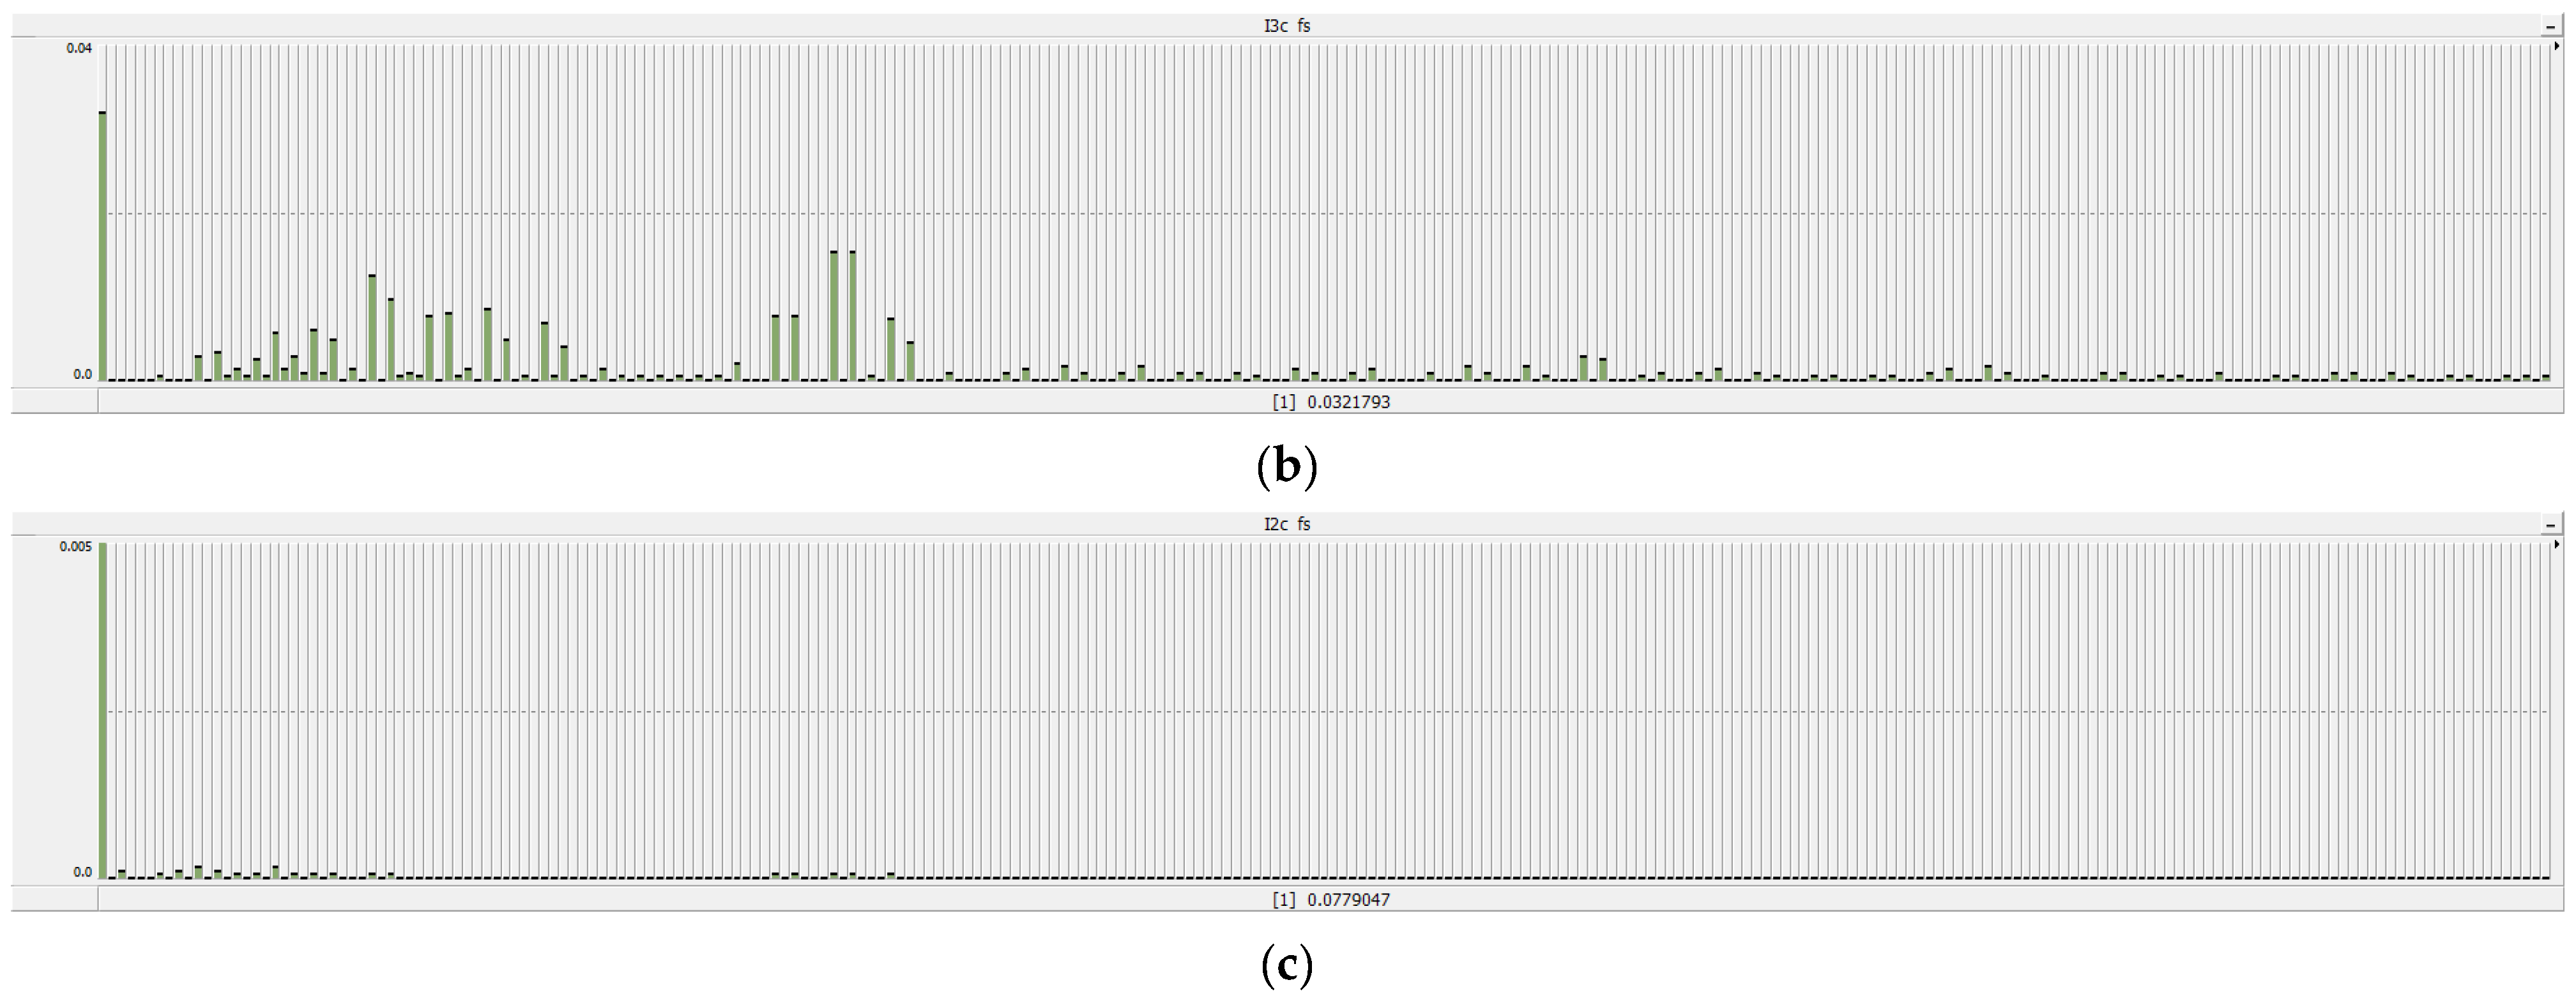
5.1. Harmonic Suppression Experiment
5.2. Immunity Recovery Experiment
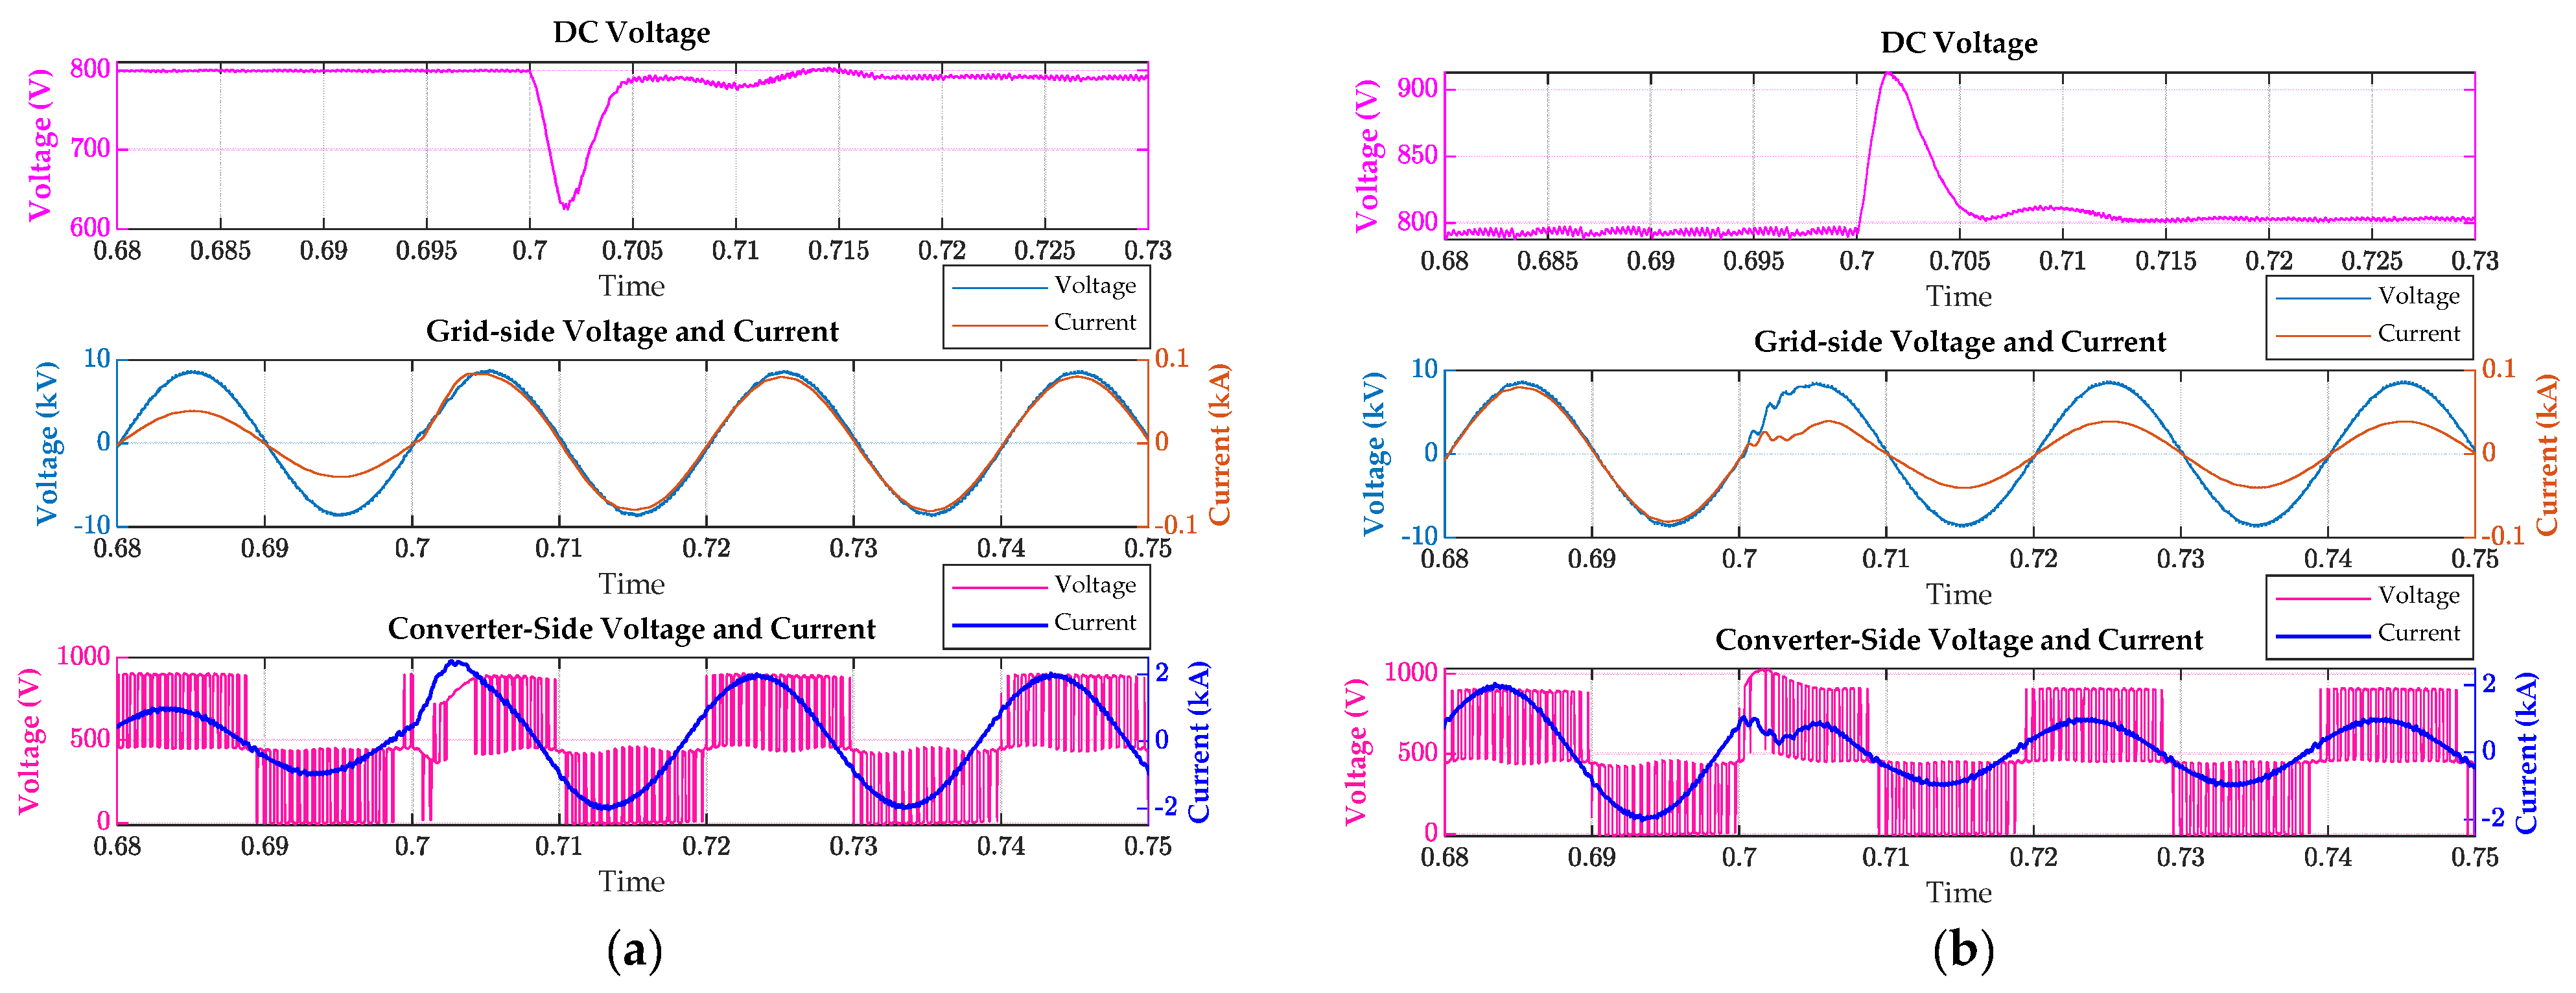
5.2.1. Power Mutation
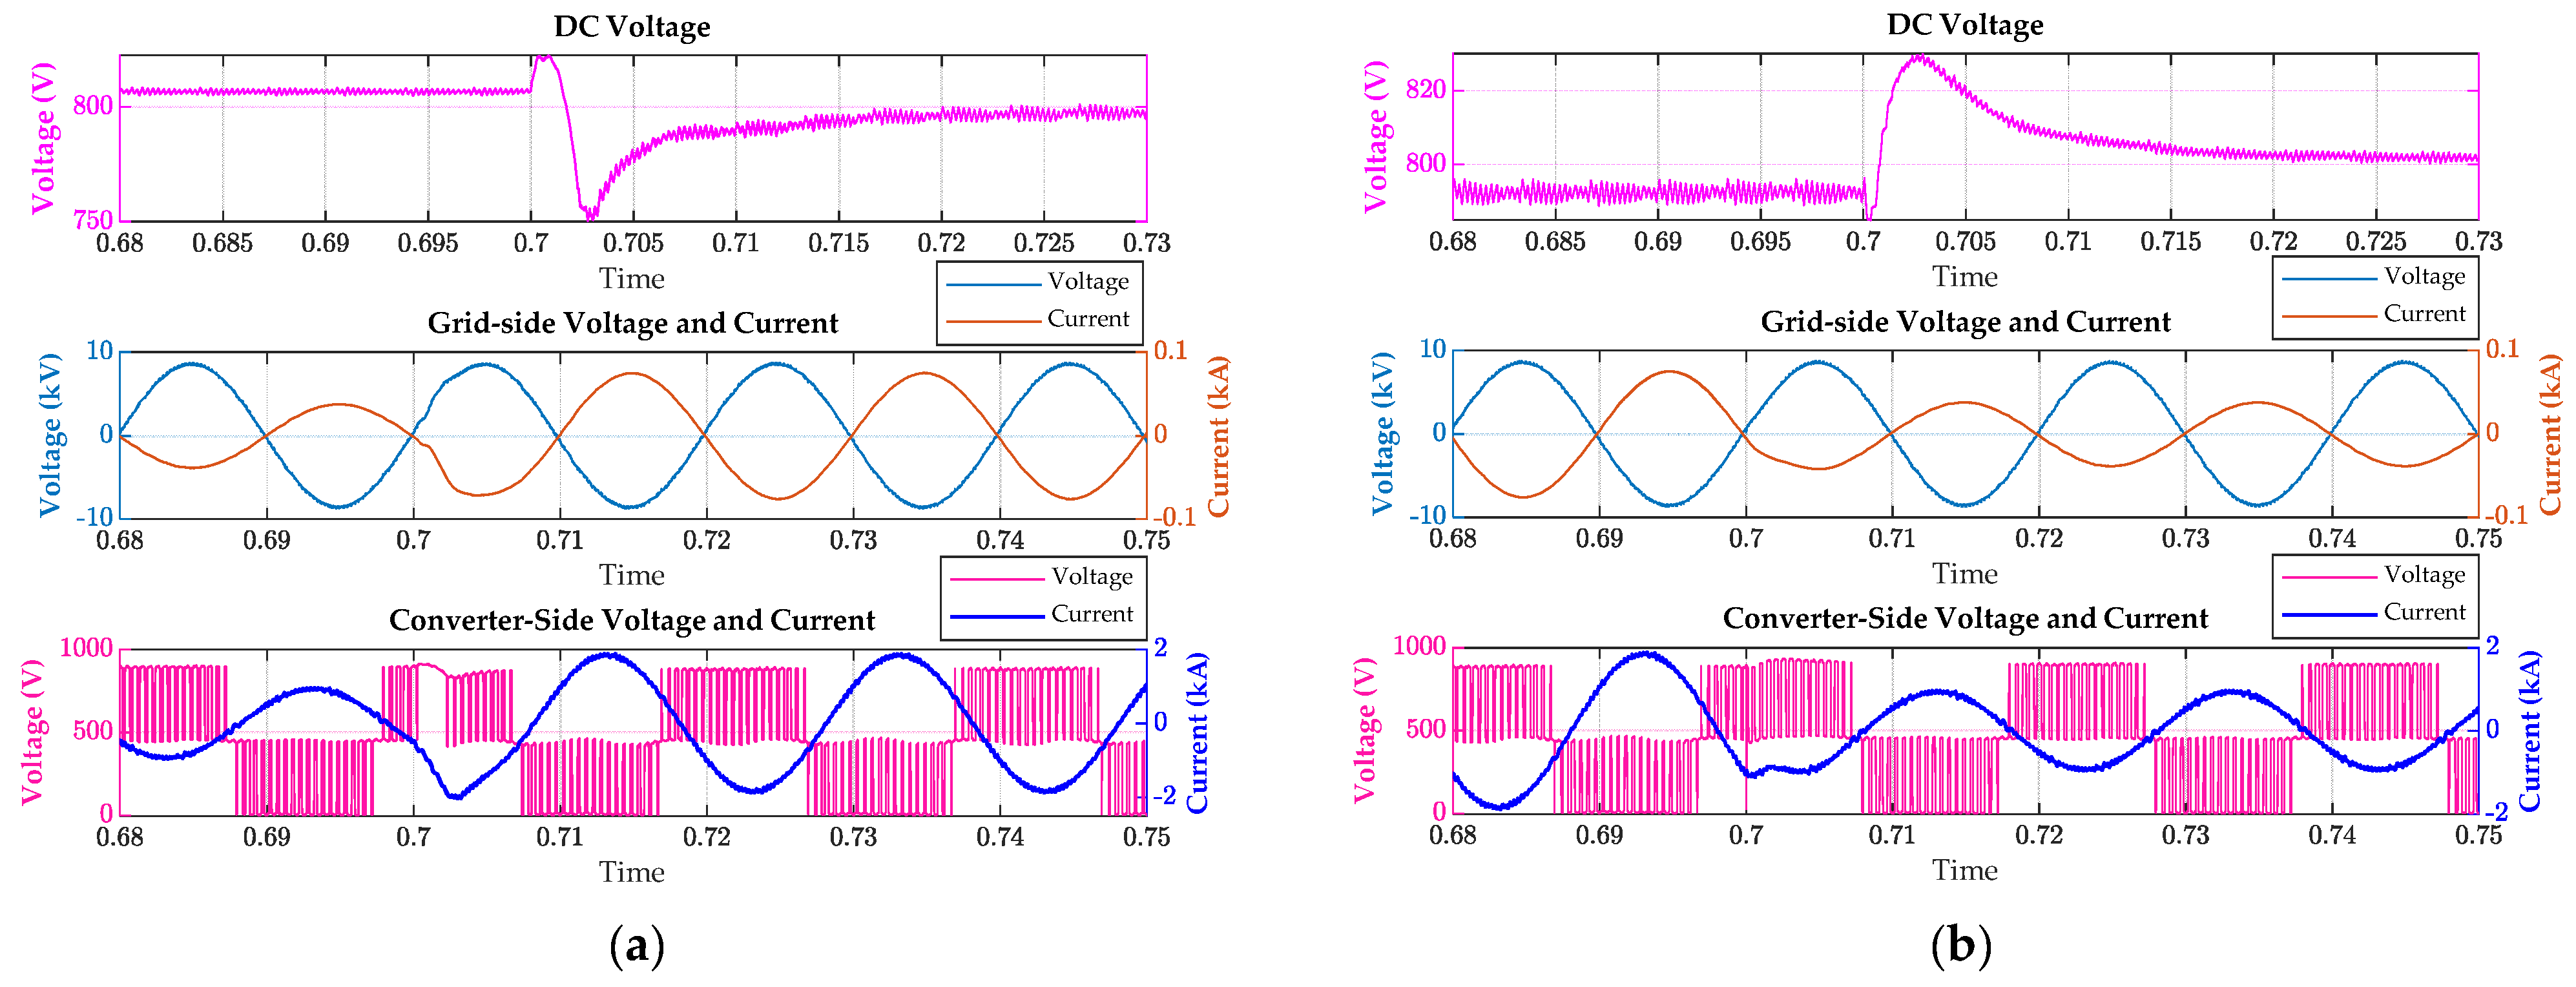
5.2.2. Voltage Transients
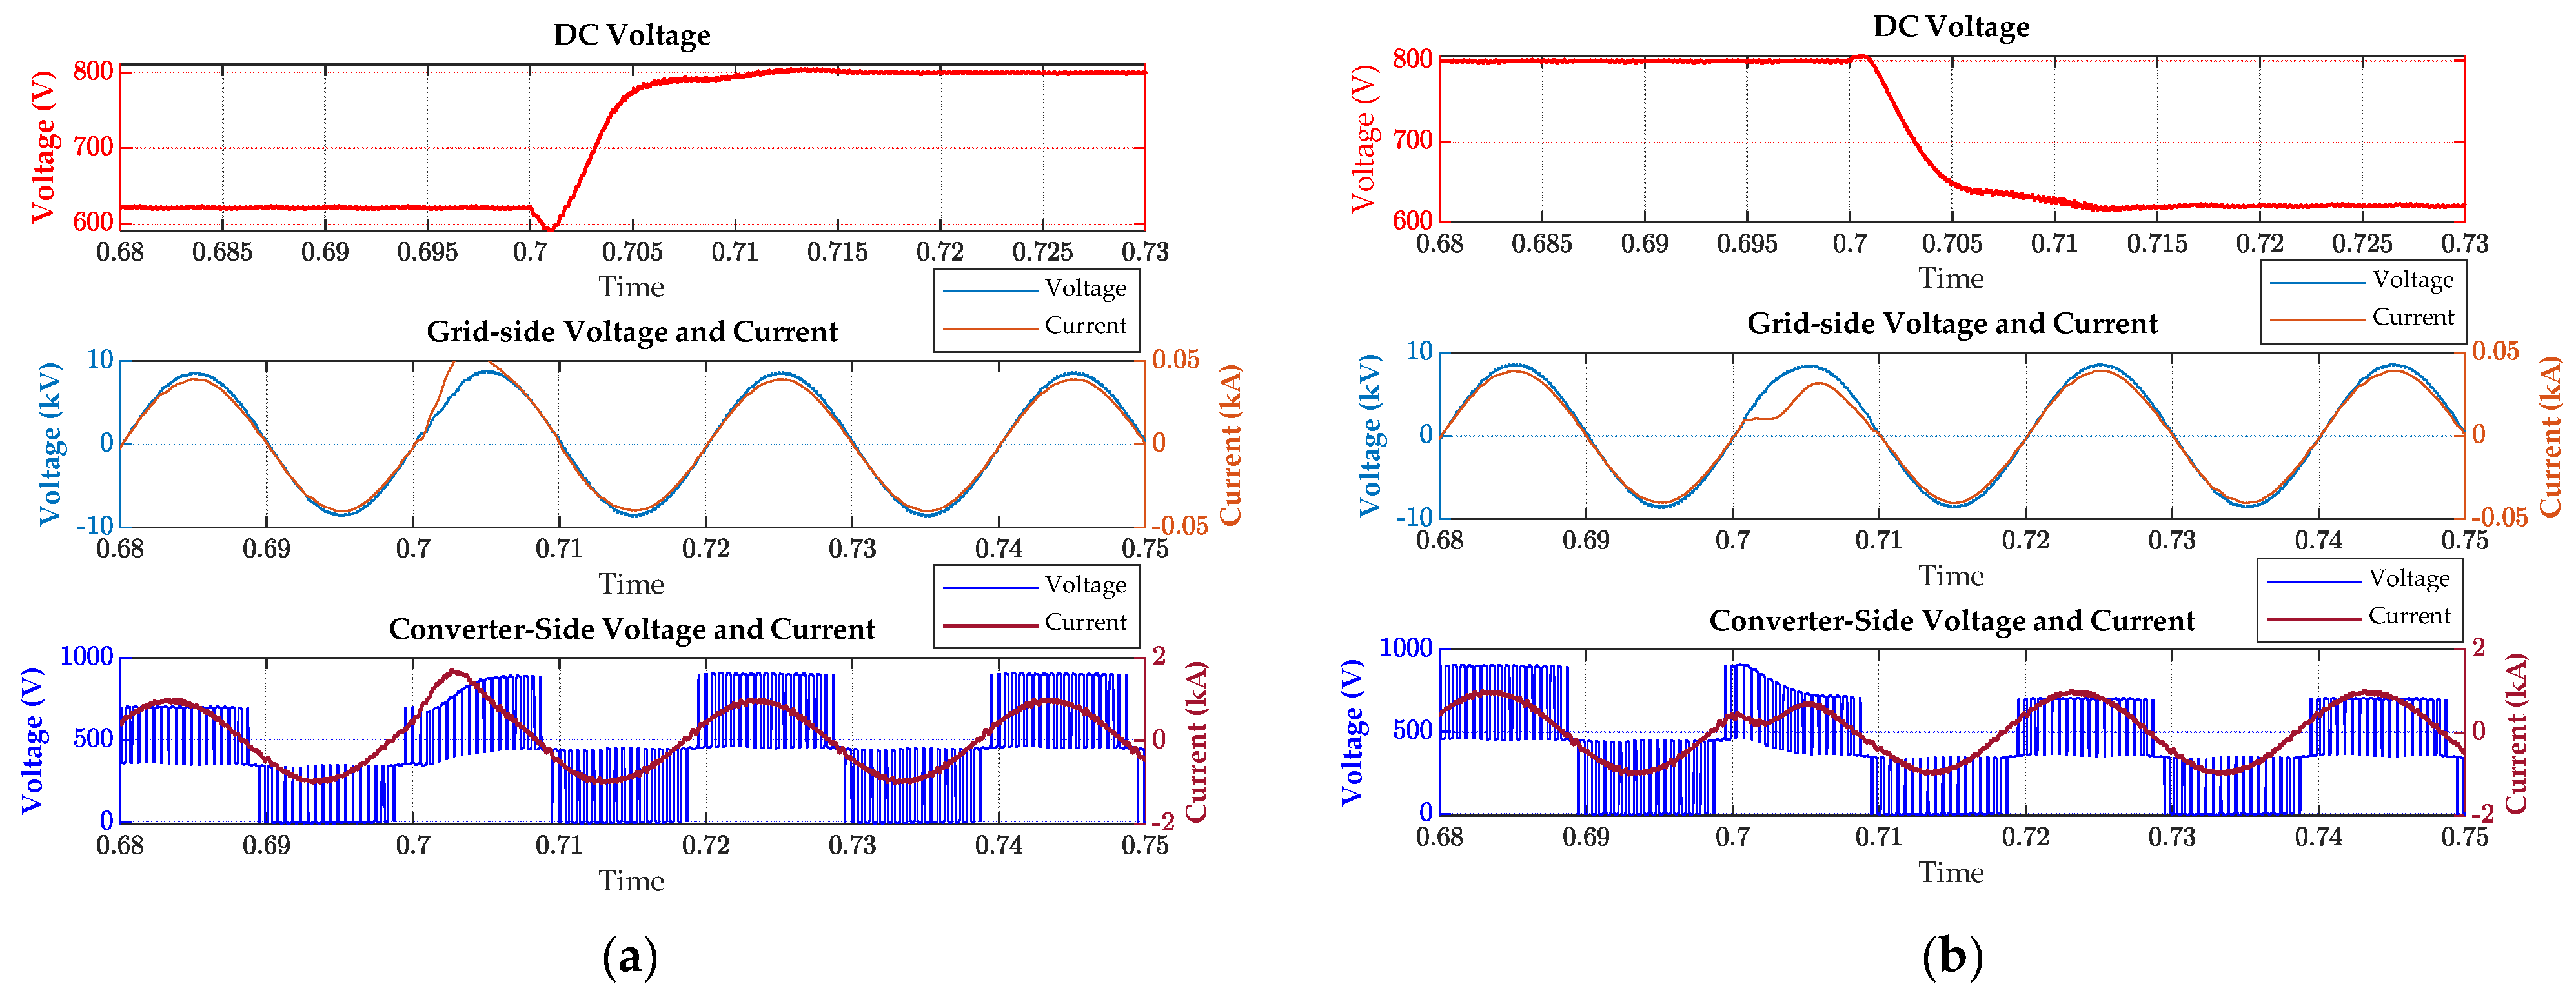
5.2.3. Fault Protection
6. Conclusions
Author Contributions
Funding
Data Availability Statement
Conflicts of Interest
References
- Nasser, M.; Megahed, T.F.; Ookawara, S.; Hassan, H. A Review of Water Electrolysis–Based Systems for Hydrogen Production Using Hybrid/Solar/Wind Energy Systems. Env. Sci. Pollut. Res. 2022, 29, 86994–87018. [Google Scholar] [CrossRef] [PubMed]
- Zhang, X.; Zhang, H.; Zhang, L.; Du, L.; Wang, Q.; Zhou, D. Optimization of a Wind-PV-Hydrogen Production Coupling System Considering Economy, Environment, and Reliability. Int. J. Hydrogen Energy 2025, 105, 441–457. [Google Scholar] [CrossRef]
- Wang, Z.; Zhang, X.; Rezazadeh, A. Hydrogen Fuel and Electricity Generation from a New Hybrid Energy System Based on Wind and Solar Energies and Alkaline Fuel Cell. Energy Rep. 2021, 7, 2594–2604. [Google Scholar] [CrossRef]
- Martinez, A.; Iglesias, G. Evaluation of Offshore Wind Energy Zones within Marine Spatial Planning: A Case Study in the Spanish Mediterranean Sea. Energy Rep. 2024, 11, 3461–3473. [Google Scholar] [CrossRef]
- Sun, Y.; Ai, H.; Li, Y.; Wang, R.; Ma, R. Data-Driven Large-Scale Spatial Planning Framework for Determining Size and Location of Offshore Wind Energy Development: A Case Study of China. Appl. Energy 2024, 367, 123388. [Google Scholar] [CrossRef]
- Su, X.; Wang, X.; Xu, W.; Yuan, L.; Xiong, C.; Chen, J. Offshore Wind Power: Progress of the Edge Tool, Which Can Promote Sustainable Energy Development. Sustainability 2024, 16, 7810. [Google Scholar] [CrossRef]
- Liserre, M.; Blaabjerg, F.; Hansen, S. Design and Control of an LCL-Filter-Based Three-Phase Active Rectifier. IEEE Trans. Ind. Applicat. 2005, 41, 1281–1291. [Google Scholar] [CrossRef]
- Dannehl, J.; Fuchs, F.W.; Hansen, S.; Thøgersen, P.B. Investigation of Active Damping Approaches for PI-Based Current Control of Grid-Connected Pulse Width Modulation Converters with LCL Filters. IEEE Trans. Ind. Applicat. 2010, 46, 1509–1517. [Google Scholar] [CrossRef]
- Karimi-Ghartemani, M.; Iravani, M.R. A Method for Synchronization of Power Electronic Converters in Polluted and Variable-Frequency Environments. IEEE Trans. Power Syst. 2004, 19, 1263–1270. [Google Scholar] [CrossRef]
- Tang, Y.; Loh, P.C.; Wang, P.; Choo, F.H.; Gao, F.; Blaabjerg, F. Generalized Design of High Performance Shunt Active Power Filter With Output LCL Filter. IEEE Trans. Ind. Electron. 2012, 59, 1443–1452. [Google Scholar] [CrossRef]
- Yan, H.; Zhou, X.; Zhang, H.; Yang, F.; Wu, Z.-G. A Novel Sliding Mode Estimation for Microgrid Control with Communication Time Delays. IEEE Trans. Smart Grid 2019, 10, 1509–1520. [Google Scholar] [CrossRef]
- Zhang, J.; Li, H.; Kong, X.; Zhou, J.; Shi, G.; Zang, J.; Wang, J. A Novel Multiple-Medium-AC-Port Power Electronic Transformer. IEEE Trans. Ind. Electron. 2024, 71, 6568–6578. [Google Scholar] [CrossRef]
- Hang, J.; Wang, X.; Li, W.; Ding, S. Interturn Short-Circuit Fault Diagnosis and Fault-Tolerant Control of DTP-PMSM Based on Subspace Current Residuals. IEEE Trans. Power Electron. 2025, 40, 3395–3404. [Google Scholar] [CrossRef]
- Yang, M.; Jiang, Y.; Zhang, W.; Li, Y.; Su, X. Short-Term Interval Prediction Strategy of Photovoltaic Power Based on Meteorological Reconstruction with Spatiotemporal Correlation and Multi-Factor Interval Constraints. Renew. Energy 2024, 237, 121834. [Google Scholar] [CrossRef]
- Wan, A.; Gong, W.; Iqbal, A.; AL-Bukhaiti, K.; Ji, Y.; Duer, S.; Ma, S.; Yao, F. Robust Loop Shaping Design Pitch Control of Wind Turbine for Maximal Power Output and Reduced Loading. Energy 2025, 319, 135136. [Google Scholar] [CrossRef]
- Wood, D.A. Spatio-Temporal Attributes of Varicella-Zoster Case Number Trends Assist with Optimizing Machine Learning Predictions. Mar. Environ. Data Inf. Netw. 2023, 1, 43–53. [Google Scholar] [CrossRef]
- Valadbeigi, A.P.; Sedigh, A.K.; Lewis, F.L. H∞ Static Output-Feedback Control Design for Discrete-Time Systems Using Reinforcement Learning. IEEE Trans. Neural Netw. Learn. Syst. 2020, 31, 396–406. [Google Scholar] [CrossRef]
- Charles, S.; Natarajan, J. Identification of Key Gene Modules and Novel Transcription Factors in Tetralogy of Fallot Using Machine Learning and Network Topological Features. Mar. Environ. Data Inf. Netw. 2023, 1, 27–34. [Google Scholar] [CrossRef]
- Adeyanju, S.A.; Ogunjobi, T.T. Machine Learning in Genomics: Applications in Whole Genome Sequencing, Whole Exome Sequencing, Single-Cell Genomics, and Spatial Transcriptomics. Mar. Environ. Data Inf. Netw. 2024. [Google Scholar] [CrossRef]
- Adamas-Pérez, H.; Ponce-Silva, M.; Mina-Antonio, J.D.; Claudio-Sánchez, A.; Rodríguez-Benítez, O.; Rodríguez-Benítez, O.M. A New LCL Filter Design Method for Single-Phase Photovoltaic Systems Connected to the Grid via Micro-Inverters. Technologies 2024, 12, 89. [Google Scholar] [CrossRef]
- Zhang, Y.; Song, C.; Wang, T.; Wang, K. Optimization of Passive Damping for LCL-Filtered AC Grid-Connected PV-Storage Integrated Systems. Electronics 2025, 14, 801. [Google Scholar] [CrossRef]
- Jena, K.; Kesh, R.; Kumar, D.; Padhy, A.P.; Ahmed, M.I.; Panigrahi, C.K. Transformer-Less Multilevel Inverter (TMLI) with Reduced Device Count and Voltage Stress. e-Prime-Adv. Electr. Eng. Electron. Energy 2024, 7, 100417. [Google Scholar] [CrossRef]
- Wang, X.; Zhuang, R.; Cai, J. Theoretical Analysis of a Fractional-Order LLCL Filter for Grid-Tied Inverters. Fractal Fract. 2023, 7, 135. [Google Scholar] [CrossRef]
- Wang, B.; Zhao, Q.; Zhang, G.; Zhang, H.; Liu, K.; Yue, X. Novel Active Damping Design Based on a Biquad Filter for an LLCL Grid-Tied Inverter. Energies 2023, 16, 1093. [Google Scholar] [CrossRef]
- Bolsi, P.C.; Prado, E.O.; Sartori, H.C.; Lenz, J.M.; Pinheiro, J.R. LCL Filter Parameter and Hardware Design Methodology for Minimum Volume Considering Capacitor Lifetimes. Energies 2022, 15, 4420. [Google Scholar] [CrossRef]
- Abbas, H.H.; Shafiee, Q.; Bevrani, H. Optimal Passive LCL Filter Design for Grid-Connected Converters in Weak Grids. Electr. Power Syst. Res. 2024, 235, 110896. [Google Scholar] [CrossRef]
- Blachuta, M.; Bieda, R.; Grygiel, R. High Performance Single and Double Loop Digital and Hybrid PID-Type Control for DC/AC Voltage Source Inverters. Energies 2022, 15, 785. [Google Scholar] [CrossRef]
- Zhou, Z.; Song, J.; Yu, Y.; Xu, Q.; Zhou, X. Research on High-Quality Control Technology for Three-Phase PWM Rectifier. Electronics 2023, 12, 2417. [Google Scholar] [CrossRef]
- Abdolrasol, M.G.M.; Hannan, M.A.; Hussain, S.M.S.; Ustun, T.S. Optimal PI Controller Based PSO Optimization for PV Inverter Using SPWM Techniques. Energy Rep. 2022, 8, 1003–1011. [Google Scholar] [CrossRef]
- Suid, M.H.; Ahmad, M.A. Optimal Tuning of Sigmoid PID Controller Using Nonlinear Sine Cosine Algorithm for the Automatic Voltage Regulator System. ISA Trans. 2022, 128, 265–286. [Google Scholar] [CrossRef]
- Marzo, I.; Muguruza, I.; Sanchez-Ruiz, A.; Abad, G.; Fernandez-Rebolleda, H.; Costa-Iriarte, J.J.; Barrena, J.A. Zero-Sequence Controller Requirements and Comparison for a Delta-CHB STATCOM under Unbalanced Operation. Int. J. Electr. Power Energy Syst. 2024, 156, 109785. [Google Scholar] [CrossRef]
- Zhou, L.; Han, W.; Qi, J.; Zhou, Z. Adaptive PI + VPI Harmonic Current Compensation Strategy under Weak Grid Conditions. Appl. Sci. 2023, 13, 5983. [Google Scholar] [CrossRef]
- Zhou, X.; Zhou, Y.; Ma, Y.; Yang, L.; Yang, X.; Zhang, B. DC Bus Voltage Control of Grid-Side Converter in Permanent Magnet Synchronous Generator Based on Improved Second-Order Linear Active Disturbance Rejection Control. Energies 2020, 13, 4592. [Google Scholar] [CrossRef]
- Kwon, J.-H.; Zhou, G.; Kim, C.-S.; Park, S.-J.; Wang, Y. A Second Harmonic Current Suppression Strategy Based on a Digital Band-Stop Filter with Center Frequency Tracking Grid Frequency. IEEE Access 2025, 13, 13250–13263. [Google Scholar] [CrossRef]
- IEEE 1547-2018; IEEE Standard for Interconnection and Interoperability of Distributed Energy Resources with Associated Electric Power Systems Interfaces. IEEE: New York, NY, USA, 2018. [CrossRef]


| Parameter | Value | Parameter | Value | Parameter | Value |
|---|---|---|---|---|---|
| Rated power | 0.5 MW | Transformer MVA | 3.3 MW | Proportional coefficient of current loop | 0.0439 |
| Peak power | 1 MW | Transformer ratio | 10.5/0.43/0.43 | Integral coefficient of current loop | 45.66 |
| Grid voltage | 10.5 kV | Transformer type | Delta/Y/Y | Integral time constant | 0.0219 |
| Converter side voltage | 0.43 kV | Transformer X12 | 0.151 | Proportional coefficient of V-PI controller | 0.2 |
| Rated DC | 800 V | Transformer X13 | 0.076 | Integral coefficient of V-PI controller | 87.6 |
| DC range | 700~900 V | Transformer X23 | 0.1 | ωg | 600π rad/s |
| Solution time step | 1 μs | Channel plot step | 10 μs | switching frequency | 2 kHz |
| Voltage Loop | No Filter | Band-Stop Filter | ||
|---|---|---|---|---|
| Current Loop | PI | M-Q-PR | PI-VPI | |
| Converter side | Fundamental wave | 1.898 kA | 1.899 A | 1.897 kA |
| 5th harmonic current | 0.401% | 0.076% | 0.024% | |
| 7th harmonic current | 0.252% | 0.1% | 0.049% | |
| THD255 | 2.11% | 2.01% | 1.97% | |
| Grid side | Fundamental wave | 77.41 A | 77.6 A | 77.9 A |
| 5th harmonic current | 0.48% | 0.077% | 0.033% | |
| 7th harmonic current | 0.35% | 0.14% | 0.059% | |
| THD255 | 1.65% | 1.27% | 0.55% | |
| Control algorithm | Algorithm 1 | Algorithm 2 | Algorithm 3 | |
Disclaimer/Publisher’s Note: The statements, opinions and data contained in all publications are solely those of the individual author(s) and contributor(s) and not of MDPI and/or the editor(s). MDPI and/or the editor(s) disclaim responsibility for any injury to people or property resulting from any ideas, methods, instructions or products referred to in the content. |
© 2025 by the authors. Licensee MDPI, Basel, Switzerland. This article is an open access article distributed under the terms and conditions of the Creative Commons Attribution (CC BY) license (https://creativecommons.org/licenses/by/4.0/).
Share and Cite
Ma, L.; Dong, R.; Fu, Q.; Wang, C.; Li, X. Optimization Control of Flexible Power Supply System Applied to Offshore Wind–Solar Coupled Hydrogen Production. J. Mar. Sci. Eng. 2025, 13, 1135. https://doi.org/10.3390/jmse13061135
Ma L, Dong R, Fu Q, Wang C, Li X. Optimization Control of Flexible Power Supply System Applied to Offshore Wind–Solar Coupled Hydrogen Production. Journal of Marine Science and Engineering. 2025; 13(6):1135. https://doi.org/10.3390/jmse13061135
Chicago/Turabian StyleMa, Lishan, Rui Dong, Qiang Fu, Chunjie Wang, and Xingmin Li. 2025. "Optimization Control of Flexible Power Supply System Applied to Offshore Wind–Solar Coupled Hydrogen Production" Journal of Marine Science and Engineering 13, no. 6: 1135. https://doi.org/10.3390/jmse13061135
APA StyleMa, L., Dong, R., Fu, Q., Wang, C., & Li, X. (2025). Optimization Control of Flexible Power Supply System Applied to Offshore Wind–Solar Coupled Hydrogen Production. Journal of Marine Science and Engineering, 13(6), 1135. https://doi.org/10.3390/jmse13061135