Article

Seasonal Self-Purification Process of Nutrients Entering Coastal Water from Land-Based Sources in Tieshan Bay, China: Insights from Incubation Experiments

1
College of Chemistry and Environment, Guangdong Ocean University, Zhanjiang 524088, China
2
Guangxi Key Laboratory of Marine Environmental Change and Disaster in Beibu Gulf, Beibu Gulf University, Qinzhou 535011, China
3
Marine Environmental Monitoring Center of Guangxi, Beihai 536000, China
*
Author to whom correspondence should be addressed.
J. Mar. Sci. Eng. 2025, 13(6), 1133; https://doi.org/10.3390/jmse13061133
Submission received: 12 March 2025 / Revised: 29 May 2025 / Accepted: 2 June 2025 / Published: 5 June 2025
(This article belongs to the Section Marine Environmental Science)

Abstract

Nutrients function as essential biological substrates for coastal phytoplankton growth and serve as pivotal indicators in marine environmental monitoring. The intensification of land-based nutrient sources inputs has exacerbated eutrophication in Chinese coastal water, while mechanistic understanding of differential self-purification processes among distinct land-based source nutrients (river source, domestic source, aquaculture source, and industrial source) remains limited, constraining accurate assessment of bay’s self-purification capacity. This study conducted incubation experiments in Tieshan Bay (TSB) during Summer (June 2023) and winter (January 2024), systematically analyzing the self-purification process of nutrients and associated environmental drivers. Distinct source-specific patterns emerged: river inputs exhibited maximal dissolved inorganic nitrogen (DIN) 1.390 ± 0.74 mg/L, whereas industrial discharges showed peak dissolved inorganic phosphorus (DIP) 4.88 ± 1.45 mg/L. Chlorophyll a (Chl-a) concentrations varied markedly across sources, ranging from 34.97 ± 23.37 μg/L (domestic source) to 86.63 ± 77.08 μg/L (river source). First-order kinetics demonstrated significant source differentiation (p < 0.05). River-derived DIN exhibited the highest attenuation coefficient (−0.3244 ± 0.17 d−1), contrasting with industrial-sourced DIP showing maximum depletion (−0.4332 ± 0.20 d−1). Correlation analysis indicated that summer was significantly associated with the impacts of three key control factors pH, dissolved oxygen, and turbidity on nutrient dynamics (p < 0.05), whereas winter exhibited a stronger dependence on salinity. These parameters collectively may modulate microbial degradation pathways and particulate matter adsorption capacities. These findings establish quantitative thresholds for coastal nutrient buffering mechanisms, highlighting the necessity for source-specific eutrophication mitigation frameworks. The differential self-purification efficiencies underscore the importance of calibrating pollution control strategies according to both anthropogenic discharge characteristics and regional hydrochemical resilience, which is of key importance for ensuring the traceability and control of land-based sources of pollution into the sea and the scientific utilization of the self-purification capacity of the bay water body.

1. Introduction

Nutrients in the ocean serve as a critical chemical foundation for coastal productivity and material cycling. The deficiency of any essential nutrient can become a limiting factor for plankton growth, making nutrient dynamics in seawater one of the key focuses in coastal water research [1,2,3,4,5]. Nutrients, particularly dissolved inorganic nitrogen (DIN), dissolved inorganic phosphorus (DIP), and dissolved silicate (DSi), function as essential metabolic substrates for marine primary producers during photosynthetic processes [1]. The classical Redfield stoichiometric ratio is defined as C:N:P = 106:16:1 [1]. It governs their assimilation patterns by phytoplankton communities, thereby establishing a delicate biogeochemical equilibrium in marine systems. The flux dynamics of nutrients profoundly influence the structure and function of marine ecosystems, which in turn impact the stability and health of the entire ecosystem. Additionally, nutrient influx can also affect water quality and the ecological environment in estuaries. Excessive nutrients input can lead to water eutrophication [2,3], promoting algae reproduction and the formation of various environmental problems [4,5]. This not only damages the marine ecosystem but also poses a serious threat to the environmental quality of the coastal ecosystem. With the rapid economic development of Tieshan Bay (TSB) and the surrounding areas, water eutrophication presents a potential threat to the sustainable health of TSB’s ecological environment [6,7].
As the transition zone between land and ocean, the estuary is severely disturbed by human activities [8]. In recent decades, with the rapid economic and social development in coastal regions [7], environmental issues in the Gulf have become increasingly significant. The Gulf serves not only as the most critical maritime passage connecting coastal areas to the world but also as a key receptor for land-based sources pollutants. Huang monitored the water quality in Sansha Bay [6], and the results showed that land-based input is the main source of nitrogen nutrients in the surface water in spring and summer. Liu Monitoring data from 15 coastal voyages in Xiamen between 2016 and 2020 indicate a gradual decrease in nutrient concentrations from nearshore to offshore areas [9,10]. Consequently, the influx of land-derived nutrients is the main driver of offshore pollution, which dynamically varies within the bay due to seawater dilution processes. A substantial number of studies have demonstrated that the process of nutrient transportation and transformation within estuaries constitutes a pivotal aspect of the investigation of biogeochemical processes within estuarine bays.
TSB is a key outlet of the Beibu Gulf in Guangxi and serves as the primary industrial base of Beihai City. In recent years, marine development along the coast has surged, leading to an evident increase in pollutants originating from aquaculture activities [11]. Moreover, surveys have indicated that the level of organic content pollution in TSB is mild, with no exceedances of organic pollutants observed at survey stations in TSB during the summer of 2021 and the winter of 2022. Additionally, the degree of PCOD is found to be significantly higher in summer than in winter, and organic pollution levels in TSB during winter are generally at a relatively low level [11,12]. Nutrient concentrations in TSB harbor exhibited an increasing trend followed by a decrease from 2003 to 2010 [13]. In 2008, another study demonstrated through three voyages that nutrient concentrations decreased from the mouth of TSB harbor to the southern waters of the North Sea [14]. Long-term variations in nutrient levels are primarily influenced by runoff and land-based pollution sources [15]. Extensive investigations indicate that nutrient concentrations in TSB decline gradually from the harbor mouth to the outer sea, with runoff, land-based pollution, and industrial discharges being the main influencing factors. However, the self-purification process of different pollution sources has not been explored.
Therefore, to investigate the self-purification processes of nutrients from different land-based sources in the bay, better protect the ecological health of TSB, rationally utilize the self-purification capacity of the ocean for land-based source pollutants, and identify key controlling factors influencing these processes [16], this study conducted an incubation experiments in summer and winter. The experiment monitors the nutrients and other environmental parameters (temperature, pH, salinity, turbidity, and chlorophyll a (Chl-a) originating from various land-based sources (river, domestic, aquaculture, and industrial) within TSB synchronously. These findings provide a scientific foundation for understanding the self-purification mechanisms of land-based sources nutrient inputs into TSB harbor and for developing effective pollution control strategies.
Environmental pollution in TSB primarily originates from land-based pollutants. The primary objective of the marine nutrient incubation experiments is to investigate and elucidate the mechanisms by which nutrients influence the growth and metabolic processes of marine organisms. The ocean constitutes a complex and delicate ecosystem, in which there is a great variety of organisms. Within this system, there exist intricate interrelationships among various organisms as well as between organisms and their environment. In this ecology, the self-purification process of nutrients is an important factor in the study of the marine system. The primary investigative focus of this study is the self-purification process of nutrients in seawater from various sources of pollution in TSB, including river source, domestic source, aquaculture source, and industrial source. The alterations in Chl-a in response to the introduction of nutrients from diverse pollution sources in TSB. Finally, the study will identify the key control factors of the self-purification process of nutrients from different pollution sources in TSB. The results of this study are expected to provide key self-purification parameters for understanding the biogeochemical processes of nutrients in TSB, and to provide a quantitative scientific basis for improving the accuracy of the environmental capacity calculation of the bay.

2. Materials and Methods
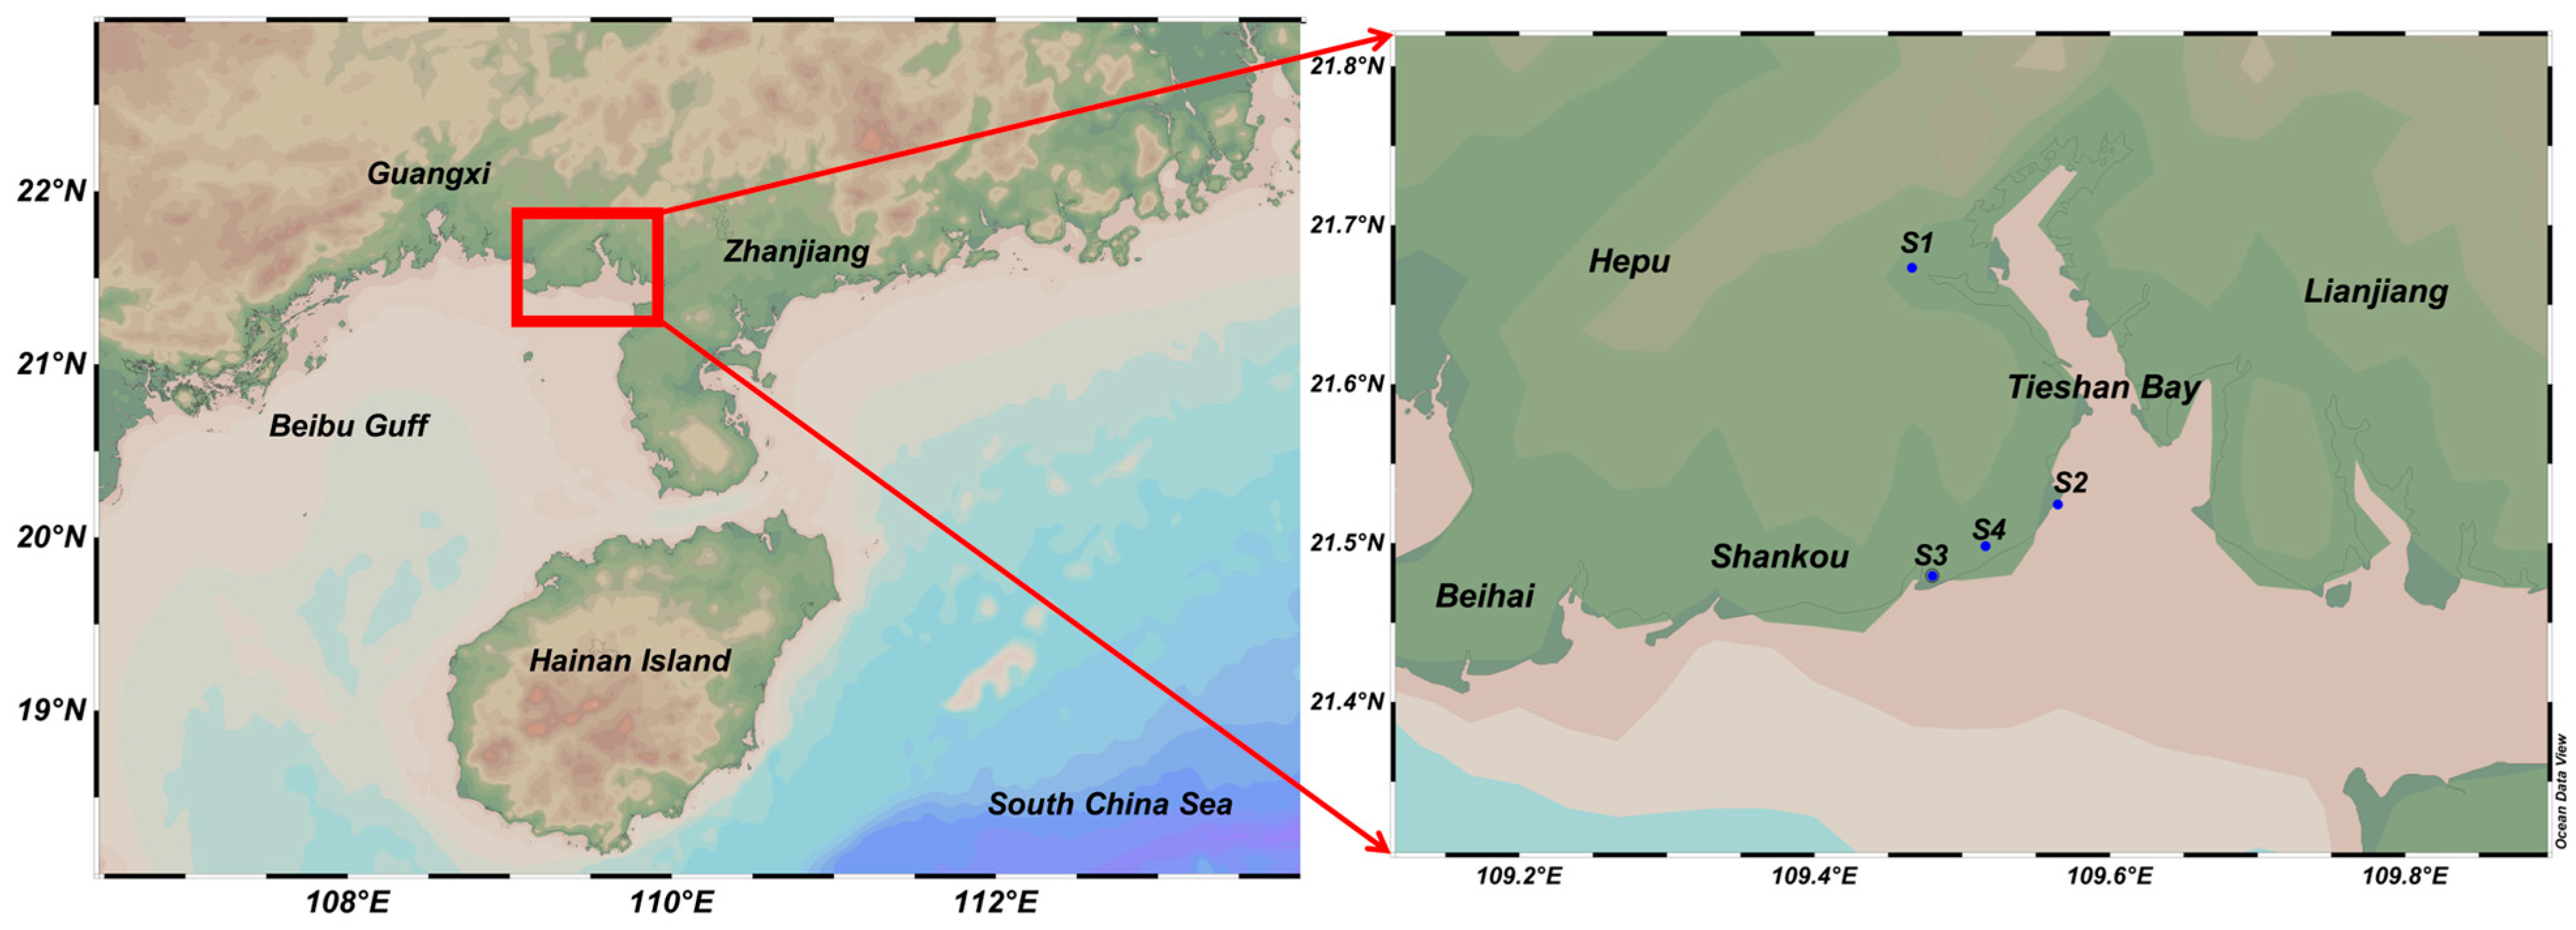
2.1. Study Area

TSB is located in the Beibu Gulf, to the east of Beihai City, spanning longitude 109°15′–109°45′ and latitude 21°26′–21°40′. The region has a southern subtropical monsoon climate with an annual mean temperature of 22.9 °C. The lowest temperature is −0.8 °C in winter and the highest is 37.4 °C in summer. The tidal regime is irregularly diurnal, with the mean and maximum tidal ranges (https://www.sciencedirect.com/topics/earth-and-planetary-sciences/tidal-range) (accessed on 20 February 2025) of 2.89 m and 6.25 m, respectively [17]. The average annual rainfall is 1573.4 mm [18], with the southern part of the national nature reserve being ecologically sensitive. TSB is a strong tidal bay, primarily influenced by the coastline, terrain, and monsoon, making it a key harbor along Guangxi’s coast [19,20]. However, due to industrialization, the water quality of TSB has significantly deteriorated [21], and the import of land-based nutrients is an important reason why the seawater quality exceeds the standard [22]. This study selects the typical pollution sources of TSB for research and sampling, and a total of 4 stations were laid (Figure 1).

2.2. Experimental Design of Ecological Incubation and Field Monitoring

This study investigates the transport mechanisms and biogeochemical transformations of nutrient species derived from heterogeneous wastewater effluents across the land-based sources [23]. By conducting a systematic analysis of advective-diffusive dynamics and speciation changes in the TSB system post-discharge, we aim to quantify source-specific dispersion pathways and marine bioavailability governing nutrient fate in transitional aquatic matrices [24]. For TSB along the sewage characteristics, we designed an experiment to identify four typical pollution sources along the coastal industry, respectively, in TSB outlet stance: river sources (S1), aquaculture sources (S2), Industrial sources (S3) and domestic sources (S4) (Table 1) sampling (Figure 1). The sampling points for the incubation experiments were obtained from various typical pollution sources in TSB (Table 2). Given the absence of major rivers discharging into the sea at TSB, the Fozi River was selected as a representative river source to simulate the self-purification process of river pollution under varying salinity and nutrient conditions in the upper reaches of TSB. Additionally, domestic pollution sources were collected from wastewater treatment plants. For industrial pollution sources, Refining and Sinopec Beihai Refining & Chemical Company, located in the coastal Industrial Zone of TSB was chosen. This company represents a typical industrial pollution source characterized by its large scale and economic significance. Samples of seawater, free from contaminants, were collected in proximity to the designated S2 aquaculture site. The sampling point was situated at a depth of 0.5 meters below sea level. The salinity of these samples was recorded as 27.2 PSU, while the temperature of the collected seawater was measured at 30.9 °C. Furthermore, the tide height at the time was recorded to be approximately 3 meters. The sewage sample was prefiltered through a 500-mesh sieve (nominal 30 μm) to exclude zooplankton organisms before microbial analysis. Then the sewage and seawater from four different pollution sources were mixed in proportion (Figure S1), so that the mixed water reached the average salinity gradient (low salinity = 10 PSU), (medium salinity = 18 PSU), (high salinity = 25 PSU) (Table 3). Due to the high salinity of the incubation water, the salinity gradient of the incubation varied (low salinity = 20 PSU), (medium salinity = 23 PSU), (high salinity = 25 PSU), according to the calculation formula of salinity mixing:
V f = ( S s S m i x ) ( S s S f ) · V t
Vf volume of freshwater from different sources to be added (L); Vt: total volume of the incubator (L); Sf increase in the salinity of freshwater due to inputs from different sources; Ss: salinity of the added seawater; and S m i x : salinity after mixing.
The incubation experiments device was put into the water environment in the water environment of the West Lake at Guangdong Ocean University for experiments, aiming to simulate the dynamic processes of different land-based sources inputs. The experimental setup consisted of eleven-liter plastic buckets (height 43.5 cm, length 20.6 cm, width 20.6 cm). Each bucket’s opening was sealed with a rubber plug for sampling purposes, and holes were drilled in the rubber plugs to insert 2 cm diameter, 40 cm long plastic tubes. These tubes ensured smooth air circulation and oxygen enrichment within the experimental devices. Each group of pollutants corresponded to a group of plastic buckets; four groups of plastic buckets were wrapped in fishing nets, and then fixed on the fence with a rope to ensure that the experimental device could maximize the flow. There were a total of twelve culture flasks: four pollution sources and three salinity gradients.
The collection, transportation, preservation, and pre-treatment of water samples were conducted in strict compliance with the requirements outlined in the Marine Monitoring Code [25]. According to the growth cycle of algae, continuous sampling of the experimental group was planned over 12 days [26]. Samples were collected at incubation times of 1, 2, 4, 6, 8, 10, and 12 days. Sampling was performed once daily, with 12 samples obtained during each collection. This schedule is designed to accurately monitor the biochemical transformation process of nutrients within the culture system. A total of 84 samples were collected seven times, covering two seasons. Samples were collected at 9:00 a.m. on each specified sampling date; the sampling level was 0.5 m. The samples were analyzed for environmental factors at the collection site and then dispensed, filtered, and frozen for subsequent analysis within one hour after they were transported back to the laboratory. Surface water sampling was conducted using glass beakers placed in shaken incubation bottles, with two 1 L surface test water samples collected. The sample bottles were 100 mL polyethylene plastic bottles, which were rinsed three times with deionized water before use [26,27], and the samples were rinsed twice with incubation samples at the time of sampling. For testing and analysis of routine environmental elements, a multiparameter water quality analyzer (DZB-712, Shanghai, China) was used for the determination of temperature (T), salinity, DO, pH, and turbidity at the time of sampling. Chl-a was determined spectrophotometrically by taking 1 L of mixed water samples and pumping and filtering the membrane into acetone for extraction. The supernatant was separated by centrifugation to be tested and analyzed under a UV spectrophotometer(UV-2000i, Shimadzu Corporation, Kyoto, Japan). After the nutrients samples were collected, the samples were filtered using 0.45 μm cellulose acetate filters [28,29,30]. Water samples were frozen at −20 °C for chemical analysis [31]. For chemical analysis, the concentration of dissolved inorganic nitrogen (DIN) was calculated as the sum of N-NH4+, N-NO3, and N-NO2. All analyses were performed strictly in accordance with the Marine Monitoring Code Part 4: Seawater Analysis. DIN is the sum of N-NO3, N-NO2, and N-NH4+, The N-NO3 is determined through the zinc–cadmium reduction method, whereby the nitrogen contained within the nitrate is reduced to a state of nitrite, and then the nitrate’s content is determined by measuring the level of nitrite. The determination of N-NO2 is achieved through the application of naphthalene ethylenediamine spectrophotometry, within an acidic medium comprising a nitrite and sulfonamide diazotization reaction. The measurement of the absorbance value was conducted at a wavelength of 543 nm. The determination of N-NH4+ was achieved through the hypobromite oxidation method, whereby hypobromite oxidized ammonia to nitrite in an alkaline medium. The total amount of nitrite nitrogen was subsequently measured by the diazotization-azo spectrophotometric method, and the concentration of ammonia nitrogen was obtained by subtracting the concentration of the original nitrite nitrogen. Dissolved silicate (DSi) was determined by the silica–molybdenum blue method, whereby the reactive silicate reacted with ammonium molybdate in an acidic medium to produce yellow silica nitrogen. The silicon molybdenum blue method was used to determine DSi. The absorbance value is measured at 812 nm. The dissolved inorganic phosphorus (DIP) is determined by the phosphomolybdenum blue spectrophotometric method, in which phosphate reacts with ammonium molybdate to produce phosphomolybdenum yellow in an acidic medium. The measurement of the absorbance value is conducted at 882 nm following the reduction of phosphomolybdenum blue by ascorbic acid. The measurement of the absorbance value is conducted at a wavelength of 882 nm [25].

2.3. Statistical Method

Ocean Data View 5.6.5 software (ODV) was used to map the above four land source sampling sites. Data analysis related to this study was carried out using Microsoft Excel 2019, SPSS 20.0 software. fitted with a non-linear curve (3) to obtain a response curve over time.
L n C t C 0 = K o b s t
where C0 is the initial concentration, Ct is the concentration after time t and Kobs is the self-purification constant.
y = a 1 + e k ( x x t )
where a is a constant, x is the concentration of Chl-a, xt is the point of fastest change, and k is the slope of the fitted curve.
The Origin 2021 software was utilized to plot the attenuation coefficient. Additionally, Spearman’s correlation analysis was conducted, and a significance level of p < 0.05 was adopted to indicate statistically significant differences between variables. In this study, mean values were presented as arithmetic mean ± standard deviation (mean ± SD).

3. Results

3.1. Dynamics of Environmental Factors During Ecological Incubation Experiments

The mean values of environmental factors exhibited limited variation during the ecological incubation of different pollution sources in the summer (Table 4) and winter season (Table 5). During the incubation experiments period of the four pollution sources (river source, domestic source, aquaculture source, industrial source), the mean values of pH varied from 8.65 to 8.92, with a total range of 0.27. Dissolved oxygen (DO) in the same pollution source with different salinity roughly showed that low salinity and high salinity were lower, with the maximum occurring at a salinity level of 20. Specifically, the industrial source at a salinity of 25 had the minimum DO value of 6.79 ± 1.80 mg/L, while the domestic source at a salinity of 25 had the maximum DO value of 8.93 ± 3.53 mg/L. During the incubation period, the temperature remained relatively stable at 30 ± 0.19 °C, with a maximum of 31.31 °C and a minimum of 30.59 °C. The winter incubation experiments were conducted at a controlled temperature of approximately 21 degrees Celsius. The overall average DO concentration was 8.08 mg/L, which was slightly lower than that observed during the summer. In the medium-salinity group of the living source, the maximum DO value was 9.55 ± 1.49 mg/L. The pH range varied between 7.77 and 8.59, also showing a lower level compared to the summer measurements.

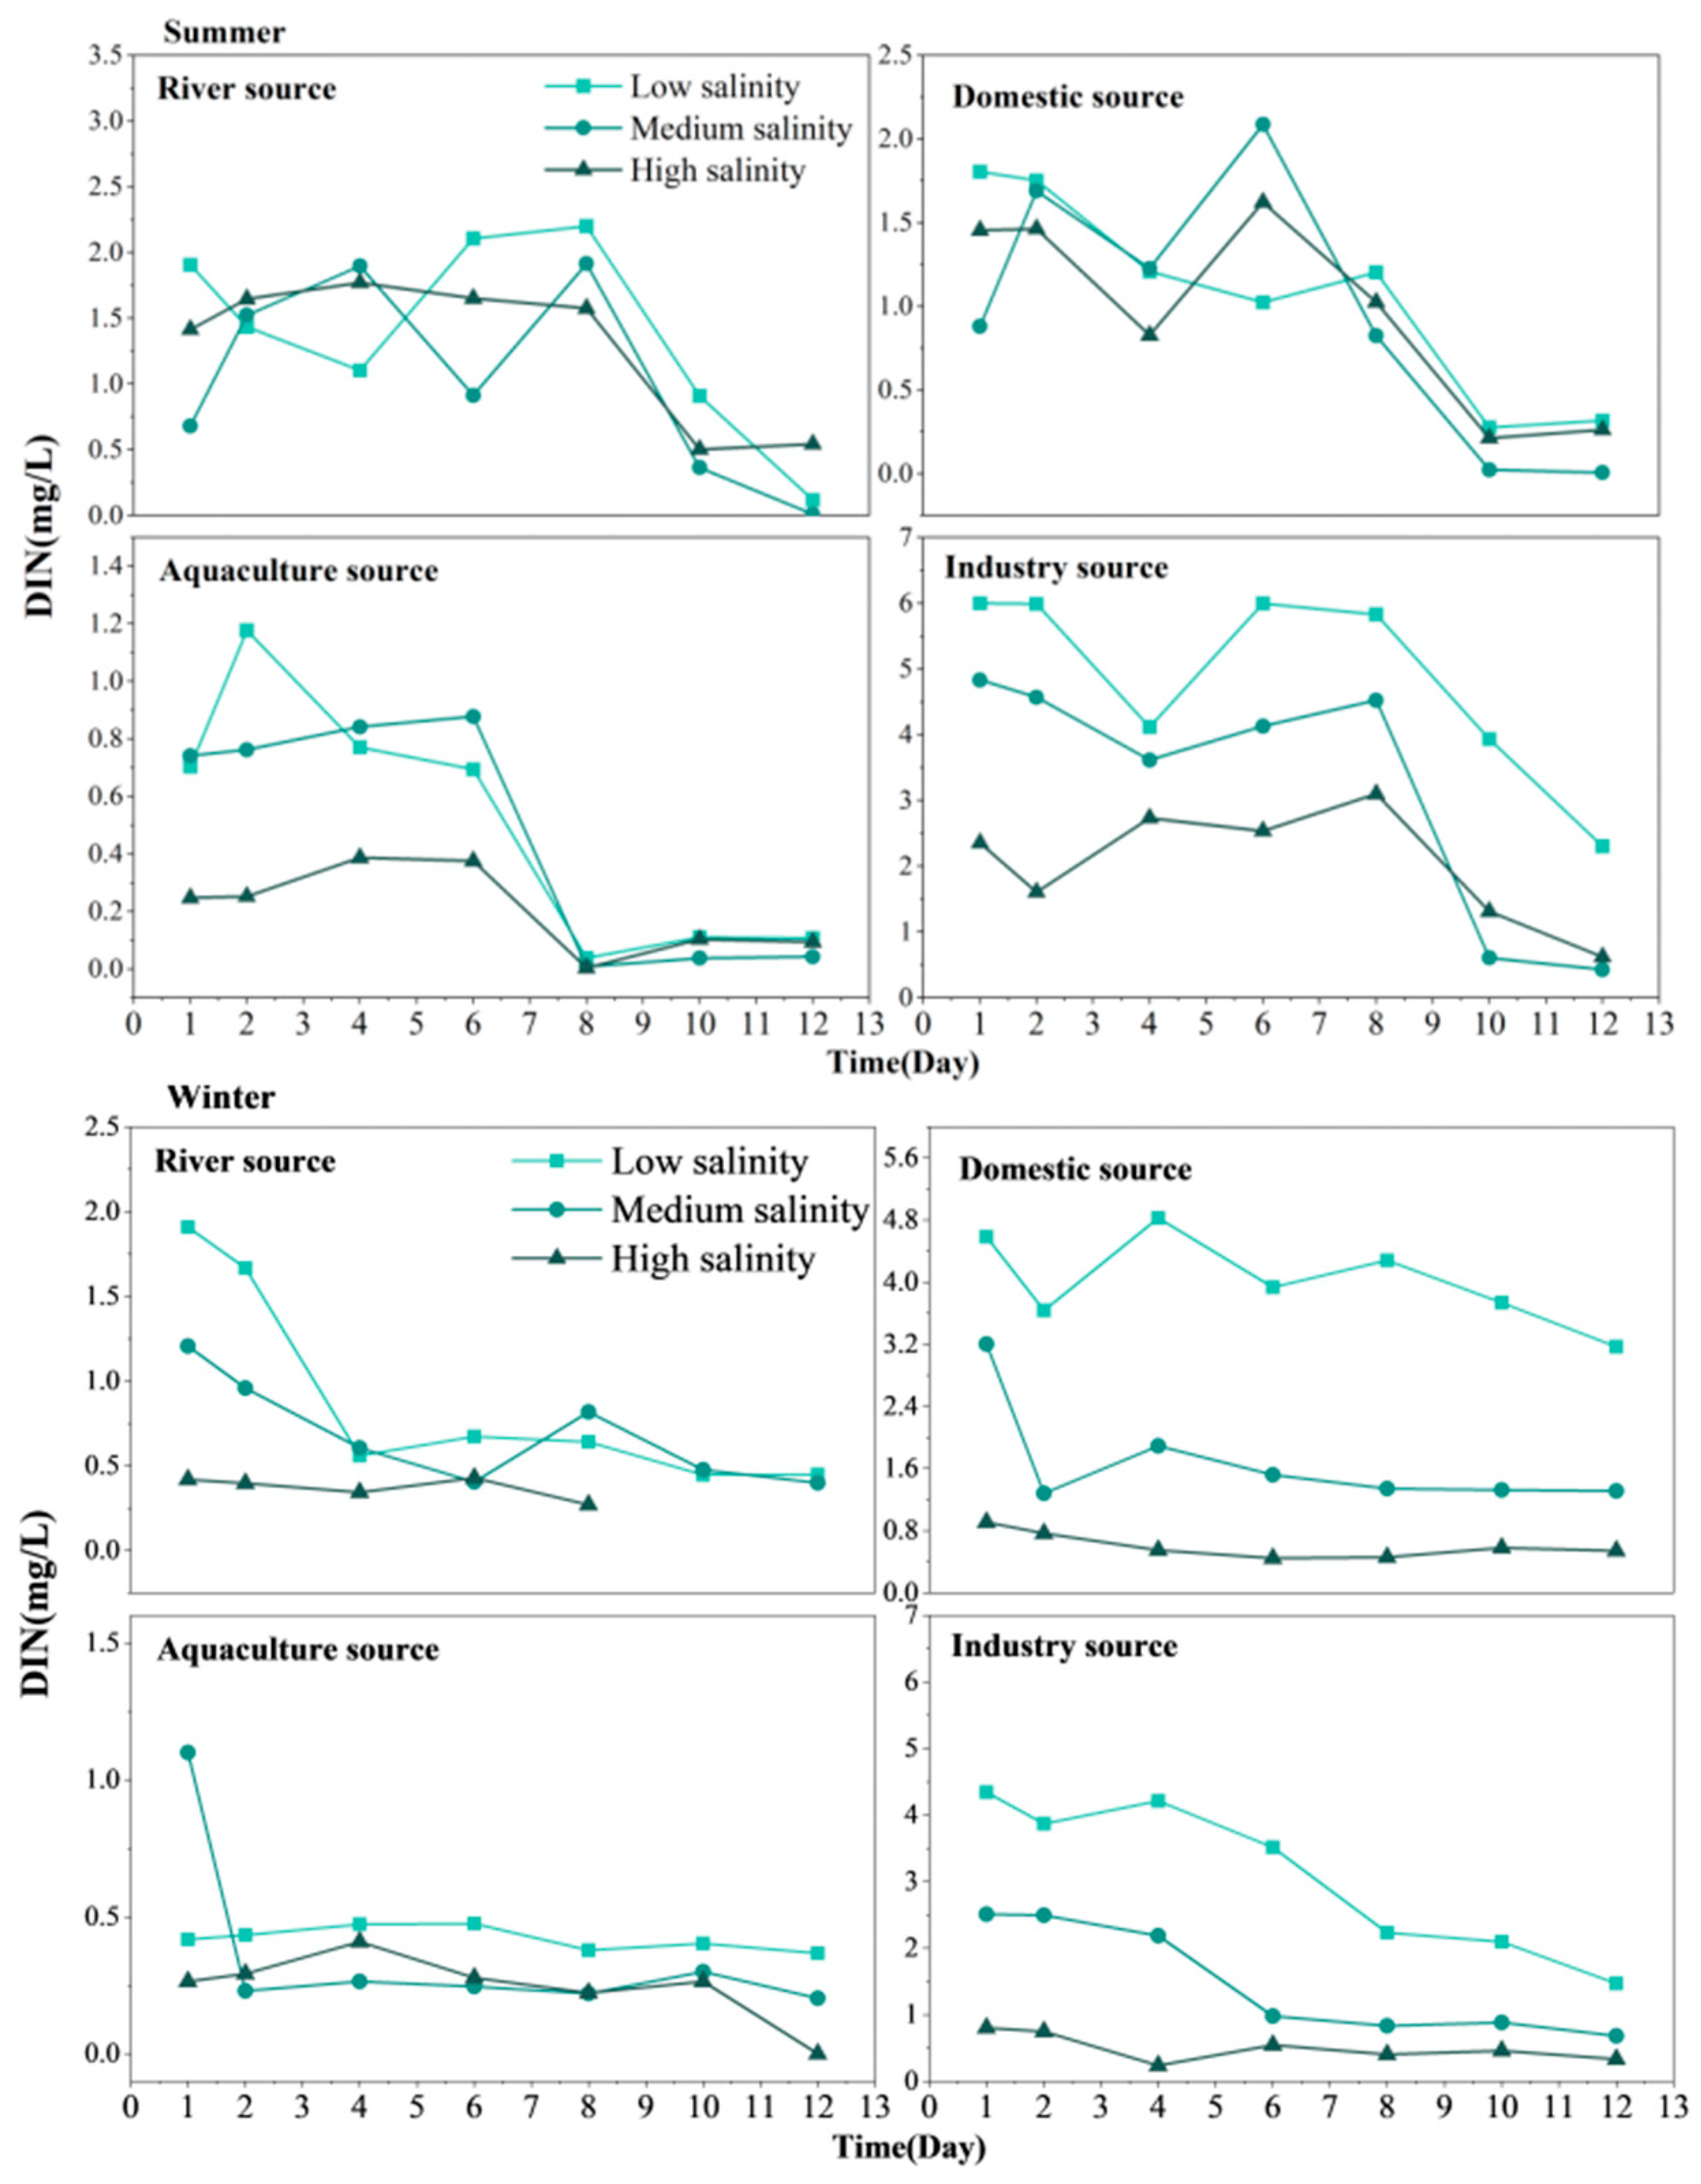
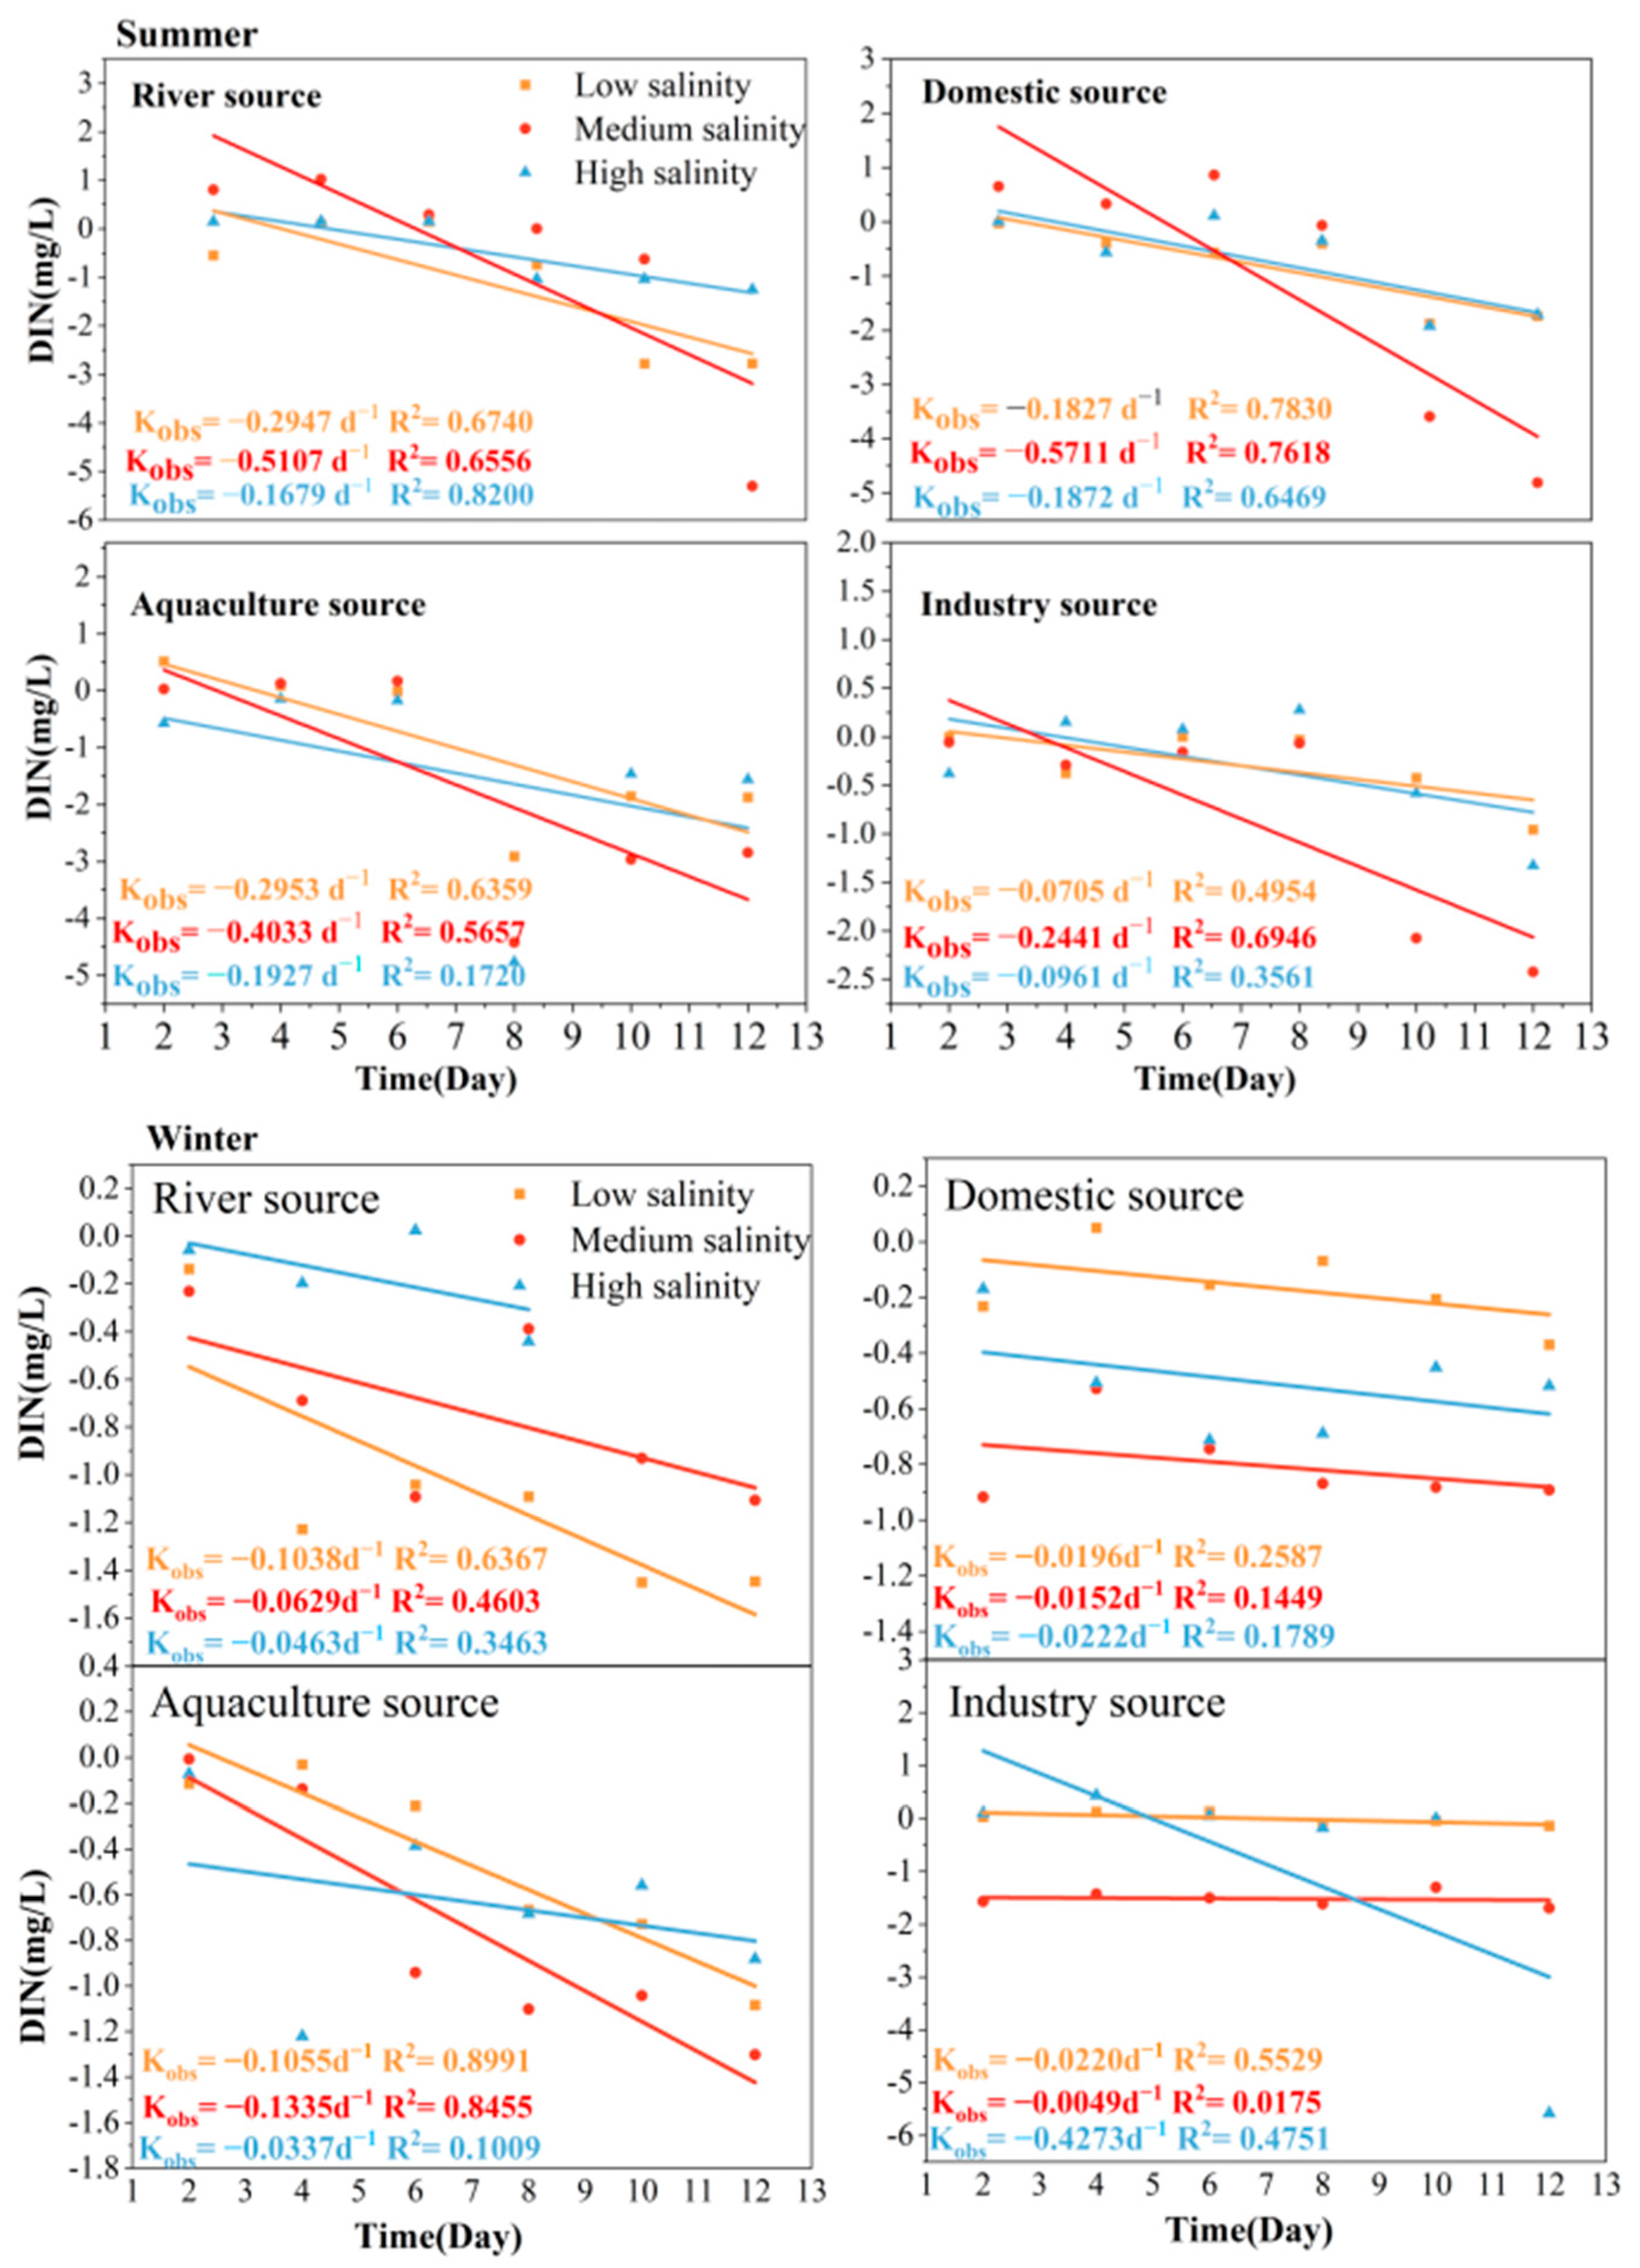
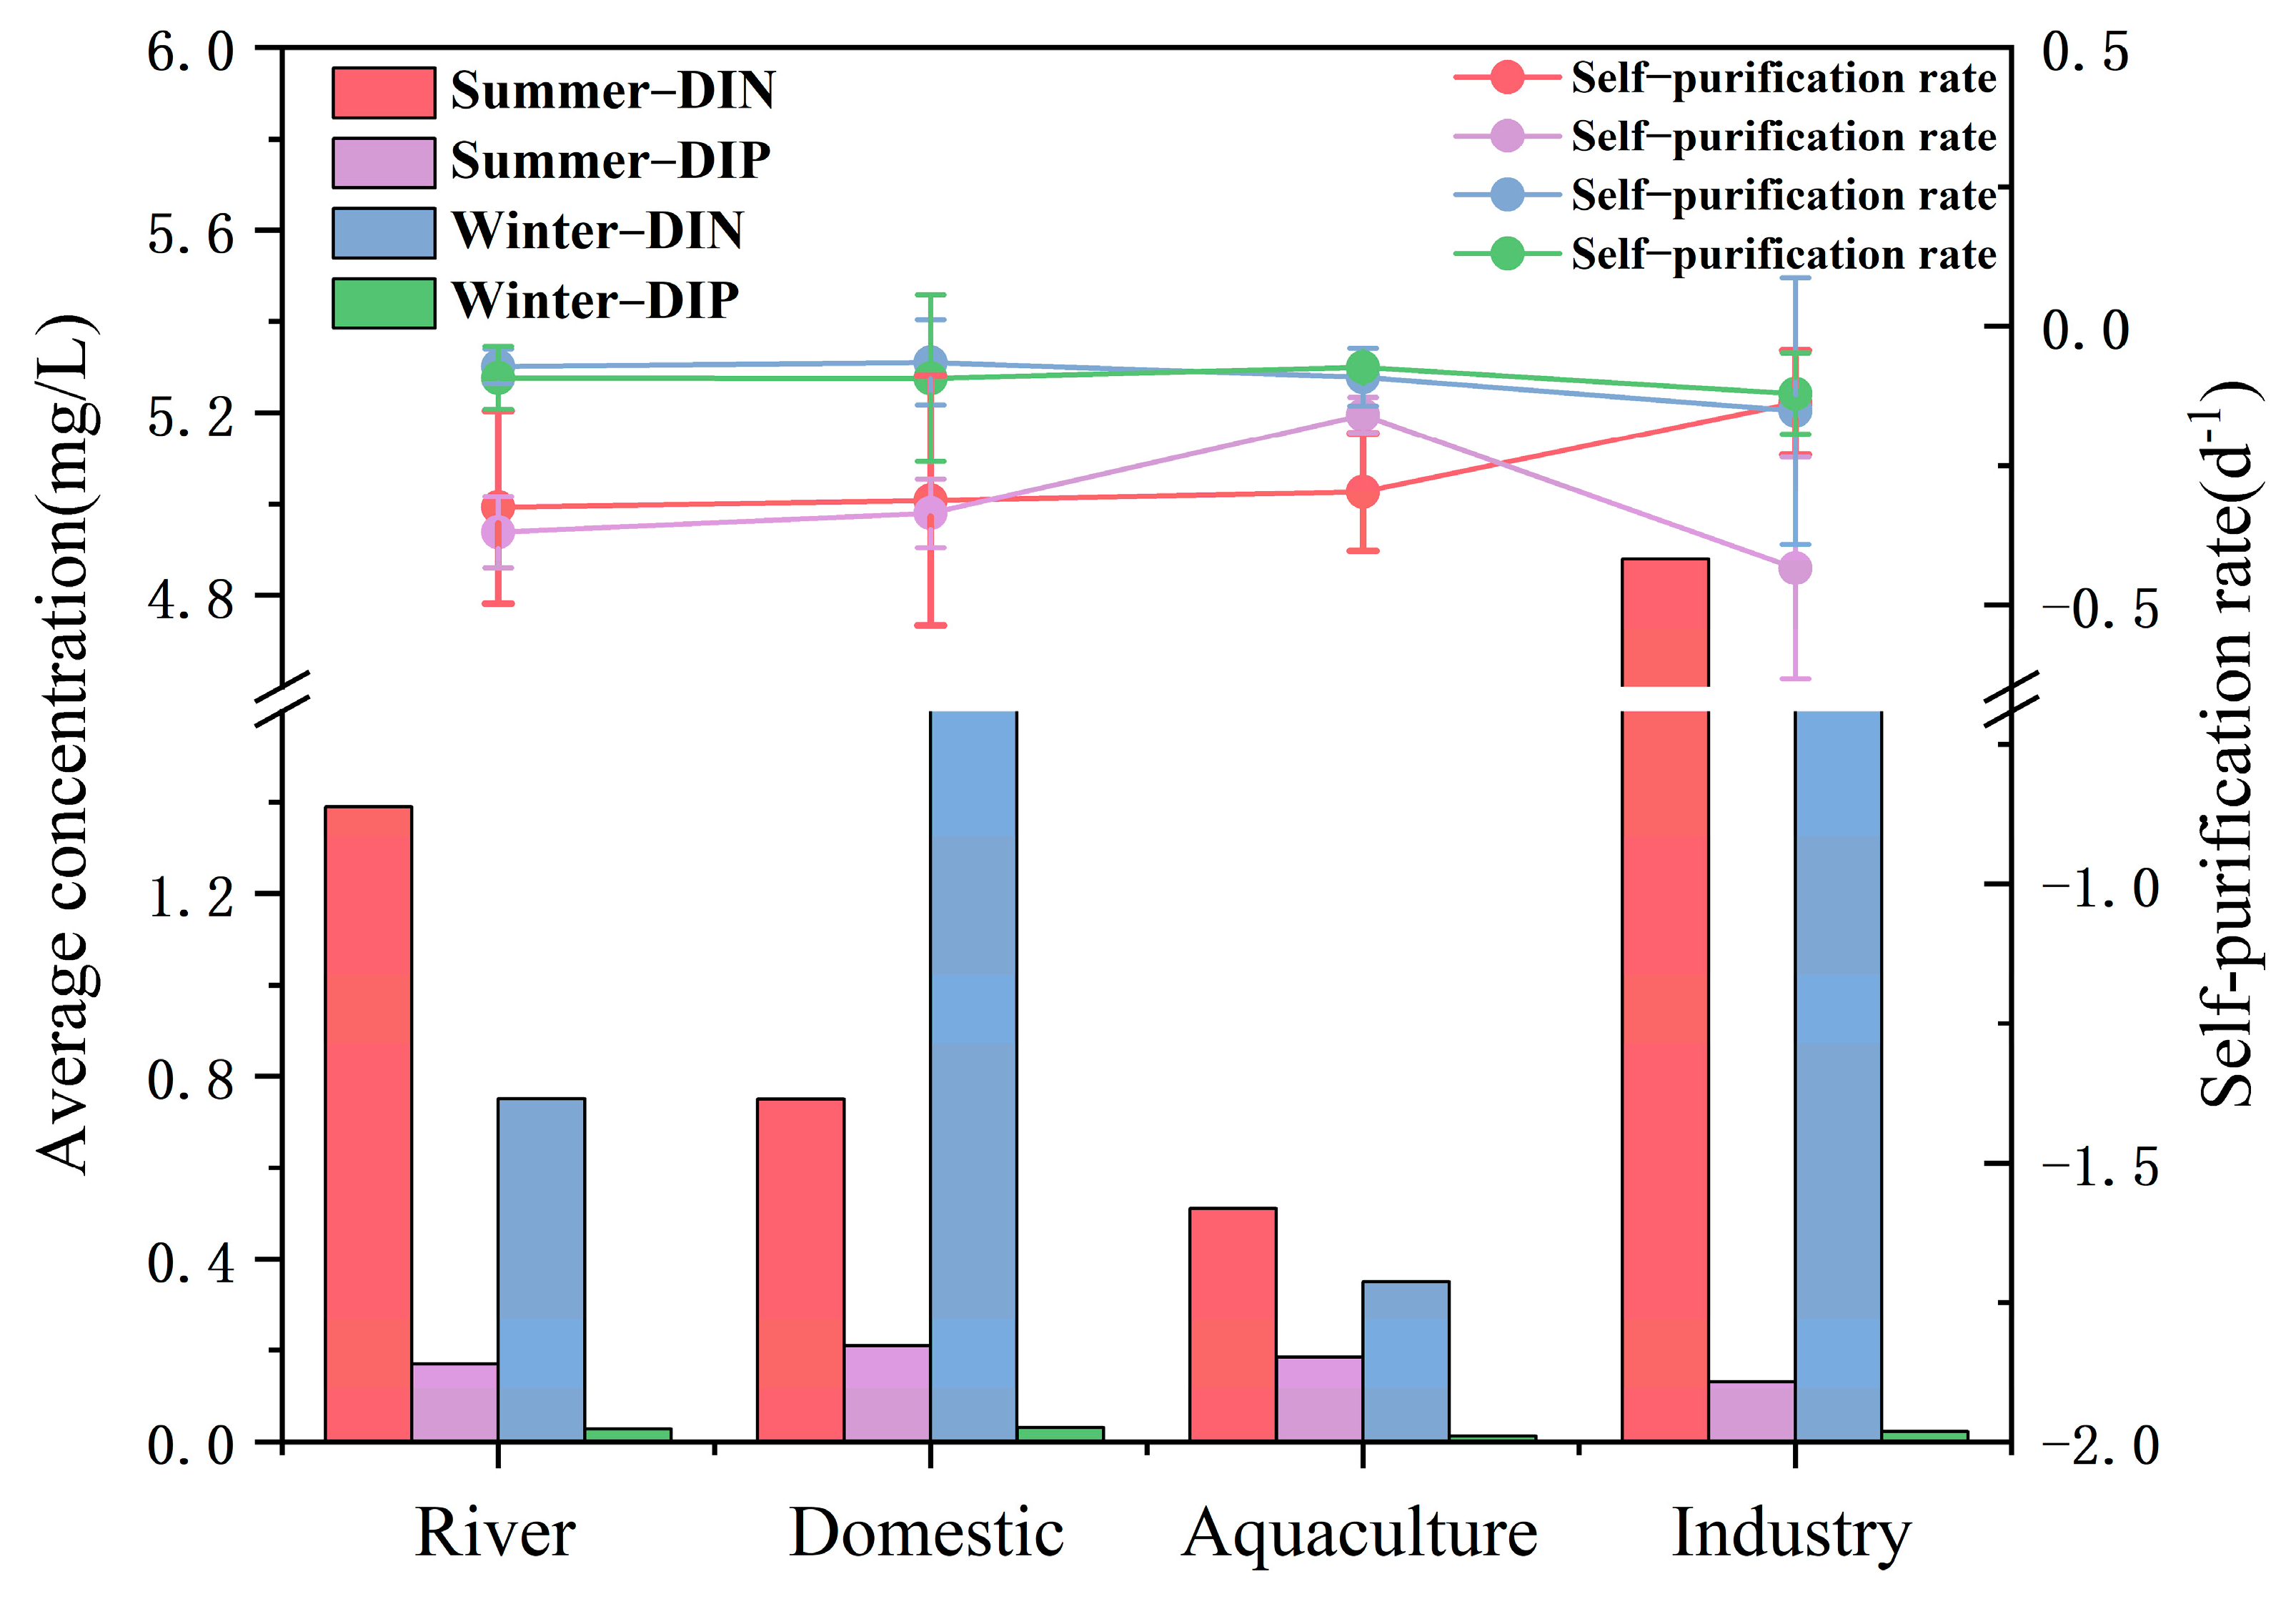
3.2. Self-Purification Process of Land-Based Sources of DIN in Seawater in TSB

The overall DIN of the four sources showed a decreasing trend during the ecological incubation period in the summer season (Figure 2), with significant differences in DIN concentrations among the sources during this period (p < 0.001). For the river source, DIN increased and then decreased at salinity of 10 and 25, reaching maximum values of 2.20 mg/L and 1.77 mg/L on day 10, respectively, before declining to minimum values by day 12. Medium salinity declined gently to reach a minimum value of 0.01 mg/L on day 12. The domestic sources at salinity of 20 and 25 initially increased and then declined, peaking at 2.09 mg/L and 1.62 mg/L on day 6, respectively. Meanwhile, DIN at low salinity for the river source gently decreased, reaching a minimum value of 0.32 mg/L on day 12. The different salinity DIN values of the incubation sources were all taken up by the organisms over time, and reached minimum values of 2.20 mg/L and 1.77 mg/L. Notably, the DIN concentration of the industrial source was consistently higher than that of the other three sources. Specifically, at low salinity and medium salinity, DIN first decreased and then increased over time; at medium salinity, it dropped from 4.83 mg/L on day 1 to 3.80 mg/L on day 4, while remaining relatively stable at 3.62 mg/L between days 1 and 4. At high salinity, DIN reached its peak value of 3.10 mg/L on day 8 before gradually declining to a minimum of 0.63 mg/L on day 12. The variations in the incubation experiments during winter were analogous to those observed in summer, with a gradually declining trend. Elevated concentrations of dissolved inorganic nitrogen (DIN) originating from domestic and industrial sources were detected. The DIN concentration from domestic sources was significantly higher than that in summer, with a peak value of 4.82 mg/L recorded in the low-salinity group. This may be attributed to the decrease in winter temperatures, which likely results in reduced activity of nitrifying bacteria.
The results of the on-site ecological incubation experiments in different seasons (Figure 3) were utilized to fit first-order kinetic Equation (2), enabling the derivation of attenuation coefficients of different nutrients under different environmental conditions (Table 6). These coefficients were subsequently employed to describe the self-purification processes of land-derived nutrients following the entry of different pollution sources into the sea. The overall trend for TSB land-source DIN during ecological incubation in different seasons was a decrease. The degradation rate of DIN in the incubation experiments during winter is lower compared to that in summer. Moreover, the self-purification capacities of low-salinity and high-salinity components originating from aquaculture sources exhibit relatively higher values. The net coefficients of river and domestic sources demonstrated maximum values of −0.5107 d−1 and −0.5711 d−1 in the fraction of medium salinity, and their self-purification rates were significantly lower in the fractions of lower and higher salinity. These findings suggest that phytoplankton bioavailability from riverine and domestic sources is higher under moderate salinity conditions, indicating that salinity plays a critical role in regulating phytoplankton abundance. Additionally, the self-purification rate of the aquaculture source was found to be at its zenith at a salinity of 23, and the phytoplankton of the cultured source demonstrated enhanced tolerance at elevated levels of salinity. However, the linear correlation of the first-order kinetic degradation fit for high salinity was poor, as demonstrated by the concentration distribution of DIN, which commenced its decline on the sixth day of high salinity for the culture source. Furthermore, the initial concentration of DIN was found to be low, exhibiting a tendency to increase in the early stage. The self-purification rate of the industrial source was −0.2441 d−1 at medium salinity, and the DIN content of the industrial source increased significantly in the middle of the incubation period. This indicated that it was not degraded at the beginning, and the nitrogenous substances in the industrial wastewater might not be completely released into seawater at once. It is possible that certain nitrogenous compounds require a certain amount of time for hydrolysis, desorption, and other processes before they can be released. Therefore, the correlation of its self-purification rate was weaker.

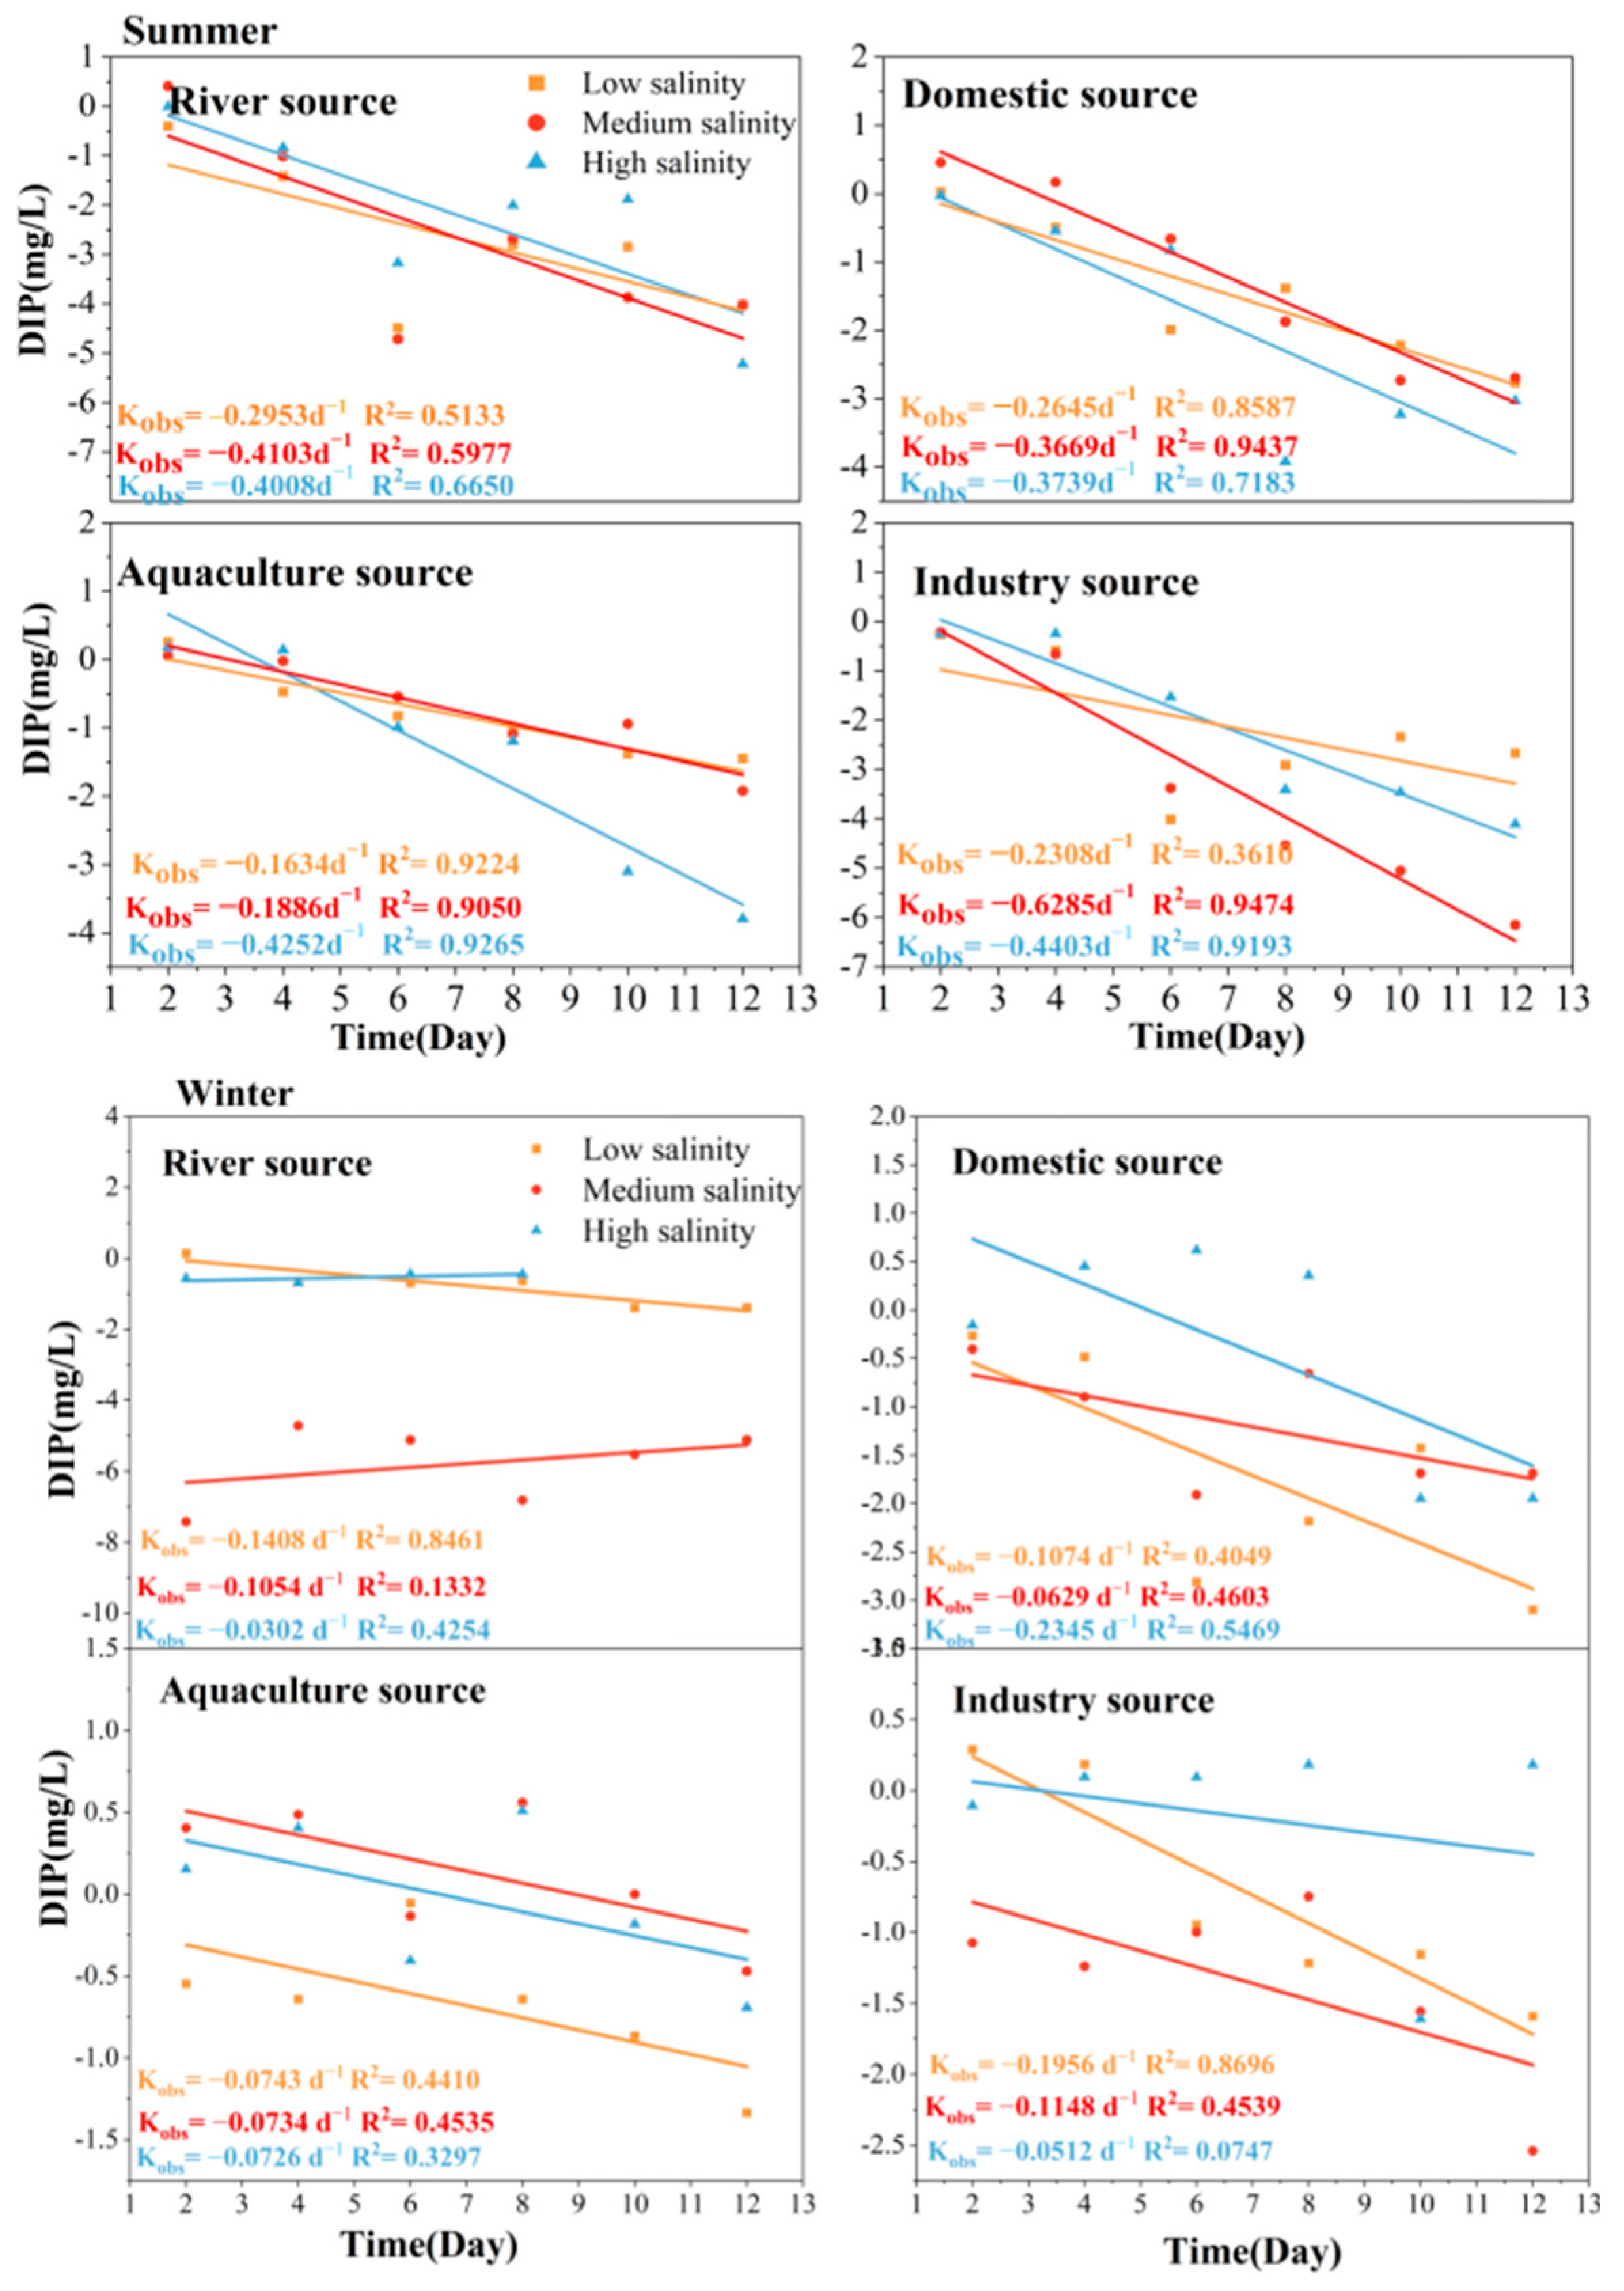
3.3. Self-Purification Process of TSB Land-Based DIP in Seawater

During the ecological incubation period across different seasons, each pollution source displayed significant temporal variations in DIP concentrations across different salinity gradients (Figure 4). For river sources, maximum DIP concentrations of 0.445 mg/L (low salinity) and 0.743 mg/L (high salinity) were observed on day 1. All salinity groups showed rapid initial DIP declines, with the highest-salinity group demonstrating the most pronounced decrease. After day 4, the rate of the decline slowed, although the high-salinity group maintained slightly higher concentrations compared to other groups. Subsequent changes exhibited convergence across salinity gradients, indicating diminished salinity effects. In winter, in contrast to summer, the concentration decreased most rapidly in the low-salinity group, suggesting that salinity serves as the primary controlling factor for the self-purification rate of river sources across different seasons. In domestic wastewater sources, peak DIP concentrations of 0.555 mg/L (low salinity) and 0.680 mg/L (medium salinity) occurred on day 2. The initial phase similarly showed greater reduction rates in medium/high-salinity groups compared to low salinity conditions. Concentrations stabilized in later stages, likely due to the presence of organic phosphorus, which exhibits slower biodegradation rates. In winter, the low-salinity components exhibit a clear downward trend, whereas the high-salinity components, which are crucial, show less pronounced downward trends. Industrial sources demonstrated rapid DIP reduction during the first six days, particularly in high-salinity groups, where concentrations plummeted from 0.667 mg/L to 0.144 mg/L. This accelerated decline can be attributed to the elevated metal ion content in industrial effluents, which facilitates phosphate ion precipitation through complexation reactions [32]. During the winter season, low salinity levels decrease markedly, while medium and high salinity levels show minimal variation. Additionally, the concentration ratio of DIP is significantly lower in winter than in summer.
The self-purification rates of DIP for river sources ranged from −0.4103 d−1 to −0.2953 d−1, with the lowest rate occurring at a low salinity (Figure 5). It showed that higher salinity resulted in faster self-purification rates. Regarding domestic sources, the self-purification rate increases with rising salinity; this change is relatively small, indicating that salinity only has a limited effect on the self-purification rate of domestic sources. The self-purification rate of domestic sources in winter is significantly lower than in summer, and the maximum self-purification capacity occurs in a pattern opposite to that of summer [31]. The aquaculture source exhibits its lowest self-purification rate at a medium salinity and achieves its highest rate of −0.4252 d−1 at higher salinity. This substantial variation suggests that high salinity environments are more conducive to the self-purification of pollutants from aquaculture sources. Greater self-purification rates are observed in both low-salinity and medium-salinity components, regardless of whether it is summer or winter. For industrial sources, the highest self-purification rate is observed at a salinity of 18, while rates at low salinity and high salinity are lower. However, during winter, the maximum self-purification rate is observed at low salinity levels. Thus, an environment with a salinity of 18 appears to be most favorable for the self-purification of industrial pollution. The trends across three salinity levels for different DIP sources are relatively consistent, suggesting that these changes are not significantly influenced by inputs from land-based sources [31].

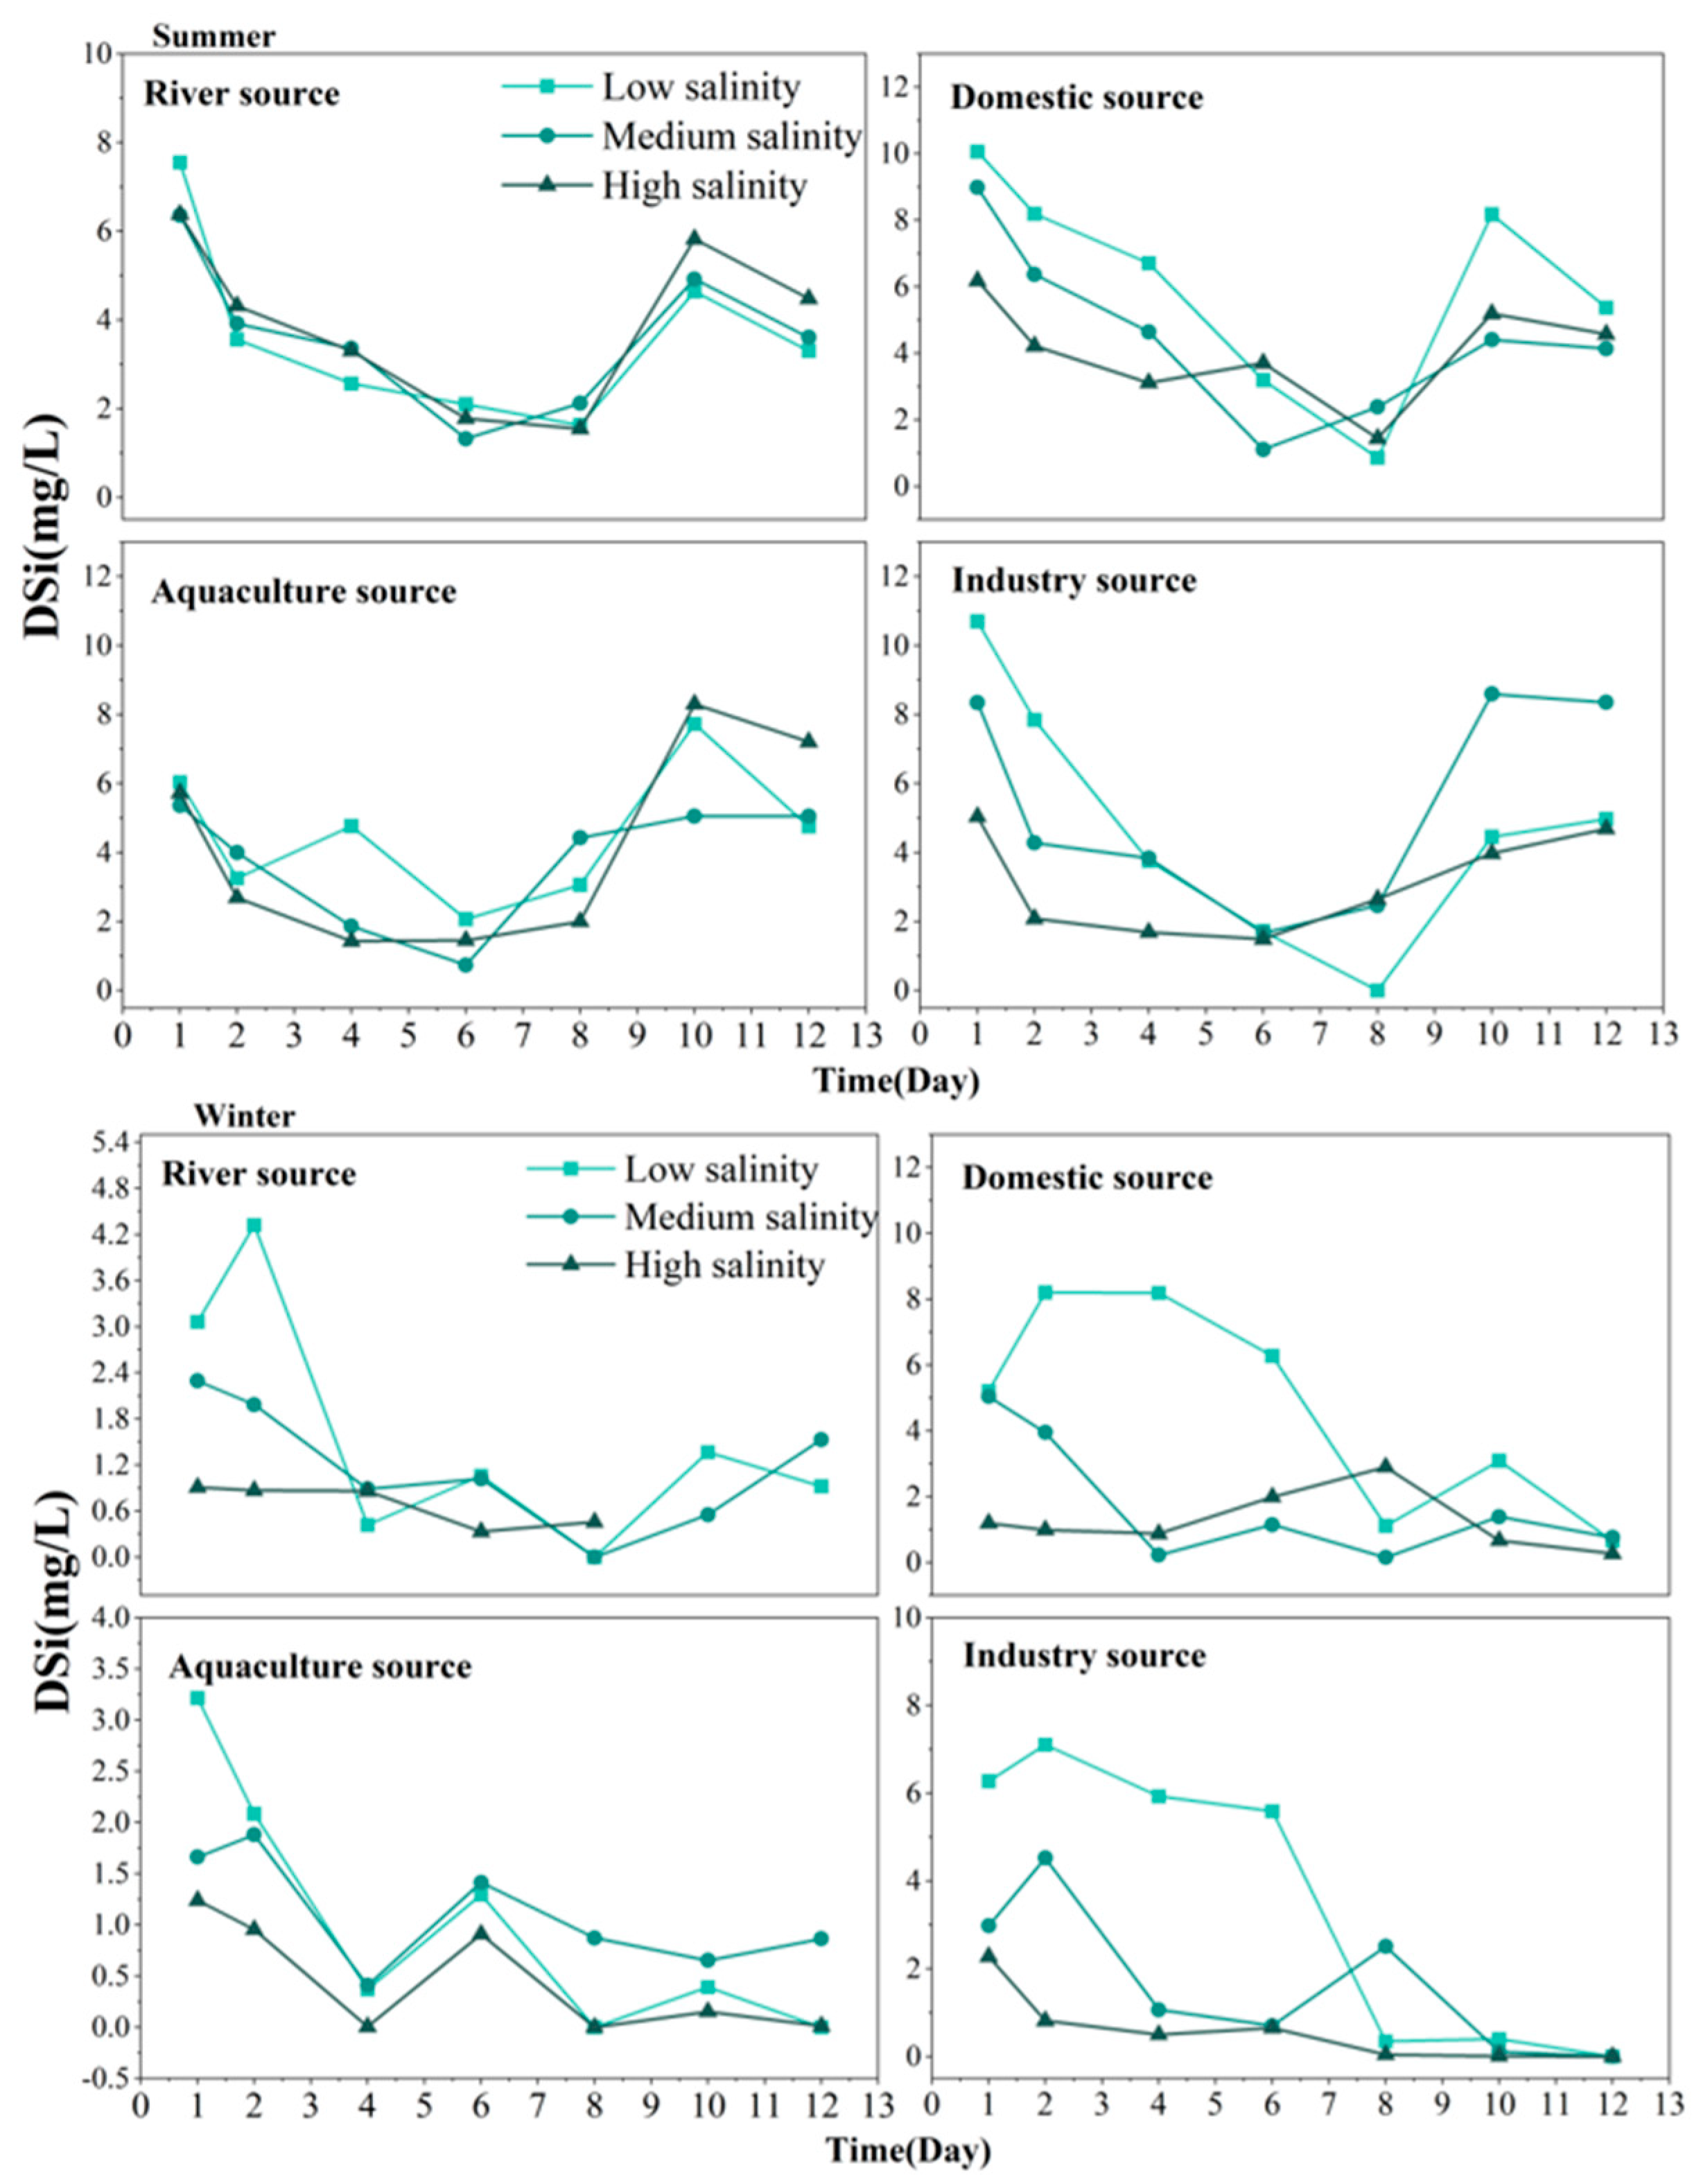
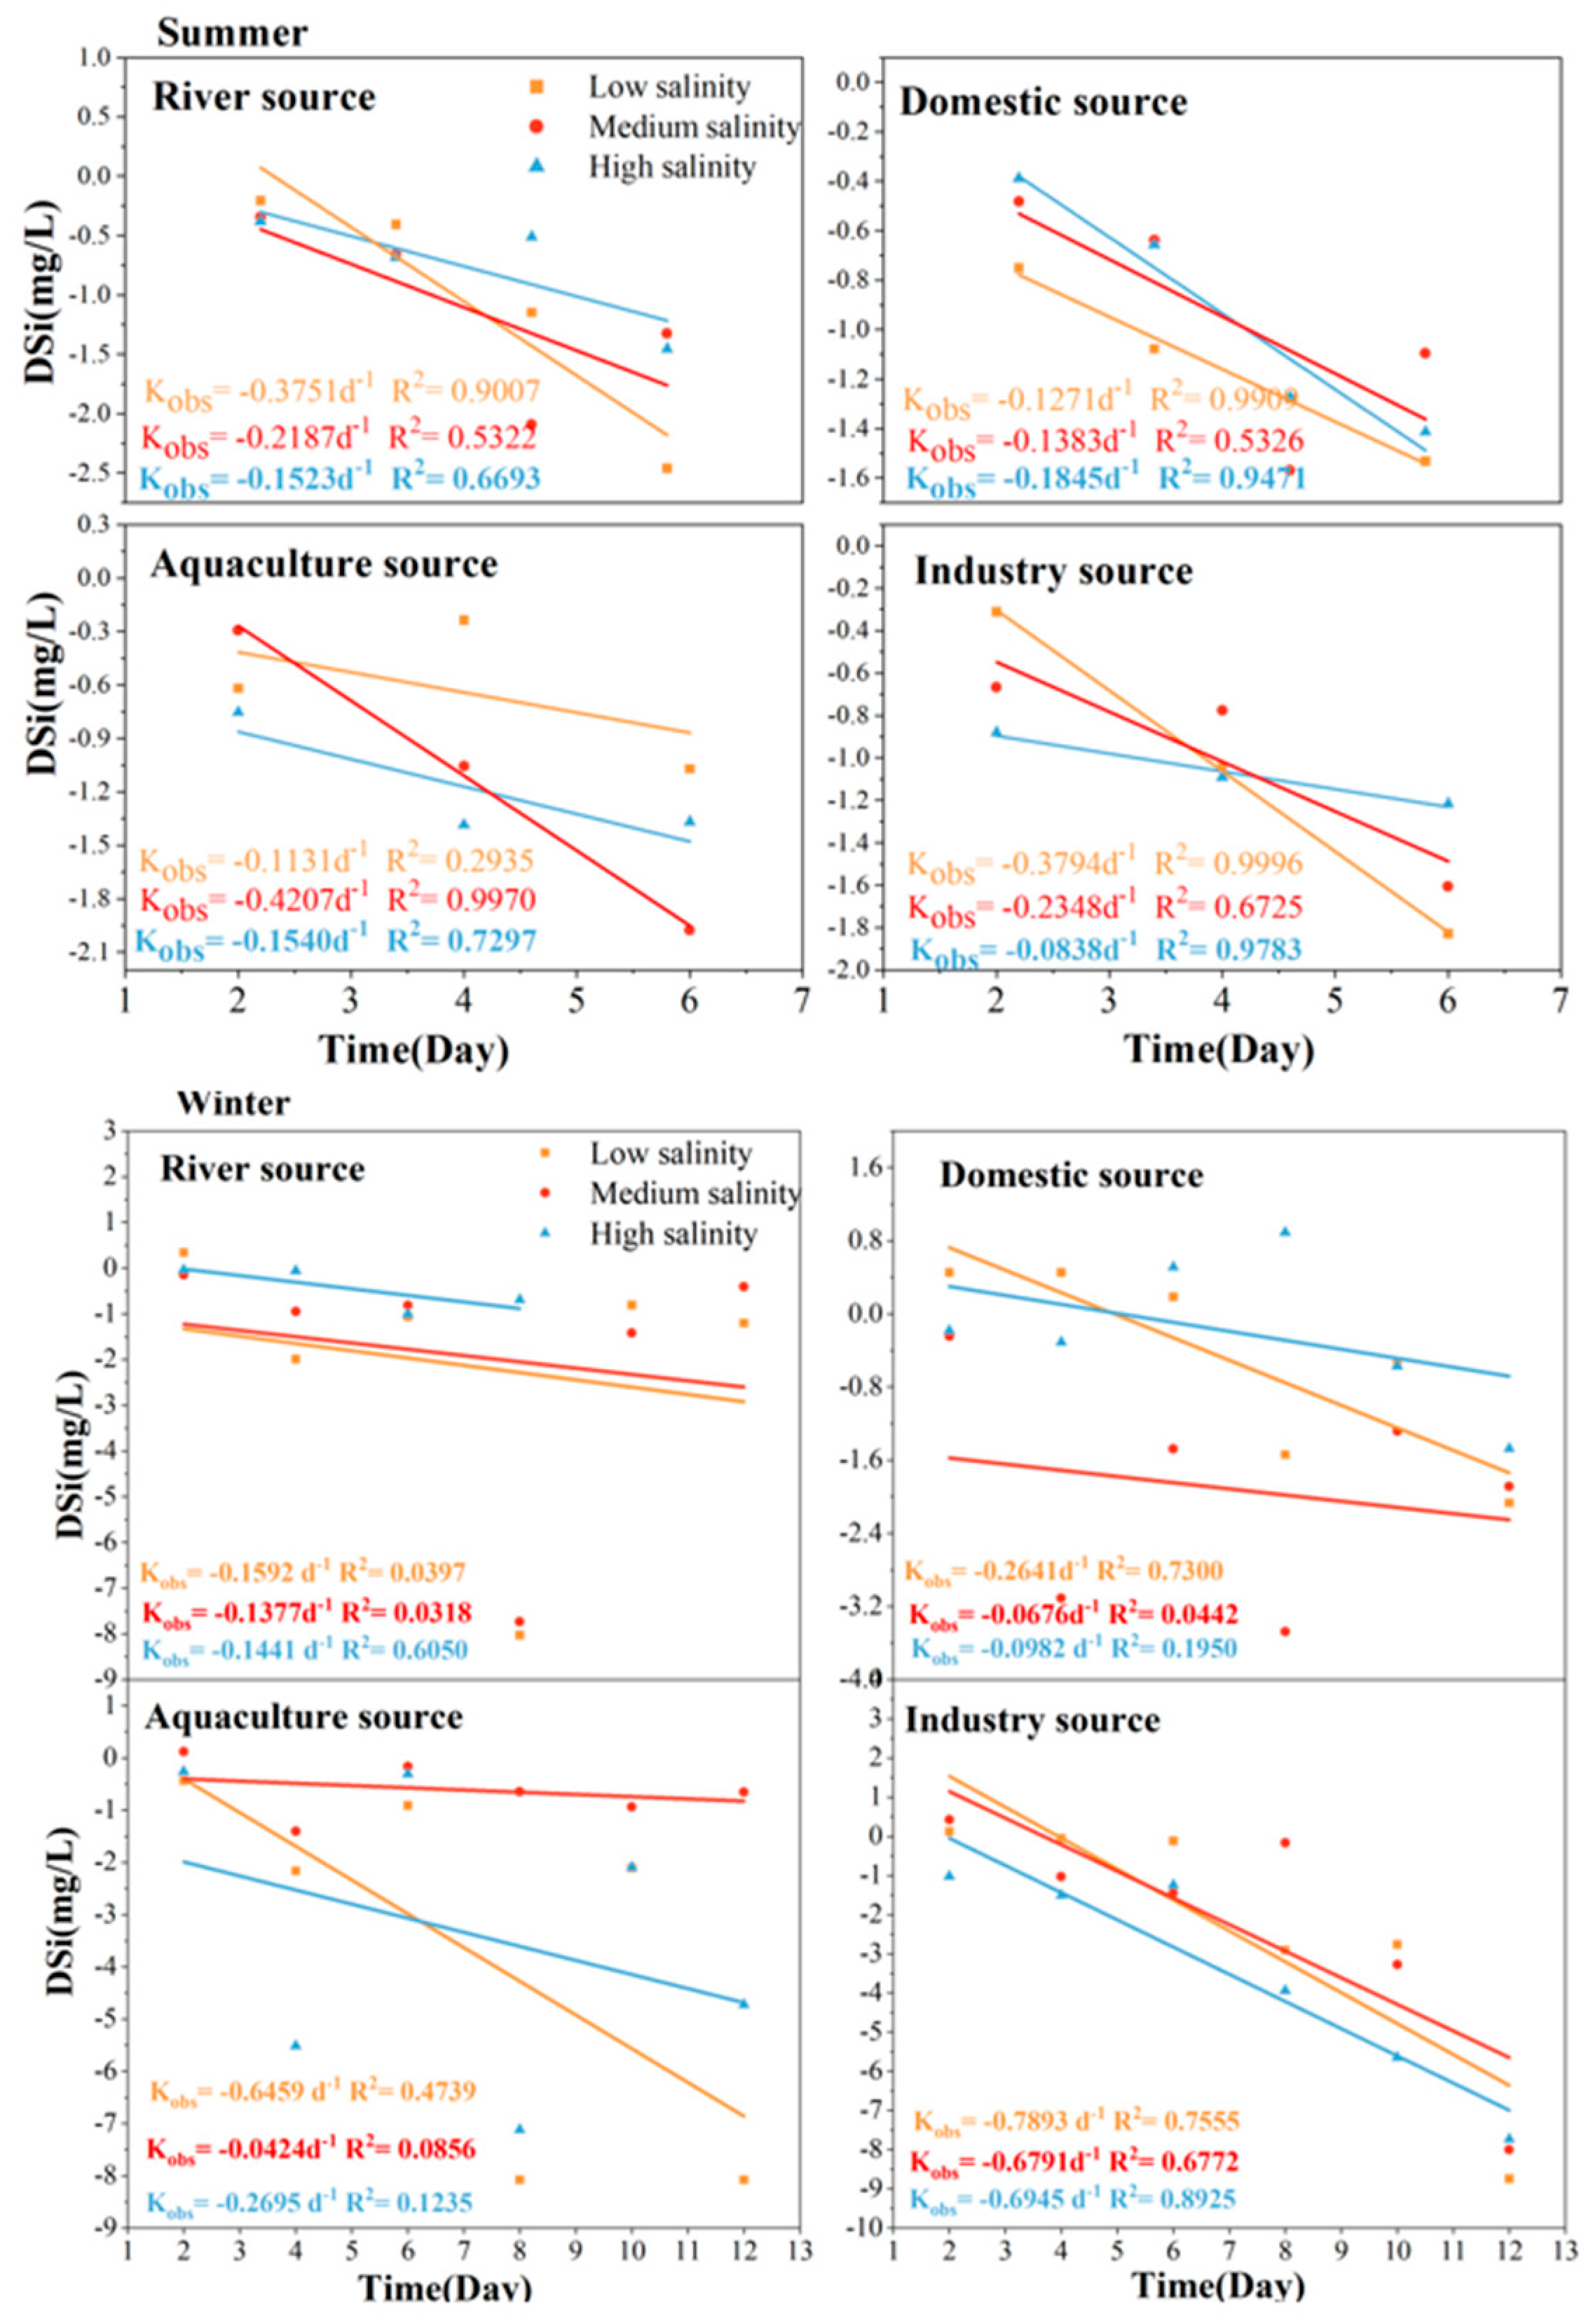
3.4. Self-Purification Process of DSi from Land-Based Sources in TSB in Seawater

DSi concentrations exhibited marked differences across pollution sources during incubation experiments in different seasons (Figure 6). In river sources, three salinity gradients displayed comparable temporal patterns through day 2, followed by stabilized fluctuations with mean concentrations of 3.625 mg/L, 3.661 mg/L, and 3.950 mg/L, respectively. The winter variation in DIP is nearly identical to that observed in summer, with both seasons exhibiting a trend of initially decreasing and subsequently increasing. Domestic wastewater sources showed distinct salinity-dependent declines, with salinity 15 reaching a minimum of 1.633 mg/L by day 8. The concentration, which exhibits significant variation during winter, is also characterized by low salinity. Both low-salinity and high-salinity conditions demonstrate an initial increase followed by a subsequent decrease. Aquaculture-derived DSi demonstrated relatively stable temporal profiles across salinity treatments, attaining minimum concentrations of 2.07 mg/L, 0.743 mg/L, and 1.432 mg/L, respectively, on day 4. In the latter part of winter, the trend did not gain significant momentum and gradually decreased. Industrial effluents maintained elevated DSi levels throughout the experimental period. This persistence underscores silicate’s crucial biogeochemical role as an essential nutrient for zooplankton exoskeleton formation, particularly in diatoms, which require substantial silicon uptake for frustule development. Silicate also serves as a key determinant of phytoplankton biomass, as quantified through Chl-a measurements [33]. The observed inverse correlation between DSi concentrations and phytoplankton populations follows established silicate depletion dynamics during diatom blooms [33,34]. The characteristic DSi rebound observed on day 10 likely resulted from phytoplankton senescence and subsequent silicate regeneration through cellular lysis and organic matter mineralization processes. However, during the winter season, the growth cycle of the organism becomes relatively slower, leading to a significant increase in the mortality rate of plankton in the later stages. As a result, DSi experiences a continuous consumption process.
The first-order kinetics of DSi from land-based nutrients pollution sources were quantified using first-order decay models, with salinity-dependent self-purification rate derived from experimental time series data (Figure 7). For river sources, the self-purification rate ranged from −0.1271 d−1 to −0.1845 d−1, with the highest coefficient observed at low salinity. Domestic wastewater exhibited the highest average self-purification rate −0.3751 d−1 at high salinity, attributable to accelerated microbial mineralization of organic silicon compounds at elevated ionic strengths [35], as evidenced by strong regression fits (R2 > 0.92). Aquaculture effluents displayed the broadest coefficient variability (−0.1131 to −0.4207 d−1), suggesting dual control by salinity-modulated ligand exchange and episodic algal uptake, particularly at mid-salinity. In the saline fraction, the self-purification rate of DSi decreases dramatically. Industrial discharges showed rapid initial DSi decline (−0.3794 d−1 at high salinity); DSi self-purification rate efficiency was higher in the group with low salinity, suggesting that its metal ions have a precipitating effect on DSi. Domestic and industrial sources achieved 85% DSi attenuation within 5 days, whereas river and aquaculture sources required longer periods (>7 days), highlighting the persistence of particulate-bound DSi in estuarine mixing zones.

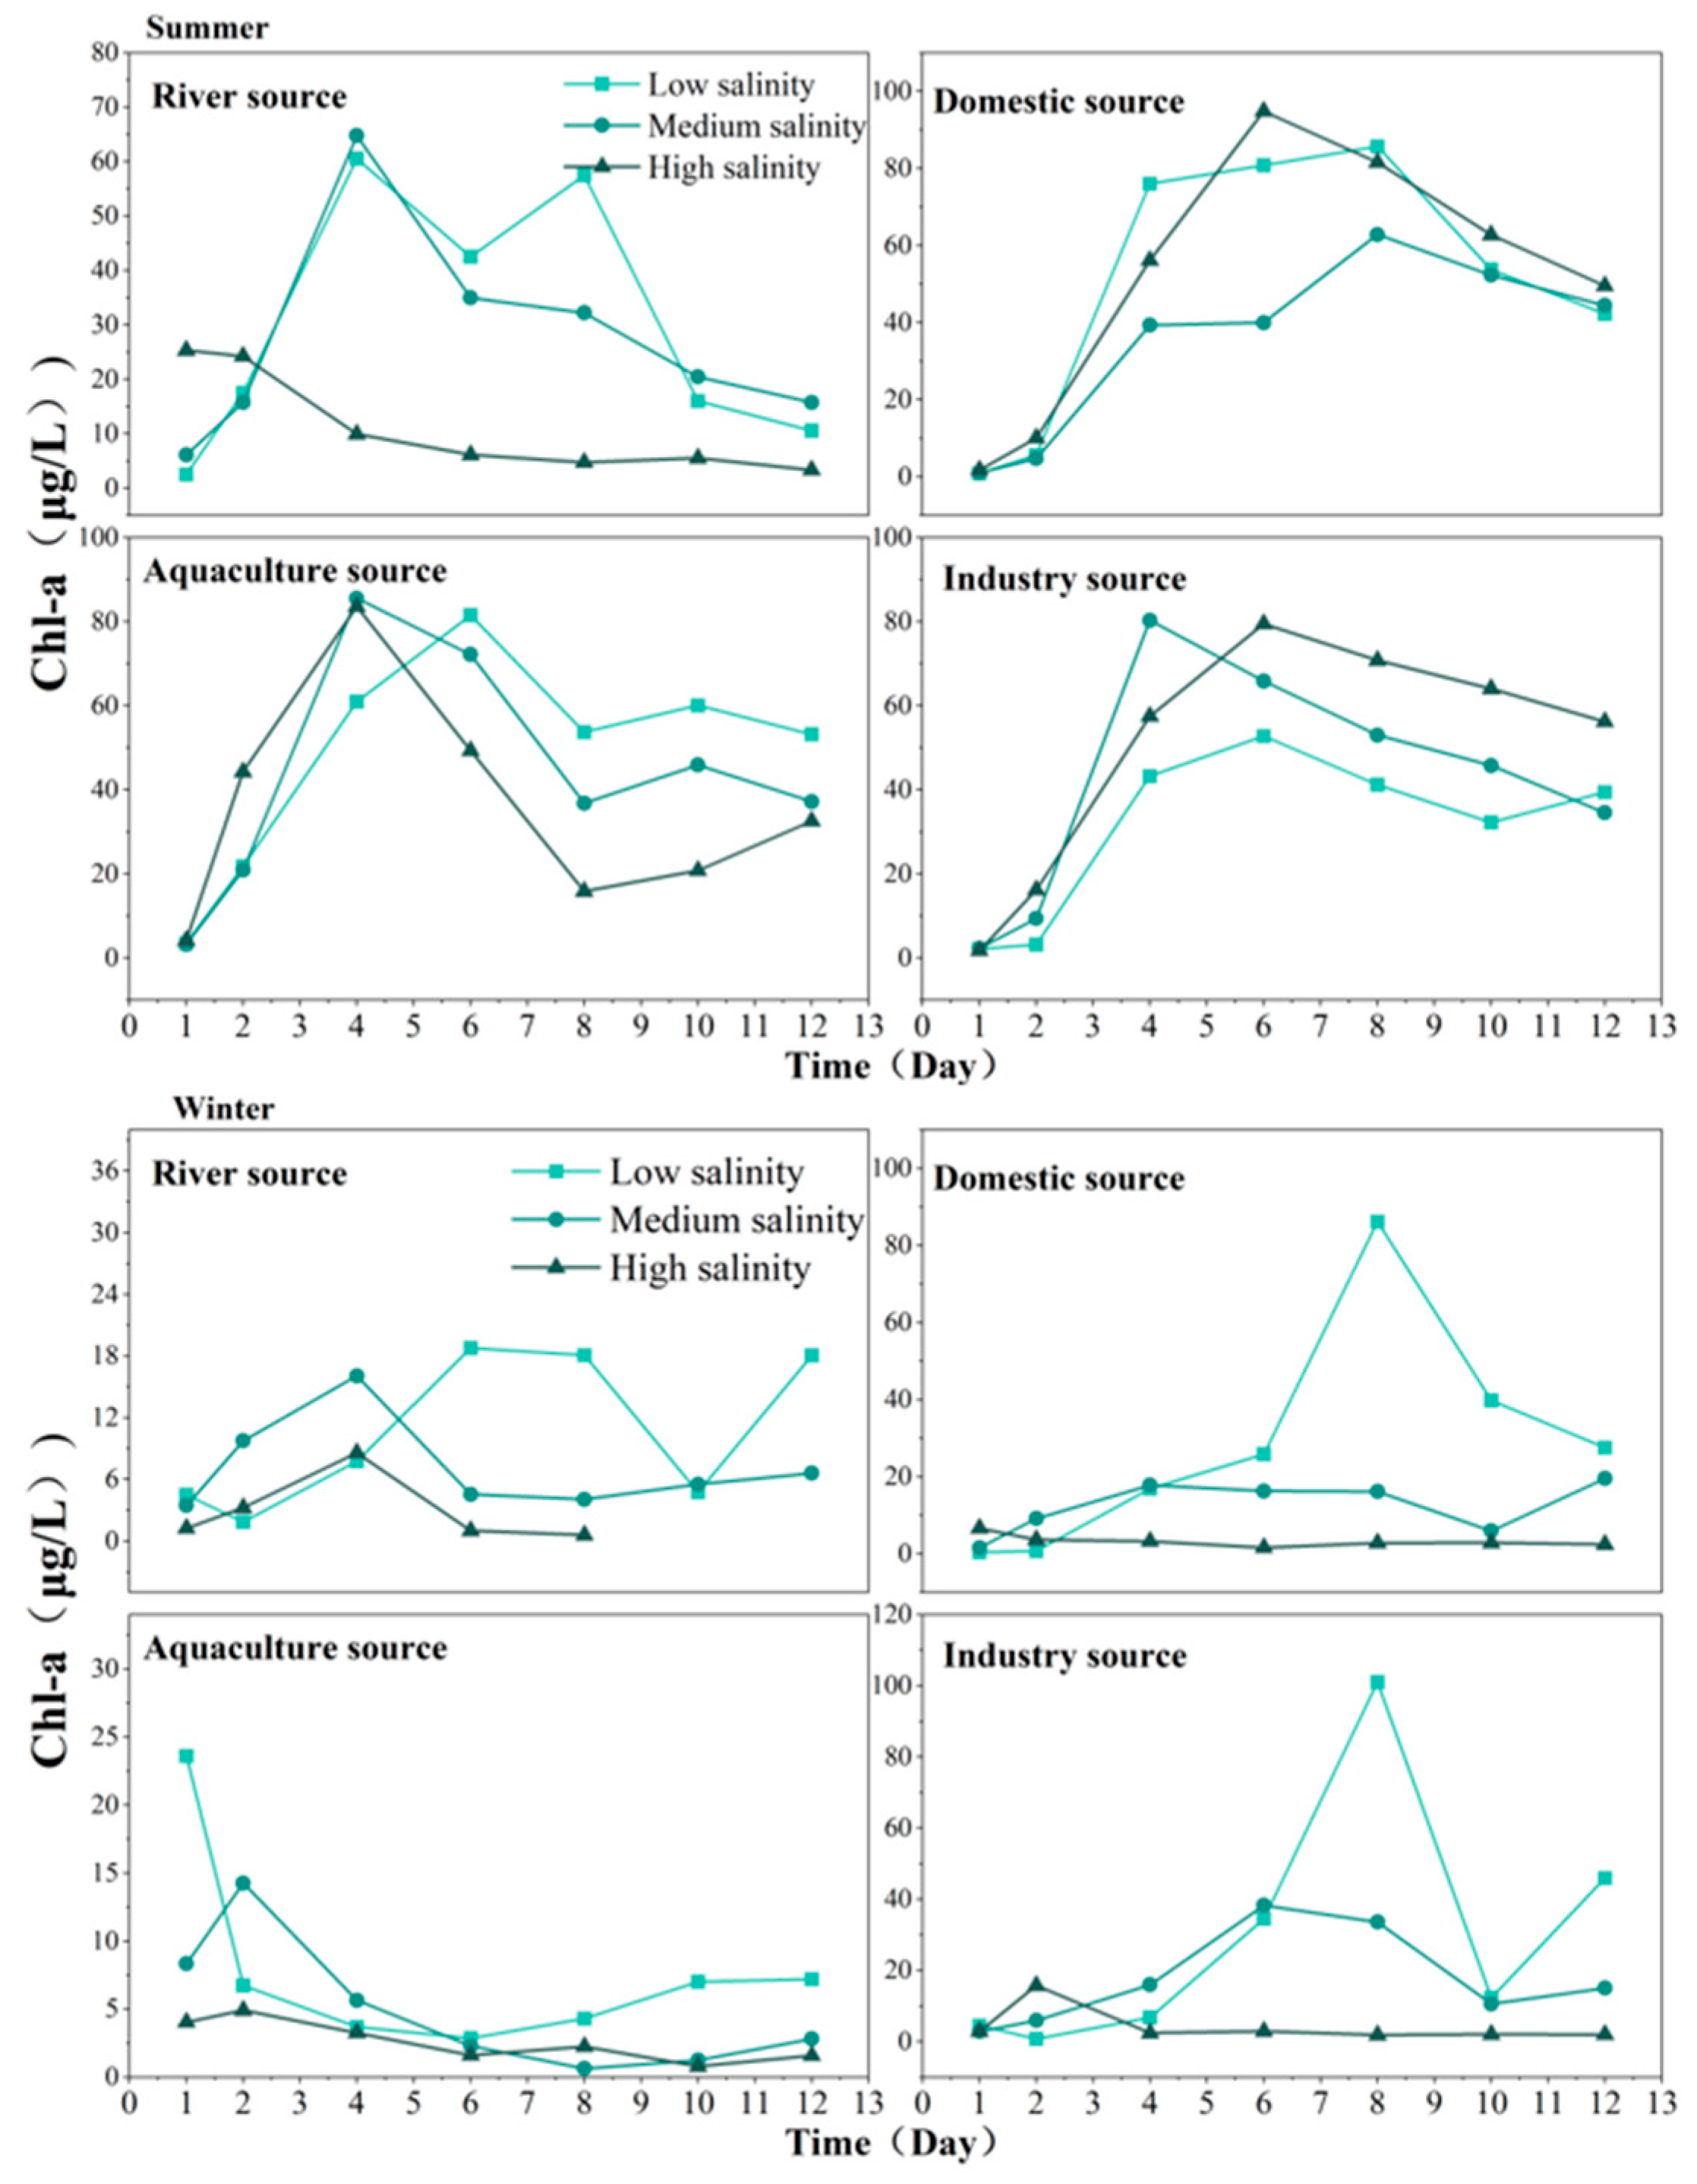
3.5. Chl-a Variations in Different Sources of Nutrients Input to TSB

Chl-a dynamics showed significant variations across pollution sources during incubation experiments (Figure 8). Statistical analysis revealed distinct Chl-a concentration patterns among pollution sources (p < 0.05). In river sources, Chl-a concentrations at low salinity at 18 increased markedly during initial phases, peaking at 60.55 μg/L and 64.80 μg/L, respectively, by day 4. By contrast, the high-salinity treatment (25 PSU) exhibited a progressive decline in Chl-a, suggesting limited halotolerance of freshwater plankton. While adaptive capacity was observed at medium salinity, mortality became prevalent at high salinity under sustained exposure. Chlorophyll a exhibits a trend of initially increasing and subsequently decreasing during the winter, however, the rate of increase is relatively slower compared to that in summer, and the peak concentration is also lower than in summer. Domestic wastewater sources displayed delayed phytoplankton response, with initial Chl-a levels remaining stable before exhibiting growth-phase escalation. The low salinity treatment reached a maximum Chl-a concentration of 85.73 μg/L by day 8, suggesting nutrient-mediated biomass accumulation. The variations in Chl-a levels under conditions of moderate and high salinity during winter are relatively insignificant, whereas the changes observed under low salinity conditions exhibit similarities to those seen in summer. Aquaculture-derived samples showed characteristic bell-shaped Chl-a curves: low salinity peaked at 81.54 μg/L on day 6, followed by rapid decline and stabilization post-day 8, while higher salinity treatments (18 and 25 PSU) achieved earlier maxima of 85.56 μg/L and 83.60 μg/L, respectively, on day 4. The breeding activities during the winter months demonstrate a steadily declining trend, and the biological composition of the breeding sources remains relatively diverse and complex. Industrial pollution sources demonstrated compressed growth cycles with universal Chl-a maxima occurring within 6 days, followed by systematic decline. This pattern reflects the system’s pollutant attenuation capacity within environmental carrying limits, influenced by temperature-dependent nutrient assimilation kinetics that affect decay rates [36]. The observed exponential Chl-a increase by day 4 aligns with established phytoplankton bloom dynamics under nutrient repletion [34], while subsequent declines correspond to resource limitation phases. Notably, Chl-a serves as a robust proxy for phytoplankton biomass fluctuations [37,38,39], with the characteristic growth–collapse sequence illustrating the dual controls of nutrient availability and environmental stress. The salinity-dependent mortality thresholds observed in river plankton communities highlight critical ecophysiological limits under osmotic stress conditions.

4. Discussion

4.1. Critical Control Factors for Self-Purification Rate Process of Different Sources of Nutrients in TSB

The study results showed that nutrients DIN and DIP from four pollution sources (river source, domestic source, aquaculture source, and industrial source) of the ecological incubation experiments in different seasons had a significant correlation with pH, dissolved oxygen, and turbidity during the ecological incubation experiments. The reduction in nutrients in water during the incubation period was attributed to the growth and reproduction of phytoplankton, leading to an increase in Chl-a. Over time, the proliferation of plankton increased water turbidity, while phytoplankton in the water body showed a negative correlation with turbidity [39]. This is consistent with direct observations in numerous estuaries worldwide, such as the seagoing River in Tianjin and the San Francisco Bay [40,41], indicating that the growth status of phytoplankton is closely associated with pH levels, DO concentrations, and turbidity. Simultaneously, enhanced photosynthesis in the water body led phytoplankton to absorb CO2 and produce oxygen, resulting in an increase in pH [42]. Furthermore, during the incubation experiments, nutrients were found to have significant negative correlations with pH and dissolved oxygen, with variations in key controlling factors observed across different pollution sources. It is important to highlight that in the winter cultivation experiments, salinity served as the primary controlling factor for various pollution sources, and all of them exhibited a negative correlation with DIN and DIP. Winter water body is shown to be controlled by differences in the temperature and salinity of different water masses constituting this ecosystem [43].
As shown in Figure 9, the ecological incubated river source DIP had a highly significant negative correlation with pH, dissolved oxygen, and turbidity (p < 0.001) and a significant positive correlation with salinity (p < 0.05). The DIN/DIP ratio exhibited a significant positive correlation with pH, dissolved oxygen, and turbidity (p < 0.05). An increase in the DIN/DIP ratio typically indicates enhanced phosphorus limitation, leading to intensified competition among algae and microorganisms for residual DIP. This phenomenon can lead to further reductions in DIP, potentially impacting the abundance of phytoplankton and resulting in increased phosphorus limitation within the river source [44]. DSi had significant negative correlation with turbidity and Chl-a (p < 0.05). The main controlling factors of DIP in domestic sources are pH, dissolved oxygen, and turbidity, in addition to phytoplankton in TSB, with diatoms as the main dominant population [11]. Therefore, DSi was significantly negatively correlated with Chl-a. As shown in the figure, the domestic source DIN and DIP had highly significant negative correlation with pH, turbidity (p < 0.001), and dissolved oxygen (p < 0.05). DSi dissolved oxygen (p < 0.05) and Chl-a (p < 0.01) had a significant correlation relationship. Chl-a from domestic sources demonstrated a critical pigment in algal photosynthesis, with its concentration directly correlating to the increase in algal biomass. Photosynthesis is a process in which algae consume substantial quantities of CO2 in the water column, thereby significantly increasing the pH value [45]. The organic matter contained within living sources for phytoplankton uptake and utilization accelerates this process [46]. In aquaculture sources, DIN had significant correlation with pH (p < 0.01) and turbidity (p < 0.05). DSi had significant negative correlation with temperature (p < 0.05). In industrial sources inorganic nitrogen was negatively correlated with turbidity (p < 0.05). DIP was significantly correlated with Chl-a, salinity (p < 0.05), and pH (p < 0.01). DSi was significantly negatively correlated with Chl-a (p < 0.01). Additionally, the correlation between chlorophyll a of industrial sources and dissolved oxygen is significant. Furthermore, the exponential growth of phytoplankton on the third day results in substantial oxygen consumption, making dissolved oxygen a key control factor for industrial sources. Enhanced hydrodynamic mixing at the outfall accelerates the self-purification rate of nutrients.

4.2. First-Order Kinetic Self-Purification Rate Processes of DIN, DIP, and DSi at Different Salinity in TSB

Nutrients play a critical role in shaping the water quality of coastal ecosystems [47], significantly impacting the achievement of environmental standards and serving as essential elements for regulating marine plant growth and primary productivity. Extensive evidence demonstrates that nutrient concentrations in TSB exhibit a pronounced gradient, decreasing progressively from nearshore to offshore regions [48]. This spatial pattern is not unique to TSB but is a common phenomenon observed in various coastal ecosystems globally. Additionally, the seasonal distribution of nutrients also reveals a consistent decline from nearshore to offshore areas [49]. This gradient is particularly prominent in the ecological dynamics of diverse pollution sources, where the self-purification rate of nutrients increases progressively with changes in salinity.
The self-purification rate of DIN at different salinities varied with changes in salinity. The highest self-purification rate for the river source was observed at a salinity of 18, with a rate of −0.5107 d−1. Similarly, the domestic source also exhibited its maximum self-purification rate at a salinity of 18, with a coefficient of −0.5711 d−1. The aquaculture source exhibited a maximum self-purification rate of −0.4033 d−1 at medium salinity. The maximum self-purification rate of industrial sources was −0.2441 d−1 at medium salinity. Additionally, the highest uptake coefficient of DIN by phytoplankton was recorded at a salinity of 18. In coastal waters, the bioavailability of biogenic elements attains its maximum when the stoichiometric equilibrium between nutrients and phytoplankton-derived primary production is optimally balanced, particularly within the low-salinity zone. This indicates that salinity is closely associated with the distribution of phytoplankton [50]. The incubation experiment results further confirmed that maximum bioavailability occurs when both nutrient supply and primary productivity are adequately satisfied, which corresponds to a salinity of 18. These findings support the hypothesis that algal blooms are more likely to occur in the transitional zone between estuaries and bay ports.
The self-purification rate coefficient of self-purification rate of DIP increased with increasing salinity. For river sources, the coefficient peaked at a salinity level of 18. In contrast, both domestic and farmed sources exhibited an increasing trend with salinity, reaching their maximum at a salinity of 25. Industrial sources demonstrated a maximum coefficient of self-purification rate at medium salinity. The fastest biological growth was observed at high salinity for both domestic and farmed sources (Figure 10), leading to an enhanced biological uptake coefficient of DIP. River and industrial sources achieved their maximum self-purification rate coefficients at a salinity of 18, suggesting that the associated organisms thrive optimally under moderate salinity conditions. In the land-estuarine-coastal system, rivers convey substantial amounts of nutrients from land sources to estuaries, while seawater is abundant in marine nutrients [51]. In the mesohaline zone, the mixing of freshwater and seawater forms ‘nutrient fronts’, resulting nutrient enrichment. The highest population densities are typically observed in estuaries [52,53]. Medium-salinity areas, which are generally located between low and high salinity zones, exhibit more abundant and balanced nutrient supplies. Estuaries are medium-salinity environments and contain higher nutrient concentrations due to the mixing of freshwater and seawater. The mesohaline zones, predominantly distributed across estuarine ecotones and coastal frontal zones, constitute critical biogeochemical reactors in marine systems [54]. These transitional waters are characterized by optimized environmental matrices (Figure 10). The majority of the observed variations in attenuation rates occur within the medium-to-high-saline regions, with a greater prevalence in the medium-saline regions. This phenomenon can be attributed to two primary factors. Firstly, the interaction of tidal hydrodynamics and winds facilitates the supply of nutrients [18], such as nitrogen and phosphorus, from low-salt estuaries to the mid-salt region. Secondly, reduced turbidity in this area allows for more effective sunlight penetration, increasing the depth of the euphotic zone and extending the availability of photosynthetically active radiation for primary producers [55]. Additionally, hydrodynamics in the open ocean and extreme weather events such as typhoons transport nutrients suspended in the sediment back to the surface waters, thereby replenishing primary production. This unique combination of physical and chemical conditions promotes highly efficient nutrient cycling. The resultant “biogeochemical priming effect” sustains phytoplankton blooms through continuous nutrient replenishment. Field observations confirm 30–45% higher Chl-a standing stocks in mesohaline waters compared to adjacent freshwater/seaward zones, demonstrating their pivotal role as marine productivity hotspots. Furthermore, phytoplankton growth is closely linked to the self-purification capacity of bays, which aligns with study findings showing that the maximum self-purification efficiency for various pollution sources occurs in mid-salinity regions. It is vital to understand how salinity affects the composition and distribution of planktonic organisms in TSB, in order to further investigate the effects of different salinity levels on primary production, trophic dynamics, and food web structure in the estuaries. Through an in-depth analysis of the various pollution sources, improvements can be made to the ecosystem condition of TSB, and work can be undertaken towards targeted and effective remediation [47].
The self-purification rate of DSi showed a significant variation with salinity, as river and industrial sources exhibited a decline in silicate contribution at higher salinity levels. The minimum value was observed at high salinity, suggesting that TSB river and industrial sources contribute a greater abundance of silicate organisms. The results are consistent with Ragueneau’s findings, which indicate that multiple inputs of silicates are predominantly derived from rivers [56].

4.3. Treatment Options for Different Sources of Pollution

A significant amount of nitrogen and phosphorus is contained in river sewage. The influx of substantial quantities of these nutrients into slow-moving water bodies can induce eutrophication, a process marked by elevated nutrient levels, such as nitrogen and phosphorus, which stimulates the overgrowth of algae and other aquatic plants [56]. As illustrated in, the extent and indicators of pollution varied across different sources. The study revealed that the negative correlations between dissolved inorganic nitrogen (DIN), dissolved inorganic phosphorus (DIP), and parameters such as dissolved oxygen, turbidity, and pH (p < 0.05) were primarily attributed to phytoplankton activities. During the growth process, phytoplankton absorb carbon dioxide and release oxygen through photosynthesis, resulting in an increase in the pH of the water body. Simultaneously, this process leads to an increase in dissolved oxygen levels, while the proliferation of phytoplankton contributes to increased turbidity [57]. The inorganic nitrogen input from riverine and aquaculture sources is generally lower in winter compared to summer, a finding that aligns with previous research conducted in the Bohai Bay [58]. Additionally, there is no significant variation observed in the self-purification rate of inorganic nitrogen across seasons. In summer, plankton adjust their N/P absorption ratio to maintain nitrogen balance, which contributes to a higher self-purification rate during this season compared to winter [58]. For domestic sources, DIN and DIP exhibited higher concentrations of 0.750 ± 0.40 mg/L and 0.296 ± 0.21 mg/L (Figure 11). In domestic sources, the inorganic nitrogen content during winter is significantly higher than that observed in summer. This seasonal variation can be attributed to several factors. During winter, the reduction in water flow leads to poor hydrodynamic conditions. Additionally, lower temperatures result in reduced biological activity, which in turn decreases the self-purification rate of the aquatic system. Consequently, the concentration of inorganic nitrogen remains relatively high during this period. These sources also exhibited higher attenuation coefficient in summer. The presence of numerous large sewage treatment plants in the TSB area underscores the necessity to enhance their self-purification capacity. This can be accomplished by controlling the input of nitrogen and phosphorus and enhancing the quality of effluents discharged from point sources, such as sewage treatment facilities [59]. Among the four pollution sources, the self-purification rate of dissolved inorganic phosphorus (DIP) originating from aquaculture is the highest, which may be attributed to the growth of specific algae species, such as Sargassum, along the coast of Guangxi. These algae consumed significant amounts of phosphorus during their growth [56], resulting in a higher attenuation coefficient. The DIP concentrations from various anthropogenic sources exhibit seasonal minima during winter, with their dynamics being strongly modulated by human activities. Specifically, land-based sources DIP inputs substantially diminish in winter due to reduced hydrological fluxes, leading to a corresponding decline in DIP levels within nearshore waters. These synergistic effects collectively exacerbate phosphorus limitation in marine ecosystems during winter compared to summer conditions. The inorganic nitrogen input from industrial sources in TSB significantly exceeded the standard, with the average concentration of DIN reaching 4.88 ± 1.45 mg/L. Although the self-purification rate of DIN increased, and its nitrogen source surpassed the bioavailable range, resulting in water quality deterioration in TSB. Therefore, to address the complex pollution components emanating from industrial sources, it is recommended that the standard of discharged wastewater be raised, whilst concomitantly enhancing the hydrodynamic conditions of TSB to dilute the elevated concentrations of nitrogen and phosphorus pollutants. This would allow more plankton to absorb and utilize these pollutants for deposition, thereby contributing to the achievement of the ecological attenuation coefficient.
The issue of nitrogen and phosphorus pollution originating from domestic, aquaculture, and industrial sources is not only severe in TSB but also prevalent in most coastal regions [60,61]. Wurtsbaugh suggested that the degradation of water quality in the bay cannot be attributed solely to nitrogen or phosphorus but rather to their synergistic effects [62]. Excessive nitrogen and phosphorus loads have been shown to stimulate the proliferation of methanogens and cyanobacteria, as well as the production of toxic substances that accumulate in marine organisms. However, there are also documented cases of toxic blooms occurring under low-nutrient conditions, highlighting the complexity of the relationship between nitrogen and phosphorus dynamics [63]. Therefore, the self-purification capacity of the Gulf is dependent on changes in nitrogen and phosphorus [64]. Research findings indicate that industrial sources contribute significantly to excessive inorganic DIN, with an average concentration accounting for 65% of the total load. Moreover, the bioavailability of DIN is notably higher. To mitigate point-source pollution effectively, it is imperative to encourage enterprises to adopt low-nitrogen emission technologies during production processes, thereby reducing the generation of inorganic DIN. Additionally, there is a need to strengthen the supervision of industrial wastewater discharge, ensuring that effluent meets the stipulated standards. Enterprises that exceed these standards should face stringent punitive measures [65]. Secondly, the management agency should establish clear regulations on the nitrogen emission quotas and concentration limits for enterprises, thereby encouraging them to proactively reduce emissions and achieve the sustainable development of the green economy. The average concentration of river source, domestic source, and breeding source of DIN is 0.883 ± 0.45 mg/L, which is within a reasonable range. This is mainly achieved through enhancing the water body dynamics, transferring the high concentration of nitrogen and phosphorus from land sources to a low concentration, thereby reducing the pollution of local pollutant concentration. The tidal type of the TSB is mixed, and the utilization of tides and waves can improve the water body’s mixing capacity, as well as its ability to dilute and disperse pollutants [43]. Additionally, it increases the contact area between the water body and air, enhancing the oxidation capacity of the water body, which facilitates the exchange and absorption of nutrients and strengthens the bay’s self-purification capability. Simultaneously, the synchronized operation of gates and pumps can expedite the water body’s renewal coefficient, thereby engendering more conducive conditions for biological purification.

5. Conclusions

This study elucidates the biogeochemical governing land-derived nutrient attenuation in TSB through incubation experiments. The results revealed source-dependent attenuation coefficients, with river source in summer exhibiting the highest DIN self-purification rate (−0.324 ± 0.17 d−1), while industrial effluents demonstrated a superior DIP self-purification rate (−0.433 ± 0.20 d−1). Both DIN and DIP exhibit the highest self-cleaning rates among industrial sources during the winter season. DSi shows minimal source-specific variability, peaking in domestic wastewater (−0.360 ± 0.27 d−1). Phytoplankton biomass dynamics revealed a triphasic Chl-a progression: an exponential growth phase (days 1–3, 4.59–71.45 μg/L) under nutrient-replete conditions, followed by nutrient limitation decline post-day 4. Industrial sources displayed the maximum Chl-a growth coefficient (4.383 ± 2.45 d−1), indicative of enhanced bioavailable nutrient loading. Stoichiometric analysis identified the nitrogen–phosphorus ratio (DIN/DIP) as a primary Chl-a modulator in domestic sources (p < 0.01), while DSi/DIP emerged as a key regulatory factor across land-based sources. Multivariate analysis revealed pH as the dominant environmental control, showing strong covariation with domestic DIN and DIP, corroborated by dissolved oxygen and turbidity correlations (p < 0.05). The salinity level is the primary factor influencing the self-purification capacity of seawater during the winter months. This study establishes critical site-specific coefficients for coastal nutrient attenuation dynamics in TSB, providing a mechanistic framework to advance source apportionment of land-based sources pollutants and inform ecosystem-based management of coastal self-purification capacity at the land–sea interface.

Supplementary Materials

The following supporting information can be downloaded at: https://www.mdpi.com/article/10.3390/jmse13061133/s1, Figure S1: Technical route of the incubation experiments.

Author Contributions

Conceptualization, P.Z.; Methodology, P.Z. and F.X.; Software, F.X.; Validation, H.L., Y.H. and F.X.; Form analysis, F.X. and Y.H.; Writing—original draft preparation, P.Z., J.Z. and F.X.; Writing—review and editing, J.Z., C.R. and D.L.; Visualization, D.L.; Supervision, P.Z.; Project management, P.Z., J.Z. and C.R.; Funding acquisition, P.Z. and J.Z. All listed authors made substantial, direct, and intellectual contributions to the work and are approved for publication. All authors have read and agreed to the published version of the manuscript.

Funding

This research was supported by the Guangxi Key Research and Development Program (GuiKeAB22035065), the Guangxi Key Laboratory of Marine Environmental Change and Disaster in Beibu Gulf, Beibu Gulf University (2022KF005), the Guangdong Basic and Applied Basic Research Foundation (2023A1515012769), Research and Development Projects in Key Areas of Guangdong Province (2020B1111020004), New Era Graduate Course Ideological and Political Education Construction Project (202523).

Data Availability Statement

Data is contained within the article or Supplementary Materials.

Acknowledgments

Thanks to the reviewers for their careful review and constructive suggestions. Thanks to all members of the research team and others involved in this study.

Conflicts of Interest

The authors declare no conflicts of interest.

References

  1. Yong, D.; Tang, X.-X.; Zhen, Y.; You, W. Effect of nutrients structure on primary production in offshore of Shandong Province. Mar. Environ. Sci. 2011, 30, 177–181. [Google Scholar]
  2. Tromme, G.; Poxleitner, M.; Lorenz, P.; Bitzilekis, B.; Gogaladze, A.; Stibor, H. Altered food-web dynamics under increased nitrogen load in phosphorus deficient lakes. Aquat. Sci. 2017, 79, 1009–1021. [Google Scholar] [CrossRef]
  3. Zhang, P.; Long, H.; Li, Z.; Chen, R.; Peng, D.; Zhang, J. Effects of typhoon events on coastal hydrology, nutrients, and algal bloom dynamics: Insights from continuous observation and machine learning in semi-enclosed Zhanjiang Bay, China. Sci. Total Environ. 2024, 924, 171676. [Google Scholar] [CrossRef] [PubMed]
  4. Kang, J.H.; Lin, Y.L.; Wang, Y.; Lan, W.L. Assessment of the Eutrophication Level of the Marine Environment and Its Effect on Phytoplankton Chlorophyll a in Qinzhou Bay. Mar. Dev. Manag. 2021, 37, 67–74. [Google Scholar]
  5. Zhang, P.; Peng, C.; Zhang, J.; Zhang, J.; Chen, J.Y.; Zhao, H. Long-Term Harmful Algal Blooms and Nutrients Patterns Affected by Climate Change and Anthropogenic Pressures in the Zhanjiang Bay, China. Front. Mar. Sci. 2022, 9, 849819. [Google Scholar] [CrossRef]
  6. Zhang, P.; Xu, J.L.; Zhang, J.B.; Li, J.X.; Luo, X.Q. Spatiotemporal dissolved silicate variation, sources, and behavior in the eutrophic Zhanjiang Bay, China. Water 2020, 12, 3586. [Google Scholar] [CrossRef]
  7. Huang, Y.L.; Li, Y.; Chen, Z.P.; Li, R.M.; Chen, H.R.; Mu, J.L. Spatiotemporal distributions of nutrients and their potential influencingfactors in Sansha bay. Mar. Environ. Sci. 2023, 42, 440–448. [Google Scholar]
  8. Lan, W.L.; Li, T.S.; Han, L.J. Distribution and seasonal variation of nutrition in the adjacent waters of Tieshangang bay in Guangxi. Mar. Sci. 2014, 38, 63–69. [Google Scholar]
  9. Ke, S.; Zhang, P.; Ou, S.; Zhang, J.; Chen, J.; Zhang, J. Spatiotemporal nutrient patterns, composition, and implications for eutrophication mitigation in the Pearl River Estuary, China. Estuar. Coast. Shelf Sci. 2022, 266, 107749. [Google Scholar] [CrossRef]
  10. Liu, L.H. Temporal and spatial nutrient variations in inshore waters of Xiamen and eutrophication assessment. J. Appl. Oceanogr. 2023, 42, 75–84. [Google Scholar]
  11. Williams, R.G.; Follows, M.J. Physical Transport of Nutrients and the Maintenance of Biological Production; Springer: Berlin/Heidelberg, Germany, 2003; pp. 19–51. [Google Scholar]
  12. Tao, X.P.; Wu, M.; Liu, X.; Lei, F.; He, X.L. Investigation and Analysis of Water Quality Pollution in BeibuGulf of Guangxi. Guangxi Sci. 2022, 29, 9. [Google Scholar]
  13. Ping, L.; Hailian, M.; Zhao, G.J. Current Condition and Assessment of Inshore Water Quality in Guangxi. Bull. Sci. Technol. 2018, 7, 6. [Google Scholar]
  14. Wei, X.M.; Tong, W.P.; Lai, T.H.; He, B.M. The changing characteristics of biogenic elements and their influencing factors in Tieshangang Port. Trans. Oceanol. Limnol. 2001, 4, 23–27. [Google Scholar]
  15. Lan, W.L.; Peng, X.Y. Characteristics of nutrient changes in Tieshan Harbor from 2003 to 2010. Guangxi Sci. 2011, 18, 380–384. [Google Scholar]
  16. Lu, D.; Kang, Z.; Yang, B.; Dan, S.F.; Zhong, Q. Compositions and spatio-temporal distributions of different nitrogen species and lability of dissolved organic nitrogen from the Dafengjiang River to the Sanniang Bay, China. Mar. Pollut. Bull. 2020, 156, 111205. [Google Scholar] [CrossRef] [PubMed]
  17. Xia, Y.H.; Li, X.L.; Han, G. Studies on the environmental capacity of the Dapeng Bay, Part I: Numerical study of water self-purification. China Environ. Sci. 2011, 31, 2031–2038. [Google Scholar]
  18. Meng, X.; Zhang, C. Offshore Resources and Current Situation in Guangxi Coast; Ocean Press Beijing: Beijing, China, 2013. [Google Scholar]
  19. Wei, X.M.; Fan, H.Q.; He, B.M.; Cao, Q.X.; Li, Z. Nutritional level and component characteristic of water in mangrove area of Tieshan Bay. J. Trop. Oceanogr. 2013, 32, 1009–5470. [Google Scholar]
  20. Zhang, B.H.; Chen, S.L.; Gu, G.C. Tidal types andcharacteristics of theharbors along the Guangxicoast. Oceanogr. Res. 2010, 28, 9–16. [Google Scholar]
  21. Pei, M.F.; Hu, J.T.; Gao, J.S.; Li, T. Study on the response of water exchange capacity to reclamation and monsoon in Tieshan Port, Guangxi. Mar. Lake Bull. 2019, 6, 34–40. [Google Scholar]
  22. Zhang, P.; Wu, S.; Xu, M.; Luo, X.; Peng, X.; Ren, C.; Zhang, J. Spatiotemporal Nutrient Patterns, Stoichiometry, and Eutrophication Assessment in the Tieshan Bay Coastal Water, China. J. Mar. Sci. Eng. 2023, 11, 1602. [Google Scholar] [CrossRef]
  23. He, B.M.; Wei, X.M.; Fan, H.Q.; Cao, X.Q. Spatio-temporal change ofinorganic nitrogen contentand the evaluation ofeutrophication in thesurface seawaters ofmangrove areas in Guangxibays. J. Appl. Oceanogr. 2014, 33, 140–148. [Google Scholar]
  24. Chen, Y.J.W. Analysis of Nitrogen and Phosphorus Pollution in Shenzhen Bay over the Past 40 Years. Water 2024, 16, 3002. [Google Scholar] [CrossRef]
  25. Saito, M.A.; Goepfert, T.J.; Ritt, J.T. Some thoughts on the concept of colimitation: Three definitions and the importance of bioavailability. Limnol. Oceanogr. 2008, 53, 276–290. [Google Scholar] [CrossRef]
  26. Lawson, G.M.; Young, J.L.; Aanderud, Z.T.; Jones, E.F.; Bratsman, S.; Daniels, J.; Malmfeldt, M.P.; Baker, M.A.; Abbott, B.W.; Daly, S. Nutrient limitation and seasonality associated with phytoplankton communities and cyanotoxin production in a large, hypereutrophic lake. Harmful Algae 2025, 143, 102809. [Google Scholar] [CrossRef]
  27. Dongwei, H.; Zhijian, H.; Shenzheng, Z.; Jian, L.; Dongdong, W.; Xisha, D.; Shaoping, W.; Zhili, H.; Jianguo, H. Environmental Factors Shape Water Microbial Community Structure and Function in Shrimp Cultural Enclosure Ecosystems. Front. Microbiol. 2017, 8, 2359. [Google Scholar]
  28. Moneta, A.; Veuger, B.; van Rijswijk, P.; Meysman, F.; Soetaert, K.; Middelburg, J.J. Dissolved inorganic and organic nitrogen uptake in the coastal North Sea: A seasonal study. Estuar. Coast. Shelf Sci. 2014, 147, 78–86. [Google Scholar] [CrossRef]
  29. Wheeler, P.A.; Kirchman, D. Utilization of inorganic and organic nitrogen by bacteria in marine systems. Limnol. Oceanogr. 1986, 31, 998–1009. [Google Scholar] [CrossRef]
  30. Zhang, L.; Wang, L.; Yin, K.; Lü, Y.; Yang, Y.; Huang, X. Spatial and Seasonal Variations of Nutrients in Sediment Profiles and Their Sediment-Water Fluxes in the Pearl River Estuary, Southern China. J. Earth Science. 2014, 25, 197–206. [Google Scholar] [CrossRef]
  31. Zhou, W.H.; Yuan, X.C.; Huo, W.Y.; Yin, K.D. Distribution of chlorophyll a and primary productivity in the Yangtze estuary neighborhood. J. Oceanogr. 2004, 26, 143–150. [Google Scholar]
  32. Ma, Y.; Wei, W.; Gao, Z.H.; Wang, D.; Yang, Y.; Ma, Y. Study of the nutrient distribution and its influence factorsin the Qinzhou Bay. Mar. Bull. 2013, 32, 481–487. [Google Scholar]
  33. Gunnars, A.; Blomqvist, S.; Johansson, P.; Andersson, C. Formation of Fe(III) oxyhydroxide colloids in freshwater and brackish seawater, with incorporation of phosphate and calcium. Geochim. Cosmochim. Acta 2002, 66, 745–758. [Google Scholar] [CrossRef]
  34. Zhang, Y.F.; Li, X.Y.; Zhang, W.L.; Zhang, J.L. Spatial and temporal distribution of silicate and chlorophyll a in the coastal waters with picophytoplankton algal bloom. Ecol. Sci. 2013, 32, 509–513. [Google Scholar]
  35. Qu, K.M.; Chen, B.J.; Yuan, Y.X.; Xin, F.Y. Preliminary study of nitrogen-phosphorous nutrients affecting the population composition of phytoplankton diatom in seawater. J. Appl. Ecol. 2000, 11, 445–448. [Google Scholar]
  36. Bin, Y.; Huai-Yi, F.; Li-Li, X.U.; Qiu-Ping, Z.; Shu-Shi, L. Spatio-temporal variation characteristics and driving factors of water pollution in Qinzhou bay. Mar. Environ. Sci. 2017, 36, 877–883. [Google Scholar]
  37. Liu, S.S.; Yang, G.P.; Gao, X.X.; Wei, Y.; He, Z. Variation of volatile haloearbon concentrations in the ineubation experiments with the addition of nutrients in the western Pacific Ocean. China Environ. Sci. 2019, 39, 4313–4320. [Google Scholar]
  38. He, Y.; Zhang, P.; Xu, F.; Zhao, L.; Zhang, J. Seasonal nutrients variation, eutrophication pattern, and Chlorophyll a response adjacent to Guangdong coastal water, China. Front. Mar. Sci. 2023, 10, 1236609. [Google Scholar] [CrossRef]
  39. Chen, C.W.; Ju, Y.R.; Chen, C.F.; Dong, C.D. Evaluation of organic pollution and eutrophication status of Kaohsiung Harbor, Taiwan. Int. Biodeterior. Biodegrad. 2016, 113, 318–324. [Google Scholar] [CrossRef]
  40. Sun, X.; Zhang, H.; Wang, Z.; Huang, T.; Huang, H. Phytoplankton Community Response to Environmental Factors along a Salinity Gradient in a Seagoing River, Tianjin, China. Microorganisms 2023, 11, 75. [Google Scholar] [CrossRef]
  41. Cloern, J. Turbidity as a control on phytoplankton biomass and productivity in estuaries. Cont. Shelf Res. 1987, 7, 1367–1381. [Google Scholar] [CrossRef]
  42. Geeraert, N.; Archana, A.; Xu, M.; Kao, S.; Baker, D.; Thibodeau, B. Investigating the link between Pearl River-induced eutrophication and hypoxia in Hong Kong shallow coastal waters. Sci. Total Environ. 2021, 772, 145007. [Google Scholar] [CrossRef]
  43. Nana, P.A.; Seth, R.E.; Tamko, N.A.N.; Ossomba, V.R.O.; Bricheux, G.; Metsopkeng, C.S.; Nola, M.; Sime-Ngando, T. Tidal effect on the dispersion of fecal pollution indicator bacteria and associated health risks along the Kribi beaches (Southern Atlantic coast, Cameroon). Reg. Stud. Mar. Sci. 2023, 60, 102831. [Google Scholar] [CrossRef]
  44. Hu, Q.; Qu, L.; Huang, B.G.; Li, Q.; You, Q.M. Status and evaluation on nutrients for the adjacent sea water of the YellowRiver estuary in autumn of 2014. Mar. Environ. Sci. 2016, 35, 732–738. [Google Scholar]
  45. Wu, H.; Zou, D.; Gao, K. Impacts of increased atmospheric CO2 concentration on photosynthesis and growth of micro-and macro-algae. Sci. China Ser. C Life Sci. 2008, 51, 1144–1150. [Google Scholar] [CrossRef] [PubMed]
  46. Liu, Q.; Jiang, Y.; Huang, X.; Liu, Y.; Guan, M.; Tian, Y. Hydrological conditions can change the effects of major nutrients and dissolved organic matter on phytoplankton community dynamics in a eutrophic river. J. Hydrol. 2024, 628, 130503. [Google Scholar] [CrossRef]
  47. Mackay, E.B.; Feuchtmayr, H.; De Ville, M.M.; Thackeray, S.J.; Callaghan, N.; Marshall, M.; Rhodes, G.; Yates, C.A.; Johnes, P.J.; Maberly, S.C. Dissolved organic nutrient uptake by riverine phytoplankton varies along a gradient of nutrient enrichment. Sci. Total Environ. 2020, 722, 137837. [Google Scholar] [CrossRef]
  48. Nielsen, D.L.; Brock, M.A.; Rees, G.N.; Baldwin, D.S. Effects of Increasing Salinity on Freshwater Ecosystems in Australia. Aust. J. Bot. 2003, 51, 655–665. [Google Scholar] [CrossRef]
  49. He, B.; Wei, M. The characteristics of the bionomical environment in Qinzhou Bay and the relationship between the characteristics and the self-purifying conditions of the water body. Mar. Sci. Bull./Haiyang Tongbao 2004, 23, 50–54. [Google Scholar]
  50. Ke, Z.; Tan, Y.; Ma, Y.; Huang, L.; Wang, S. Effects of surface current patterns on spatial variations of phytoplankton community and environmental factors in Sunda shelf. Cont. Shelf Res. 2014, 82, 119–127. [Google Scholar] [CrossRef]
  51. Bharathi, M.D.; Sarma, V.V.S.S.; Ramaneswari, K. Intra-annual variations in phytoplankton biomass and its composition in the tropical estuary: Inuence of river discharge. Mar. Pollut. Bull. 2018, 129, 14–25. [Google Scholar] [CrossRef]
  52. Muylaert, K.; Sabbe, K.; Vyverman, W. Changes in phytoplankton diversity and community composition along the salinity gradient of the Schelde estuary (Belgium/The Netherlands). Estuar. Coast. Shelf Sci. 2009, 82, 335–340. [Google Scholar] [CrossRef]
  53. Montagna, P.A.; Kalke, R.D. The effect of freshwater inflow on meiofaunal and macrofaunal populations in the Guadalupe and Nueces Estuaries, Texas. Estuaries 1992, 15, 307–326. [Google Scholar] [CrossRef]
  54. Jacquemot, L.; Kalenitchenko, D.; Matthes, L.; Lovejoy, C. Protist communities along freshwater–marine transition zones in Hudson Bay (Canada). Elem. Sci. Anthr. 2021, 9, 00111. [Google Scholar] [CrossRef]
  55. Orchard, E.D.; Ammerman, J.W.; Lomas, M.W.; Dyhrman, S. Dissolved inorganic and organic phosphorus uptake in Trichodesmium and the microbial community: The importance of phosphorus ester in the Sargasso Sea. Limnol. Oceanogr. 2010, 55, 1390–1399. [Google Scholar] [CrossRef]
  56. Ragueneau, O.; De Blas, V.E.; Treguer, P.; Queguiner, B. Phytoplankton dynamics in relation to biogeochemical cycle of silicon in a coastal ecosystem of Western Europe. Mar. Ecol. Prog. Ser. 1994, 106, 157–172. [Google Scholar] [CrossRef]
  57. Wang, J.; Zhang, Z. Phytoplankton, dissolved oxygen and nutrient patterns along a eutrophic river-estuary continuum: Observation and modeling. J. Environ. Manag. 2020, 261, 110233. [Google Scholar] [CrossRef]
  58. Ding, X.; Guo, X.; Gao, H.; Gao, J.; Shi, J.; Yu, X.; Wu, Z. Seasonal variations of nutrient concentrations and their ratios in the central Bohai Sea. Sci. Total Environ. 2021, 799, 149416. [Google Scholar] [CrossRef]
  59. Hendriks, A.T.; Langeveld, J.G. Rethinking wastewater treatment plant effluent standards: Nutrient reduction or nutrient control? Engl. Sci. Technol. 2017, 51, 4735–4737. [Google Scholar] [CrossRef]
  60. Paerl, H.W.; Hall, N.S.; Peierls, B.L.; Rossignol, K.L. Evolving paradigms and challenges in estuarine and coastal eutrophication dynamics in a culturally and climatically stressed world. Estuaries Coasts 2014, 37, 243–258. [Google Scholar] [CrossRef]
  61. Yan, X.; Xia, Y.; Ti, C.; Shan, J.; Wu, Y.; Yan, X. Thirty years of experience in water pollution control in Taihu Lake: A review. Sci. Total Environ. 2024, 914, 12. [Google Scholar] [CrossRef]
  62. Wurtsbaugh, W.A.; Paerl, H.W.; Dodds, W.K.J. Nutrients, eutrophication and harmful algal blooms along the freshwater to marine continuum. Wiley Interdiscip. Rev. Water 2019, 6, e1373. [Google Scholar] [CrossRef]
  63. Jeppesen, E.; Meerhoff, M.; Davidson, T.; Trolle, D.; Sondergaard, M.; Lauridsen, T.; Nielsen, A. Climate change impacts on lakes: An integrated ecological perspective based on a multi-faceted approach, with special focus on shallow lakes. J. Limnol. 2014, 73, 88–111. [Google Scholar] [CrossRef]
  64. Mezentseva, I.V.; Sovga, E.E.; Khmara, T.V. Self-purification capacity of Sevastopol Bay ecosystems in relation to inorganic forms of nitrogen and phosphorus from 2012 to 2020. Ecol. Saf. Coast. Shelf Zones Sea 2023, 4, 101–115. [Google Scholar]
  65. Mokhtar, Z.; Kenway, S.; Mat Nashir, I. Challenges for Compliance with Industrial Effluent Regulations—An Industry Perspective. Challenges 2024, 16, 1. [Google Scholar] [CrossRef]
Figure 1. Different land-based sources of sampling stations in TSB.
Jmse 13 01133 g001
Figure 2. Dynamics of DIN during incubation experiments in different seasons.
Jmse 13 01133 g002
Figure 3. Dynamics of DIN self-purification rates during incubation experiments across different seasons.
Jmse 13 01133 g003
Figure 4. Dynamics of DIP during incubation experiments in different seasons.
Jmse 13 01133 g004
Figure 5. Dynamics of DIP self-purification rates during incubation experiments across different seasons.
Jmse 13 01133 g005
Figure 6. Dynamics of DSi during incubation experiments in different seasons.
Jmse 13 01133 g006
Figure 7. Dynamics of DSi self-purification rates during incubation experiments across different seasons.
Jmse 13 01133 g007
Figure 8. Dynamics of Chl-a during incubation experiments in different seasons.
Jmse 13 01133 g008
Figure 9. Correlation analysis of nutrients in different seasons from different sources of pollution with environmental factors. Incubation experiments summer river sources (a), domestic source (b), aquaculture source (c), industry source (d). Incubation experiments winter river sources (e), domestic source (f), aquaculture source (g), industry source (h).
Jmse 13 01133 g009
Figure 10. Mechanisms of differences in self-purification between different salinity.
Jmse 13 01133 g010
Figure 11. The concentration of nutrient salts and the self-purification rates of pollution sources vary across different seasons.
Jmse 13 01133 g011
Table 1. Sampling information for various pollution sources of TSB.
River SourcesDomestic SourcesAquaculture SourcesIndustrial SourcesMixed Sea Water
Temperature (°C)31.232.531.541.830.9
Salinity (PSU)0.50.828.86.327
DO (mg/L)7.066.766.625.16.3
pH7.88.098.167.37.66
Turbidity (NTU)4.932.015.8865.32.87
Table 2. Basic information on different pollution sources in TSB.
StationEstuaries and Outfalls from Land-Based SourcesLongitudes/°ELatitude/°NDifferent Sources
S1Fozi river109.465821.6733River sources
S2Guangxi Beihai City, Tieshan Port District sewage treatment plant109.564821.5243Domestic sources
S3TSB Zhengang Aquaculture109.479821.4794Aquaculture sources
S4Sinopec Beihai Refining & Chemical company 109.515821.4981Industrial sources
Table 3. Incubation Experiments information of different pollution sources in TSB.
Different Sources of PollutionSalinity Settings After Mixing with Seawater (PSU)
River sources101825
Domestic sources101825
Aquaculture sources202325
Industrial sources101825
Table 4. Changes in mean values of environmental factors for ecological experiments during the summer season.
Different Sources of PollutionMixed SalinityTemperature (°C)DO (mg/L)pH
River sourceLow salinity30.59 ± 1.157.88 ± 1.018.87 ± 1.03
Medium salinity30.83 ± 1.457.80 ± 2.158.82 ± 1.02
High salinity31.01 ± 1.668.40 ± 4.408.86 ± 1.07
Domestic sourceLow salinity31.04 ± 2.268.80 ± 3.008.92 ± 1.19
Medium salinity30.79 ± 2.508.42 ± 3.238.78 ± 0.98
High salinity30.91 ± 1.918.93 ± 3.538.83 ± 1.07
Aquaculture sourceLow salinity31.06 ± 2.268.64 ± 3.348.82 ± 1.15
Medium salinity31.31 ± 2.508.31 ± 4.008.74 ± 1.14
High salinity31.17 ± 1.908.70 ± 2.978.65 ± 0.83
Industrial sourceLow salinity31.07 ± 2.436.79 ± 1.808.73 ± 1.45
Medium salinity31.09 ± 1.568.55 ± 3.068.79 ± 1.07
High salinity31.14 ± 1.918.19 ± 2.178.75 ± 1.04
Table 5. Changes in mean values of environmental factors for ecological experiments during the winter season.
Different Sources of PollutionMixed SalinityTemperature (°C)DO (mg/L)pH
River sourceLow salinity21.61 ± 1.188.54 ± 1.608.34 ± 0.72
Medium salinity21.4 ± 1.647.77 ± 1.077.80 ± 0.53
High salinity20.93 ± 0.958.33 ± 0.6617.77 ± 0.19
Domestic sourcesLow salinity21.49 ± 1.069.55 ± 1.498.59 ± 1.02
Medium salinity21.32 ± 1.078.05 ± 1.828.29 ± 0.56
High salinity21.28 ± 1.067.23 ± 0.898.08 ± 0.26
Aquaculture sourcesLow salinity21.20 ± 0.957.61 ± 0.967.96 ± 0.27
Medium salinity21.20 ± 0.967.86 ± 21.068.05 ± 0.32
High salinity21.23 ± 0.987.73 ± 0.617.79 ± 0.19
Industrial sourceLow salinity21.15 ± 0.928.97 ± 1.738.53 ± 0.54
Medium salinity21.21 ± 0.957.85 ± 1.918.16 ± 0.33
High salinity21.37 ± 1.227.54 ± 1.017.85 ± 0.15
Table 6. The self-purification rate (Kobs) of ecological cultivation experiments varies across different seasons in TSB.
Different Sources of PollutionAverage DIN Self-Purification (d−1)Average DIP Self-Purification (d−1)Average DSi Self-Purification (d−1)
Summer
River source−0.3244 ± 0.17−0.3688 ± 0.06−0.1499 ± 0.03
Domestic source−0.3122 ± 0.22−0.3351 ± 0.06−0.2487 ± 0.11
Aquaculture source−0.2971 ± 0.11−0.1591 ± 0.03−0.2293 ± 0.17
Industry source−0.1369 ± 0.09−0.4332 ± 0.20−0.2327 ± 0.15
Winter
River source−0.0717 ± 0.03−0.0921 ± 0.06−0.1470 ± 0.01
Domestic source−0.0646 ± 0.08−0.0930 ± 0.15−0.1433 ± 0.11
Aquaculture source−0.0909 ± 0.05−0.0734 ± 0.00−0.3193 ± 0.31
Industry source−0.1541 ± 0.24−0.1205 ± 0.07−0.7109 ± 0.06
Disclaimer/Publisher’s Note: The statements, opinions and data contained in all publications are solely those of the individual author(s) and contributor(s) and not of MDPI and/or the editor(s). MDPI and/or the editor(s) disclaim responsibility for any injury to people or property resulting from any ideas, methods, instructions or products referred to in the content.

