
Colloidal Silica-Stabilized Subgrade for Self-Sensing Vehicle Stress Affected by Unsaturation and Crack

Abstract
1. Introduction
2. Experiment
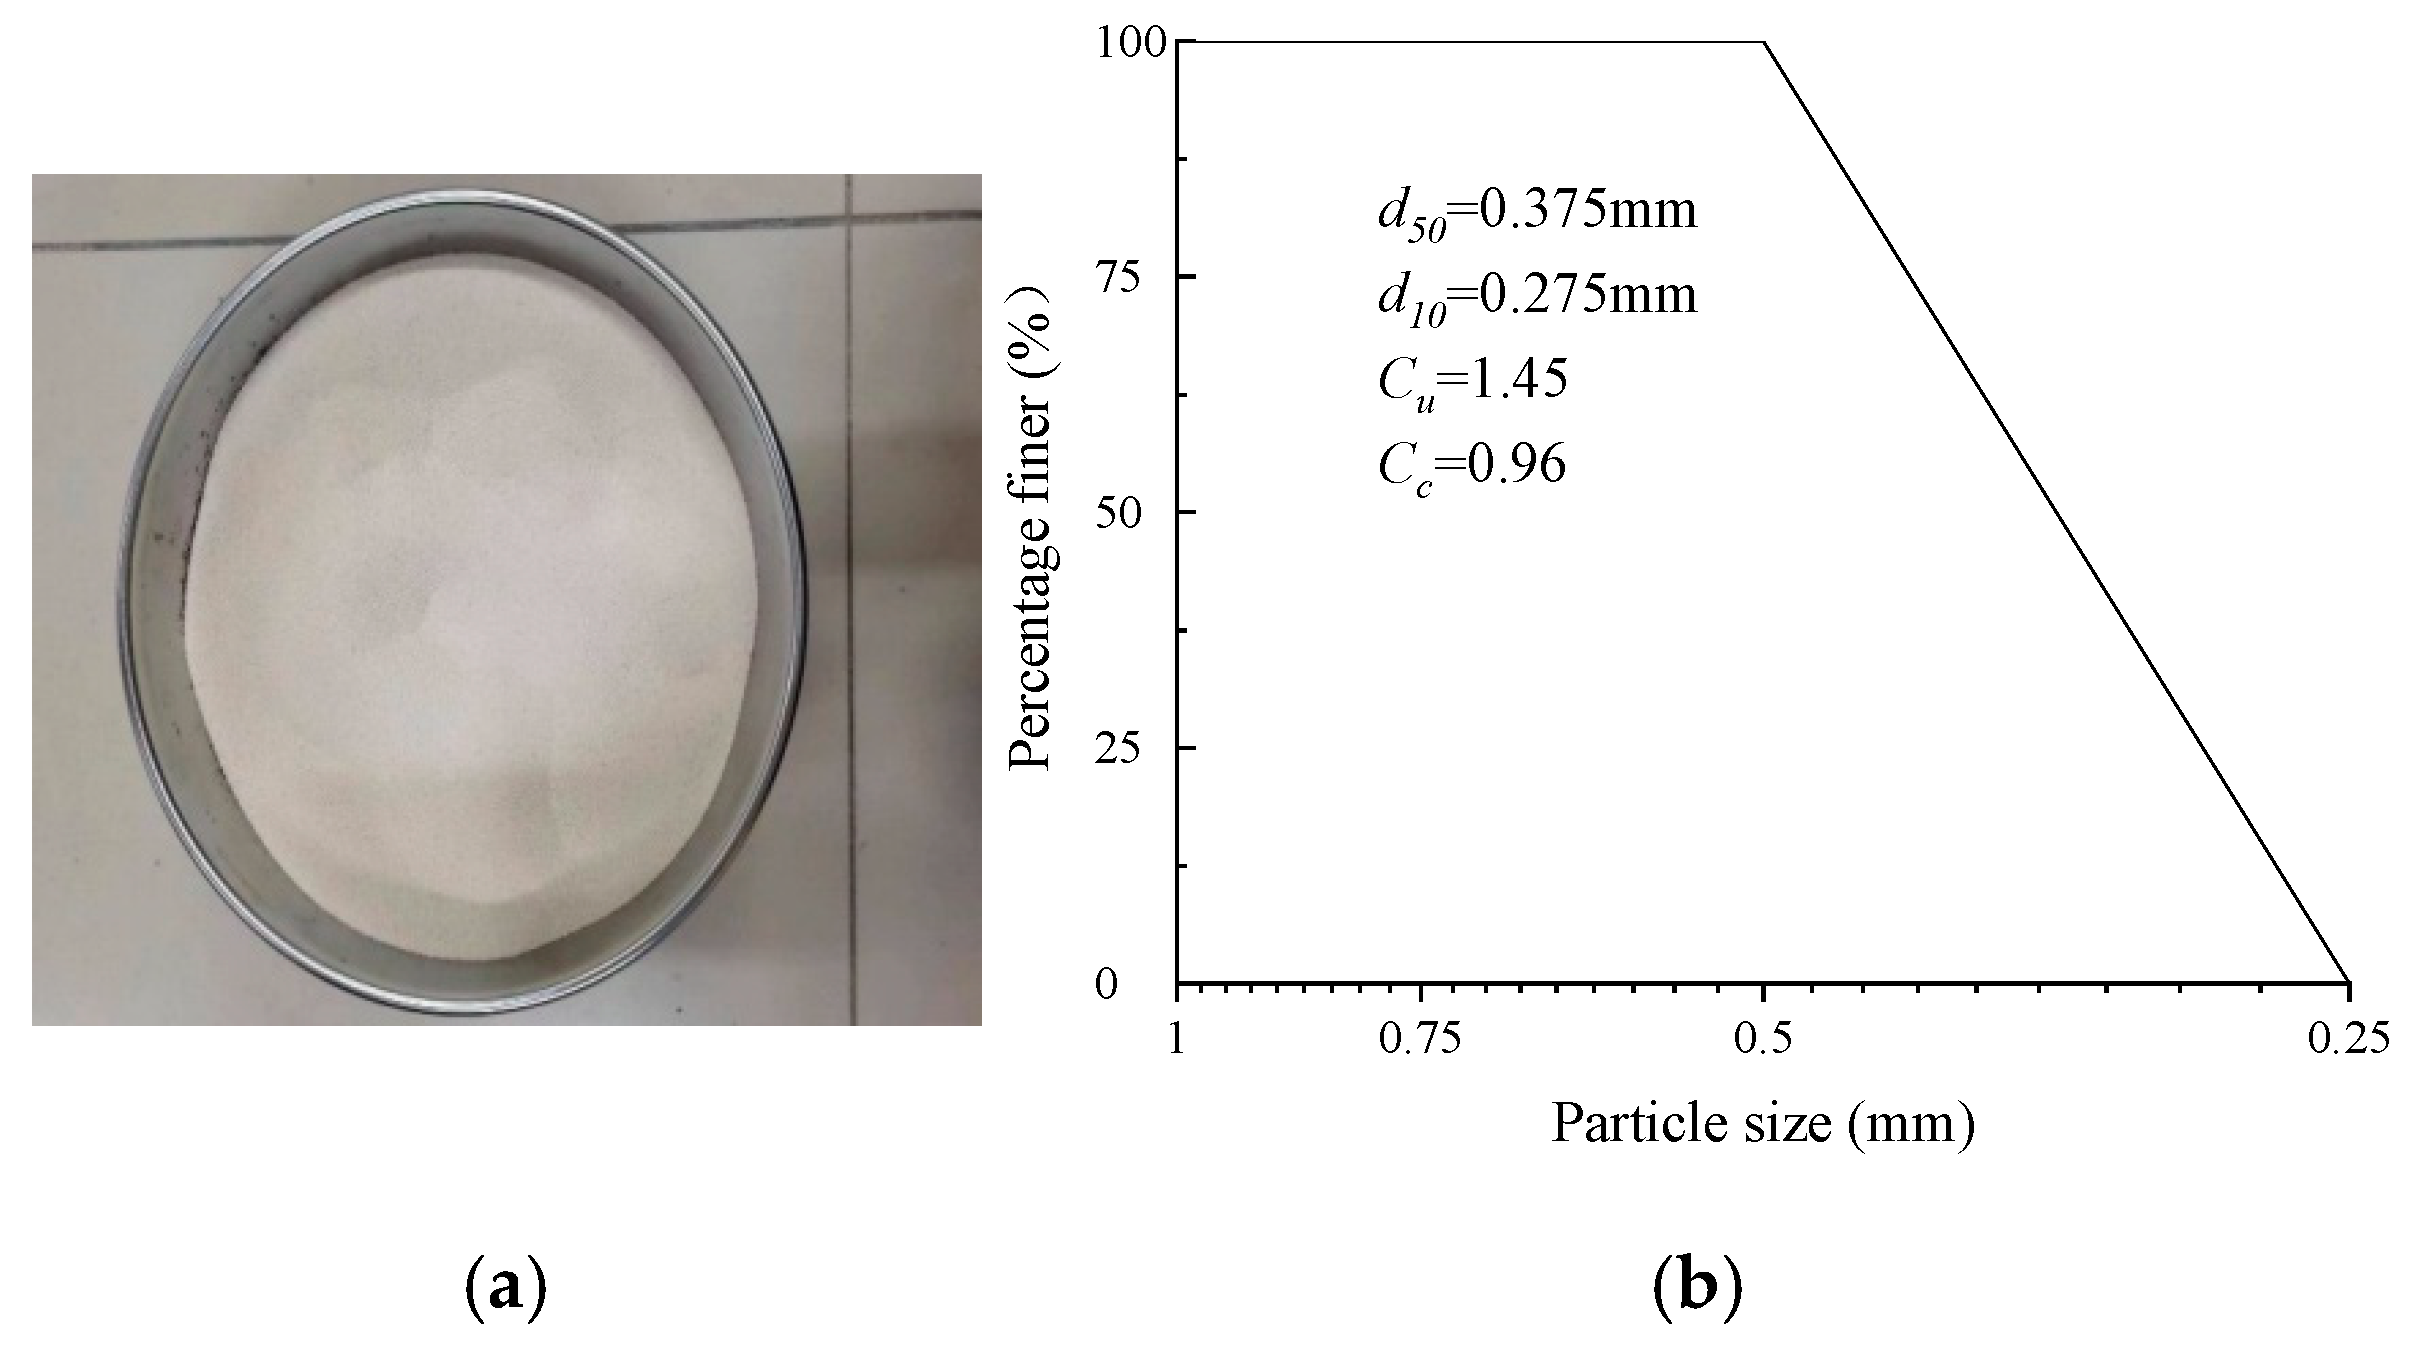
2.1. Materials
2.2. Specimen Preparation and Testing Plan
2.2.1. Suction Measurement
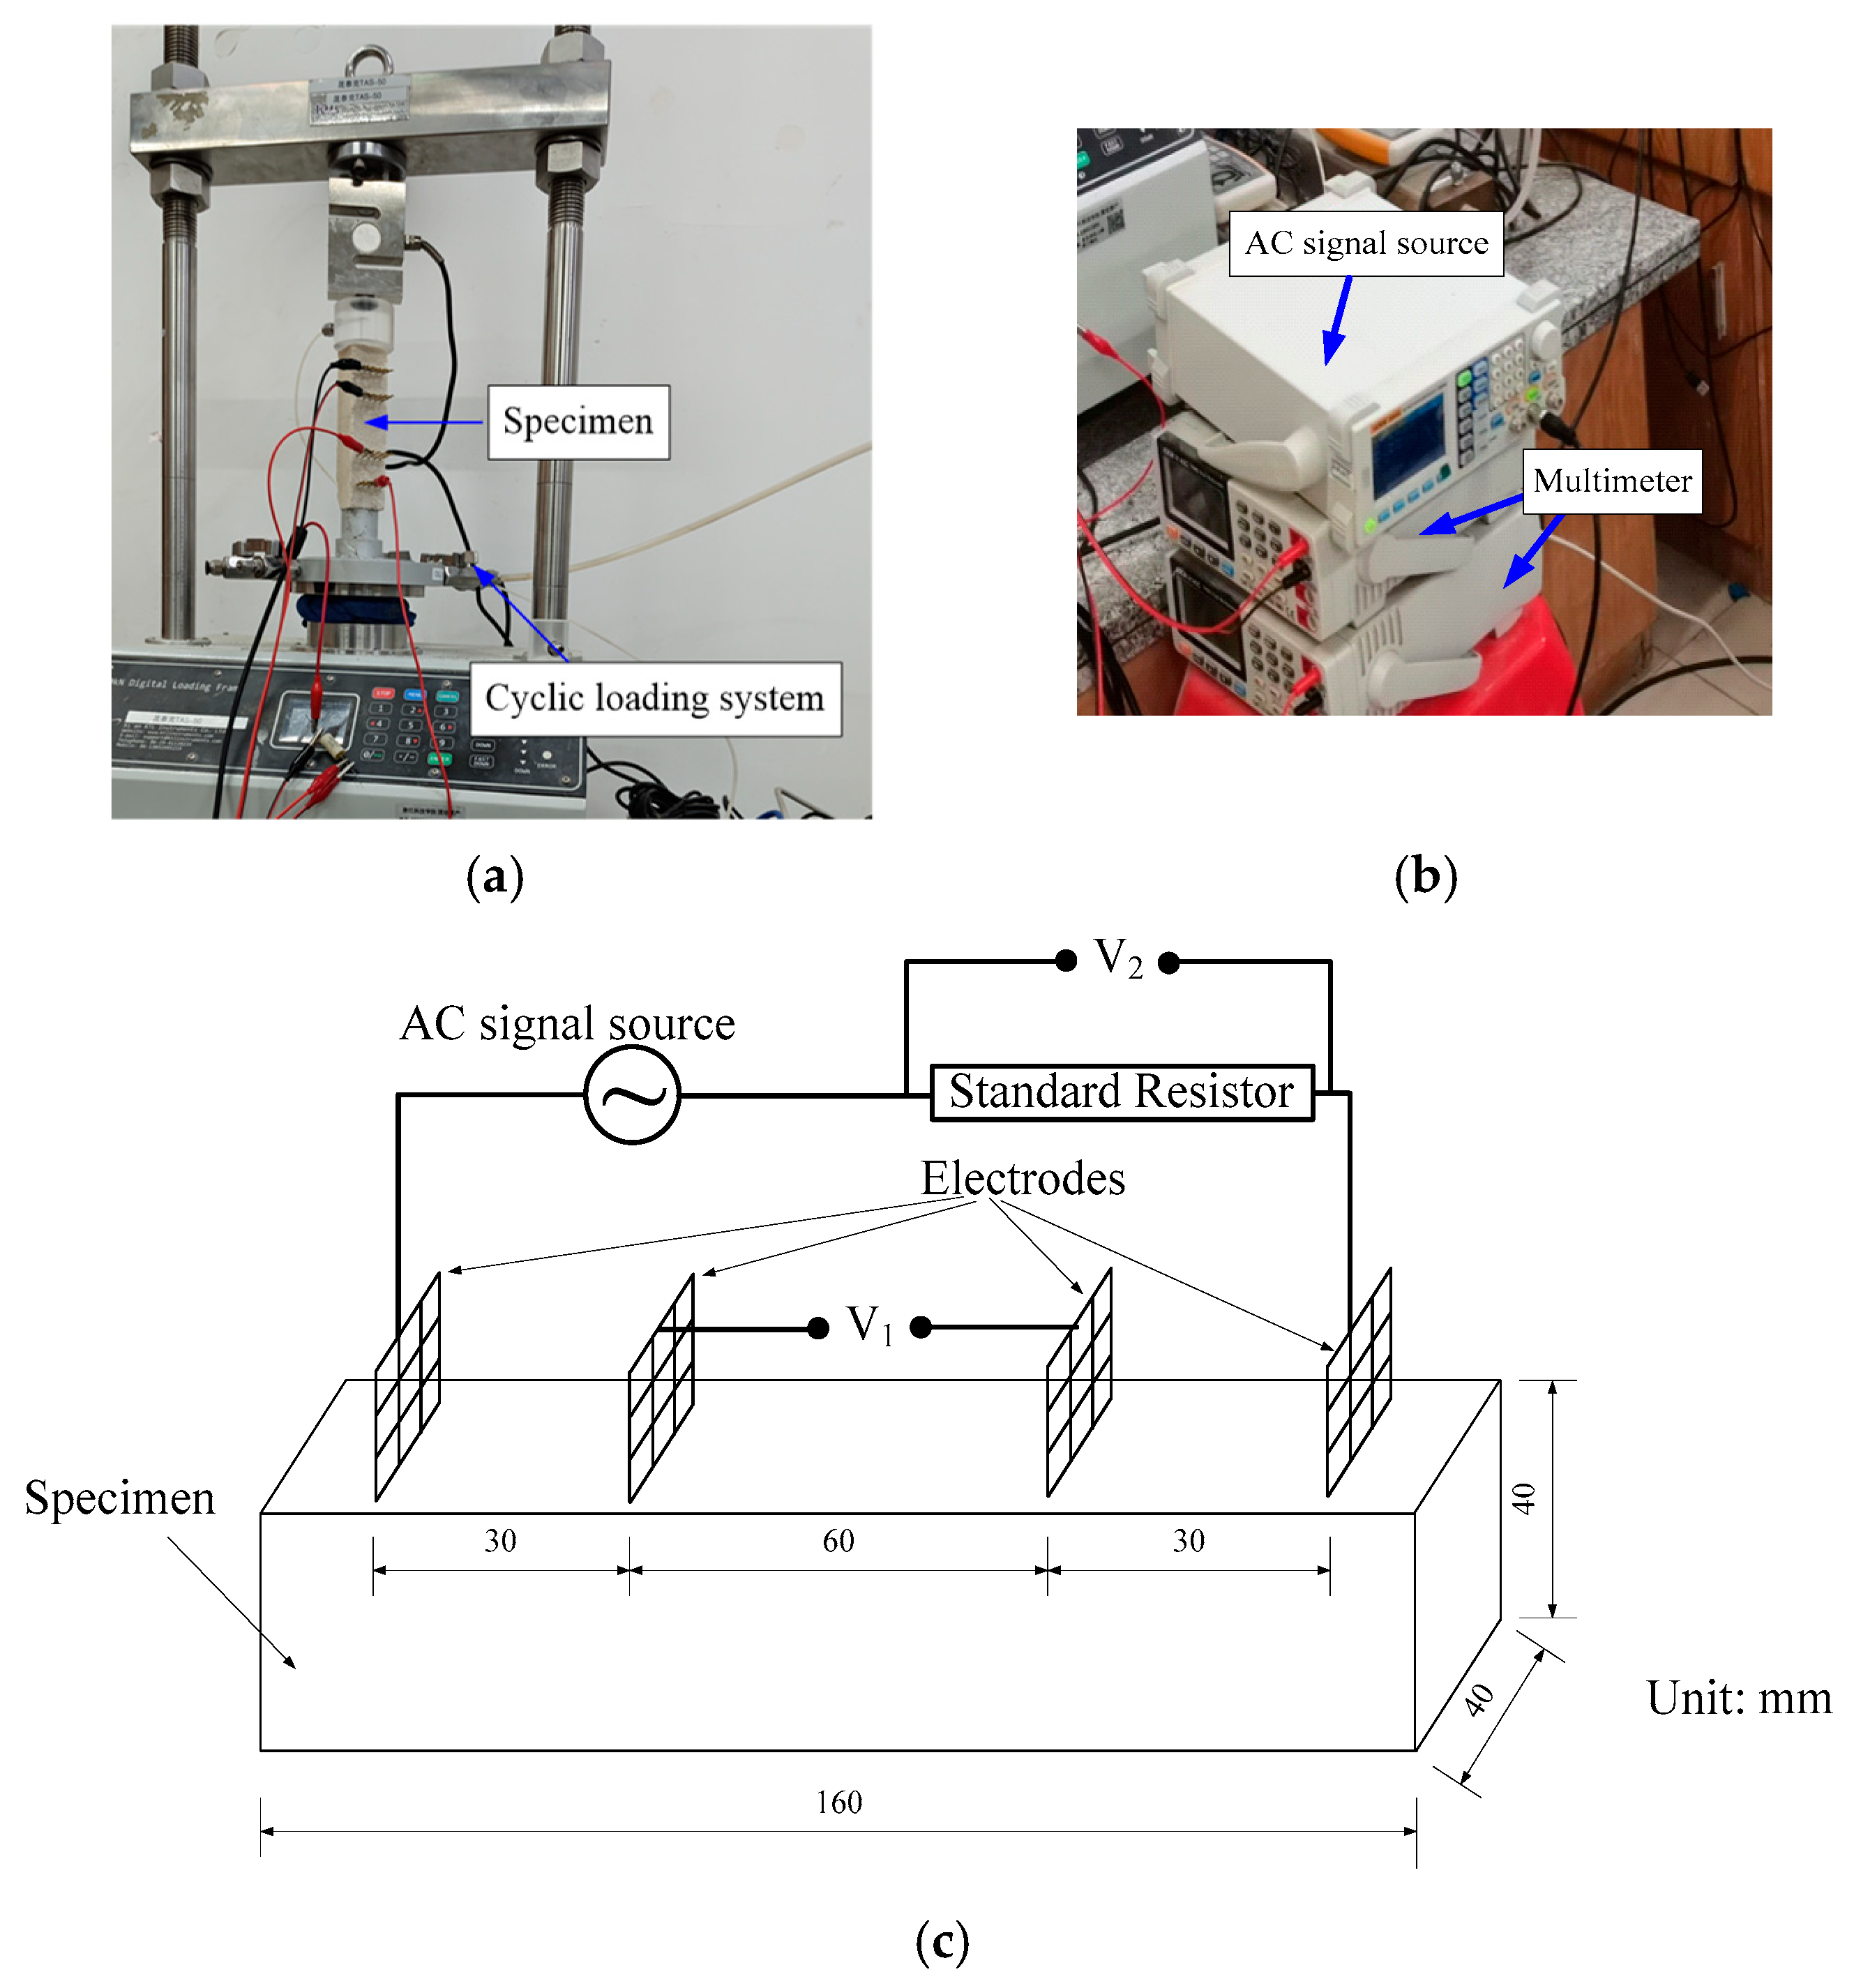
2.2.2. Self-Sensing Measurement
3. Experiment Results and Analysis
4. Mechanism
5. Conclusions
- For the effect of unsaturation, when without a crack, unsaturation increases self-sensing sensitivity, i.e., as saturation (S) decreases from 100% to 67.5%, sensitivity increases from 0.0135%/kPa to 0.0758%/kPa.
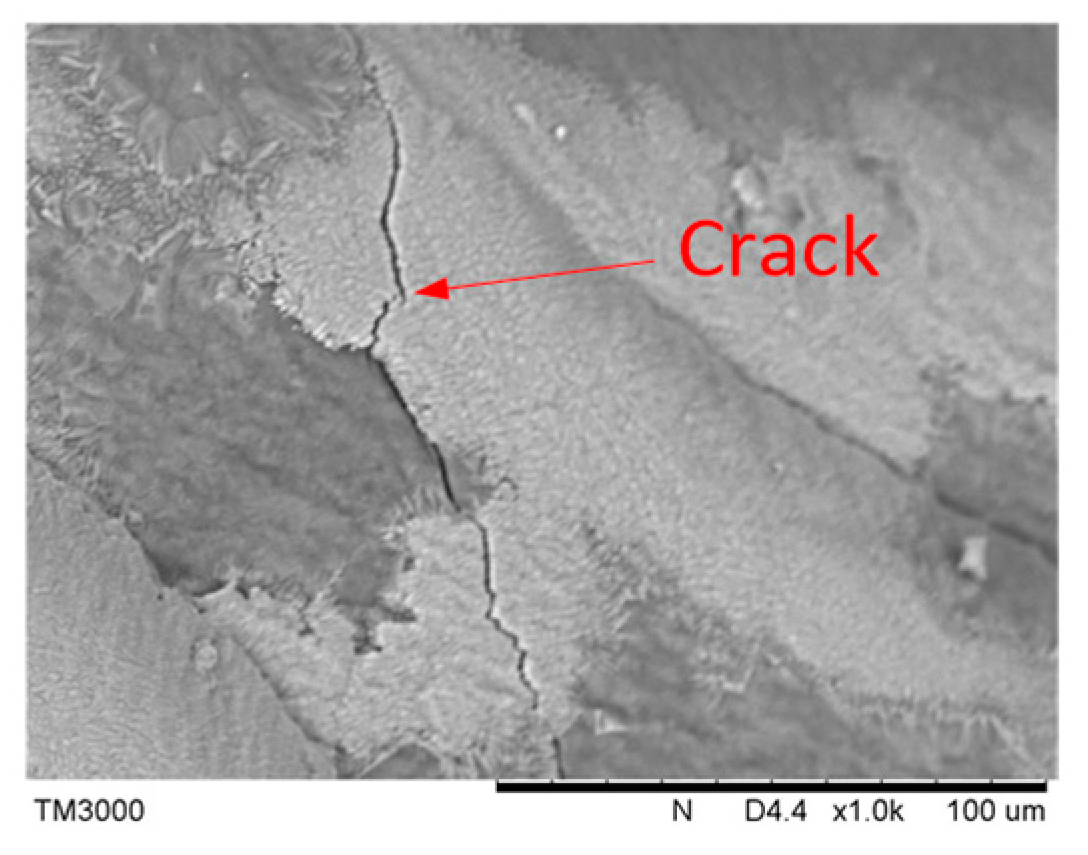
- For the effect of cracks, when a crack exists, in the saturation state (S = 100%), the crack increases self-sensing sensitivity to around 0.027%/kPa.
- For the coupled effect of unsaturation and crack, with both unsaturation (S = 70%) and a crack, self-sensing sensitivity increases by one order of magnitude (e.g., 0.247%/kPa), which is greater than when only unsaturation or a crack exists.
- For the effect from the roughness of a crack, self-sensing sensitivity almost does not change with the roughness of a crack in the saturation state, while self-sensing sensitivity first increases and then decreases with increasing crack roughness in the unsaturated state.
- For the smoothness of the self-sensing curve, the SNR (signal-to-noise ratio) of the FCR (fractional change in resistivity) curve is almost not affected by unsaturation and cracking.
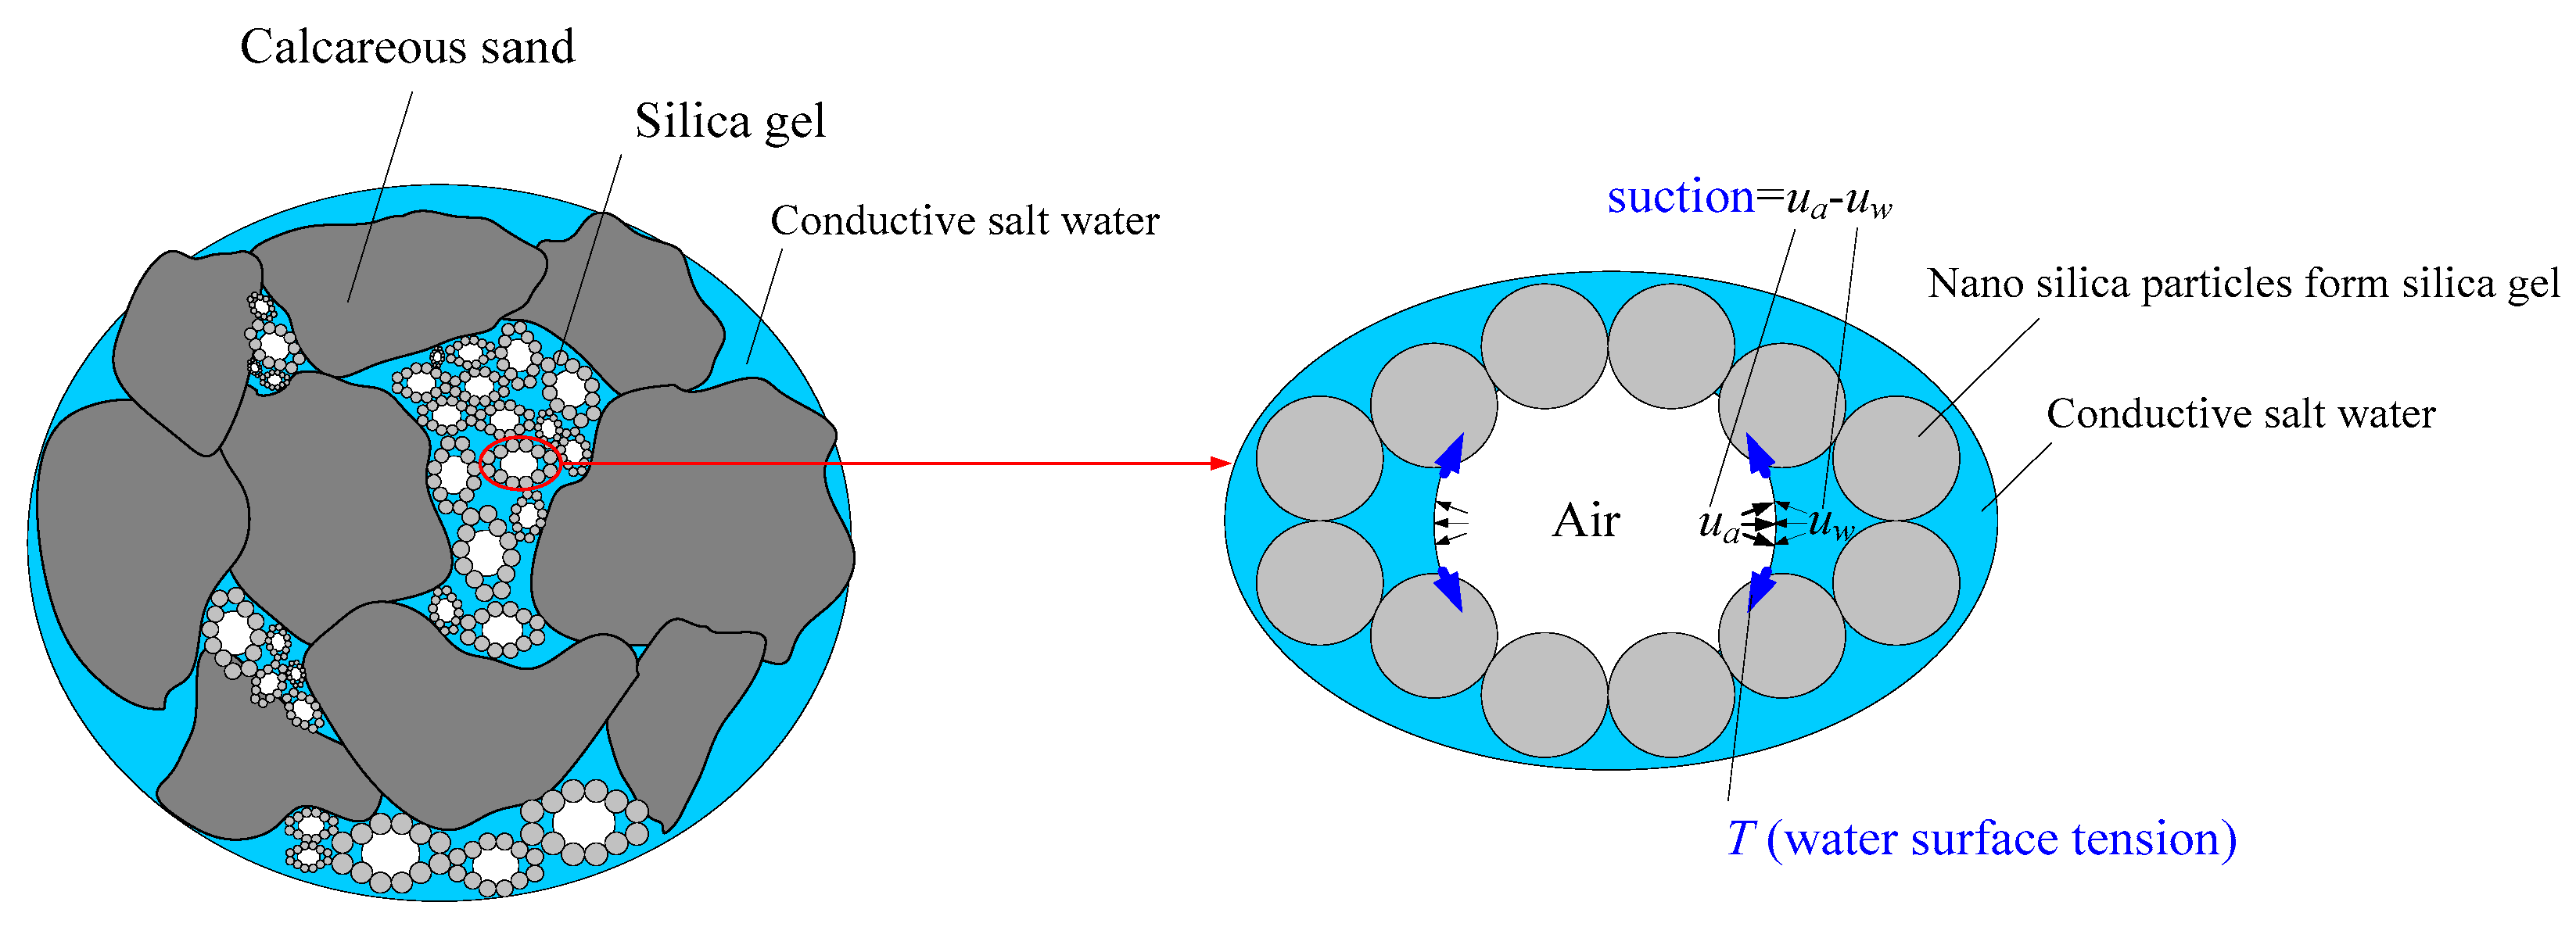
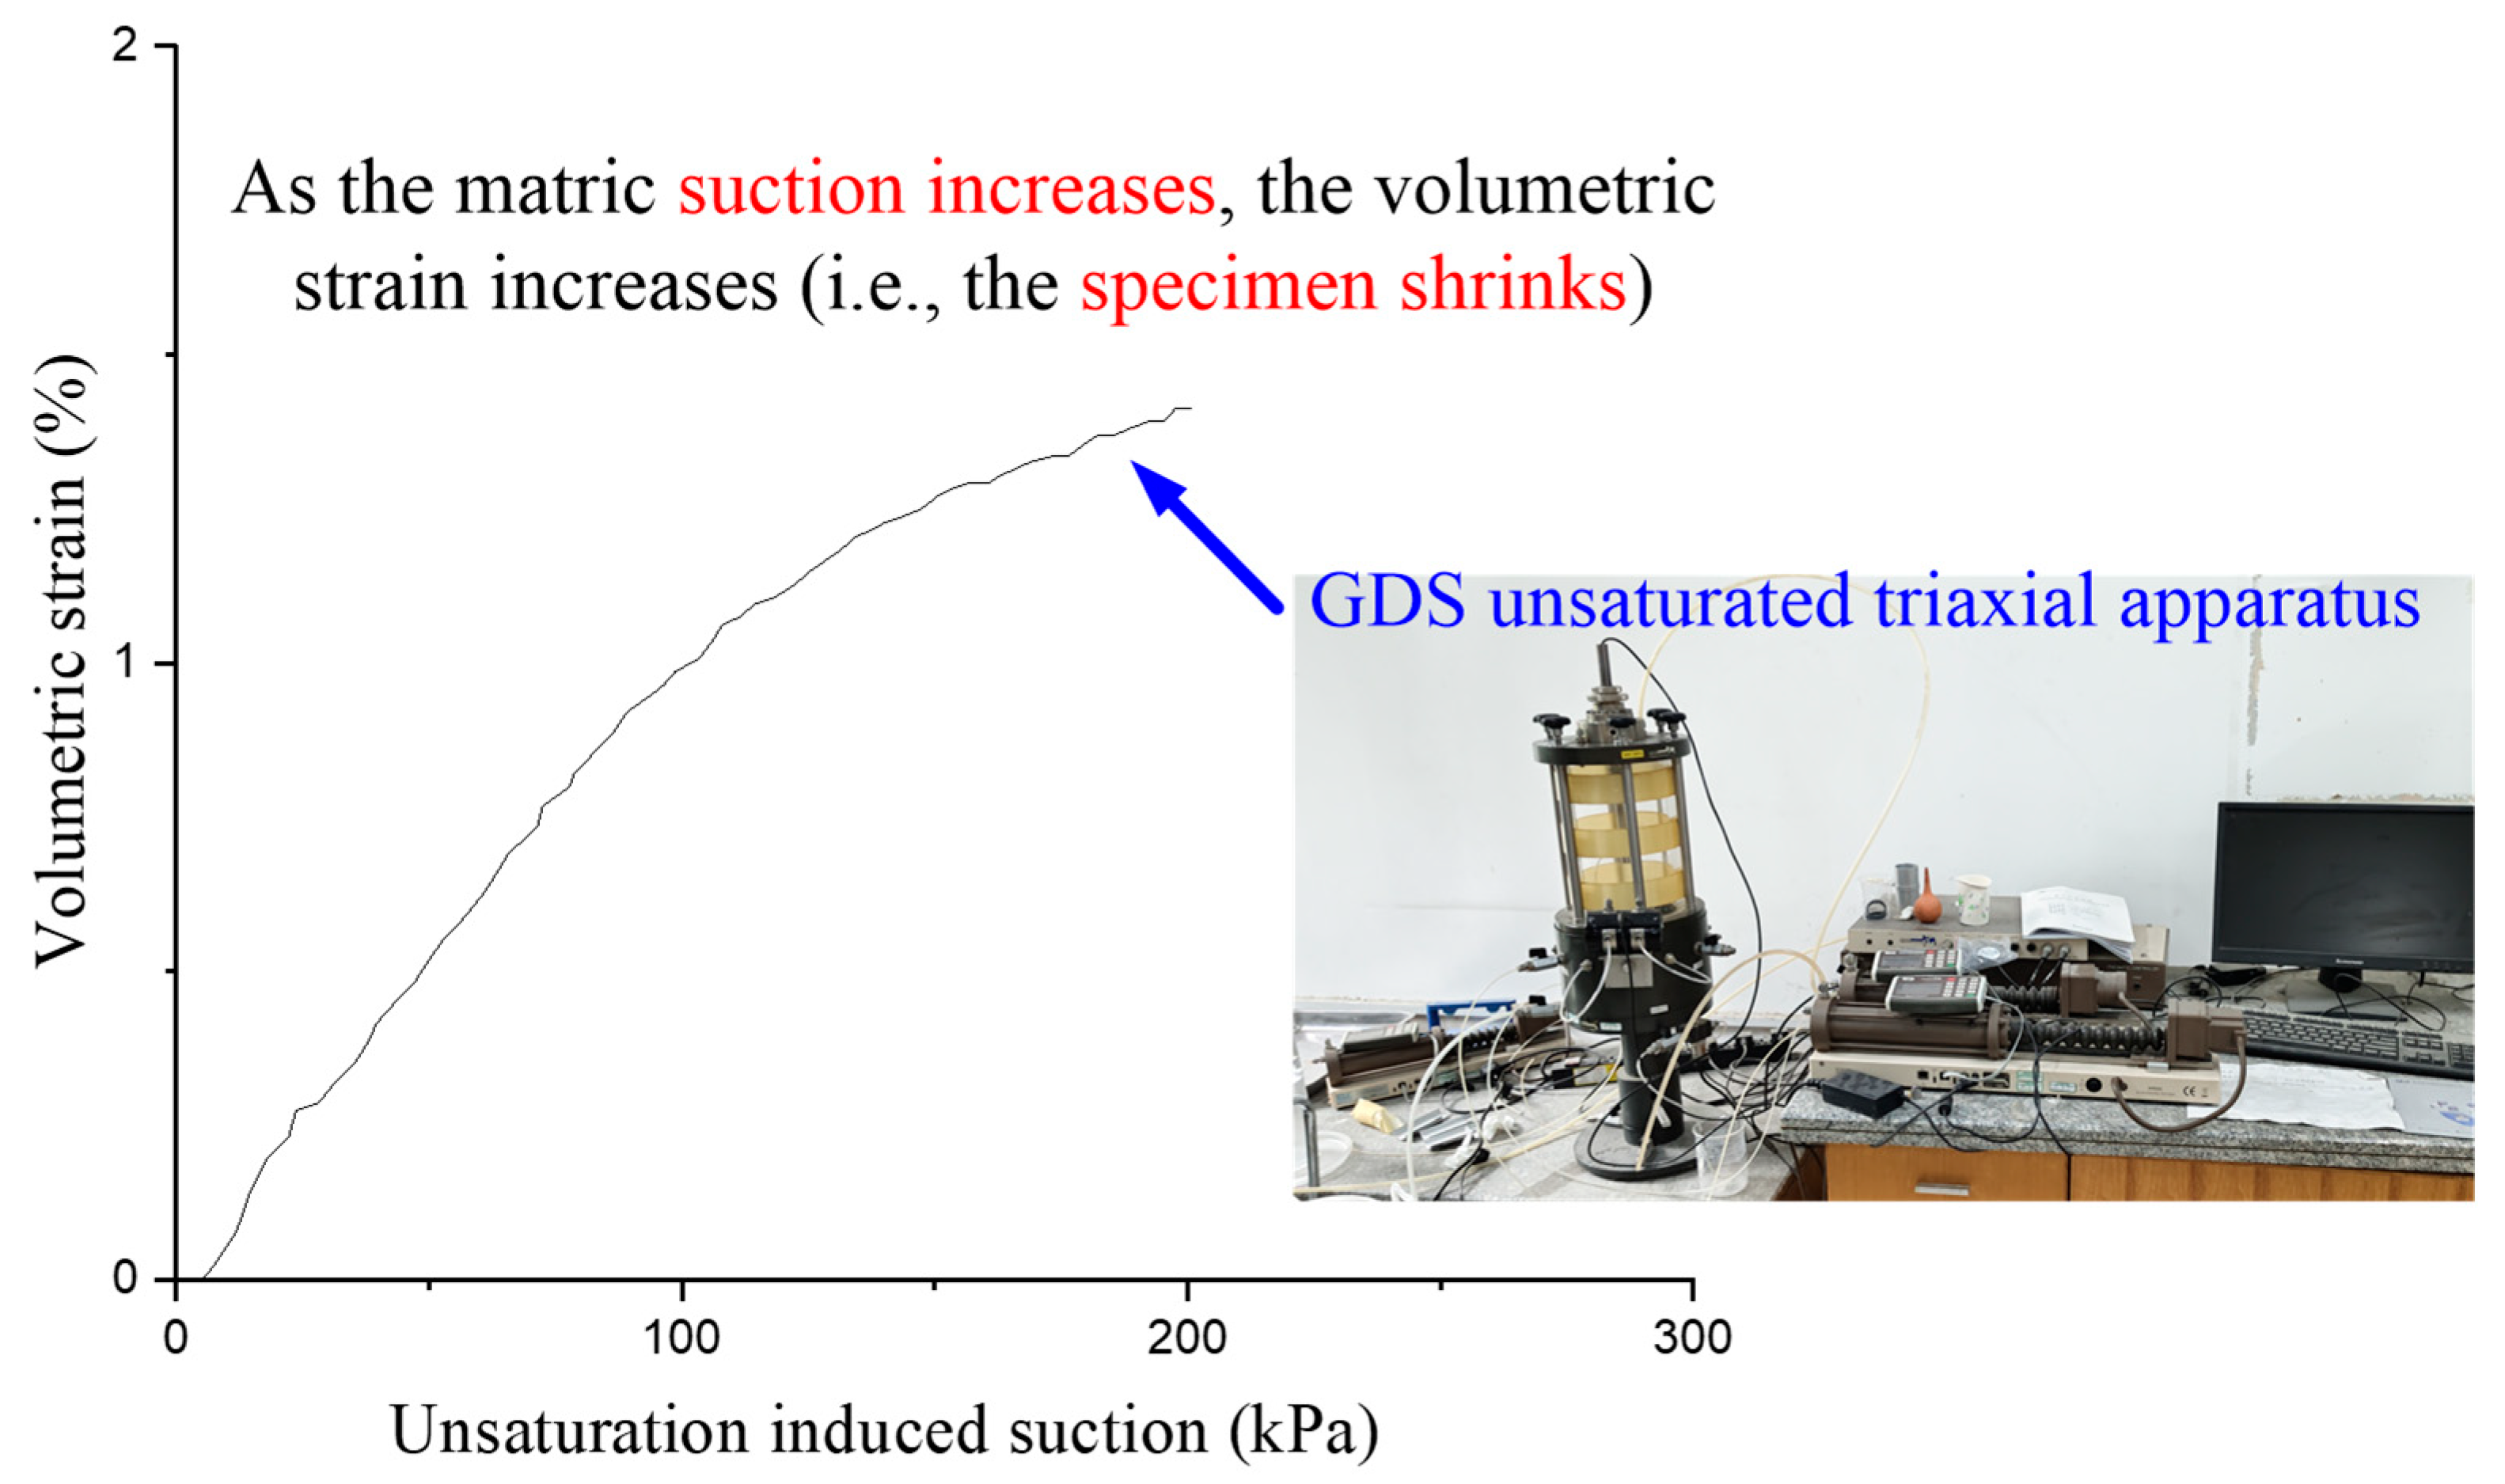
- For the self-sensing mechanism, the mechanism of the unsaturation-improved self-sensing may be related to suction. Based on the unsaturated triaxial apparatus, it is demonstrated that suction induces shrinkage of the specimen. However, during the increase in suction (i.e., unsaturation increases), self-sensing increases. So, the increase in self-sensing is accompanied by the suction-induced shrinkage.
Author Contributions
Funding
Data Availability Statement
Conflicts of Interest
References
- Gallagher, P.M.; Lin, Y. Colloidal silica transport through liquefiable porous media. J. Geotech. Geoenviron. Eng. 2009, 135, 1702–1712. [Google Scholar] [CrossRef]
- Hamderi, M.; Gallagher, P.M. An optimization study on the delivery distance of colloidal silica. Sci. Res. Essays 2013, 8, 1314–1323. [Google Scholar] [CrossRef]
- Liu, G.; Zhao, M.; Wang, T.; Connolly, D.P.; Cai, Y. Permeation grouting of low-permeability silty sands with colloidal silica. Case Stud. Constr. Mater. 2023, 19, e02327. [Google Scholar] [CrossRef]
- Spagnoli, G.; Collico, S. Multivariate analysis of a grouted sand with colloidal silica at different dilution stages. Transp. Geotech. 2023, 40, 100987. [Google Scholar] [CrossRef]
- Rasouli, R.; Hayashi, K.; Zen, K. Controlled permeation grouting method for mitigation of liquefaction. J. Geotech. Geoenviron. Eng. 2016, 142, 04016052. [Google Scholar] [CrossRef]
- Gallagher, P.M.; Conlee, C.T.; Rollins, K.M. Full-Scale Field Testing of Colloidal Silica Grouting for Mitigation of Liquefaction Risk. J. Geotech. Geoenviron. Eng. 2007, 133, 186–196. [Google Scholar] [CrossRef]
- Conlee, C.T.; Gallagher, P.M.; Boulanger, R.W.; Kamai, R. Centrifuge modeling for liquefaction mitigation using colloidal silica stabilizer. J. Geotech. Geoenvironmental Eng. 2012, 138, 1334–1345. [Google Scholar] [CrossRef]
- Pamuk, A.; Gallagher, P.M.; Zimmie, T. Remediation of pile foundations against lateral spreading by passive site stabilization technique. Soil Dyn. Earthq. Eng. 2007, 27, 864–874. [Google Scholar] [CrossRef]
- Ciardi, G.; Madiai, C. Effects of initial static shear stress on cyclic behaviour of sand stabilised with colloidal silica. Acta Geotech. 2023, 18, 2389–2409. [Google Scholar] [CrossRef]
- Gallagher, P.M.; Mitchellb, J.K. Influence of colloidal silica grout on liquefaction potential and cyclic undrained behavior of loose sand. Soil Dyn. Earthq. Eng. 2002, 22, 1017–1026. [Google Scholar] [CrossRef]
- Jin, W.F.; Tao, Y.; Chen, R.Z. Capturing the turning hook of stress-dilatancy curve of crushable calcareous sand. J. Mar. Sci. Eng. 2022, 10, 1269. [Google Scholar] [CrossRef]
- Jin, W.; Li, Y. Cementation state of sand judged by the stress−dilatancy relationship from a single drained triaxial test. J. Geotech. Geoenviron. Eng. 2025, 151, 04025027. [Google Scholar] [CrossRef]
- Pavlopoulou, E.E.; Georgiannou, V.N. Effect of colloidal silica aqueous gel on the monotonic and cyclic response of sands. J. Geotech. Geoenviron. Eng. 2021, 147, 04021122. [Google Scholar] [CrossRef]
- Vranna, A.; Tika, T.; Papadimitriou, A. Laboratory investigation into the monotonic and cyclic behaviour of a clean sand stabilised with colloidal silica. Géotechnique 2022, 72, 377–390. [Google Scholar] [CrossRef]
- Jin, W.; Liao, X.; Tao, Y. Self–sensing, anti–liquefaction, and long–term settlement characteristics of calcareous sand seeped by high-concentration colloidal silica. Constr. Build. Mater. 2024, 422, 135864. [Google Scholar] [CrossRef]
- Fredlund, D.G. Unsaturated Soil Mechanics in Engineering Practice; John Wiley & Sons: Hoboken, NJ, USA, 2012. [Google Scholar]
- Carísio, P.D.A.; Mendonça, Y.G.D.S.; Soares, C.F.T.; Reales, O.A.M.; Fairbairn, E.D.M.R.; Filho, R.D.T. Dispersion of carbon nanotubes with different types of superplasticizer as a dispersing agent for self-sensing cementitious materials. Appl. Sci. 2021, 11, 8452. [Google Scholar] [CrossRef]
- Deng, S.J.; Fan, J.; Li, G.Y.; Zhang, M.; Li, M. Influence of styrene-acrylic emulsion additions on the electrical and self-sensing properties of CNT cementitious composites. Constr. Build. Mater. 2023, 403, 133172. [Google Scholar] [CrossRef]
- Han, B.; Yu, X.; Kwon, E. A self-sensing carbon nanotube/cement composite for traffic monitoring. Nanotechnology 2009, 20, 445501. [Google Scholar] [CrossRef]
- Li, Q.; Hong, C.; Xie, H.; Lai, H.; Shen, Y.; Xu, S.; Kong, P. Piezoresistive behavior in cement-based sensors: Nonlinear modeling and preliminary application. Compos. A Appl. Sci. 2023, 175, 107786. [Google Scholar] [CrossRef]
- Meoni, A.; D’Alessandro, A.; Downey, A.; García-Macías, E.; Rallini, M.; Materazzi, A.L.; Torre, L.; Laflamme, S.; Castro-Triguero, R.; Ubertini, F. An Experimental Study on Static and Dynamic Strain Sensitivity of Embeddable Smart Concrete Sensors Doped with Carbon Nanotubes for SHM of Large Structures. Sensors 2018, 18, 831. [Google Scholar] [CrossRef]
- Yang, Q.; Liu, P.; Ge, Z.; Wang, D. Self-sensing carbon nanotube-cement composite material for structural health monitoring of pavements. J. Test. Eval. 2020, 48, 1990–2002. [Google Scholar] [CrossRef]
- Yuan, J.; Lu, D.; Wu, H.M.; Meng, J.; Song, H.X.; Zhong, J.; Xie, N. Carbon nanotubes-coated cement particles for cement-based sensors with excellent piezoresistivity. Smart Mater. Struct. 2023, 32, 065019. [Google Scholar] [CrossRef]
- Gupta, S.; Gonzalez, J.G.; Loh, K.J. Self-sensing concrete enabled by nano-engineered cement-aggregate interfaces. Struct. Health Monit. 2016, 16, 309–323. [Google Scholar] [CrossRef]
- Parvaneh, V.; Khiabani, S.H. Mechanical and piezoresistive properties of self-sensing smart concretes reinforced by carbon nanotubes. Mech. Adv. Mater. Struct. 2018, 26, 993–1000. [Google Scholar] [CrossRef]
- D’Alessandro, A.; Rallini, M.; Ubertini, F.; Materazzi, A.L.; Kenny, J.M. Investigations on scalable fabrication procedures for self-sensing carbon nanotube cement-matrix composites for SHM applications. Cem. Concr. Compos. 2016, 65, 200–213. [Google Scholar] [CrossRef]
- Siad, H.; Lachemi, M.; Sahmaran, M.; Mesbah, H.A.; Hossain, K.A. Advanced engineered cementitious composites with combined self-sensing and self-healing functionalities. Constr. Build. Mater. 2018, 176, 313–322. [Google Scholar] [CrossRef]
- Yin, T.J.; Xu, J.X.; Wang, Y.; Liu, L.Y. Increasing self-sensing capability of carbon nanotubes cement-based materials by simultaneous addition of Ni nanofibers with low content. Constr. Build. Mater. 2020, 254, 119306. [Google Scholar] [CrossRef]
- Wen, S.; Chung, D.D.L. Electrical-resistance-based damage self-sensing in carbon fiber reinforced cement. Carbon 2007, 45, 710–713. [Google Scholar] [CrossRef]
- Al-Dahawi, A.; Öztürk, O.; Emami, F.; Yıldırım, G.; Şahmaran, M. Effect of mixing methods on the electrical properties of cementitious composites incorporating different carbon-based materials. Constr. Build. Mater. 2016, 104, 160–168. [Google Scholar] [CrossRef]
- Taheri, S.; Georgaklis, J.; Ams, M.; Patabendigedara, S.; Belford, A.; Wu, S. Smart self-sensing concrete: The use of multiscale carbon fillers. J. Mater. Sci. 2022, 57, 2667–2682. [Google Scholar] [CrossRef]
- Roshan, M.J.; Abedi, M.; Correla, A.G.; Fangueiro, R. Application of self-sensing cement-stabilized sand for damage detection. Constr. Build. Mater. 2023, 403, 133080. [Google Scholar] [CrossRef]
- Yoo, D.-Y.; You, I.; Zi, G.; Lee, S.-J. Effects of carbon nanomaterial type and amount on self-sensing capacity of cement paste. Measurement 2018, 134, 750–761. [Google Scholar] [CrossRef]
- Hou, Y.; Sun, M.; Chen, J. Electrical resistance and capacitance responses of smart ultra-high performance concrete with compressive strain by DC and AC measurements. Constr. Build. Mater. 2022, 327, 127007. [Google Scholar] [CrossRef]
- JTG 3430-2020; Test Methods of Soils for Highway Engineering. JTG: Beijing, China, 2020.
- Gao, Y.; Sun, D.A.; Zhu, Z.C.; Xu, Y.F. Hydromechanical behavior of unsaturated soil with different initial densities over a wide suction range. Acta Geotech. 2019, 14, 417–428. [Google Scholar] [CrossRef]
- Ng, C.W.W.; Sadeghi, H.; Jafarzadeh, F. Compression and shear strength characteristics of compacted loess at high suctions. Can. Geotech. J. 2017, 54, 690–699. [Google Scholar] [CrossRef]
- Vaid, Y.P.; Sivathayalan, S.; Stedman, D. Influence of specimen reconstituting method on the undrained response of sand. Geotech. Test. J. 1999, 22, 187–195. [Google Scholar] [CrossRef]
- Leong, E.C.; He, L.; Rahardjo, H. Factors affecting the filter paper method for total and matric suction measurements. Geotech. Test. J. 2002, 25, 322–333. [Google Scholar] [CrossRef]
- Barton, N.; Choubey, V. The shear strength of rock joints in theory and practice. Rock Mech. 1977, 10, 1–54. [Google Scholar] [CrossRef]
- Asadollahi, P.; Tonon, F. Constitutive model for rock fractures: Revisiting Barton’s empirical model. Eng. Geol. 2010, 113, 11–32. [Google Scholar] [CrossRef]
- Zhao, Y. Dynamic Responses and Accumulative Settlement of Subgrade Under Aircraft Load in High-Filled Airport. Ph.D. Thesis, Zhejiang University, Hangzhou, China, 2018. [Google Scholar]
- Falara, M.G.; Thomoglou, A.K.; Gkountakou, F.I.; Elenas, A.; Chalioris, C.E. Hybrid smart cementitious materials incorporating ladder scale carbon fiber reinforcement: An experimental investigation. Case Stud. Constr. Mater. 2023, 18, e02035. [Google Scholar] [CrossRef]
- Sevim, O.; Jiang, Z.F.; Ozbulut, O. EEffects of graphene nanoplatelets type on self-sensing properties of cement mortar composites. Constr. Build. Mater. 2022, 359, 129488. [Google Scholar] [CrossRef]
- Suo, Y.X.; Xia, H.T.; Guo, R.X.; Yang, Y. Study on self-sensing capabilities of smart cements filled with graphene oxide under dynamic cyclic loading. J. Build. Eng. 2022, 58, 104775. [Google Scholar] [CrossRef]
- Aqtash, U.A.; Bandini, P. Prediction of unsaturated shear strength of an adobe soil from the soil–water characteristic curve. Constr. Build. Mater. 2015, 98, 892–899. [Google Scholar] [CrossRef]
- Fredlund, D.G.; Morgenstern, N.R.; Widger, R.A. The shear strength of unsaturated soils. Can. Geotech. J. 1978, 15, 313–321. [Google Scholar] [CrossRef]


| Max. Void Ratio emax | Min. Void Ratio emin | Max. Dry Density ρdmax (g/cm3) | Min. Dry Density ρdmin (g/cm3) | Particle Size d (mm) | Specific Gravity Gs | Relative Density Dr (%) | Internal Friction Angle (Degrees) | Permeability Coefficient (cm/s) |
|---|---|---|---|---|---|---|---|---|
| 1.11 | 0.79 | 1.50 | 1.276 | 0.25–0.5 | 2.69 | 70 | 50.1 | 1.79 × 10⁻⁴ cm/s |
| Specimen Description | Frequency of the AC Signal Source (Hz) | Amplitude of the Cyclic Stress Δσ (kPa) | Frequency of the Cyclic Stress (Hz) | Type of Pre–Crack | Degree of the Saturation S (%) |
|---|---|---|---|---|---|
| Without a precrack | 100 | 30 | 0.1 | - | 100, 70, 67.5 |
| With a precrack | 100 | 30 | 0.1 | plane | 100, 70 |
| 100 | 30 | 0.1 | JRC9 | 100, 70 | |
| 100 | 30 | 0.1 | JRC11 | 100, 70 | |
| 100 | 30 | 0.1 | JRC15 | 100, 70 |
| Ref. | Cement Material | Conductive Filler | Stress Sensitivity, π = Δρ/ρ/Δσ1 (See Equation (5)) (%/kPa) |
|---|---|---|---|
| This study (S = 67.5% with a precrack) | Colloidal silica | - | 0.247 |
| This study (S = 100% with a precrack) | Colloidal silica | - | 0.0283 |
| This study (S = 67.5% without a precrack) | Colloidal silica | - | 0.0758 |
| This study (S = 100% without a precrack) | Colloidal silica | - | 0.0135 |
| [26] | Portland–cement | CNTs (1 wt%) | 0.0013 |
| [29] | Portland–cement | CNTs (1.7 vol%) + NiNF (0.1 vol%) | 0.0025 |
| [23] | Portland–cement | CNTs (0.1 wt%) | 0.0015 |
| [22] | Portland–cement | CNTs (0.5 wt%) | 0.00025 |
| [21] | Portland–cement | CNTs (1 wt%) | 0.001 |
| [19] | Portland–cement | CNTs (0.01 wt%) | 0.002 |
| [31] | Portland–cement | Carbon Fiber (1.5 wt%) | 0.0004 |
| [43] | Portland–cement | Carbon Fiber (1.5 wt%) | 0.0025 |
| [33] | Portland–cement | Graphene (1 wt%) | 0.0004 |
| [44] | Portland–cement | Graphene (7.5 wt%) | 0.0016 |
| [45] | Portland–cement | Graphene (0.05 wt%) | 0.0032 |
| [34] | Portland–cement | Steel fiber (21 wt%) | 0.0024 |
Disclaimer/Publisher’s Note: The statements, opinions and data contained in all publications are solely those of the individual author(s) and contributor(s) and not of MDPI and/or the editor(s). MDPI and/or the editor(s) disclaim responsibility for any injury to people or property resulting from any ideas, methods, instructions or products referred to in the content. |
© 2025 by the authors. Licensee MDPI, Basel, Switzerland. This article is an open access article distributed under the terms and conditions of the Creative Commons Attribution (CC BY) license (https://creativecommons.org/licenses/by/4.0/).
Share and Cite
Ruan, S.; Jin, W.; Liao, X. Colloidal Silica-Stabilized Subgrade for Self-Sensing Vehicle Stress Affected by Unsaturation and Crack. J. Mar. Sci. Eng. 2025, 13, 1127. https://doi.org/10.3390/jmse13061127
Ruan S, Jin W, Liao X. Colloidal Silica-Stabilized Subgrade for Self-Sensing Vehicle Stress Affected by Unsaturation and Crack. Journal of Marine Science and Engineering. 2025; 13(6):1127. https://doi.org/10.3390/jmse13061127
Chicago/Turabian StyleRuan, Shuaishuai, Weifeng Jin, and Xiaohui Liao. 2025. "Colloidal Silica-Stabilized Subgrade for Self-Sensing Vehicle Stress Affected by Unsaturation and Crack" Journal of Marine Science and Engineering 13, no. 6: 1127. https://doi.org/10.3390/jmse13061127
APA StyleRuan, S., Jin, W., & Liao, X. (2025). Colloidal Silica-Stabilized Subgrade for Self-Sensing Vehicle Stress Affected by Unsaturation and Crack. Journal of Marine Science and Engineering, 13(6), 1127. https://doi.org/10.3390/jmse13061127