Article

Experimental Study on a Laterally Loaded Pile Under Scour Condition Using Particle Image Velocimetry Technology

by
Feng Yu
1,*,
Xiaofeng Yang
1,
Zhaoming Yao
1 and
Yaoyao Meng
2
1
School of Civil Engineering and Architecture, Anhui University of Science and Technology, Huainan 232001, China
2
State Key Laboratory of Mining Response and Disaster Prevention and Control in Deep Coal Mines, Anhui University of Science and Technology, Huainan 232001, China
*
Author to whom correspondence should be addressed.
J. Mar. Sci. Eng. 2025, 13(6), 1125; https://doi.org/10.3390/jmse13061125
Submission received: 6 May 2025 / Revised: 30 May 2025 / Accepted: 3 June 2025 / Published: 4 June 2025
(This article belongs to the Section Coastal Engineering)

Abstract

The monopile foundation is a popular foundation type for offshore wind turbines; due to the harsh marine environment, there are lateral loads applied on the monopile foundation from winds and currents, and scouring also often occurs around the pile, reducing the bearing capacity and impacting the normal operation of offshore wind turbines. A series of 1 g model tests is conducted to investigate the lateral load response and scouring response of the monopile in sand. Based on the experimental results, the characteristics of the pile’s load-displacement curves, bending moments, and p-y curves under the effects of scour were analyzed. Particle Image Velocimetry technology was adopted to analyze the deformation development rules of soil particles around the pile. It is found that under the same lateral load, the maximum bending moment of the pile increases and the bearing capacity is reduced as the scour depth increases, the scour width increases, or the scour slope decreases. The effects of scour depth, slope, and width on pile bearing stability decrease successively. Soil displacements and strains in the passive zone in front of the pile develop gradually in both radial and vertical directions.

1. Introduction

The consumption of electric energy continuously increases due to the rapid development of the world economy, and most of it is generated by fossil fuels. To reduce CO2 emissions and environmental pollution, many countries are developing offshore wind turbine technology to obtain renewable energy. The foundations of offshore wind turbines come in various forms, such as gravity type, tripod, jacket, and monopile [1,2,3,4], monopile foundation has been the most widely used, accounting for about 80% of all existing foundations [5,6], it has a simple structure, convenient installation, and is suitable for water depths of 35–40 m [7].
In the marine environment, monopile foundations are affected by currents and winds, causing lateral displacement of the pile and impacting the normal operation of wind turbines [8]. Additionally, scour pit around the pile caused by flowing water reduces the lateral bearing capacity and changes the mechanical properties of soil [9,10]. There are two forms of scour, local scour and general scour. General scour completely washes away part of the surface soil, and local scour forms a scour pit around the pile. Generally, a scour pit consists of three parts: the scour depth (Sd), scour slope (θ), and scour width (Sw); some related research has been conducted to study the responses of pile foundations subjected to lateral loads and scouring. Zhang et al. (2019) carried out a series of caisson-pile tests at 1 g to investigate the scouring responses of lateral cyclic loading [11]. It is found that the lateral displacements are dependent on the lateral loading condition and scour depth; the lateral displacements can be predicted by a modified cyclic load level. Yu et al. (2023) carried out 1 g model monopile tests under lateral loading and two scour depths in dry sand [10], the test results show that the accumulated displacements can be predicted by an exponential function with cyclic amplitudes and cyclic number, the cyclic amplitudes should be modified twice under scour condition.
Although numerous methods can describe the interaction between structures and soil, the p-y curve method is among the most widely used for analyzing the behavior of soil and piles. Due to the presence of a scour pit, the traditional p-y curve method is no longer applicable. Lin et al. (2014) modified the lateral ultimate resistance of Reese’s empirical p-y curves (1974) under scour conditions, thereby obtaining the corresponding p-y curves for sand [12]. Yang et al. (2018) derived a p-y curve for the analysis of a laterally loaded pile based on the strain wedge method [13]. Qi et al. (2016) carried out a series of centrifuge model tests considering scouring effects; based on the experimental results, the concept of “effective soil depth” was introduced, which was used to determine the corresponding p-y curves for shallowly embedded piles in sand [14].
As a non-contact measurement method, PIV technology is widely used in deformation measurement in geotechnical engineering [15,16,17,18]. With advanced digital image correlation (DIC) technology, real-time observation of a 2D or 3D deformation field can be realized. Specialized algorithms can be used to obtain the stress-strain field, displacement field, and velocity field from the acquired images, displaying the results as contour maps, cloud maps, and vector maps. Currently, some scholars use PIV technology to observe and analyze the real-time deformation characteristics of soil around piles. Wang et al. (2024) used PIV technique to study the displacement change characteristics of micropile [19], the test results show that pile surface roughness is related to the soil arch range, if the pile space is too large, the support effect is poor, the perfect pile space is 5–7D (D is pile diameter). Yuan et al. (2019) developed a 3D displacement measurement system for laterally loaded piles [20]; the soil test results indicate that the system can be used to obtain the interior 3D displacement fields of transparent soil around a pile under lateral load. Yang et al. (2021) used high-resolution PIV to study the flow fields around model pile groups [21]; it is observed that the velocity of reverse flow and upward flow in the pile gap increases due to the increased pile spacing. Zou et al. performed a series of laboratory tests to discuss the mechanical responses of hybrid piles under composite loads with the adoption of PIV technology [22]; the main conclusion was that the length-to-diameter ratio of the pile has less effect on the bearing capacity compared to the footing diameter.
Given the above, the paper conducted a series of 1 g model tests on a monopile subjected to lateral monotonic loading to investigate the influence of scouring on pile displacements, bending moments, and p-y curves. PIV technology was used to obtain the soil displacement fields around the pile and analyze the deformation characteristics and development rules of the soil under different scour conditions. The influences of different scour slopes, scour widths, and scour depths on the pile-soil interaction were discussed in the study.

2. Materials and Methods

The soil used in all the tests is dry sand, with particle sizes mainly concentrated in the range of 0.3 mm to 0.5 mm. The particle gradation curve shown in Figure 1 shows that the sand is homogeneous. The characteristics of the sand are summarized in Table 1.

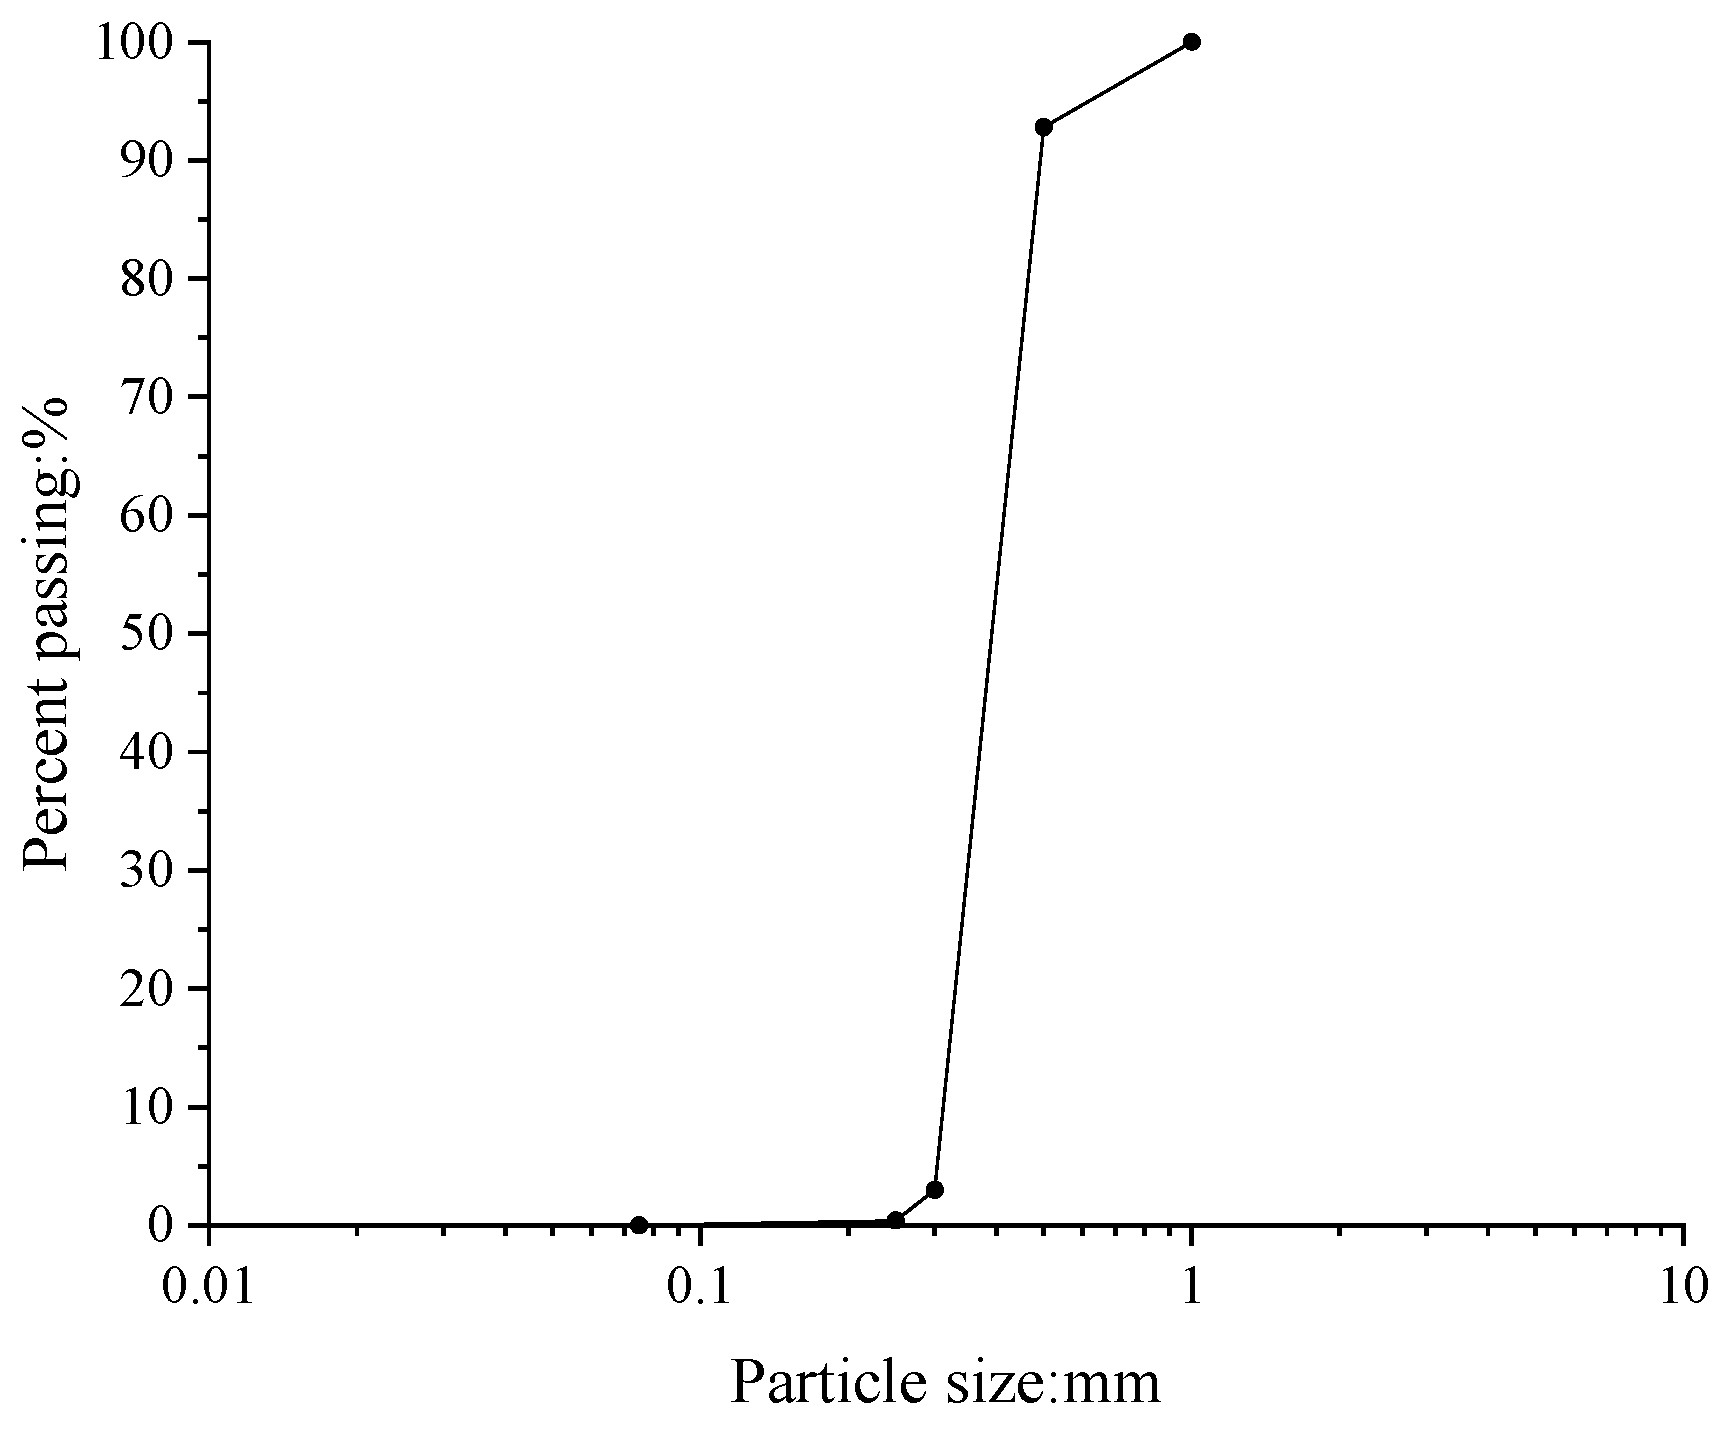
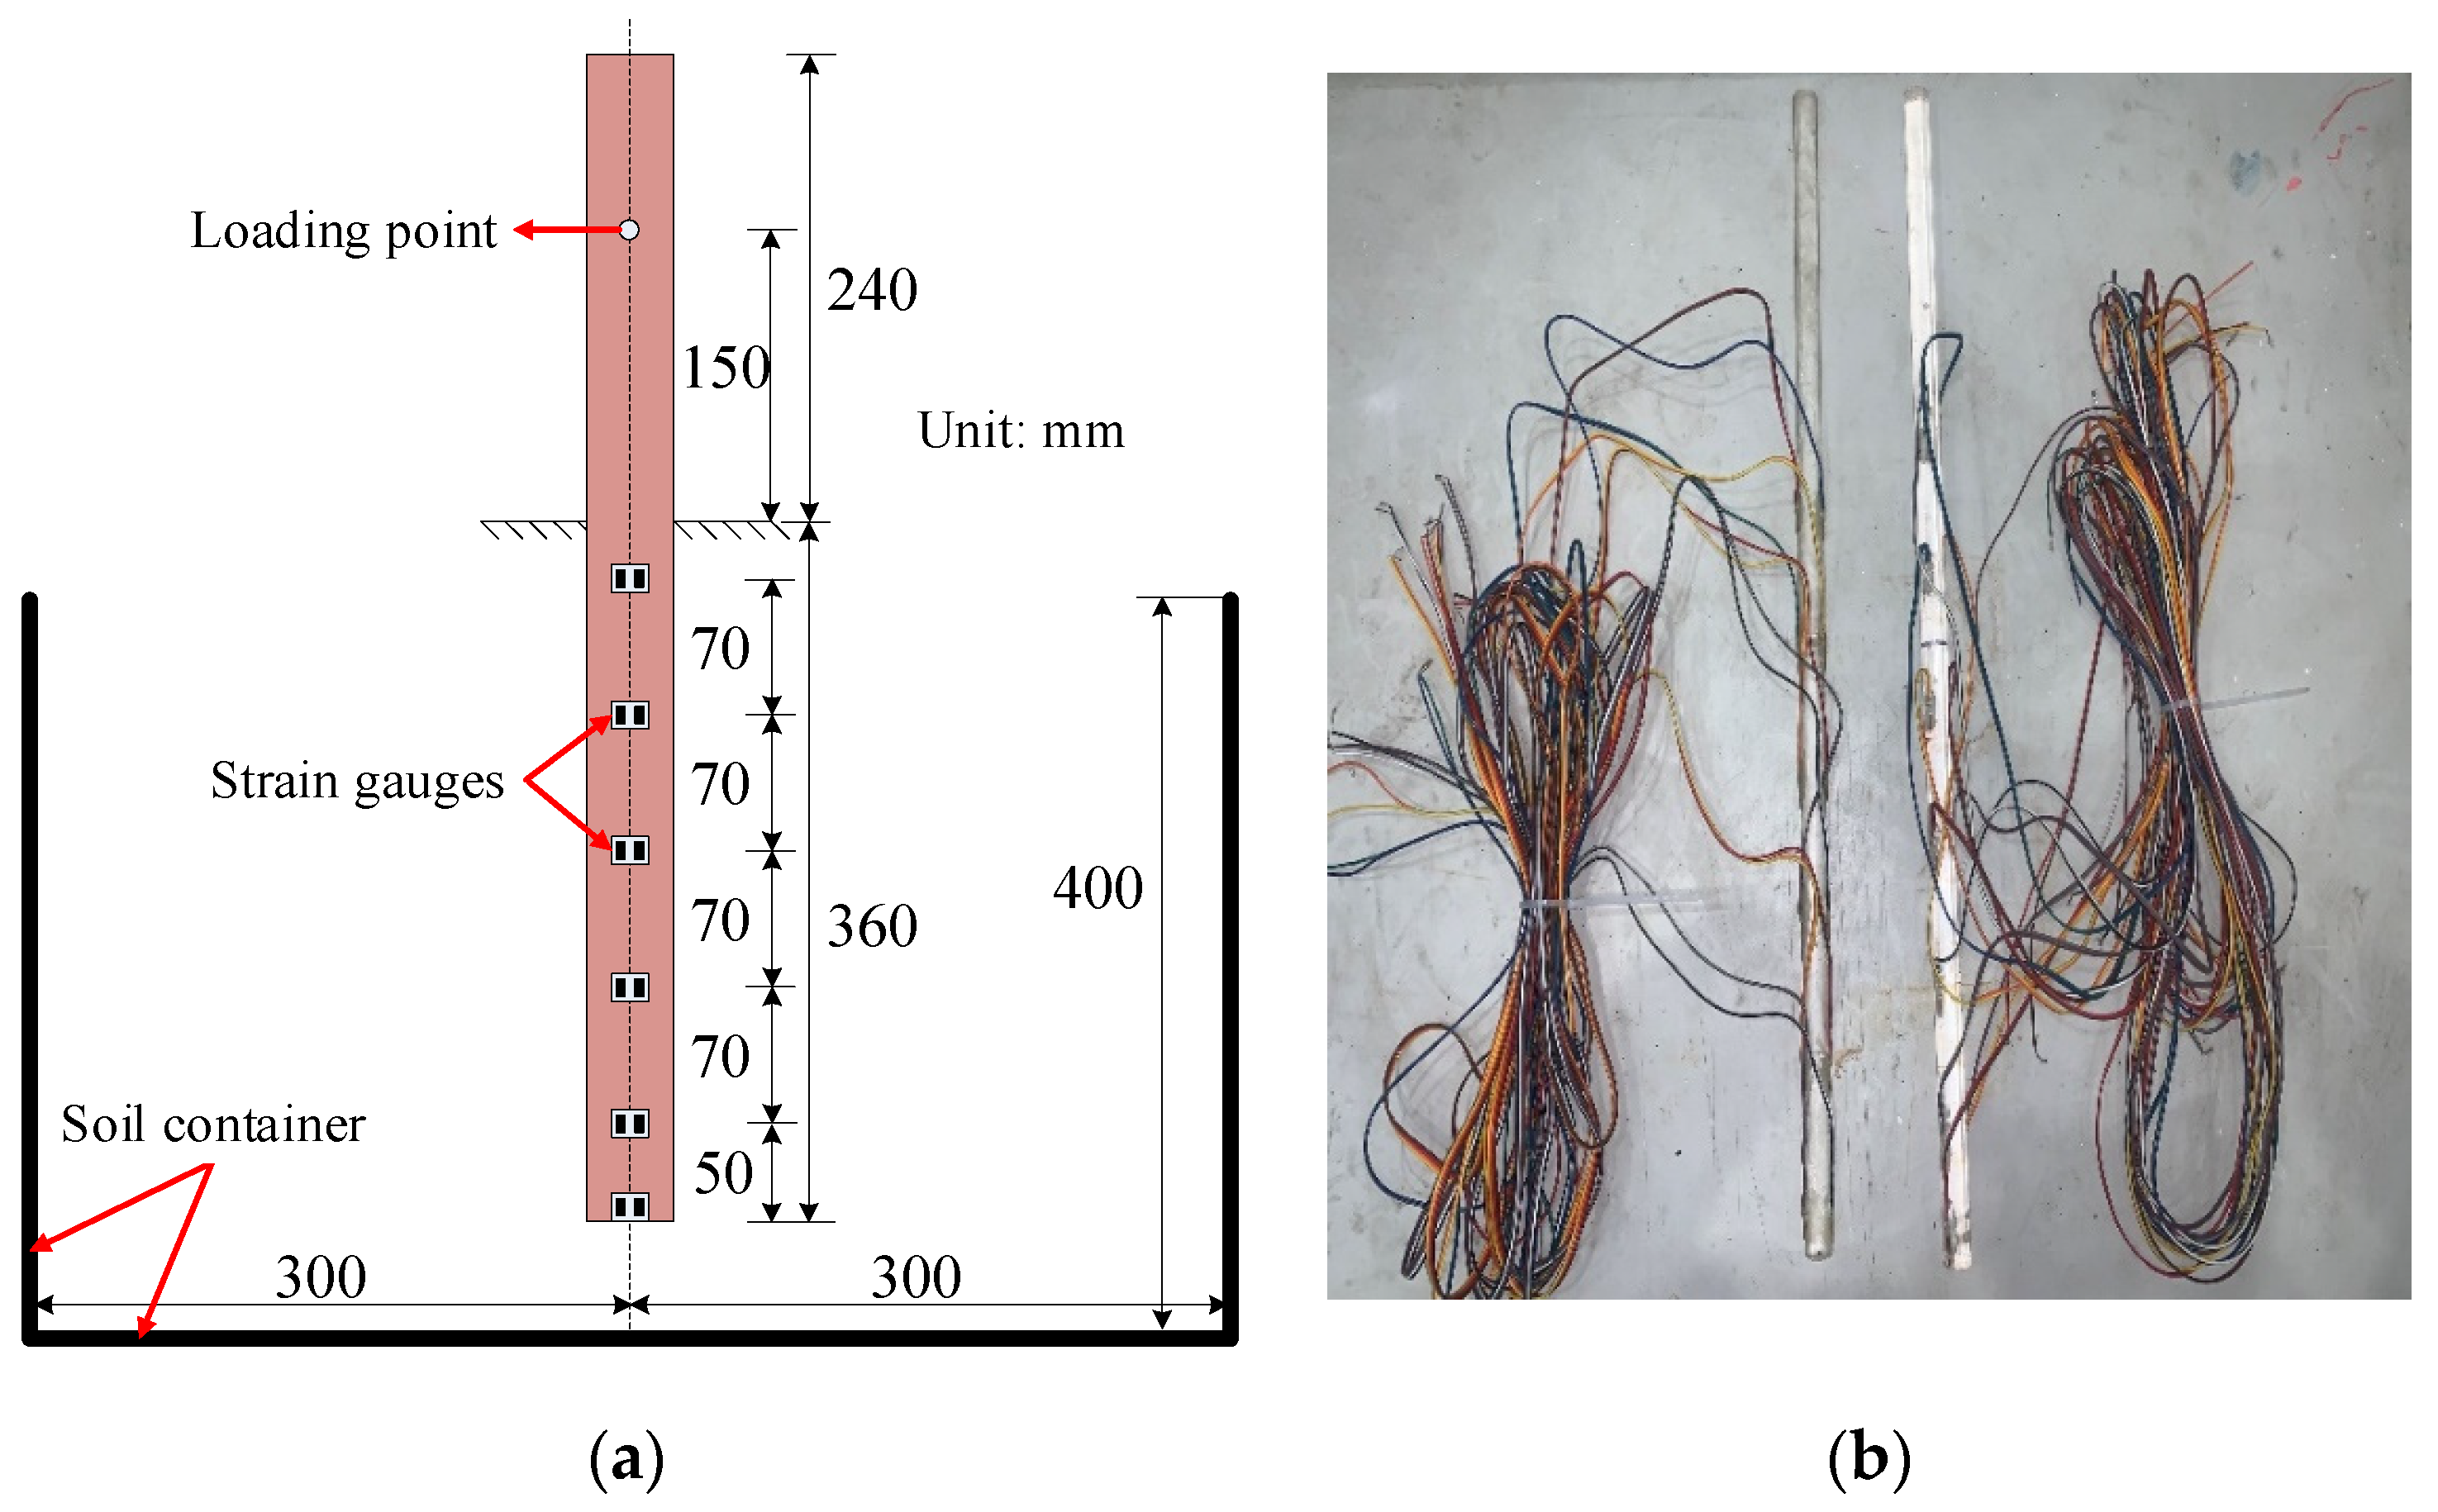
2.1. Model Pile Characteristics

The half model pile was made of organic glass (PMMA) with a flexural rigidity of 12.99 N·m2. The embedded depth and the total length of the pile are 0.36 and 0.6 m, respectively. The cross-sectional shape of the half pile is semicircular. The diameter of the pile is 2 cm.
There are six pairs of strain gauges (see Figure 2a) pasted on the pile shaft to calculate the bending moment along the pile; the resistance of the strain gauge is 120 Ω. All the strain gauges were arranged below the ground surface. The static strain measuring instrument was used to collect strain data, with a measuring range of 0~±38,000 με. The wires of the strain gauge were connected to the static strain measuring instrument by a 1/4 Wheatstone bridge.
In order to obtain the flexural stiffness EI of a pile accurately, which is generally measured by the simply supported beam method or the cantilever beam method. In this test, the flexure stiffness EI was measured using the simply supported beam method; for PIV observation, the model pile was cut in half against the container wall, and the EI of the half-pile was 12.99 N·m2.

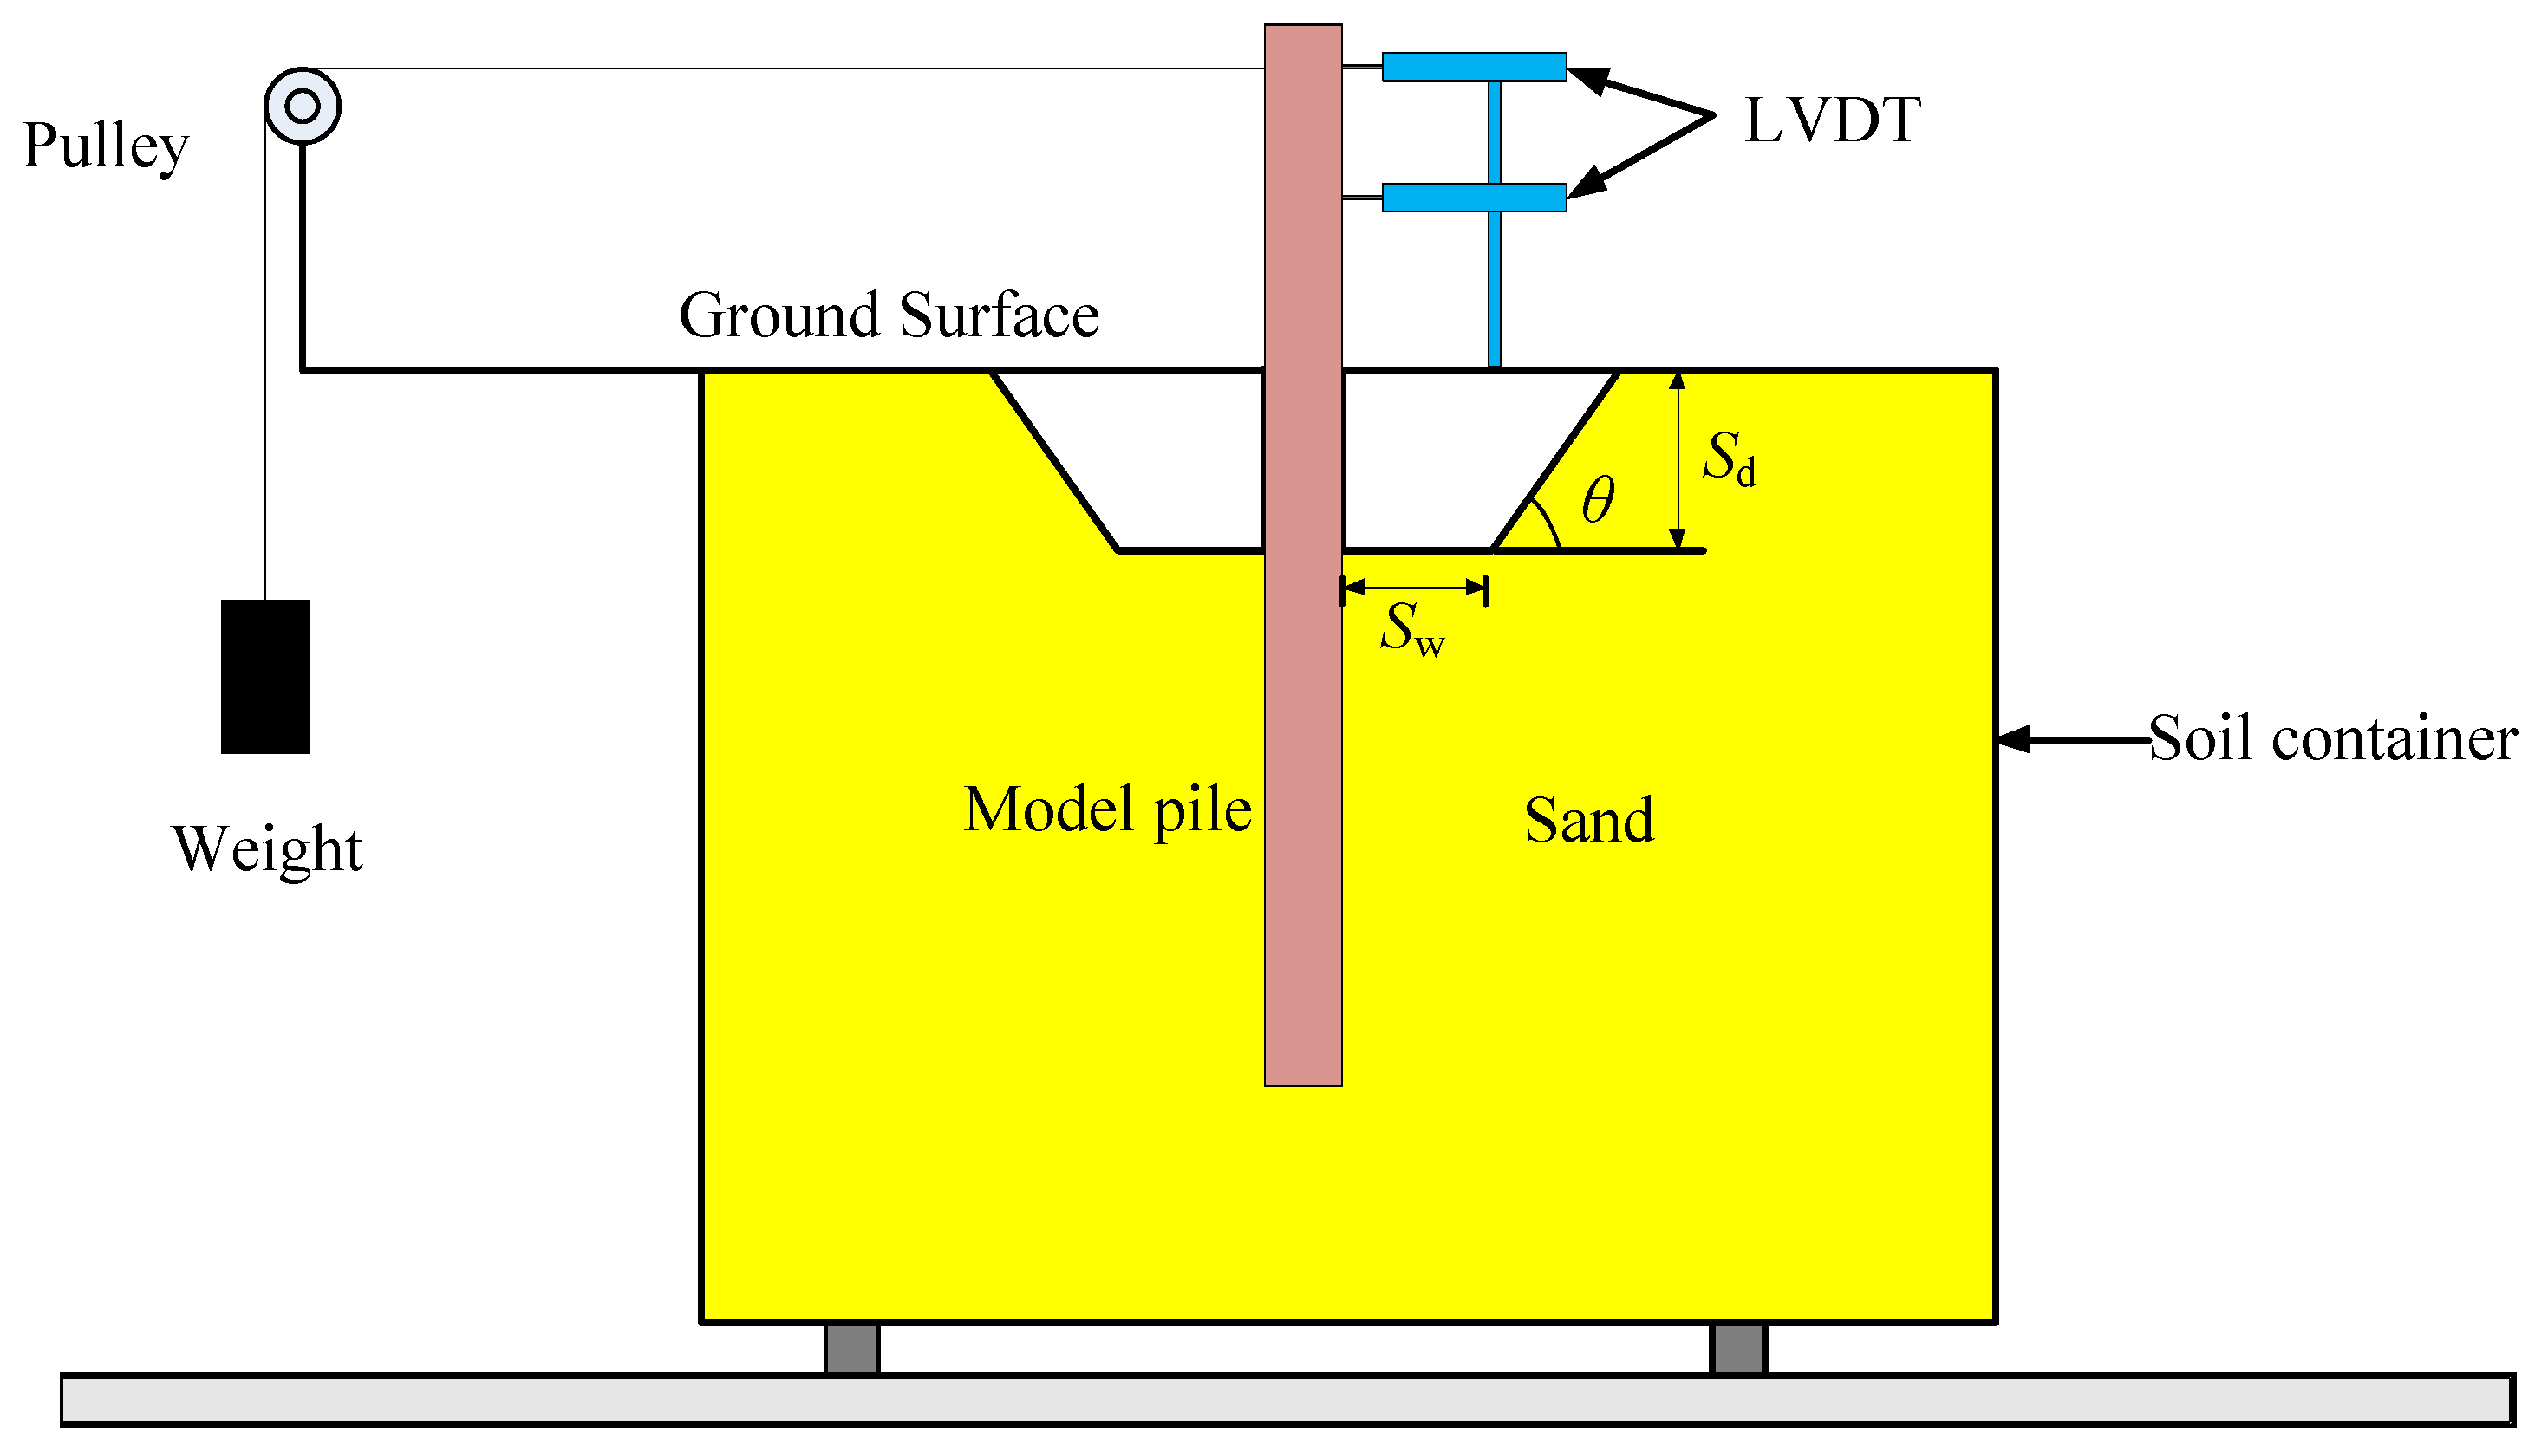
2.2. Experimental Loading Device

The soil container used in the tests is 0.6 m in length, 0.4 m in width, and 0.6 m in height. In order to observe the soil movement, the front and back sides of the container are made of transparent plexiglass, with the half model pile clinging to the plexiglass. Since the pile and the side of the container are in direct contact, there is some friction between them. As both are made of plexiglass, the friction is relatively low and does not significantly affect the experimental results. The deformation process of the soil around the half model pile was recorded by a digital camera. The camera has a resolution of 20.88 million pixels, meeting the definition requirements of the test.
The lateral displacements of the pile are measured by two linear variable differential transformers (LVDTs), which have a range of 0–70 mm and an accuracy of 0.1%, and at a height of 80 mm and 150 mm above the soil surface.
The loading device mainly consists of a soil container, a moving pulley, an LVDT, a weight, and a wire rope, as shown in Figure 3. Three factors are involved in a typical local scour pit around the pile foundation: the scour width (Sw), scour depth (Sd), and scour slope (θ). The general scour is a special local scour as the slope (θ) is 0°. The steel wire rope can apply a lateral load on the model pile through a pulley. It should be noted that in order to avoid the boundary effect, the distance between the side wall and pile should be larger than 6D (D is the diameter of the pile) [23,24]. The formation of the scour pit was realized by hand in the test, and the sand was evenly poured into the soil container; when the sand accumulated to a certain thickness, the sand was compacted, and the relative density of the sand was controlled to 60%.
In order to prepare the relative density Dr of 60%, firstly, the void ratio of soil e can be obtained by Equation (1), and then the dry density ρd of soil is obtained by Equation (2). Finally, the weight of sand under a certain volume can be calculated based on dry density.
e = e max D r ( e max e min )
ρ d = G S ρ w 1 + e
where GS is the specific gravity of soil, ρw is the water density. Dr is the predicted relative density, e is the void ratio of soil, emax is the maximum void ratio, and emin is the minimum void ratio.

2.3. Test Schedule

All the tests are shown in Table 2. A-1 represents normal tests without scour, A-2 represents tests of general scour, and the rest were local scour tests.
The soil sample was prepared by mass control. A roller was used to compact the soil layer by layer, with each layer being 0.05 m. The average relative density of each layer of sand was 60%. The model pile was put in place and temporarily fixed before pouring sand, and all the tests were carried out after the completed soil sample stood for 24 h and were conducted using stage loading, with each load weighing 160 g.

2.4. Principle of PIV Technology in the Tests

Particle Image Velocimetry (PIV) technology is a non-disturbing, high-speed, full-flow contactless visual flow field measurement technology. It can analyze the instantaneous flow image and get the displacement vector of the entire flow field in the test area, reflecting the real flow field information. This test used GeoPIV8 software to analyze the displacement of the soil around the model pile. It was developed by White and Take [25] at Cambridge University, based on the MATLAB software platform. The analysis process is mainly divided into three parts: pre-processing, PIV analysis, and post-processing.
Pre-processing: The images taken before and after the test are input into the GeoPIV program, and the editing and comparison commands are executed.
PIV analysis: Unchanged soil particles are converted into gray points, while moving particles are represented as arrows proportional to the intensity of their movement, generating a PIV displacement vector diagram.
Post-processing: Convert the virtual coordinates of the image to the realistic coordinates, complete the image calibration, and start the strain calculation program to calculate the strain and strain contour of the soil around the pile.

3. Results and Discussion

In this part, the results of the static laterally loaded pile are investigated by plotting the load-displacement curve at the loading point, the pile bending moment variation curves along the depth, and the p-y curves at different depths.
The bending moment can be calculated by the strain data of the pile shaft, and a fourth-order polynomial function can be adopted to express the bending moment distribution along the pile. Based on elastic beam theory, the lateral displacements and soil resistance can be obtained through the bending moment distribution. The lateral displacements of pile y and soil resistance p can be calculated according to Equations (3) and (4), respectively.
y = M ( Z ) E I d z 2
p = d 2 M ( Z ) d 2 z
where y is the lateral displacement of the model pile, p is soil resistance, EI is the flexural rigidity of the model pile, M(Z) is the bending moment distribution function, and z is the soil depth.

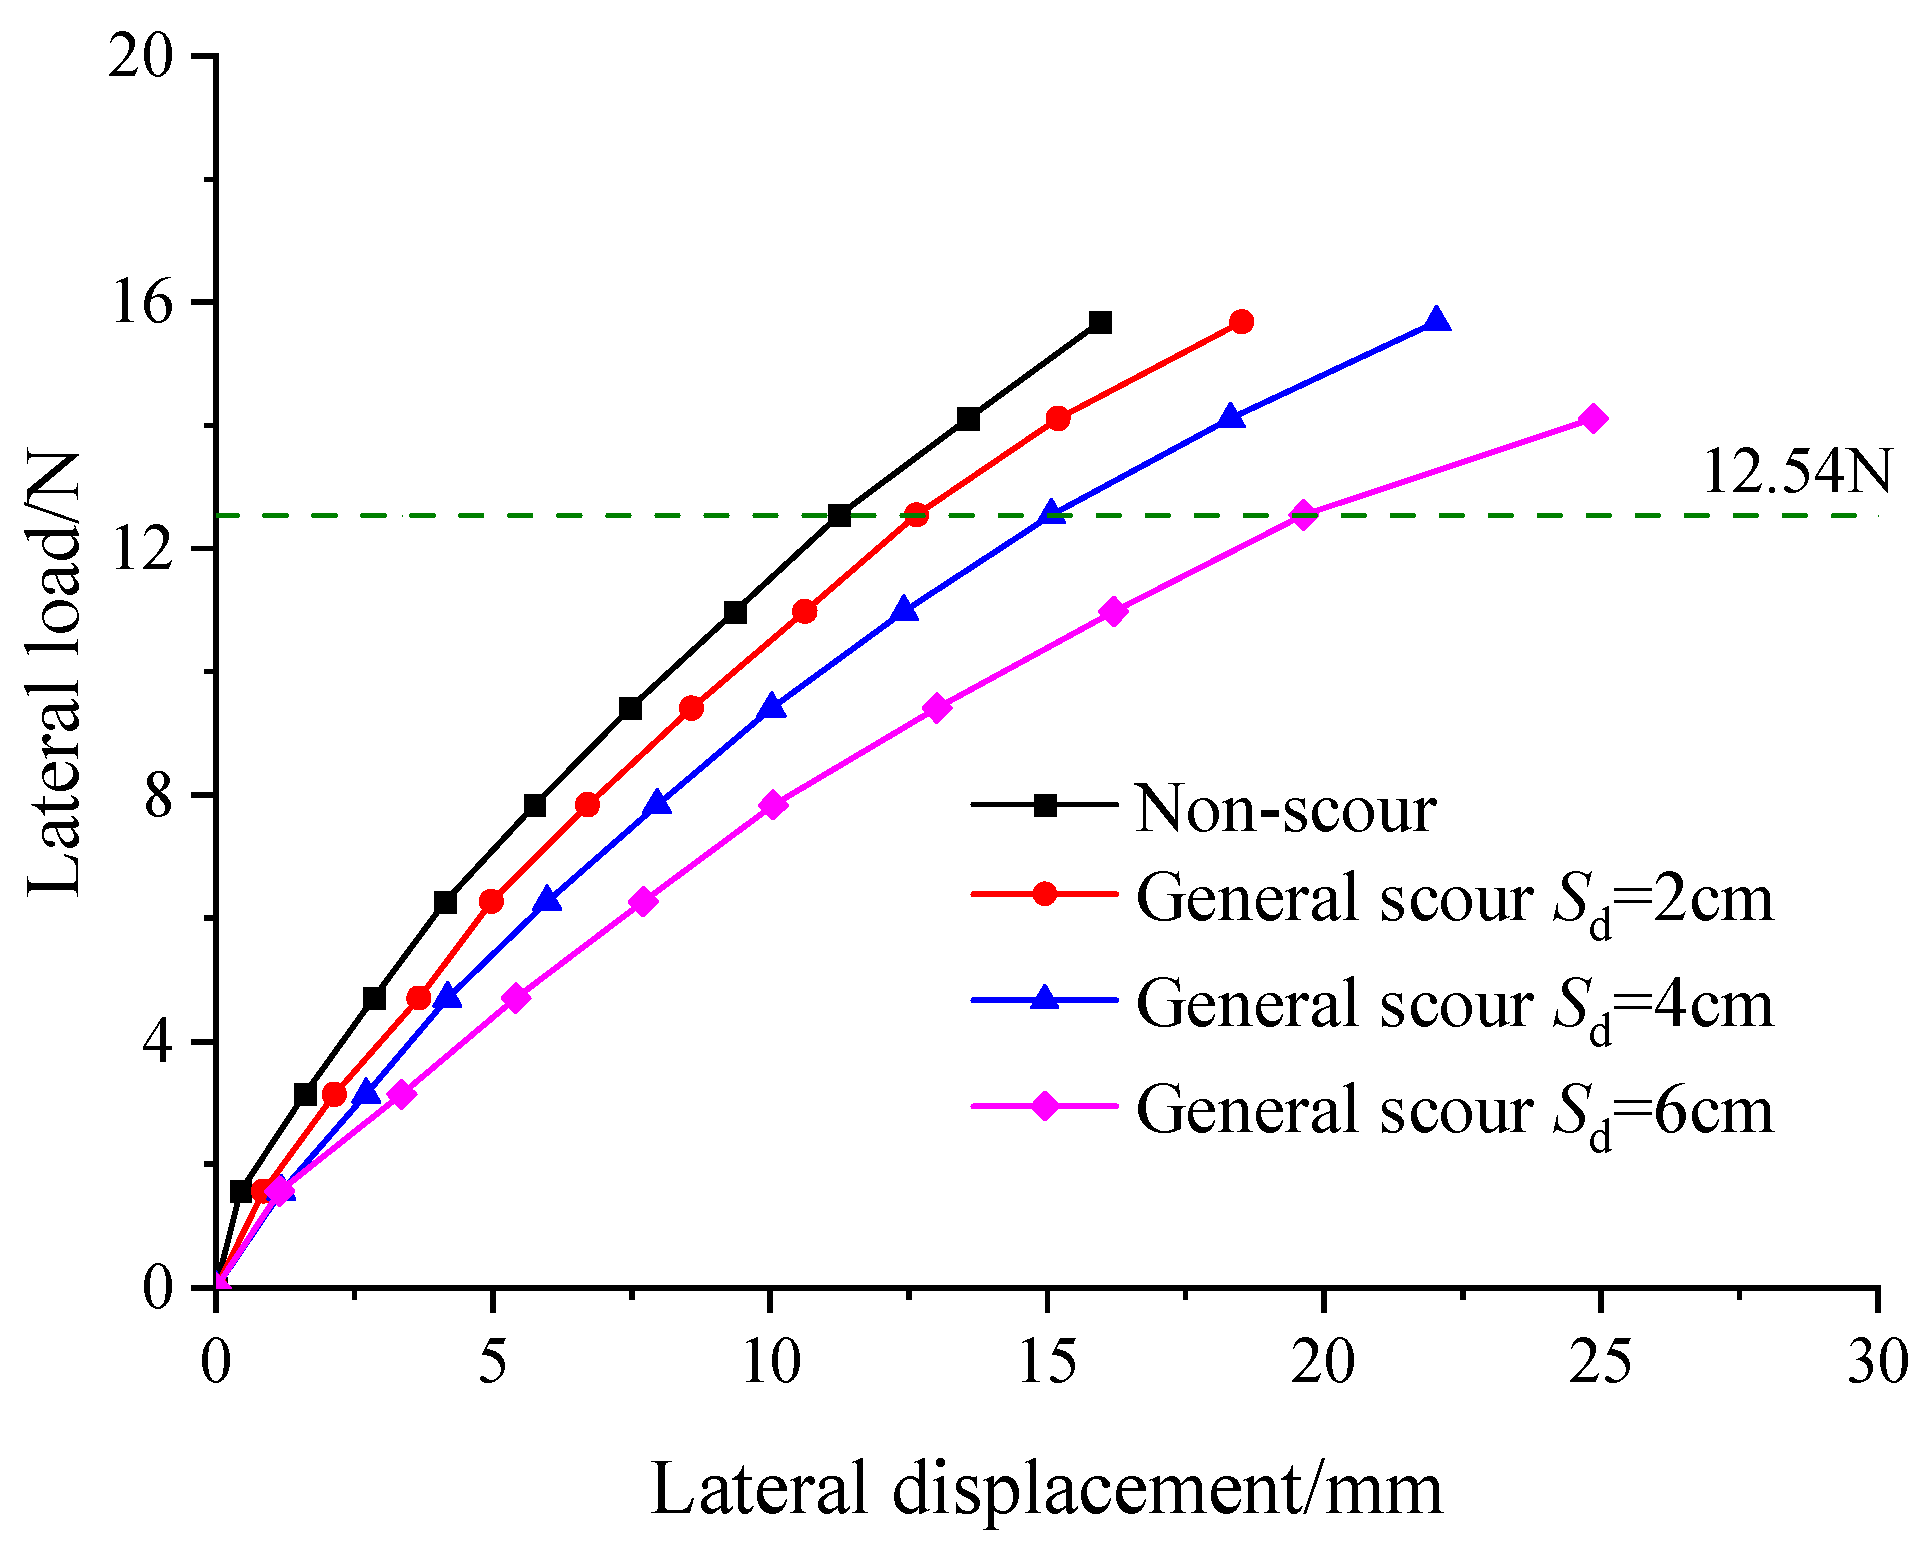
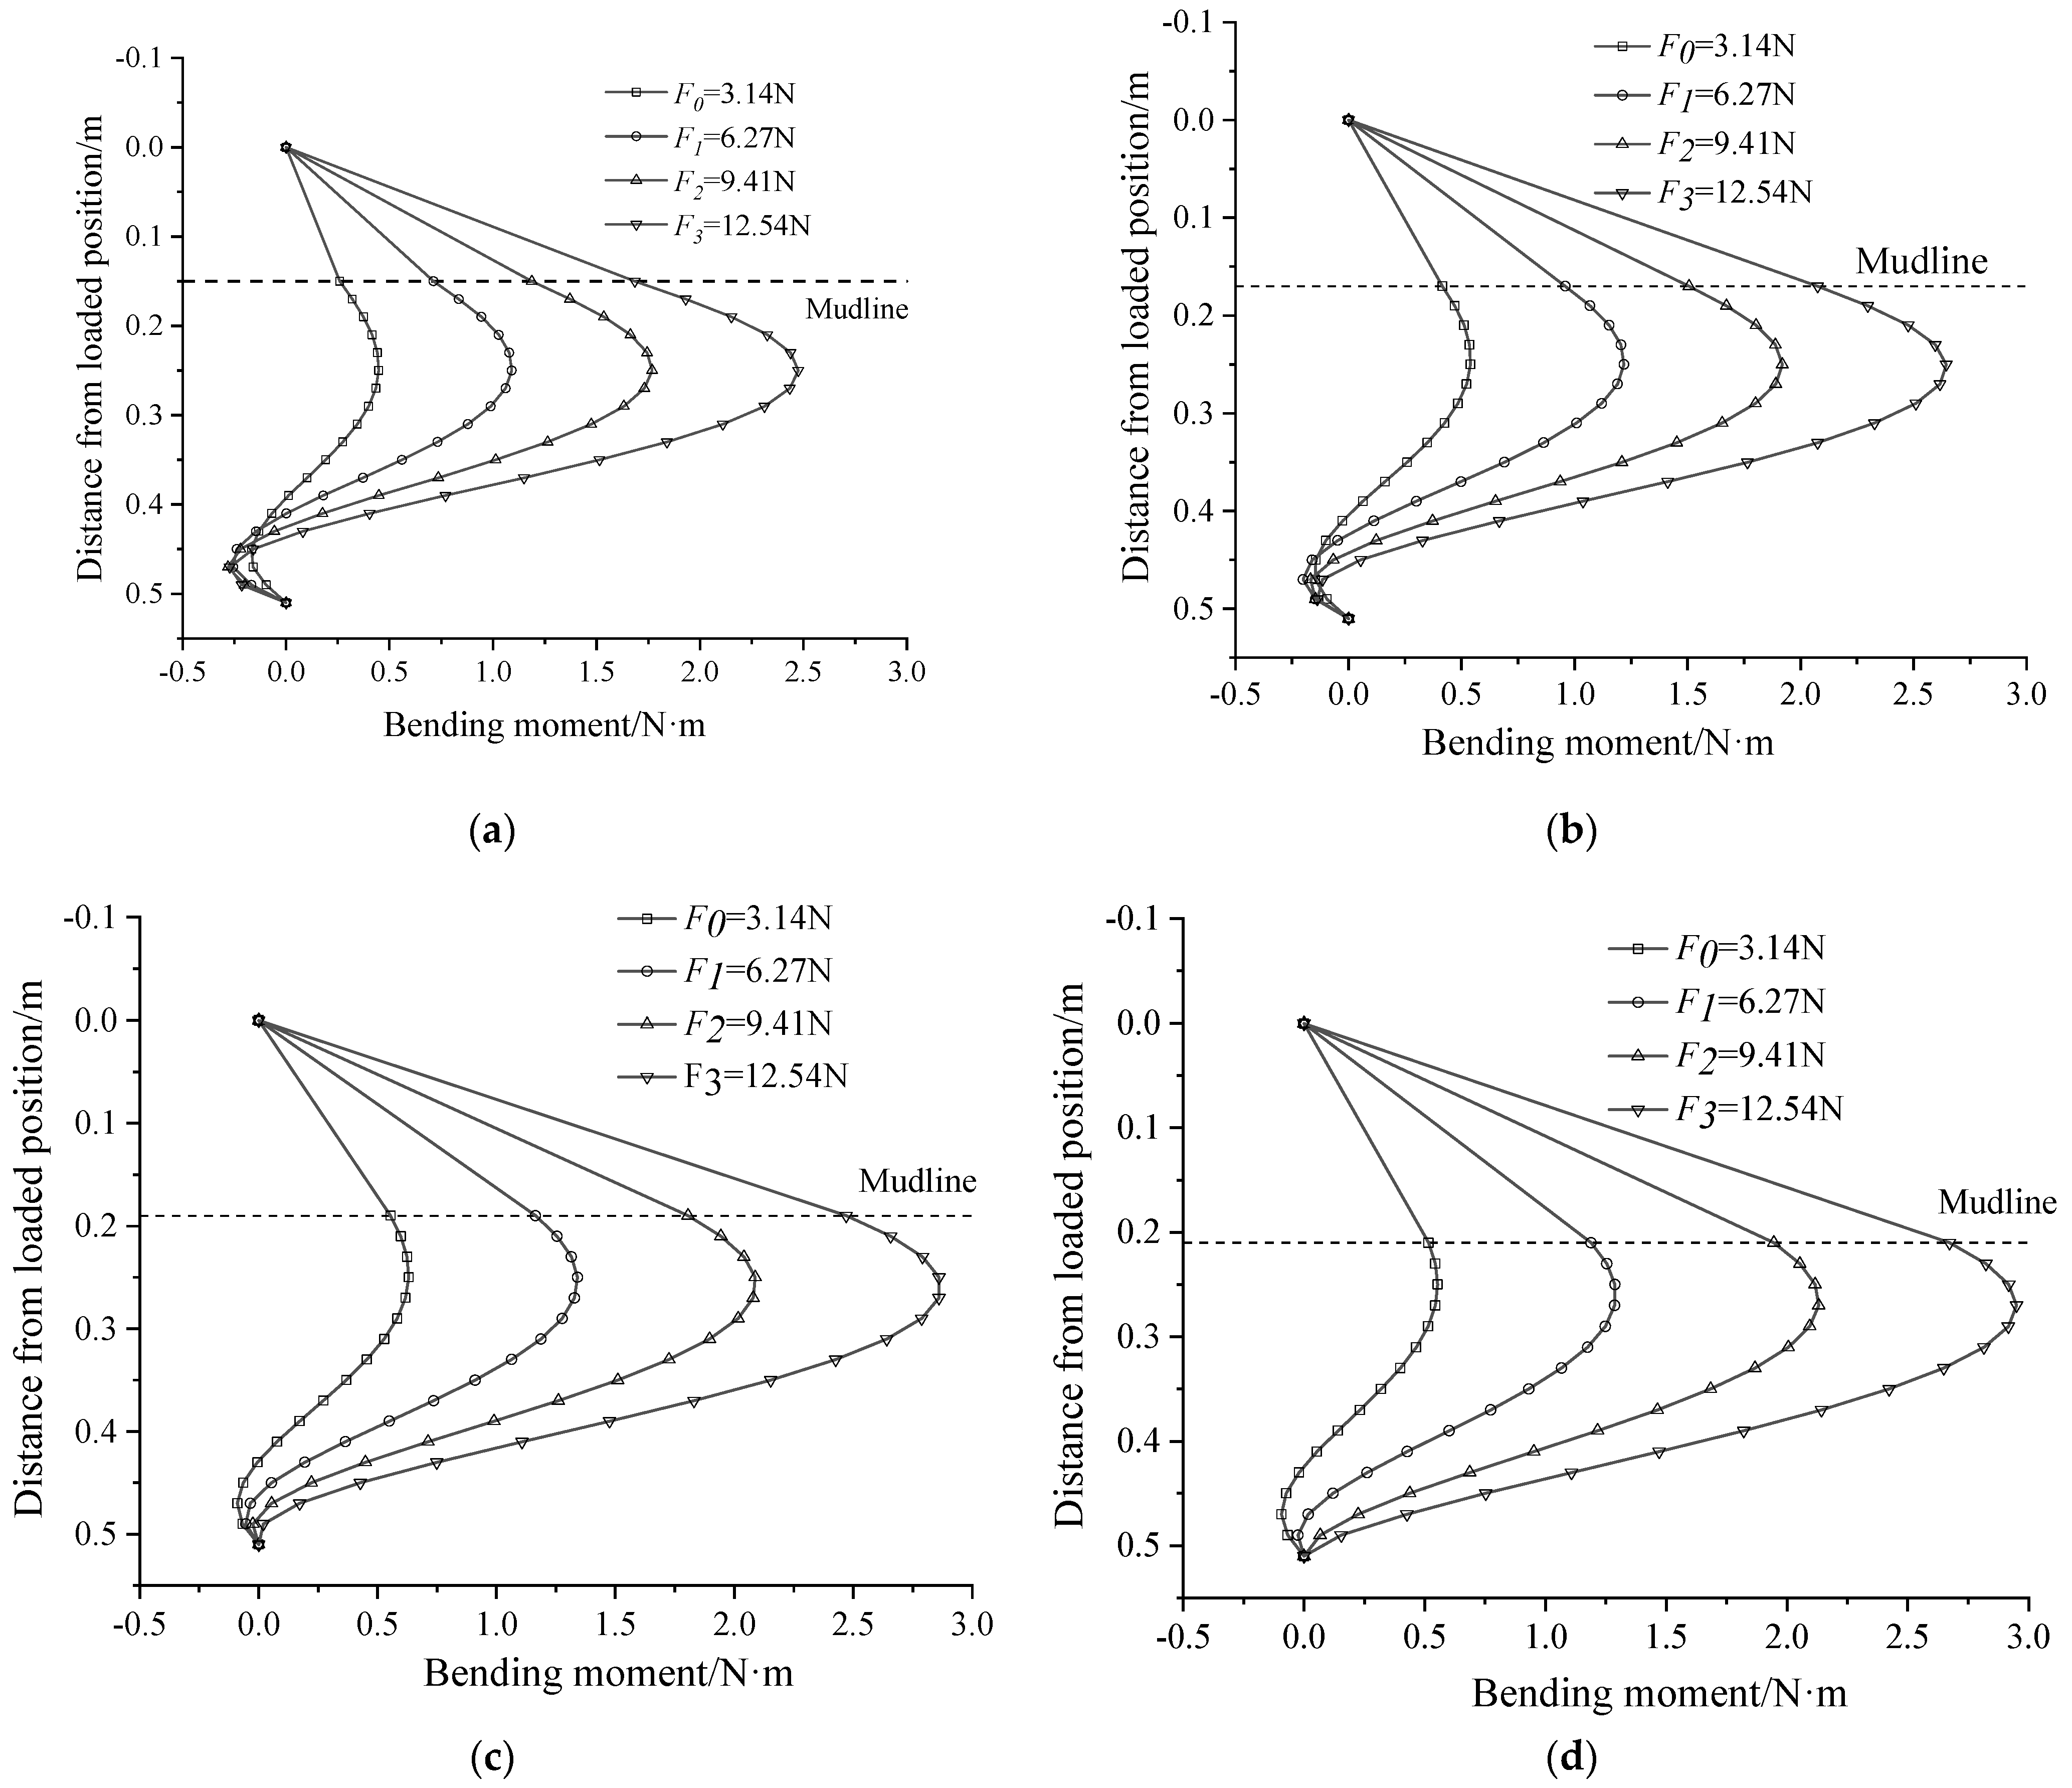
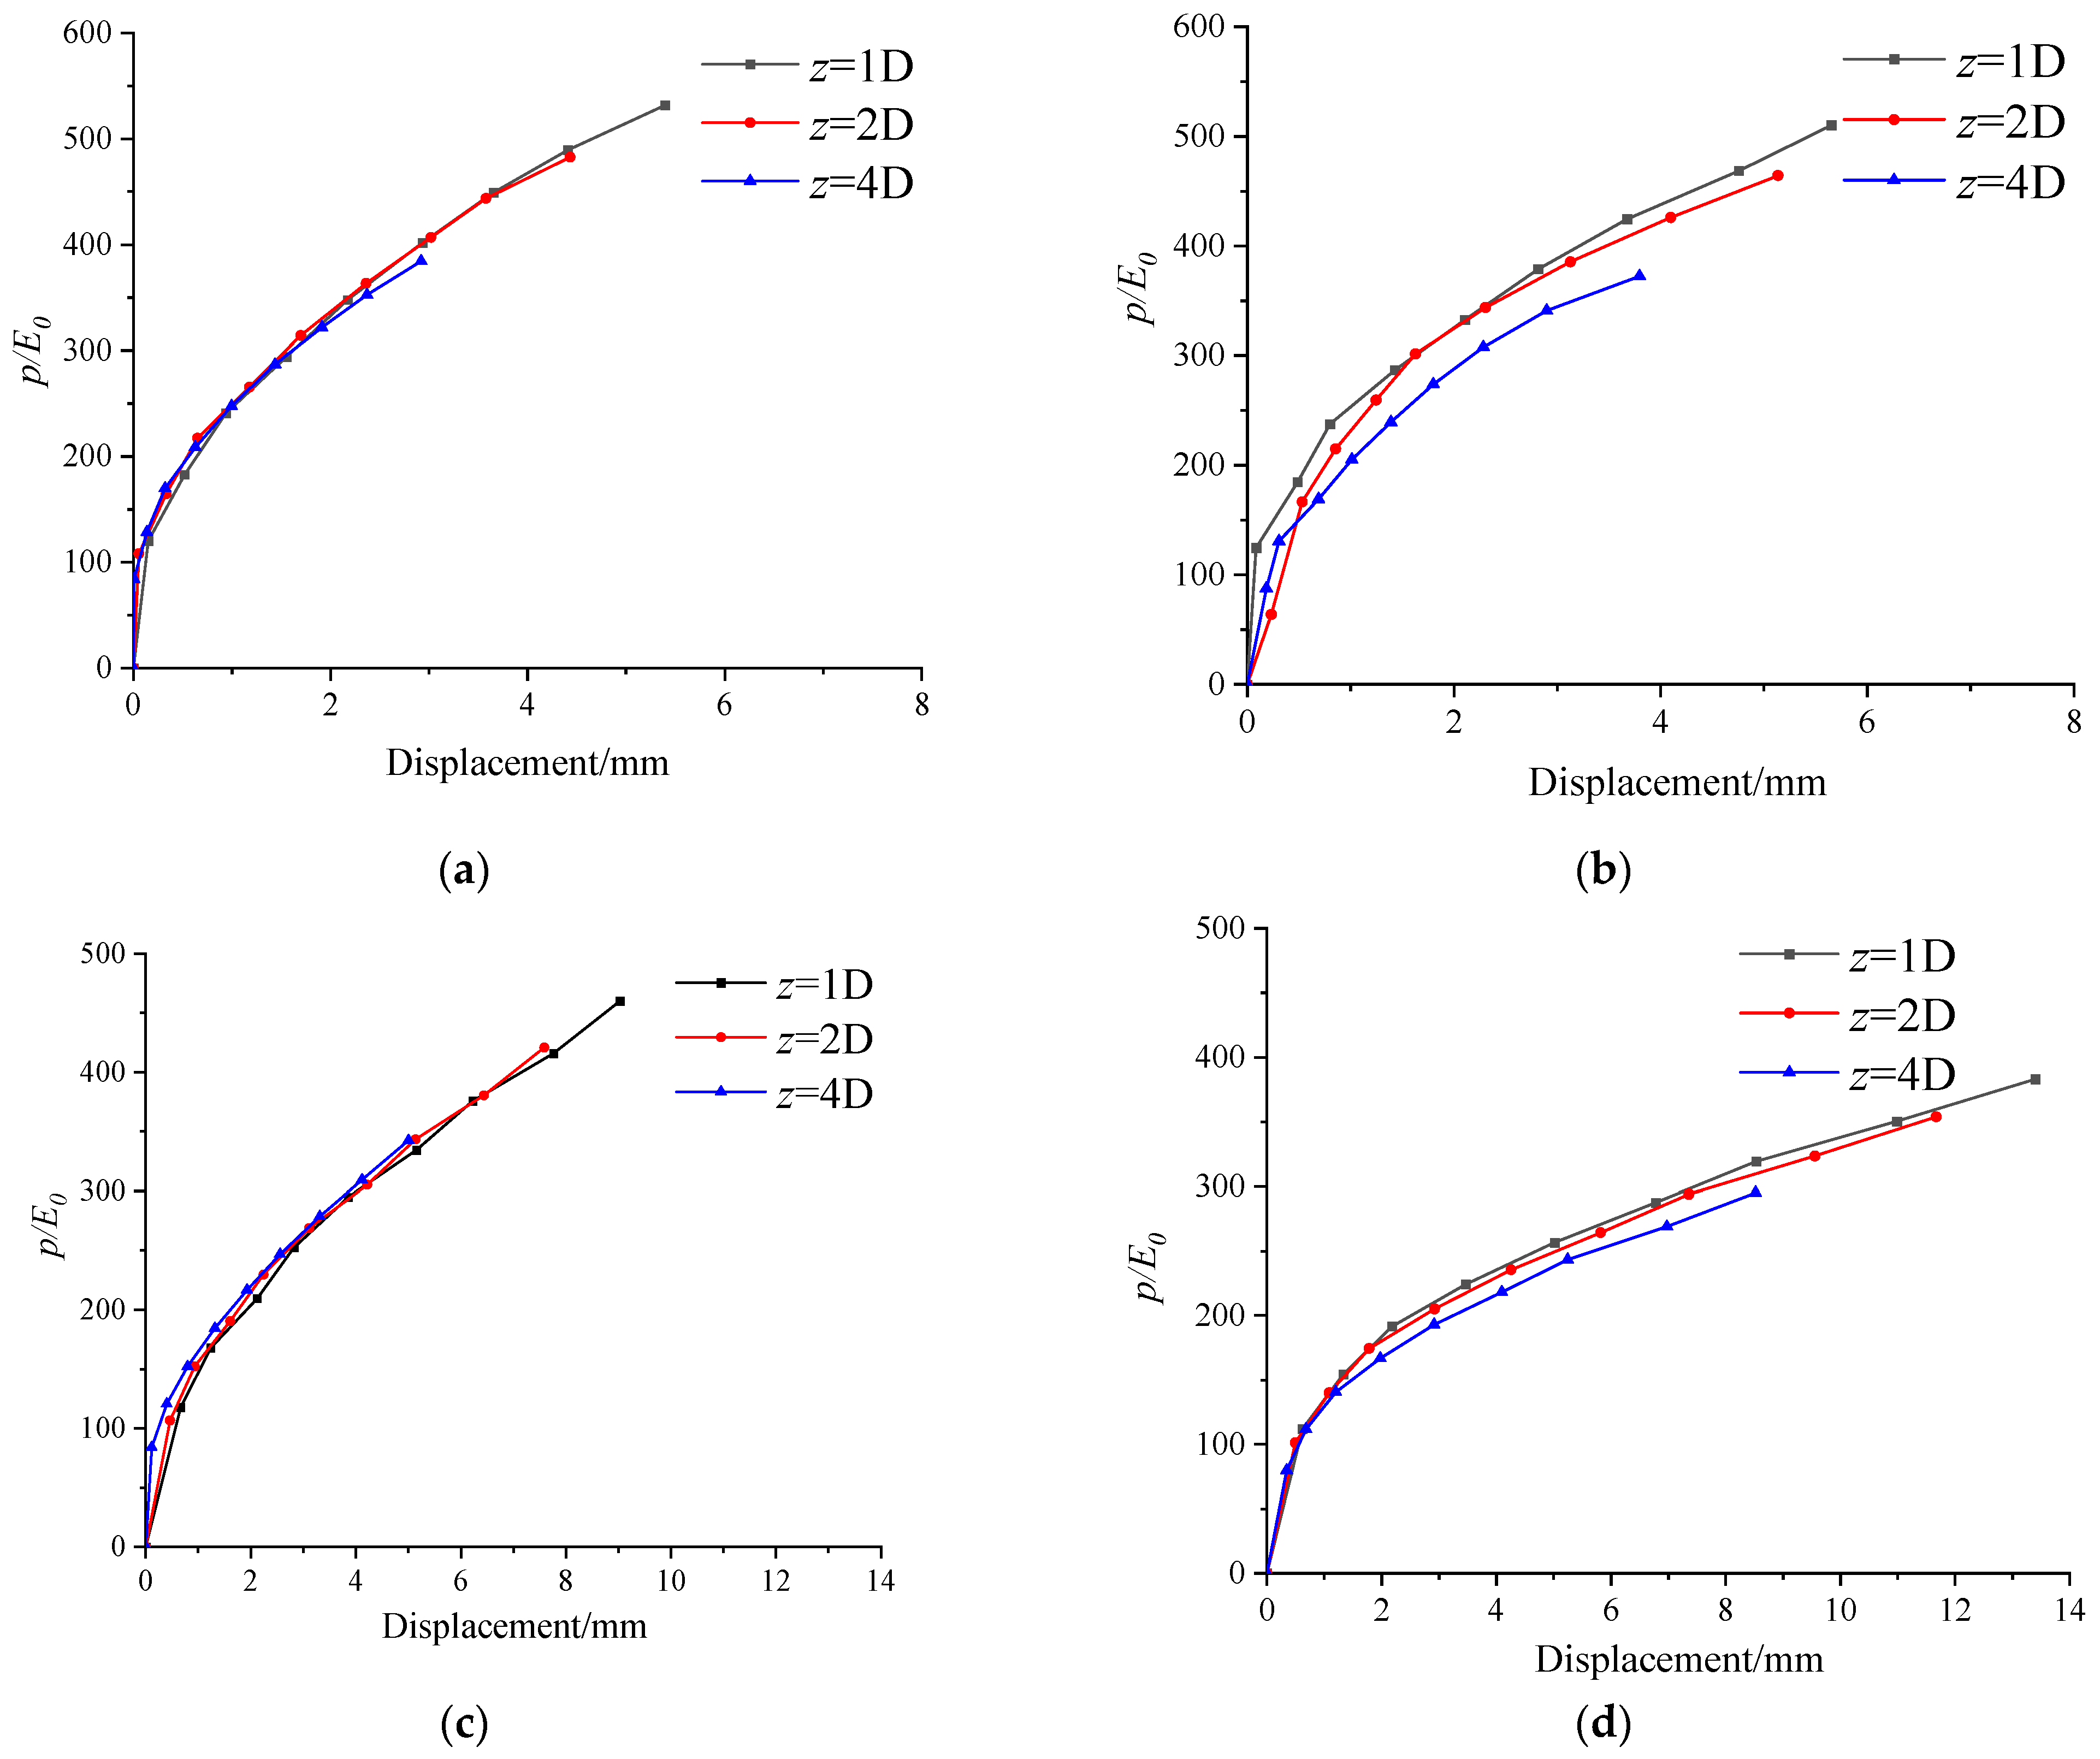
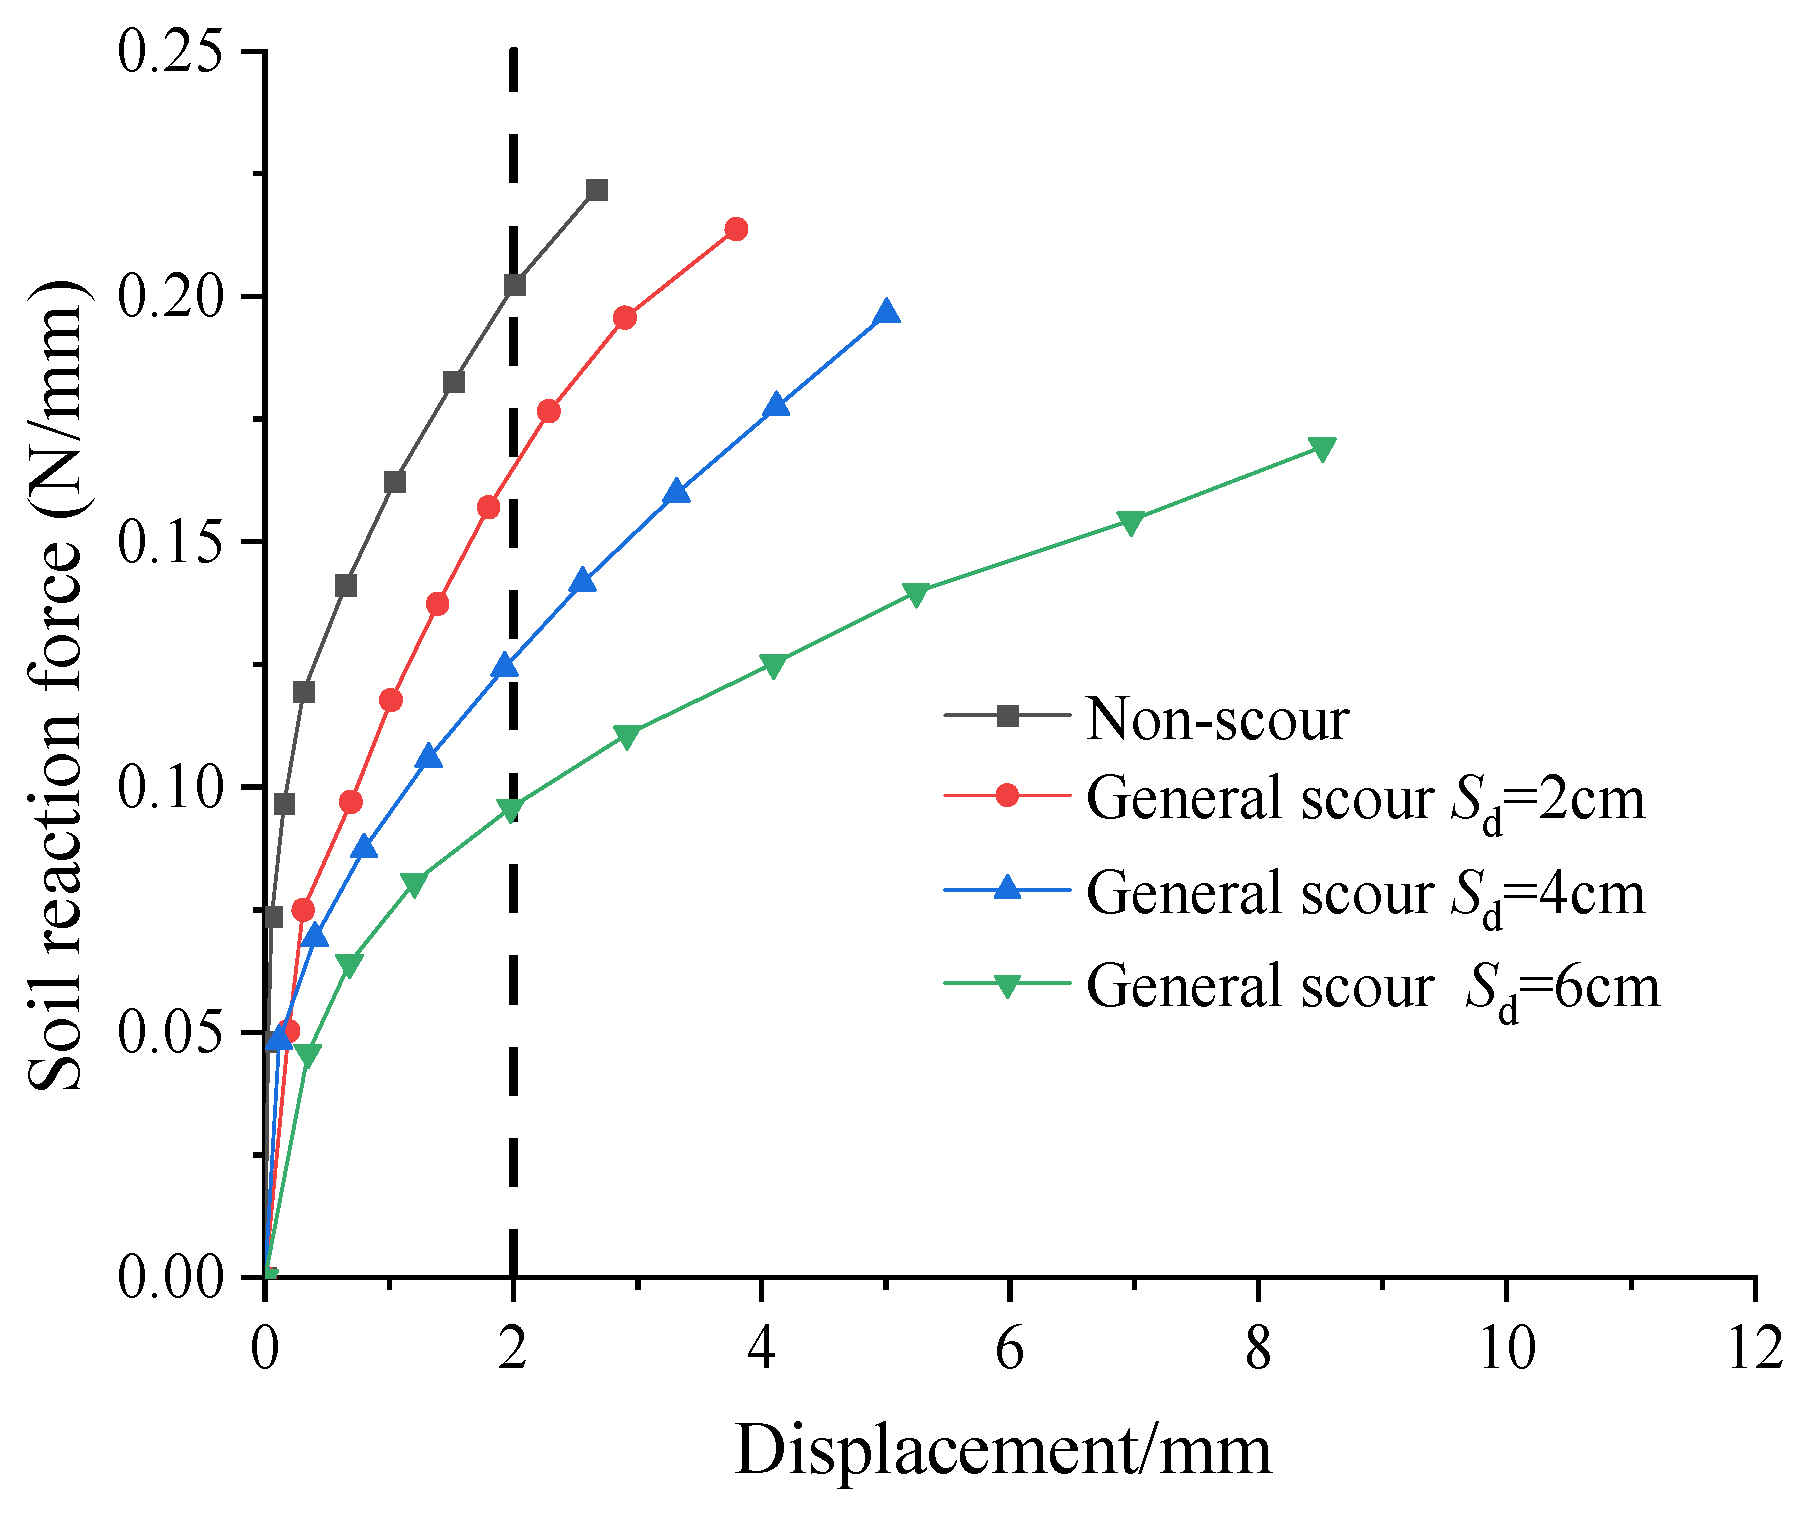
3.1. The Effect of Scour Depth

Figure 4 and Figure 5 show the load-displacement curves for different scour depths under general and local scour conditions, respectively. It is evident that the lateral bearing capacity of the pile decreases gradually with increasing scour depth. Compared to local scour, general scour has a greater impact on the bearing capacity of the model pile. For instance, when the lateral load is 12.54 N and the scour depth (Sd) is 4 cm, the displacements for local and general scour are 25% and 34% higher than those in a non-scour test.
Figure 6 presents the bending moment distribution curve against depth, showing that the bending moment increases with depth in the shallow soil, reaching a maximum value at 0.10 m below the surface, and then gradually decreases. Under the same scouring condition, the maximum bending moment of the pile increases with the increase of lateral load.
Figure 7 shows the bending moment distribution of the pile at different depths under general scour when the lateral load is 12.54 N. It can be seen that the maximum bending moment increases with scoured depth, reaching 2.48 N m under non-scour conditions. When the general scour depth is 2 cm, 4 cm, and 6 cm, their maximum bending moment values are 6.78%, 12.68%, and 18.78% larger, respectively, compared to non-scour conditions. Additionally, the position of the maximum bending moment exhibits an overall downward trend with increasing scour depth.
Figure 8 shows the bending moment distribution of the pile at different depths under local scour, with the lateral load set at 12.54 N. It can be seen that the maximum bending moment increases with the scoured depth. When the local scour depth is 2 cm, 4 cm, and 6 cm, their maximum bending moment values are 4.27%, 9.36%, and 12.06% larger, respectively, compared to non-scour conditions. The levels of growth are less than those observed under general scour tests.
Figure 9 presents the p-y curves at different scour depths (under general scour). These curves generally exhibit a nonlinear distribution. The slope of the p-y curve increases with soil depth. For example, in Figure 9a, the initial slopes of soil at depths of 1D, 2D, and 4D below the surface are 0.11 N/mm2, 0.57 N/mm2, and 9.63 N/mm2, respectively. Correspondingly, the soil reaction force (p) increases with soil depth. When the displacement of the pile is 2 mm, the soil reaction forces (p) are 0.048 N/mm, 0.096 N/mm, and 0.188 N/mm at soil depths of 1D, 2D, and 4D below the surface, respectively. This is because the deeper the soil is below the surface, the heavier the upper soil, resulting in a greater soil reaction force.
In order to eliminate stress-dependency, the p-y curves are normalized using horizontal earth pressure (E0) at each depth. Horizontal earth pressure (E0) can be obtained by Equation (6). Figure 10 presents the normalized p-y curves at different scour depths (under general scour). It can be seen that before normalization, the deeper the soil, the greater the soil reaction force (p). However, after normalization, it can be observed that as soil depth increases, the corresponding normalized soil reaction force (p) actually decreases. This indicates that the growth of soil reaction force is not linear with soil depth but follows a nonlinear trend. In other words, as soil depth increases, the rate of soil reaction force (p) growth slows down.
k 0 = 1 sin φ
E 0 = k 0 γ Z Δ L
where φ is the internal friction angle of soil, φ = 33°, and k0 is the horizontal earth pressure coefficient. γ is soil unit weight, γ = 16 kN/m3, Z is soil depth, and ΔL is the length of the stress distribution range, ΔL = 1 mm, consistent with the distribution length of the soil reaction force.
Figure 11 shows the p-y curves at a depth of 4D below the soil surface (general scour). According to the figure, when the pile displacements are the same, the soil reaction force decreases with the increase of general scour depth, and the initial stiffness of the p-y curve at 4D below the soil surface also decreases with the increase of scour depth. When the displacement of the pile is 2 mm, the soil reaction force is 0.203 N/mm under non-scour conditions. The soil reaction forces are 81.28%, 62.07%, and 47.29% of that under non-scour conditions, corresponding to scour depths of 2 cm, 4 cm, and 6 cm, respectively. This is because the increase in scour depth ultimately leads to a decrease in the initial stiffness of the p-y curve and soil reaction force.

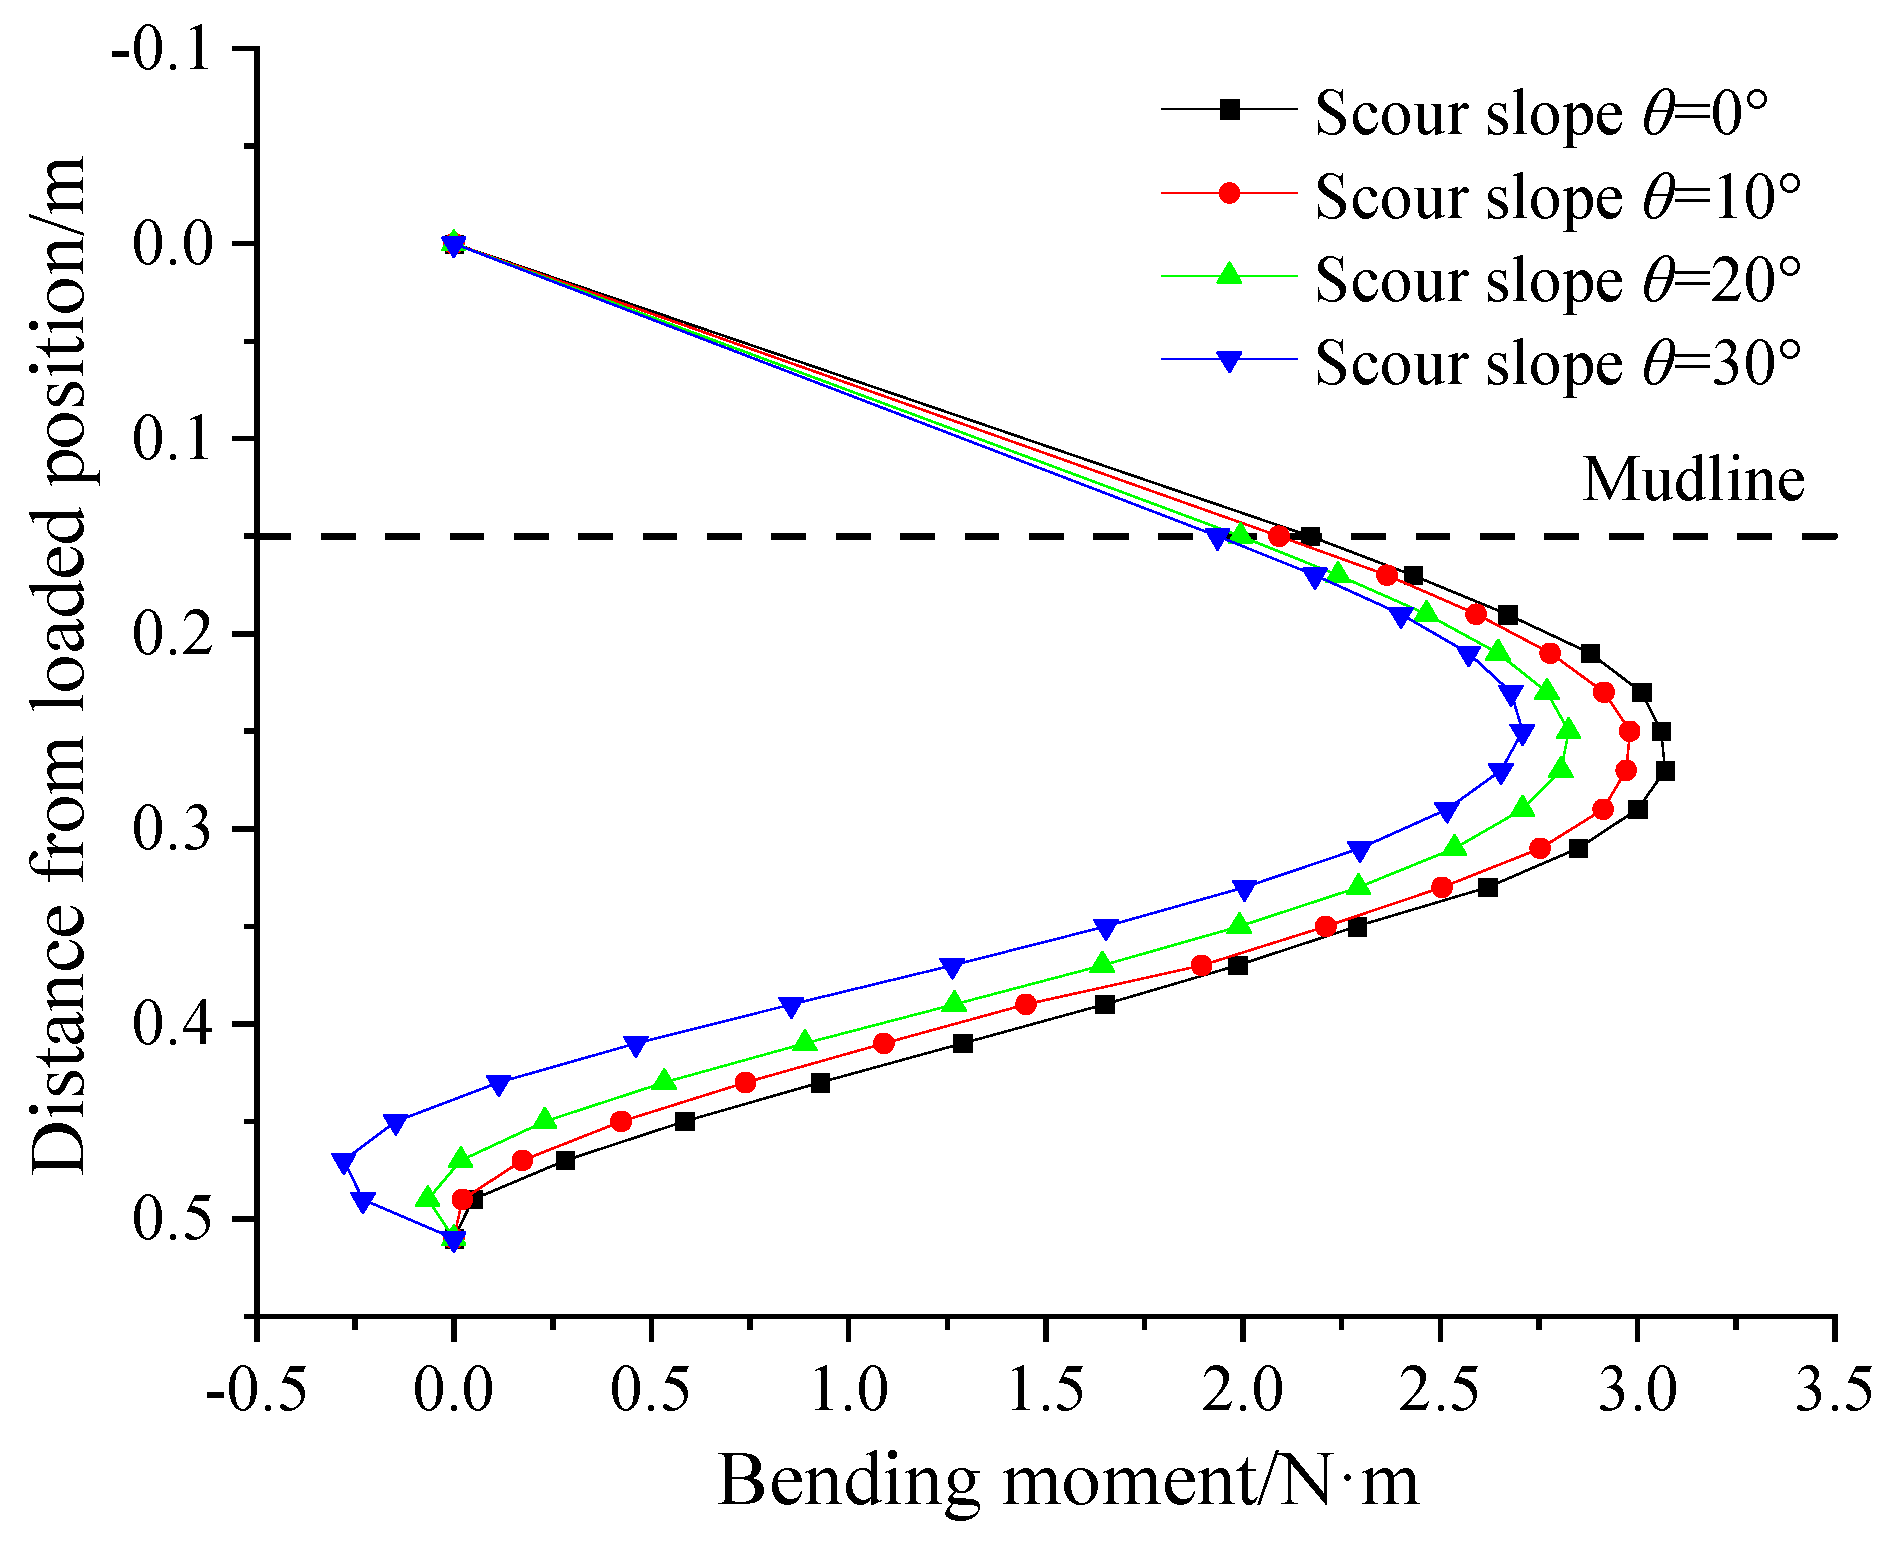
3.2. The Effect of Scour Slope

Figure 12 shows the displacement-load curves. It can be seen that the larger the scour slope, the greater the ability to resist deformation, and the stronger the pile foundation maintains its stability. When the lateral load is 12.54 N, the displacement at the loading point of the pile with a slope of 30° is 14.09 mm. When the slope is 20°, 10°, and 0°, the displacement is 122%, 136.79%, and 138.8% of that for the slope of 30°. Compared to scour depth, scour slope has less influence on the displacement growth rate.
Figure 13 provides the bending moment distribution curve under different scour slopes with a lateral load of 12.54 N. Under the same lateral load, the bending moment of the pile decreases as the scour slope increases, with the maximum bending moment at a scour slope of 0° being 3.07 N·m. The maximum bending moment values for scour slopes of 10°, 20°, and 30° are 97.06%, 91.85%, and 88.27% of that for the scour slope of 0°, respectively.
Figure 14 shows the p-y curve under different scour slopes for 4D below the surface. It can be seen that at the same position below the surface, the initial slope of the p-y curve increases with the increase of the scour slope. The initial slope of the curve is 0.07 N/mm2 for a scour slope of 10°. The initial slopes of the curves are 0.11 N/mm2 and 0.57 N/mm2 for scour slopes of 20° and 30°, respectively. This is because the larger the scour slope, the more soil remains in the upper soil, resulting in a greater initial modulus of the soil.

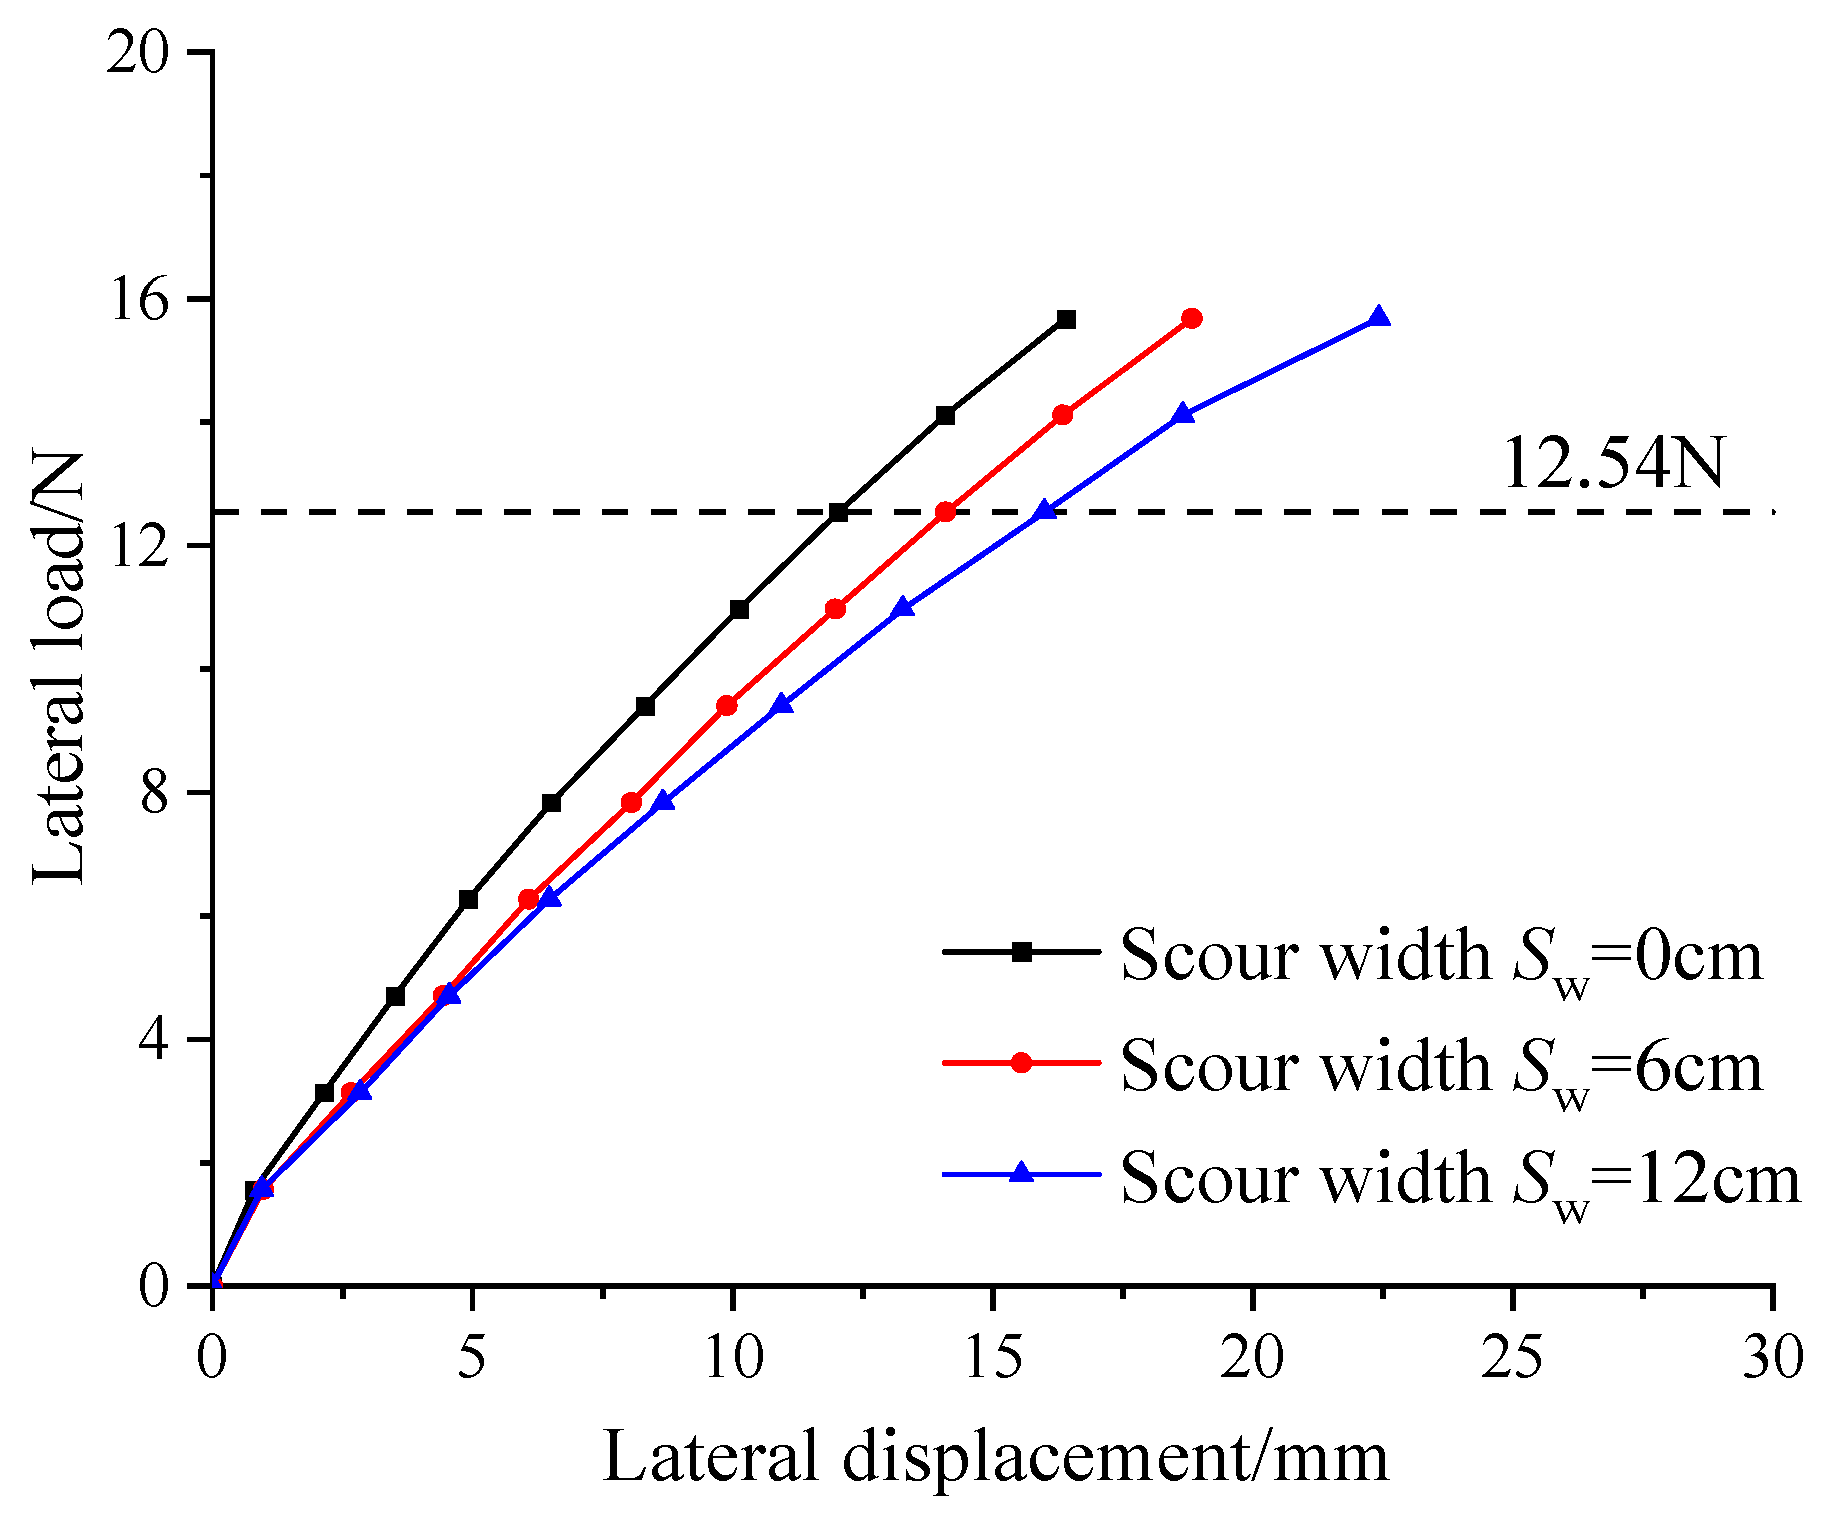
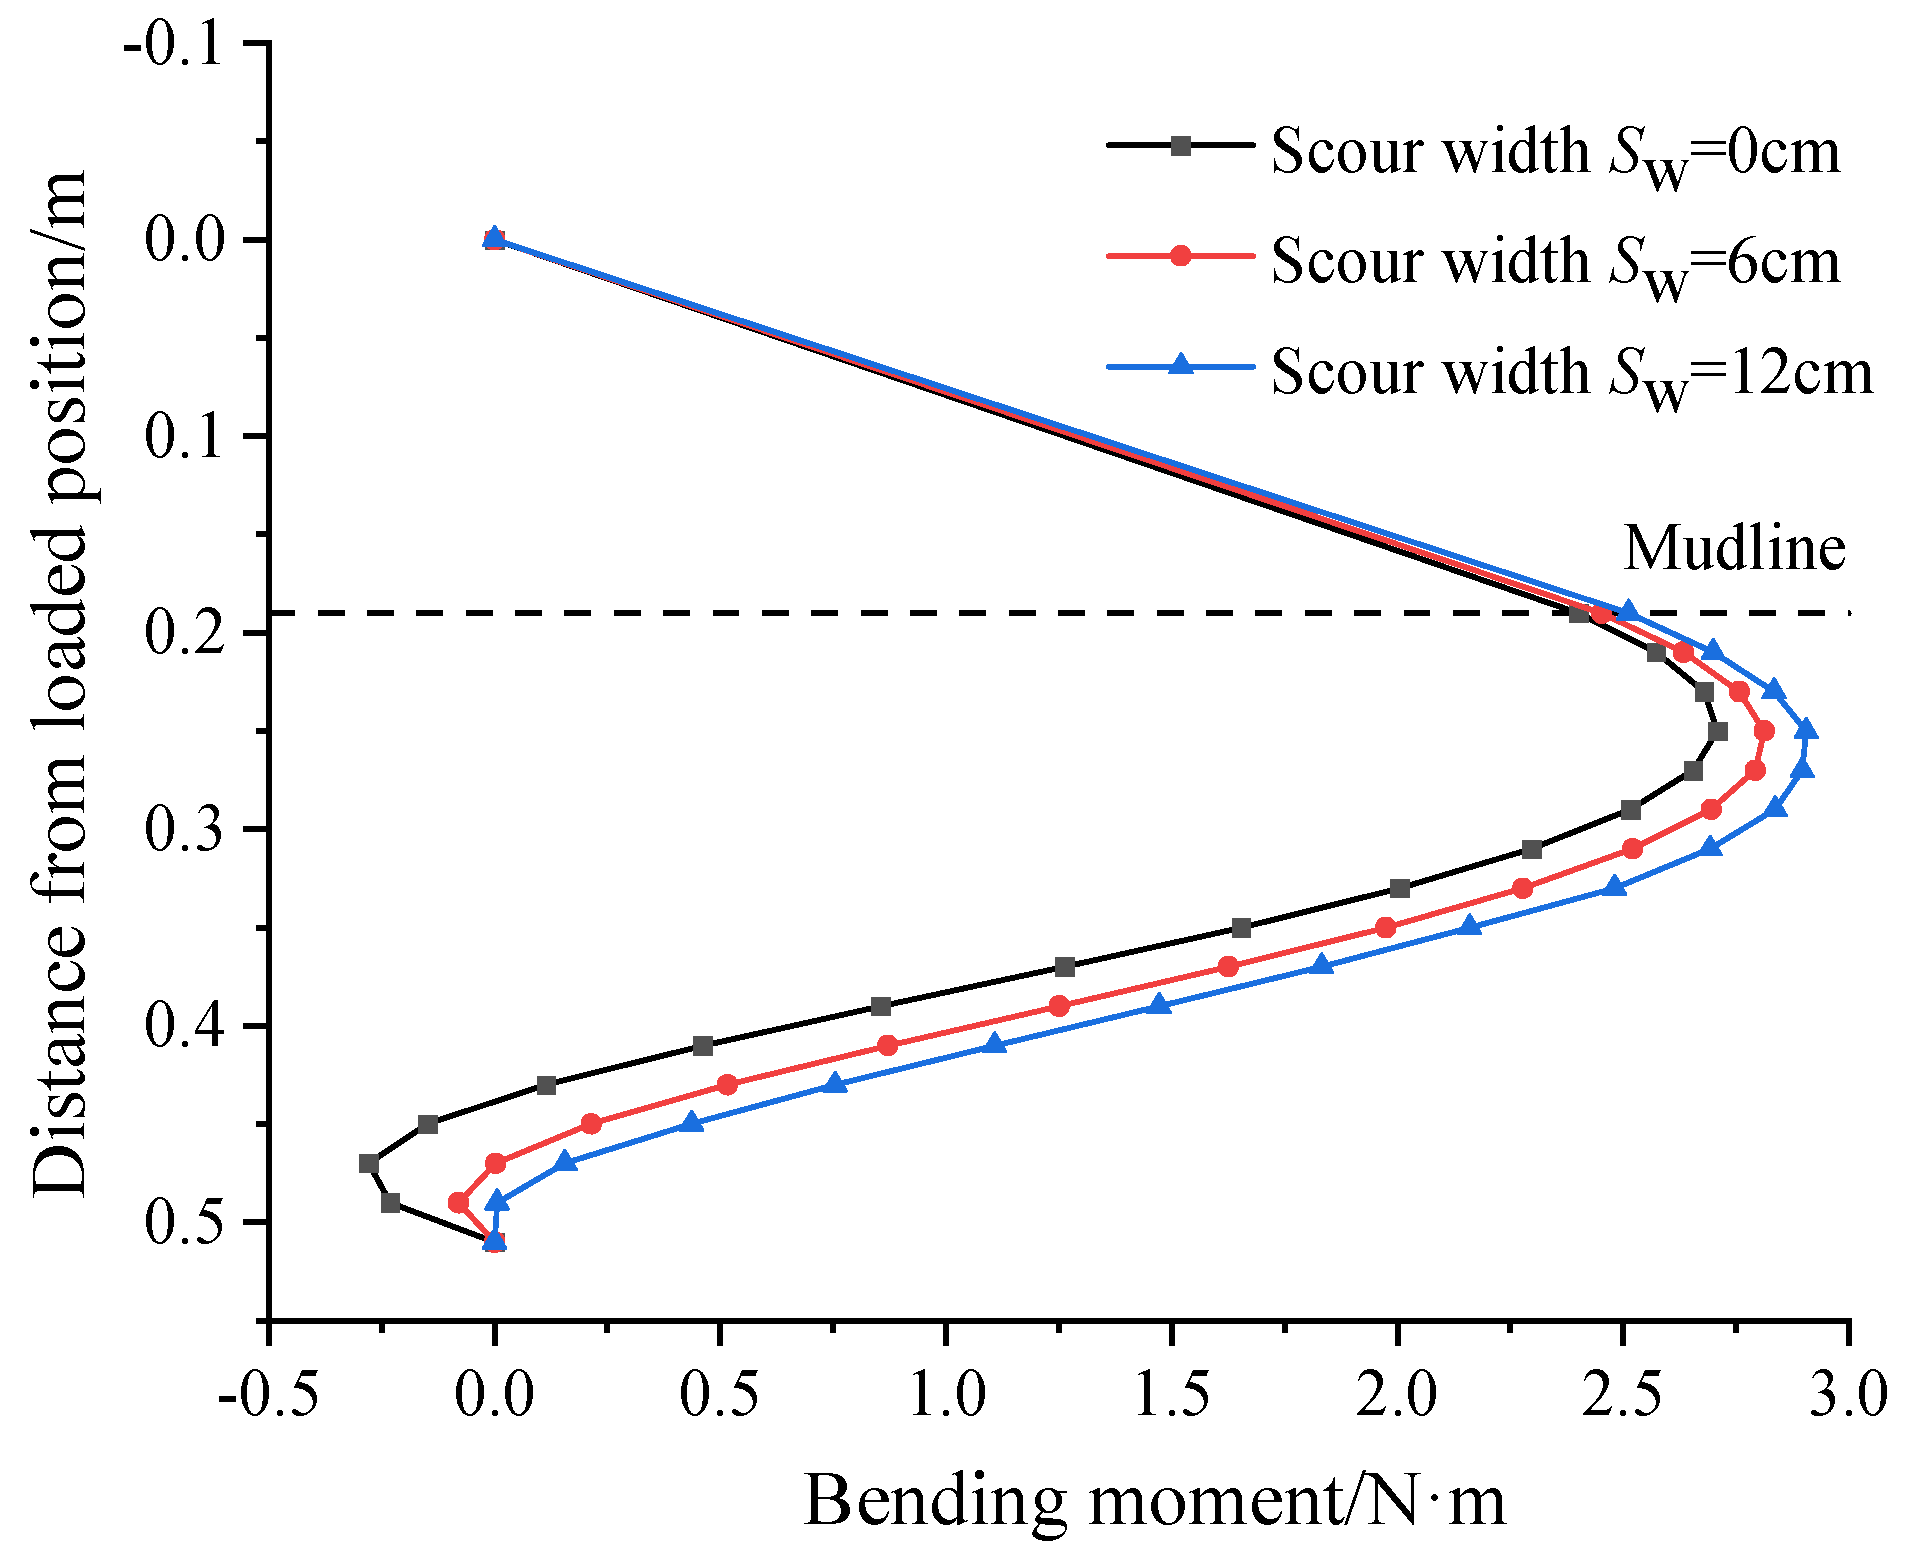
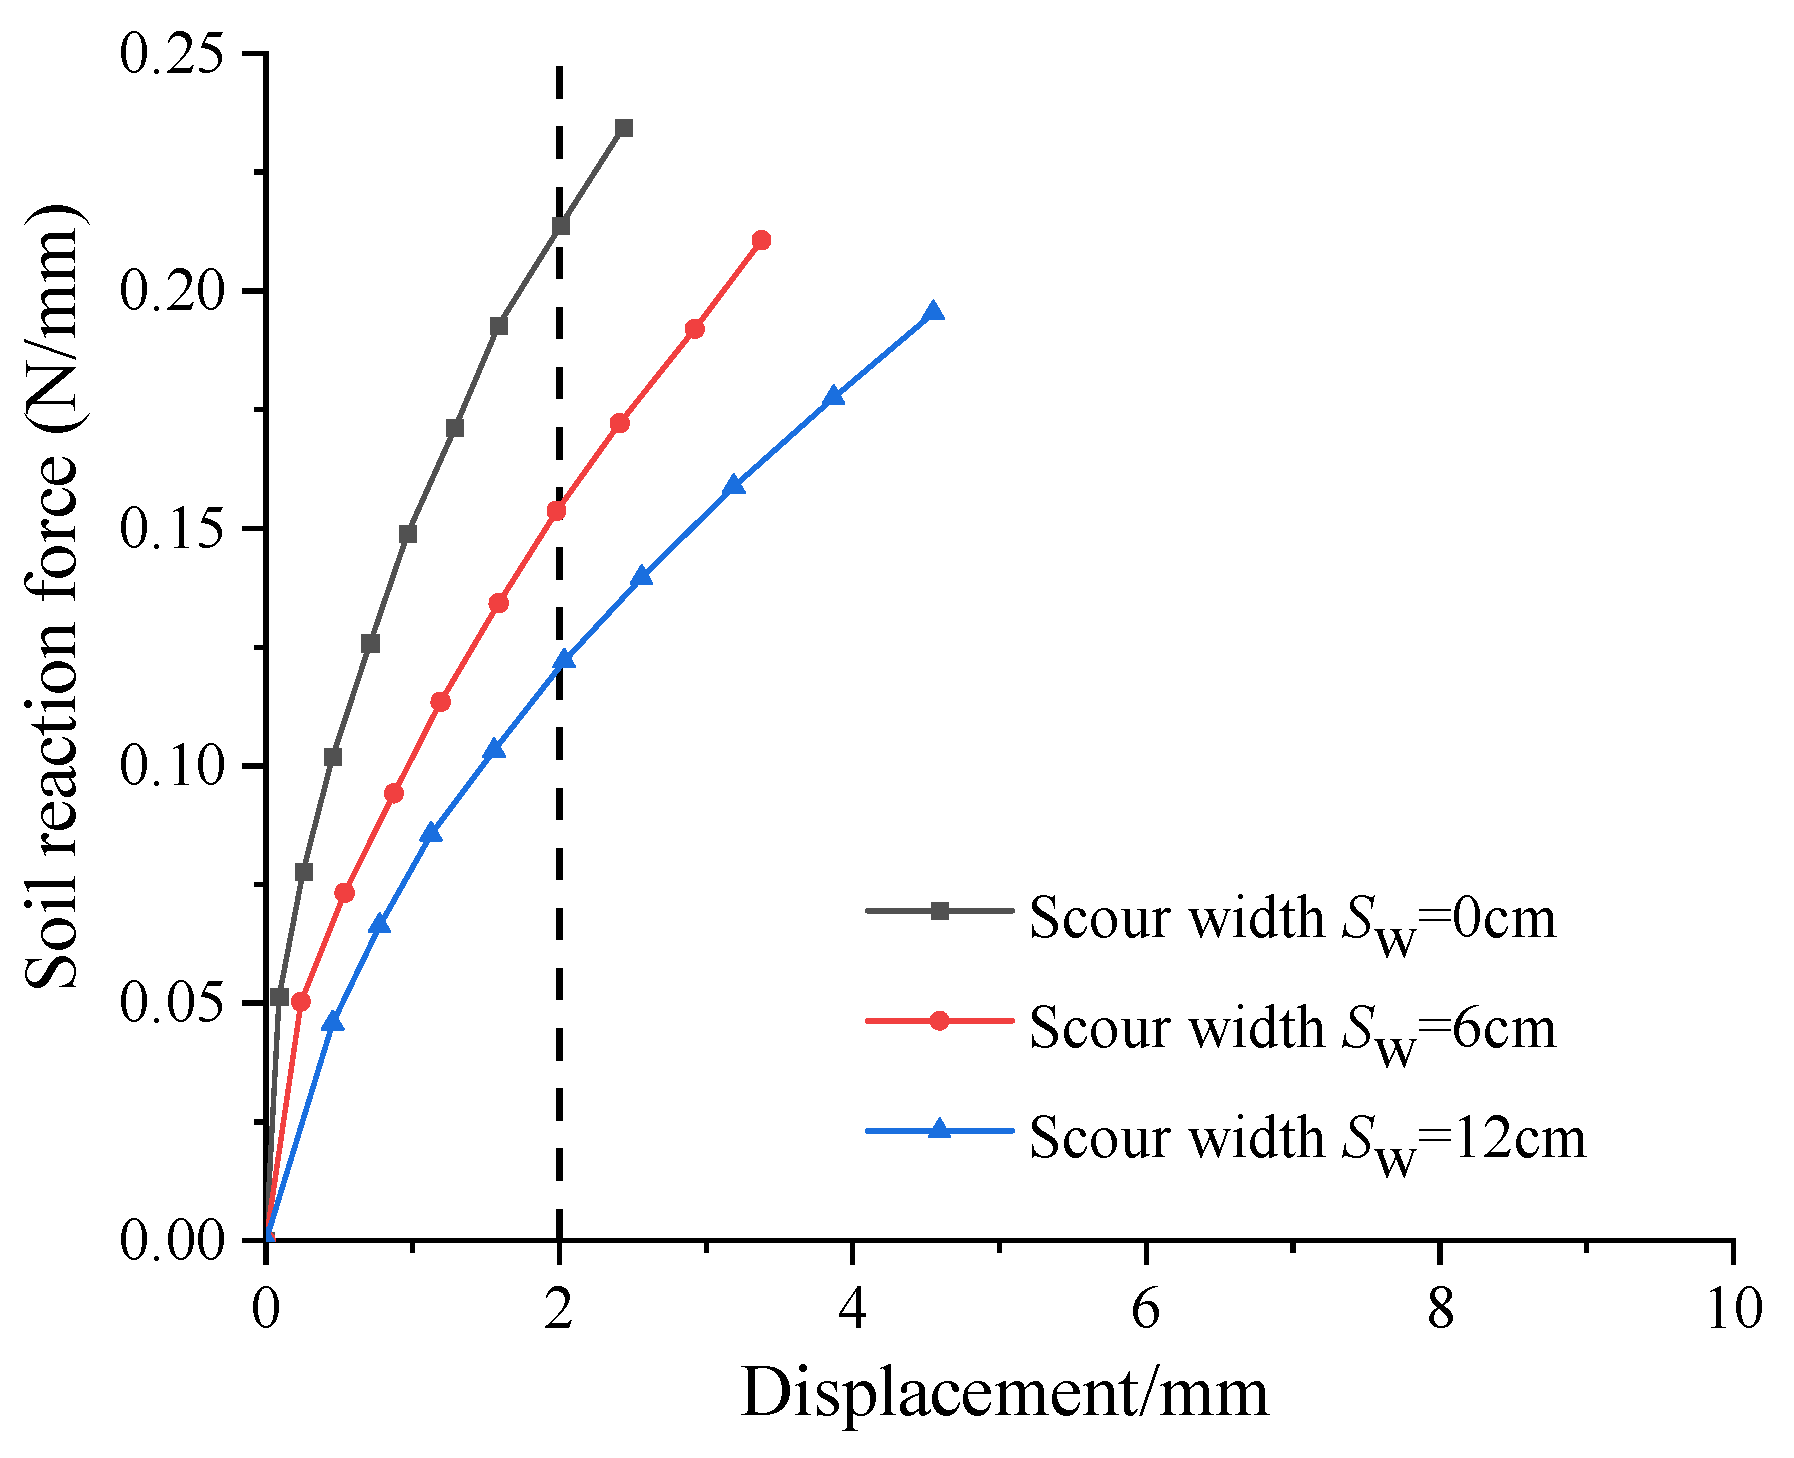
3.3. The Effect of Scour Width
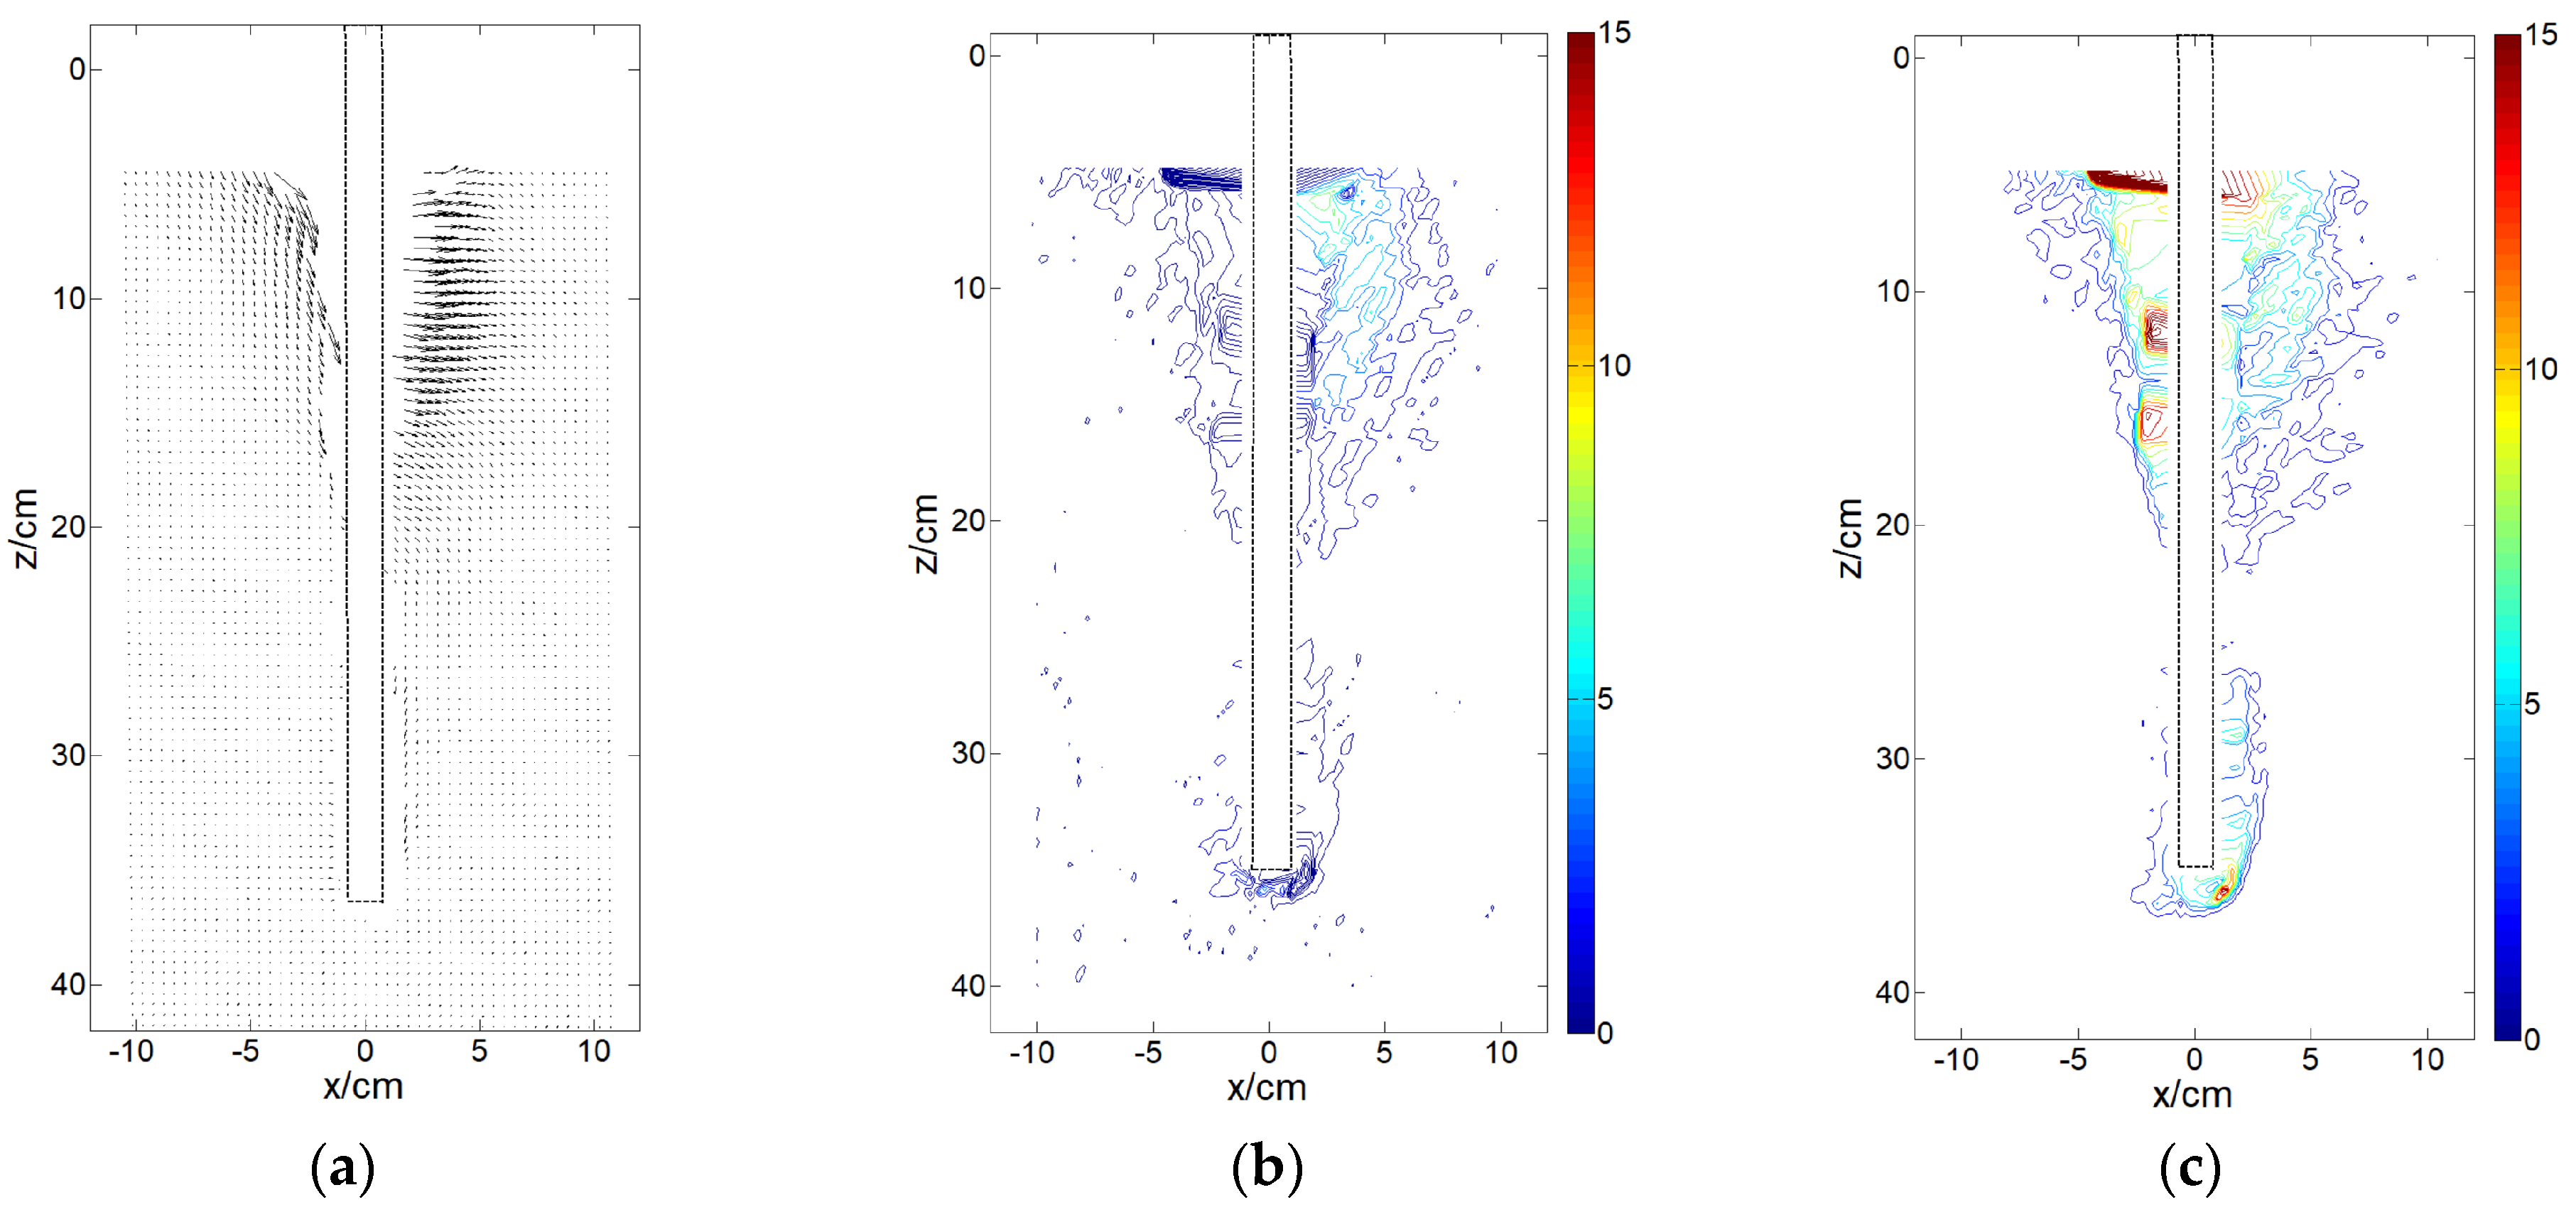
Figure 15 illustrates load-displacement curves for different scour widths. The displacement at the loading point of the pile increases with the increase of scour width, causing the lateral bearing capacity of the pile to continuously decrease. When the lateral load is 12.54 N, the displacement at the loading point of the pile with a scour width of 0 cm is 12.03 mm. When the scour widths are 6 cm and 12 cm, the corresponding displacements are 17.2% and 32.95% larger than that for the scour width of 0 cm, respectively. Meanwhile, compared to other scour factors such as depth and slope, the scour width has a lesser effect on the increased amplitude of the displacement.
Figure 16 shows the bending moment distribution curve for different scour widths under a lateral load of 12.54 N. The bending moment of the pile increases with the increase of scour width under the same lateral load. For example, the maximum bending moment is 2.70 N·m when the scour width is 0 cm. The maximum bending moments for Sw = 6 cm and Sw = 12 cm are 2.81 N·m and 2.91 N·m, respectively, which are 4.07% and 7.40% larger than that for the scour width of 0 cm.
Figure 17 shows the p-y curves at 4D below the surface for different scour widths. When the lateral displacement is 2 mm, the soil reaction forces (p) are 0.12 N/mm, 0.153 N/mm, and 0.214 N/mm for scour widths of 12 cm, 6 cm, and 0 cm, respectively. The main reason is that a larger scour width results in more soil loss, which reduces the soil reaction force.

3.4. PIV Analysis

The GeoPIV program was used to visually analyze the movement of the pile and soil during the experiment. Displacement vector, positive strain, and shear strain contour field maps under scour conditions were obtained. The unit of the color legend in the strain contour map is percentage (%), with strain values ranging from 0% to 15%.
Figure 18 shows the deformation field of the pile and soil without scour. As seen in the figure, soil deformation gradually develops and changes from near to far, from the shallow layer to the bottom layer. With the increase of lateral load, the soil on the right side of the pile axis is passively squeezed, while the soil on the left side collapses and slides. Soil deformation mainly occurs in the middle and upper layers, with minimal deformation at the bottom of the pile, exhibiting characteristics of flexible piles. The soil deformation primarily occurs within a 4D (where D is the pile diameter) range to the right and left of the pile.
Figure 19 shows the displacement vector, positive strain contour, and shear strain contour under general scour. It illustrates that when the lateral force is 12.54 N, the range of soil movement and stress in the deformation field significantly increases with scour depth, this is represented by an increase in the number of arrows with elongated tails, the expansion of the contour range, the color of the lines changing from blue to red, the stress rising, and the deformation of the shallow soil near the pile becomes more pronounced. This indicates that scour depth is crucial to the deformation of the pile and soil. The increase of general scour depth is equivalent to a decrease in the buried depth of the pile, leading to greater pile deformation.
Figure 20 presents the strain field of soil under a scour slope of θ = 30°, which is similar to that of general scour; the soil deformation evolves progressively from near to far and from shallow to deep layers. Changing the scour depth induces intense particle movement in the soil. As the depth increases, both the magnitude and range of stress in the soil expand further. Compared to general scour, local scour has less effect on pile deformation, characterized by sparse arrows, shorter arrow tails, and a reduced strain field range.
Figure 21 shows the comparison of the deformation field under different scour slopes. It can be seen that when the lateral load is the same (F = 12.54 N), along with the further development of the scour slope, the movement of sand particles around the pile increases, the stress range expands, and the stress increases. The smaller the scour slope, the more significant the soil deformation is, and the pile exhibits more characteristics of a flexible long pile. The reason is that the scour slope decreases the mass of the soil above the surface, resulting in less restriction on the lateral movement of the pile under the same load.
Figure 22 compares the deformation field under different scour widths while keeping the scour depth Sd = 4 cm and scour slope θ = 30° unchanged. The figure shows that compared to the PIV image with a scour width of 0 cm, soil movement and deformation are more intense with a scour width of 12 cm. Soil deformation develops progressively from near to far and from shallow to deep layers. The range of the stress contour lines moves downward and spreads out. On the right side of the pile, along the positive direction of the lateral load, the soil experiences passive compression, while on the left side of the pile, the area undergoes active collapse and sliding. Additionally, no obvious rotation center is observed in the deformation field, and slight deformation occurs at the pile base.
The above study conducts some preliminary work about the effects of soil scouring on the lateral displacement, bending moment, and p-y curves of the monopile. The following limits demand that the application with caution.
The paper shows a series of static loading tests. However, in practical engineering, a monopile is subjected to lateral long-term cyclic loading, and the cyclic numbers are usually up to 108 during the lifetime. Even under the same lateral load, a monopile exhibits different response characteristics under static and cyclic loading, as the soil around the pile may be strengthened or weakened due to the effects of cyclic loading.
In this study, the soil is considered isotropic; in fact, the stress path of the sand around the pile experiences some changes due to scouring, which can result in soil anisotropy. The pile exhibits different behaviors in isotropic and anisotropic soil. In addition, the tower above the monopile foundation can be considered as a vertical load, which may reduce the lateral bearing capacity of the pile due to the P-Δ effect.
PIV technology was used to visually analyze the interaction between the pile and the surrounding soil during the experiment. Displacement vector, positive strain, and shear strain contour field maps under scour conditions were obtained in this paper. As the scour depth increases, the pile transitions from a flexible state to a rigid one, and then the pile may have a rotation center; due to technical limitations, the PIV results did not reveal the location of the pile’s rotation center. Some quantitative analysis should be conducted in the future.
Based on the PIV analysis results above, Figure 23 illustrates the lateral pile-soil movement trajectory of the model pile. When there is no scouring, the soil in zone I mainly experiences lateral and upward diagonal compression deformation, with uplift deformation occurring at the surface. Under the local scour conditions, zone I is also compressed in the direction of load application, but without significant uplift deformation at the surface; under both non-scour and local scour conditions, the pile exhibits characteristics of a flexible pile, without a distinct rotation center. However, under general scour conditions, the pile behaves as a rigid pile and has a distinct center of rotation; zones I and II experience lateral compression and oblique upward displacement, resulting in passive earth pressure on the pile, which is the most important reason to limit the deviation of the pile.

4. Conclusions

A series of model tests on a laterally loaded pile were conducted with three scour depths, three scour slopes, and two scour widths. The effects of these three scour factors on the bearing capacity of the pile and the stability of the pile-soil system are discussed. The distribution and development characteristics of lateral deformation, bending moment distribution curves, and p-y curves are analyzed. Soil displacement vectors, contours of positive strain, and shear strain are obtained and analyzed using PIV technology from a macroscopic visualization perspective. The main experimental findings are as follows:
(1)
Scour will weaken the structural stability and bearing performance of the pile foundation. In cases of both general and local scour, when the scour depth increases from 0D to 2D, the pile head displacement increases by 34% and 25%, respectively. It is recommended to avoid exposing pile foundations to a completely scoured environment in engineering practices.
(2)
Under the same lateral load, as the scour depth increases, the scour slope decreases, and the scour width increases, the maximum bending moment of the pile increases, reducing the bearing capacity of the pile foundation. The influence of scour depth, slope, and width on pile bearing stability decreases successively. The maximum bending moment of the pile increases, and the bearing capacity of the pile foundation is reduced when the scour depth increases, the scour slope decreases, or the scour width increases.
(3)
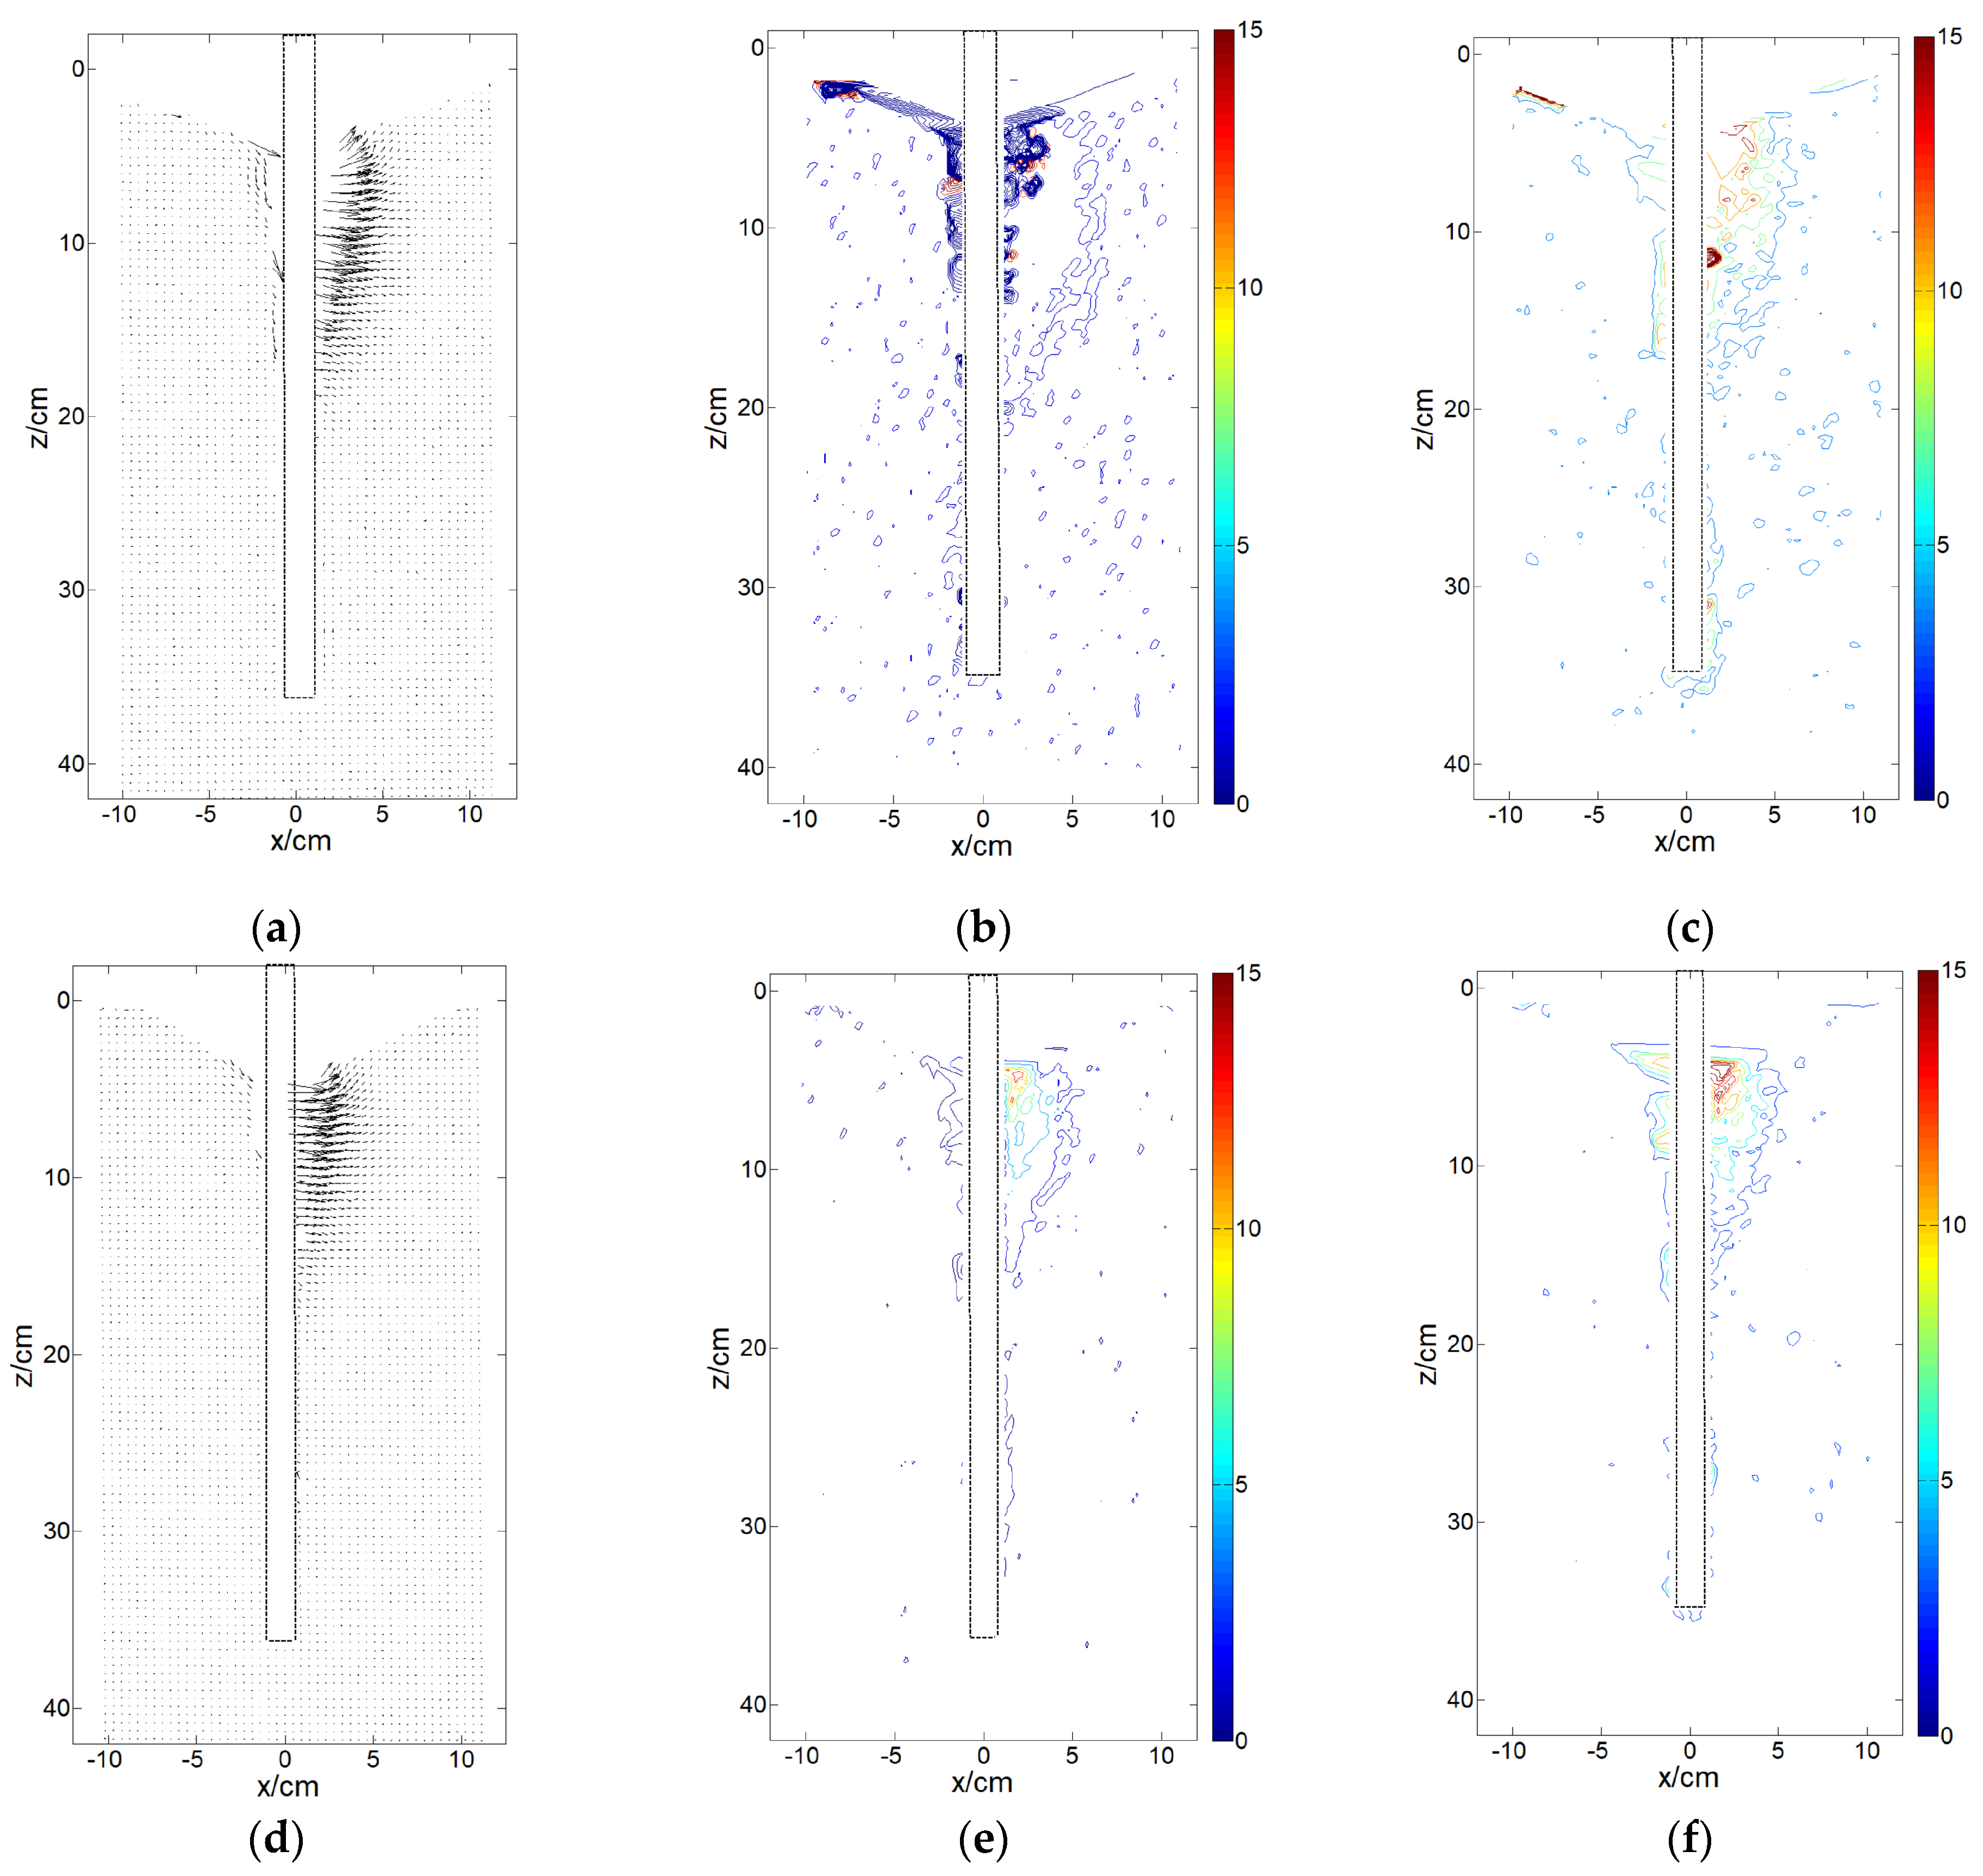
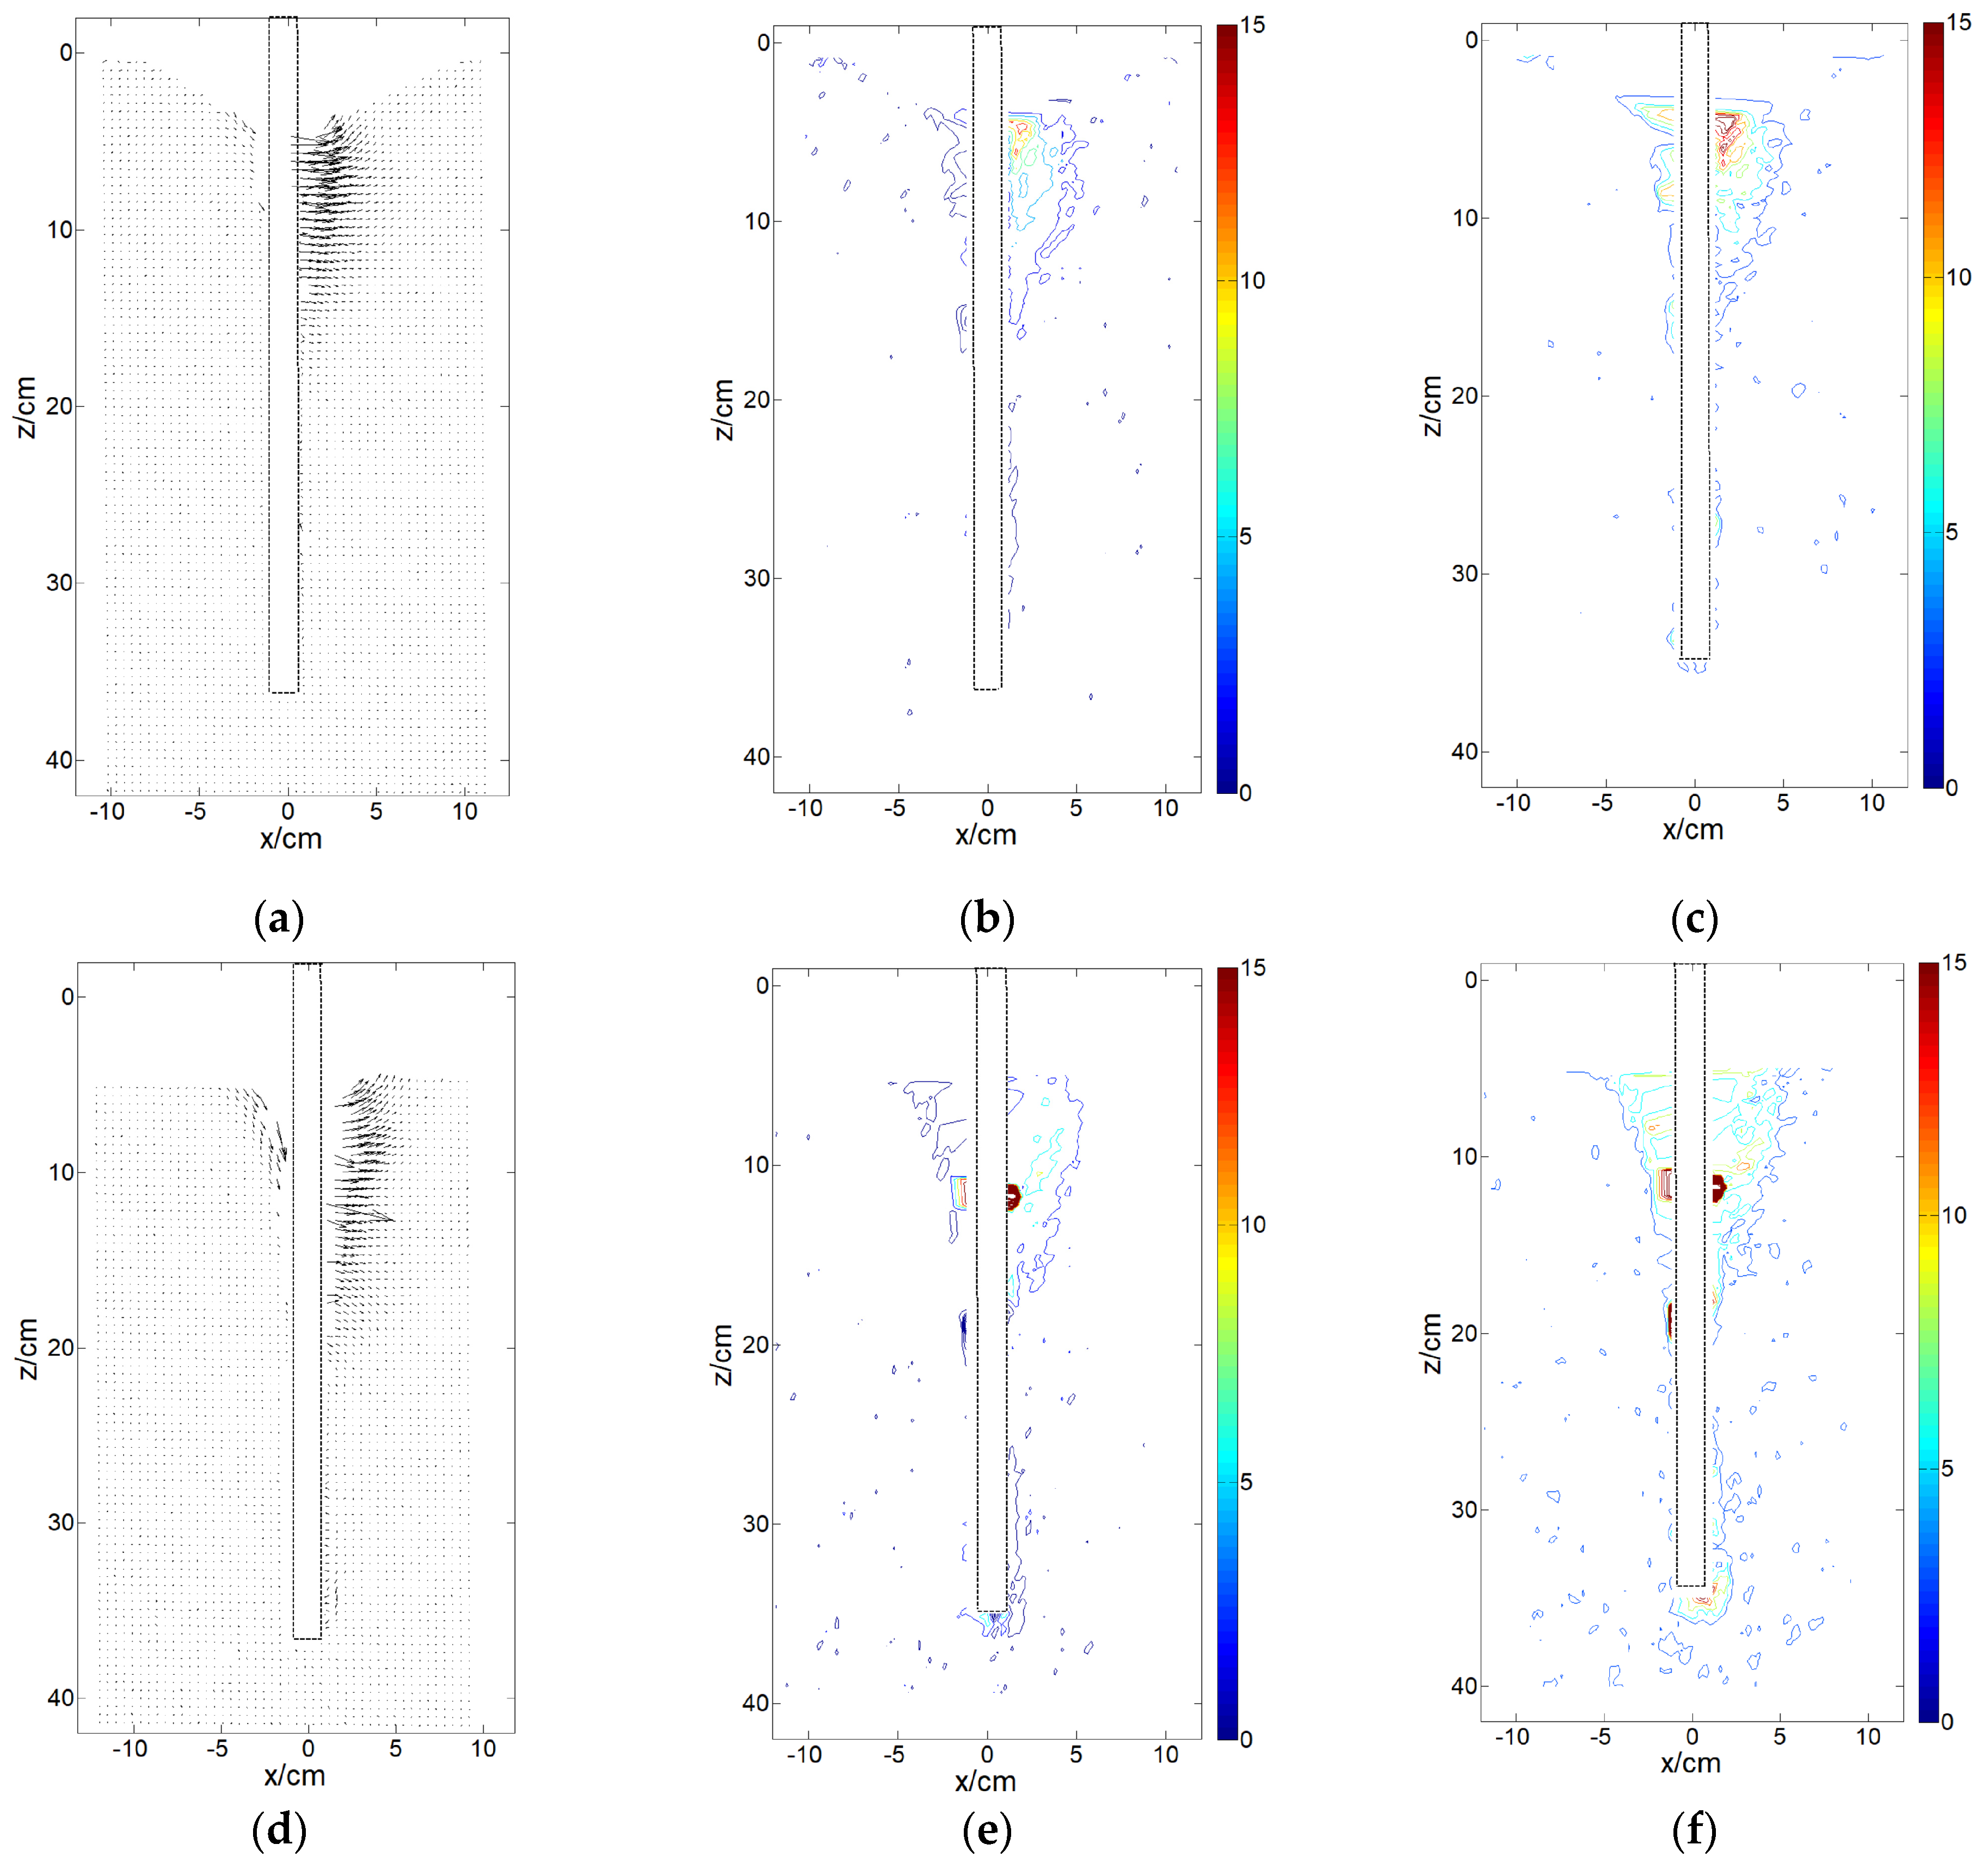
All PIV images indicate that regardless of changes in scour factors, soil deformation progresses from near to far and from the shallow layer to the bottom layer. As the lateral load on the pile head increases, soil displacements and strains in the passive zone in front of the pile develop gradually in both radial and vertical directions. The soil deformation is primarily observed in the middle and upper soil layers, with minimal deformation at the bottom of the pile. There is no distinct rotation center during the movement of the pile, which overall exhibits the characteristics of a flexible pile.

Author Contributions

Writing—original draft preparation, methodology, data curation, validation, F.Y.; writing—reviewing and editing, investigation, software, X.Y.; investigation, Z.Y. and Y.M. All authors have read and agreed to the published version of the manuscript.

Funding

This research was funded by the Natural Science Research Project of Anhui Educational Committee (Grant No. 2024AH050353).

Data Availability Statement

Data are contained within the article.

Acknowledgments

The authors would like to acknowledge Anhui University of Science and Technology.

Conflicts of Interest

The authors declare no conflict of interest.

References

  1. Liu, Q.; Lei, X.; Lai, Y.; Qin, M.; Zhang, X.; Ma, L.; Dai, K.; Yang, Y.; Bashir, M. Analysis of dynamic response of offshore wind turbines subjected to earthquake loadings and the corresponding mitigation measures: A review. Ocean. Eng. 2024, 311, 118892. [Google Scholar] [CrossRef]
  2. Sánchez, S.; López-Gutiérrez, J.S.; Negro, V.; Esteban, M.D. Foundations in Offshore Wind Farms: Evolution, Characteristics and Range of Use. Analysis of Main Dimensional Parameters in Monopile Foundations. J. Mar. Sci. Eng. 2019, 7, 441. [Google Scholar] [CrossRef]
  3. Ren, Z.R.; Zhen, X.W.; Jiang, Z.Y.; Gao, Z.; Li, Y.; Shi, W. Underactuated control and analysis of single blade installation using a jackup installation vessel and active tugger line force control. Mar. Struct. 2023, 88, 103338. [Google Scholar] [CrossRef]
  4. Zhang, Y.; Shi, W.; Li, D.S.; Li, X.; Duan, Y.F.; Verma, A.S. A novel framework for modeling floating offshore wind turbines based on the vector form intrinsic finite element (VFIFE) method. Ocean. Eng. 2022, 262, 112221. [Google Scholar] [CrossRef]
  5. Wang, X.F.; Zeng, X.W.; Li, J.L.; Yang, X.; Wang, H.J. A review on recent advancements of substructures for offshore wind turbines. Energy Convers. Manag. 2018, 158, 103–119. [Google Scholar] [CrossRef]
  6. Doherty, P.; Gavin, K. Laterally loaded monopile design for offshore wind farms. Proc. Inst. Civ. Eng. Energy. 2012, 165, 7–17. [Google Scholar] [CrossRef]
  7. Albiker, J.; Achmus, M.; Frick, D.; Flindt, F. 1 g model tests on the displacement accumulation of large-diameter piles under cyclic lateral loading. Geotech. Test. J. 2017, 40, 173–184. [Google Scholar] [CrossRef]
  8. Achmus, M.; Kuo, Y.S.; Abdel-Rahman, K. Numerical investigation of scour effect on lateral resistance of windfarm monopiles. In Proceedings of the Twentieth International Offshore and Polar Engineering Conference, Beijing, China, 20–25 June 2010. [Google Scholar]
  9. Liang, F.; Zhang, H.; Chen, S. Effect of vertical load on the lateral response of offshore piles considering scour-hole geometry and stress history in marine clay. Ocean. Eng. 2018, 158, 64–77. [Google Scholar] [CrossRef]
  10. Yu, F.; Zhang, C.R.; Huang, M.S.; Yang, X.F.; Yao, Z.M. Scouring effects on lateral cyclic responses of piles in sand. Eur. J. Environ. Civ. Eng. 2023, 27, 1941–1956. [Google Scholar] [CrossRef]
  11. Zhang, C.R.; Zhang, X.; Huang, M.S.; Tang, H.W. Responses of caisson-piles foundations to long-term cyclic lateral load and scouring. Soil Dyn. Earthq. Eng. 2019, 119, 62–74. [Google Scholar] [CrossRef]
  12. Lin, C.; Han, J.; Bennett, C.; Parsons, R.L. Analysis of laterally loaded piles in sand considering scour hole dimensions. J. Geotech. Geoenviron. Eng. 2014, 140, 04014024. [Google Scholar] [CrossRef]
  13. Yang, X.F.; Zhang, C.R.; Huang, M.S.; Yuan, J.Y. Lateral Loading of a Pile using Strain Wedge Model and Its Application under Scouring. Mar. Georesour. Geotech. 2018, 36, 340–350. [Google Scholar] [CrossRef]
  14. Qi, W.G.; Gao, F.P.; Randolph, M.F.; Lehane, B.M. Scour effects on p–y curves for shallowly embedded piles in sand. Géotechnique 2016, 66, 648–660. [Google Scholar] [CrossRef]
  15. Tong, L.; Zhou, H.; Sheil, B.; Liu, H.L.; Chen, R.L. Full-field internal 3D deformations measurement of transparent soil using 3D-DIC combined with optical slicing. Acta. Geotech. 2024, 19, 1627–1648. [Google Scholar] [CrossRef]
  16. Wu, T.H.; Gao, Y.T.; Huang, C.F.; Zhou, Y.; Li, J.W. Mechanical Behavior of Single and Group Piles with a Low Cap Adjacent to Shield Tunneling in Composite Ground: Insights from Centrifugal Model Testing. Geotech. Geol. Eng. 2024, 42, 7451–7480. [Google Scholar] [CrossRef]
  17. Liu, C.; Tang, X.W.; Wei, H.W.; Zhao, H.H. A new spatial deformation measurement method using 3D reconstruction technology during pile penetration. KSCE J. Civ. Eng. 2021, 25, 4106–4120. [Google Scholar] [CrossRef]
  18. De-Cataldo, D.; Chen, K.; Airey, D. Three-dimensional deformations in transparent soil using fluorescent markers. Int. J. Phys. Model. Geotech. 2017, 17, 122–134. [Google Scholar] [CrossRef]
  19. Wang, Z.Y.; Xu, X.Y.; Li, Z.Q. Research on the Pile–Soil Interaction Mechanism of Micropile Groups in Transparent Soil Model Experiments. Buildings 2024, 14, 2753. [Google Scholar] [CrossRef]
  20. Yuan, B.X.; Sun, M.; Wang, Y.X.; Zhai, L.H.; Luo, Q.Z.; Zhang, X.Q. Full 3D displacement measuring system for 3D displacement field of soil around a laterally loaded pile in transparent soil. Int. J. Geomech. 2019, 19, 04019028. [Google Scholar] [CrossRef]
  21. Yang, Y.L.; Qi, M.L.; Li, J.Z.; Ma, X.D. Experimental study of flow field around pile groups using PIV. Exp. Therm. Fluid Sci. 2021, 120, 110223. [Google Scholar] [CrossRef]
  22. Zou, X.J.; Jiang, Y.C.; Wang, Y.K. Failure mechanism of single pile-friction footing hybrid foundation under combined V–H–M loadings by PIV experiments and FE method. Ocean. Eng. 2023, 280, 114461. [Google Scholar] [CrossRef]
  23. Bayton, S. Centrifuge Modelling of Monopiles in Sand Subject to Lateral Loading. Doctoral Dissertation, University of Sheffield, Sheffield, UK, 2020. [Google Scholar]
  24. Randolph, M.F.; Wroth, C.P. An analysis of the vertical deformation of pile groups. Geotechnique 1979, 29, 423–439. [Google Scholar] [CrossRef]
  25. White, D.J.; Take, W.A.; Bolton, M.D. Soil deformation measurement using particle image velocimetry (PIV) and photogrammetry. Geotechnique 2003, 53, 619–631. [Google Scholar] [CrossRef]
Figure 1. Particle gradation curve of sand.
Jmse 13 01125 g001
Figure 2. Model piles used in the test. (a) Position of strain gauges; (b) Photograph of strain gauges.
Jmse 13 01125 g002
Figure 3. Schematic of test loading under scour conditions.
Jmse 13 01125 g003
Figure 4. Load-displacement curves for different scour depths under general scour.
Jmse 13 01125 g004
Figure 5. Load-displacement curves for different scour depths under local erosion (θ = 30°).
Jmse 13 01125 g005
Figure 6. Curve of pile bending moment with depths under general scour. (a) Non-scour; (b) Sd = 2 cm; (c) Sd = 4 cm; (d) Sd = 6 cm.
Jmse 13 01125 g006
Figure 7. Distribution curve of pile bending moment at different scouring depths (General scour, F = 12.54 N).
Jmse 13 01125 g007
Figure 8. Distribution curve of pile bending moment at different scouring depths (local scour, F = 12.54 N).
Jmse 13 01125 g008
Figure 9. p-y curves at different depths under general scour. (a) Non-scour; (b) Sd = 2 cm; (c) Sd = 4 cm; (d) Sd = 6 cm.
Jmse 13 01125 g009
Figure 10. Normalized p-y curves at different depths under general scour. (a) Non-scour; (b) Sd = 2 cm; (c) Sd = 4 cm; (d) Sd = 6 cm.
Jmse 13 01125 g010
Figure 11. Comparison of p-y curves at different scour depths (z = 4D).
Jmse 13 01125 g011
Figure 12. Load displacement curves for different scouring slopes.
Jmse 13 01125 g012
Figure 13. Distribution curves of pile bending moment at different scour slopes (F = 12.54 N).
Jmse 13 01125 g013
Figure 14. Comparison of p-y curves at different scour slopes (z = 4D).
Jmse 13 01125 g014
Figure 15. Load displacement curves for different scour widths.
Jmse 13 01125 g015
Figure 16. Distribution curve of pile bending moment under different scour widths (F = 12.54 N).
Jmse 13 01125 g016
Figure 17. p-y curves under different scour widths (z = 4D).
Jmse 13 01125 g017
Figure 18. Deformation fields of pile-soil under non-scour condition when F = 12.54 N. (a) Displacement vectors; (b) Positive strain contours; (c) shear strain contours.
Jmse 13 01125 g018
Figure 19. Deformation fields of pile-soil under general scour when Sd = 4 cm (F = 12.54 N). (a) Displacement vectors; (b) Positive strain contours; (c) Shear strain contours.
Jmse 13 01125 g019
Figure 20. Deformation fields of pile-soil under local scour when Sd = 4 cm (F = 12.54 N). (a) Displacement vectors; (b) Positive strain contours; (c) Shear strain contours.
Jmse 13 01125 g020
Figure 21. Deformation fields of pile-soil under different scour slopes. (a) Displacement vectors (θ = 10°); (b) Positive strain contours (θ = 10°); (c) Shear strain contours (θ = 10°); (d) Displacement vectors (θ = 30°); (e) Positive strain contours (θ = 30°); (f) Shear strain contours (θ = 30°).
Jmse 13 01125 g021
Figure 22. Deformation fields of pile-soil under different scouring widths. (a) Displacement vectors (Sw = 0 cm); (b) Positive strain contours (Sw = 0 cm); (c) Shear strain contours (Sw = 0 cm); (d) Displacement vectors (Sw = 12 cm); (e) Positive strain contours (Sw = 12 cm); (f) Shear strain contours (Sw = 12 cm).
Jmse 13 01125 g022
Figure 23. Diagram of lateral pile-soil deformation under different scouring conditions. (a) Non-scour; (b) Local scour; (c) General scour.
Jmse 13 01125 g023
Table 1. Physical properties of soils.
GS (g/cm3)CuCcemaxemind50φ (°)
2.631.340.960.750.560.3933
Table 2. Test program.
NumberDiameter
D/cm
Scour Depth Sd/cmScour Slope θScour Width Sw/cmEach Weight
/g
A-12Non-scour160
A-22, 4, 60
A-32, 4, 630°0
A-4410°, 20°, 30°0
A-5430°6, 12
Disclaimer/Publisher’s Note: The statements, opinions and data contained in all publications are solely those of the individual author(s) and contributor(s) and not of MDPI and/or the editor(s). MDPI and/or the editor(s) disclaim responsibility for any injury to people or property resulting from any ideas, methods, instructions or products referred to in the content.

