Review

Challenge at the Edge: Long-Term Sea Level Rise vs. Short-Term Extreme Events

Department of Earth and Planetary Sciences, Institute of Marine Sciences, University of California Santa Cruz, Santa Cruz, CA 95064, USA
J. Mar. Sci. Eng. 2025, 13(6), 1123; https://doi.org/10.3390/jmse13061123
Submission received: 8 May 2025 / Revised: 29 May 2025 / Accepted: 29 May 2025 / Published: 4 June 2025
(This article belongs to the Section Coastal Engineering)

Abstract

California and most other coastlines around the nation and the world are being impacted by both long-term sea-level rise (SLR) and short-term extreme events. Global sea level over the last 10 years of satellite altimetry has averaged approximately 4.1 mm/yr. (~16 in./100 yrs.), although this rate is accelerating at about 1.2 mm/yr. per decade. Projections of future sea levels have now been developed by many different agencies, organizations, and committees, and cluster around 12 inches by 2050. Over the near term, however, until mid-century, and likely beyond, it will be the short-term extreme events such as hurricanes along the U.S. Atlantic and Gulf coasts, and the coincidence of very large waves and high astronomic tides along the U.S. Pacific coasts that will pose the major threat to both public infrastructure and private development.

1. Introduction

Sea level rise (SLR) has become a local, national, and global concern. The Intergovernmental Panel on Climate Change [1], relevant U.S. federal agencies (prior to 2025), as well as many coastal states and countless coastal cities and counties, have been concerned with sea level rise for a decade or more. The number of published reports and studies is very large and increasing [2] and references therein have focused on projections of future sea level at various times in the future, the impacts of an accelerating rise in sea level, and/or how we can respond or adapt to the expected changes.
Sea level rise has been an important element of each of the regular IPCC reports [3]; federal agencies have released national assessments [4]; and California, with the longest coastline and the largest population in the lower 48 states, has been updating sea level rise projections and impacts every five years [5,6,7,8] and references therein. NGOs such as the Union of Concerned Scientists have published three SLR reports [9,10,11], and there are now several popular books focused on future sea level rise and impacts as well [12,13,14,15,16], to name a few.
While tide gauges on U.S. coasts have been recording local sea level changes—at some sites since the 1850s—(https://tidesandcurrents.noaa.gov/map/, accessed on 1 March 2025), these all document the changing level of the ocean relative to the land or structure they are founded on. Thus, the values documented vary depending on whether the local coastline is rising, sinking, or relatively stable. In 1993, two satellites (Topex and Poseidon) were placed in orbit, which began to precisely measure global sea level from space. These platforms, which have been augmented by additional satellites, have now documented mean global sea level rise averaging 3.6 mm/year (±3 mm/yr.)over the entire altimeter record (1993–2025; https://www.aviso.altimetry.fr/en/data/products/ocean-indicators-products/mean-sea-level/data-acces.html, accessed on 1 March 2025). There is also clear evidence that the rate of sea level rise has accelerated over the altimeter record [17,18], and the acceleration is now estimated at 1.2 mm/yr. per decade. The average rate of rise over the past decade (2013–2024) was 4.1 mm/yr. (±0.5 mm/yr.), indicating that the rate of global sea level rise has essentially doubled from the 1993–2003 decade (2.1 ± 1 mm/yr.) (Figure 1). For a plain language comparison, 4.1 mm is about the thickness of two U.S. nickels. This is the average rate at which the sea level has been rising globally over the past ten years.
The challenge that many government agencies, committees, and task forces have taken on in recent years has been how to plan for future conditions by projecting where the sea level will be at different future time periods [4,6,7,8]. These projections or predictions are based on a combination of historic sea level trends from tide gauges and satellite altimetry, and increasingly sophisticated global climate models with inputs ranging from historic and estimated future greenhouse gas emissions, global atmosphere and ocean temperatures, thermal expansion of seawater as it continues to warm, and the rate of land ice melting, primarily on Antarctica and Greenland, through an improved understanding of ice-sheet dynamics [19,20,21].
Sweet et al. [4] provide a comprehensive summary of the importance, complexities, and challenges of projecting future sea levels (all references are listed as cited in the original report language):
Sea level rise driven by global climate change is a clear and present risk to the United States today and for the coming decades and centuries [22,23]. Sea levels will continue to rise due to the ocean’s sustained response to the warming that has already occurred—even if climate change mitigation succeeds in limiting surface air temperatures in the coming decades [3]. Tens of millions of people in the United States already live in areas at risk of coastal flooding, with more moving to the coasts every year [24]. Rising sea levels and land subsidence are combining, and will continue to combine, with other coastal flood factors, such as storm surge, wave effects, rising coastal water tables, river flows, and rainfall (Figure 1.1 in [4]), some of whose characteristics are also undergoing climate-related changes [25]. The net result will be a dramatic increase in the exposure and vulnerability of this growing population, as well as the critical infrastructure related to transportation, water, energy, trade, military readiness, and coastal ecosystems, and the supporting services they provide.
Using the state of California as an example, the most recent projections of sea level by 2050, now just 25 years away, fall within a relatively narrow range, from a low of 0.15 m (0.5 ft.) to a high of 0.36 m (1.2 ft.) [7]. By 2100, due to many uncertainties, the projected values range from a low of 0.3 m (1.0 ft.) to a high of 2.0 m (6.6 ft.) (Table 1). While one foot of additional sea level rise by 2050 will not constitute a disaster, 6.6 feet will have major destructive impacts along the state’s coast, around the U.S., and along the planet’s shorelines.
Adopting the scientific framework and approach used in the 2022 Federal Sea Level Rise Technical Report [4] and creating consistency between state and federal planning, each scenario (Table 1) is defined and labeled according to a target value of global mean sea level rise in 2100 (e.g., the Intermediate Scenario has a GMSL target of 1.0 m (3.3 ft.)). The Sea Level Scenarios are derived from the sets of probabilistic projections developed in the Intergovernmental Panel on Climate Change Sixth Assessment Report (IPCC AR6) and reflect the most up-to-date scientific understanding of the physical drivers of sea level rise. The information about the likelihood of meeting or exceeding a specific Sea Level Scenario is embedded in the scenarios themselves (e.g., the High Scenario is less likely than the Intermediate Scenario, as described in more detail in Chapter 2.0). The Sea Level Scenarios for California span the plausible range of future sea level rise under all emissions and global development futures and enable users to consider sea level rise without first selecting a single emissions future on which to base planning and projects.
In the short term, however, there are more damaging near-term shoreline issues of concern than the 4.1 mm/yr. of sea level rise over the past decade, or even the approximately 12 inches of sea level rise projected by 2050. Along the Atlantic and Gulf coasts, tropical storms and hurricanes will be far more devastating. Superstorm Sandy in 2012, for example, impacted 24 states and caused an estimated $70.2 billion in damage. The highest storm surge during this event was at Kings Point, New York, and reached 3.86 m (12.65 ft.) above tidal prediction [26]. The NOAA tide gauge at Kings Point has recorded an average sea level rise rate of 2.74 mm/yr. over its 94-year history, the equivalent of 0.27 m (10.8 in.) per 100 years.
Hurricane Katrina in 2005 produced damages exceeding $108 billion and led to over 1800 deaths. A storm surge ranging from 3 to 8.6 m (10–28 feet) impacted much of the coastal areas across southeast Louisiana and coastal Mississippi. The highest water level above the predicted astronomical tide was 3.5 m (11.4 ft.) at Ocean Springs, Mississippi, although the sensor ceased transmission at this point. The closest NOAA tide gauge to Ocean Springs is at Bay Waveland Yacht Club, Mississippi, where the average rate of sea level rise over the 46 years of record is 4.72 mm/yr. or 0.47 m (1.55 ft.) per century.

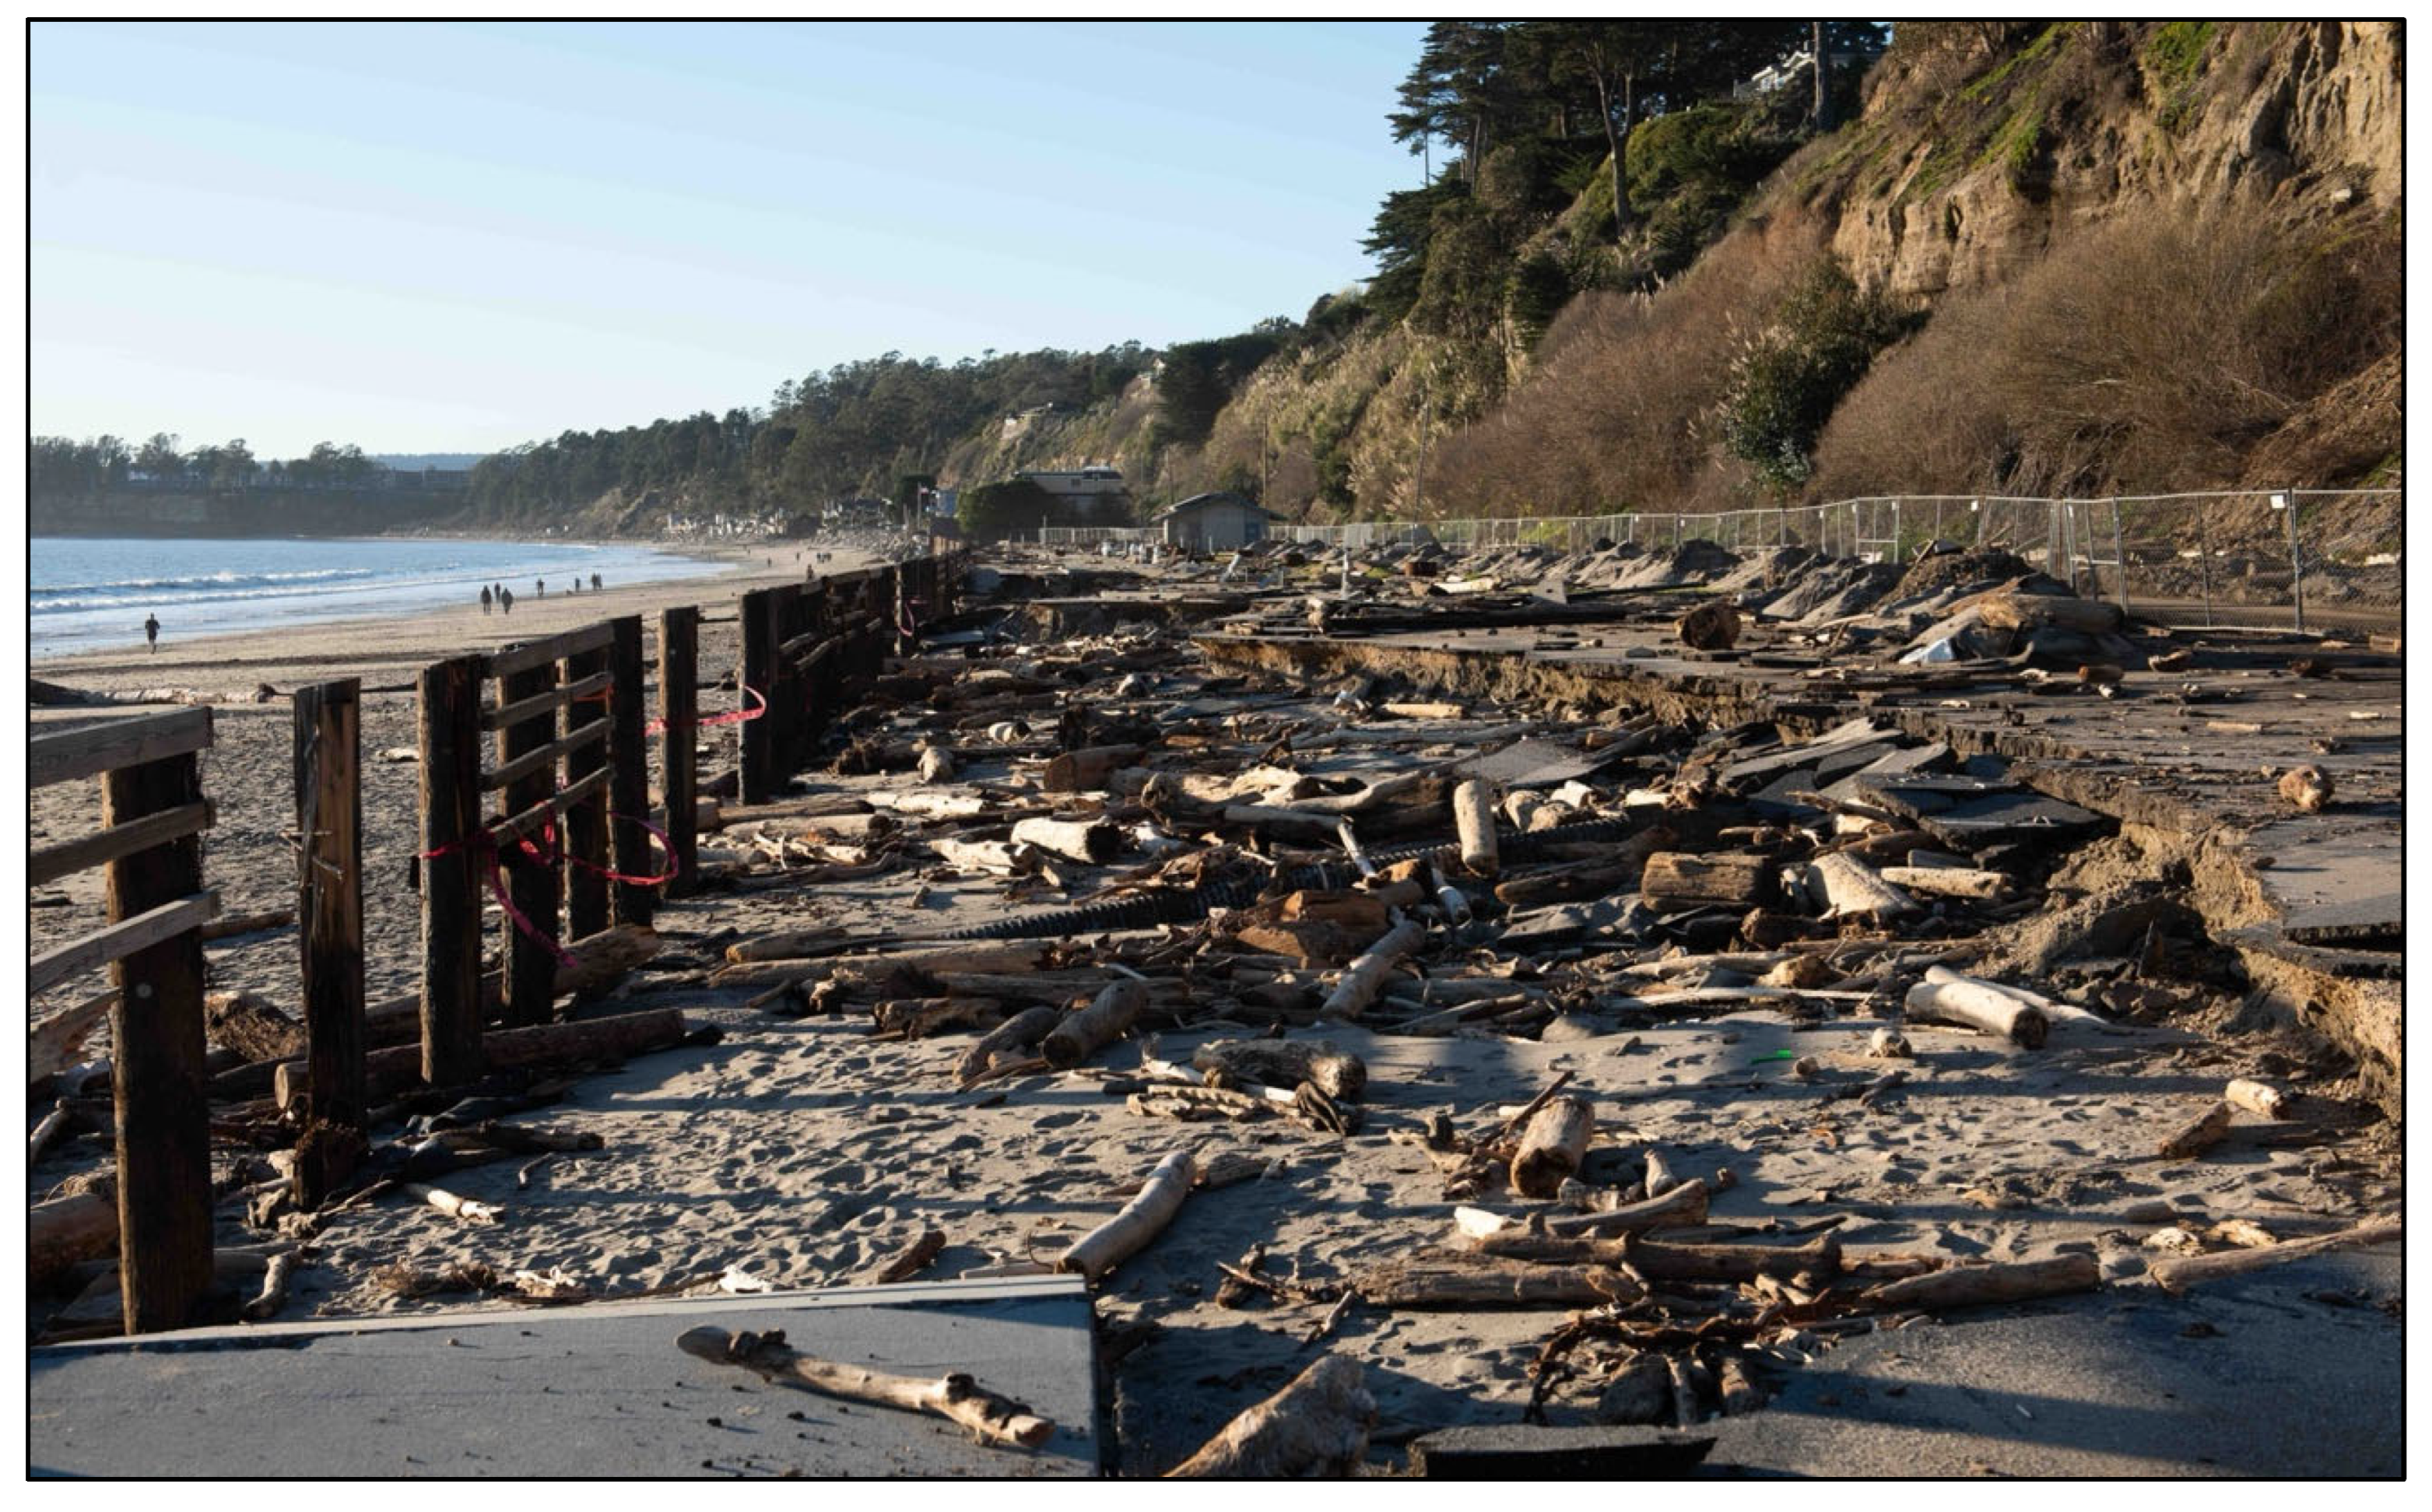
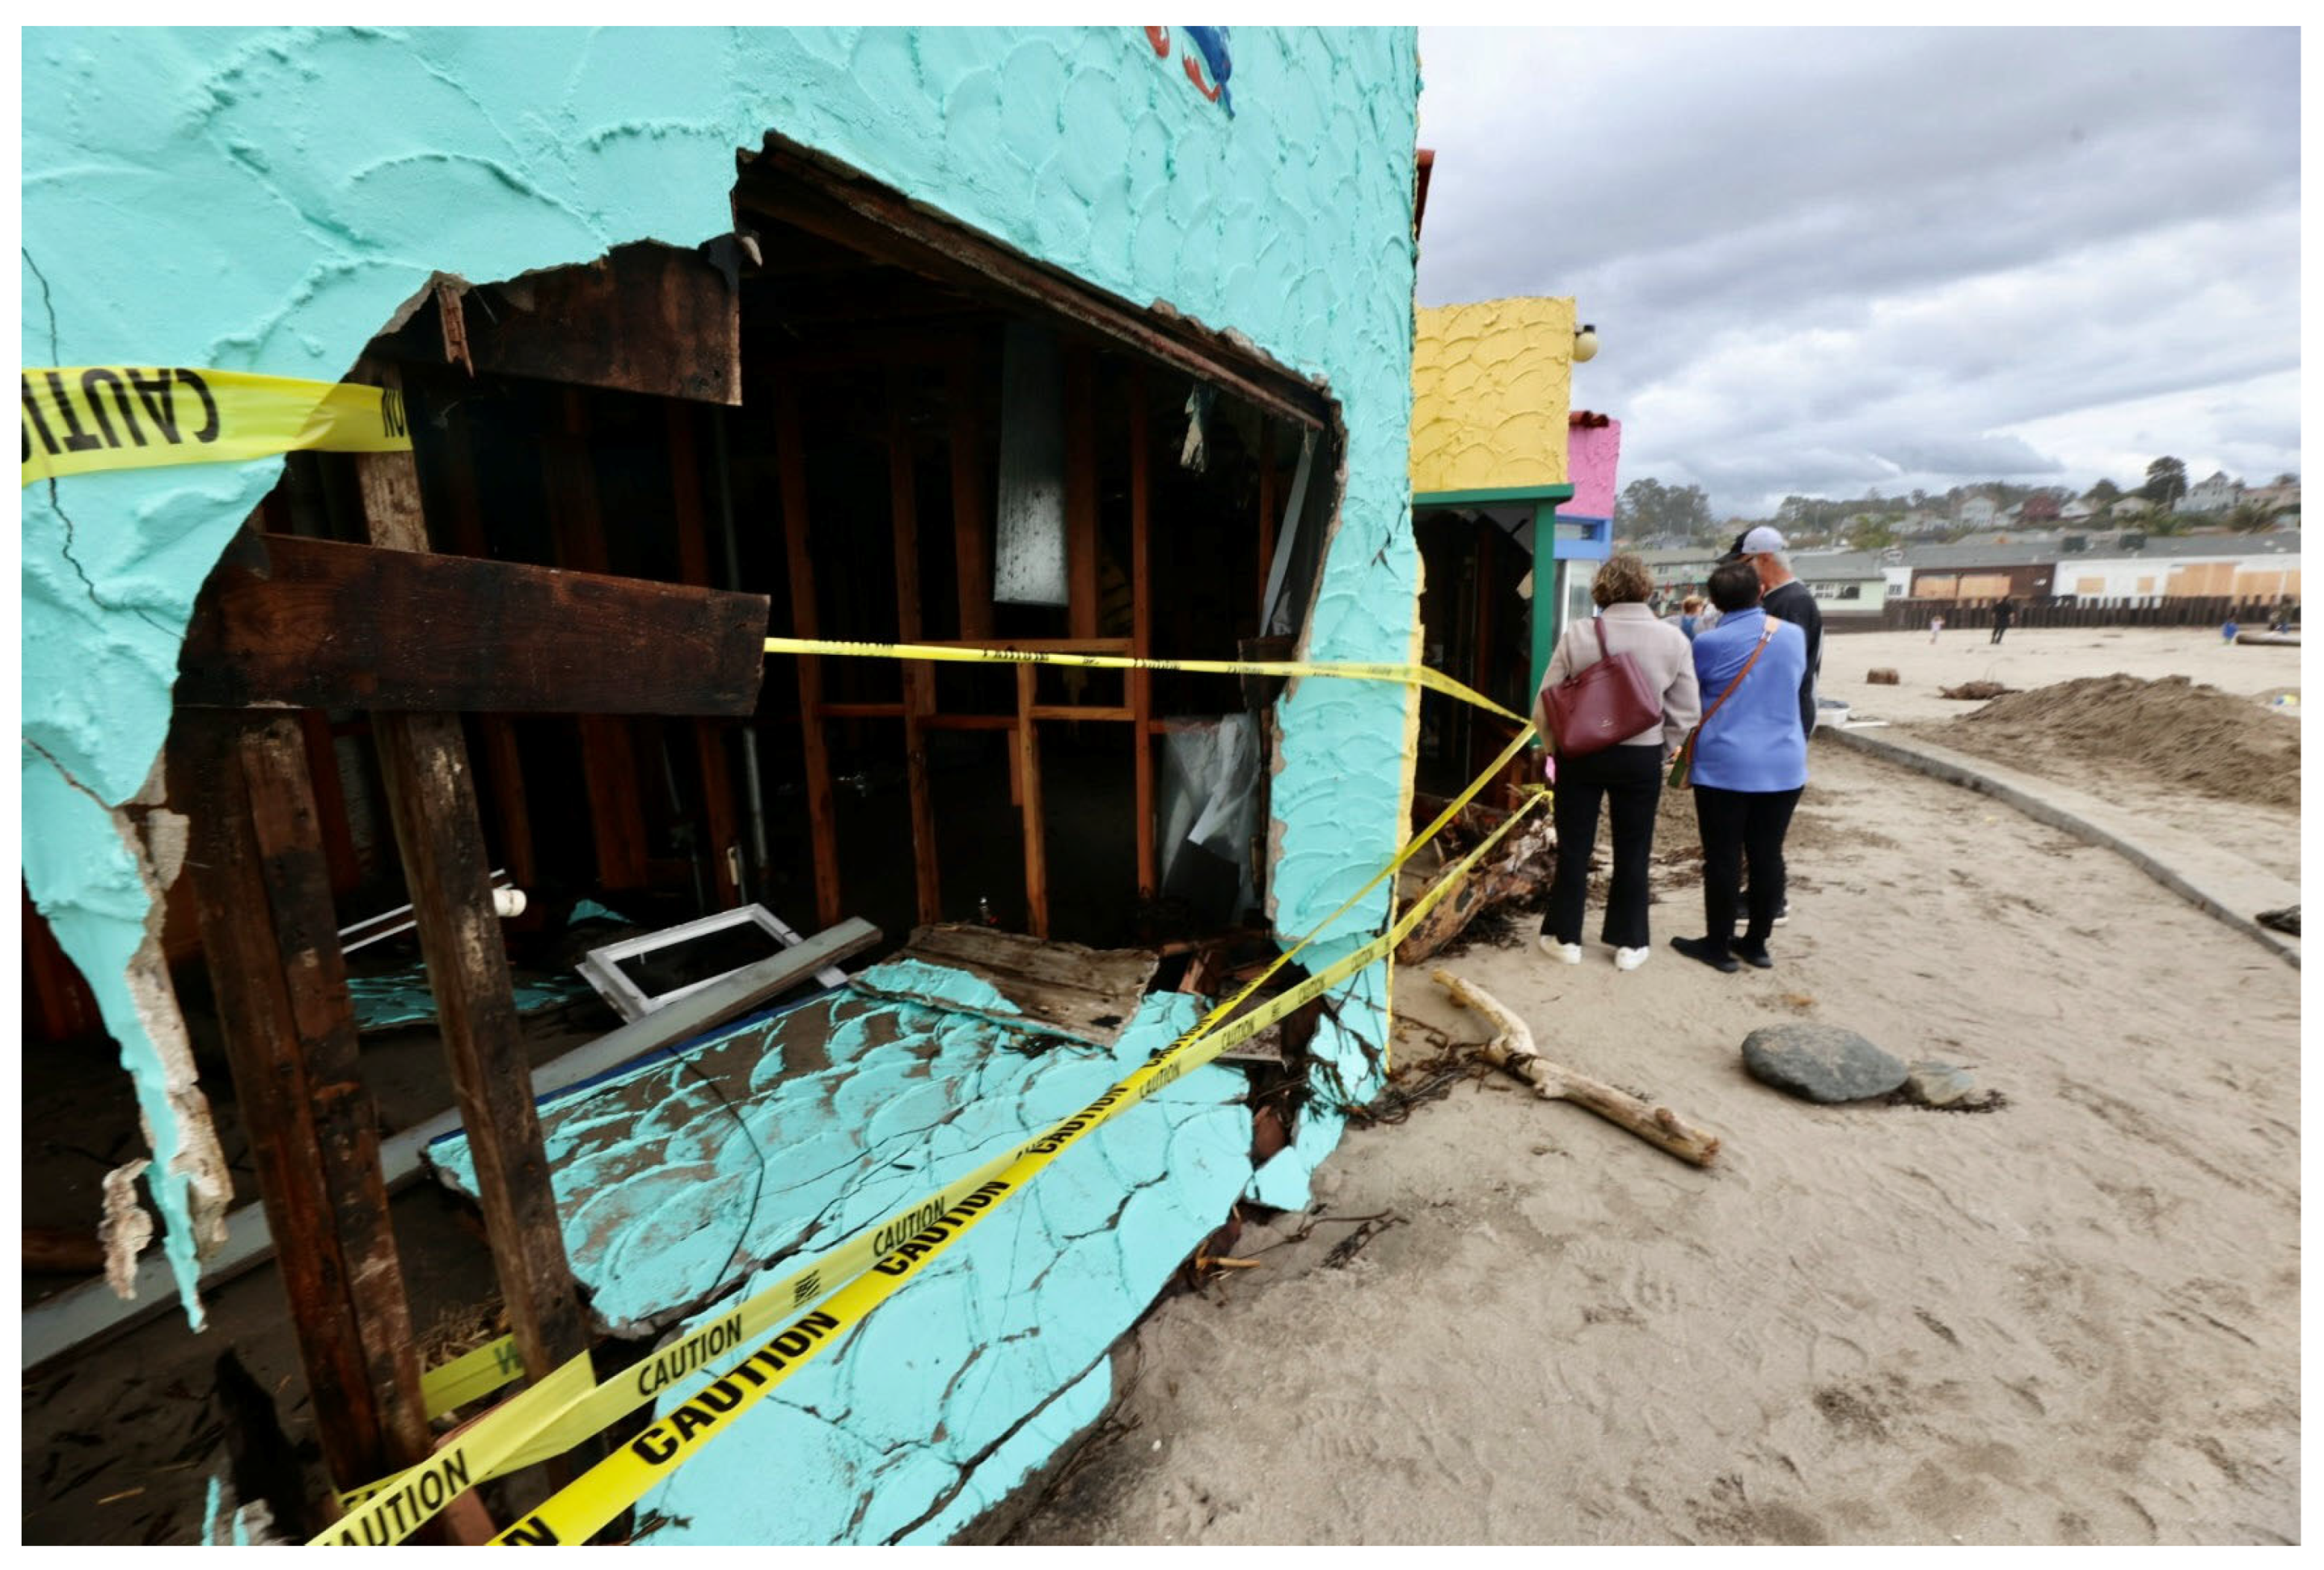
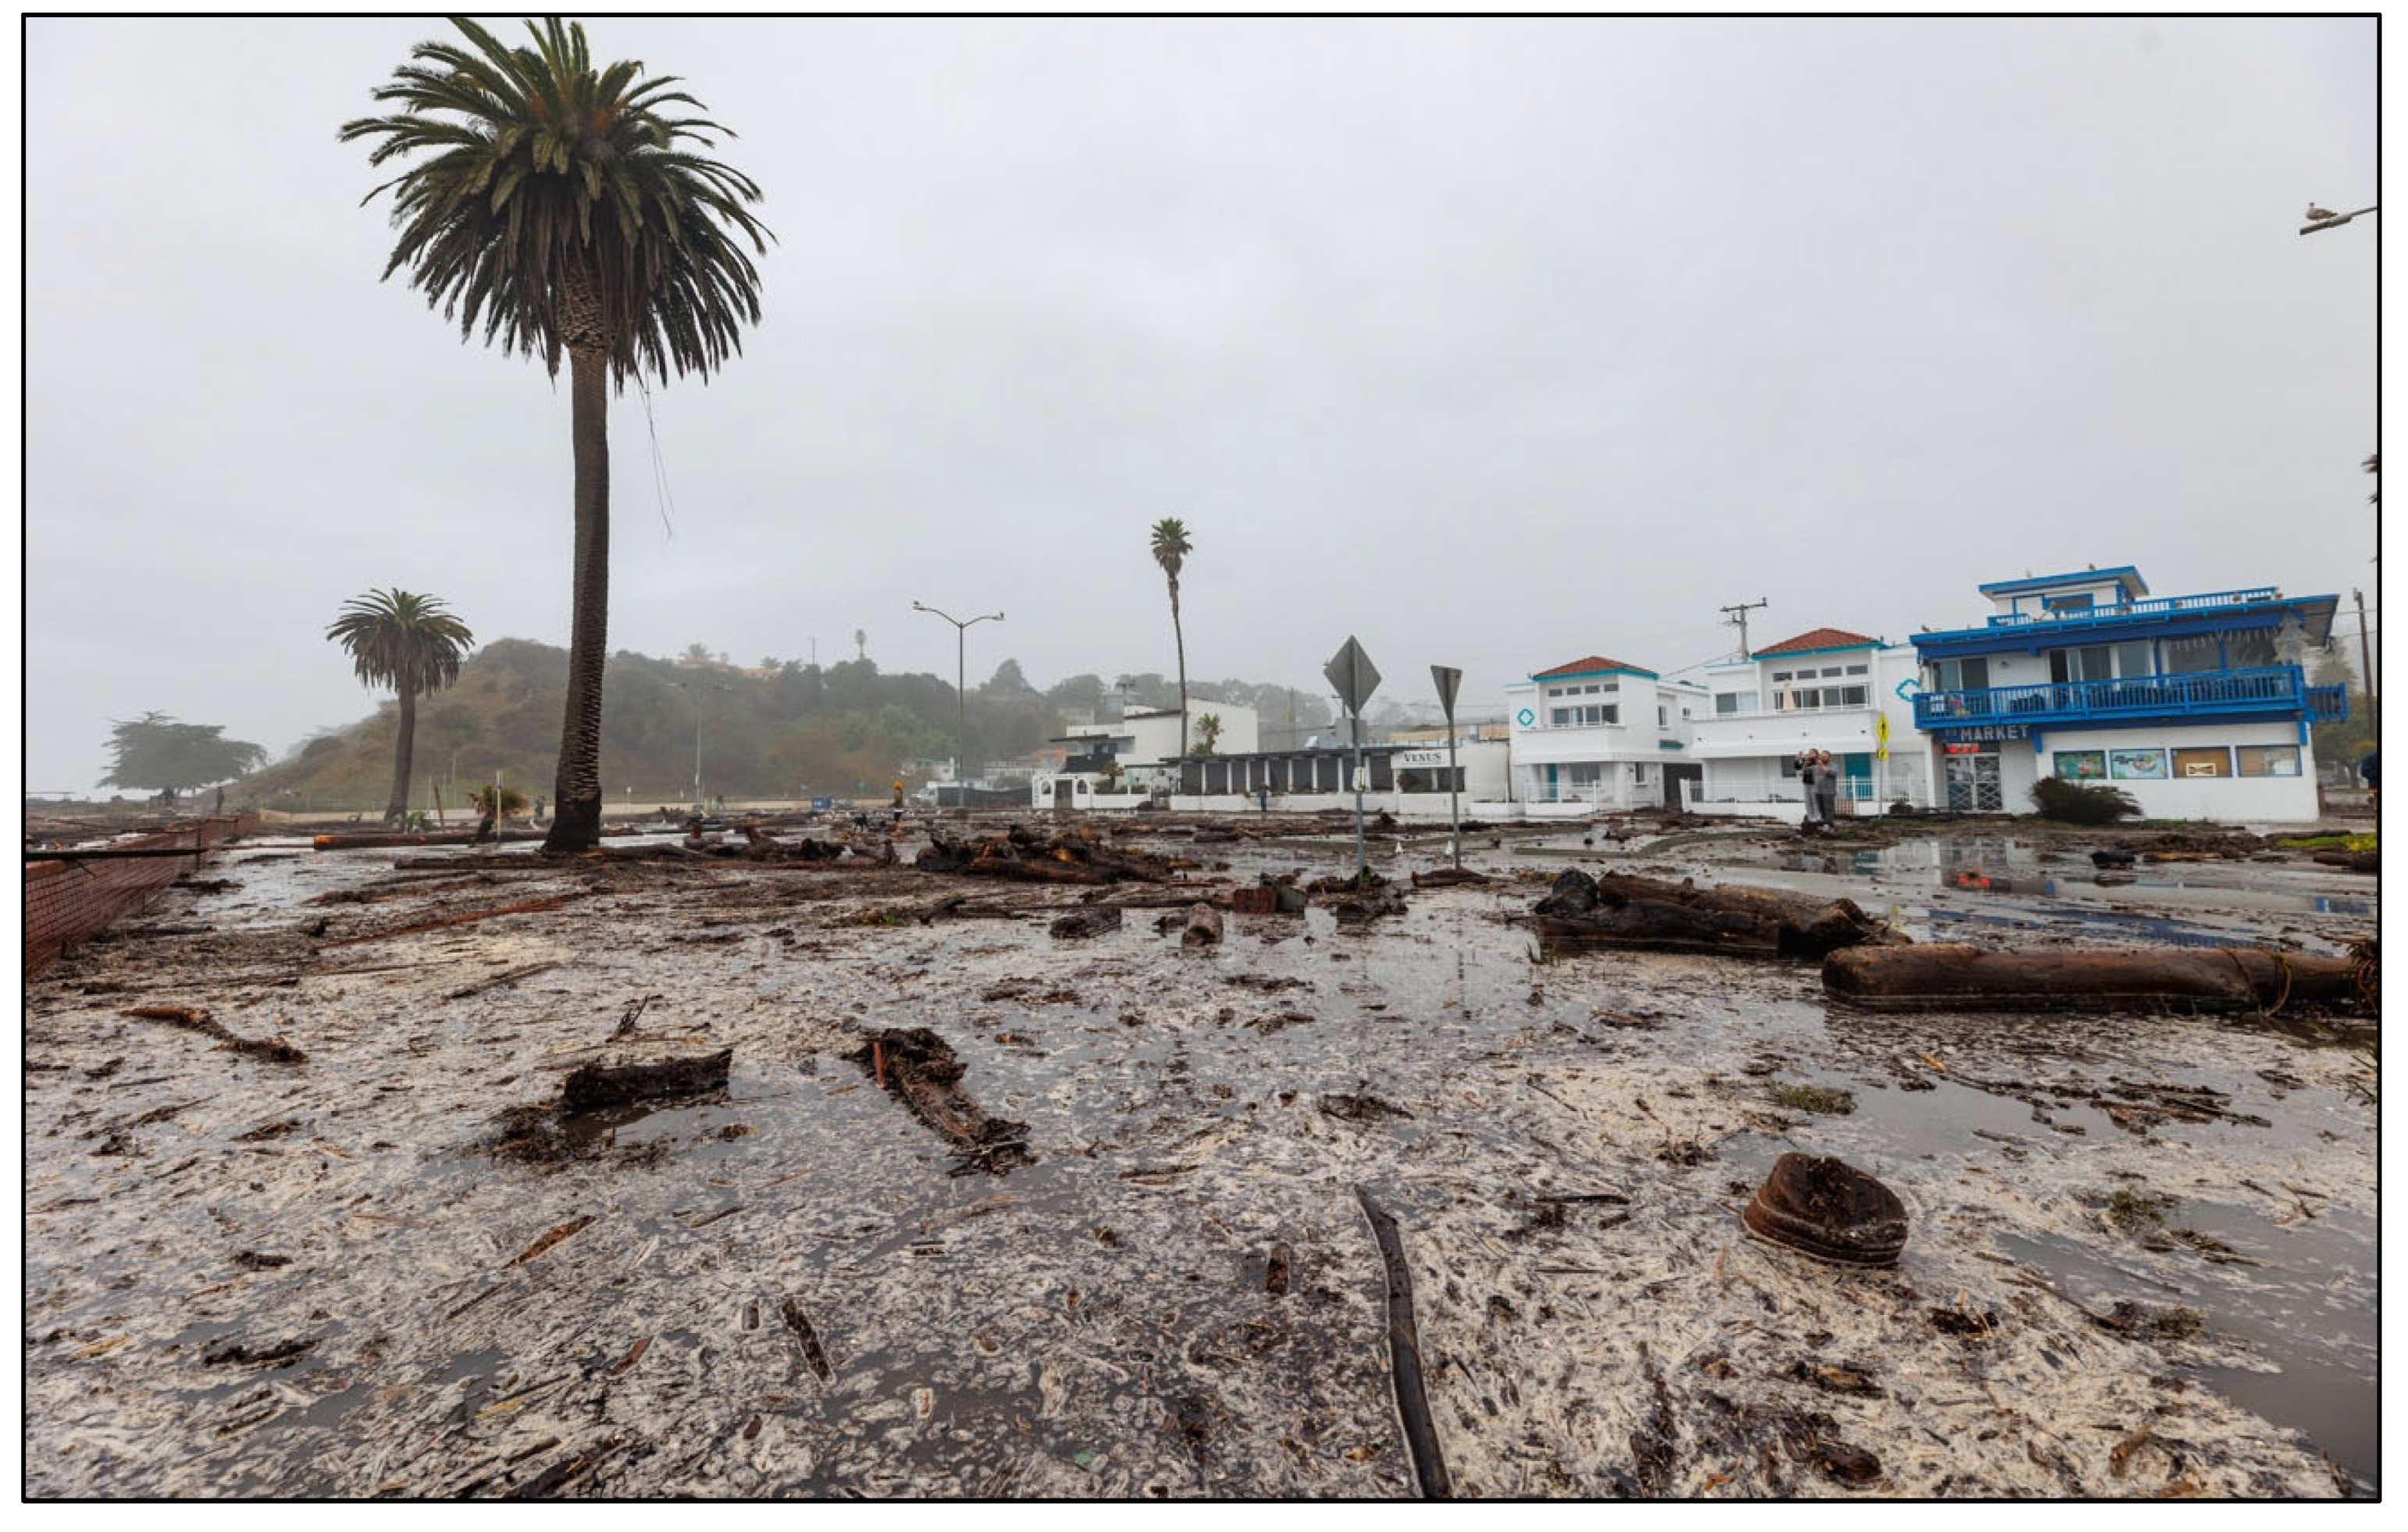
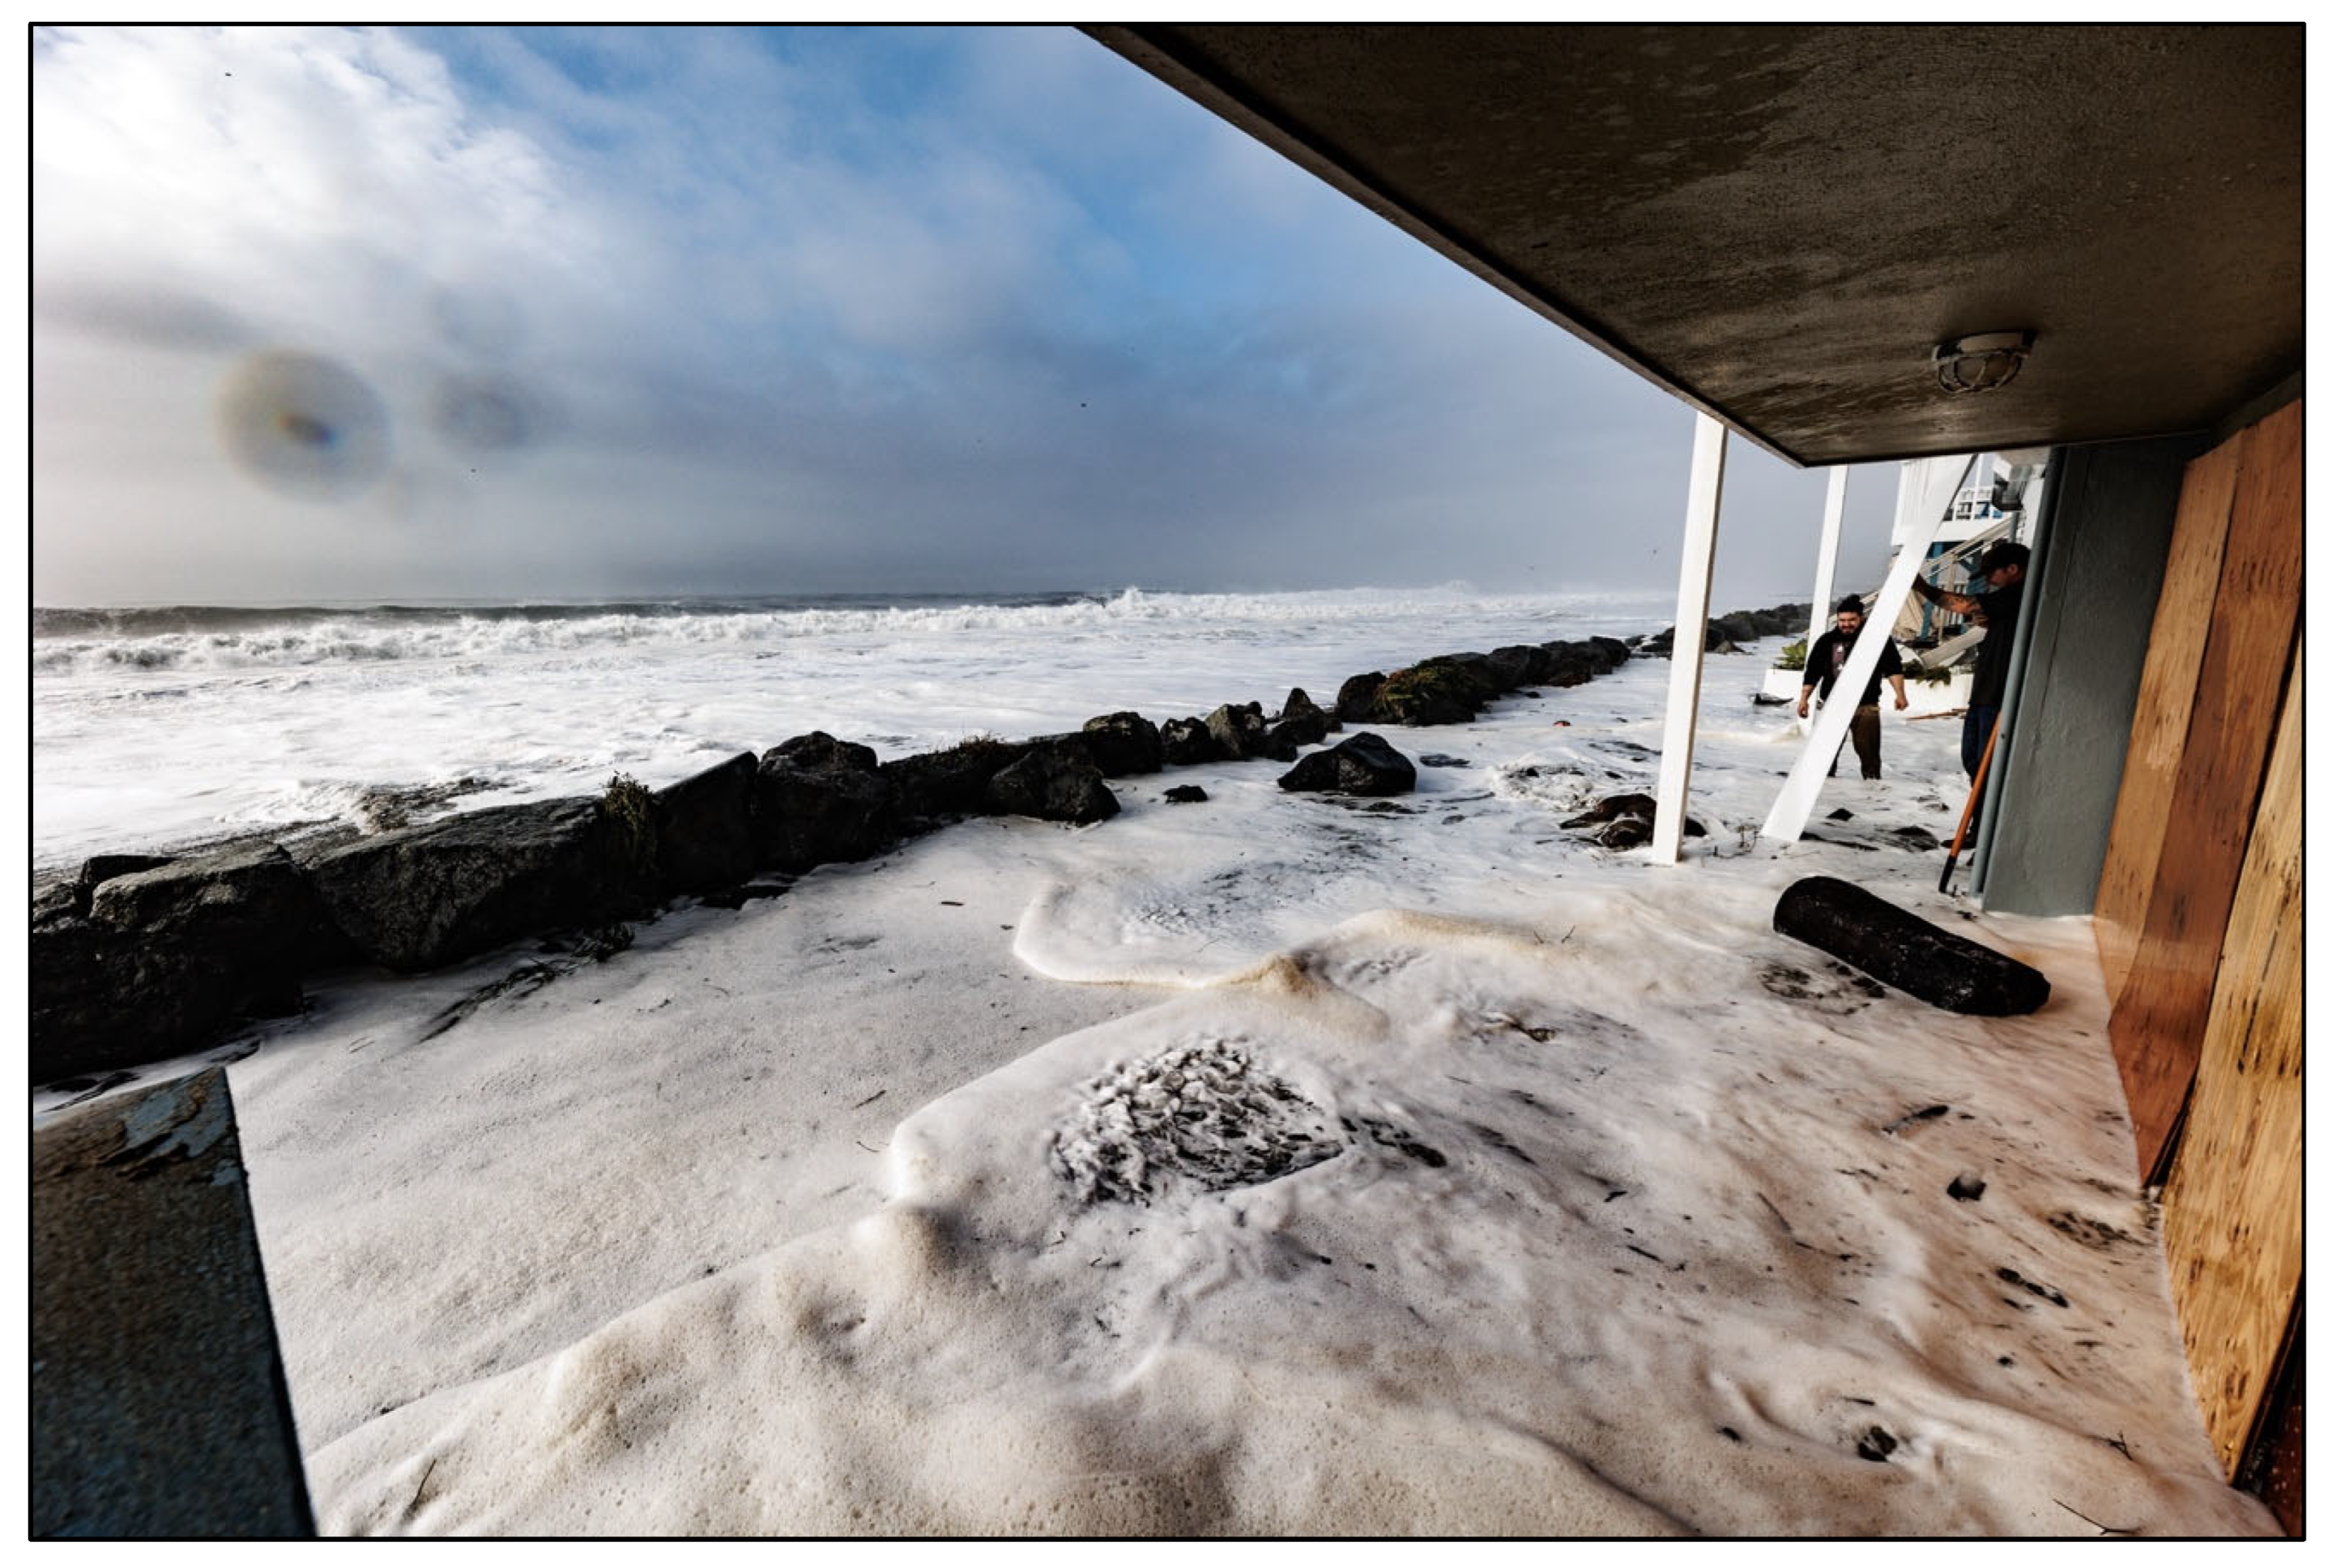
2. Importance of Short-Term Extreme Events Along California’s Coast

While the California coast is rarely affected by tropical cyclones, it has been regularly impacted by the simultaneous arrival of very large waves and high astronomical tides, with water levels amplified every several years by El Niño conditions [27]. These conditions have repeatedly led to flooding of low-lying developed shoreline areas and episodic cliff, bluff, and dune retreat [28].
Over the past century, extreme and damaging events like the El Niño winters of 1982–83, 1997–98, and 2015–16 were usually seen as just that, extreme events that occurred only infrequently. Consequently, reconstruction proceeded from the perspective that such events would not likely happen again soon. This response seems to reflect a “disaster amnesia”, which appears to be a common characteristic of many Californians. We experience a flood, earthquake, major storm, or disastrous fire; we suffer, but then typically rush to rebuild, often in the same locations, and forget about the damages, losses, injuries, and fatalities of the past. But climate is changing, and the conditions of the past are no longer reliable indicators of future events. The Monterey Bay area of California’s Central Coast presents an excellent example of these changing conditions.
The first of what were to become three severe and damaging back-to-back coastal winters arrived on the morning of 5 January 2023, on the central coast, with the simultaneous occurrence of extremely large waves at the precise time of the highest monthly tides [29]. These are the conditions that have historically produced the greatest erosion and storm damage along the central California coast [28]. The January 5 event severely impacted about eleven miles of the northern Monterey Bay shoreline from Santa Cruz to Rio Del Mar along the inner bay (Figure 2), and larger-than-normal winter waves persisted for several more days. The closest wave buoy was anchored about 20 miles offshore and recorded significant wave heights of 8.6 m (28 feet), which arrived at the peak of the high tide. Although the predicted tide was 1.8 m (5.93 feet), the actual maximum verified high water in Monterey (the closest tide gauge) was 0.4 m (1.3 feet) higher (2.2 m). Major damage to low-lying public infrastructure and private homes and businesses occurred along about 18 km (11 miles) of coastline and included bluff retreat accompanying wave overtopping with the loss of significant portions of a pedestrian walkway/bike path and damage to a major oceanfront road (Figure 3), flooding and damage from logs and debris to shoreline homes and businesses (Figure 4), and the destruction of a state beach recreational vehicle campground (destroyed for the 8th time—Figure 5). Repairs and new seawall construction to protect the blufftop road in Santa Cruz have taken over two years at a cost of approximately $35 million.
Until very recently, the nearest NOAA tide gauges to these impacted northern Monterey Bay shoreline areas were at San Francisco and Monterey, where long-term sea level rise rates are 1.98 mm/yr. and 1.72 mm/yr., respectively. These damages and those from similar events over the past century were not due to 18–20 cm (7 to 8 inches) of sea level rise, but to short-term extreme events when very large waves arrived at times of high tides [26].
It soon became apparent that the combined impacts of large waves and high tide conditions of early January 2023 were not infrequent or isolated events. Very similar oceanographic events occurred before the year was out in late December 2023 and continued into early January 2024. A series of large wave events were recorded at CDIP (Coastal Data Information Program) stations all along the West Coast from extratropical storm activity in the Pacific Ocean, consistent with the ongoing El Niño. The waves that arrived on 28 December 2023 came close to historic records at several California wave buoys and were compounded again by high tides, which caused additional coastal flooding and erosion [30].
The beach-level Venetian Court in the town of Capitola was again battered by large waves at high tide, which partially demolished the front walls of several units and filled them with sand and debris (Figure 6). Sand and debris also filled the village’s oceanfront Esplanade, which had to be cleaned up again. Along Rio del Mar’s shoreline esplanade, waves again overtopped the low seawall, flooded the streets, and left behind logs, sand, and debris (Figure 7). Immediately downcoast, waves again washed across the normally wide beach, topped the seawall, and flooded Beach Drive (Figure 8).
The debris left behind by the late December 2023/early January 2024 waves and high tides had just been cleaned up and damage repairs were underway from Santa Cruz to Rio del Mar, when the 3rd severe winter (severe compared to years of more moderate winters when coastal storm damage was very minor) in a row impacted this stretch of the coast [29]. Conditions peaked on 22–23 December 2024, when waves at a newly installed buoy in northern Monterey Bay (Soquel Cove South CDIP Buoy 281) recorded significant wave heights of 6.8 m (19 feet) with periods of 22 s from the southwest. The water level recorded at a new gauge mounted on the Santa Cruz Municipal pier reached a peak of 2.4 m (7.9 ft.), which was 1.1 m (3.5 ft.)above the predicted tide of 1.3 m (4.4 ft.).
The most significant damage during this event was to this pier, which was originally constructed in 1914. Piers require regular maintenance, however, primarily involving replacing the supporting pilings and the wooden decking. When the large waves and high tides of 23 December 2024 arrived, repairs were underway to replace older pilings in anticipation of building a large public structure at the end of the pier. Cross-members tied the pilings together and some of the decking had been removed beneath the outer 150 feet of the pier as new pilings were to be driven into the seafloor to strengthen the outer end. This significantly reduced the structure’s shear strength. Within hours of the wave attack, while two engineers were inspecting the area under construction, the outer 46 m (150 feet), with its public restrooms, collapsed into the large swells (Figure 9). The destruction of the outer end of the pier and the estimated $20 million replacement cost led the city of Santa Cruz to rethink their plans to rebuild the destroyed section and build a large structure at the outer end of the pier. Loose pilings and large timbers from the collapsed section of the pier were carried as far as 19 km (12 miles) downcoast, creating a severe hazard for anyone in the water, including surfers as well as vessels.
The repeated coastal damages along the northern Monterey Bay coastline of Central California during each of these three back-to-back winters were again the result of the simultaneous occurrence of extremely large waves and very high tides and were unrelated to sea level rise. This has also been the case for the coastal storm damage over the previous century in this area.

3. Long-Term Sea Level Rise Along the California Coast

In contrast to the short-term extreme events along the California coast described earlier, the 12 NOAA open-coast tide gauges have recorded long-term sea level rise rates ranging from −0.77 mm/yr. (−3 in./100 yrs.—Crescent City) to 5.04 mm/yr. (19.8 in./100 yrs.—North Spit, Eureka). Omitting these two northernmost tide gauges, which are situated in a different tectonic regime where subduction is affecting the coastline, the sea level rise values for the remaining ten gauges range from 0.98 to 2.22 mm/yr. or 3.8 to 8.8 in./100 yrs. (Table 2), and average 1.57 mm/yr. or 6.2 in./100 yrs.
California recently released its 3rd Sea Level Rise Guidance document [7] that focuses primarily on projecting future sea levels out to 2150, referencing the year 2000 as the baseline. The scientific framework and approach used were consistent with the 2022 Federal Sea Level Rise Technical Report [4]. Five scenarios were constructed for each tide gauge in 10-year increments from 2020 to 2150, including Low, Intermediate-Low, Intermediate, Intermediate-High, and High (see Table 1). Taking 2050 as an example, 25 years from now, the projected statewide averages for sea level range from 0.15 m (0.5 feet) for the Low Scenario to 0.36 m (1.2 feet) for the High Scenario; not a large range or a large value. By 2100, however, the projected Low Scenario is 0.40 m (1.3 feet) while the High is 2 m (6.6 feet).

4. Discussion and Conclusions

Extreme events over the past three winters on the central California coast repeatedly left major damage along 17 km (11 miles) of the northern Monterey Bay shoreline (Figure 2). Offshore significant wave heights of 8.6 m (28 feet) were recorded coincident with extremely high tides (7.22 feet or 1.3 feet above predicted tide) on 5 January 2023. Comparing these values to the highest sea level scenario for 2050 at 1.2 feet (Table 1), until at least mid-century, and likely beyond, it will be these extreme short-term events that will have much greater impacts along the state’s shoreline, for both public infrastructure and private development. While these short-term events will be additive over the long term with sea level rise, for at least the next several decades, we need to plan for and be responsive to these short-term episodic events. Recent reports also indicate that waves are gradually becoming larger and more energetic [31,32], which will amplify the impact of these short-term extreme events. The damages that the central California shoreline has experienced over the recent decades have not been due to 4.1 mm/yr. of sea level rise, but the coincidence of very large waves and high tides. This has been the case over the past century as well.
The challenges of both long-term sea level rise and short-term extreme events are not unique to the Central California coast but are global in their impacts. The damages to both public infrastructure and private development from both types of events are global and are going to increase in the future as sea levels continue to rise at an accelerating rate and storm waves increase in size and energy. The options for responding or adapting to these present and future impacts are limited and well known. These include denial or do nothing; beach nourishment; armor, whether hard or soft; and ultimately relocation or retreat, whether managed or unmanaged [2]. Denial or doing nothing is the least costly approach, at least until the next major storm event occurs, and then damage can be rapid and widespread. Beach nourishment has been widely used along the Atlantic and Gulf Coasts of the U.S. for a century, but it is very expensive and usually very short-lived. Armor, whether seawalls or rock revetments, has historically been the most common approach along the California coast, where 14% of the state’s entire coastline has now been armored, although increasing concerns with the impacts of armoring structures [33] has led to the denial of permits for almost all new proposed hard engineering structures. While “living shorelines” and “nature-based solutions” have been widely discussed in recent years, there are major limitations regarding where these might be appropriate, which include wave energy and latitude or ocean temperature constraints for such solutions as coral reefs and mangroves.
In the long term, and this depends on what individual communities or cities consider to be the long run, there is nothing we can do to hold back the oceans as sea levels continue to rise with the well-documented warming of the planet and the associated melting of the ice sheets and glaciers and warming and expansion of seawater. Coastal communities and cities will need to decide when they will need to relocate and retreat, and how they will do this. The retreat will eventually have to occur as sea levels continue to rise, and if retreat is not managed, it will be unmanaged.

Funding

This research received no external funding.

Conflicts of Interest

The author declares no conflict of interest.

References

  1. IPCC (Intergovernmental Panel on Climate Change). Climate Change 2023, Synthesis Report. Summary for Policymakers; IPCC: Geneva, Switzerland, 2023; 42p.
  2. Griggs, G.; Reguero, B. Coastal Adaptation to Climate Change and Sea-Level Rise: An Introduction to the Special Issue of Water. Water 2021, 13, 2151. [Google Scholar] [CrossRef]
  3. Fox-Kemper, B.; Hewitt, H.T.; Xiao, C.; Aðalgeirsdóttir, G.; Drijfhout, S.S.; Edwards, T.L.; Golledge, N.R.; Hemer, M.; Kopp, R.E.; Krinner, G.; et al. Ocean, Cryosphere and Sea Level Change. In Climate Change 2021: The Physical Science Basis. Contribution of Working Group I to the Sixth Assessment Report of the Intergovernmental Panel on Climate Change; Masson Delmotte, V., Zhai, P., Pirani, A., Connors, S.L., Péan, C., Berger, S., Caud, N., Chen, Y., Goldfarb, L., Gomis, M.I., et al., Eds.; Cambridge University Press: Cambridge, UK, 2021; Available online: https://www.ipcc.ch/report/ar6/wg1/ (accessed on 1 March 2025).
  4. Sweet, W.V.; Hamlington, B.D.; Kopp, R.E.; Weaver, C.P.; Barnard, P.L.; Bekaert, D.; Brooks, W.; Craghan, M.; Dusek, G.; Frederikse, T.; et al. Global and Regional Sea Level Rise Scenarios for the United States: Updated Mean Projections and Extreme Water Level Probabilities Along U.S. Coastlines; NOAA Technical Report NOS 01; National Oceanic and Atmospheric Administration, National Ocean Service: Silver Spring, MD, USA, 2022; 111p. Available online: https://oceanservice.noaa.gov/hazards/sealevelrise/noaa-nos-techrpt01-global-regional-SLR-scenarios-US.pdf (accessed on 1 March 2025).
  5. National Research Council. Sea-Level Rise for the Coasts of California, Oregon and Washington: Past, Present and Future; The National Academies Press: Washington, DC, USA, 2012; 274p. [Google Scholar]
  6. Griggs, G.; Cayan, D.; Tebaldi, C.; Fricker, H.A.; Arvai, J.; DeConto, R.; Kopp, R.E.; Whiteman, E.A.; California Ocean Science Protection Council Advisory Team Working Group. Rising Seas in California: An Update on Sea-Level Rise Science; California Ocean Sciences Trust: Sacramento, CA, USA, 2017; 71p.
  7. OPC OST. California Sea Level Rise Guidance: 2024 Science and Policy Update; California Sea Level Rise Science Task Force, California Ocean Protection Council, California Ocean Science Trust: Sacramento, CA, USA, 2024; 101p.
  8. California Coastal Commission. Sea Level Rise Policy Guidance. Interpretative Guidelines for Addressing Sea Level Rise in Local Coastal Programs and Development Permits; California Coastal Commission: San Francisco, CA, USA, 2024; 365p.
  9. Union of Concerned Scientists. Encroaching Tides. How Sea Level Rise and Tidal Flooding Threaten U.S. East and Gulf Coast Communities over the Next 30 Years; Union of Concerned Scientists: Cambridge, MA, USA, 2014; 76p. [Google Scholar]
  10. Union of Concerned Scientists. When Rising Seas Hit Hope—Hard Choices for Hundreds of US Coastal Communities; Union of Concerned Scientists: Cambridge, MA, USA, 2017; 64p. [Google Scholar]
  11. Union of Concerned Scientists. Underwater—Rising Seas, Chronic Floods, and the Implications for US Coastal Real Estate; Union of Concerned Scientists: Cambridge, MA, USA, 2018; 28p. [Google Scholar]
  12. Englander, J. High Tide on Main Street. Rising Sea Level and the Coming Coastal Crisis; The Science Bookshelf: West Hartford, CT, USA, 2012; 219p. [Google Scholar]
  13. Englander, J. Moving to Higher Ground. Rising Sea Level and the Path Forward; Girl Friday Productions: Seattle, WA, USA, 2021; 222p. [Google Scholar]
  14. Goodell, J. The Water Will Come—Rising Seas, Sinking Cities, and the Remaking of the Civilized World; Little, Brown and Company: New York, NY, USA, 2017; 340p. [Google Scholar]
  15. Rush, E. Rising: Dispatches from the New American Shore; Milkweed Edition: Minneapolis, MN, USA, 2018; 328p. [Google Scholar]
  16. Xie, R. California Against the Sea—Visions for Our Vanishing Coastline; Heydey: Berkeley, CA, USA, 2023; 325p. [Google Scholar]
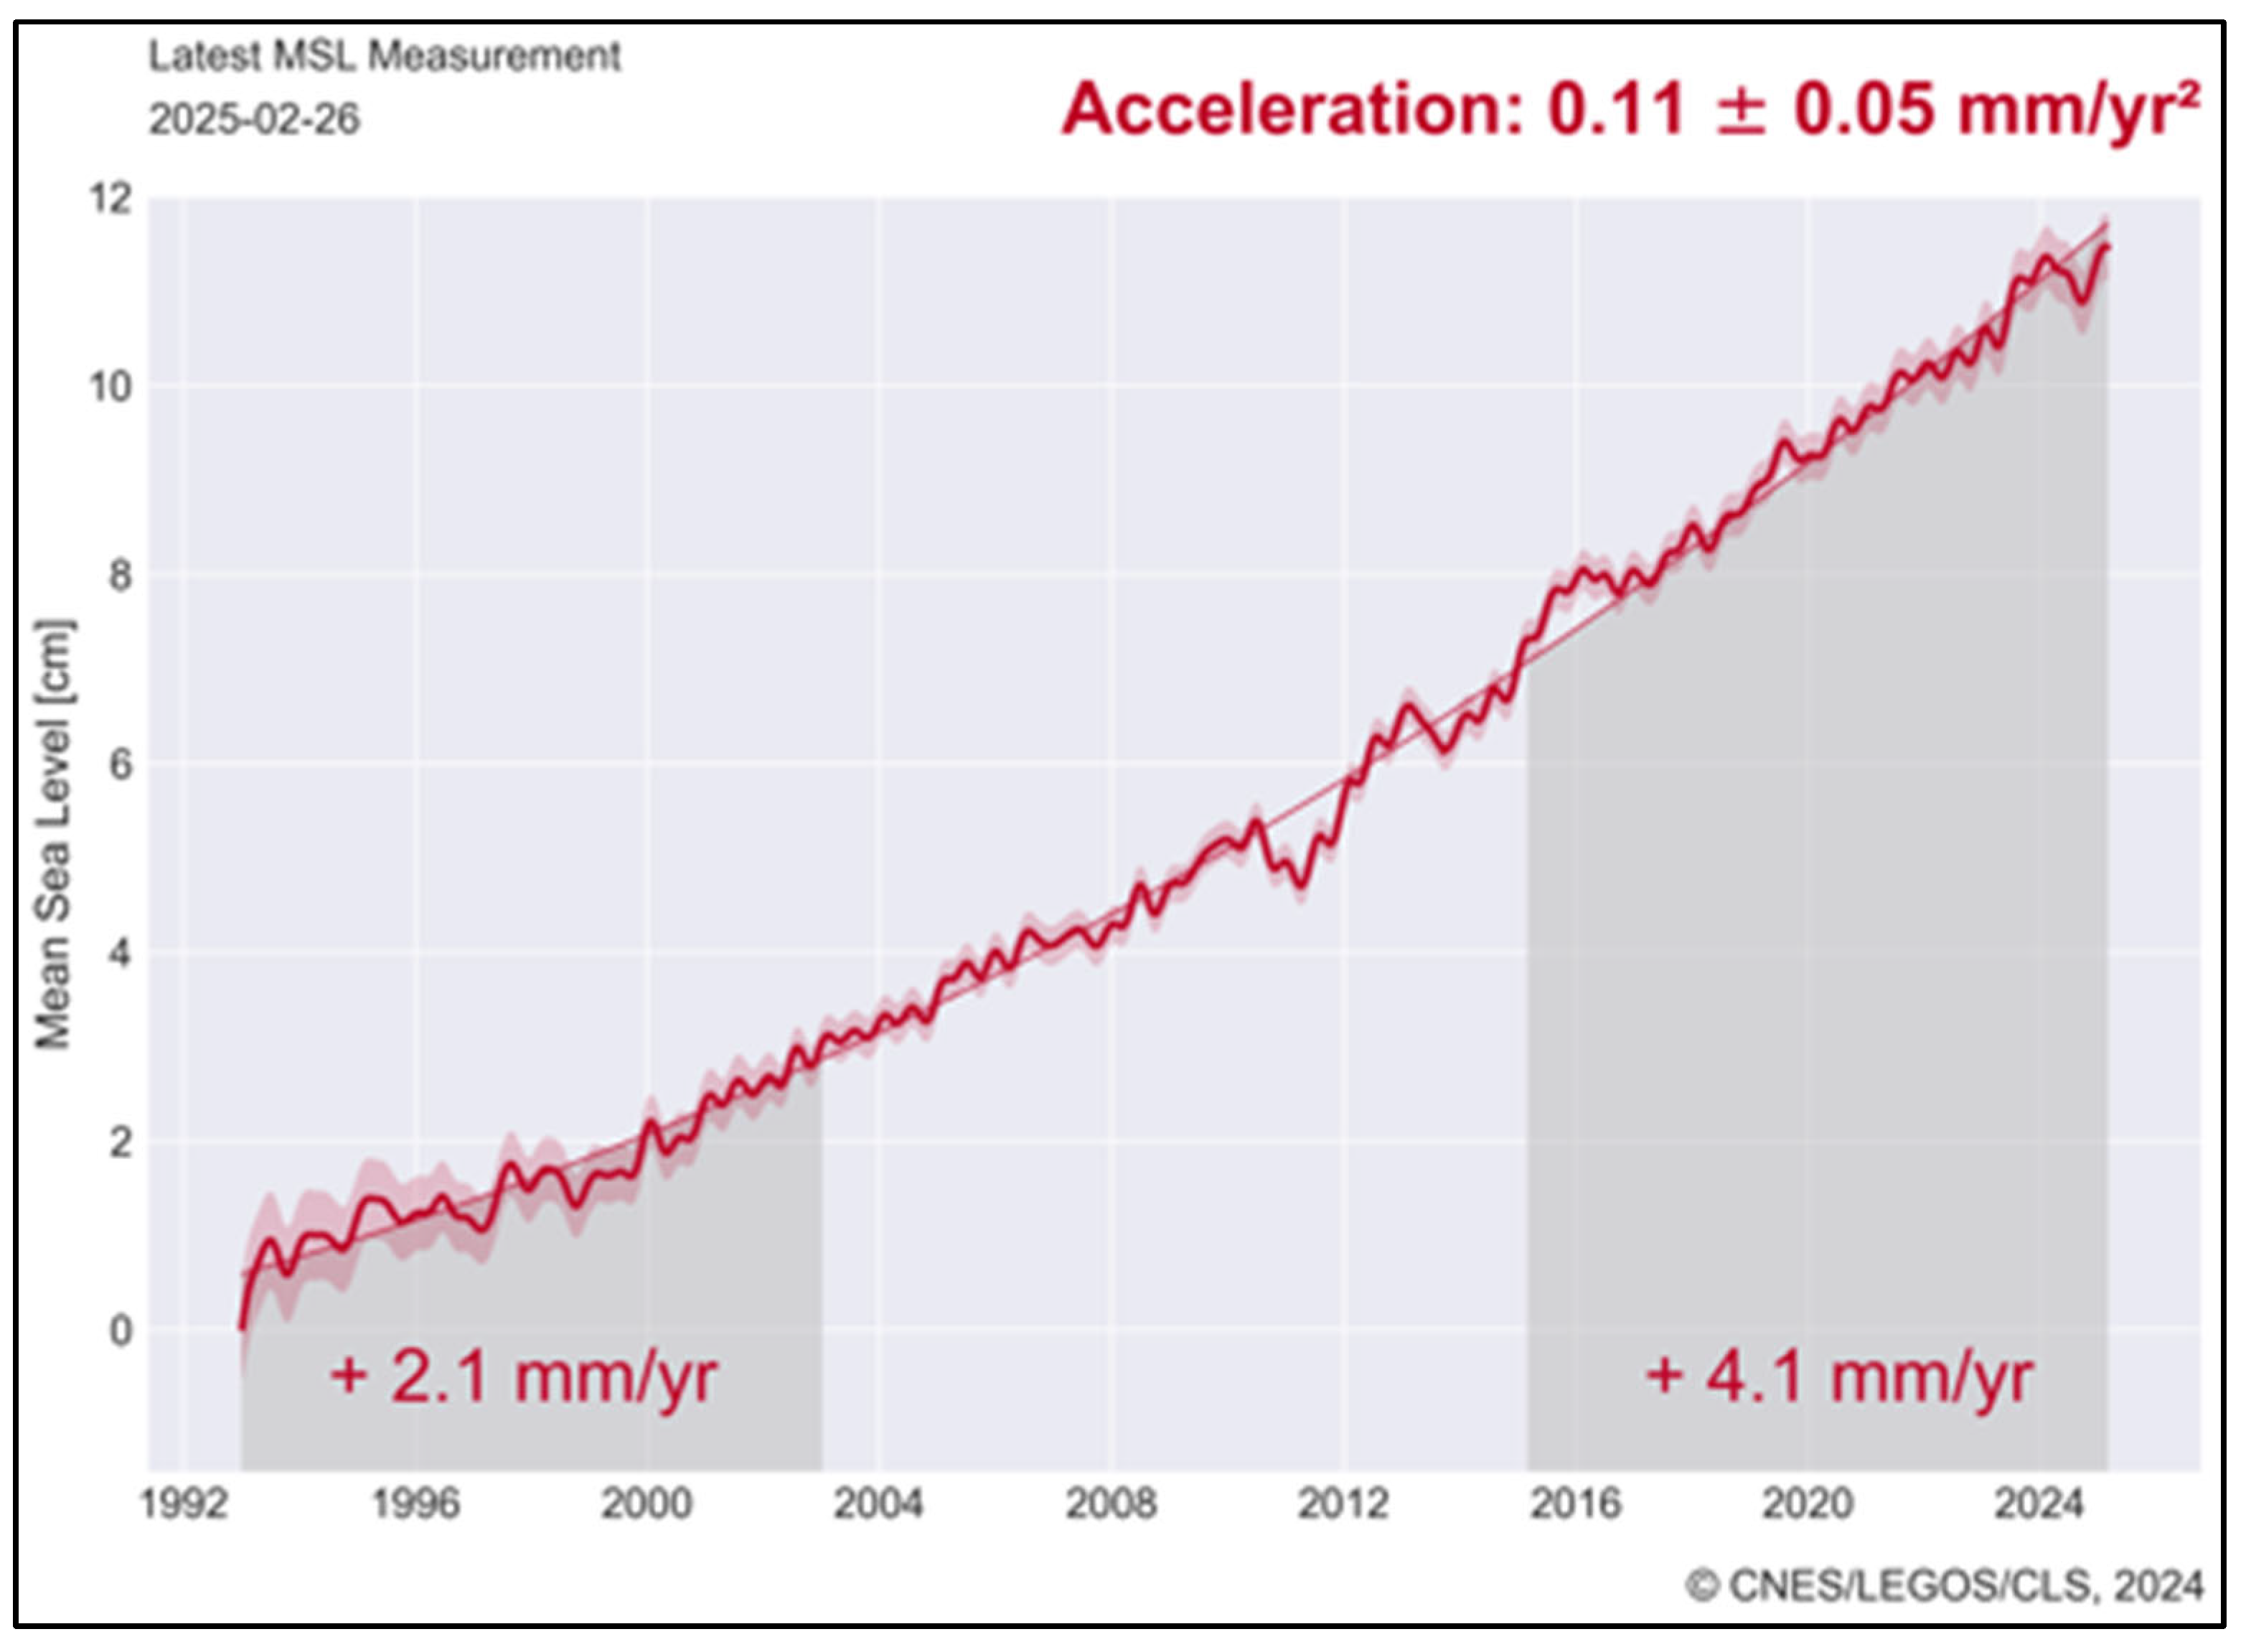
  17. Nerem, R.S.; Beckley, B.D.; Fasullo, J.T.; Hamlington, B.D.; Masters, D.; Mitchum, G.T. Climate-change-driven accelerated sea-level rise detected in the altimeter era. Proc. Natl. Acad. Sci. USA 2018, 115, 2022–2025. [Google Scholar] [CrossRef] [PubMed]
  18. Guérou, A.; Meyssignac, B.; Prandi, P.; Ablain, M.; Ribes, A.; Bignalet-Cazalet, F. Current observed global mean sea level rise and acceleration estimated from satellite altimetry and the associated measurement uncertainty. Ocean Sci. 2023, 19, 431–451. [Google Scholar] [CrossRef]
  19. Cayan, D.R.; Bromirski, P.D.; Hayhoe, K.; Tyree, M.; Dettinger, M.D.; Flick, R.E. Climate change projections of sea level extremes along the California coast. Clim. Change 2008, 87 (Suppl. S1), S57–S73. [Google Scholar] [CrossRef]
  20. Hamlington, B.D.; Chambers, D.P.; Frederikse, T.; Dangendorf, S.; Fournier, S.; Buzzanga, B.; Nerem, R.S. Observation-based trajectory of future sea level for the coastal United States tracks near high-end model projections. Commun. Earth Environ. 2022, 3, 230. [Google Scholar] [CrossRef]
  21. Hamlington, B.D.; Frederikse, T.; Thompson, P.R.; Willis, J.K.; Nerem, R.S.; Fasullo, J.T. Past, Present, and Future Pacific Sea-Level Changes. Earth’s Future 2021, 9, e2020EF001839. [Google Scholar] [CrossRef]
  22. USGCRP. Impacts, Risks, and Adaptation in the United States: Fourth National Climate Assessment, Volume II; Reidmiller, D.R., Avery, C.W., Easterling, D.R., Kunkel, K.E., Lewis, K.L.M., Maycock, T.K., Stewart, B.C., Eds.; U.S. Global Change Research Program: Washington, DC, USA, 2018; 1515p. [CrossRef]
  23. Hall, J.A.; Weaver, C.P.; Obeysekera, J.; Crowell, M.; Horton, R.M.; Kopp, R.E.; Marburger, J.; Marcy, D.C.; Parris, A.; Sweet, W.V.; et al. Rising sea levels: Helping decision-makers confront the inevitable. Coast. Manag. 2019, 47, 127–150. [Google Scholar] [CrossRef] [PubMed]
  24. NOAA; NOS; U.S. Census Bureau. National Coastal Population Report: Population Trends from 1970 to 2020; National Oceanic and Atmospheric Administration, National Ocean Service, and U.S. Census Bureau: Silver Spring, MD, USA, 2013; 22p. Available online: https://aambpublicoceanservice.blob.core.windows.net/oceanserviceprod/facts/coastal-population-report.pdf (accessed on 1 March 2025).
  25. USGCRP. Climate Science Special Report: Fourth National Climate Assessment, Volume I; Wuebbles, D.J., Fahey, D.W., Hibbard, K.A., Dokken, D.J., Stewart, B.C., Maycock, T.K., Eds.; U.S. Global Change Research Program: Washington, DC, USA, 2017; 470p. [CrossRef]
  26. NOAA. Hurricane Sandy. In NOAA Water Level and Meteorological Data Report; NOAA: Washington, DC, USA, 2013; 62p. [Google Scholar]
  27. Storlazzi, C.D.; Willis, C.M.; Griggs, G.B. Comparative impacts of the 1982–83 and 1997–98 El Niño winters on the Central California coast. J. Coast. Res. 2000, 16, 1022–1036. [Google Scholar]
  28. Griggs, G.B.; Patsch, K.B.; Savoy, L.E. Living with the Changing California Coast; University of California Press: Oakland, CA, USA, 2005; 540p. [Google Scholar]
  29. Griggs, G.; Davar, L. A Tale of Two Winters: Repeated Extreme Event Damage Along the Central California Coast. J. Coast. Res. 2025; in press. [Google Scholar]
  30. Timmerman, R. West Coast Swells. CDIP Wave Observations; Scripps Institution of Oceanography: La Jolla, CA, USA, 2024. [Google Scholar]
  31. Bromirski, P.D. Climate-induced decadal ocean wave height variability from microseisms: 1931–2021. J. Geophys. Res. Ocean. 2023, 128, e2023JC019722. [Google Scholar] [CrossRef]
  32. Reguero, B.G.; Losada, I.J.; Méndez, F.J. A recent increase in global wave power as a consequence of oceanic warming. Nat. Commun. 2019, 10, 205. [Google Scholar] [CrossRef] [PubMed]
  33. Griggs, G.B. The Impacts of Coastal Armoring. Shore Beach 2005, 73, 13–22. [Google Scholar]
Figure 1. Satellite altimetry record of global mean sea level rise from 1993 to 2025 (from https://www.aviso.altimetry.fr/en/data/products/ocean-indicators-products/mean-sea-level/data-acces.html, accessed on 1 March 2025).
Jmse 13 01123 g001
Figure 2. Location map of northern Monterey Bay for sites listed in text (from Google Earth).
Jmse 13 01123 g002
Figure 3. Wave overtopping of the bluff along West Cliff Drive in the city of Santa Cruz on 5 January 2023 led to erosion of weak upper bluff materials, collapse of several sections of the pedestrian pathway, and threats to the roadway (Photo by Author).
Jmse 13 01123 g003
Figure 4. Logs and debris carried by large waves at high tide washed up onto and into shoreline restaurants in Capitola Village on 5 January 2023 (Photo: Shmuel Thaler—Santa Cruz Sentinel).
Jmse 13 01123 g004
Figure 5. Destruction of timber bulkhead and former back beach RV parking area at Seacliff State Beach on 5 January 2023 (Kim Steinhardt).
Jmse 13 01123 g005
Figure 6. 2 January 2024, damage to beach-level cottages as waves and debris broke through exterior walls (Kevin Painchaud—Lookout Santa Cruz).
Jmse 13 01123 g006
Figure 7. The Rio del Mar Esplanade was flooded with logs, sand, and debris from very large waves at high tide on 2 January 2024 (Kevin Painchaud- Lookout Santa Cruz).
Jmse 13 01123 g007
Figure 8. Flooding of beach-level homes on Rio del Mar’s Beach Drive from very large waves at high tide on 2 January 2024 (Kevin Painchaud- Lookout Santa Cruz).
Jmse 13 01123 g008
Figure 9. The outer end of the Santa Cruz Municipal Pier after collapsing into the ocean on 23 December 2024 (Brad Porter, City of Santa Cruz).
Jmse 13 01123 g009
Table 1. Statewide averages for five California sea level rise scenarios in feet relative to the 2000 baseline [7].
YearLowInt-LowIntermedInt-HighHigh
20200.20.20.20.20.3
20300.30.40.40.40.4
20400.40.50.60.70.8
20500.50.60.81.01.2
20600.60.81.11.52.0
20700.71.01.42.23.0
20800.81.21.83.04.1
20900.91.42.43.95.4
21001.01.63.14.96.6
21101.11.83.85.78
21201.124.56.49.1
21301.22.257.110
21401.32.45.67.711
21501.32.66.18.311.9
Table 2. Sea level rise rates for California’s coastal tide gauges. (https://tidesandcurrents.noaa.gov/map/, accessed on 1 March 2025).
Crescent City (1993–2024)−0.77 mm/yr./−0.25 ft./100 yrs. (3 in.)
North Spit, Eureka (1977–2024)5.04 mm/yr./1.65 ft./100 yrs. (19.8 in.)
Arena Cove (1978–2024)1.11 mm/yr./0.36 ft./100 yrs. (4.3 in.)
Pt. Reyes (1975–2024)2.13 mm/yr./0.70 ft./100 yrs. (8.4 in.)
San Francisco (1897–2024)1.98 mm/yr./0.65 ft./100 yrs. (7.8 in.)
Monterey (1973–2024)1.72 mm/yr./0.56 ft./100 yrs. (6.7 in.)
Port San Luis (1945–2024)0.98 mm/yr./0.32 ft./100 yrs. (3.8 in.)
Santa Barbara (1973–2024)0.99 mm/yr./0.32 ft./100 yrs. (3.8 in.)
Santa Monica (1933–2024)1.52 mm/yr./0.50 ft./100 yrs. (6.0 in.)
Los Angeles (1923–2024)1.05 mm/yr./0.34 ft./100 yrs. (4.1 in.)
La Jolla (1924–2024)2.02 mm/yr./0.66 ft./100 yrs. (7.9 in.)
San Diego (1906–2024)2.22 mm/yr./0.73 ft./100 yrs. (8.8 in.)
Disclaimer/Publisher’s Note: The statements, opinions and data contained in all publications are solely those of the individual author(s) and contributor(s) and not of MDPI and/or the editor(s). MDPI and/or the editor(s) disclaim responsibility for any injury to people or property resulting from any ideas, methods, instructions or products referred to in the content.

