Article

Study on the Mechanism of Local Scour Around Bridge Piers

1
Ocean College, Zhejiang University, Hangzhou 310058, China
2
Ocean Research Centre of Zhoushan, Zhejiang University, Zhoushan 316000, China
3
School of Marine Science and Engineering, South China University of Technology, Guangzhou 510641, China
4
Department of Civil Engineering, Hangzhou City College, Hangzhou 310015, China
*
Authors to whom correspondence should be addressed.
J. Mar. Sci. Eng. 2025, 13(6), 1021; https://doi.org/10.3390/jmse13061021
Submission received: 7 April 2025 / Revised: 18 May 2025 / Accepted: 21 May 2025 / Published: 23 May 2025

Abstract

:
Local scour around bridge piers poses significant challenges to the stability and safety of bridge structures. Local scour results from the combined effects of increased longitudinal flow velocity, the direct impact of the flow in front of the pier, and the suction effect of horseshoe vortices. This study utilizes a three-dimensional mathematical model to simulate the flow field around the pier, employing the SWASH (simulating waves till shore) model. Experimental observations in a bed load flume were conducted to analyze the contribution of different factors to local scour. The results indicate that the scour depth caused predominantly by the flow accounts for approximately 75–80% of the total scour depth. Analysis of the longitudinal flow velocity distribution suggests that the scour depth due to the redistribution of longitudinal flow velocity generally accounts for 15–30% of the total scour depth. These findings provide insights into the local scour mechanism and have implications for the design and maintenance of bridge foundations.

1. Introduction

Bridge piers are critical structural components that support bridges, yet the phenomenon of local scour around them poses significant challenges in hydraulic engineering. Local scour can undermine the stability of bridge piers, leading to potential safety hazards for the entire bridge. Historical data indicate that more than half of bridge failures worldwide are attributed to scour-related issues. Understanding the underlying mechanisms of local scour around bridge piers is essential for accurate prediction, effective prevention, and rational design of bridge foundations [1,2].
There are three main factors that cause local scour around bridge piers: (1) the increase in longitudinal flow velocity on both sides caused by the bridge pier; (2) the flow in front of pier generated by the combined action of the ward momentum component and gravity, which has a direct impact and brushing effect on the bed surface; (3) the horseshoe vortices around the pier, which have a suction effect on sediment [3,4,5]. The flow structure around the pier is shown in Figure 1 [6]. There are significant differences in the contribution of these three factors on local scour around bridge piers [7,8].
The horseshoe vortex represents a crucial feature in the flow dynamics around bridge piers. Upon encountering a pier, the flow splits, forming a horseshoe-shaped vortex system that wraps around the pier’s front and sides. This vortex system, originating near the bed, exhibits a high-velocity gradient, capable of entraining sediment particles. Research by Si [9], utilizing particle image velocimetry (PIV), has demonstrated that the strength and size of the horseshoe vortex are influenced by factors like approach flow velocity, pier shape, and bed roughness. Higher approach flow velocities typically result in more robust horseshoe vortices, potentially enhancing sediment entrainment. Yang [10] established the relationship between riverbed erosion depth over time and the Froude number based on diverse flow rates and pile arrangements, predicting equilibrium erosion pit characteristics through empirical methods.
Following the pier, a wake region forms, characterized by a complex flow structure featuring low-velocity zones and oscillating flow patterns. The wake vortex, present in this region, contributes to sediment transport. Vortex shedding within the wake region induces flow pressure fluctuations, with the potential to resuspend sediment within the scour hole. The shedding frequency is linked to the flow’s Reynolds number and pier geometry. The Strouhal number, extensively studied for circular piers, offers critical insights into understanding wake-induced sediment transport processes. The entrainment of sediment particles from the bed surrounding the pier initiates the process of local scour. Shear stress exerted by the horseshoe and wake vortices on the bed surface serves as the primary force behind sediment entrainment. When this shear stress surpasses the sediment’s critical shear stress, particles are dislodged from the bed. The critical shear stress is influenced by factors like sediment size, shape, and density. Fine-grained sediments are typically more easily entrained due to their lower critical shear stress. Additionally, cohesive forces within fine-grained sediments impact the entrainment process. The estuarine and bay areas are mostly composed of fine-grained sediment, where erosion resistance is not solely shear stress-dependent but also influenced by inter-particle bonding strength [11].
Once entrained, sediment follows specific transport pathways. Sediment entrained by the horseshoe vortex primarily travels along the pier’s sides and accumulates in the scour hole. Part of the sediment may also be transported by the wake-induced flow. Factors like flow velocity, sediment concentration, and sediment availability near the pier influence the sediment transport rate. Studies employing laboratory experiments and numerical simulations, such as that by Wei [12], using the Euler–Lagrange approach, have revealed the complexity of sediment transport patterns influenced by flow-sediment interactions.
Pier shape and size significantly impact local scour. Circular piers generally experience less scour depth compared to square or rectangular piers due to their streamlined flow characteristics that reduce horseshoe vortex intensity. Pier diameter also influences scour depth, with larger diameters resulting in more severe scour due to increased flow blockage and stronger vortices. Sun’s research [13] indicates that scour depth around a pier is approximately proportional to the 2/3 power of the pier diameter under specific flow and sediment conditions. Approach flow velocity stands out as a pivotal factor in local scour development. Higher flow velocities lead to stronger vortices and increased shear stresses on the bed, intensifying scour processes. Flow depth plays a crucial role as well, with greater flow depths enhancing flow energy and vortex sizes, thereby elevating scour potential. Turbulence in the flow further complicates the scour process.
Despite extensive research on local scour mechanisms around bridge piers, knowledge gaps persist. For instance, the combined effects of multiple factors like pier geometry, flow conditions, and sediment properties in complex riverine environments remain incompletely understood. Developing precise numerical models capable of comprehensively considering complex flow–sediment–structure interactions represents a significant challenge. Future research could focus on enhancing understanding of local scour mechanisms during extreme flow events, such as floods and tsunamis, which pose substantial threats to bridge safety. In situ measurements are essential for validating and refining existing theoretical and numerical models to predict and mitigate local scour effectively. While strides forward have been made in understanding and mitigating scour around bridge piers, gaps in the current literature persist. Further investigations are needed to explore the impacts of different boundary layer thicknesses and flow conditions on scour efficacy [14]. Various countermeasures have been developed to combat local scour, with sacrificial piles emerging as a popular solution. These smaller-diameter piles, typically placed upstream of the bridge pier, help deflect high-velocity flows, creating a low-velocity wake region behind them, thereby mitigating scour effects [15,16].
In conclusion, local scour around bridge piers is a complex process characterized by intricate interactions between flow and sediment. To investigate the contributions of various factors at different stages of scouring, we employed a combination of theoretical analysis and experimental observation to assess the scour intensity resulting from increases in longitudinal flow velocity and discharge. This study aims to deepen our understanding of the mechanisms of local scour, including flow characteristics, sediment transport processes, and influencing factors, thereby ensuring the long-term stability and safety of bridge structures.

2. Scour Mechanism Experiments

The scour experiments around the bridge pier was conducted in the bed load flume in the Offshore Pavilion of Zhejiang University. The flume is 16 m in length, 0.5 m in width, and 0.5 m in height, with a maximum flow rate of 0.6 m3 s−1. The cylindrical piers, made of PVC pipe, with diameters of 2.5 cm and 5 cm, are positioned within a double-layered glass base to prevent tilting or loosening due to water flow.
During the experiments, the sand-paved section spans 1.5 m in length, 0.5 m in width, and 0.1 m in thickness. The water depth is maintained at 0.2 m. The sediment size ranges from 0.2 to 0.7 mm. The density is 2.6 × 10³ kg m−3, and the critical velocity is 0.25 m/s. The approaching flow velocities u 0 are set at 0.4 to 0.8 times of critical velocity u c . The flume arrangement is shown in Figure 2a,b.
After leveling and compacting the sand, the downstream sluice gate was closed, and water was slowly introduced into the flume, allowing the sand to absorb moisture for 24 h. Prior to the experiment, water was gradually added until the desired depth was achieved, followed by a progressive increase in flow rate while gently opening the sluice gate. Once the flow velocity reached the set value, an acoustic doppler velocimeter (ADV) was employed to measure the flow speed, with scour depth observed and recorded every 10 to 20 min. After 8 to 12 h of scouring, the local scour holes reached a state of equilibrium, with no further deepening or widening observed. The sluice gate was then closed, and the water pump was turned off, allowing the flow to decrease to zero before slowly opening the sluice gate for drainage. Once the water in the flume was fully drained, the morphology of the local scour around the bridge pier was examined. Scour hole profiles were measured using an H-40 laser rangefinder (made in China), as shown in Figure 3. This device operates within a temperature range of 0 to 60 °C, with a measurement range of 0.03 m to 40 m and an accuracy of 0.1 mm, sufficiently meeting the requirements for topographic measurements.
A glass plate measuring 100 cm × 70 cm was placed over the flume, on which a grid of 1 cm × 1 cm squares was drawn. The laser rangefinder was moved along the glass plate to measure the elevation of the scour holes relative to the glass cover at each grid intersection. Measurements were taken with increased density near the bridge pier, allowing for the calculation of scour depth at various points surrounding the pier.
Grain size analysis of sediment samples was conducted using a laser particle size analyzer (made in America) to obtain key parameters such as the gradation curve, median particle diameter, and standard deviation. The laser particle size analyzer consists of a main unit, a sample measurement device and a computer system. The analysis effectively measures particles ranging from 0.1 mm to 1.25 mm, providing detailed insights into the grain size distribution of the sediment samples. The grain size gradation curve for the sediment samples used in this experiment is presented in Figure 4, in which red represents the distribution curve, blue represents the cumulative curve. The results indicate that the median particle diameter of the tested sediment is d 50 = 0.0587   m m ; σ g = 4.62 .
After leveling and compacting the sand and the tailgate was closed, we slowly fill the flume with water to the required depth then gradually increase the flow rate and slowly open the tailgate. After adjusting the flow rate to the set value, we use ADV to measure the flow rate, and we observe and record the scour depth every 10 min. When the local scour hole will no longer deepen and expand, in other words, reaching a state of equilibrium, we close the tailgate, turn off the water pump, and slowly open the tailgate to drain water. After the water in the flume is drained, the local scour morphology around the bridge pier is observed.

3. Results and Discussion

3.1. Scour Hole Morphology

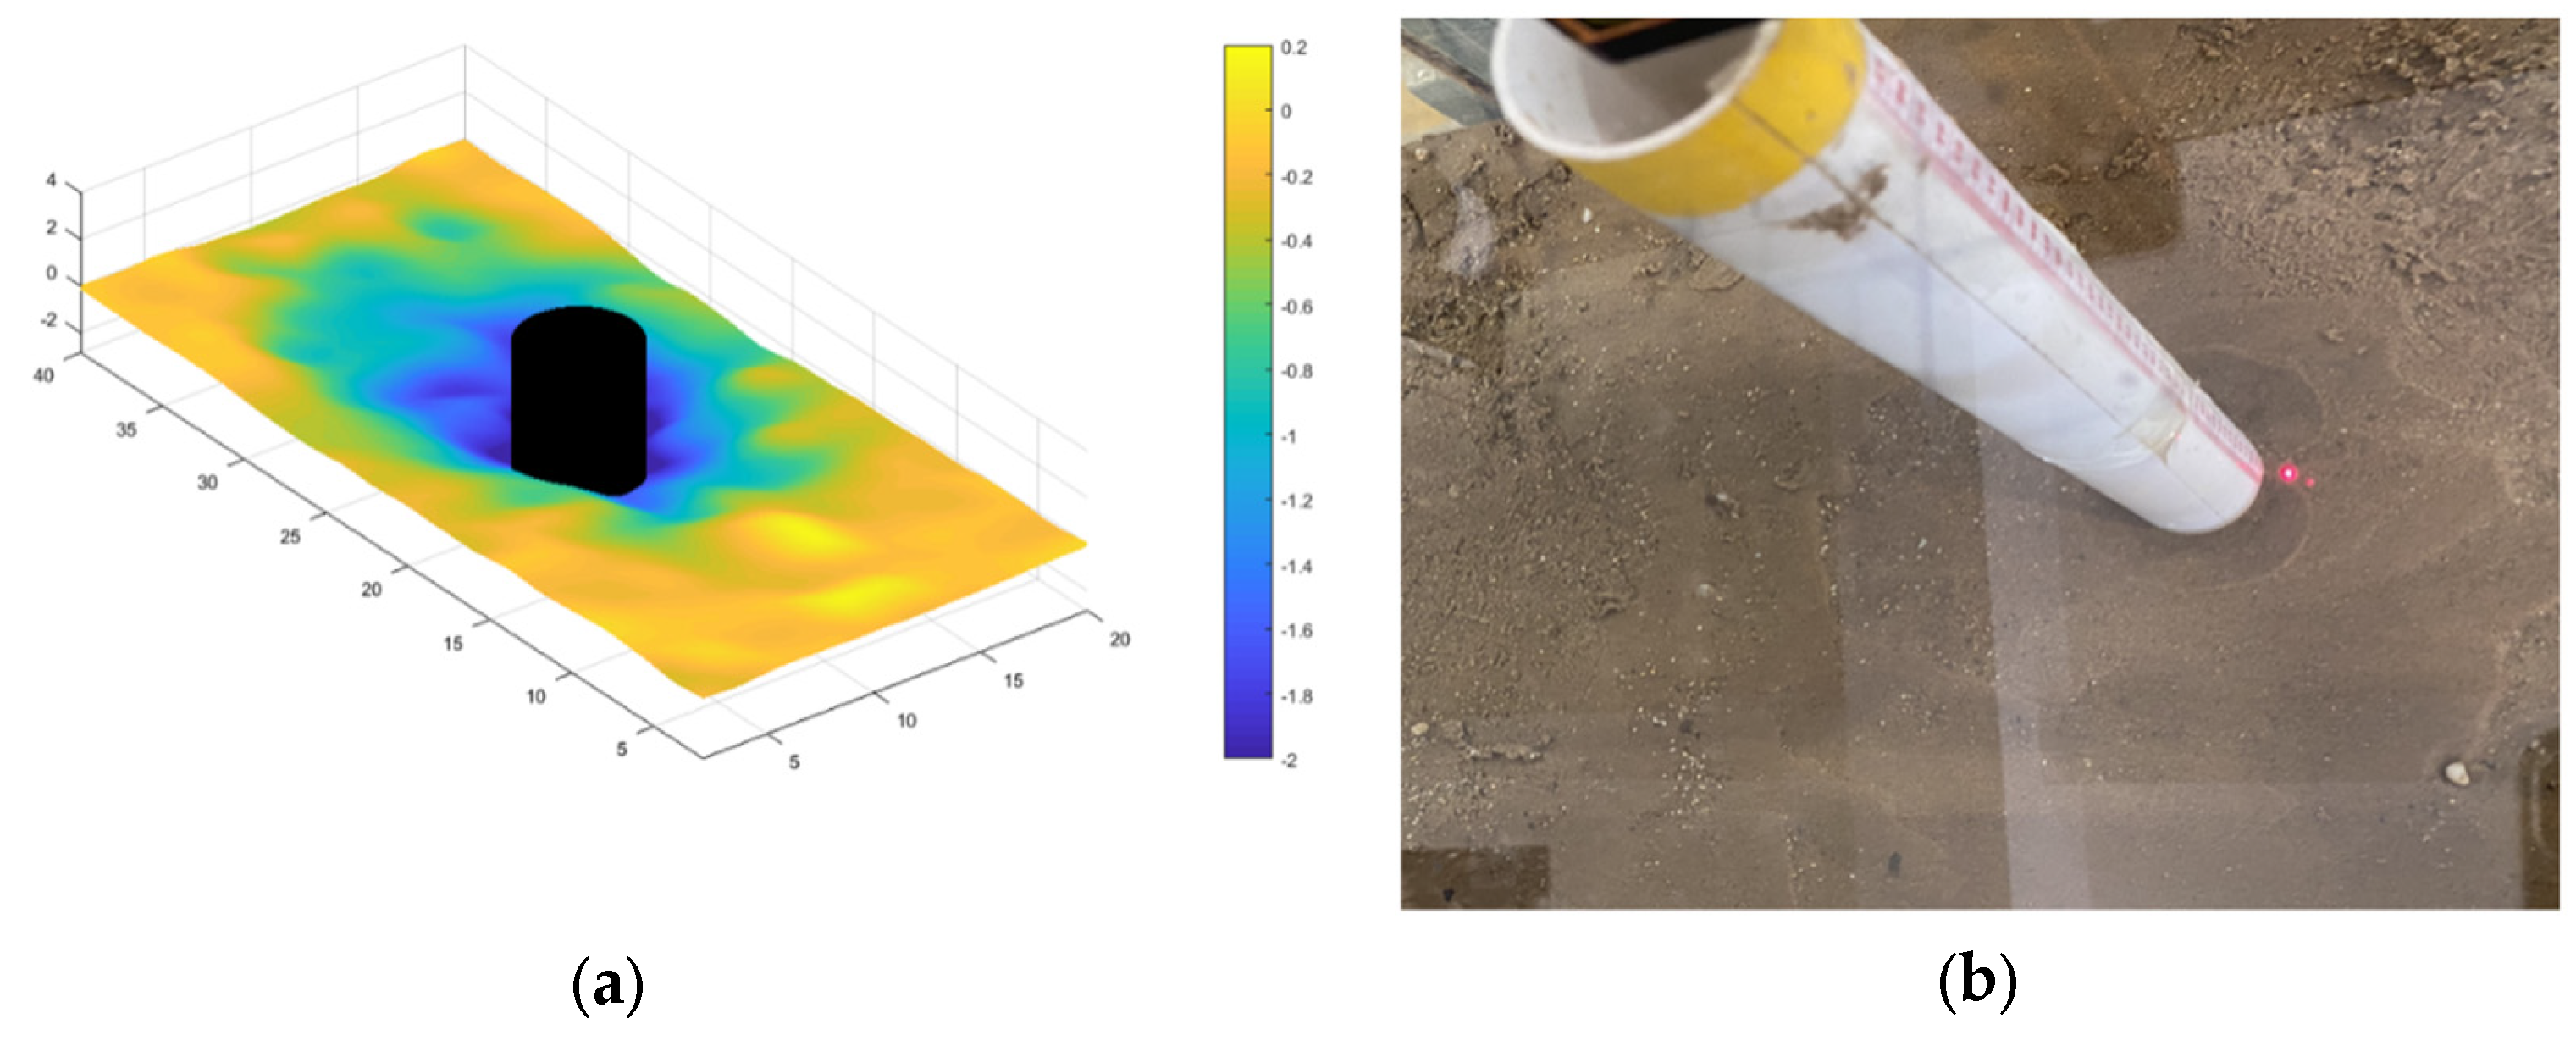
Based on the elevation obtained, a three-dimensional topographic map of the scour hole around the bridge pier was drawn, as shown in Figure 5, Figure 6, Figure 7 and Figure 8.
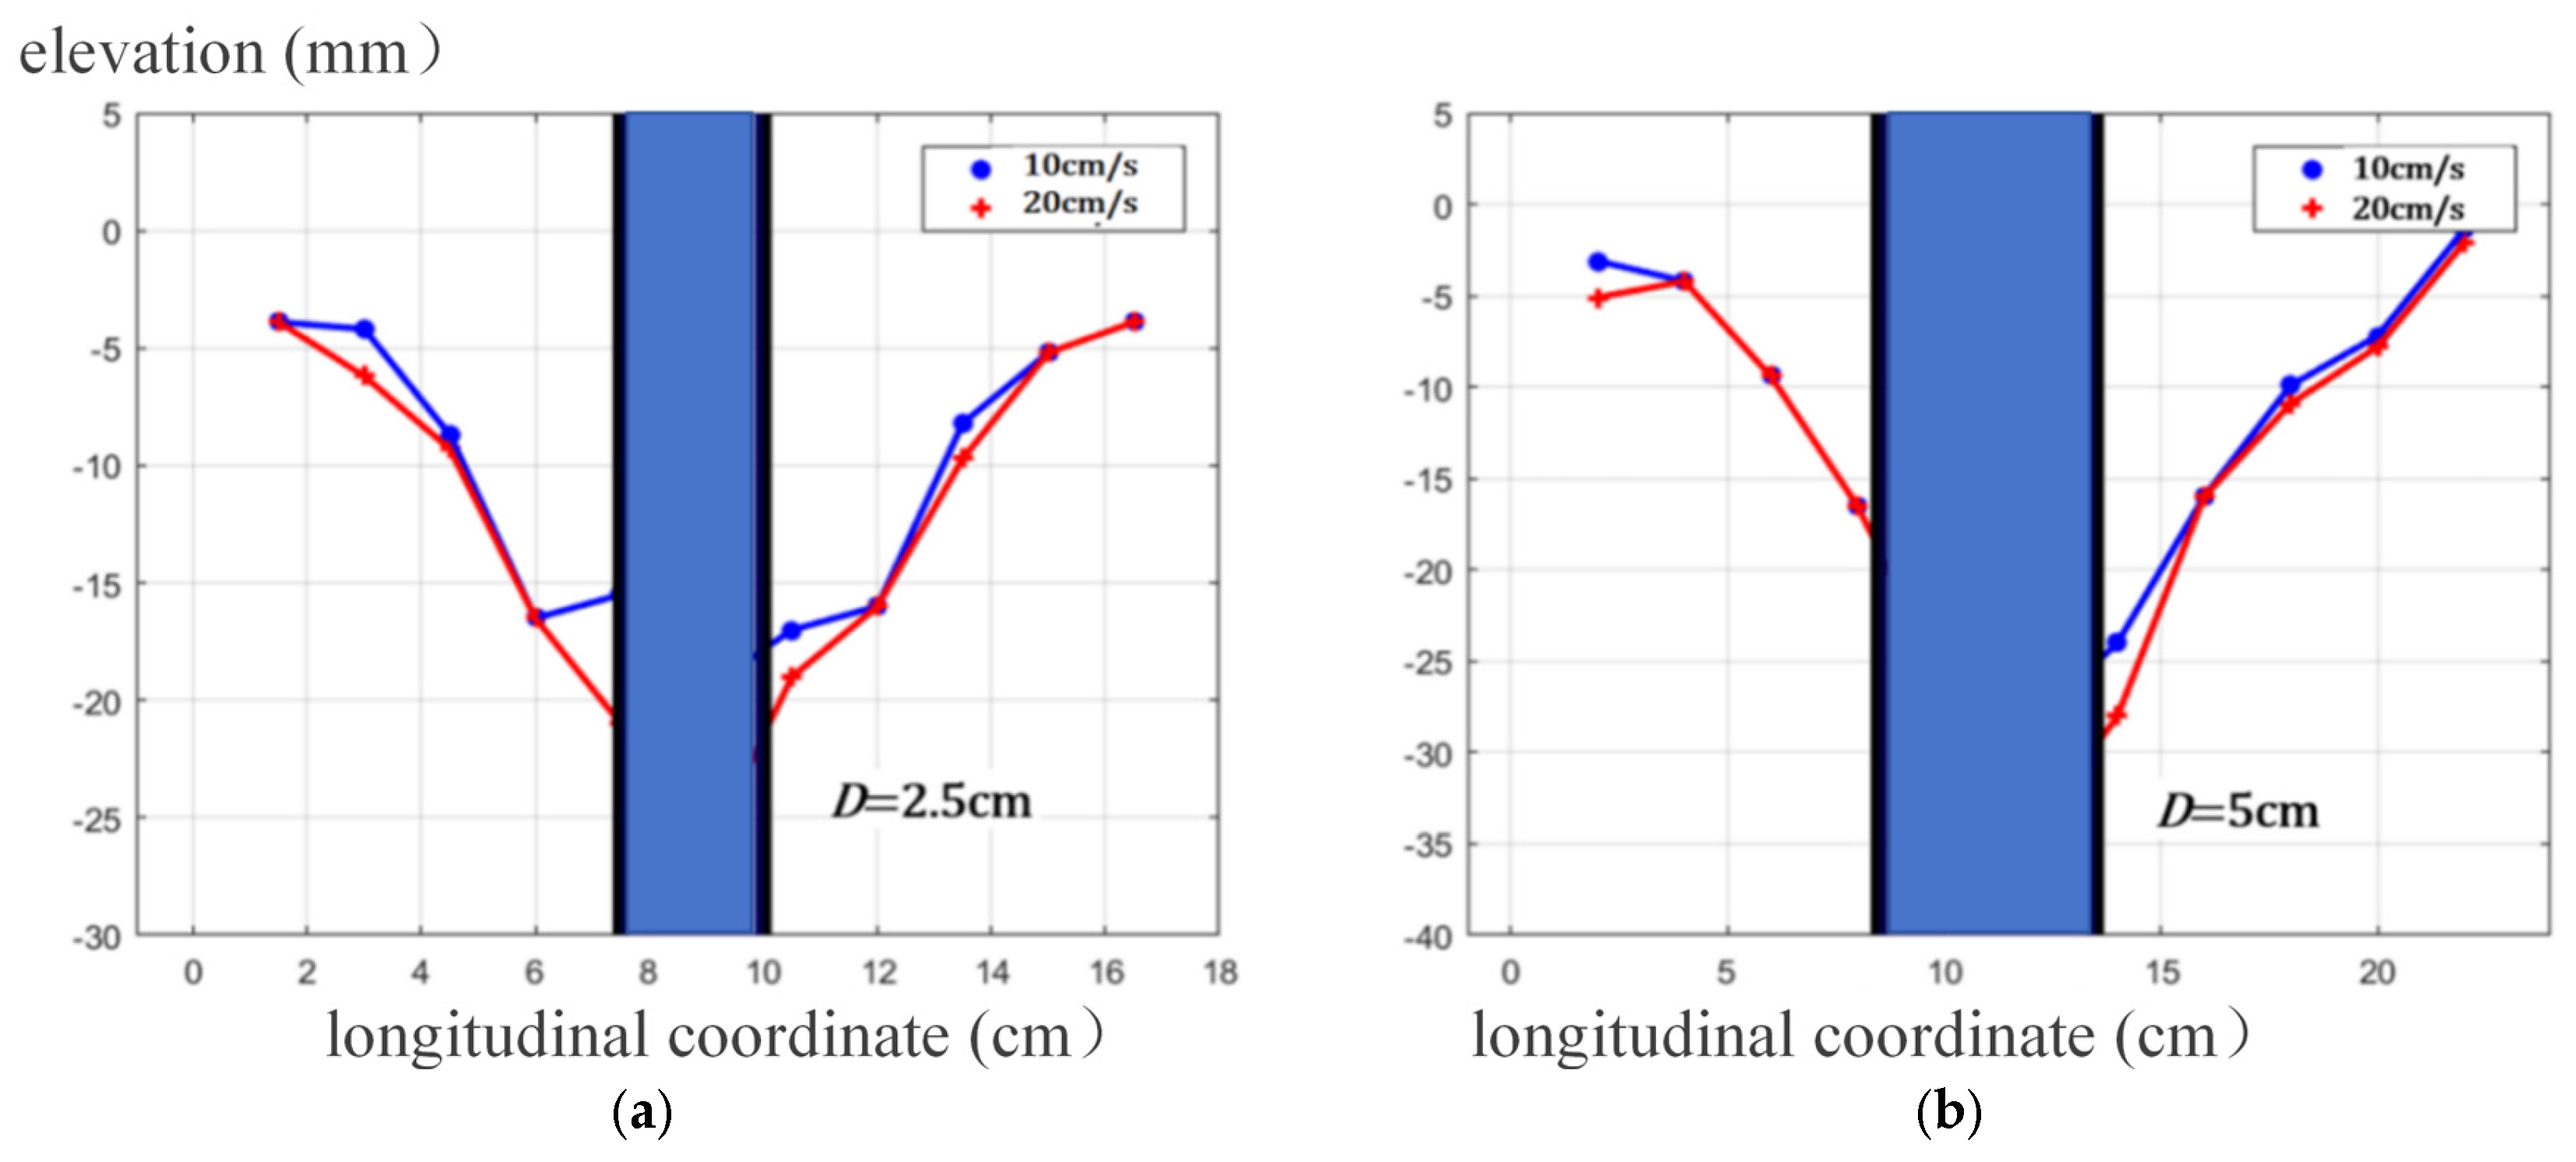
The cross-sectional and longitudinal profiles of the scour hole were drawn, as shown in Figure 9 and Figure 10, where the blue column is a simulated bridge pier.
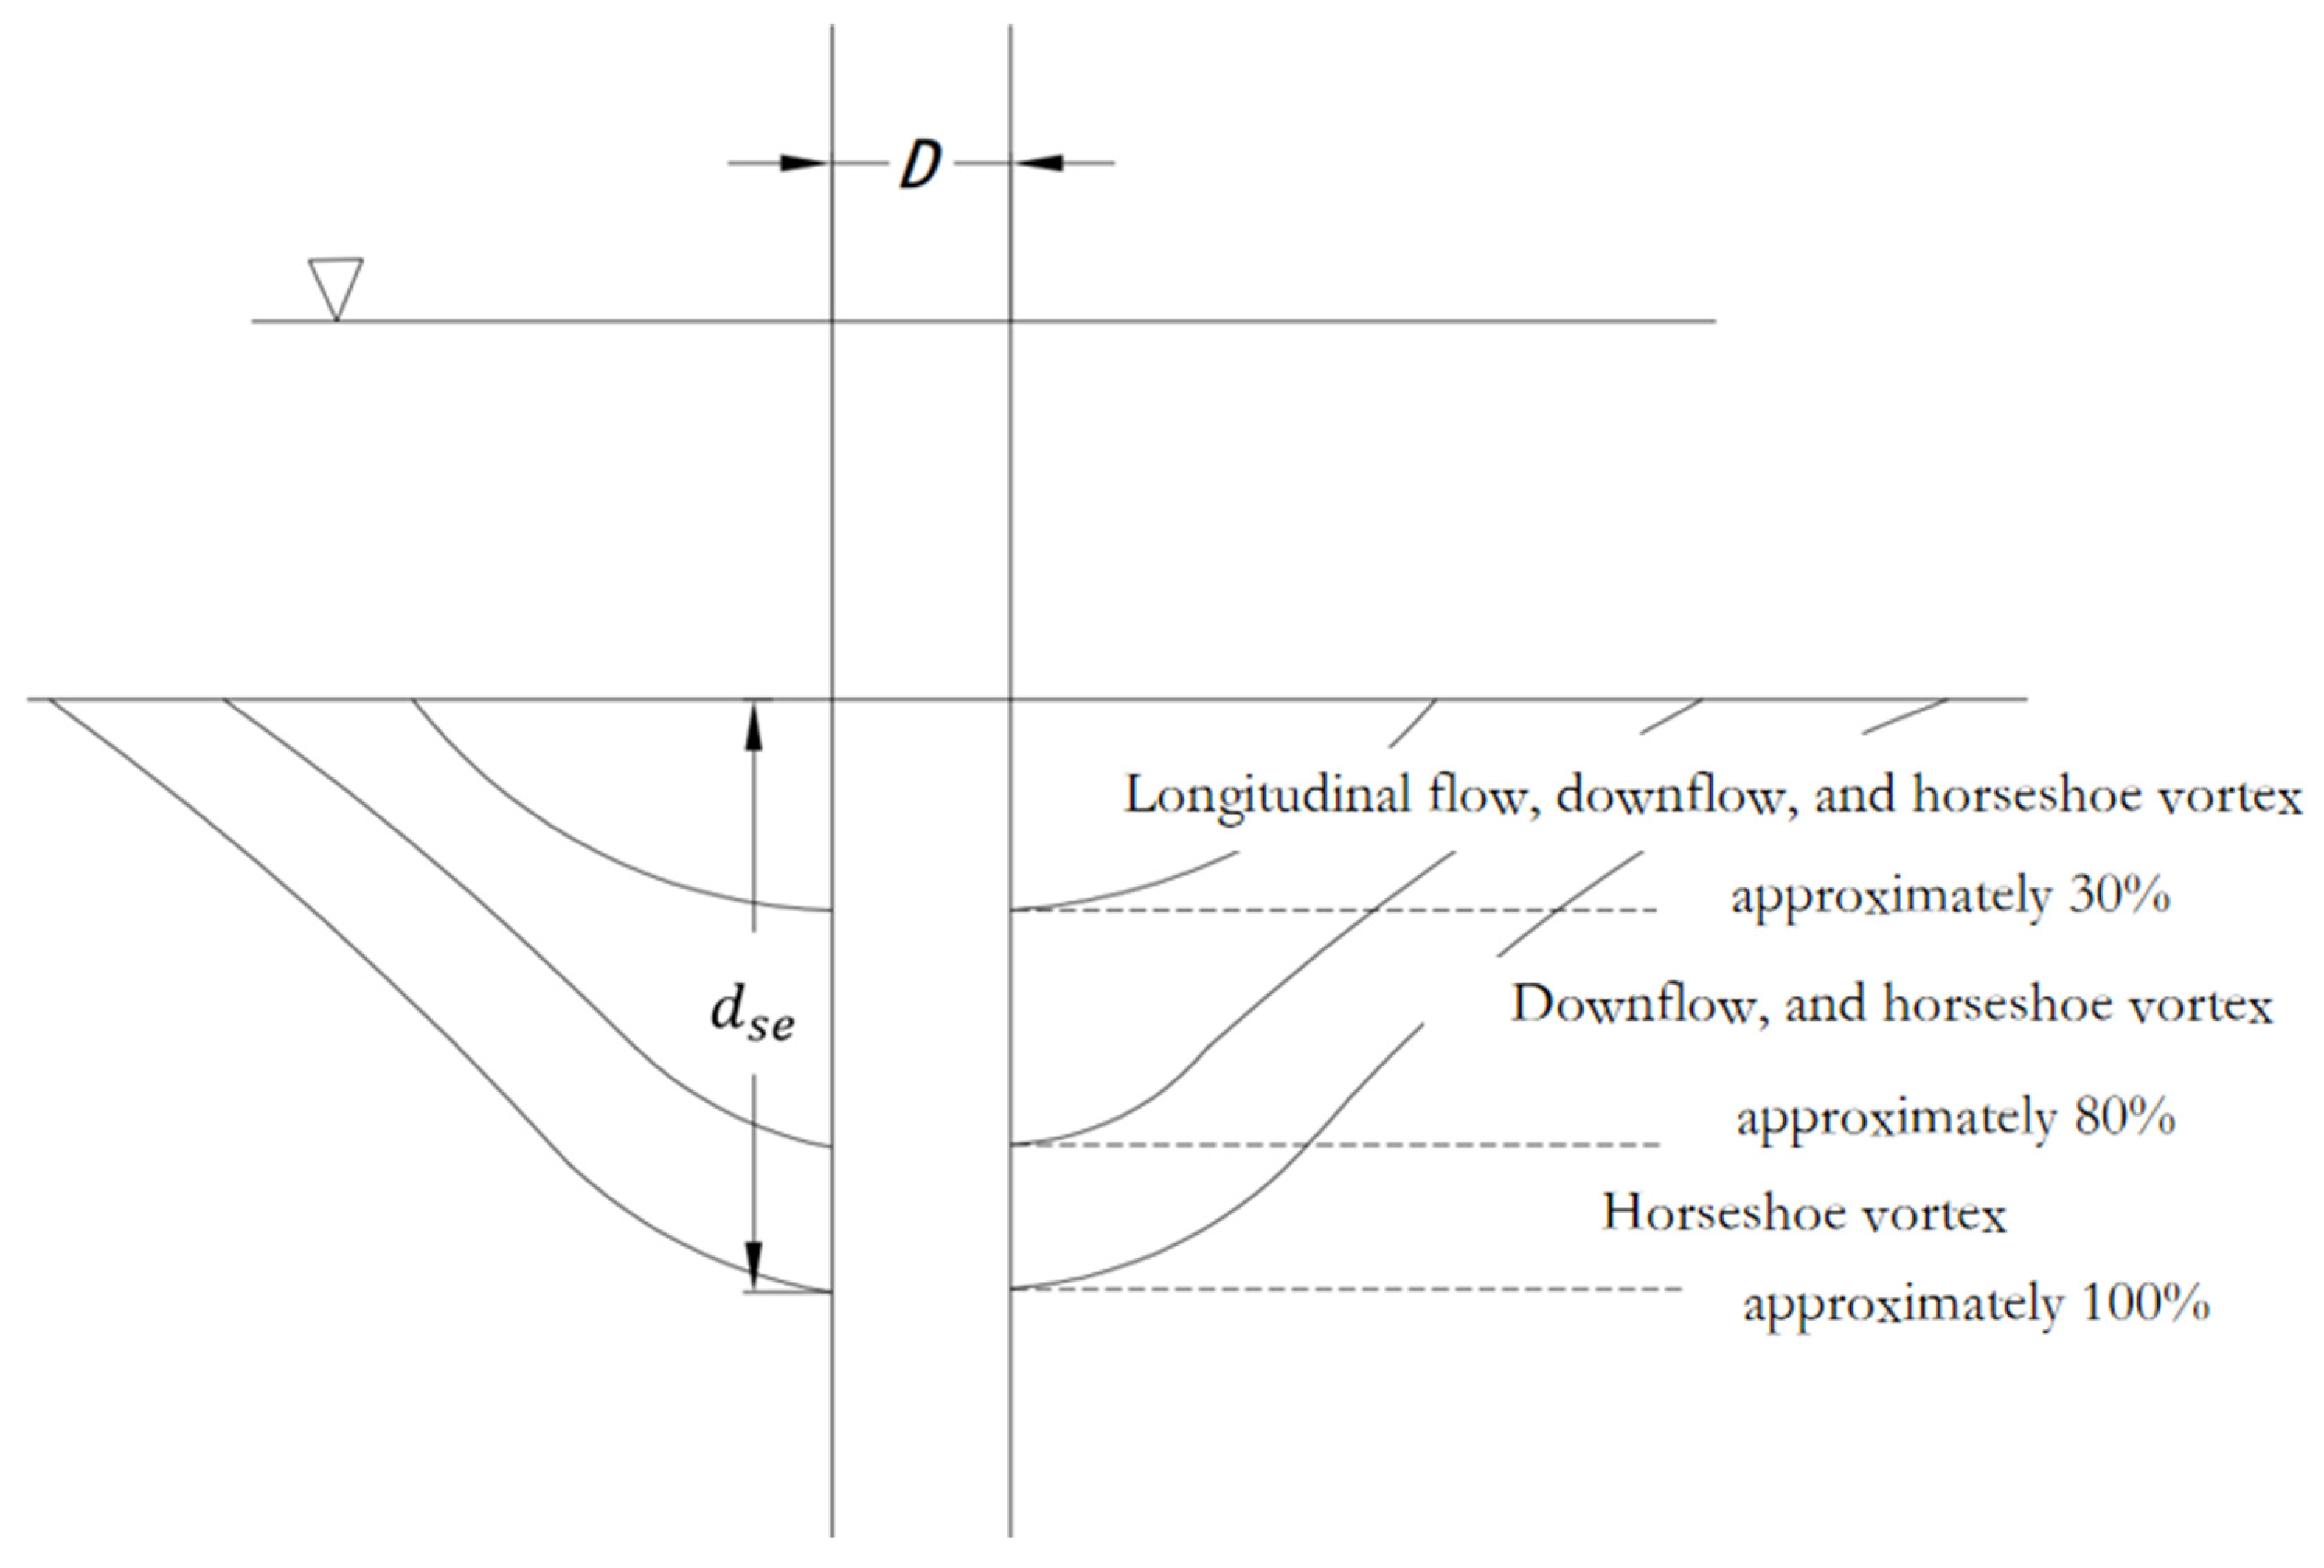
From the scour topography, the left and right slopes on the cross section are basically the same. The slope of the upstream face is short and steep, while that of the stream face is long and gentle, with the maximum depth located at the front edge of the pier. Under given flow and sediment conditions, the profile slope is approximately constant. The cross-sectional slope varies from 0.31 to 0.48, corresponding to a slope angle of between 17.2° and 25.7°. The slope angle of the upstream face varies from 23° to 28.1°, with a slope of between 0.42 and 0.53. The slope angle of the stream face varies from 14.3° to 17.1°, with a slope of between 0.25 and 0.31.
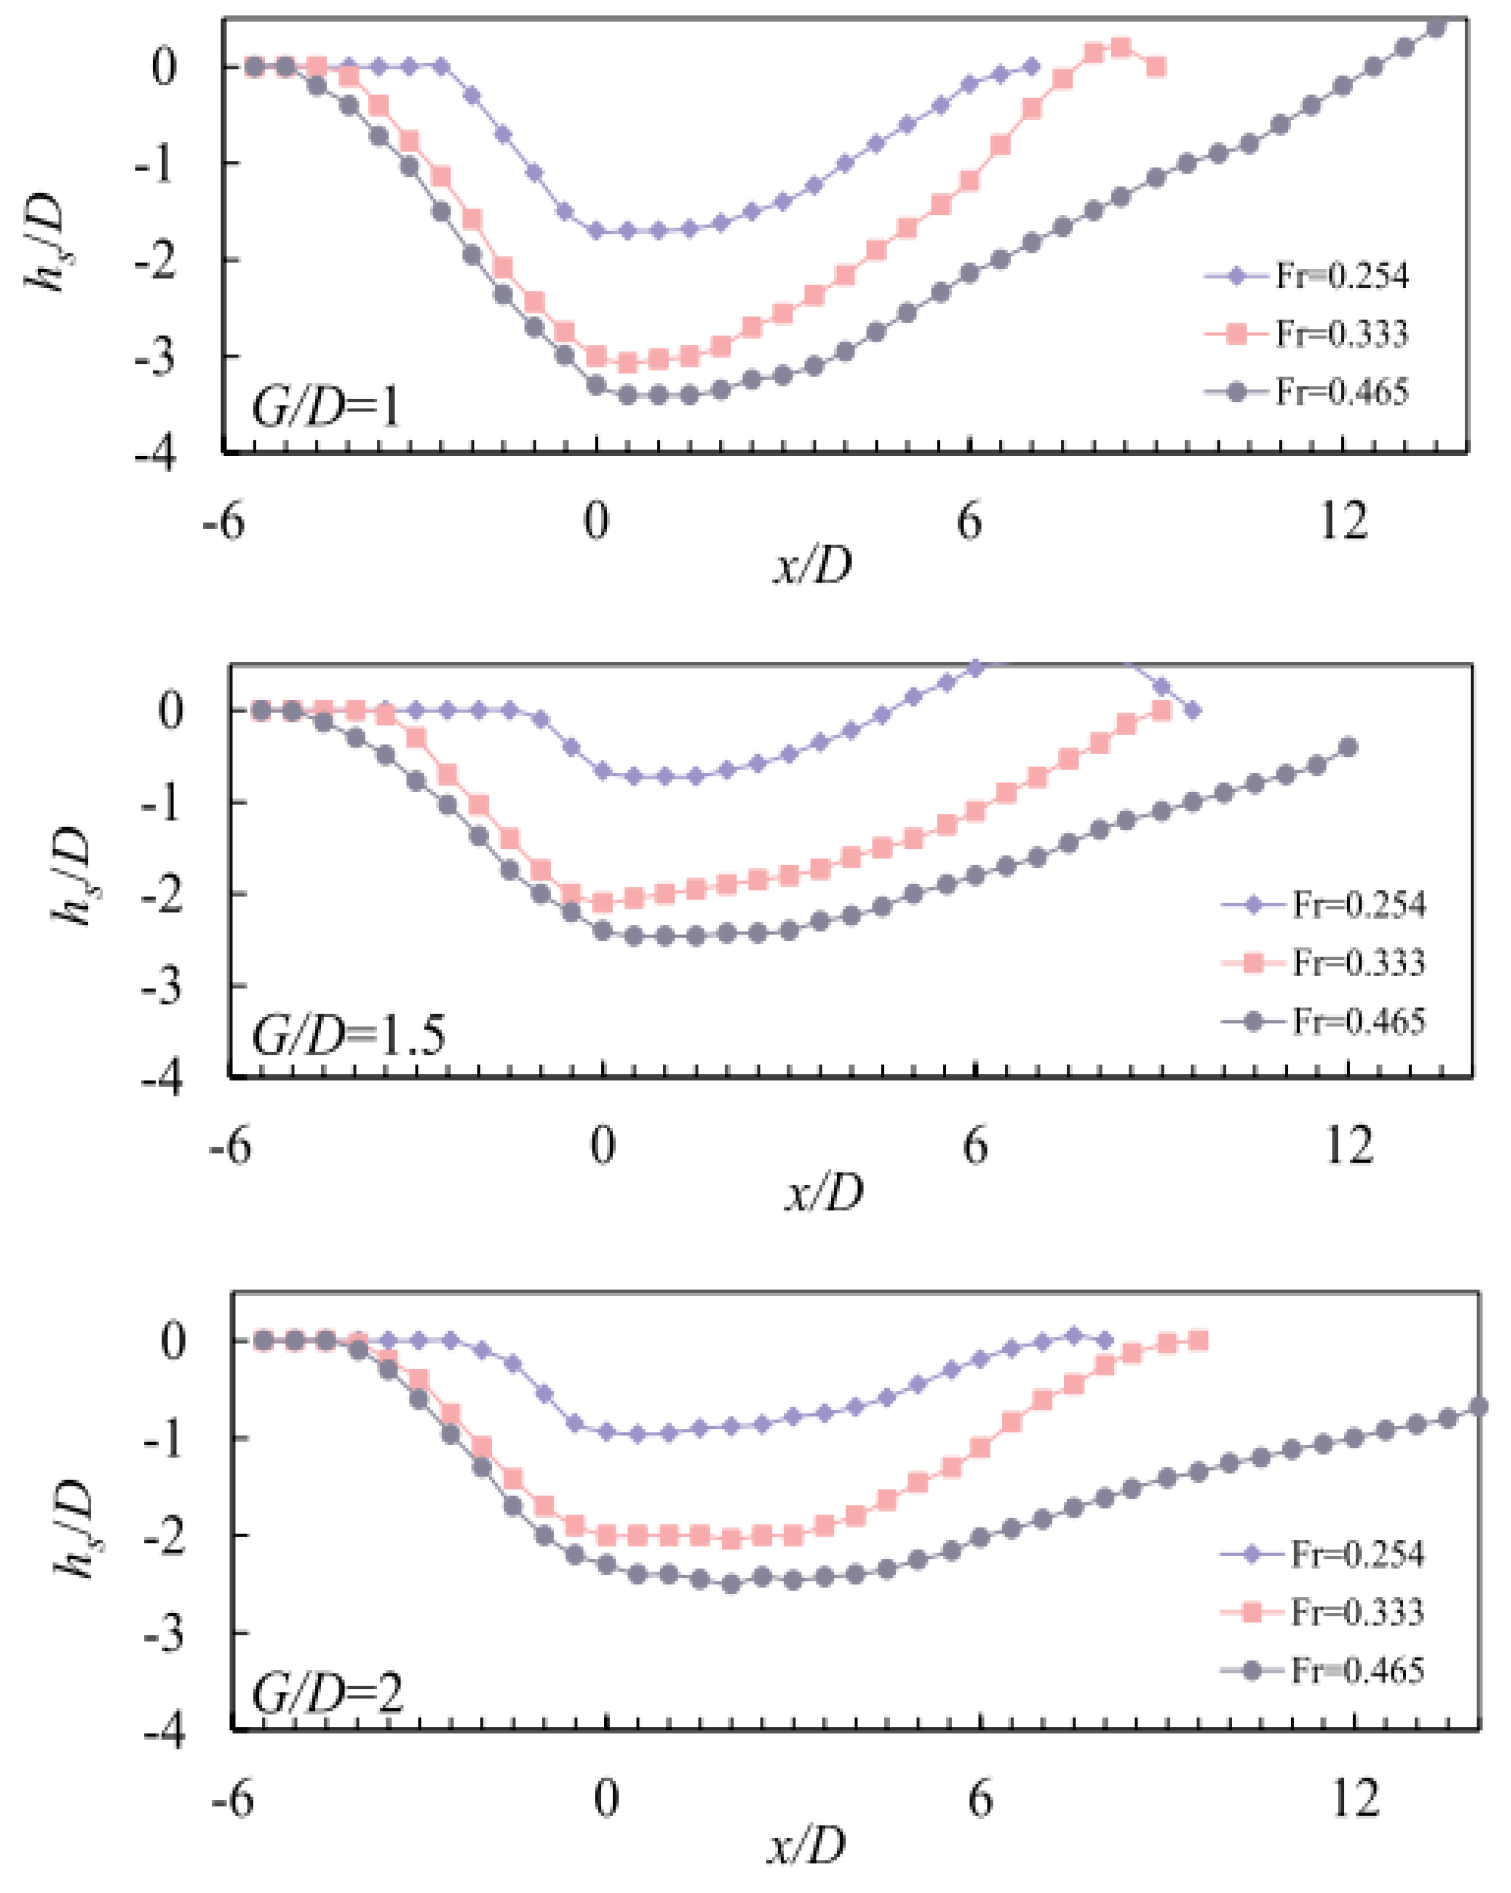
Yilin Yang [9] observed a phenomenon similar to that in this study during his experiment, and the longitudinal profile of the local scour pit on the pier obtained in his experiment is shown in Figure 11.
As shown in Figure 11, the slope of upstream face ranges from 0.46 to 0.9, with a slope angle of 24.7° to 42.0°. The slope of the back surface is approximately 0.2 to 0.29, with a slope angle ranging from 11.3° to 16.4°. With the increase in Fr, the slope of the upstream face changes little, while the slope of the stream face changes greatly.
According to Figure 5, Figure 6, Figure 7, Figure 8, Figure 9, Figure 10 and Figure 11, combined with the observation results from other researchers [17,18,19], it can be summarized that the local scour hole around the pier is composed of two semi-elliptical cones, as shown in 
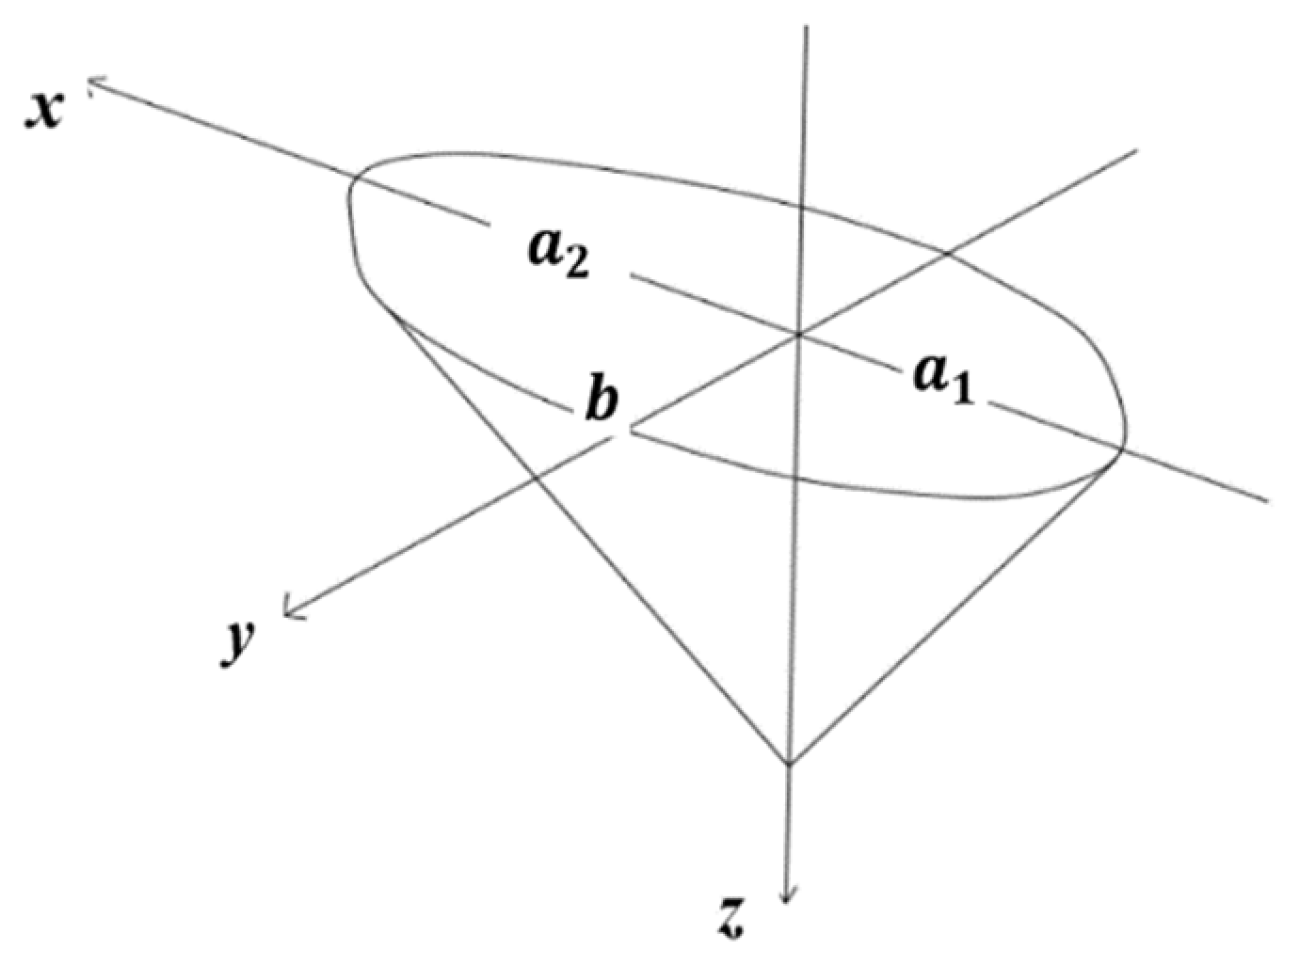
Figure 12. The semi-major axes of the two semi-elliptical cones are a 1   a n d   a 2 , and the height is d s e . The length L = a 1 + a 2 , and width W s = 2b.
The cone equation for an ellipse is as follows:
x 2 a 2 + y 2 b 2 z 2 d s e 2 = 0           x a 1 , a 2
where a is the length of the semi-major axis, and b is the length of the semi-minor axis. The volume of an elliptical cone can be calculated via integration according to the following formula:
V c = V d x d y d z = 0 d s e d z D z d x d y = π 3 a b d s e
Hence, the volume of the scour hole composed of two semi-elliptical cones is as follows:
V c = π 3 a 1 + a 2 2 b d s e = π 6 L b d s e
The projected area of the scour hole is as follows:
S s = π 2 L b
Based on the observation results, the volume of the scour hole can be calculated with Equation (3) using the length L, width 2b, and depth d s e . The measured volume V m   and calculated V c of the local scour hole are listed in Table 1. It can be seen that the difference between the theoretical calculation of the scour hole volume and the measured value is not significant, indicating that this assumption is reasonable.
Based on the data presented in Table 2, it is evident that the volume of the local scour pit derived from theoretical calculations V c does not significantly differ from the measured volume V m   , thereby validating this assumption.
Das [18] measured the length, width, and depth of the scour hole based on local scour experiments and calculated the scour volume V m   . Based on the double semi-ellipsoidal cone assumption above, the local scour hole volume is also calculated using Das’s experimental data. The calculated volume V c is compared with measured ones in Table 2. The results show that the difference is very small, indicating that this assumption is consistent with reality.
For cylindrical piers, the volume of the scour hole calculated by Equation (3) in this research is in good agreement with the value measured by Das [18], with a relative error of less than 1%. This means that the double semi-elliptical cone assumption is consistent with the actual condition of cylindrical piers. The relative errors of the three forms of square columns, triangular columns, and flat plates are between 6.84% and 13.65%, which are within a reasonable range. The differences between the scour pit volumes of triangular columns and cylindrical columns and theoretical calculations are the largest.
To summarize, the scour hole around the bridge pier exhibits the following characteristics: local scour hole can be approximated as a combination of two semi-elliptical cones, with a steep slope on the upstream face and a relatively gentle slope on the back face. Under given flow and sediment conditions, the slope of the scour hole profile is approximately constant. The cross-sectional slope angle is between 17.2° and 25.7°, the upstream slope angle is between 23° and 42.0°, and the stream slope angle is between 11.3° and 17.1°.

3.2. Flow Scour Experiments

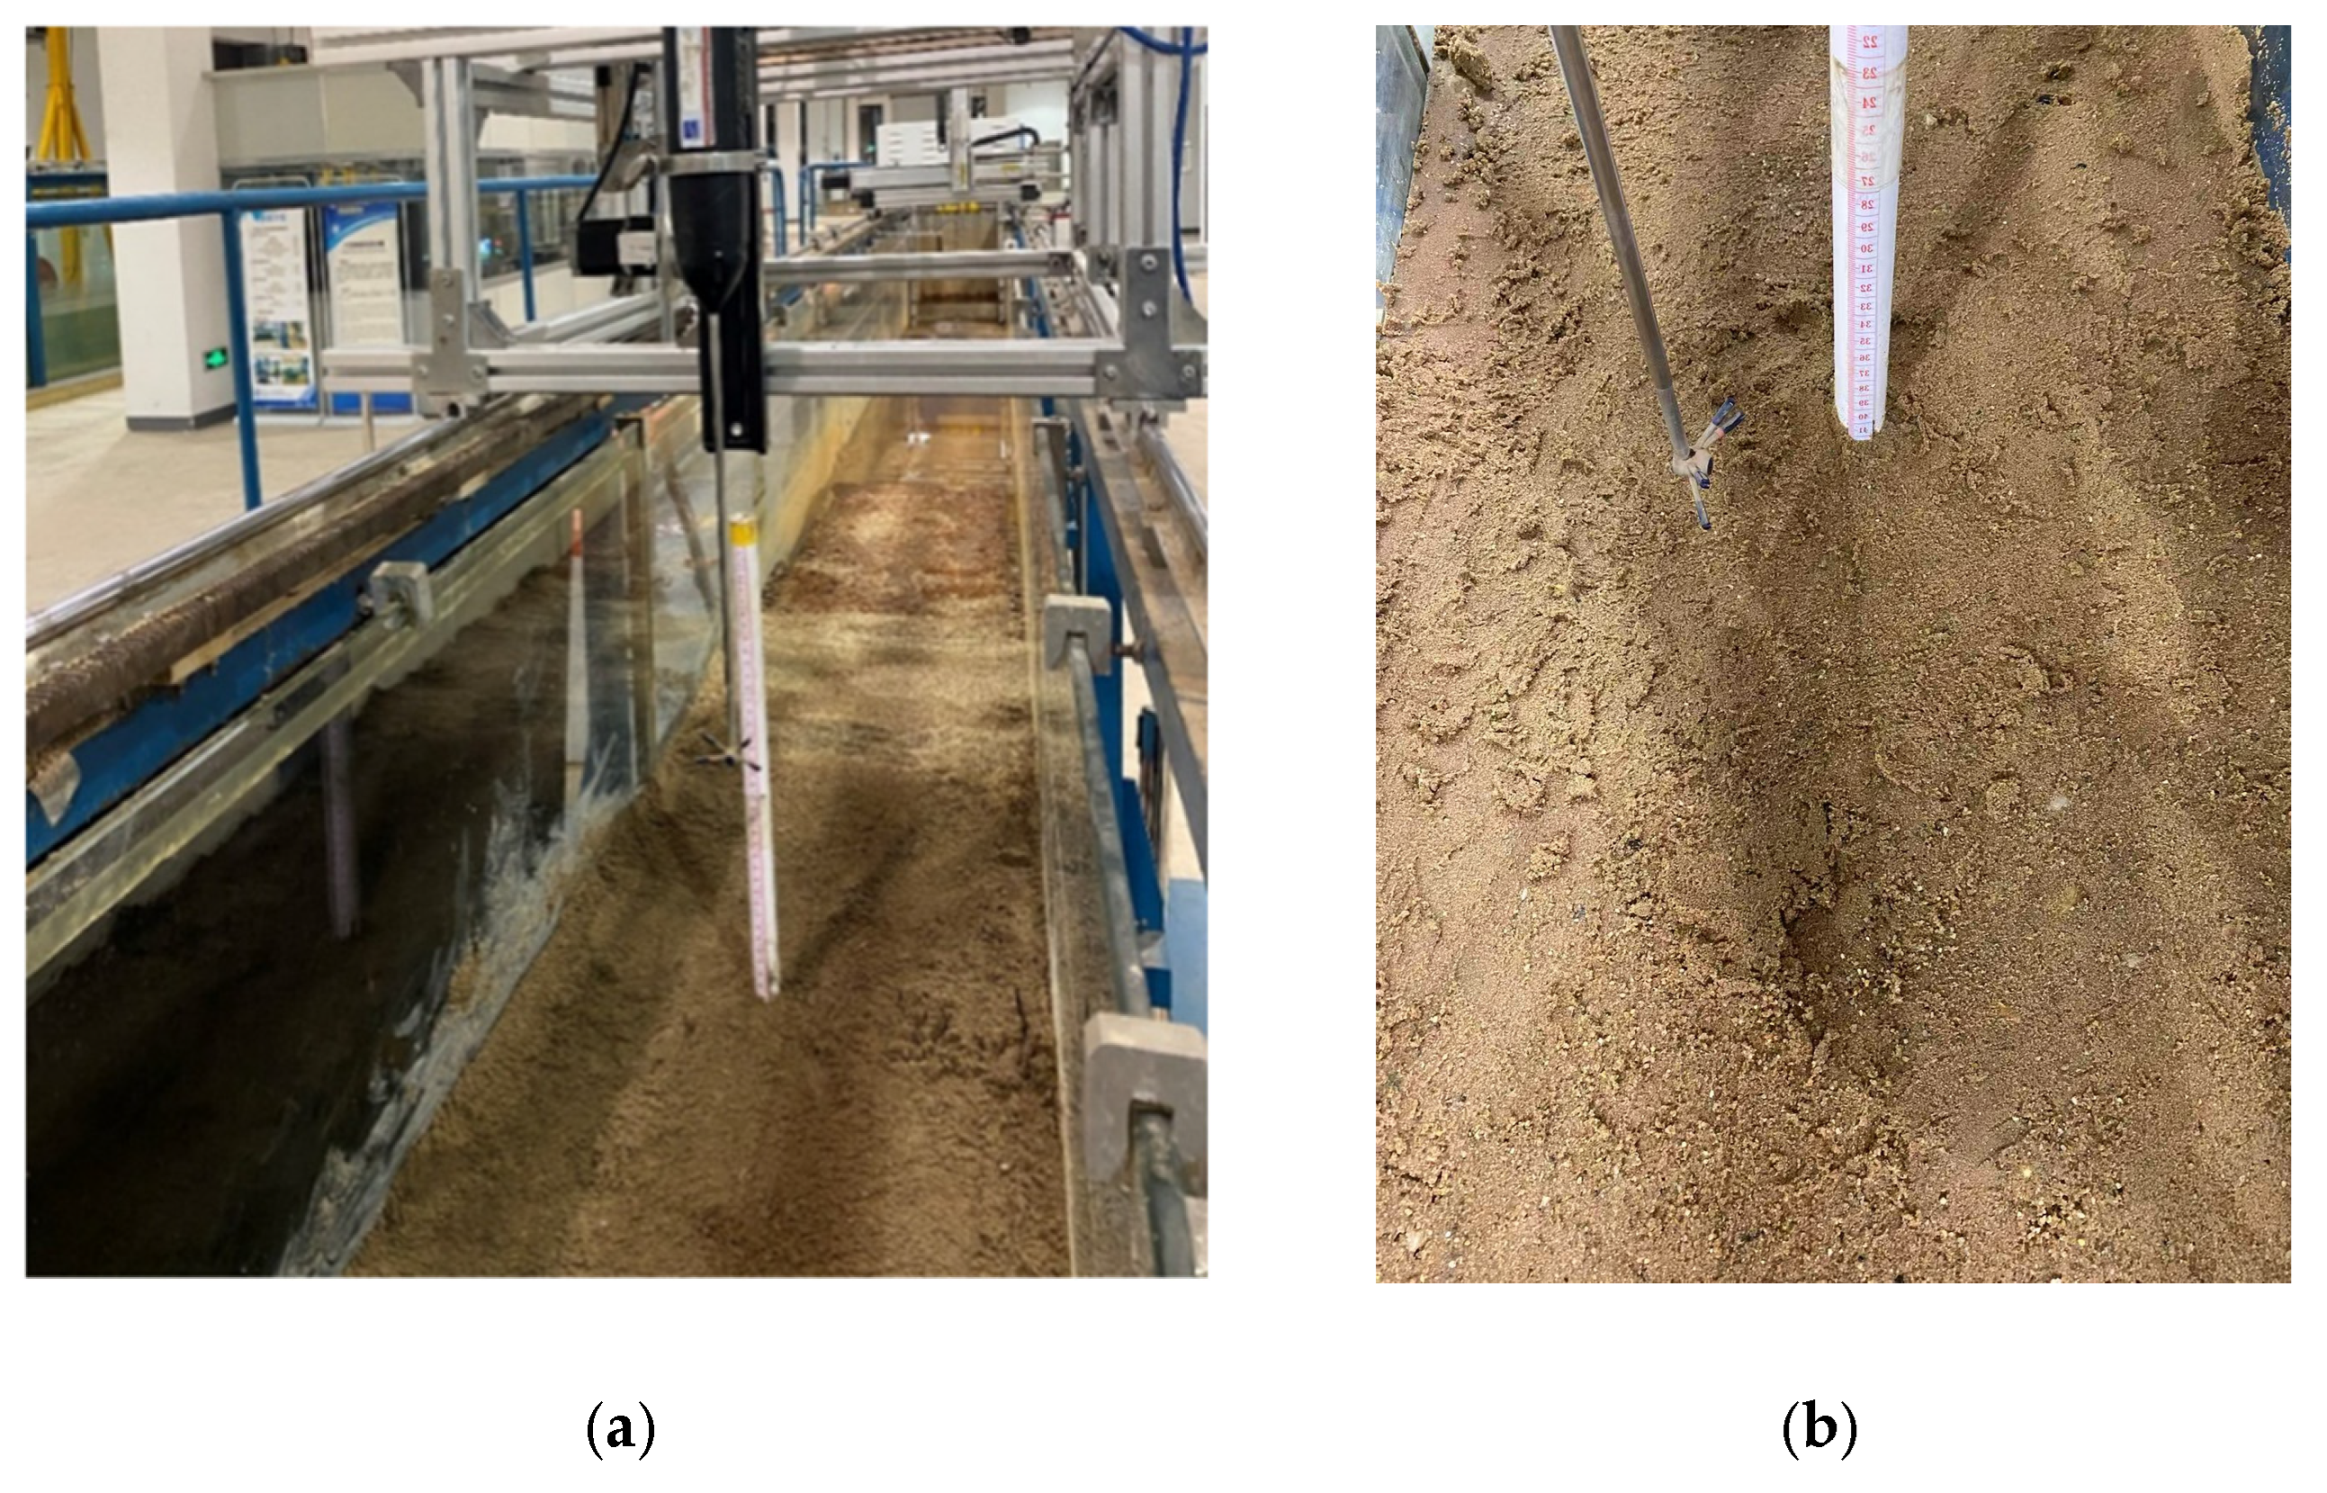
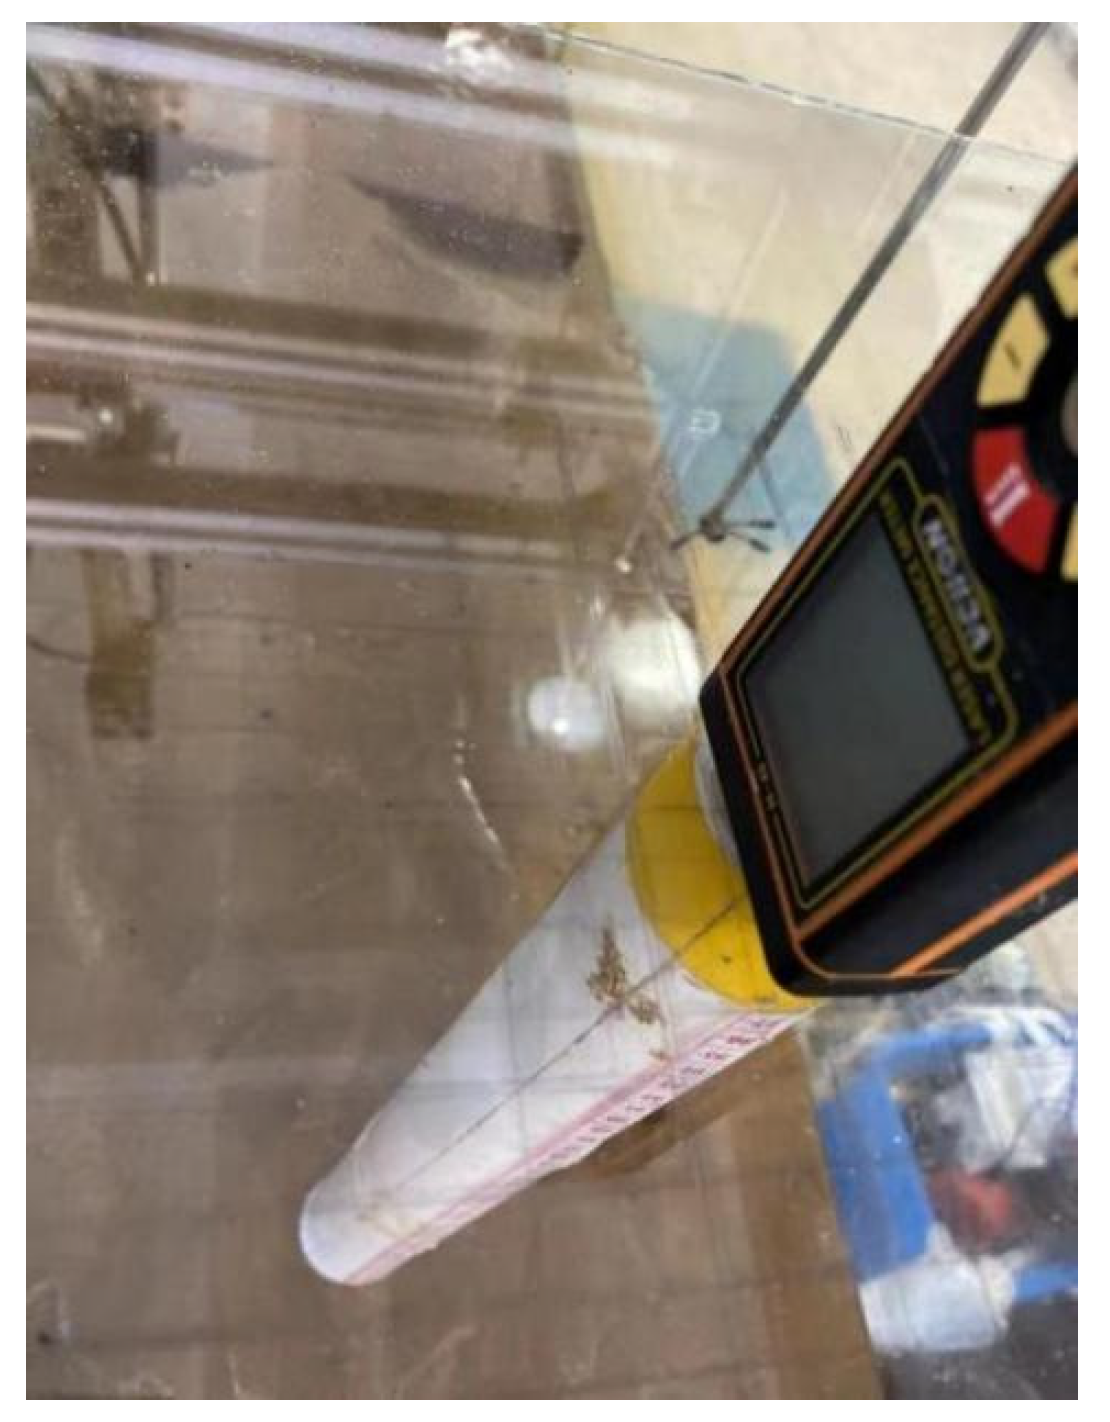
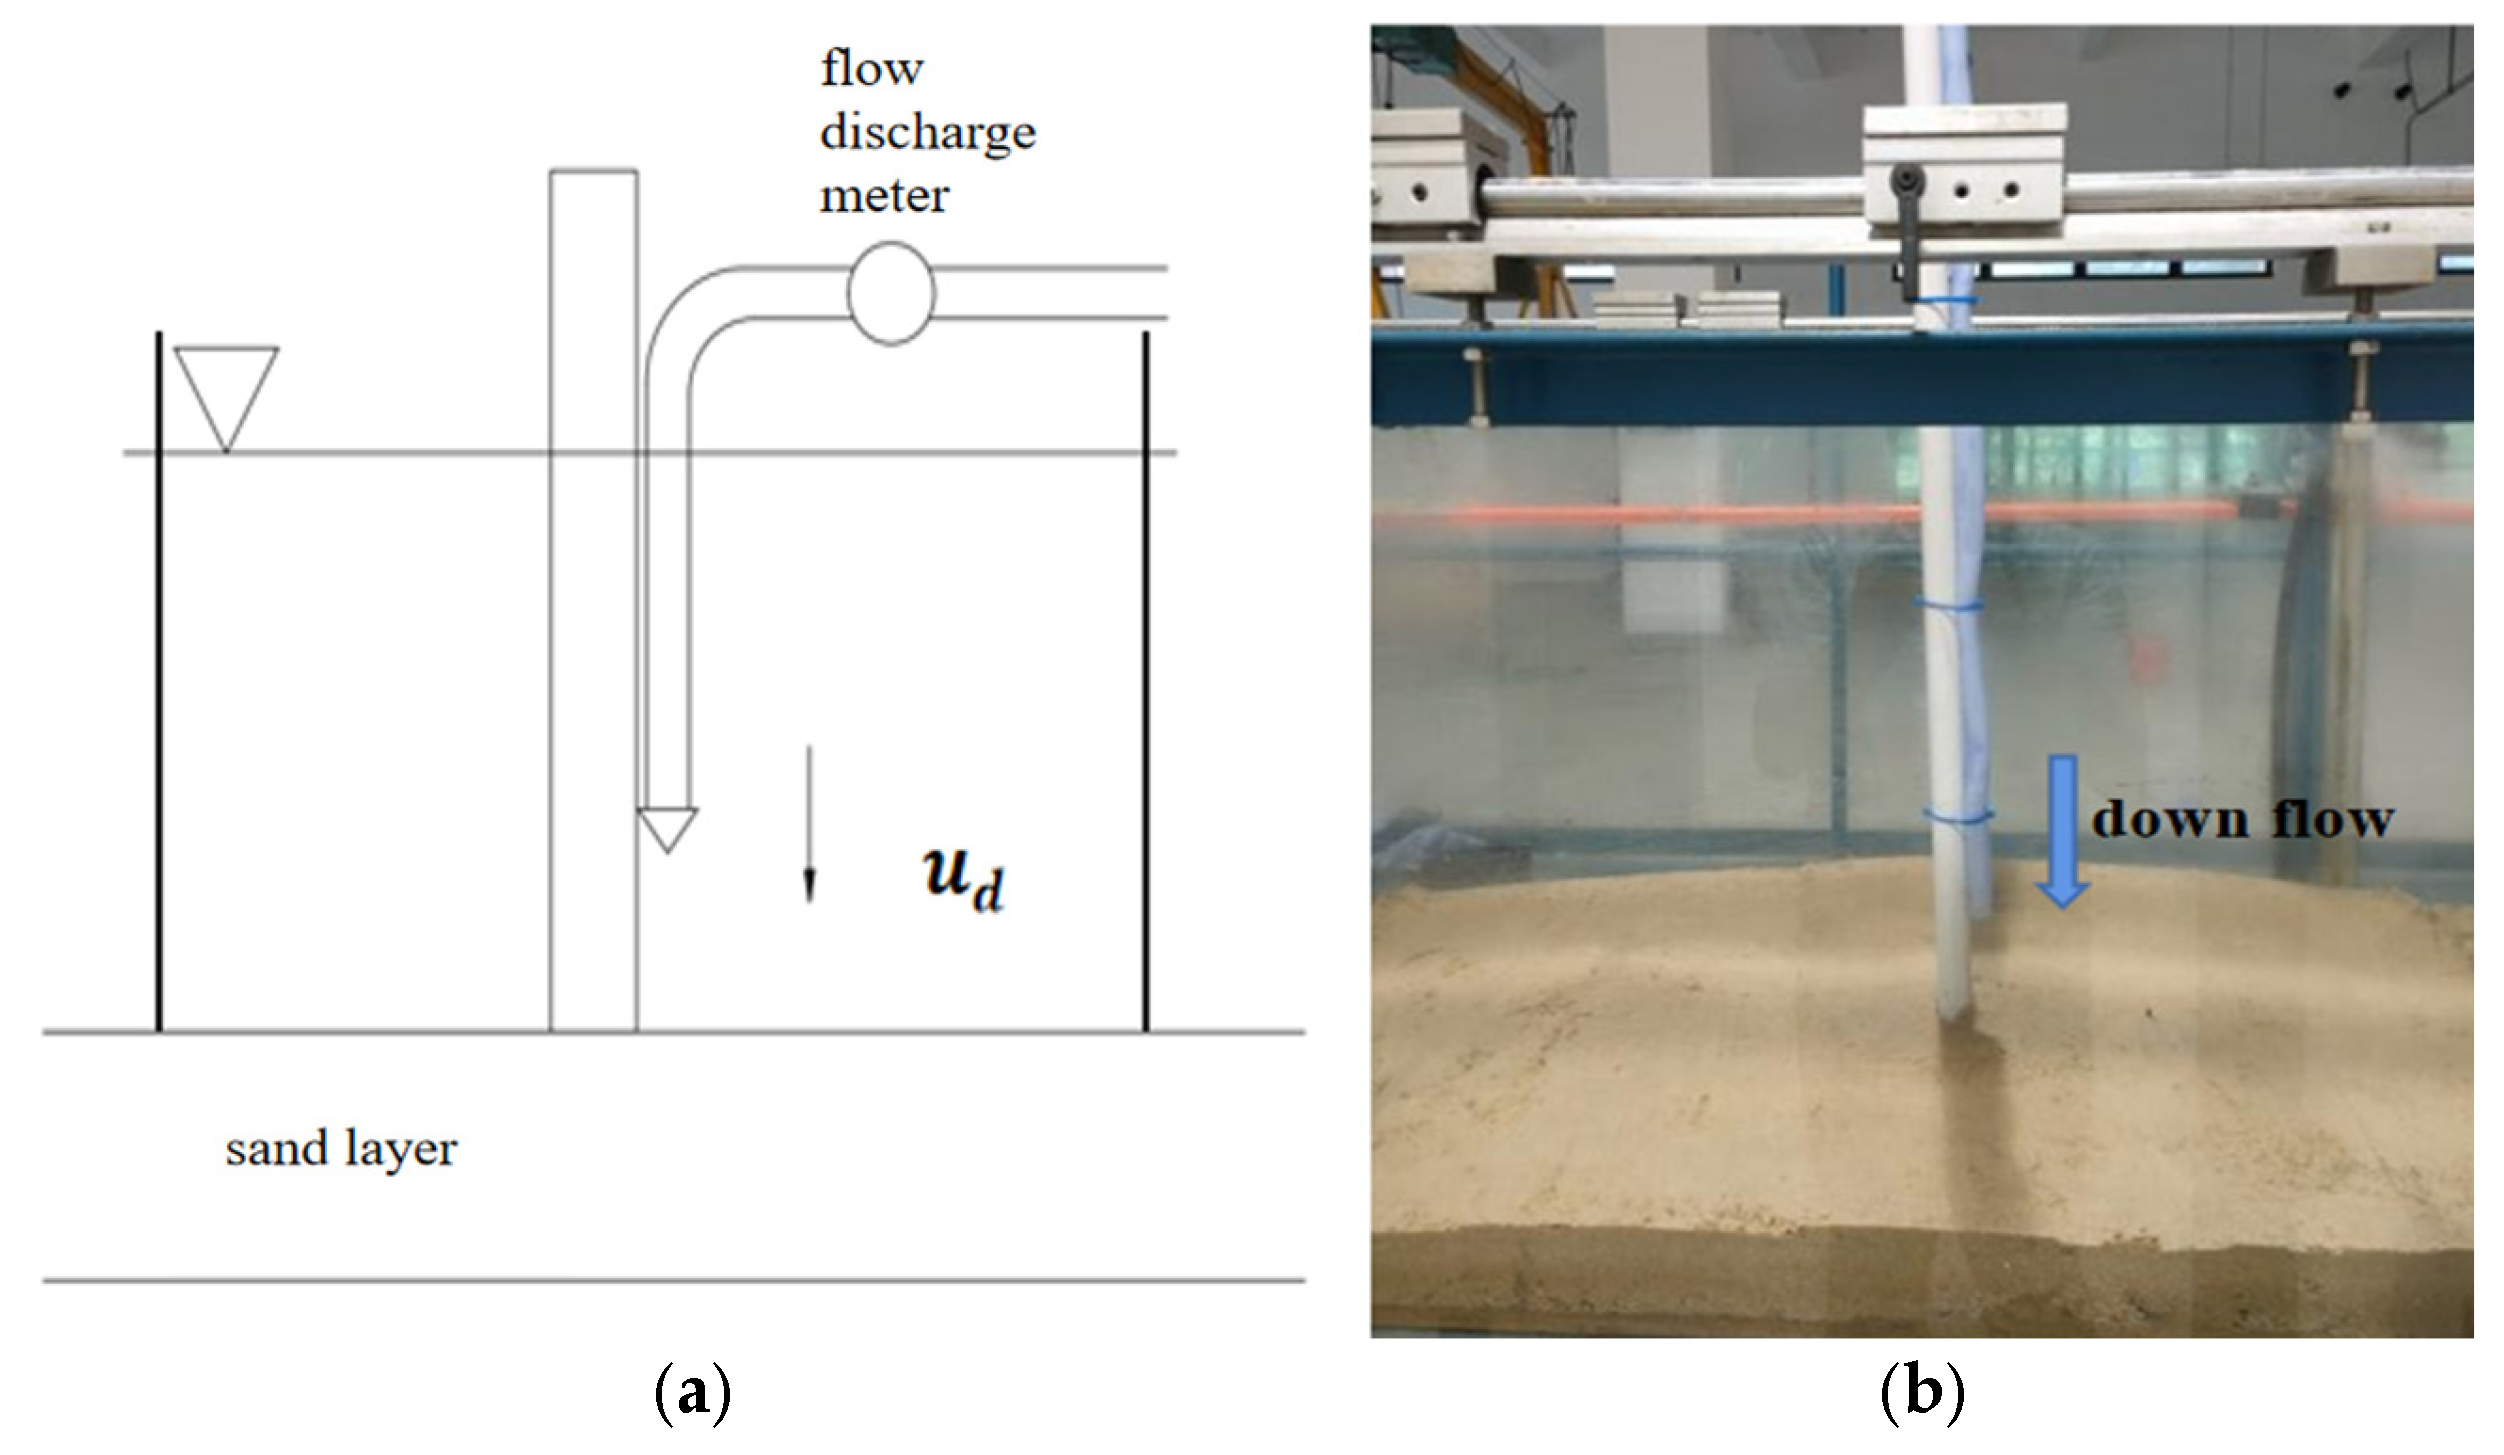
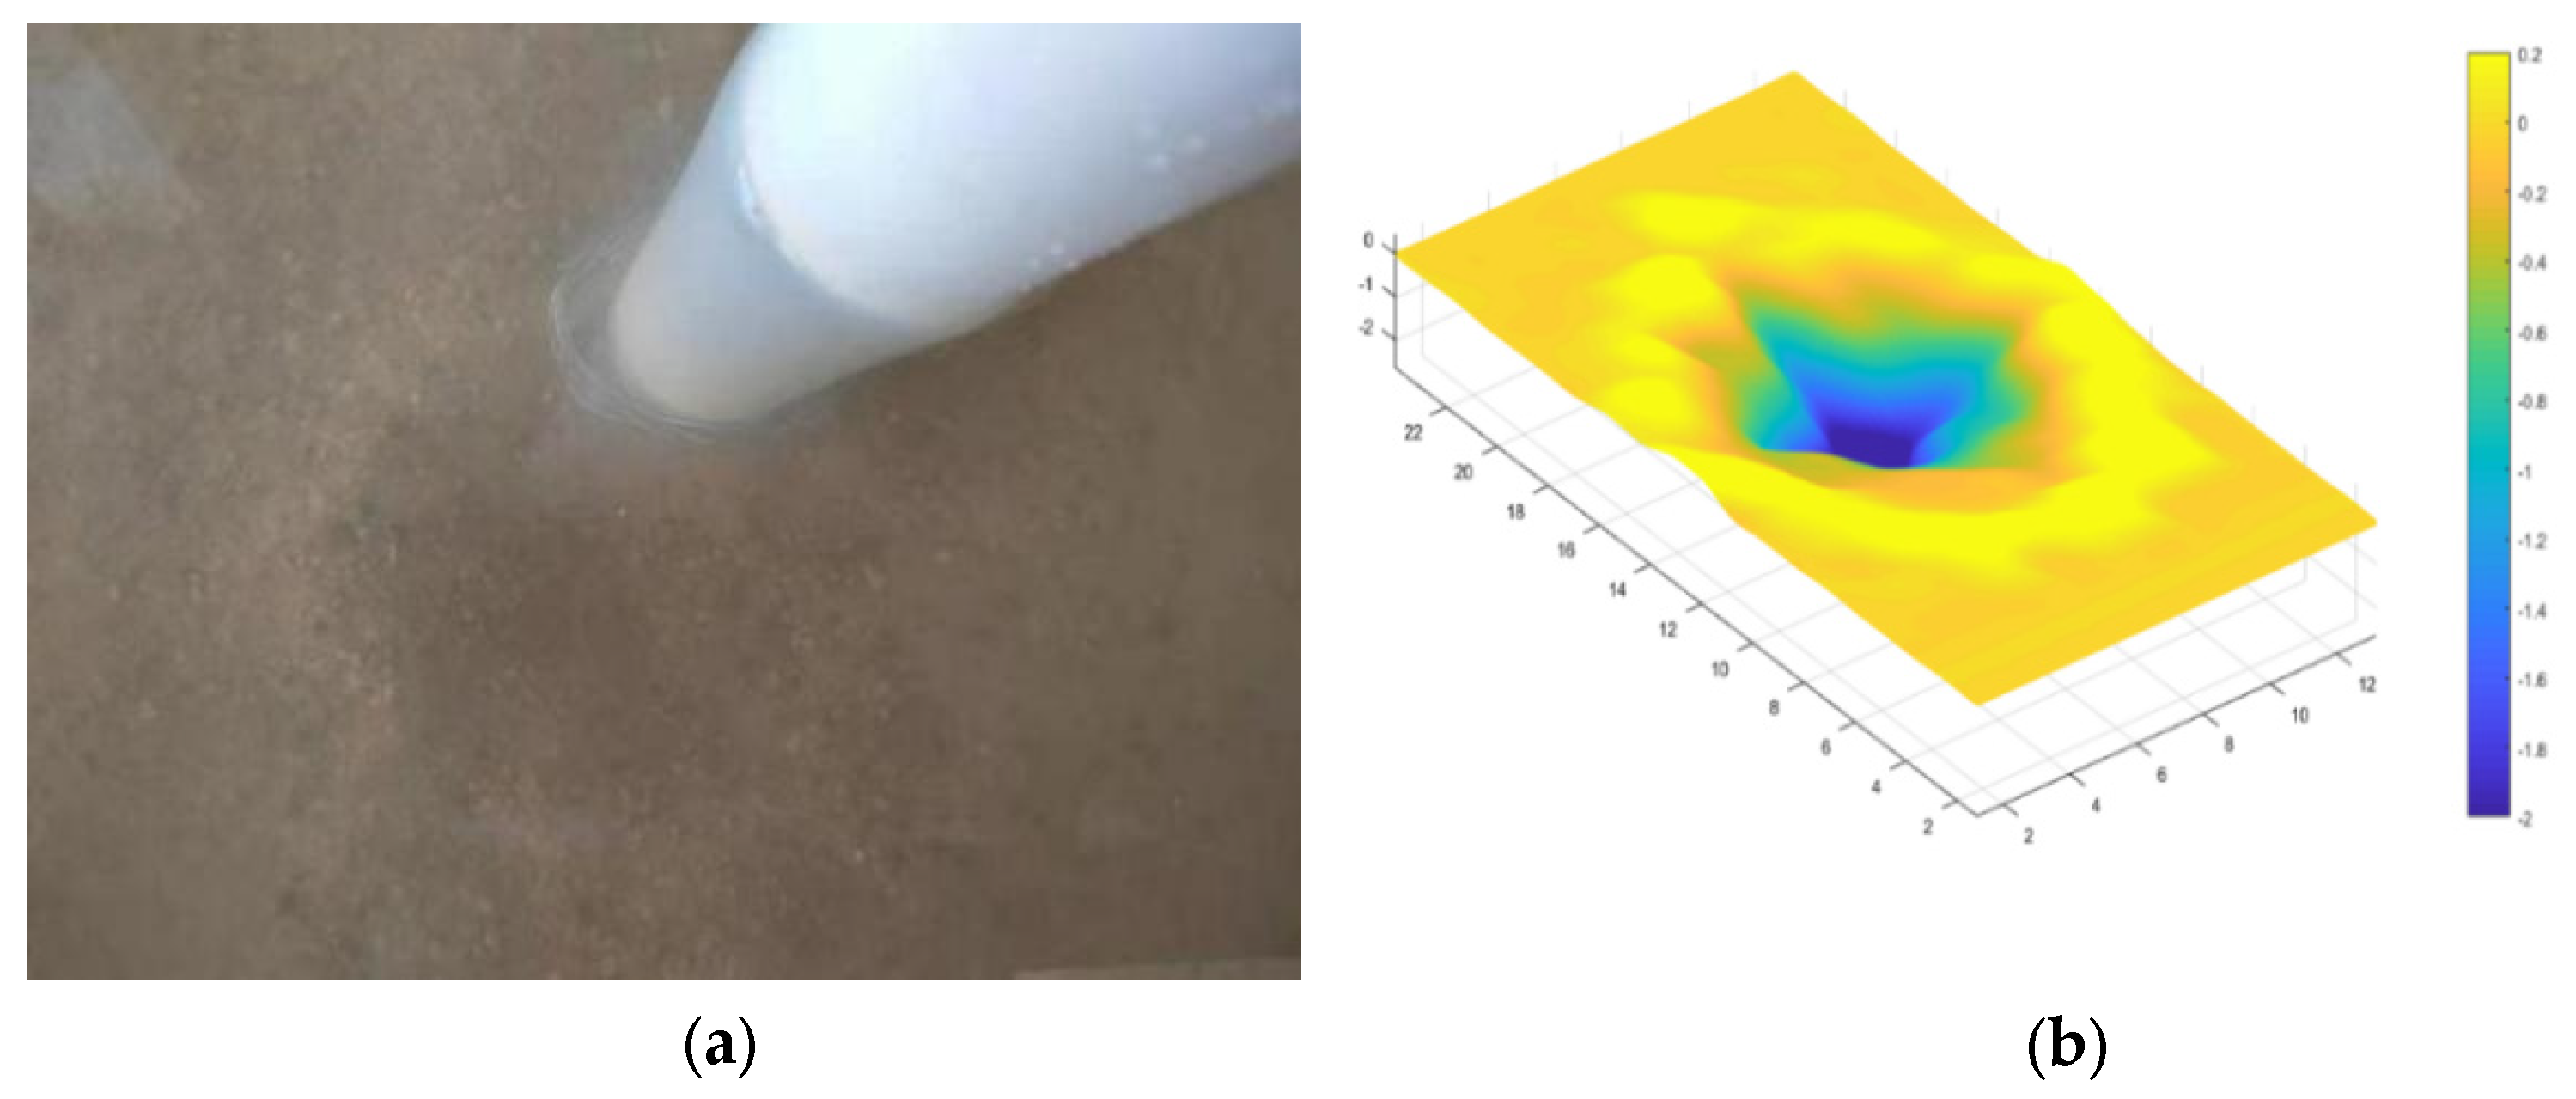
To analyze the contribution of flow to local scour, flow scouring experiments were conducted at Zhejiang University. A cylindrical bridge pier was fixed in a sandy area with a nozzle on the pier side to simulate the flow, which can avoid the scouring effect of longitudinal flow and horseshoe vortex. The range of the flow is equal to the width of the bridge pier, so the inner diameter of the water pipe ought to be the same as the pier diameter. According to the experimental observations and numerical simulation results, the maximum flow velocity in front of the pier is slightly higher than 1/4 of the approaching flow velocity. Therefore, the average pipe flow velocity is taken as 1/4 of the experimental approaching flow velocity. A 2 m long and 10 cm thick sediment was placed at the bottom of the water tank. At both ends of the sand laying section, glass plates with a height of 30 cm are used to maintain a constant water depth of 20 cm. The layout is shown in Figure 13, where Figure 13a represents the experimental design, and Figure 13b represents the actual experiment.
After the water storage is completed, we adjust the flow discharge to ensure that the flow velocity in the pipeline is 2.5 cm s−1 and 5.0 cm s
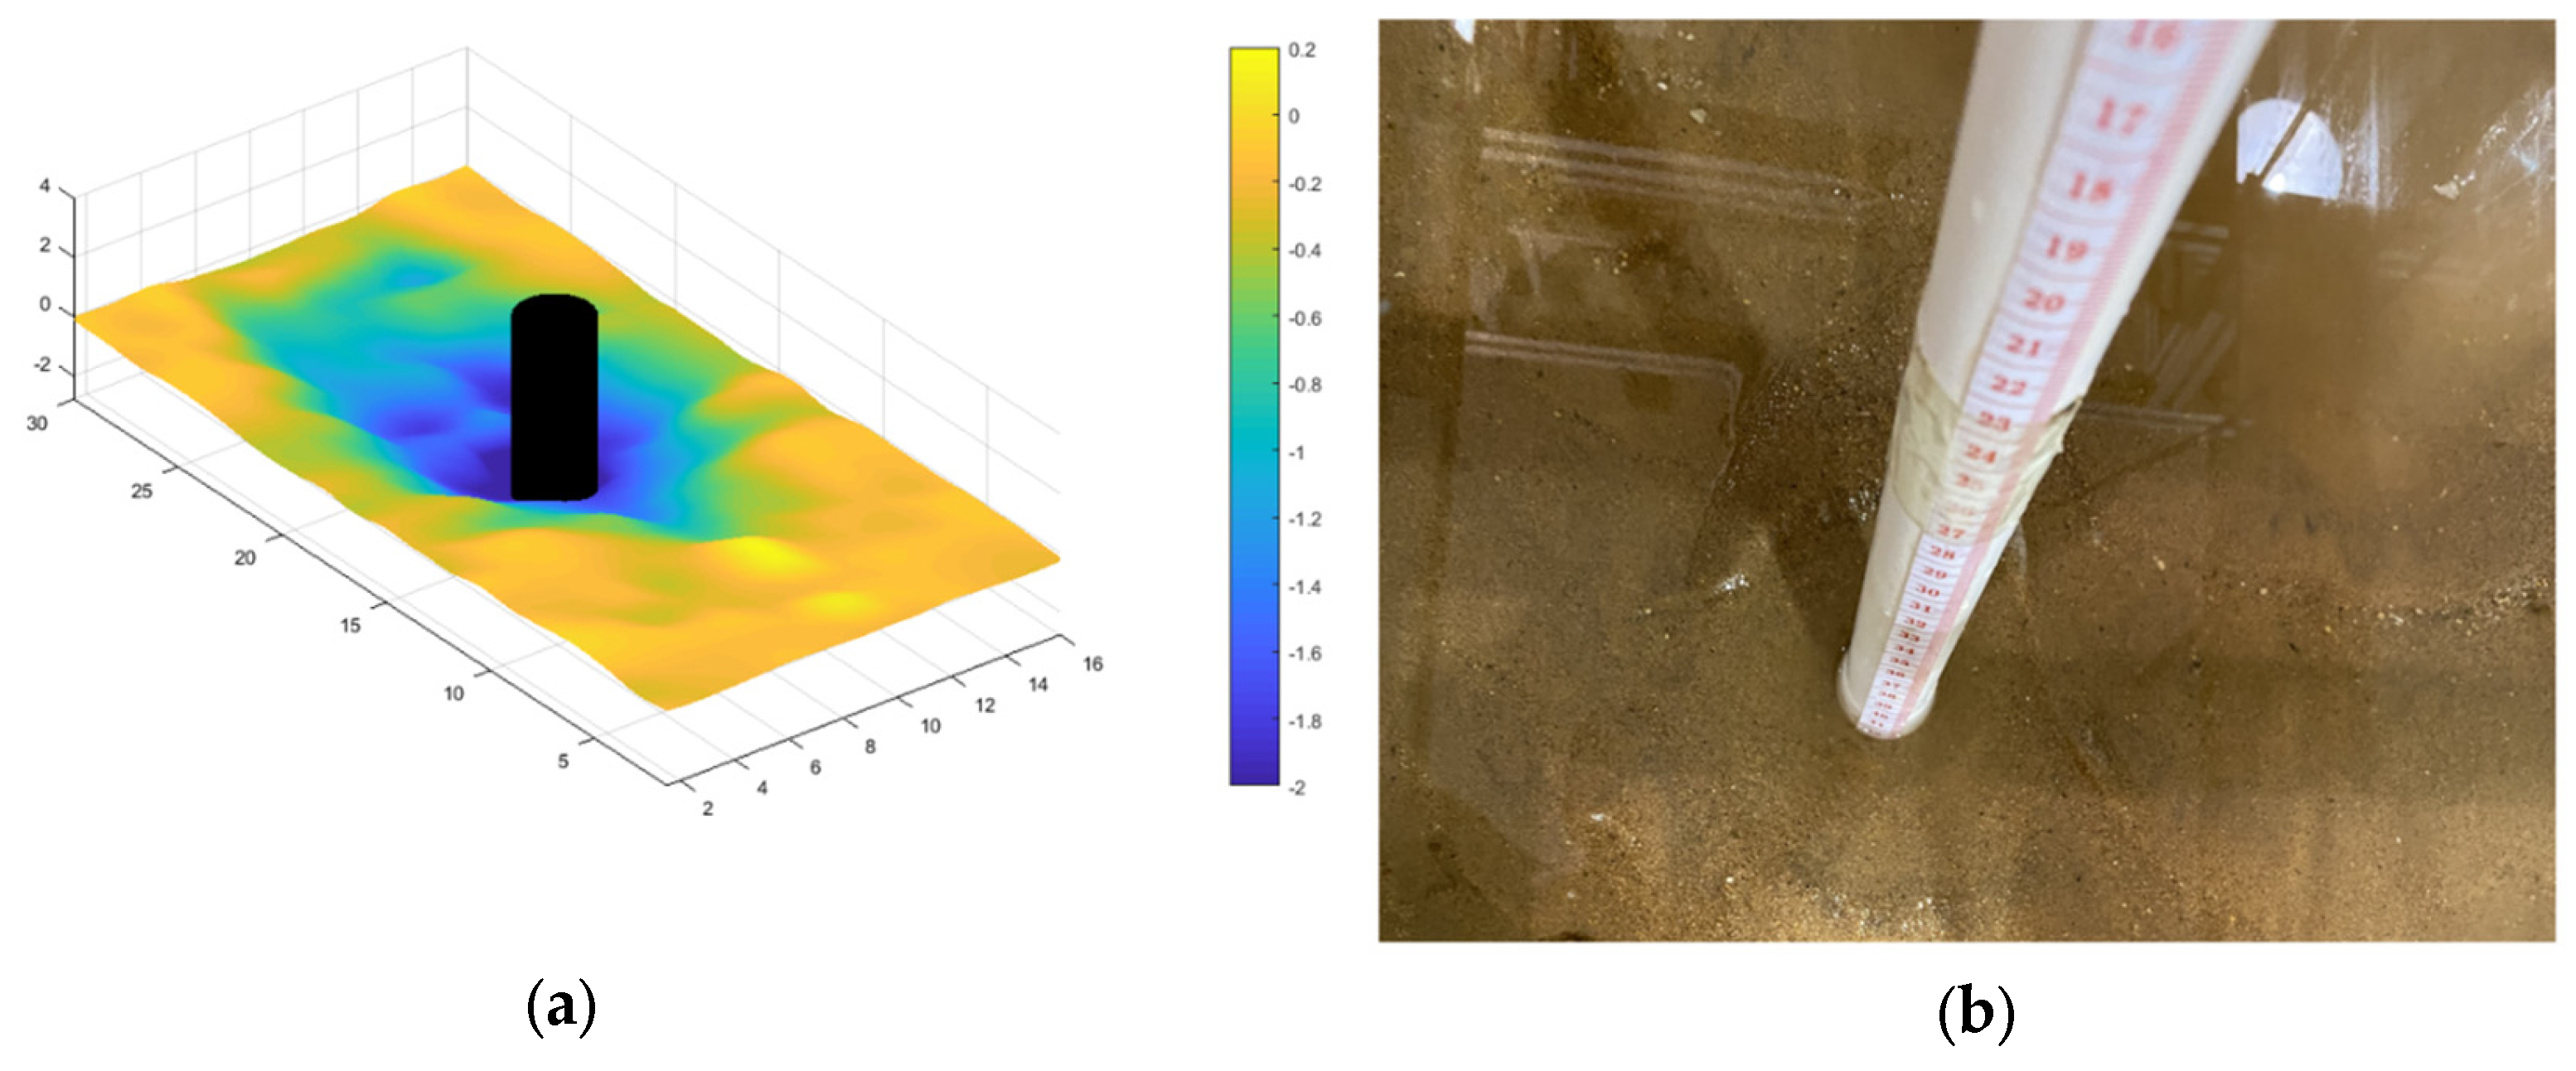
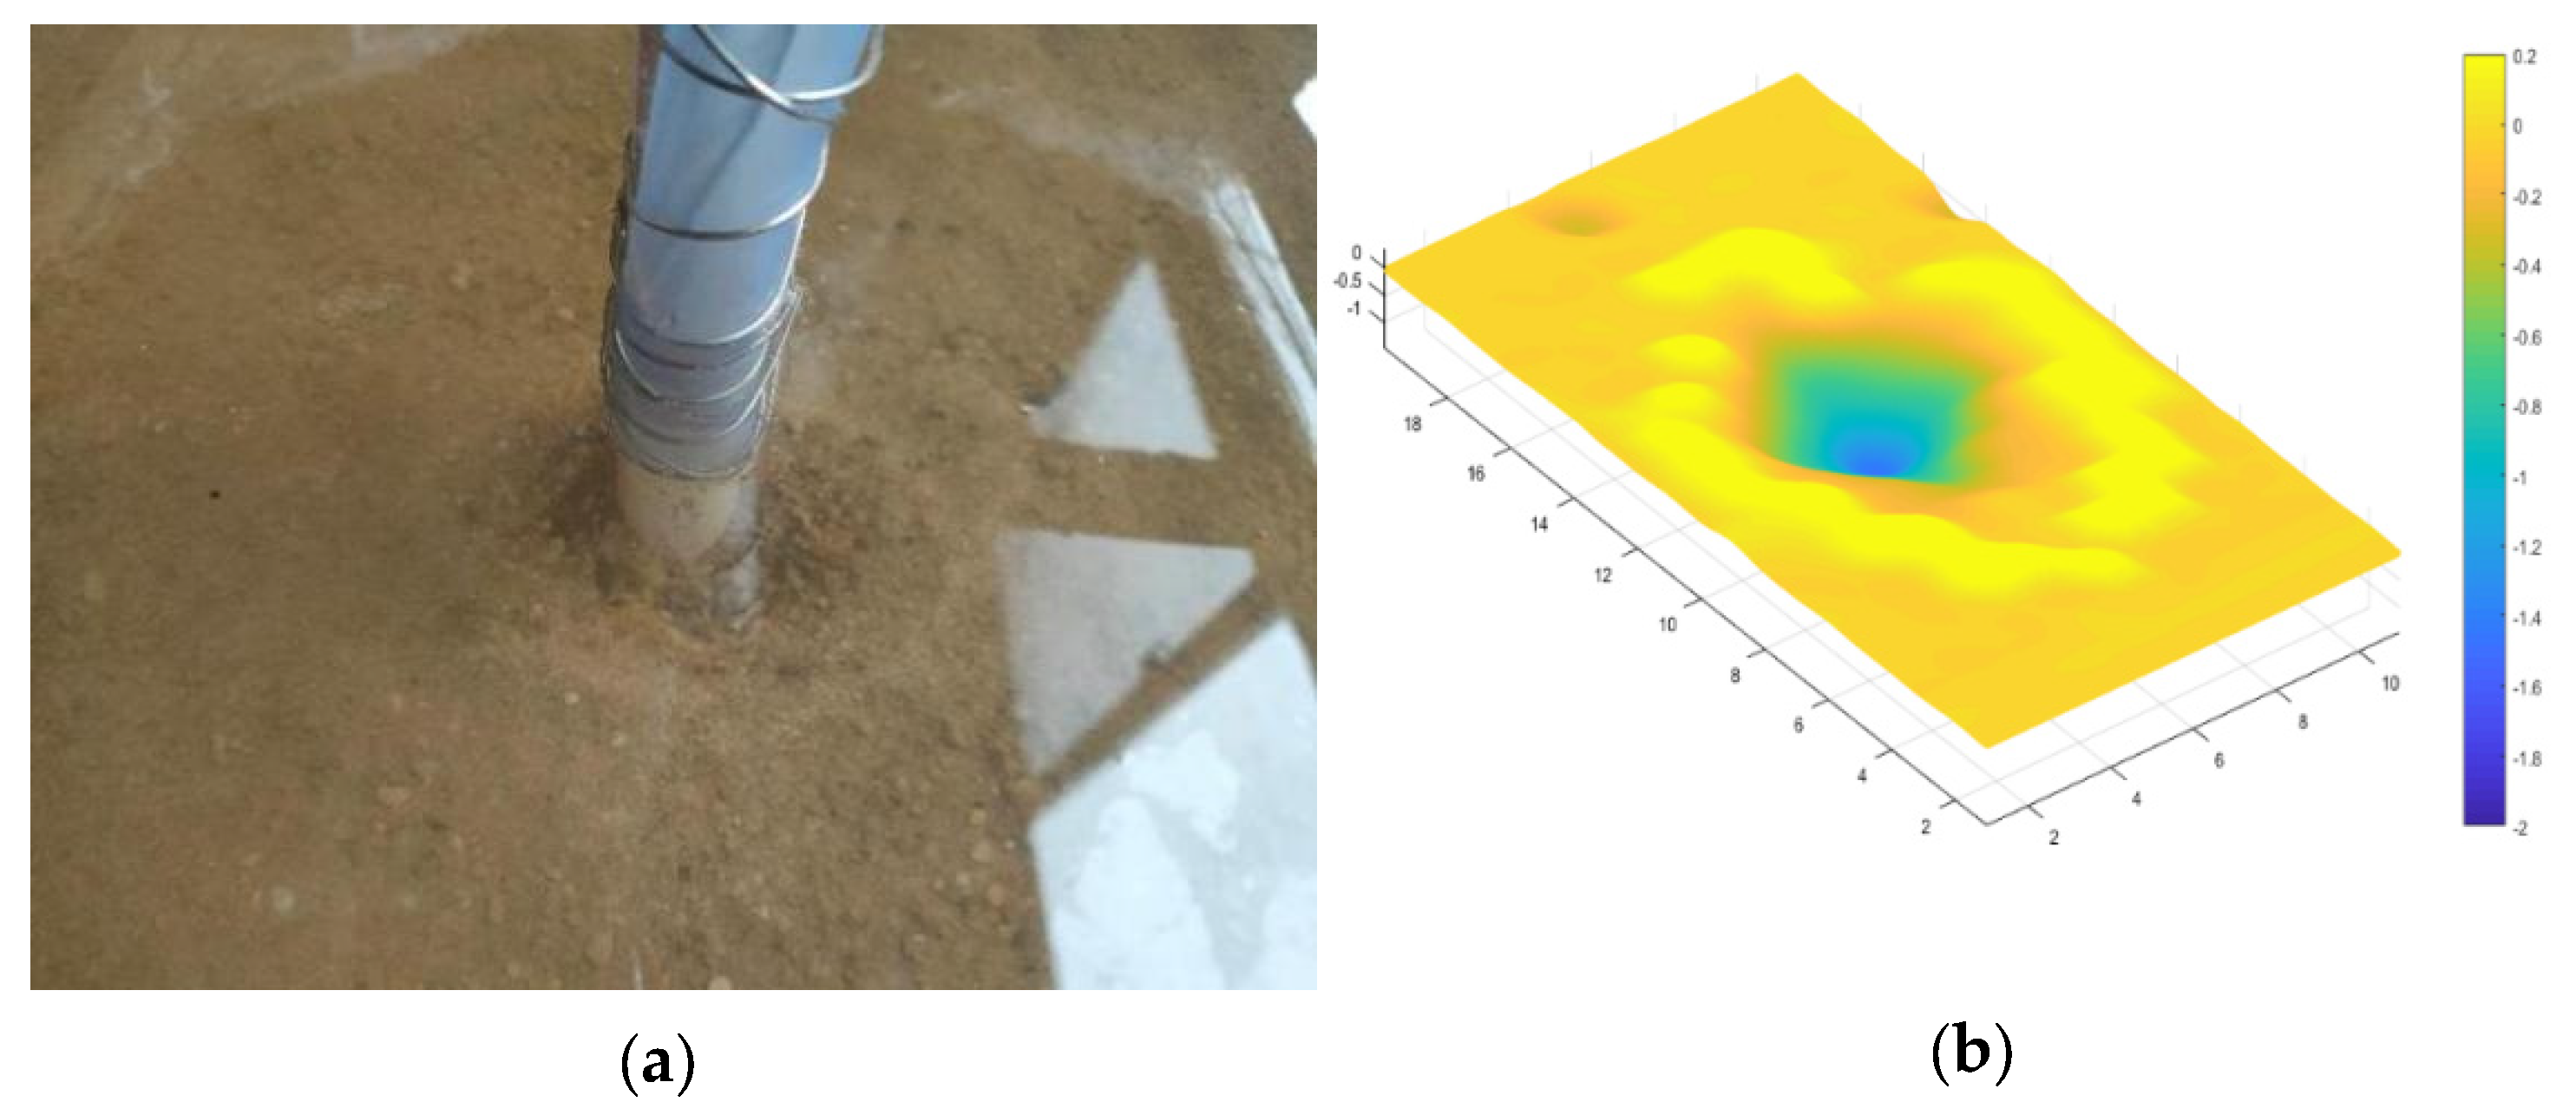
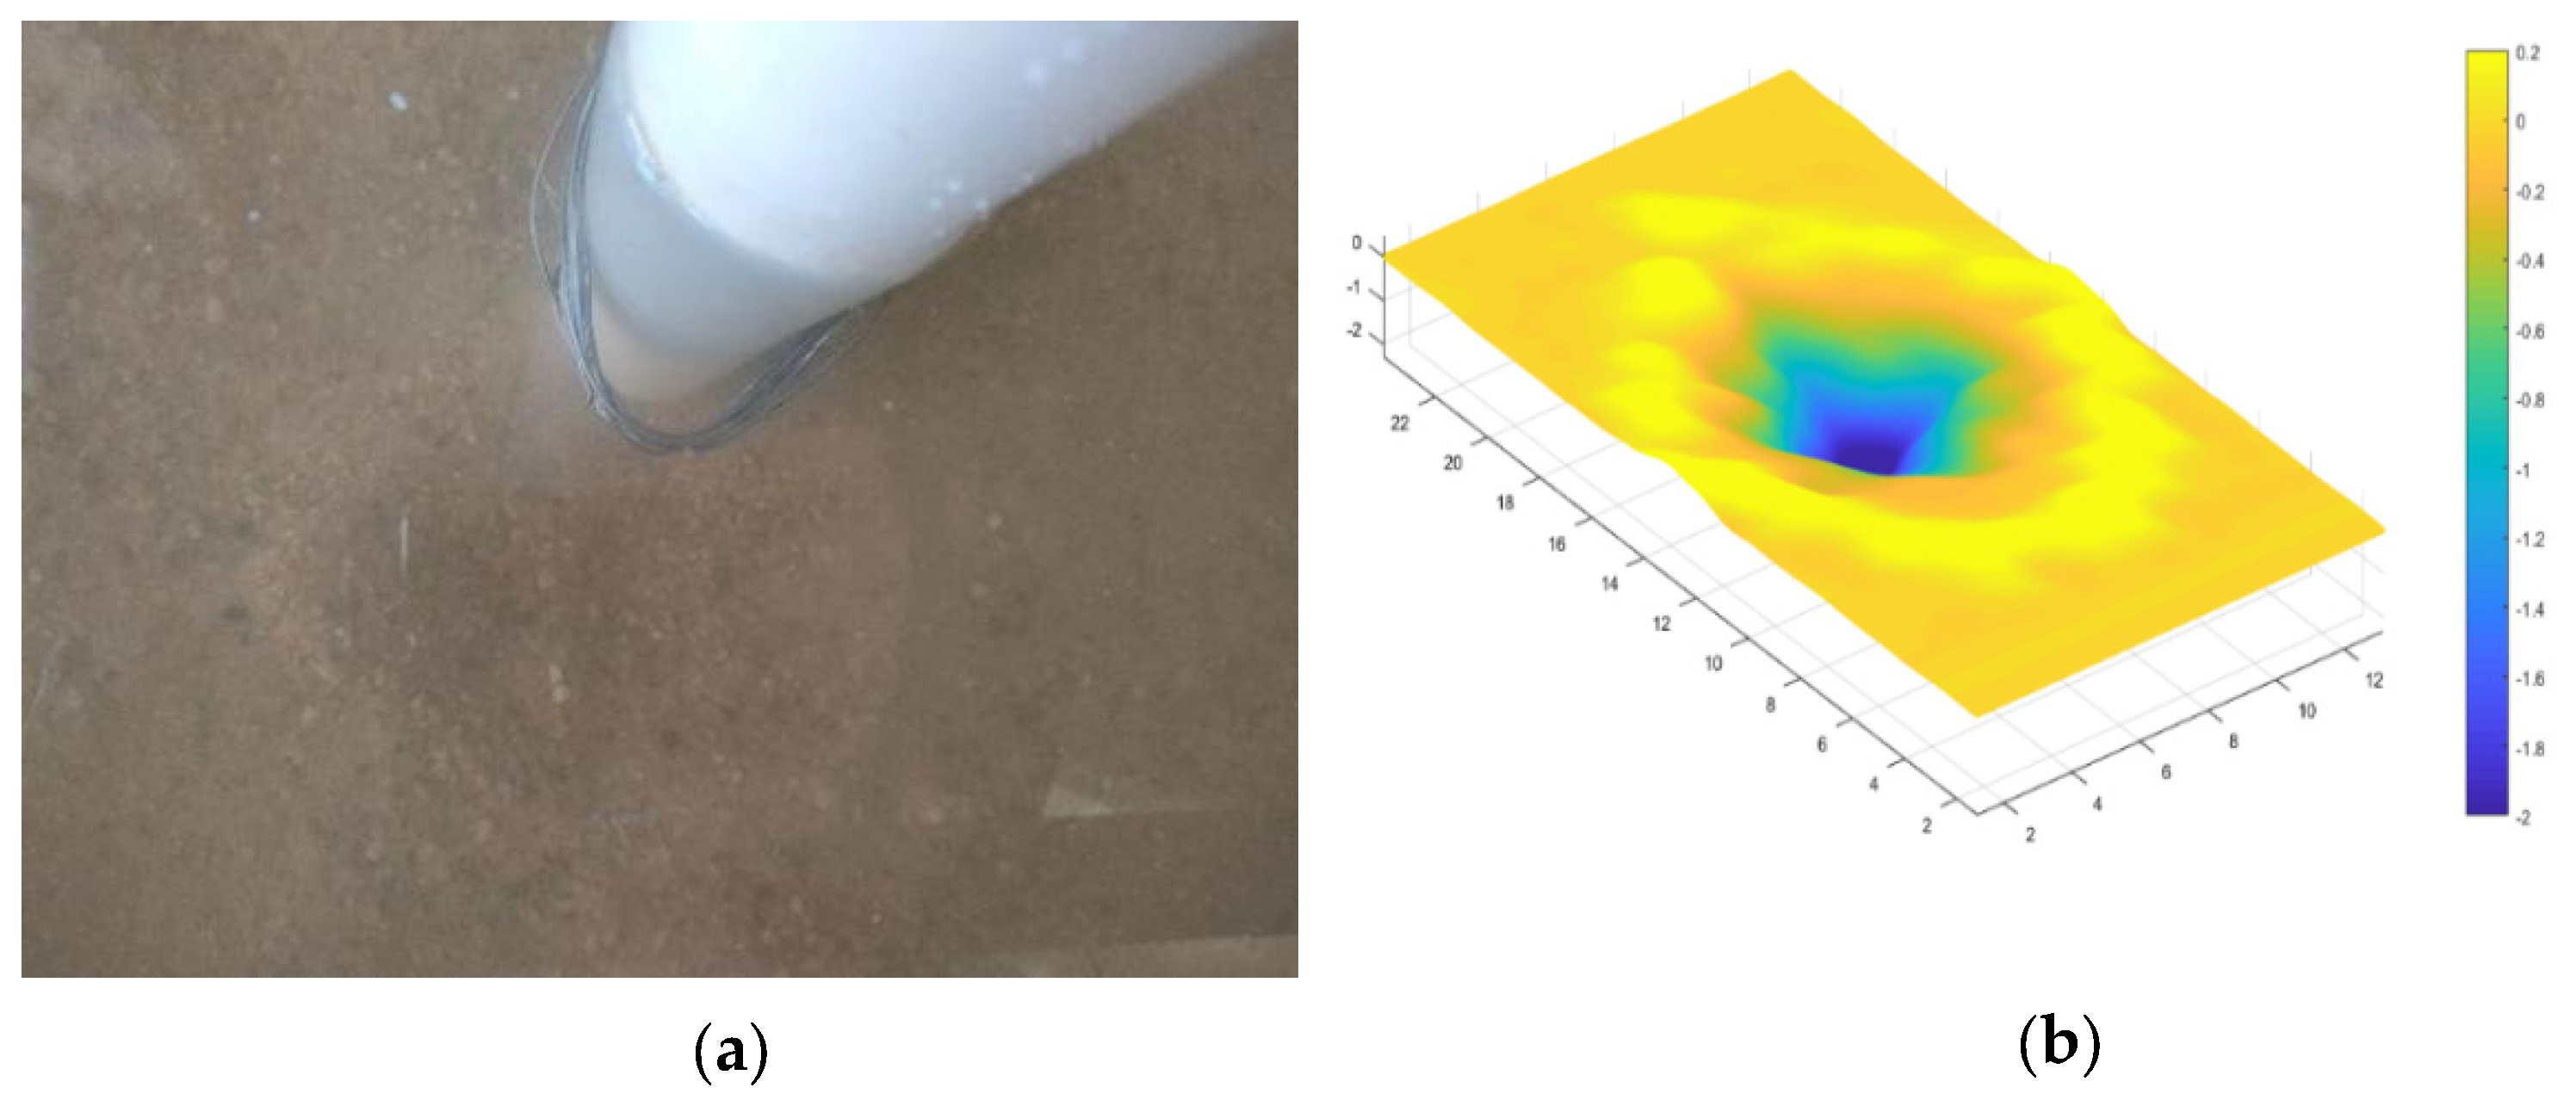
−1 in order to simulate the scour conditions in the above experiments, where the inflow velocity is 10 cm/s and 20 cm/s. According to the experiment and simulation results, the maximum velocity of the flow is approximately 1/4 times the approaching velocity and occurs at a depth of 1/3H. The pipe orifice is placed at a distance of 6.7 cm from the bottom. After the experiment, a topographic map was drawn based on the measured data, as shown in Figure 14, Figure 15, Figure 16 and Figure 17.
From Figure 14, Figure 15, Figure 16 and 
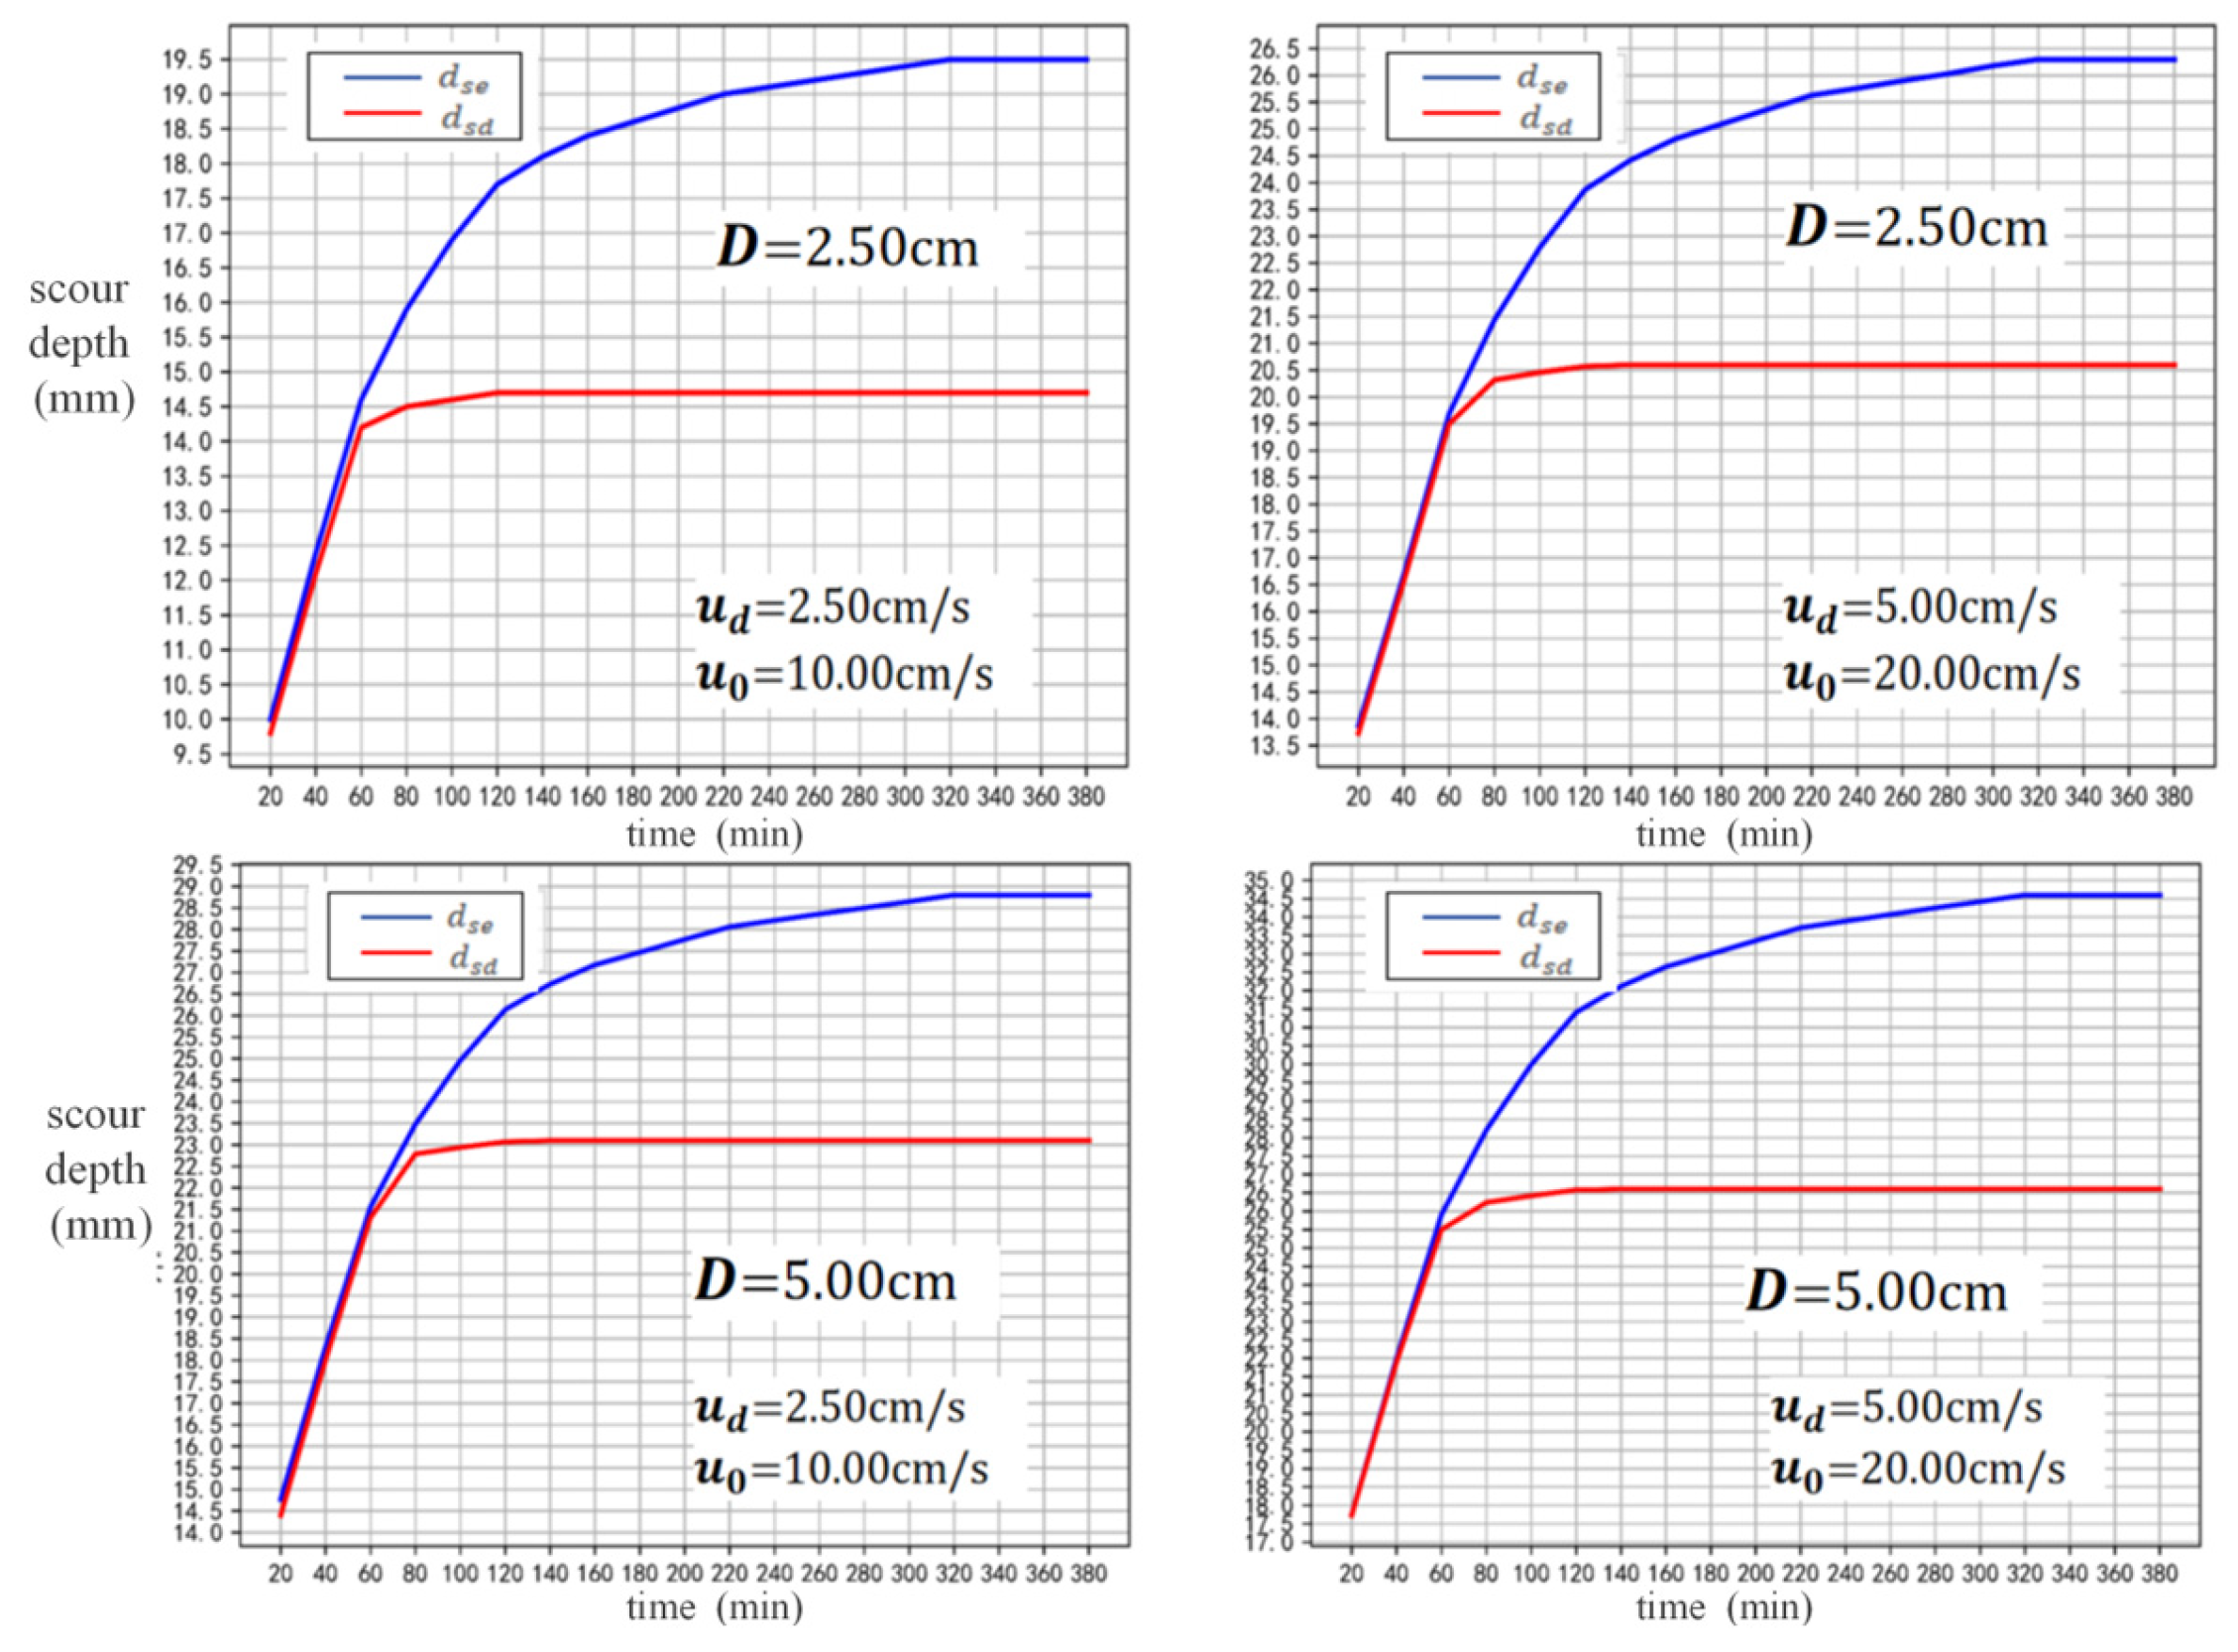
Figure 17, it can be seen that the scour caused by the flow is an inverted conical shape, and most of the sediment that is moved out of scour hole accumulates around it. Longitudinal water flow and the horseshoe vortex will wash away the sediment carried up by the flow, so the scour hole behind the pier will elongate, leading the conical pit to become an elliptical cone. The time-varying curve showing the scour depth under three factors with the flow at different times is drawn in Figure 18.
From Figure 18, it can be seen that in the early stage of scouring, the local scouring depth caused by the flow increases rapidly, reaching equilibrium at about 80 min. During this period, the scouring depth change of the flow is basically consistent with the total scouring depth. The area and depth of the erosion pit after the equilibrium of the flow are smaller than the combined effect of multiple factors. The increase in local scour depth and area after 80 min is mainly caused by longitudinal water flow and the horseshoe vortex. The scour depth caused by down-flow d s d and the total scour depth d s e are listed in Table 3.
From Table 3, it can be inferred that the lower limit of the scour depth dominated by the flow d s d is basically fixed, accounting for 75–80% of d s e . Considering that for the local scour depths obtained from the experiments, it was difficult to achieve strict equilibrium, the lower limit of scour dominated by flow is roughly determined to be 3/4 below the original bed surface.

3.3. Longitudinal Flow Scour Depth

The scour depth caused by the redistribution of flow velocity across the cross-section is theoretically analyzed.
Based on field observations and experimental results, when u 0 > u c , both the general and local scouring around the bridge pier will occur. According to studies [20,21,22], when u 0 < 0.5 u C , local scour around the bridge pier did not occur or was very weak; local scour only occurred after the bridge pier caused a redistribution of flow velocity when u 0 ( 0.5 u C , u c ) .
Perpendicular to flow direction, the longitudinal flow velocity gradually decreases from the pier edge. When the flow velocity decreases to the critical velocity, local scour would not occur on the bed surface. Therefore, the flow velocity at the lateral edge of the scour hole satisfies the sediment critical condition; that is, u y = u c . At the start of scouring, the lateral distribution of dimensionless velocity across the bridge pier section satisfies the following equation.
Assuming the width of the scour pit is W s , the following equation is satisfied:
u W s 2 u 0 = 0.02 W s 2 D + 0.50 2 D W s + 0.80
Substitute the initial scour condition u W s 2 = u c into Equation (5), we obtain the following:
W s 2 + 100 D 0.80 u c u 0 W s + 100 D 2 = 0
We solve Equation (6) to obtain the following:
W s D = 10 5 u c / u 0 4 5 u c / u 0 4 2 1
Equation (7) indicates that the relative width of the scour hole W s / D is a function of the ratio of the critical velocity to the approaching velocity u c / u 0 .
According to Equation (7), when u c / u 0 = 1, the approaching velocity is equal to the critical velocity. The velocity within the flow width affected by the bridge pier is greater than the critical velocity, and the width of the scour hole is equal to the lateral range affected by the bridge pier, so W s = 10 D . When u 0 0.56 u c , the maximum velocity in the cross-section is lower than the critical velocity. The local scour caused by the increase in longitudinal velocity is zero, and at this time, W s = D .
When u 0 = u c , the sediment on the bed surface is already in a critical motion state. At this time, the longitudinal velocity within the flow width affected by the bridge pier is higher than the critical velocity, causing scour. The width of the scour hole is equal to this flow width. The cross-section where the center of the bridge pier is located after equilibrium is shown in Figure 19. The flow direction is perpendicular to the paper surface. After the scour reaches equilibrium, the sediment on the bed surface is also in a critical motion state.
Let H be the initial water depth and h be the water depth at each point after the scour reaches equilibrium. Based on the constant flow rate before and after the scour, we obtain the following:
D 2 D 2 + B 0 u c h h y d y = u 0 D 2 + B 0 H
In the above formula, u c h is the critical velocity at a water depth of h:
u c h = 8 7 h d 1 / 6 ρ s ρ ρ g d
Substitute Equation (9) into Equation (8) to obtain the following:
8 7 d 1 / 3 ρ s ρ ρ g D 2 W s 2 h y 7 / 6 d y = u c H D 2 + B 0 H
According to the research on the morphology inside the scour hole in the above text, it is understood that on the cross-section where the center of the bridge pier is located, the slope is a fixed-value k; that is, the water depth and the lateral coordinate are in a linear relationship:
h y = H + k y
Substitute Equation (11) into Equation (10) to obtain the following:
1 k ρ s ρ ρ g d 1 / 3 8 7 H H + d s e H + k y 7 / 6 d H + k y = u C H D 2 + B 0 H
Solve Equation (12) to obtain the lower limit of the local scour depth,   d s f , considering only the sediment critical motion condition.
We compare the maximum scour depth caused by the increase in longitudinal velocity with the measured total scour depth of the bridge piers in Hangzhou Bay (as well as Jiashao Bridge and Jintang Bridge), as shown in Figure 20. The abscissa in the figure is the measured value of the local scour depth, and the ordinate is the “proportion”, which represents the ratio of the calculated value of the scour depth caused by the increase in longitudinal velocity to the measured total scour depth.
It can be seen from Figure 20 that for about 80% of the data points, the ratio of the scour depth of longitudinal velocity to the total scour depth is between 0.15 and 0.30. Therefore, it can be seen that the lower limit position of the local scour depth caused solely by the redistribution of longitudinal velocity is within 0.3 d s e below the original bed surface.

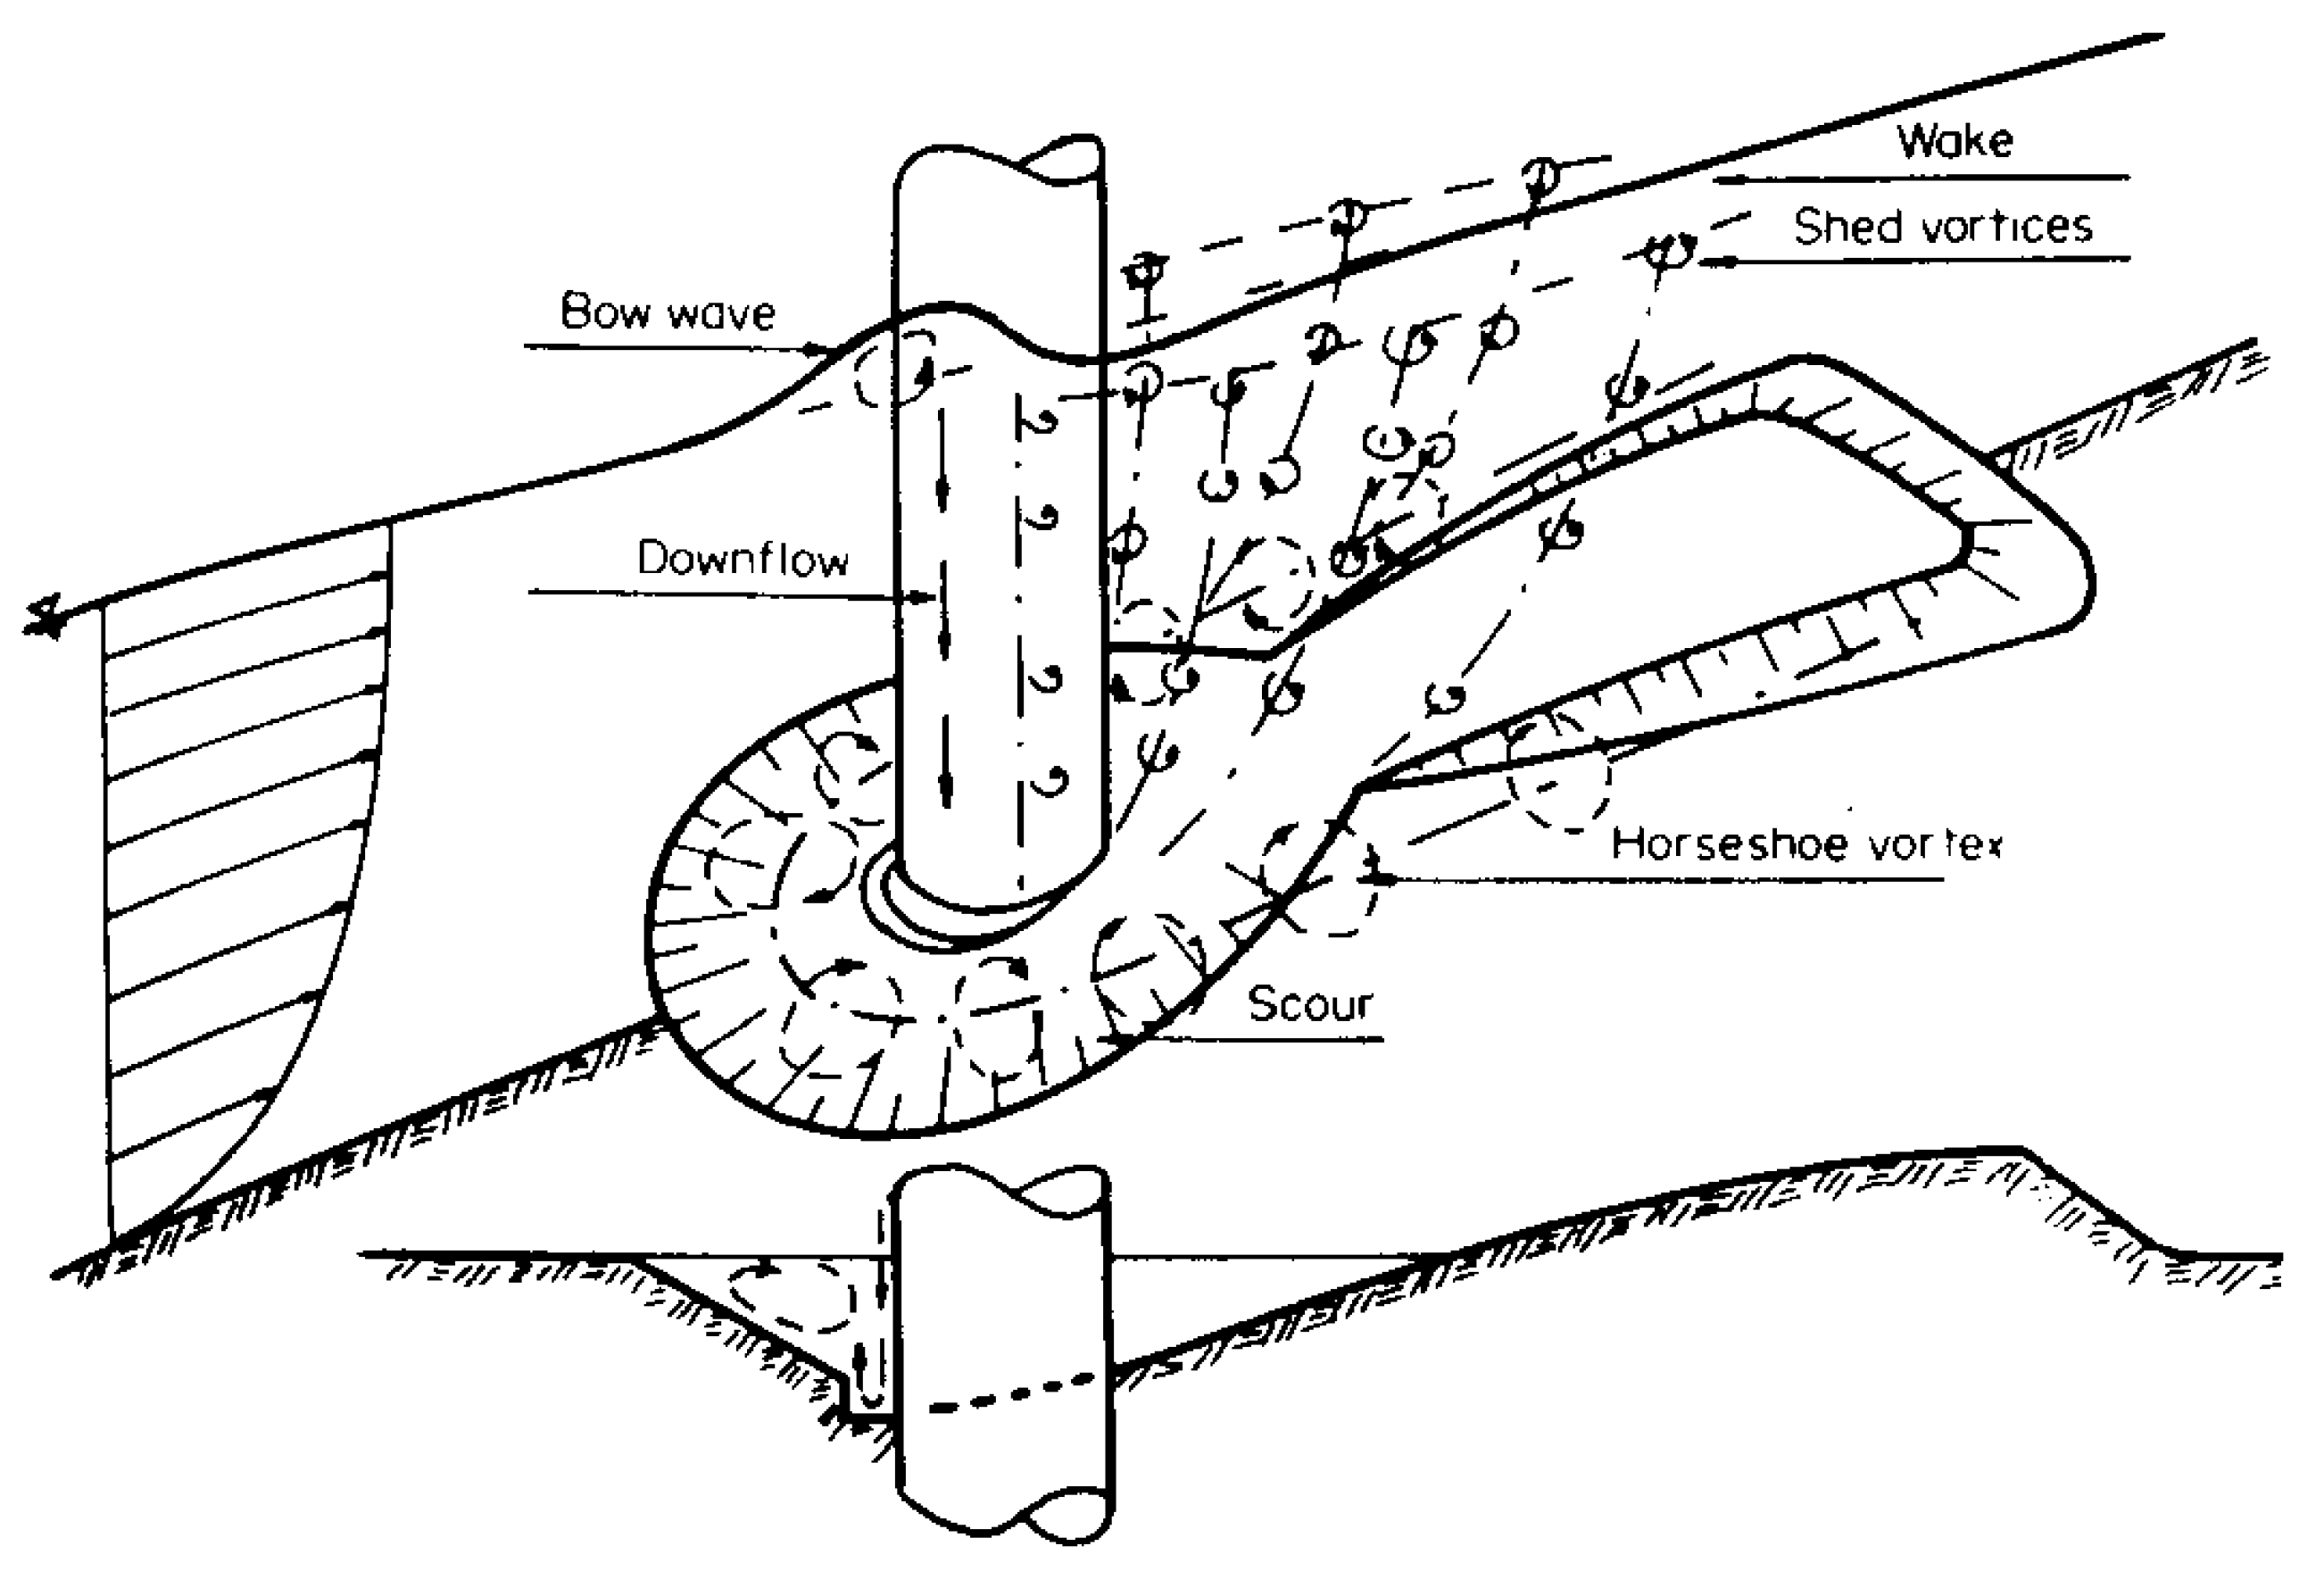
3.4. Local Scour Mechanism Analysis

From the comparative experiments results of the ward flow in front of the pier and the local erosion of longitudinal water flow, it can be seen that the upstream area of the pier is mainly eroded by the direct impact of the ward flow in front of the pier, and the scouring effect is strong. Generally speaking, the deepest scouring position appears here. The main influencing factor on both sides of the pier column is longitudinal water flow, which determines the width of the scour hole. The longitudinal flow velocity at the edge of this area is equal to the starting flow velocity. The main event behind the pier is the horseshoe vortex sucking up and transporting the washed-out sediment stream. The strength of the horseshoe vortex gradually weakens along the direction of the water flow. When its strength is insufficient to maintain sediment suspension or movement, sediment may accumulate on the riverbed, forming a sedimentation area behind the scour hole. In this way, the local scour hole can be divided into three areas, marked as Zone I, Zone II, and Zone III, respectively, as shown in Figure 21.
Zone I is mainly affected by flow, Zone II is mainly affected by longitudinal water flow, and Zone III is mainly affected by horseshoe vortex. The increase in vertical water flow determines the width of the scour hole, while the decrease in flow intensity affects the scour depth, and the horseshoe vortex is closely related to the length of the scour hole.
According to the previous experimental results, the lower limit of erosion caused by the dominant ward flow is approximately below the original bed surface (0.75~0.8); while according to the starting flow velocity formula, the lower limit of erosion caused by the increase in longitudinal flow velocity is approximately 0.3 below the original bed surface, which is included in the previous flushing depth. According to the different dominant factors, the local erosion process of the bridge pier can be divided into three stages, as shown in Figure 22.
The first stage is the initial stage, during which the longitudinal flow increases, and the flow in front of the pier and the horseshoe vortex around the pier work together. The flow velocity increases and exceeds the starting flow velocity, causing the sediment around the pier to start. At the same time, the flow in front of the pier has a strong scouring effect on the bed surface, and the horseshoe vortex around the pier can also cause scouring. As the depth of the scour hole increases, the water depth around the bridge pier increases, and the longitudinal flow velocity gradually decreases while the starting flow velocity increases until they are equal. After that, the longitudinal water flow no longer has an effect on local scour, and the scour depth is the lower-limit depth of the longitudinal water flow effect, generally within 0.3.
The second stage is the erosion development stage, during which the sediment initiation caused by longitudinal water flow tends to be weak, and local erosion is mainly caused by flow and horseshoe vortex. Among them, the flow plays a dominant role in the continuous strong scouring of the bed surface, causing sediment to be lifted up from the bed surface and transported stream by the water flow. According to the experimental results, the lower limit of the local scour depth caused by the dominant role of flow is approximately below the original bed surface, indicating that flow plays a major role in the three important factors causing local scour. As the depth of erosion increases, the intensity of flow decreases, making it more difficult for sediment to be washed away. When the scouring pit develops below the original bed surface, a balance is reached between the flow scouring effect and the anti-scouring ability of the sediment.
In the third stage, after the scouring of the flow reaches equilibrium, the scouring effect of the longitudinal water flow and the flow is already very weak, and at this time, the scouring effect is mainly caused by the horseshoe vortex. The horseshoe vortex continuously rolls up the sediment in the scouring pit and transports its stream, deepening the scouring pit and expanding the scouring range. This stage has a weaker erosion intensity than the second stage, which is dominated by the flow, but the duration is longer, often lasting several days in experiments and several years or even longer in actual environments.

4. Conclusions

Based on the local scour experiments conducted around bridge piers in a bed load flume, the morphology of the scour hole can be approximated as two semi-ellipsoidal cones. From the experimental results of this study and others, the volume of the scour hole obtained based on this hypothesis was calculated. The comparison between the calculated and measured scour volumes proves the reliability of this conclusion.
Upon encountering the bridge pier, the incoming flow is altered due to water resistance, resulting in a vertical ward scouring of the riverbed along the upstream face of the pier. The impact energy of the descending flow is substantial, which may account for the presence of the maximum scour depth in front of the pier. Starting with the factors that contribute to local scour around the pier, an analysis was conducted on the proportion of the local scour depth caused by three factors relative to the total scour depth. Based on the descending flow velocity obtained, a scour experiment considering only the flow was conducted. The results indicate that the local scour depth predominantly caused by the descending flow can account for approximately 75–80% of the total scour depth.
Based on the distribution pattern of longitudinal flow velocity at the bridge pier section and the morphology of the scour hole, the local scour depth and width resulting from the redistribution of longitudinal flow velocity were calculated. The results indicate that the local scour depth caused by longitudinal flow generally accounts for approximately 15–30% of the total scour depth. At that time, the local scour caused by the redistribution of longitudinal flow should be zero, and the scour hole width is a function of the ratio of the sediment critical velocity to the incoming flow velocity. This reveals the formation pattern of the scour hole: in the initial stage, all three factors jointly contribute to scouring; in the second stage, descending flow plays a dominant role, with the horseshoe vortex having a secondary effect; and in the third stage, scouring is primarily caused by the horseshoe vortex. An increase in longitudinal flow velocity leads to sediment incipience, with its lower limit being approximately 30% of the scour depth; the lower limit of descending flow is roughly 80%; and the scour depth caused solely by the horseshoe vortex accounts for about 20%.

Author Contributions

Conceptualization, H.D. and Z.S.; methodology, Z.L.; software, H.D.; validation, H.D. and Z.L.; formal analysis, H.D.; investigation, H.D. and Z.L.; resources, Z.S.; data curation, H.D.; writing—original draft preparation, H.D.; writing—review and editing, H.D. and Z.L.; visualization, H.D.; supervision, Z.S.; project administration, Z.S.; funding acquisition, Z.S. All authors have read and agreed to the published version of the manuscript.

Funding

This study received support and funding from the Major Scientific and Technological Project of Zhoushan City: “Early Warning and Disaster Prevention of Scour around Cross Sea Bridge Foundation (2024C03006)” and the Key Project of Agricultural and Social Development in Hangzhou (20231203A16).

Institutional Review Board Statement

Not applicable.

Informed Consent Statement

Not applicable.

Data Availability Statement

The raw data supporting the conclusions of this article will be made available by the authors on request.

Acknowledgments

The authors wish to thank Ningbo Hangzhou Bay Bridge Development Co., Ltd., for offering data of local scour depth in Hangzhou Bay Bridge piers.

Conflicts of Interest

The authors declare no conflicts of interest.

References

  1. Hughes, D.; Ramey, G.E.; Hughes, M.L. Effects of Extreme Scour and Soil Subgrade Modulus on Bridge Pile Bent Buckling. Pract. Period. Struct. Des. Constr. 2007, 12, 96–108. [Google Scholar] [CrossRef]
  2. Wardhana, K.; Hadipriono, F.C. Analysis of Recent Bridge Failures in the United States. J. Perform. Constr. Facil. 2003, 17, 144–150. [Google Scholar] [CrossRef]
  3. Raudkivi, A.J. Functional Trends of Scour at Bridge Piers. J. Hydraul. Eng. 1986, 112, 1–13. [Google Scholar] [CrossRef]
  4. Melville, B.W. The Physics of Local Scour at Bridge Piers. In Proceedings of the Fourth International Conference on Scour and Erosion 2008, Tokyo, Japan, 5–7 November 2008. [Google Scholar]
  5. Kharbeche, M.; Williams, P.; Balachandar, R. Effect of Gap Width and Pile Diameter on Efficacy of Sacrificial Piles for Scour Mitigation. In Proceedings of the International Conference on Scour and Erosion, Washington, DC, USA, 18–20 October 2021. [Google Scholar]
  6. Guragain, S.; Tanaka, N. An Experimental Study on the Effect of Distance and Sheltering Area of a Group of Linearly Arranged Sacrificial Piles on Reducing Local Scour around a Circular Bridge Pier under Clear-Water Conditions. Fluids 2024, 9, 35. [Google Scholar] [CrossRef]
  7. Ettema, R.; Melville, B.W. Clear-Water Scour at Cylindrical Piers. J. Hydraul. Eng. 1983, 109, 338–350. [Google Scholar]
  8. Si, J.H.; Lim, S.Y.; Wang, X.K. Jet-Flipping in Scour Hole Downstream of Unsubmerged Weir with Apron. J. Hydraul. Eng. 2019, 145, 04019035. [Google Scholar] [CrossRef]
  9. Yang, Y.; Qi, M.; Wang, X.; Li, J. Experimental study of scour around pile groups in steady flows. Ocean. Eng. 2020, 195, 106651. [Google Scholar] [CrossRef]
  10. Partheniades, E. Erosion and deposition of cohesive soils. J. Hydraul. Div. 1965, 91, 105–139. [Google Scholar] [CrossRef]
  11. Li, Z.; Lin, W.; Chu, D.; Liu, F.; Sun, Z.; Yang, W.; Huang, H.; Xu, D. Prediction of Pier Scour Depthunder Extreme Typhoon Storm Tide. J. Mar. Sci. Eng. 2024, 12, 1244. [Google Scholar] [CrossRef]
  12. Sun, Z.; Dong, H. New formula for scour depth at piles based on energy equilibrium. Ocean. Eng. 2023, 287, 115725. [Google Scholar] [CrossRef]
  13. Sheppard, D.M.; Odeh, M.; Glasser, T. Large Scale Clear-Water Local Pier Scour Experiments. J. Hydraul. Eng. 2004, 130, 957–963. [Google Scholar] [CrossRef]
  14. Zhang, Z. Study on Local Scour Protection Countermeasures of Bridge Pier. Highlights Sci. Eng. Technol. 2022, 28, 464–470. [Google Scholar] [CrossRef]
  15. Malik, R.; Setia, B.; Banik, A. Mechanism of Scouring Around Group of Bridge Piers in Tandem Arrangement. J. Inst. Eng. India Ser. A 2023, 104, 633–642. [Google Scholar] [CrossRef]
  16. Zijlema, M.; Stelling, G.; Smit, P. SWASH: An operational public domain code for simulating wave fields and rapidly varied flows in coastal waters. Coast. Eng. 2011, 58, 992–1012. [Google Scholar] [CrossRef]
  17. Diab, R.; Link, O.; Zanke, U. Geometry of developing and equilibrium scour holes at bridge piers in gravel. Can. J. Civ. Eng. 2010, 37, 544–552. [Google Scholar] [CrossRef]
  18. Das, S.; Das, R.; Mazumdar, A. Variations in clear water scour geometry at piers of different effective widths. Turk. J. Eng. Environ. Sci. 2014, 38, 97–111. [Google Scholar] [CrossRef]
  19. Kitsikoudis, V.; Kirca, V.O.; Yagci, O.; Celik, M.F. Clear-water scour and flow field alteration around an inclined pile. Coast. Eng. 2017, 129, 59–73. [Google Scholar] [CrossRef]
  20. Elliott, K.R.; Baker, C.J. Effect of Pier Spacing on Scour Around Bridge Piers. J. Hydraul. Eng. 1985, 111, 1105–1109. [Google Scholar] [CrossRef]
  21. Sheppard, D.M.; Miller, W., Jr. Live-Bed Local Pier Scour Experiments. J. Hydraul. Eng. 2006, 132, 635–642. [Google Scholar] [CrossRef]
  22. Melville, B.W. Pier and Abutment Scour: Integrated Approach. J. Hydraul. Eng. 1997, 123, 125–136. [Google Scholar] [CrossRef]
Figure 1. Flow around the bridge pier [6].
Jmse 13 01021 g001
Figure 2. (a) Front view of flume arrangement. (b) Overhead view of flume arrangement.
Jmse 13 01021 g002
Figure 3. Measurement of scour hole topography.
Jmse 13 01021 g003
Figure 4. Gradation curve of the sediment particle sizes used in the experiment.
Jmse 13 01021 g004
Figure 5. (a) Contour of local scour depth. (b) Overhead view of flume arrangement. (D = 2.5 cm; u 0 = 10.00 cm s−1).
Jmse 13 01021 g005
Figure 6. (a) Contour of local scour depth. (b) Overhead view of flume arrangement. (D = 2.5 cm; u 0 = 20.00 cm s−1).
Jmse 13 01021 g006
Figure 7. (a) Contour of local scour depth. (b) Overhead view of flume arrangement. (D = 5 cm; u 0 = 10.00 cm s−1).
Jmse 13 01021 g007
Figure 8. (a) Contour of local scour depth. (b) Overhead view of flume arrangement. (D = 5 cm; u 0 = 20.00 cm s−1).
Jmse 13 01021 g008
Figure 9. The longitudinal profile of the scour hole: (a) D = 2.5 cm; (b) D = 5 cm.
Jmse 13 01021 g009
Figure 10. The cross-sectional profile of the scour hole: (a) D = 2.5 cm; (b) D = 5 cm.
Jmse 13 01021 g010
Figure 11. The longitudinal profile of the scour hole [9].
Jmse 13 01021 g011
Figure 12. Scour hole morphology.
Jmse 13 01021 g012
Figure 13. Layout of flow scour experiments: (a) experimental design; (b) actual experiment.
Jmse 13 01021 g013
Figure 14. (a) Overhead view of flume arrangement. (b) Contour of local scour depth ( u d = 2.5   c m   s 1 ; D = 2.5 cm).
Jmse 13 01021 g014
Figure 15. (a) Overhead view of flume arrangement. (b) Contour of local scour depth ( u d = 5.0   c m   s 1 ; D = 2.5 cm).
Jmse 13 01021 g015
Figure 16. (a) Overhead view of flume arrangement. (b) Contour of local scour depth ( u d = 2.5   c m   s 1 ; D = 5 cm).
Jmse 13 01021 g016
Figure 17. (a) Overhead view of flume arrangement. (b) Contour of local scour depth ( u d = 5.0   c m   s 1 ; D = 5 cm).
Jmse 13 01021 g017
Figure 18. Changes in scour depth over time.
Jmse 13 01021 g018
Figure 19. Cross-section where the center of the pier is located.
Jmse 13 01021 g019
Figure 20. Ratio of the scour depth of longitudinal flow to the measured value.
Jmse 13 01021 g020
Figure 21. Division of scour hole area.
Jmse 13 01021 g021
Figure 22. Local scour process.
Jmse 13 01021 g022
Table 1. Calculated and measured values of local scour volume.
u 0
(cm/s)
D
(cm)
d s e
(cm)
2b
(cm)
a 1
(cm)
a 2
(cm)
S s
(cm2)
V m
(cm3)
V c
(cm3)
Error
(%)
102.51.9512.67.715.3227.5184.5147.9−24.75
202.52.6315.512.417.7366.2288.4321.210.21
1052.8812.010.820.2292.0261.8280.56.67
2053.4616.714.522.6486.4498.2561.211.23
Table 2. Comparison of scour volume measured by Das (2014) [18] and the calculated value.
No.Pier
Type
D
(cm)
L
(cm)
b
(cm)
d s e
(cm)
V m
(cm3)
V c
(cm3)
Error
(%)
1Cylinder114626.59.2583558690.58
2Square column15.56583011.2954510,1986.84
3Triangular column12.704824.59.668425908−13.65
4Flat plate11.0242248.247804325−9.52
Table 3. Flow scour depth.
No.H (cm) u 0 (cm/s)D (cm) u d (cm/s) d s e (cm) d s d (cm) d s d / d s e
12010.002.52.51.951.470.75
22020.002.552.632.060.78
32010.0052.52.882.310.80
42020.00553.462.660.77
Disclaimer/Publisher’s Note: The statements, opinions and data contained in all publications are solely those of the individual author(s) and contributor(s) and not of MDPI and/or the editor(s). MDPI and/or the editor(s) disclaim responsibility for any injury to people or property resulting from any ideas, methods, instructions or products referred to in the content.

