Abstract
Marine litter threatens ocean ecosystems, and nautical tourism, as a source of litter, contributes significantly. This paper presents a qualitative and quantitative study of seafloor litter in the Bay of Selehovica in the northern Adriatic Sea. The bay is accessible only by sea and is attractive to nautical tourism vessels. The survey was conducted using a remotely operated vehicle across 22,100 m2 of seafloor, before and after the tourist season (summer) in 2024. The analysis shows a 25.90% increase in litter items after one season. The predominant litter category is plastic, followed by glass, metal, rubber, and textiles. The abundance of marine litter increased from 1.3 to 1.7 items per 100 m2 in the post-season, reflecting a measurable rise in litter density. Due to non-normal data distribution (Shapiro–Wilk test, p < 0.001), the Wilcoxon Signed-Rank Test was used, revealing a statistically significant increase in marine litter (W = 0, p < 0.001) with a large effect size (Cohen’s d = 0.89). A strong positive correlation between the pre- and post-season values was observed (Spearman’s r = 0.96, p < 0.001), suggesting that areas with higher initial litter levels tend to accumulate more over time. The results point to the necessity of targeted management strategies to reduce the pressure of nautical tourism on marine ecosystems and to protect the marine environment.
1. Introduction
Marine litter (ML) is considered one of the major threats to the world’s oceans and marine ecosystems. The United Nations Environment Program defines ML as “any persistent, manufactured or processed solid material discarded, disposed of or abandoned in the marine and coastal environment” [1]. According to some sources, approximately 10 million tons of litter end up in the seas and oceans worldwide every year [2,3].
Many analyses of ML composition have shown that all of the following dominant materials can be found: plastic, metal, glass, paper, rubber, textiles, concrete, and more [4]. Most material types and subtypes do not float in seawater or lose buoyancy over time and sink. In general, 94% of the plastic that ends up in the ocean eventually sinks onto the seafloor. It is estimated that, on average, 70 kg of plastic is present on every square kilometer of seafloor worldwide [5,6,7].
Considering location, ML on a seafloor is the least studied compared to sea surfaces (floating ML) or coastlines (beached ML), and due to research complexity, the needed equipment and cost are limiting factors [8,9,10,11,12,13,14,15,16,17,18,19,20]. Available research methods for investigating ML on a seafloor include trawling, SCUBA diving, snorkeling (in shallow waters), and advanced technical approaches such as using submersibles or remotely operated vehicles (ROVs). Using trawl nets is an invasive method suitable for deeper and larger areas with simple and flat seafloors, and they are often used in cooperation with fishermen [12,13,16,18,19,20,21,22,23,24]. Other non-invasive visual methods are suitable for smaller areas of all types, including complex, protected, or sensitive areas. ROVs are highly maneuverable underwater unmanned vehicles controlled by ROV pilots, and they are equipped with one or more cameras, enabling safe, fast, and real-time underwater surveys. ROVs are a novel approach for ML research, and they can be used in a wide range of depths, depending on their technical specifications, like research in shallow areas up to 35 m in depth [25,26,27], deeper areas up to approximately 200 m in depth [28,29], and at greater depths [30,31,32,33].
Considering various sources, it is estimated that 80% of ML originates from land-based activities, while the remaining 20% originates from various sea-based activities [34,35,36,37,38,39]. The main polluting sea-based activities include fishing and aquaculture, maritime transportation, offshore industry, and nautical tourism [9,40,41,42]. Nautical (or maritime) tourism includes recreational or sporting activities at sea—mainly in coastal areas—such as yachting, boating, sailing, and cruising [43]. Nautical tourists contribute to sea and se floor litter, mainly through accidental littering, but also through negligent littering. Many authors emphasize the increased pressure on the marine environment caused by nautical tourism development and an increasing number of vessels (pleasure crafts, i.e., boats and yachts) [44,45,46,47]. Some studies have indicated that nautical tourism vessels are one of the main sea-based sources of ML [48,49,50,51,52]. On the other hand, there are very few studies focusing on the composition of ML generated by these vessels, in general, and in the Adriatic Sea, in particular. Stagličić et.al. [53] investigated shallow seafloors in selected areas with high tourism pressures in the Central–Eastern Adriatic Sea using diving methods. The results showed that ML is often distributed in large- and small-scale patches and that it is challenging to understand its distribution and accumulation due to complex marine processes.
Mutlu et al. [54] carried out research using SCUBA divers in the bays and coasts of the Mediterranean part of Turkey, known for its intensive nautical tourism vessel activities (provinces of Muğla and Antalya). The dominant types of litter in the studied areas were plastic (26%), glass/ceramic (21%), and metal (17%). During the summer season, with an increase in the activities at sea, the abundance of litter increased.
Investigating the impact of nautical tourism vessels on the environment is important because nautical tourism is proving to grow worldwide [50,55,56,57,58,59,60]. In the EU, nautical tourism is an important part of the blue economy, and economically, it contributes significantly in many states, particularly Mediterranean and Adriatic coastal states. The main factors supporting its growth are marinas (increasing numbers of berth demands), charter companies offering nautical tourism vessels for lease, and numerous related quality services. Concurrently, there is an increasing number of boat and yacht owners, i.e., citizens in the EU who can afford such vessels for personal use. The European Boating Industry (EBI) has estimated that there are 48 million EU citizens who regularly participate in various tourist sea-based activities, of which 36 million are those who use nautical tourism vessels, either through chartering or ownership [61]. According to the latest report of the Croatian Bureau of Statistics on Nautical Tourism, the pressure of boats and yachts is significant. In 2023, in Croatian nautical ports, there were 16,482 such vessels with permanent berths and 224,404 vessels in transit [62].
This paper presents research on marine litter pollution on the seafloor in a highly visited bay accessible only by sea, intending to estimate the pressure on the marine environment caused by nautical tourism vessels. The research includes a comparative quantity and composition analysis of marine litter before and after the summer season, i.e., intensive nautical tourism activities. Seafloor surveys were conducted with an ROV following a bathymetric survey of the area and detailed transect planning. The results include the estimated abundance, composition, and accumulation rate of the ML.
Research of this kind is essential for meeting the provisions of the Marine Strategy Framework Directive (MSFD) 2008/56/EC of the EU and the Marine Waste Management Plan of the Republic of Croatia (2020) on the state level [63,64].
2. Methodology
The research process was divided into four stages: (1) selection of the study area, (2) bathymetric survey, (3) planning and conducting the ROV surveys, and (4) video and data analysis. All stages were conducted separately.
2.1. Selection of the Study Area
The research objective was to investigate the influence of nautical tourism vessels (yachts and boats) on seafloor pollution in the northern Adriatic Sea area. The research area had to satisfy the following criteria: a closed-type bay to reduce the impact of sea currents on litter transfer, an area with intensive activities by the targeted vessels, not easily accessible and visited from the coastal side, no infrastructure on shore, and not being investigated and cleaned before (any kind of diving clean-up actions).
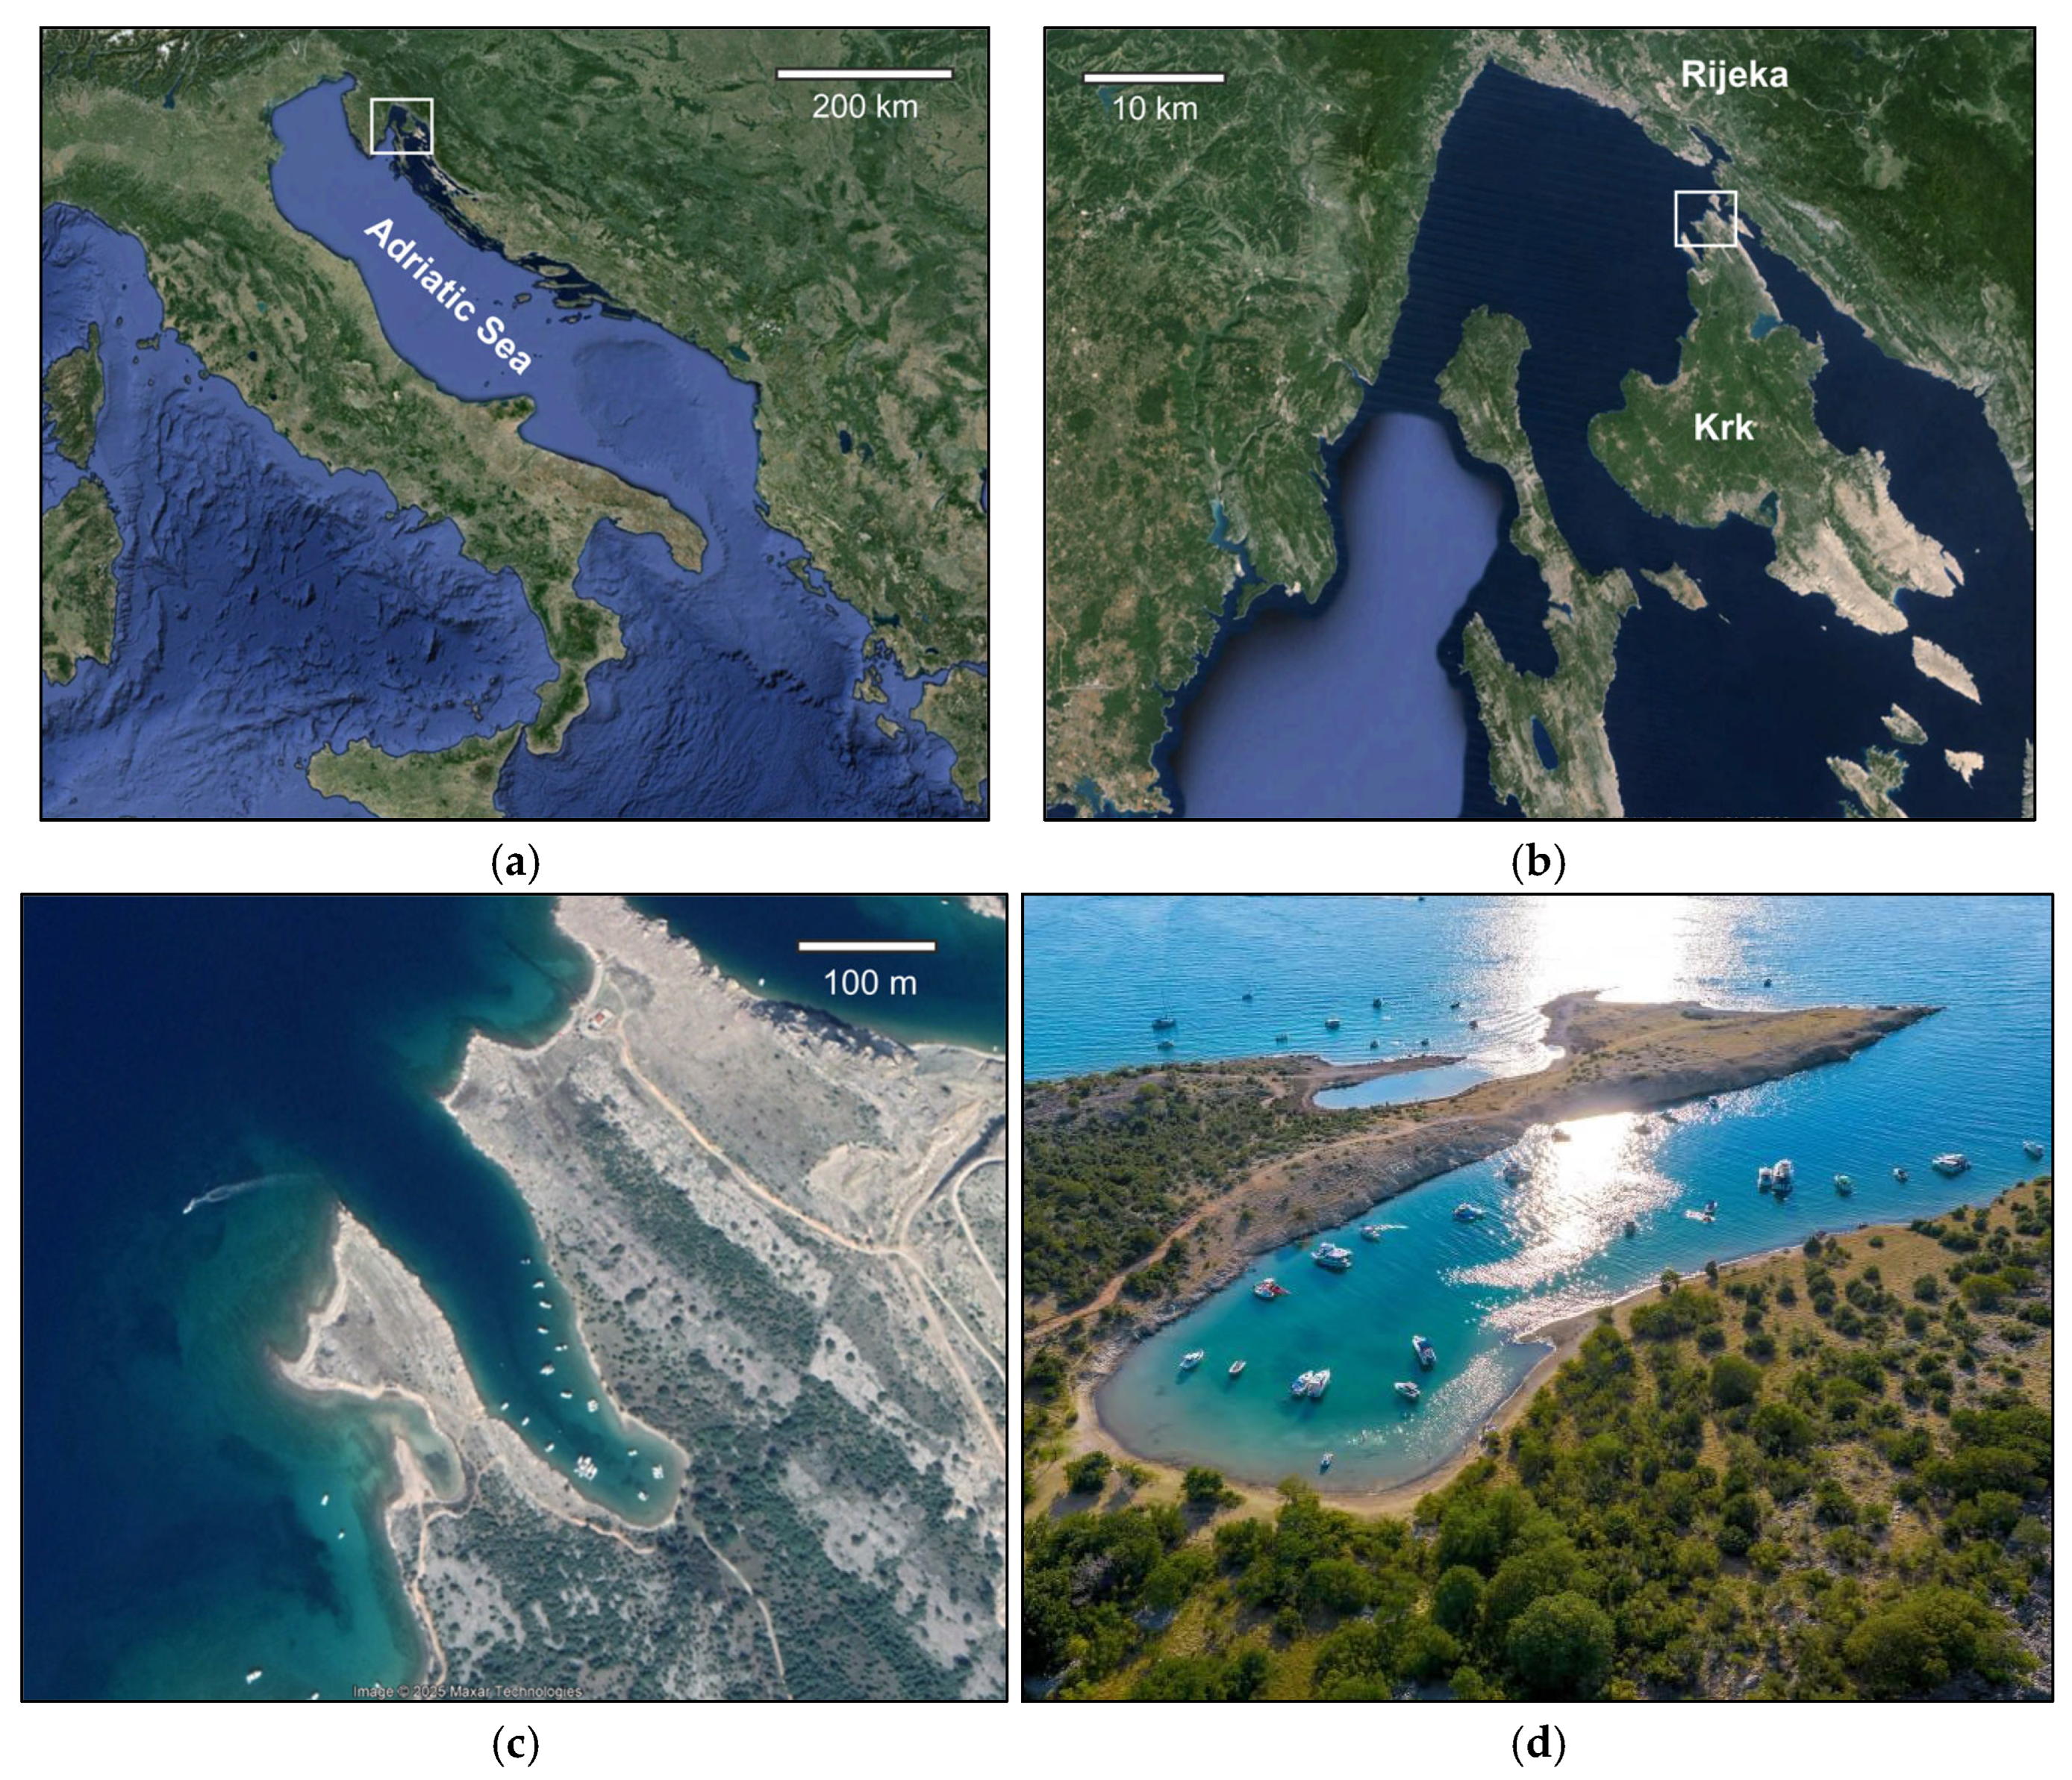
The Bay of Selehovica (geographical position 45°14′30′′ N 014°33′12′′ E) situated on the northern coast of Krk island in Primorje Gorski Kotar County in Croatia was recognized as a suitable location (Figure 1).
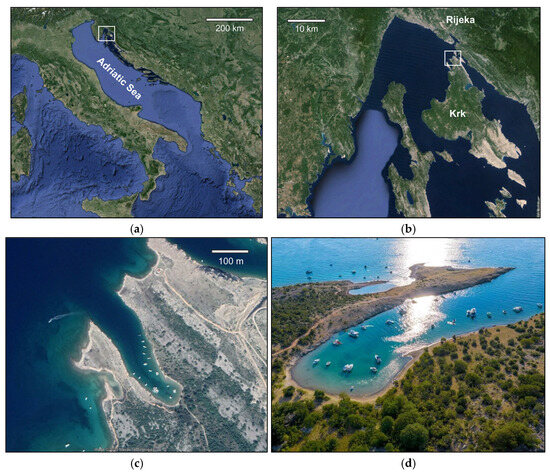
Figure 1.
Research location: (a) the Adriatic Sea; (b) the Gulf of Rijeka; and (c,d) the Bay of Selehovica on the island of Krk. Sources: (a–c) Google Earth and (d) https://www.info-krk.com/omisalj/plaze/197/selehovica (accessed on 10 April 2025).
From late April to October, the Bay of Selehovica is visited by nautical tourism vessels daily, particularly during the peak summer season (June to September). They mainly stay at anchor during daylight, while in the evening hours, they depart to spend the night in nearby marinas and ports. Some vessels stay overnight because the bay offers good protection from the prevailing winds and waves.
The bay has no land access for vehicles and no infrastructure whatsoever. There is a narrow macadam trail rarely used by a small number of domestic residents accessing the bay by walking. The bay is deeply indented into the island and is 340 m long, with an average width of 50 m. The entrance to the bay is 102 m wide. During the summer season, more than 30 yachts can safely anchor within the bay limits. Hence, the bay satisfies all criteria, and it may be assumed that the marine litter found in this area mainly originates from visiting vessels.
The bay is attractive due to its natural beauty and, in particular, its vicinity to small ports and marinas. Within a 10 nautical mile radius, there are 49 ports, of which 10 are classified as county important and 37 are locally important, and there are also two marinas. In total, there are approximately 6190 berths available to accommodate smaller vessels, of which 4928 are municipal berths, 819 are nautical berths (commercial for tourists), and 443 are within the two marinas (excluding dry berths).
2.2. Bathymetric Survey
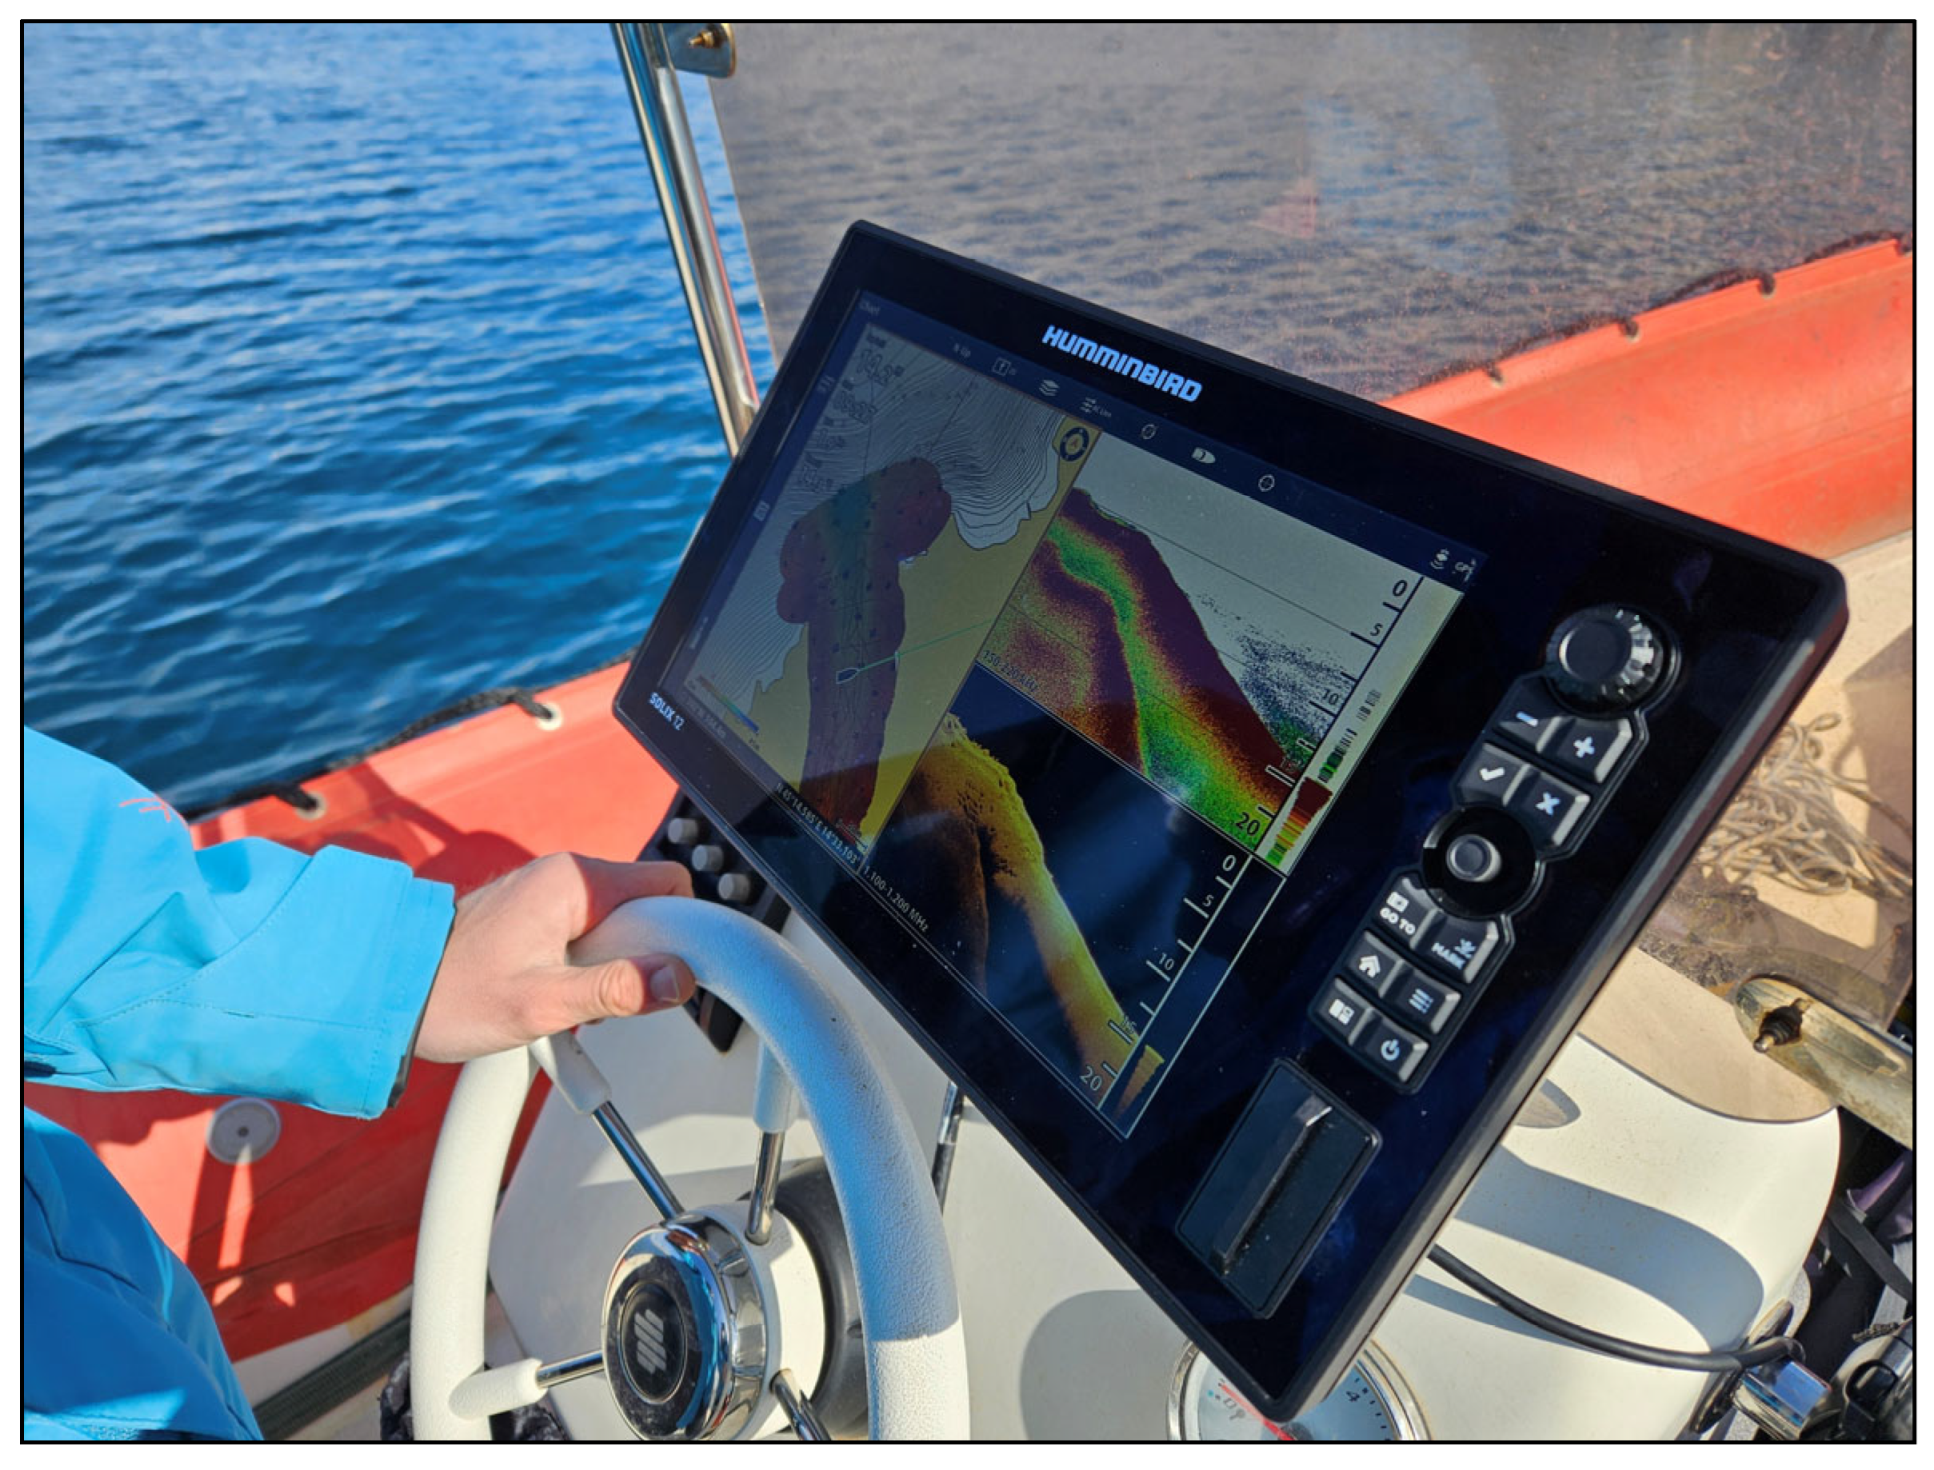
The bathymetric survey and bay profile were needed for the seafloor morphology analysis, which was essential for planning safe and efficient ROV operations, as well as for the later data analysis and results interpretation. The measurements were taken with a side-scan sonar, model Humminbird Solix 12 CHIRP MSI + GPS G2, mounted on a research rigid inflatable boat (RIB), (Figure 2), and they were later processed using Autochart Pro v.2.300 software (Figure 3). This sonar may use a range of frequencies, from 200, 455, and 800 kHz, to a high of 1100 kHz, which is suitable for shallow areas (up to approximately 50 m in depth).
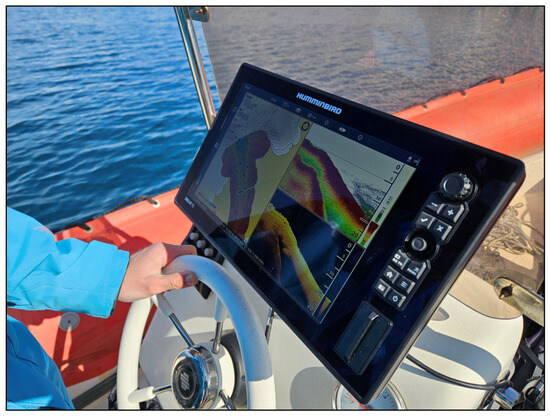
Figure 2.
The Humminbird Solix 12.
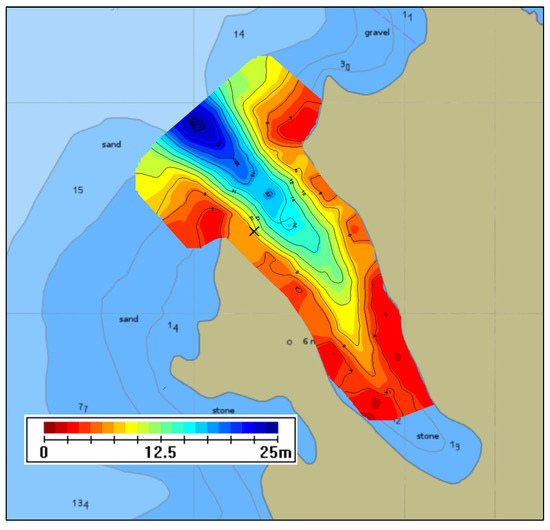
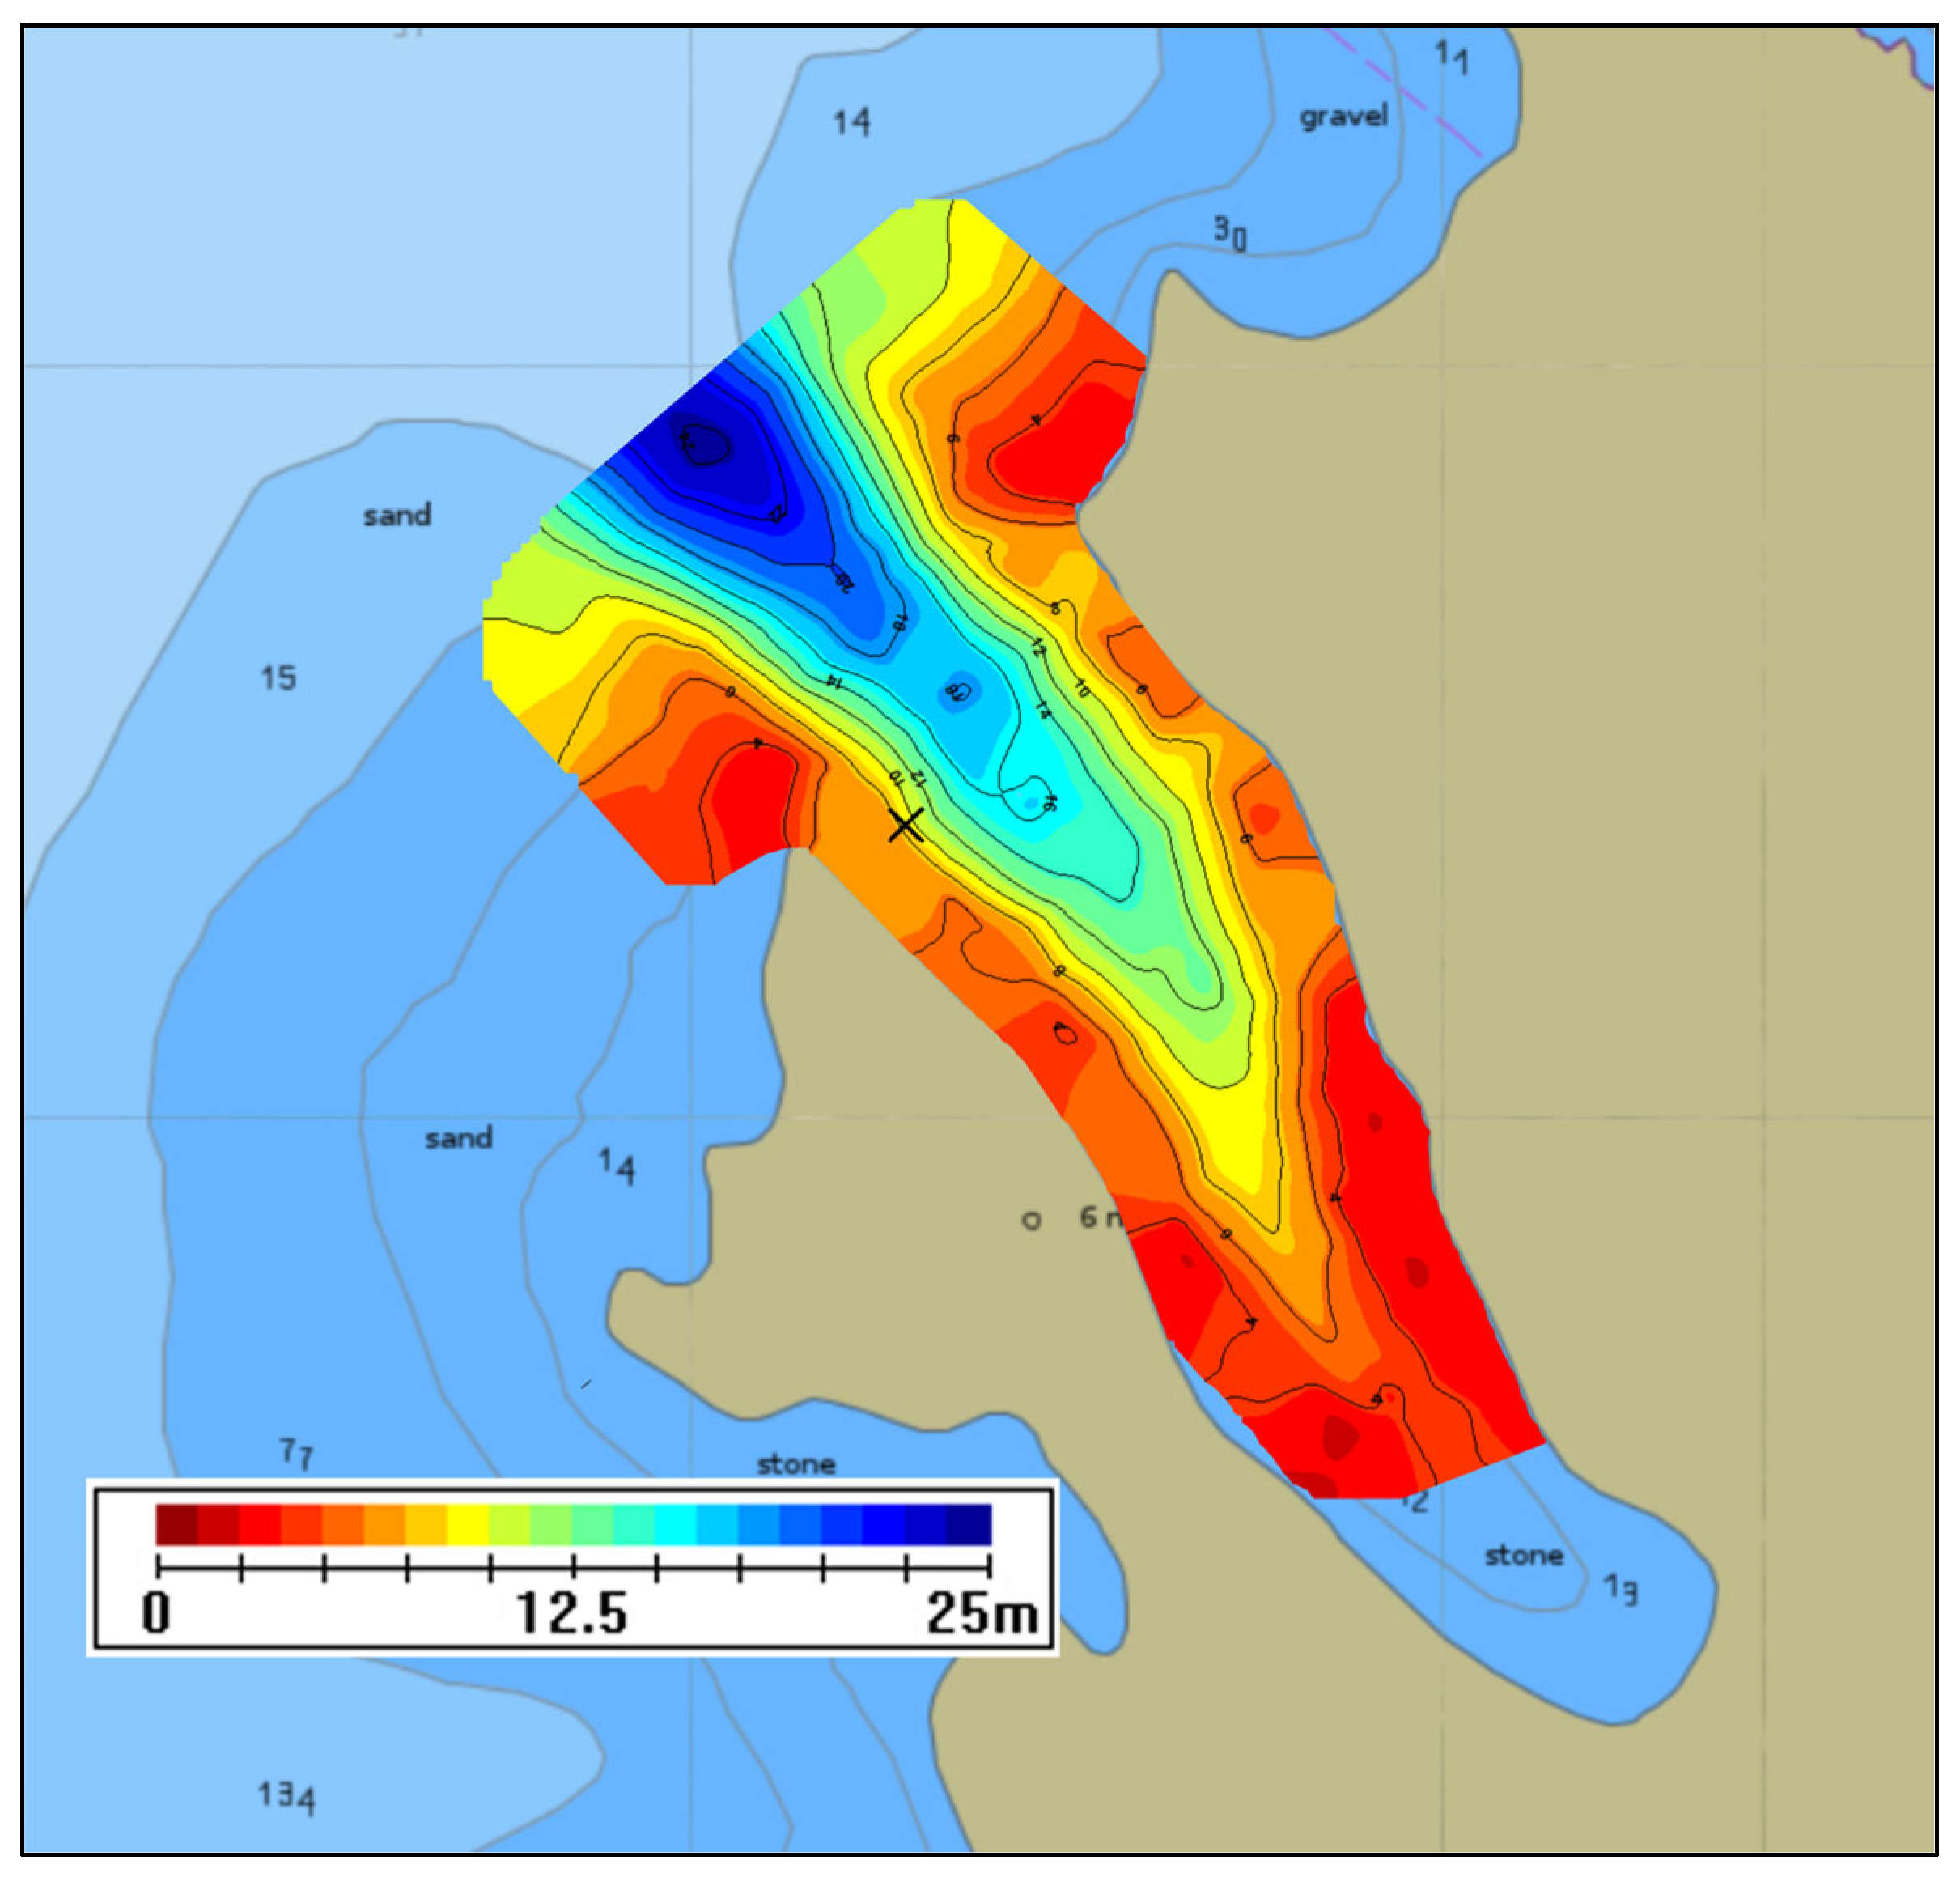
Figure 3.
Bathymetric map of Selehovica bay (overlay on electronic nautical chart).
For accurate measurements, the survey was conducted during a calm sea state, with a cruising speed of 2 knots, navigating in a mesh pattern (parallel and perpendicular to the shoreline at 10 m transects) and considering tidal height corrections. The bathymetric survey included the wider entrance area and the bay and excluded parts where the depths were less than 3.0 m and, hence, impractical. Using side-scan sonar, approximately 24,000 m2 were surveyed in total.
The survey showed that the bay seafloor morphology resembled an S-shaped funnel, spreading from the minimum surveyed depth (3 m) to the maximum measured depth of 25 m at the bay entrance (Figure 3). The survey indicated that the seafloor in the central part of the bay was predominantly flat, with no particular obstacles or significant geological structures that should have been considered for the ROV’s safety. At the bay entrance, the seafloor formed an elongated depression. Further out in the Bay of Rijeka, outside the research area, the depths increased to approximately 50 m.
2.3. ROV Surveys
The temporal dynamics data for the marine litter, i.e., its accumulation on the seafloor over time, were essential; hence, an ROV survey was conducted twice. The first survey was conducted before the summer season in April 2024, and the second was conducted after the summer season in October 2024. The surveys were conducted while the bay was empty (no vessels were present) and during calm weather conditions.
The lengths and widths of the transects were planned following the established scientific standard limits stated in the Guidance on Monitoring of Marine Litter in European Seas [65]. According to the Guidance, to efficiently investigate marine litter on a seafloor, the length of a transect may vary between 20 and 200 m and the width may vary between 4 and 8 m depending on the depth, depth gradient, turbidity, habitat complexity, and litter density.
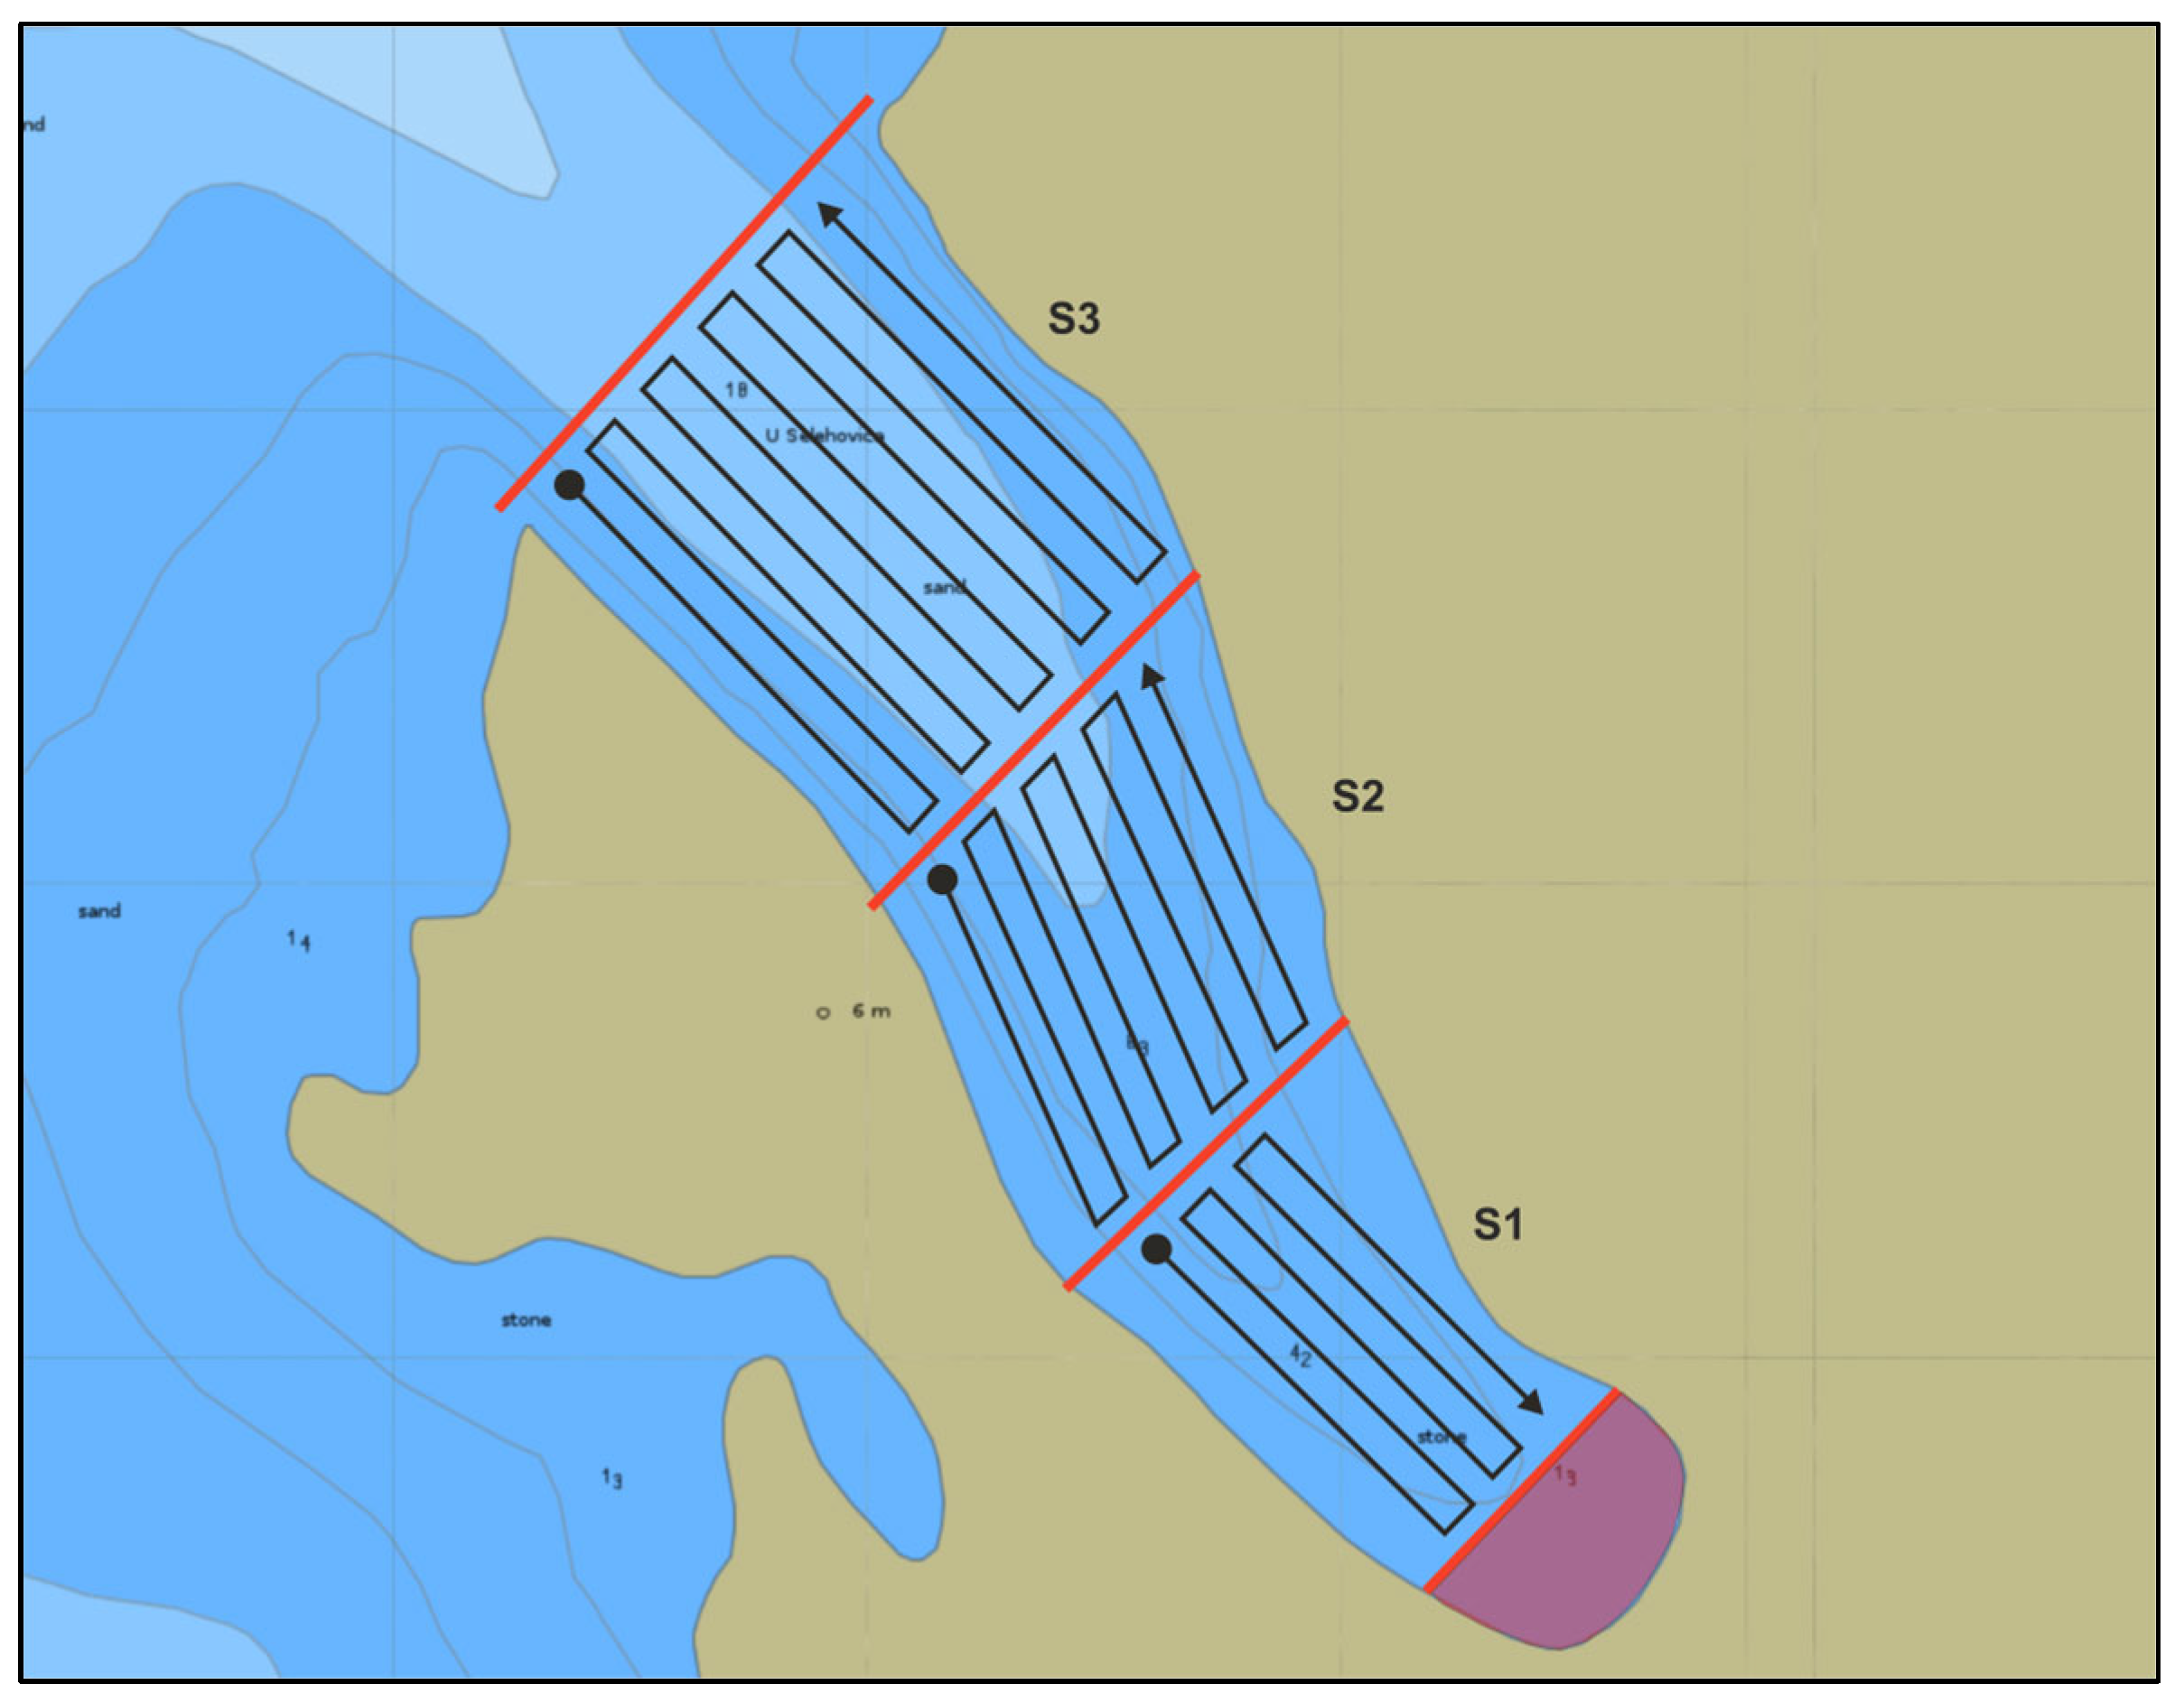
Due to the natural shape of the bay, which resembles an S-shape, and the seafloor morphology, the survey area and associated transects were divided into three sectors named S1, S2, and S3 (Figure 4). Sector S3 ended with a line of positions connecting two endpoints on the bay entry. The division into three sectors ensured a comprehensive analysis of the underwater environment, considering the depth differences, equipment setup, and duration of the ROV recordings.

Figure 4.
Planned transects for the ROV survey (overlay on electronic nautical chart).
The transect length in sector S1 was 80 m, while in the other two, it was 100 m (Table 1). The chosen width between transects in all sectors was 8 m. This width was chosen because daylight is able to reach the seafloor and the underwater visibility in the area is very good (approximately 15 m during calm sea and without seafloor disturbances), and also, the ROV has a built-in wide-angle camera providing a wide field of view. The trials on location confirmed the suitability of the transect width. In total, 22,100 m2 were surveyed using an ROV.

Table 1.
Survey area features.
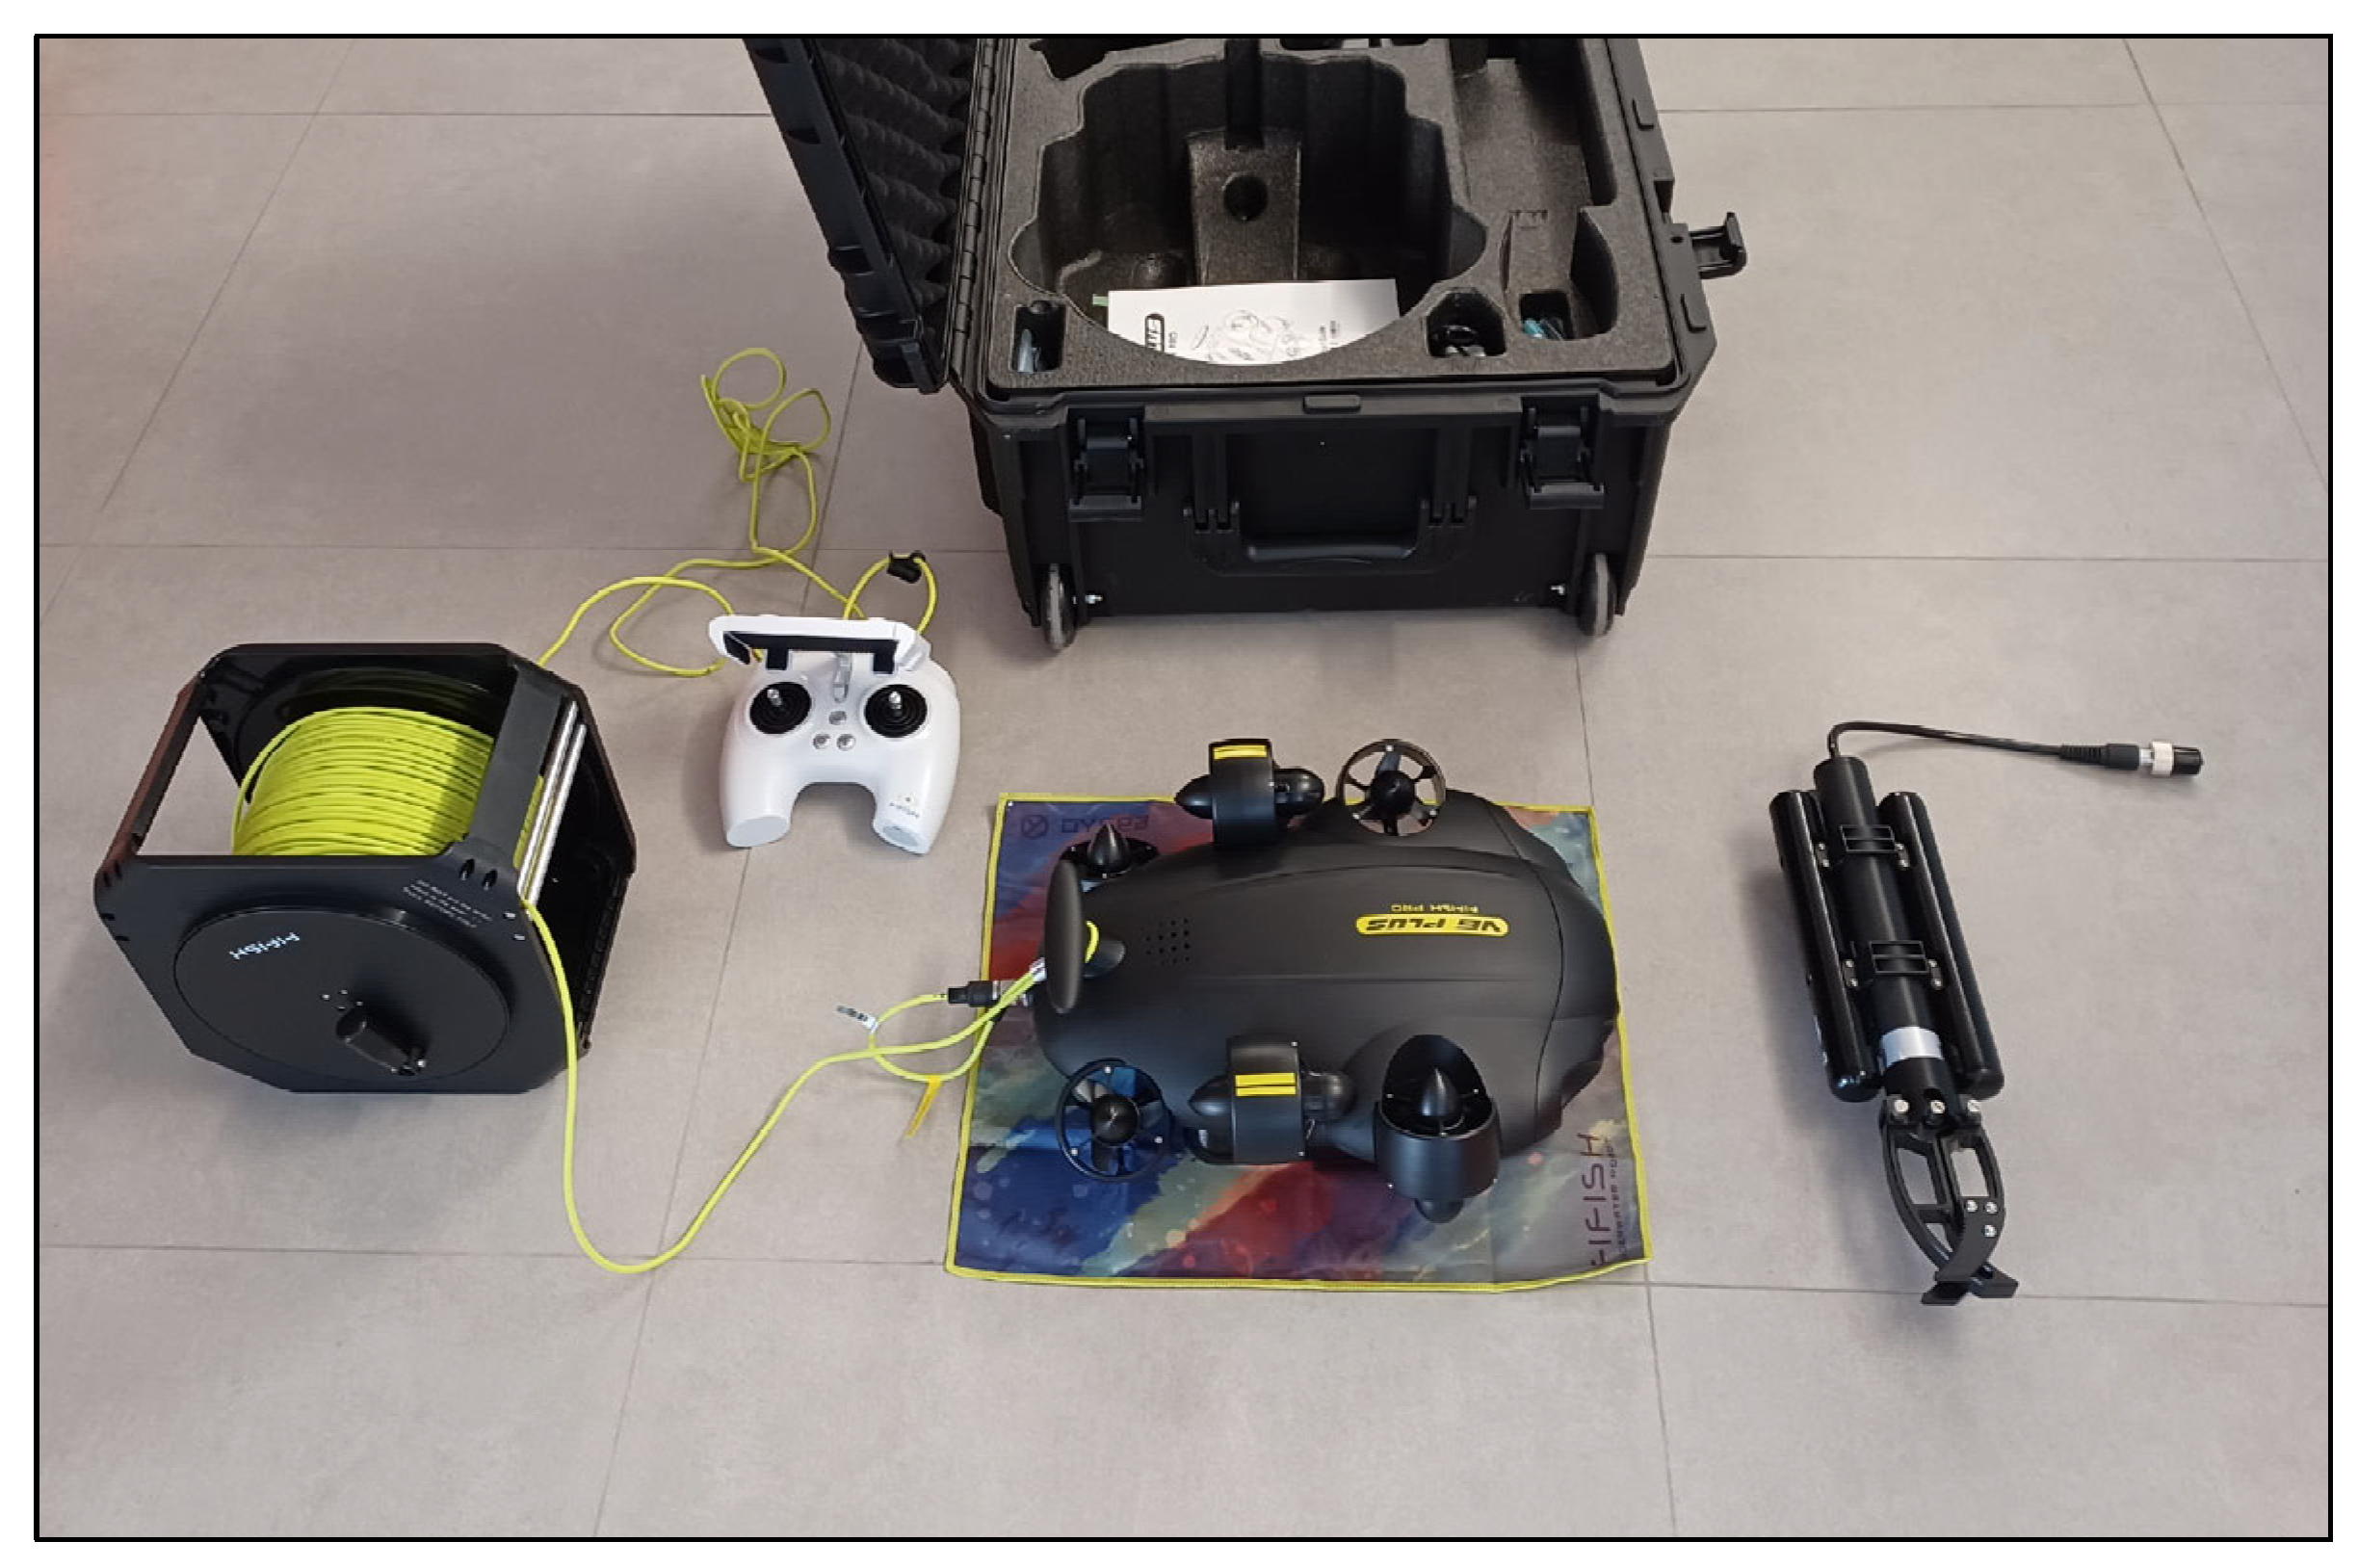
The survey was performed with an inspection class ROV (model Qysea Fifish Pro V6P) capable of diving up to 150 m, and it featured a 166° field-of-view wide-angle lens, a 4K UHD camera with 12 MP resolution, and 6.000 lumen LED lights (Figure 5). The ROV was equipped with a distance and altitude sonar lock system used for holding the same and constant altitude from the seafloor during a survey. The ROV had 6 degrees of freedom, providing the capability to hold any desired posture of the ROV or change it in any desired direction around all main rotational axes. Additionally, the ROV was equipped with two laser beams, providing a reference for any dimensional measurements.
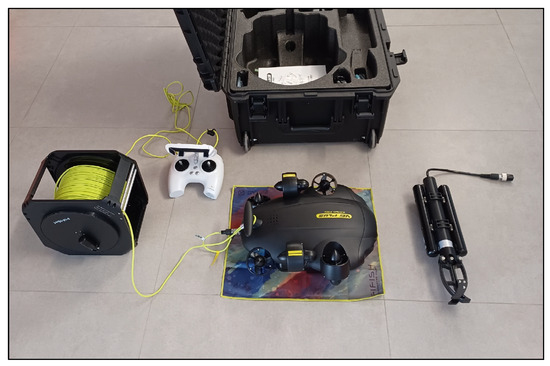
Figure 5.
The ROV: a Qysea Fifish V6P.
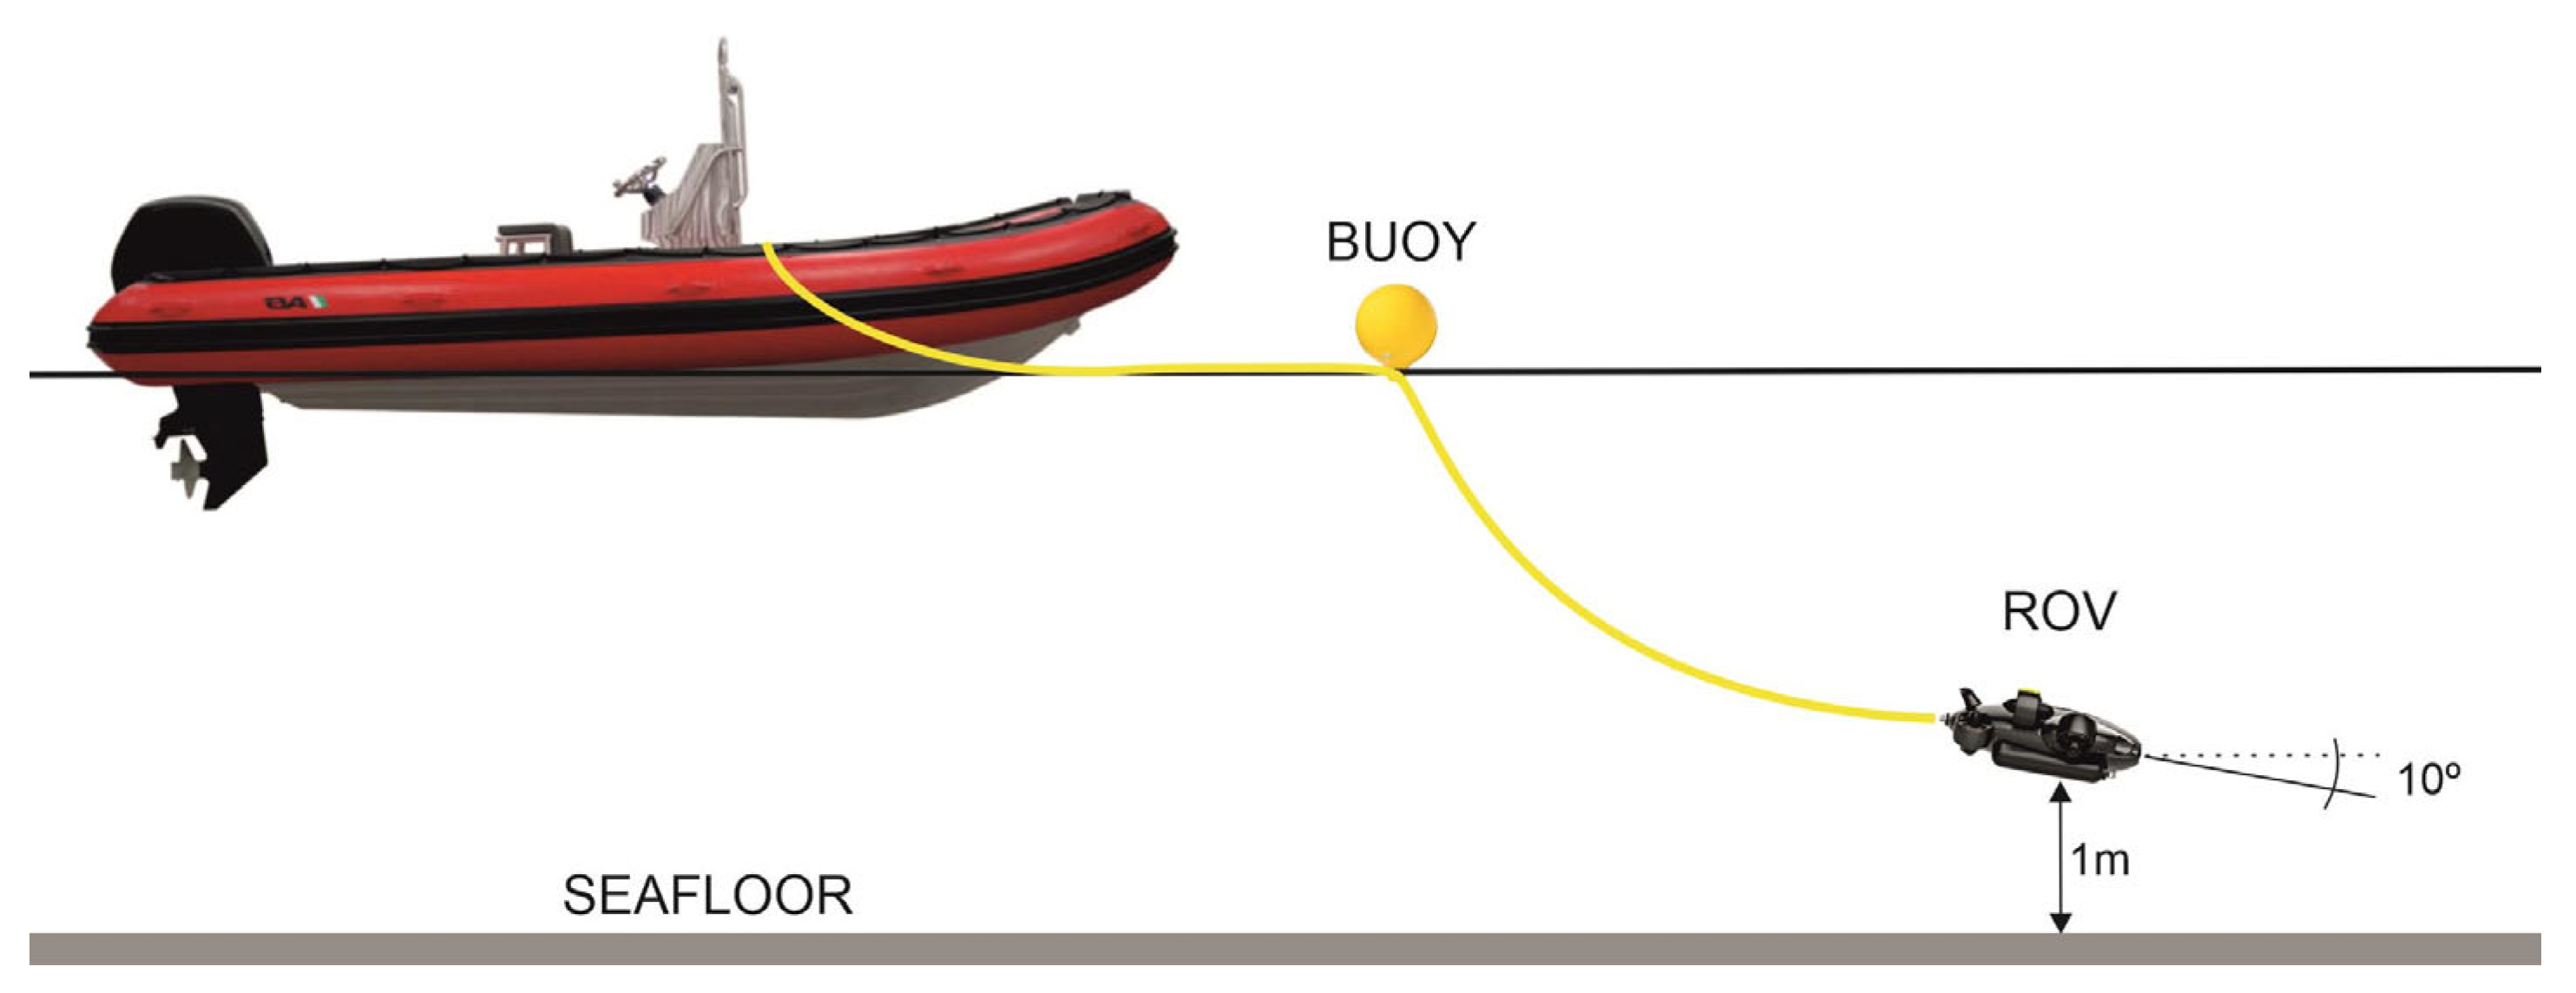
The survey setup was as follows: the ROV was deployed from the research RIB and controlled by the ROV pilot using a mask for visual enhancement. The pilot was sitting safely in the front part of the RIB. A small buoy was attached to the ROV tether and used as a control point for continuous and precise monitoring of the ROV’s movements (Figure 6). The tether length from the ROV to the control buoy was adapted for each sector, i.e., 5 m more than the maximum depth of a particular sector. The tether length from the control buoy to the RIB bow was an additional 5 m, which showed to be optimal, i.e., long enough to keep the safe distance between the buoy and RIB and short enough to precisely move along the planned transects (Figure 7). The navigation was conducted using Humminbird Solix 12 electronic nautical charts with GPS positioning and programmed transect routes. The timing of the ROV operations (commencing, transect passage, changing courses, stops, and endings) was recorded. Continuous coordination and previously agreed communication between the boat skipper and the ROV pilot were required.
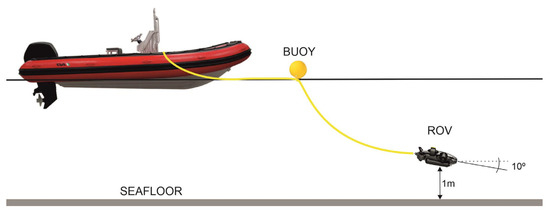
Figure 6.
The boat–ROV setup profile.

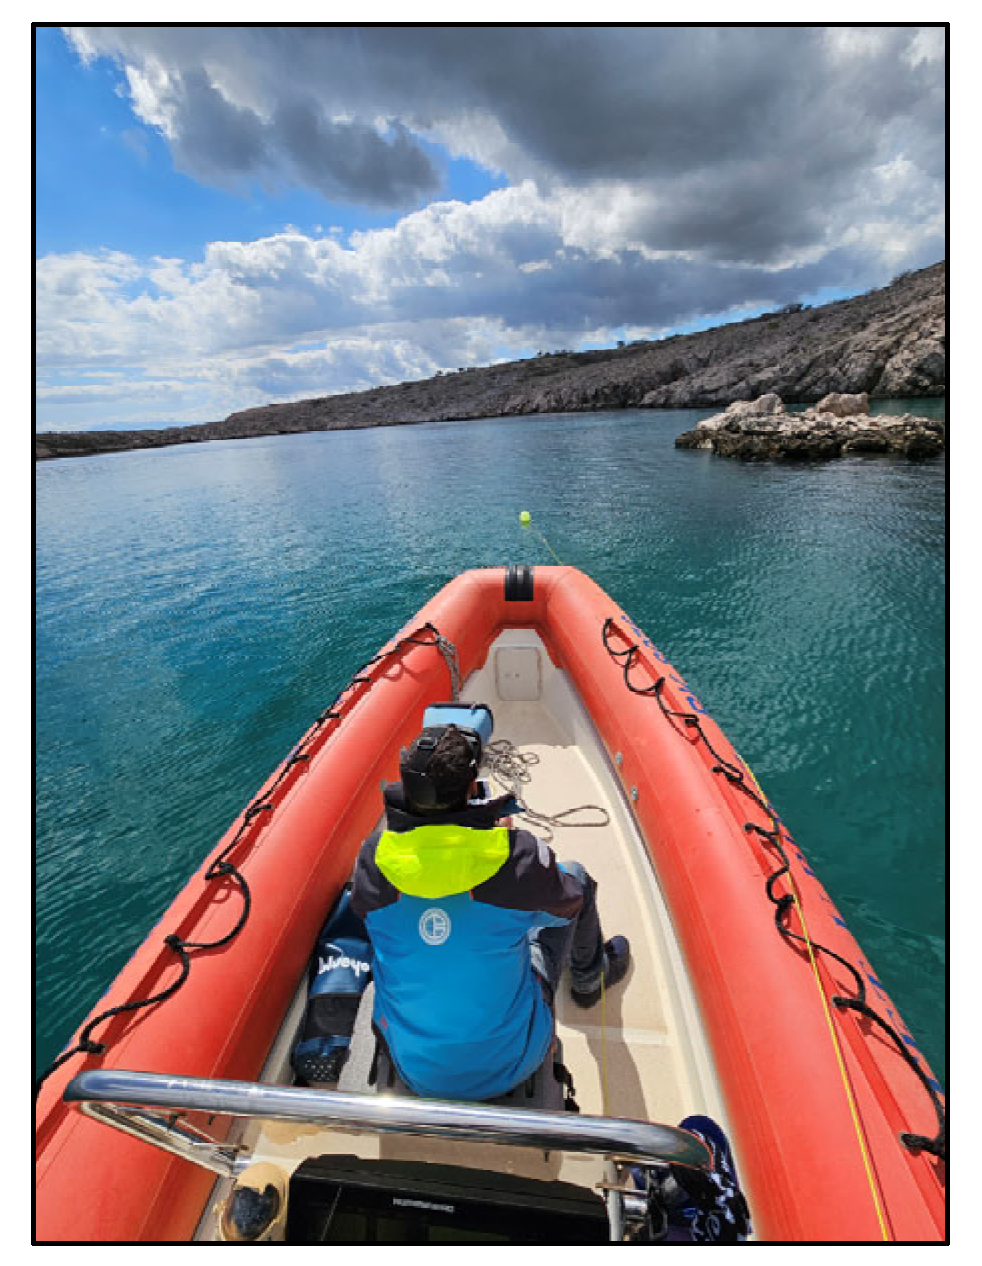
Figure 7.
The boat–ROV setup.
During the transect passages, the ROV altitude was locked at a height of 1 m above the seafloor using the built-in down-looking sonar. To attain the best overview of the items on the seafloor and to hold a steady course while moving forward, the ROV pitch was locked in position 10° downwards. The average speed of the ROV was 0.5 m/s.
This setup was found to be optimal during several trials and within this research considering safety, efficiency in the RIB–ROV maneuvering interrelation, and the quality of the video materials.
2.4. Video and Statistical Analysis
For each survey (pre- and post-season), a total of approximately 240 min of video material was recorded (approximately 45 min for sector S1, 75 min for sector S2, and 120 min for sector S3). Each video was thoroughly examined twice for recognition of and to count every captured item on the seafloor. The number of each recognized item category (type, material, and estimated size) for each sector was recorded in an Excel file. This process was completed by the research team, without trained machine learning algorithms; hence, the reliability is considered high.
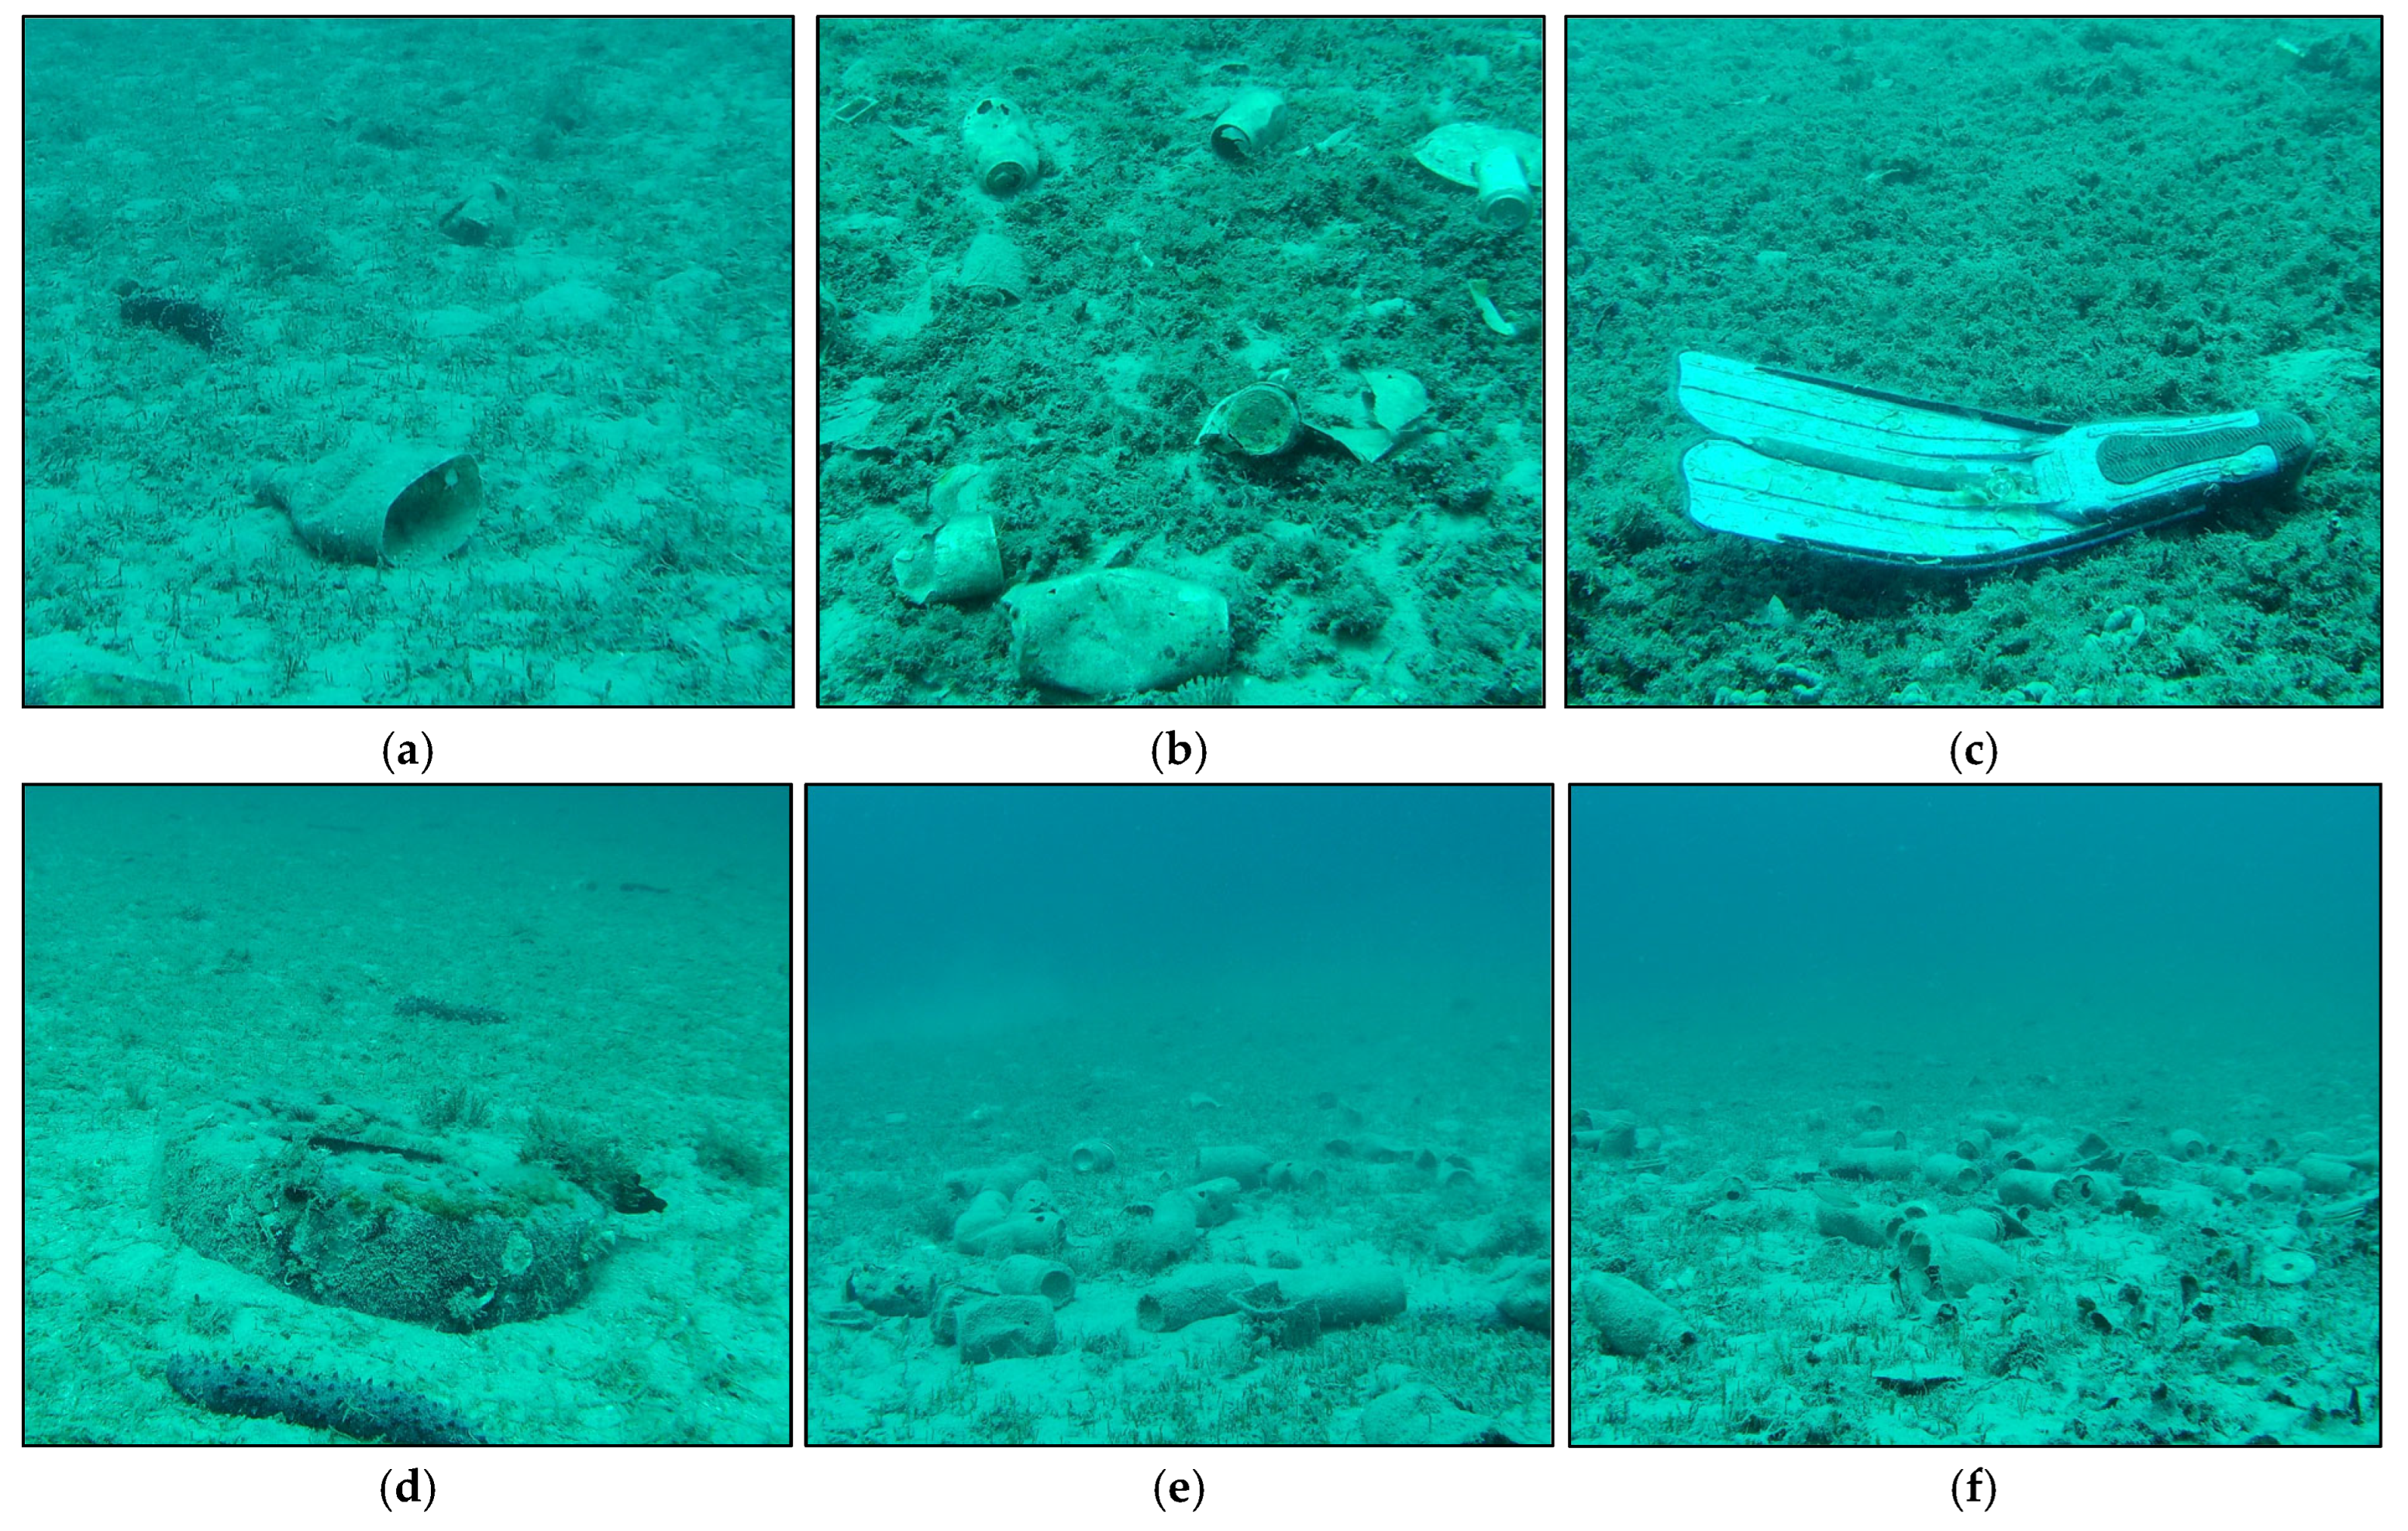
The classification of marine litter was carried out according to the standards set up in The Joint List of Litter Categories for Marine Macrolitter Monitoring prepared by the MSFD Technical Group on Marine Litter, European Commission [65]. The various items captured and classified on the seafloor are shown in Figure 8.

Figure 8.
Recorded seafloor litter in the Bay of Selehovica: (a) a plastic bottle; (b) metal cans; (c) a plastic flipper; (d) a rubber tire; (e) and (f) high accumulation spots.
The collected data were analyzed to assess the abundance, composition, and temporal patterns of the marine litter. A statistical analysis was conducted using DATAtab Team (2025), a statistical software tool. Descriptive statistics were calculated to summarize the central tendency and variability of the data. The Shapiro–Wilk test was used to evaluate the normality of the distributions. As the data deviated from normality, the Wilcoxon Signed-Rank Test was employed to determine the significant differences between the pre-season and post-season observations. Additionally, a Spearman’s rank correlation was performed to explore the strength and direction of relationships between the two periods. Effect sizes, including Cohen’s d, were also calculated to assess the magnitudes of the observed differences.
3. Results
The video and data analysis after the first (pre-season) survey showed a total of 305 ML items on the seafloor, while the analysis after the second (post-season) survey showed a total of 384 ML items in the same area of 22,100 m2. Table 2 presents the numbers and ratios of the ML categories pre- and post-season in the location, categorized according to the monitoring protocol established in The Joint List of Litter Categories for Marine Macrolitter Monitoring prepared by the MSFD Technical Group on Marine Litter, European Commission [65].
Table 2.
Numbers and ratios of the ML categories pre- and post-season in the Bay of Selehovica in 2024.
The absolute number of items shows that the amount of marine litter increased by a significant 25.90%. The last two columns present the ratios of particular categories of ML to the total number of items pre- and post-season.
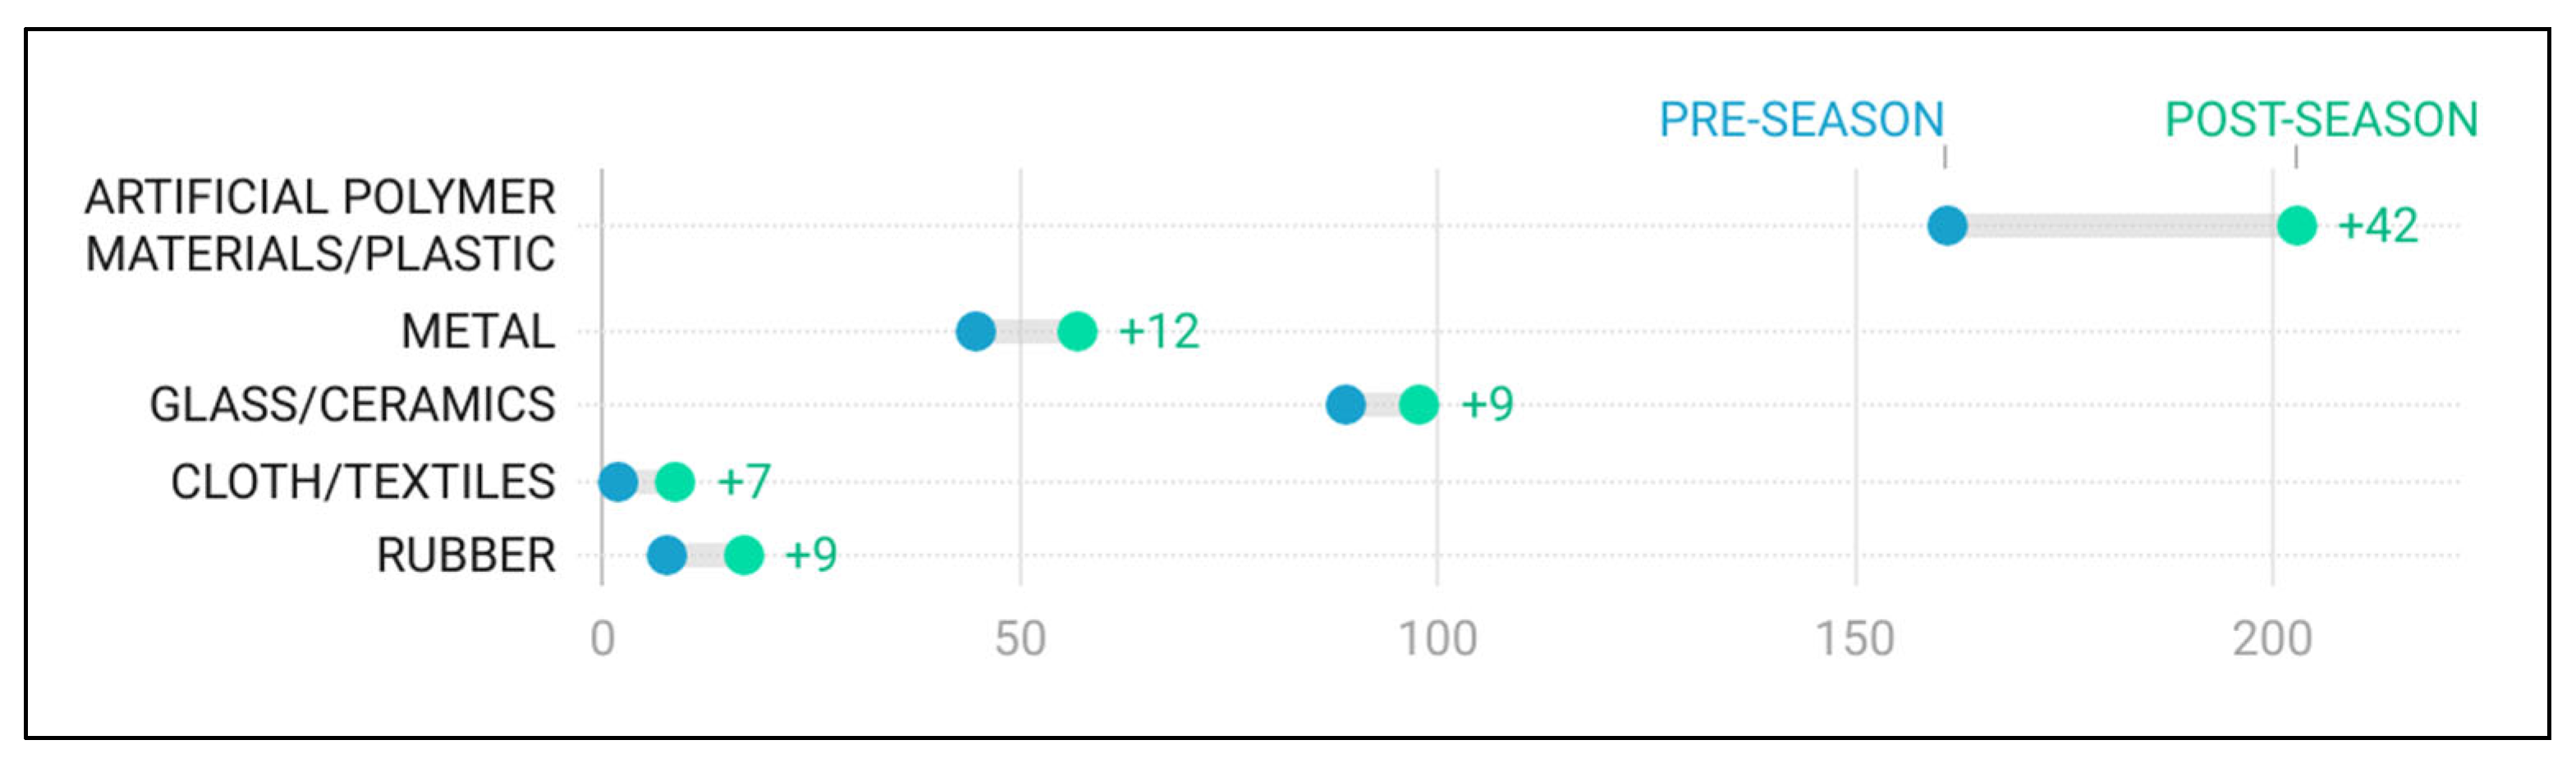
Figure 9 shows the relationship between the amount of marine litter found in the pre-season and post-season surveys considering the five most represented categories of marine litter. The comparison indicated that the largest difference was within the man-made polymeric materials category, with an increase of 42 items (mainly plastic bottles), followed by metal, with an increase of 12 items (mainly drink and food cans); glass and rubber, with an increase of 9 items; and clothing, with an increase of 7 items.

Figure 9.
Comparison of the main marine litter categories: pre-season and post-season.
In both periods observed, plastics dominated, accounting for 52.79% in the pre-season and increasing slightly to 52.86% in the post-season (+0.13%). Glass/ceramics, on the other hand, was the second most common category, accounting for 29.18% in the pre-season and decreasing to 25.52% in the post-season (−12.54%). The ratio of metal also increased very slightly from 14.75% in the pre-season to 14.84% in the post-season (+0.61%). The proportion of rubber rose significantly from 2.62% in the pre-season to 4.42% in the post-season, which corresponded to an increase of 68.70%. The findings were similar to cloth/textiles, which, although less common, showed a significant increase of approximately 260.00%, i.e., from the pre-season (0.65%) to the post-season (2.34%).
When analyzing the plastic category specifically, plastic drink bottles sized ≤0.5 L and >0.5 L accounted for the largest share, having a cumulative share of 73% in the pre-season and 65% in the post-season. Bottles were followed by plastic covers, with a total of 9% in the pre-season and 8% in the post-season. Plastic crates, boxes, and baskets were the least represented, with 0.62% in the pre-season and 2% in the post-season (Figure 10).
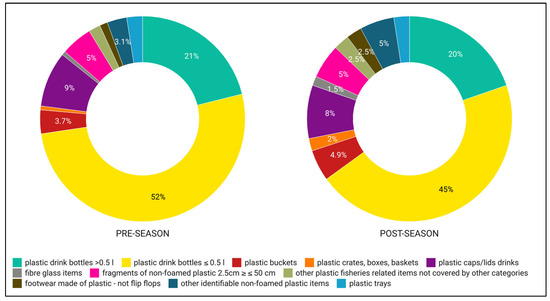
Figure 10.
Plastic subcategories distribution: pre-season vs. post-season.
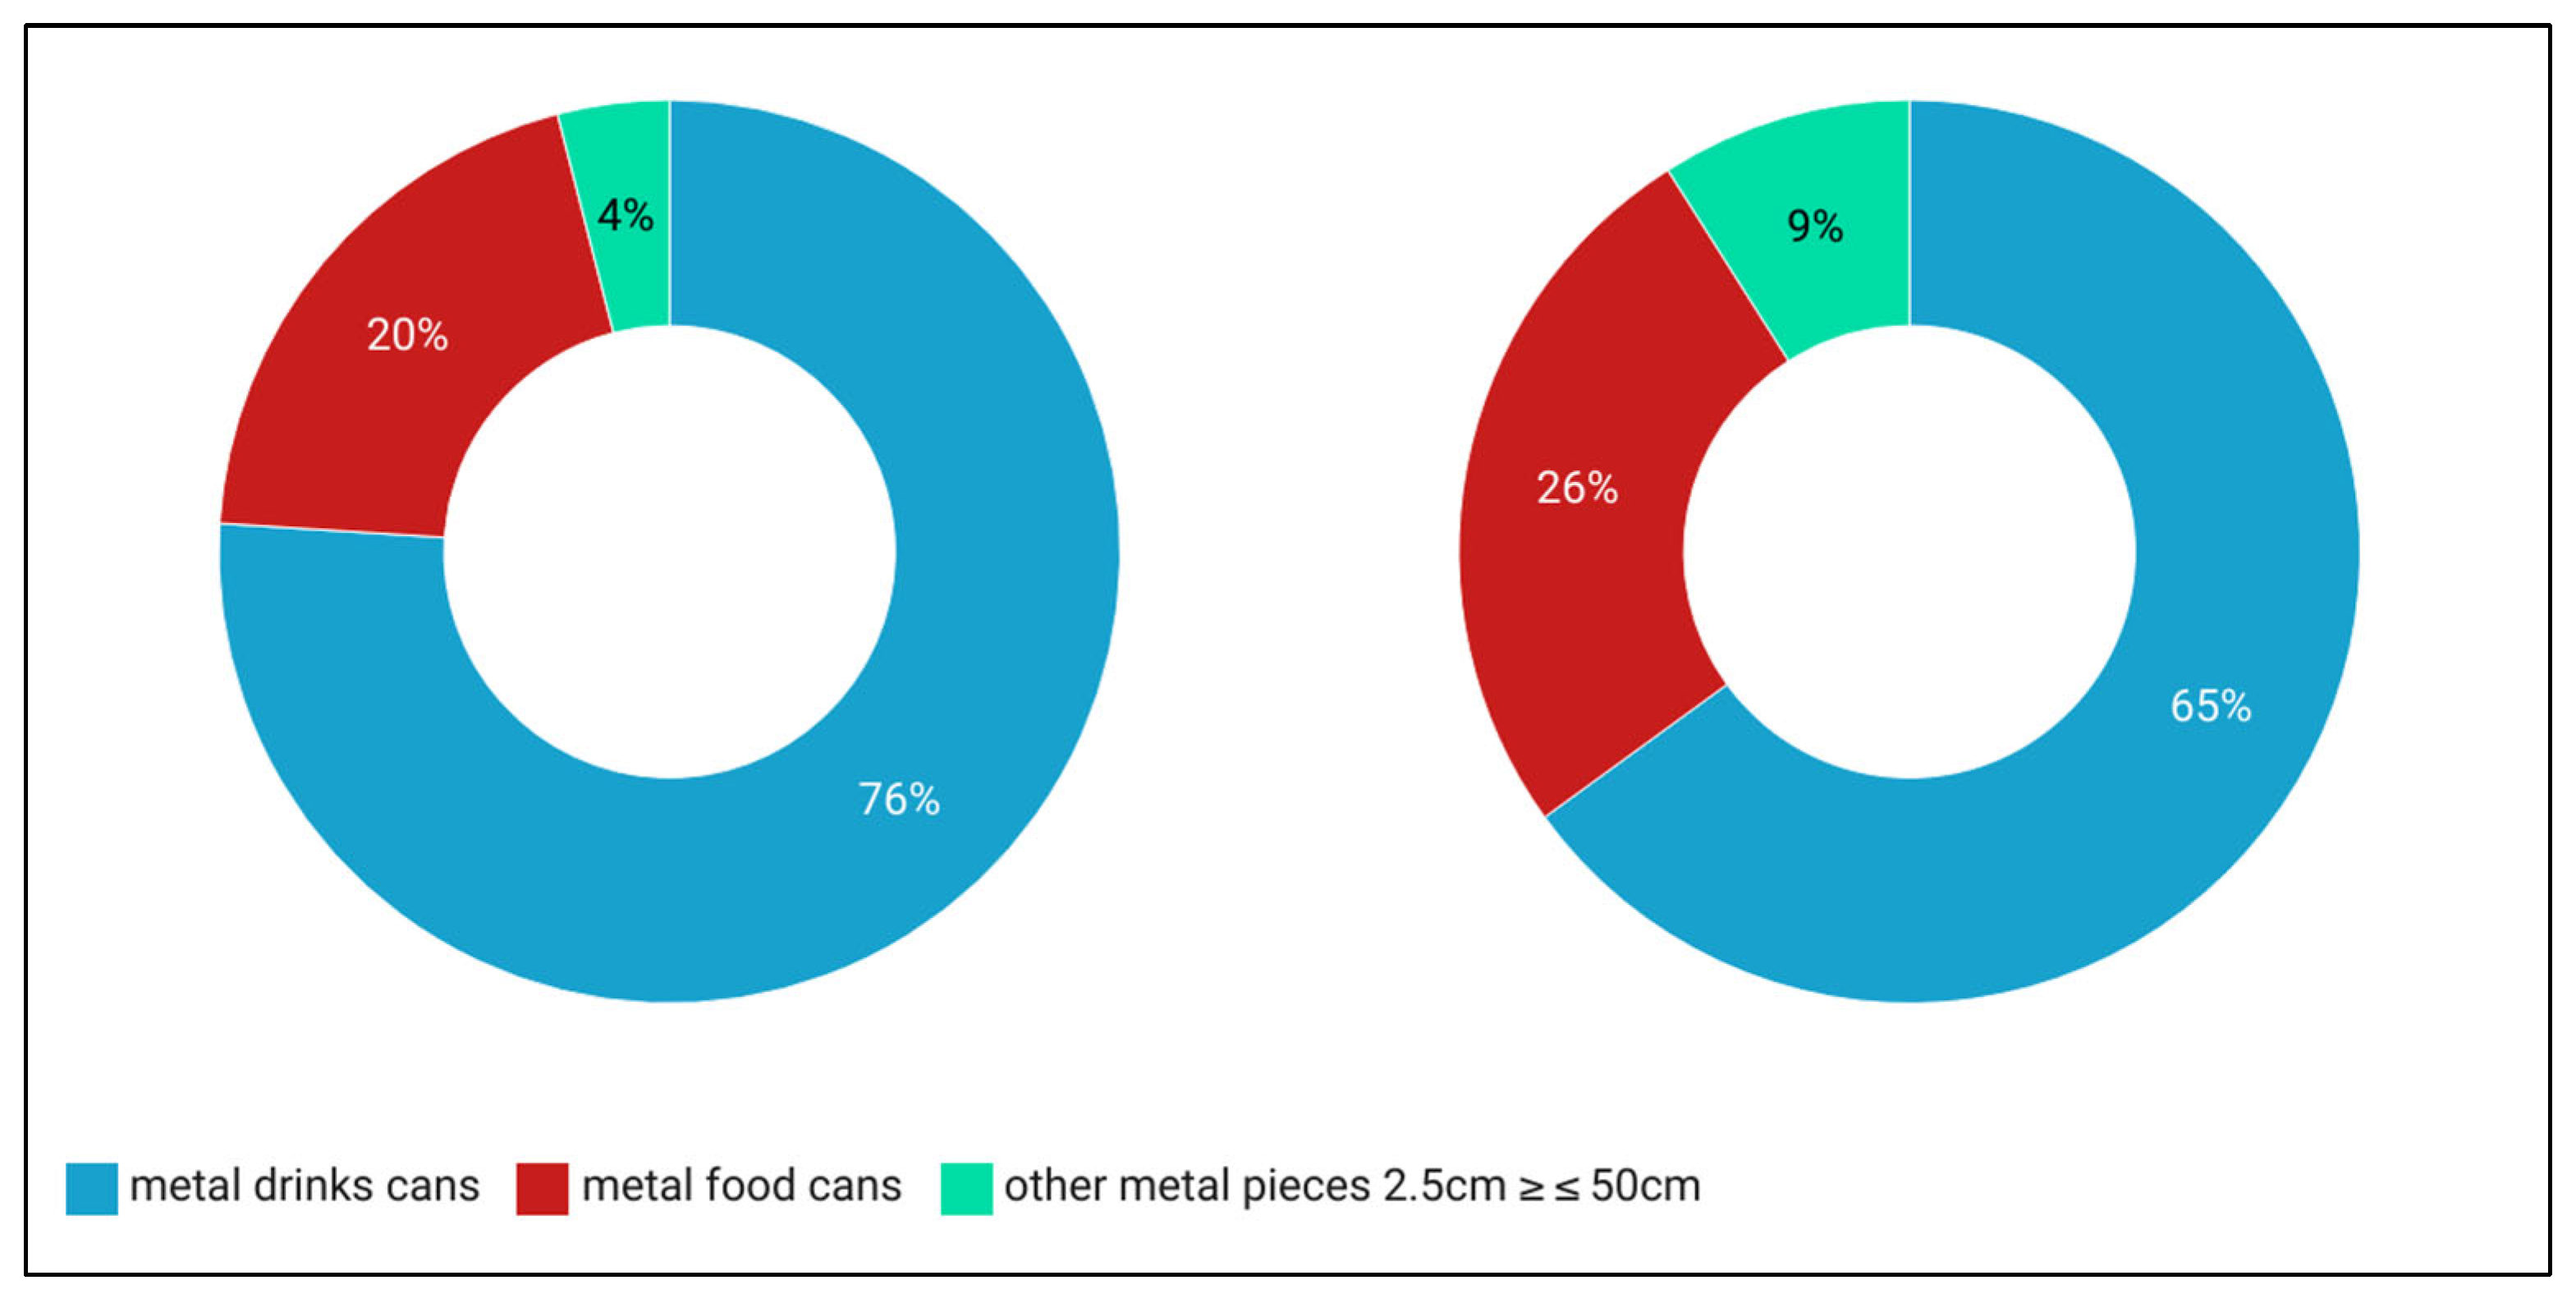
Analyzing the metal category, drink cans and food cans (which was expected considering that nautical tourists are very likely to use food and drinks in metal cans) dominated, with 96% in the pre-season and 91% in the post-season (Figure 11).
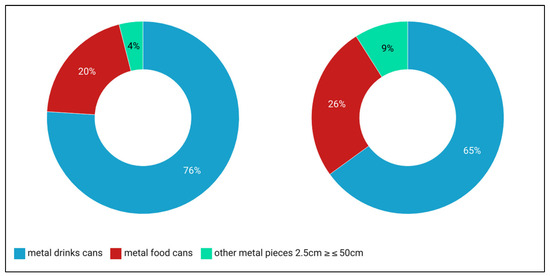
Figure 11.
Metal subcategories distribution: pre-season (on left) vs. post-season (on right).
Analyzing the glass category, glass bottles dominated, with a total of 82% in the pre-season and 81% in the post-season, followed by jars, with 18% in the pre-season and 19% in the post-season. Analyzing the rubber category, rubber tires were the most common rubber item, with a ratio of 50% in the pre-season and 59% in the post-season. Finally, the textile category mainly included textile towels.
The results indicated a significant accumulation of marine litter, with an additional 79 items recorded during the post-season survey. This increase highlights the dynamic nature of marine litter accumulation and the importance of understanding temporal changes and trends for effective management.
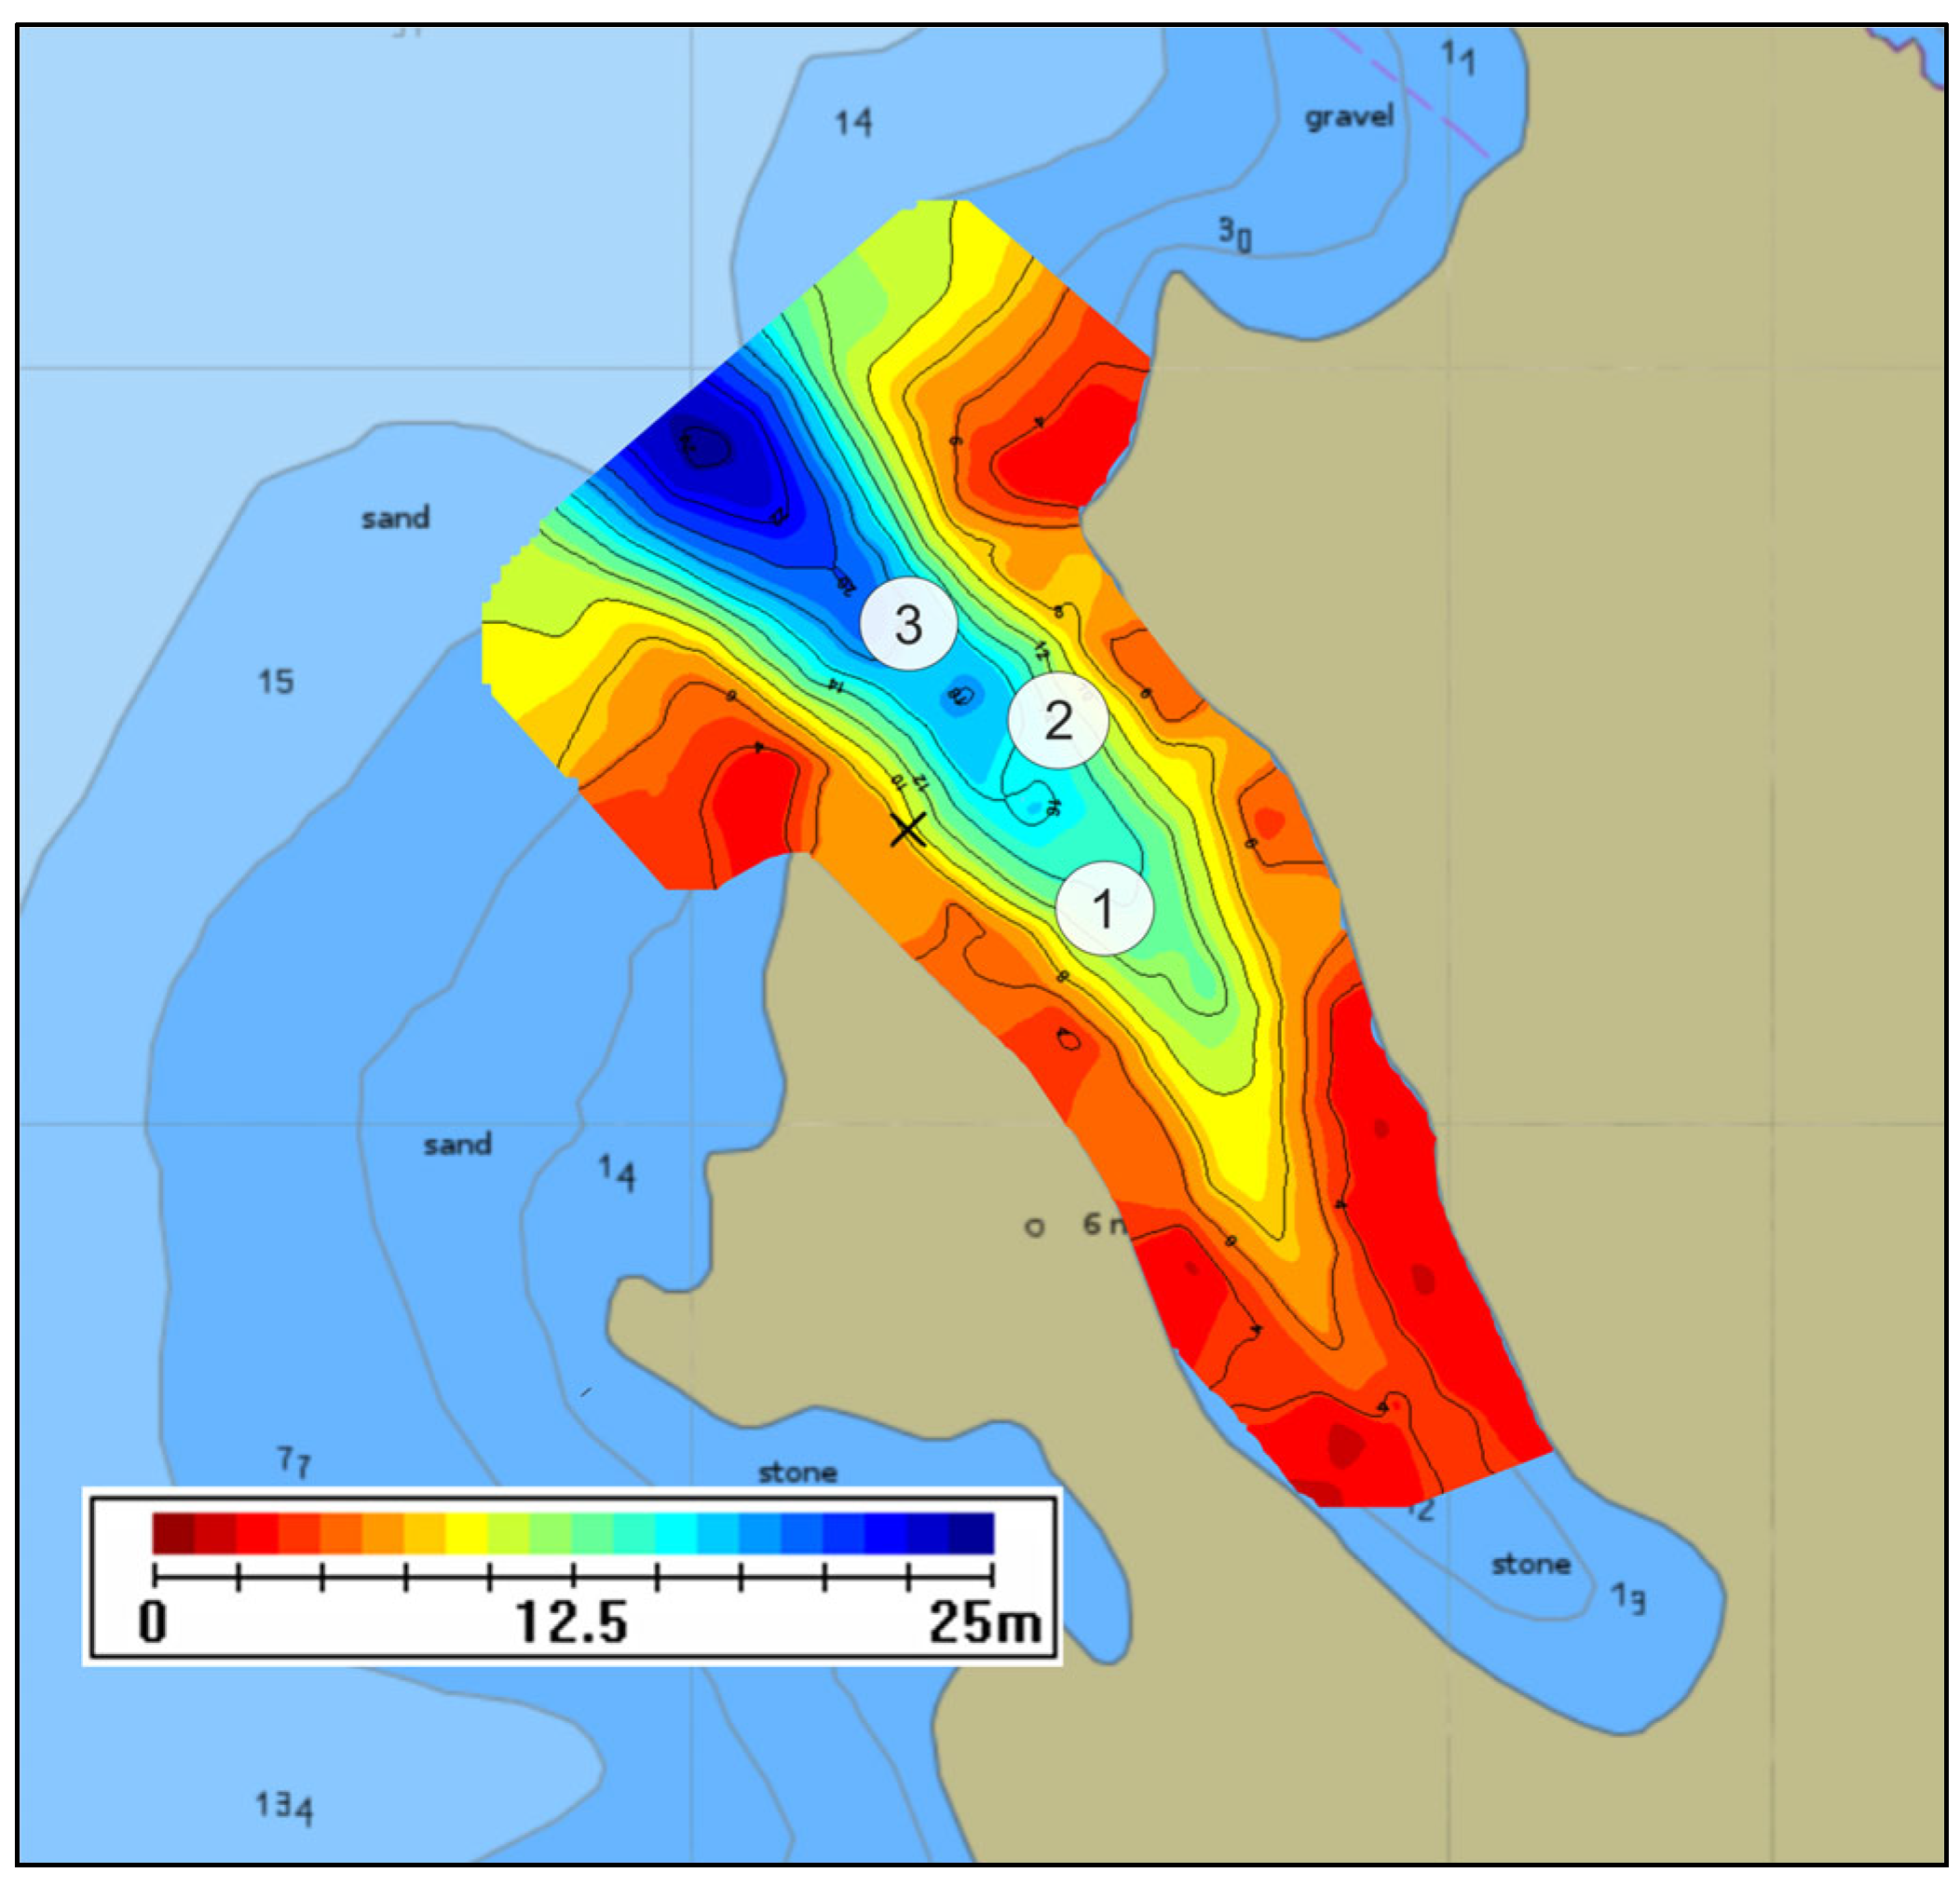
The average abundance of marine litter (ML) on the seafloor in Selehovica Bay was 0.013 items/m2 in the pre-season and 0.017 items/m2 in the post-season (equivalent to 130–170 items per hectare or 13,000–17,000 items per km2). Despite these relatively low average values, the bay contains three distinct hotspots with localized densities of ≥4 items/m2 (400,000 items per km2), indicating a highly uneven spatial distribution and significant accumulation in specific areas (Figure 12). A detailed comparison with other regional and European studies is provided in the discussion section below. Overall, the area may be considered highly contaminated, and the average litter concentrations can be compared with those found in other Adriatic Sea locations subject to high nautical tourism pressure [53].
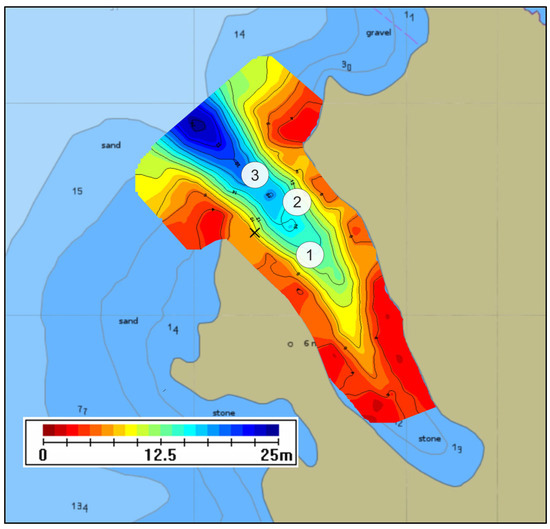
Figure 12.
Three areas (1, 2, and 3) with high ML item concentrations per m2 (overlay on electronic nautical chart).
To evaluate the assumption of data normality, the Shapiro–Wilk test was conducted. The results revealed a violation of normality for both the pre-season data (W = 0.65, p < 0.001) and the post-season data (W = 0.66, p < 0.001), indicating that both datasets significantly deviated from a normal distribution (p < 0.05). As a result, the non-parametric Wilcoxon Signed-Rank Test was employed to assess the differences between the two time periods. The pre-season group exhibited lower litter values (Mdn = 5) compared to the post-season group (Mdn = 10). A one-tailed Wilcoxon test for paired samples confirmed that this difference was statistically significant (W = 0, p < 0.001) confirming a significant increase in marine litter accumulation from pre- to post-season.
The effect size, calculated using Cohen’s d, was 0.89, which indicated a large effect and suggested a substantial disparity in marine litter composition between the two periods. In addition, a Spearman correlation analysis revealed a very high positive correlation between the pre-season and post-season values, suggesting that higher pre-season values were generally associated with higher post-season values. This correlation was statistically significant (r(17) = 0.96, p < 0.001).
Finally, descriptive statistics further detailed the nature of the marine litter abundance. The pre-season had a mean of 16.05 items, a median of 5, and a standard deviation of 23.99. In contrast, the post-season showed higher levels, with a mean of 20.21 items, a median of 10, and a standard deviation of 25.26.
These findings demonstrate that marine litter accumulation exhibits seasonal patterns and that a comprehensive understanding of temporal variation is important for the development of effective management and mitigation strategies.
4. Discussion
The discussion section is divided into two parts: the first focuses on the methodology and the practical experience gained during the research, while the second addresses the findings related to the global issue of marine litter.
Methodology. After reviewing the research of other authors, it was evident that there were various approaches when using different ROV classes for seafloor surveys. In general, technically advanced ROV units with different accessories and significantly higher costs, compared to smaller ROVs with basic equipment, enable far better results and greater flexibility.
The ROV used in this research (a Qysea Fifish V6P) could be considered part of the upper-level range of basic inspection-class ROVs. This model has two significant features that enhance surveys. The first is omnidirectional maneuvering, which enables the ROV to regulate and hold its pitch and roll degrees as necessary. This allows the ROV to adapt to seafloor morphology, resulting in better video recordings that are easier to view and analyze. The second notable feature is the ability to automatically adjust its predefined altitude, i.e., the distance from the seafloor, using a down-looking sonar. This capability enables smoother, more precise maneuvering without unnecessary interruptions.
However, a limitation of the unit used in this study is the lack of an underwater localization system. While precise geographical positioning is less critical when surveying a seafloor along a long, straight transect, as is common in many studies, it becomes important when surveying a specific area in detail following a predefined pattern. To address this, the study minimized position errors by using a surface control buoy, maintaining an 8 m separation between transects, and carefully comparing video records from adjacent transects.
Marine Litter. This study aimed to assess the pressure of nautical tourism vessels on the seafloor. The selected location criteria (a closed-type bay to reduce the impact of sea currents on transferring floating litter, an area with intensive activities by targeted vessels, no visitation from the coastal side, no infrastructure on shore, and not being cleaned before) supported the hypothesis that most of the litter found in the Bay of Selehovica originated from nautical tourist activities. Of course, regardless of the carefully chosen location, it was not exclusive that the ML did not accumulate from other sources and sea fluctuations (mostly wind/wave/current influences).
The research revealed significant seasonal variations in the litter amounts on the seafloor, with a 25.9% increase between the pre-season and post-season surveys. This aligned with previous studies [44,45,46,47,54], strongly indicating a correlation between nautical activities and marine litter accumulation on the seafloor. However, it should be emphasized that a comparison over one year is a rather short period of temporal coverage. Multi-seasonal monitoring over several years should be conducted to obtain more in-depth data, interannual and yearly trends, and, thus, more precise anthropogenic pressure on the seafloor. Hence, the authors intend to continue the monitoring of the selected area.
Regarding materials, plastic dominated, accounting for over 50% of total litter, followed by glass and metals. Among the items, plastic drink bottles were the most prevalent, followed by glass bottles and metal drink cans, likely due to negligent littering or accidental losses. The fact that the research area was not cleaned before was positive, providing the ability to identify accumulation patterns and litter composition on the “undisturbed site”. On the other hand, it was also negative because of possible ML accumulation in layers or that the ML was covered with sediment (older items), which could make it difficult to estimate the ML quantity and seasonal fluctuations precisely. The optimal approach would be to conduct an annual thorough cleaning of a site and a subsequent analysis of the seafloor.
Heavier plastic items likely remained at their initial point of deposition due to their higher density, resisting movement by currents or waves. With increasing depths near the entrance, the funnel-shaped bay morphology further suggested that a portion of the ML was carried outwards over time. ML was detected beyond the bay’s limits, indicating that monitoring efforts should include adjacent areas near bay entrances to account for litter displacement.
When placed in context with other studies on Adriatic and European waters, both the average and hotspot densities in Selehovica Bay were notable. In a comparable regional study, Stagličić et al. [53] surveyed several coastal sites along the eastern Adriatic Sea in Croatia and reported ML densities ranging from 0.04 to 0.9 items/m2, with data categorized by material type (plastics, glass/ceramics, metals, textiles, etc.). Although the average ML density in Selehovica Bay (0.013–0.017 items/m2) was below the range reported by Stagličić et al., the hotspot areas (≥4 items/m2) in our study far exceeded the maximum values recorded in that work. This suggested that while Selehovica Bay had a lower average ML burden, it contained localized zones of extreme accumulation, likely driven by hydrodynamic conditions or tourism-related activities.
In broader European waters, Urban-Malinga et al. [66] reported ML densities from the southern Baltic Sea using bottom trawl surveys, with average values of approximately 0.20 items/ha, equivalent to 0.00002 items/m2. This means the average ML density in Selehovica Bay was approximately 650–850 times higher than the southern Baltic average.
Similarly, Buhl-Mortensen and Buhl-Mortensen [67] found background seafloor ML densities in the Nordic Seas of 202–279 items/km2 (i.e., 0.00020–0.00028 items/m2), with isolated peaks of up to 6000 items/km2 (0.006 items/m2). The average values from Selehovica Bay were 60–85 times higher than these Nordic background levels, and the hotspot concentrations surpassed the Nordic maximum values by nearly 700 times.
For a continental reference, Pham et al. [8] reported average ML densities across the European continental shelf of approximately 2.2 items/ha, or 0.00022 items/m2, again placing Selehovica Bay well above the typical background levels in temperate European waters.
Taken together, these comparisons show that while the average litter density in Selehovica Bay was lower than some localized coastal sites in the Adriatic (e.g., the areas studied by Stagličić et al.), it was substantially higher than most other European regions when considering both average and peak values.
5. Conclusions
This study underscores the effectiveness of ROV surveys in underwater monitoring, particularly for marine litter detection and analysis. The methodology and insights shared here can serve as a model for future research in this area and other regions. High-quality data collected using an ROV and bathymetric surveys provided a comprehensive understanding of the seafloor environment and facilitated detailed analyses of the litter accumulation.
The findings highlight nautical tourism vessels as a significant source of marine litter accumulation on the seafloor. Seasonal variation from pre- to post-season reflects the direct impact of these activities. Similar to other studies, plastics dominated the composition of the ML. Drink bottles, glass bottles, and metal drink cans were the most common items. Heavier items tended to remain localized, while lighter litter may have been transferred along the seafloor in deeper areas.
In Croatia, systematic monitoring of ML abundance, hotspot identification, and compliance with the Guidance on Monitoring of Marine Litter in European Seas (2013) and the Marine Waste Management Plan (2020) have yet to be implemented on regional or state levels.
Increased collaboration between local authorities, boating stakeholders, communities, and environmental organizations is essential to raise awareness of marine litter on the seafloor. Management strategies such as waste disposal facilities on boats, waste disposal vessels or buoys, stricter regulations on marina and port waste management, and measures targeting zero introduction of litter into the sea are crucial to mitigating the issue.
Author Contributions
Conceptualization, L.M. (Livia Maglić) and L.M. (Lovro Maglić); methodology, L.M. (Livia Maglić) and L.M. (Lovro Maglić); software, L.M. (Livia Maglić) and L.M. (Lovro Maglić); validation, L.M. (Livia Maglić) and L.M. (Lovro Maglić); formal analysis, L.M. (Livia Maglić) and L.M. (Lovro Maglić); investigation, L.M. (Livia Maglić), L.M. (Lovro Maglić), and A.B.; resources, L.M. (Lovro Maglić); data curation, L.M. (Livia Maglić) and L.M. (Lovro Maglić); writing—original draft preparation, L.M. (Livia Maglić), L.M. (Lovro Maglić), and A.B.; writing—review and editing, L.M. (Livia Maglić), L.M. (Lovro Maglić), and A.B.; visualization, L.M. (Livia Maglić) and L.M. (Lovro Maglić); supervision, L.M. (Livia Maglić) and L.M. (Lovro Maglić); project administration, L.M. (Livia Maglić); funding acquisition, L.M. (Livia Maglić). All authors have read and agreed to the published version of the manuscript.
Funding
This research was supported by the project “Impact of Nautical Tourism Vessels on Seabed Pollution in Primorsko-Goranska County” and funded by the Scientific-Research Project Initiatives of The University of Rijeka, Croatia (project number: ZIP UNIRI 2103-7-22).
Data Availability Statement
The raw data supporting the conclusions of this article will be made available by the authors on request.
Conflicts of Interest
The authors declare no conflicts of interest.
Abbreviations
The following abbreviations are used in this manuscript:
| ML | Marine litter |
| ROV | Remotely operated vehicle |
| SCUBA | Self-contained underwater breathing apparatus |
| EBI | European boating industry |
| MSFD | Marine strategy framework directive |
| RIB | Rigid inflatable boat |
| UHD | Ultra-high definition |
References
- UNEP. Marine Litter: A Global Challenge; UNEP: Nairobi, Kenya, 2009; 232p. [Google Scholar]
- Plastic Oceans. Available online: https://plasticoceans.org/the-facts (accessed on 18 October 2024).
- Ocean Literacy Portal. Available online: https://oceanliteracy.unesco.org/plastic-pollution-ocean (accessed on 19 October 2024).
- IMO. Review of the Current State of Knowledge Regarding Marine Litter in Wastes Dumped at Sea Under the London Convention and Protocol–Final Report; IMO: London, UK, 2016. [Google Scholar]
- Eunomia. Plastics in the Marine Environment. Available online: https://eunomia.eco/reports/plastics-in-the-marine-environment (accessed on 19 October 2024).
- Oceana. Protecting the World’s Ocean. Available online: https://oceana.org/blog/3-misconceptions-about-great-pacific-garbage-patch (accessed on 12 October 2024).
- Population Education. Available online: https://populationeducation.org/8-facts-about-the-garbage-gyres-in-our-oceans (accessed on 8 October 2024).
- Pham, C.K.; Ramirez-Llodra, E.; Alt, C.H.S.; Amaro, T.; Bergmann, M.; Canals, M.; Company, J.B.; Davies, J.; Duineveld, G.; Galgani, F.; et al. Marine Litter Distribution and Density in European Seas, from the Shelves to Deep Basins. PLoS ONE 2014, 9, e95839. [Google Scholar] [CrossRef]
- Galgani, F. Marine litter, future prospects for research. Front. Mar. Sci. 2015, 2, 2296–7745. [Google Scholar] [CrossRef]
- Melli, V.; Angiolillo, M.; Ronchi, F.; Canese, S.; Giovanardi, O.; Querin, S.; Fortibuoni, T. The first assessment of marine debris in a Site of Community Importance in the north-western Adriatic Sea (Mediterranean Sea). Mar. Pollut. Bull. 2017, 114, 821–830. [Google Scholar] [CrossRef]
- Sbrana, A.; Maiello, G.; Gravina, M.F.; Cicala, D.; Galli, S.; Stefani, M.; Russo, T. Environmental DNA metabarcoding reveals the effects of seafloor litter and trawling on marine biodiversity. Mar. Environ. Res. 2024, 196, 106415. [Google Scholar] [CrossRef]
- Sandra, M.; Devriese, L.I.; Booth, A.M.; De Witte, B.; Everaert, G.; Gago, J.; Galgani, F.; Langedock, K.; Lusher, A.; Maes, T.; et al. A systematic review of state-of-the-art technologies for monitoring plastic seafloor litter. J. Ocean Eng. Sci. 2023, in press. [Google Scholar] [CrossRef]
- Nogueira, P.; Kammann, U.; Aust, M. Visual quantification and identification of shallow seafloor marine litter in the southernmost North and Baltic seas using an epibenthic video sledge (EVS)—A comparison to bottom trawl data. Sci. Total Environ. 2023, 891, 164633. [Google Scholar] [CrossRef]
- Cau, A.; Sbrana, A.; Franceschini, S.; Fiorentino, F.; Follesa, M.C.; Galgani, F.; Garofalo, G.; Gerigny, O.; Profeta, A.; Rinelli, P.; et al. What, where, and when: Spatial-temporal distribution of macro-litter on the seafloor of the western and central Mediterranean Sea. Environ. Pollut. 2024, 342, 123028. [Google Scholar] [CrossRef]
- Canals, M.; Pham, C.K.; Bergmann, M.; Gutow, L.; Hanke, G.; Van Sebille, E.; Angiolillo, M.; Buhl-Mortensen, L.; Cau, A.; Ioakeimidis, C.; et al. The quest for seafloor macro litter: A critical review of background knowledge, current methods and future prospects. Environ. Res. Lett. 2020, 16, 023001. [Google Scholar] [CrossRef]
- Buhl-Mortensen, L.; Houssa, R.; Weerakoon, W.; Kainge, P.; Olsen, M.N.; Faye, S.; Wagne, M.M.; Thwe, S.M.; Voado, G.C.; Grøsvik, B.E. Litter on the seafloor along the African coast and in the Bay of Bengal based on trawl bycatches from 2011 to 2020. Mar. Pollut. Bull. 2022, 184, 114094. [Google Scholar] [CrossRef]
- Kuroda, M.; Uchida, K.; Tokai, T.; Miyamoto, Y.; Mukai, T.; Imai, K.; Shimizu, K.; Yagi, M.; Yamanaka, Y.; Mituhashi, T. The current state of marine debris on the seafloor in offshore area around Japan. Mar. Pollut. Bull. 2020, 161, 111670. [Google Scholar] [CrossRef]
- Zablotski, Y.; Kraak, S.B.M. Marine litter on the Baltic seafloor collected by the international fish-trawl survey. Mar. Pollut. Bull. 2019, 141, 448–461. [Google Scholar] [CrossRef]
- Barry, P.J.; Silburn, B.; Bakir, A.; Russell, J.; Tidbury, H.J. Seafloor macrolitter as a settling platform for non-native species: A case study from UK waters. Mar. Pollut. Bull. 2024, 204, 116499. [Google Scholar] [CrossRef]
- Pasanisi, E.; Galasso, G.; Panti, C.; Baini, M.; Galli, M.; Giani, D.; Limonta, G.; Tepsich, P.; Delaney, E.; Fossi, M.C.; et al. Monitoring the composition, sources and spatial distribution of seafloor litter in the Adriatic Sea (Mediterranean Sea) through Fishing for Litter initiatives. Environ. Sci. Pollut. Res. 2023, 30, 90858–90874. [Google Scholar] [CrossRef]
- Sciutteri, V.; Pedà, C.; Longo, F.; Calogero, R.; Cangemi, G.; Pagano, L.; Battaglia, P.; Nannini, M.; Romeo, T.; Consoli, P. Integrated approach for marine litter pollution assessment in the southern Tyrrhenian Sea: Information from bottom-trawl fishing and plastic ingestion in deep-sea fish. Mar. Pollut. Bull. 2023, 188, 114661. [Google Scholar] [CrossRef]
- Balcells, M.; Blanco, M.; Colmenero, A.I.; Barría, C.; Santos-Bethencourt, R.; Nos, D.; López-Pérez, C.; Ribera-Altimir, J.; Sala-Coromina, J.; Garriga-Panisello, M.; et al. Fishing for litter, accidental catch in bottom trawl nets along the Catalan coast, Northwestern Mediterranean. Waste Manag. 2023, 166, 360–367. [Google Scholar] [CrossRef]
- Ryan, P.G.; Weideman, E.A.; Perold, V.; Durholtz, D.; Fairweather, T.P. A trawl survey of seafloor macrolitter on the South African continental shelf. Mar. Pollut. Bull. 2020, 150, 110741. [Google Scholar] [CrossRef]
- Mghili, B.; Keznine, M.; Hasni, S.; Aksissou, M. Abundance, composition and sources of benthic marine litter trawled-up in the fishing grounds on the Moroccan Mediterranean coast. Reg. Stud. Mar. Sci. 2023, 63, 103002. [Google Scholar] [CrossRef]
- Šiljeg, A.; Marić, I.; Krekman, S.; Cukrov, N.; Lovrić, M.; Domazetović, F.; Panđa, L.; Bulat, T. Mapping of marine litter on the seafloor using WASSP S3 multibeam echo sounder and Chasing M2 ROV. Front. Earth Sci. 2023, 11, 1133751. [Google Scholar] [CrossRef]
- Consoli, P.; Falautano, M.; Sinopoli, M.; Perzia, P.; Canese, S.; Esposito, V.; Battaglia, P.; Romeo, T.; Andaloro, F.; Galgani, F.; et al. Composition and abundance of benthic marine litter in a coastal area of the central Mediterranean Sea. Mar. Pollut. Bull. 2018, 136, 243–247. [Google Scholar] [CrossRef]
- Costanzo, L.G.; Marletta, G.; Alongi, G. Assessment of Marine Litter in the Coralligenous Habitat of a Marine Protected Area along the Ionian Coast of Sicily (Central Mediterranean). J. Mar. Sci. Eng. 2020, 8, 656. [Google Scholar] [CrossRef]
- Enrichetti, F.; Dominguez-Carrió, C.; Toma, M.; Bavestrello, G.; Canese, S.; Bo, M. Assessment and distribution of seafloor litter on the deep Ligurian continental shelf and shelf break (NW Mediterranean Sea). Mar. Pollut. Bull. 2020, 151, 110872. [Google Scholar] [CrossRef]
- Ioakeimidis, C.; Papatheodorou, G.; Fermeli, G.; Streftaris, N.; Papathanassiou, E. Use of ROV for assessing marine litter on the seafloor of Saronikos Gulf (Greece): A way to fill data gaps and deliver environmental education. SpringerPlus 2015, 4, 463. [Google Scholar] [CrossRef]
- Botero, C.M.; Zielinski, S.; Pereira, C.I.; León, J.A.; Dueñas, L.F.; Puentes, V. The first report of deep-sea litter in the South-Western Caribbean Sea. Mar. Pollut. Bull. 2020, 157, 111327. [Google Scholar] [CrossRef]
- Dominguez-Carrió, C.; Sanchez-Vidal, A.; Estournel, C.; Corbera, G.; Riera, J.L.; Orejas, C.; Canals, M.; Gili, J. Seafloor litter sorting in different domains of Cap de Creus continental shelf and submarine canyon (NW Mediterranean Sea). Mar. Pollut. Bull. 2020, 161, 111744. [Google Scholar] [CrossRef]
- Mecho, A.; Francescangeli, M.; Ercilla, G.; Fanelli, E.; Estrada, F.; Valencia, J.; Sobrino, I.; Danovaro, R.; Company, J.B.; Aguzzi, J. Deep-sea litter in the Gulf of Cadiz (Northeastern Atlantic, Spain). Mar. Pollut. Bull. 2020, 153, 110969. [Google Scholar] [CrossRef]
- Pierdomenico, M.; Casalbore, D.; Chiocci, F.L. The key role of canyons in funnelling litter to the deep sea: A study of the Gioia Canyon (Southern Tyrrhenian Sea). Anthropocene 2020, 30, 100237. [Google Scholar] [CrossRef]
- Korshenko, E.; Zhurbas, V.; Osadchiev, A.; Belyakova, P. Fate of river-borne floating litter during the flooding event in the northeastern part of the Black Sea in October 2018. Mar. Pollut. Bull. 2020, 160, 111678. [Google Scholar] [CrossRef]
- Nguyen, T.T.; Ha, N.; Bui, T.L.; Nguyen, K.L.P.; Tran, D.T.; Nguyen, H.Q.; El-Arini, A.; Schuyler, Q.; Nguyen, T.T.L. Baseline Marine Litter Surveys along Vietnam Coasts Using Citizen Science Approach. Sustainability 2022, 14, 4919. [Google Scholar] [CrossRef]
- Newman, S.; Watkins, E.; Farmer, A.; Brink, P.T.; Schweitzer, J. The Economics of Marine Litter. In Marine Anthropogenic Litter; Bergmann, M., Gutow, L., Klages, M., Eds.; Springer: Cham, Switzerland, 2015; pp. 367–394. [Google Scholar] [CrossRef]
- Mokos, M.; Rokov, T.; Čižmek, I.Z. Monitoring and analysis of marine litter in Vodenjak cove on Iž Island, central Croatian Adriatic Sea. Rend. Lincei. Sci. Fis. Nat. 2020, 31, 905–912. [Google Scholar] [CrossRef]
- Jambeck, J.R.; Geyer, R.; Wilcox, C.; Siegler, T.R.; Perryman, M.; Andrady, A.; Narayan, R.; Law, K.L. Plastic waste inputs from land into the ocean. Science 2015, 347, 768–771. [Google Scholar] [CrossRef]
- McKinsey Center for Business and Environment, Ocean Conservancy. Available online: https://www.greenpeace.org/static/planet4-southeastasia-stateless/2019/04/eae10551-eae10551-full-report-stemming-the.pdf (accessed on 25 October 2024).
- Boonstra, M.; Hougee, M. OSPAR Beach Litter Monitoring in The Netherlands; North Sea Foundation: Utrecht, The Netherlands, 2022. [Google Scholar]
- GESAMP WG 43 Second Interim Report. Sea-Based Sources of Marine Litter—A Review of Current Knowledge and Assessment of Data Gaps; Committee on Fisheries, FAO: Rome, Italy, 2020.
- Deville, A.; Vazquez-Rowe, I.; Ita-Nagy, D.; Kahhat, R. Ocean-based sources of plastic pollution: An overview of the main marine activities in the Peruvian EEZ. Mar. Pollut. Bull. 2023, 189, 114785. [Google Scholar] [CrossRef]
- Jacob, M.; Florido, C. Nautical tourism. In Encyclopedia of Tourism; Jafari, J., Xiao, H., Eds.; Springer: Cham, Switzerland, 2021. [Google Scholar] [CrossRef]
- González, D.A.; Campanales, S.; Grimalt, M. Managing the Environmental Sustainability of Nautical Tourism in Mediterranean MPAs; Capboating Project; eco-union: Barcelona, Spain, 2020. [Google Scholar]
- Andrés, M.; Madariaga, E.; Delgado, O.; Marin, J.E.M. Marine pollution in the nautical seaports in Croatia by the effluent of tourists. Eur. Transp./Trasp. Eur. 2017, 1, 1–11. [Google Scholar]
- Favro, S.; Gržetić, Z. Nautical Tourism—The advantages and effects of development. WIT Trans. Ecol. Environ. 2008, 115, 35–43. [Google Scholar] [CrossRef]
- Carreño, A.; Lloret, J. Environmental impacts of increasing leisure boating activity in Mediterranean coastal waters. Ocean Coast. Manag. 2021, 209, 105693. [Google Scholar] [CrossRef]
- UNEP. Marine Litter, An Analytical Overview; UNEP: Nairobi, Kenya, 2005; 58p. [Google Scholar]
- Sheavly, S.B. Marine Debris—An Overview of a Critical Issue for Our Oceans. In Proceedings of the 6th Meeting of the UN Open-Ended Informal Consultative Processes on Oceans & the Law of the Sea, New York, NY, USA, 6–10 June 2005; 7p. [Google Scholar]
- Carreño, A.; Hardy, P.-Y.; Sánchez, E.; Martínez, E.; Piante, C.; Lloret, J. Safeguarding Marine Protected Areas in the Growing Mediterranean Blue Economy. Recommendations for Leisure Boating; PHAROS4MPAs Project; WIT Press: Southampton, UK, 2019; 52p. [Google Scholar]
- Fortibuoni, T.; Ronchi, F.; Mačić, V.; Mandić, M.; Mazziotti, C.; Peterlin, M.; Prevenios, M.; Prvan, M.; Somarakis, S.; Tutman, P.; et al. A harmonized and coordinated assessment of the abundance and composition of seafloor litter in the Adriatic-Ionian macroregion (Mediterranean Sea). Mar. Pollut. Bull. 2019, 139, 412–426. [Google Scholar] [CrossRef]
- Cincinelli, A.; Martellini, T.; Guerranti, C.; Scopetani, C.; Chelazzi, D.; Giarrizzo, T. A potpourri of microplastics in the sea surface and water column of the Mediterranean Sea. TrAC Trends Anal. Chem. 2019, 110, 321–326. [Google Scholar] [CrossRef]
- Stagličić, N.; Varezić, D.B.; Mrčelić, J.K.; Pavičić, M.; Tutman, P. Marine litter on the shallow seafloor at Natura 2000 sites of the Central Eastern Adriatic Sea. Mar. Pollut. Bull. 2021, 168, 112432. [Google Scholar] [CrossRef]
- Mutlu, E.; Özvarol, Y.; Şahin, A.; Duman, G.S.; Karaca, D. Macro litter distribution of the Turkish Mediterranean coasts dominated by pleasure crafts. Mar. Pollut. Bull. 2020, 151, 110833. [Google Scholar] [CrossRef]
- Kovačić, M.; Silveira, L. Nautical Tourism in Croatia and in Portugal in the Late 2010’s. Issues and Perspectives. Pomorstvo 2018, 32, 281–289. [Google Scholar] [CrossRef]
- Venturini, S.; Massa, F.; Castellano, M.; Fanciulli, G.; Povero, P. Recreational boating in the Portofino Marine Protected Area (MPA), Italy: Characterization and analysis in the last decade (2006–2016) and some considerations on management. Mar. Policy 2021, 127, 103178. [Google Scholar] [CrossRef]
- Payeras, M.; Jacob, M.; Garcia, M.A.; Alemany, M.; Alcover, A.; Martínez-Ribes, L. The yachting charter tourism SWOT: A basic analysis to design marketing strategies. Tourismos 2011, 6, 111–134. [Google Scholar]
- Spinelli, R.; Benevolo, C. Towards a new body of marine tourism research: A scoping literature review of nautical tourism. J. Outdoor Recreat. Tour. 2022, 40, 100569. [Google Scholar] [CrossRef]
- Gómez, A.G.; Balaguer, P.; Fernández-Mora, À.; Tintoré, J. Mapping the nautical carrying capacity of anchoring areas of the Balearic Islands’ coast. Mar. Policy 2023, 155, 105775. [Google Scholar] [CrossRef]
- Gannier, A.J.; Boyer, G.; Gannier, A.C. Recreational boating as a potential stressor of coastal striped dolphins in the northwestern Mediterranean Sea. Mar. Pollut. Bull. 2022, 185, 114222. [Google Scholar] [CrossRef]
- European Boating Industry (EBI). Facts and Figures. Available online: https://www.europeanboatingindustry.eu/about-the-industry/facts-and-figures (accessed on 28 October 2024).
- Croatian Bureau of Statistics. Nautical Tourism—Capacity and Turnover of Ports; TUR-2023-2-1; Croatian Bureau of Statistics: Zagreb, Croatia, 2023; ISSN 1334-0557.
- MSFD. Directive 2008/56/EC of the European Parliament and of the Council of 17 June 2008 establishing a framework for community action in the field of marine environmental policy (Marine Strategy Framework Directive). Off. J. Eur. Union 2008, L164, 19–40. [Google Scholar]
- Marine Waste Management Plan; Ministry of Economy and Sustainable Development: Tbilisi, Georgia, 2020.
- EC (European Commission). MSFD Technical Subgroup on Marine Litter. Guidance on Monitoring of Marine Litter in European Seas: A Guidance Document Within the Common Implementation Strategy for the Marine Strategy Framework Directive; JRC Scientific and Policy Reports; Joint Research Centre Institute for Environment and Sustainability: Ispra, Italy, 2013. [Google Scholar]
- Urban-Malinga, B.; Wodzinowski, T.; Witalis, B.; Zalewski, M.; Radtke, K.; Grygiel, W. Marine litter on the seafloor of the southern Baltic. Mar. Pollut. Bull. 2018, 127, 612–617. [Google Scholar] [CrossRef]
- Buhl-Mortensen, L.; Buhl-Mortensen, P. Marine litter in the Nordic Seas: Distribution, composition and abundance. Mar. Pollut. Bull. 2017, 125, 260–270. [Google Scholar] [CrossRef]

Disclaimer/Publisher’s Note: The statements, opinions and data contained in all publications are solely those of the individual author(s) and contributor(s) and not of MDPI and/or the editor(s). MDPI and/or the editor(s) disclaim responsibility for any injury to people or property resulting from any ideas, methods, instructions or products referred to in the content. |
© 2025 by the authors. Licensee MDPI, Basel, Switzerland. This article is an open access article distributed under the terms and conditions of the Creative Commons Attribution (CC BY) license (https://creativecommons.org/licenses/by/4.0/).