1. Introduction
Water-exit phenomena occupy an important position in fluid mechanics and ocean engineering research, with extensive engineering applications in aerospace, naval architecture, underwater vehicles, and other fields. As a typical multiphase cross-media problem, water-exit phenomena occur not only in nature, such as marine animals leaping out of water and birds catching prey, but also widely in engineering applications, including underwater unmanned vehicles, ship bulbous bows, and ocean platforms [
1,
2]. During the water-exit process, due to the interaction between the body surface and the gas–liquid interface, complex flow phenomena such as cavitation, vortices, and gas–liquid separation occur, which significantly impact the pressure distribution, drag, and exit attitude of the body [
3,
4].
In contrast to the comprehensive body of literature on water entry phenomena, investigations into water-exit dynamics remain comparatively limited. Von Karman [
5] first conducted theoretical analysis on the water impact problem of seaplanes, pioneering the study of water-exit problems. In recent years, with the widespread application of cross-media equipment, research on water-exit has increased, mainly focusing on theoretical research, numerical simulation, and experimental studies.
Regarding theoretical investigations, Korobkin et al. (2017) [
6] elucidated the theoretical foundations of rigid-flat-plate water-exit phenomena, demonstrating that when such a plate interfaces with a horizontal water surface and undergoes constant acceleration in the vertical direction, the resultant flow field in proximity to the plate edges exhibits both non-linear behavior and self-similar characteristics. Shams et al. (2017) [
7] established a semi-analytical model to estimate the hydrodynamic loads in the wedge water elastic impact from entry to exit phases. Nevertheless, theoretical analyses remain predominantly confined to fundamental scenarios, with substantial challenges persisting in the theoretical treatment of complex phenomena including splashing mechanics, free-surface disruption, and vortex shedding dynamics during water-exit events.
In terms of numerical simulation, Johan (2011) [
8] introduced the weakly compressible smoothed particle hydrodynamics (WCSPH) method by integrating a floating object model to study fluid–object interactions. While the method shows promising capabilities for predicting hydrodynamic forces and object movement, its limitations include computational intensity, minor pressure fluctuations, particle discretization challenges affecting jet formation accuracy, and occasional asymmetry in the numerical solutions at lower resolutions. Moshari et al. (2014) [
9] implemented the Volume of Fluid (VOF) methodology to numerically characterize non-linear free-surface deformations during the water-exit trajectory of a neutrally buoyant circular cylinder. Ni et al. (2015) [
10] used the boundary element method to simulate the entire water-exit process of a fully submerged rigid body, investigating the effect of the Froude number and the body shape on its horizontal and vertical dimension ratio. Hao et al. (2019) [
11] used the lattice Boltzmann method to conduct a three-dimensional numerical study of sphere water-exit with different vertical velocities. Zhang et al. (2022) [
12] and Guo et al. (2023) [
13] employed VOF multiphase flow interface-capturing technology and the overset mesh technique to numerically calculate gas–liquid multiphase flow interactions during high-speed cylinder water-exit. Although numerical simulation can obtain more comprehensive flow field information, accurately capturing large free-surface deformations and gas–liquid interface breaking still remains significant challenges.
Experimental studies have contributed significantly to our understanding of water-exit phenomena, providing intuitive and reliable data despite challenges in implementation. Wu et al. (2017) [
14] developed specialized equipment to investigate free-surface deformation during the water-exit of both partially and fully submerged spheres. Their subsequent work [
15] on lightweight sphere water-exit and re-entry identified that upward-directed jets form due to local high-pressure regions created when water converges into vacancies above the exiting body. However, their experimental setup was limited by relatively small test tanks that may have introduced wall effects, and their pressure measurement system lacked the temporal resolution needed to fully capture rapid transient phenomena during cavity collapse. Lu et al. (2019) [
16] expanded this understanding by examining mutual interference effects between multiple underwater revolving bodies during simultaneous water-exit, revealing how cavity evolution from leading bodies influences trailing bodies’ trajectories. Yet, their research was constrained to specific launch configurations and did not explore the full parameter space of timing intervals and spatial separations relevant to operational scenarios. Zhang et al. (2021) [
17] demonstrated how brash ice significantly alters cavity evolution patterns and hydrodynamic loads during axisymmetric vehicle water-exit, with ice causing more severe trajectory deflection than in open water, though their modeling of brash ice using polypropylene simplified the complex mechanical properties of actual sea ice and limited the applicability of their findings to real-world conditions. Most recently, Yun et al. (2024) [
3] utilized novel experimental methods to systematically analyze cylinder water-exit processes, quantifying how emission parameters affect force coefficients and establishing that initial velocity directly influences force variations while increased submergence depth introduces greater uncertainty in the exit moment. Their work, while methodologically sound, was conducted at laboratory scale with simplified geometries that may not fully represent the complex interaction between actual vehicle geometries and free-surface dynamics during operational water-exit scenarios.
Reviewing existing research, water-exit studies have mainly focused on basic geometric shapes such as spheres and simple cylinders, with relatively fewer studies on the water-exit characteristics of complex geometric shapes (such as different head shapes and length-to-diameter ratios of slender bodies). Furthermore, existing research mainly focuses on macroscopic phenomena such as waterfall breaking, exit height, and trajectory, with limited research on cavity formation and evolution mechanisms, material property influences, and other mechanisms during water-exit. Based on the equipment [
16], this work systematically studied the water-exit behavior of slender bodies in 13 cases under different conditions. The effects of ejection velocity, head shape, length-to-diameter ratio, and material elastic moduli on water-exit characteristics were first analyzed, revealing their interaction mechanisms. Then, the fluid–structure coupling effects during the elastic material slender body water-exit process were further studied, providing theoretical guidance for vehicle structure design. The remainder of this paper is organized as follows: In
Section 2, the experimental setup and cylinder models are introduced. In
Section 3, the details of the experimental results are listed and discussed. Concluding remarks are given in
Section 4.
3. Experimental Results and Discussion
This section systematically analyzes the experimental results of slender body water-exit under different conditions based on experimental observations, focusing on the influence of different ejection velocities, head shapes, length-to-diameter ratios, and elastic moduli on water-exit behavior. Through the quantitative analysis of displacement, velocity changes, cavity morphology evolution, and structural deformation, the dynamic characteristics and physical mechanisms of the object during water-exit are revealed. Experimental image data were processed and analyzed using ImageJ2 software.
3.1. Characteristics of Slender Body Water-Exit with Different Ejection Velocities
In adjusting the storage tank pressure, the ejection velocity of the slender body can be regulated accordingly. This subsection uses the conical-headed slender body as the research subject, and systematic experiments were conducted at three different pressure values (0.2, 0.4, and 0.7 MPa), with experimental conditions for the three cases shown in
Table 3. The cavitation number σ is defined as
, where
is the far-field pressure (
),
is the liquid saturated vapor pressure at 20 °C, i.e.,
,
is the liquid density, and
is the flow velocity. Lower cavitation numbers indicate more pronounced cavitation phenomena.
3.1.1. Analysis of Cavity Evolution Mechanism During Water-Exit Process
Figure 3 presents sequential high-speed photographic imagery depicting the complete water-exit process of a conical-headed cylindrical specimen at an ejection velocity of
. Cavity evolution during slender body water-exit can be categorized into four distinct phases—formation, development, stabilization, and collapse—each corresponding to specific fluid dynamic mechanisms. In reality, the slender body rarely maintains a perfectly vertical trajectory due to the interplay between the rubber sealing cover and high-pressure gas dynamics. For each case, we conducted three sets of experiments, selecting the one with the minimum deflection as the final experimental result. The repeatability of the experiment is confirmed in
Figure 4, which shows the error bar chart of the water-exit angle for Cases 1–3, indicating that the deviation in the water-exit angle is within 5%.
When time ranges from 0 to 3 ms, the cavitation evolution is in the formation stage. At t = 3 ms, initial shoulder cavitation forms after the slender body exits the tube. Due to the high-speed relative motion between the head shape and the fluid, a local low-pressure area forms at the slender body’s shoulder, triggering cavitation when the pressure falls below the liquid saturated vapor pressure. A small amount of high-pressure gas can be observed escaping from the gap between the launch tube and the slender body, causing turbulence at the cavity edge. The cavity formation mechanism in this stage conforms to classical boundary layer separation theory—the fluid cannot remain attached to the body surface, separates at the shoulder, forming a low-pressure region, and subsequently induces cavitation.
When time ranges from 12 to 33 ms, the cavitation evolution is in the cavity development stage. The slender body continues to rise, and the cavity develops downward along the body surface, forming a closed supercavity. At t = 23 ms, the escaping high-pressure gas forms a characteristic inverted funnel-shaped cavity at the launch tube exit under the combined action of gas pressure and water pressure, resulting from the interaction between high-speed jets and the surrounding water. During this stage, the cavity volume continuously increases, the internal pressure remains low, and the boundaries are clear. The fluid static pressure gradient leads to streamlined cavity boundaries.
When time ranges from 33 to 60.6 ms, the cavitation evolution undergoes two distinct phases: the cavity development stage and the cavity stability stage. As the slender body continues to rise, two key phenomena can be observed: first, return flow liquid appears inside the cavity due to the pressure gradient at the interface between the cavity bottom and the slender body, causing local fluid to move upward; second, partial gas detachment forms turbulent regions, creating a gas–liquid mixed state inside the cavity. At t = 53 ms, the return flow effect is further enhanced, and gas detachment occurs in both the cavity and the slender body bottom cavity.
When time ranges from 60.6 to 88 ms, the cavitation evolution progresses through three distinct phases: the cavity development stage, the cavity stability stage, and the cavity collapse stage. When the slender body top contacts the water surface (t = 60.6 ms), the free-surface static pressure drops sharply, and the cavity begins to collapse irregularly. The right side of the cavity boundary shows significant inward concavity, indicating a local high-pressure region. Simultaneously, gas clusters detached from the cavity accumulate at the bottom cavity position, while gas clusters detached from the bottom cavity appear in the slender body wake with a lag effect. At t = 73 ms, the slender body partially exits the water, the cavity completely collapses, forming multiple irregular gas–liquid mixing regions. Subsequently, the bottom cavity contracts and forms an upward rebound flow that impacts the slender body bottom, causing a sudden velocity increase, consistent with the “pop-up effect” observed by Truscott et al. [
18].
3.1.2. Velocity Evolution Characteristics and Dynamic Analysis
Figure 5 shows the velocity evolution curves of the slender body during water-exit at three different ejection velocities (
,
,
). The experimental data clearly show that the slender body water-exit consistently experiences a four-stage velocity evolution pattern, i.e., acceleration stage, deceleration stage, second acceleration stage and second deceleration stage. This phenomenon can be explained with a multi-stage dynamic model.
At the initial acceleration stage, the slender body accelerates from a stationary state under the action of high-pressure gas, subject to the combined effect of thrust, buoyancy, gravity, and drag.
At the deceleration stage, after completely exiting from the tube, the thrust disappears, and the slender body decelerates under the action of buoyancy, drag, and gravity. The dynamic equation simplifies to
where
is the slender body mass,
is the velocity,
is time, and
is buoyancy.
refers to the initial stage’s high-pressure gas thrust, which decreases exponentially with gas pressure.
indicates drag force, which is inversely proportional to the square of velocity, expressed as
, where
is the drag coefficient,
is the fluid density, and
is the cross-sectional area.
At the secondary acceleration stage, when the slender body contacts the water surface, the velocity curve shows a significant jump, which also occurs in Chen’s experiments on the water-exit process of nails [
19]. Likewise, the velocity jump can be attributed to the decrease in the drag force
caused by the water and the impact force
of the cavity collapse on the bottom of the slender body [
18]. The impact force
can be expressed as
where
is the fluid density,
is the impact area, and
is the rebound jet velocity. This impact force acts on the bottom of the slender body, providing additional short-term thrust, causing acceleration.
At the final deceleration stage, after completely exiting from the water, the slender body moves in air, decelerating under the influence of gravity and air resistance .
Through quantitative analysis of the velocity curves during the deceleration stage, we calculated the drag coefficients
for different conditions, as shown in
Table 4.
The relationship between drag coefficient
and cavitation number
was analyzed using the experimental data obtained from Cases 1–3. A power-law regression analysis of the experimental data yielded the relationship
with a high coefficient of determination (R
2 = 0.943). This relationship was compared with the classical Logvinovich model [
20], which predicts
, where
is a coefficient dependent on the body shape. The comparison confirms that a power-law relationship indeed exists between drag coefficient and cavitation number, validating the reliability of our experimental results. However, the exponent obtained from our experiments (0.4135) is notably lower than the theoretical prediction (0.5) from the Logvinovich model. This discrepancy can be attributed to several factors: the optimized geometry of the conical head, which creates a more streamlined cavity structure and reduces flow separation, the larger experimental tank used in our study, which minimizes wall effects compared to earlier studies and the higher accuracy of modern measurement techniques employed in this study. The lower exponent indicates that our conical-headed slender body achieves better drag reduction performance than predicted by classical theory. This finding has significant implications for the design of high-speed underwater vehicles, suggesting that further optimization of head geometry could yield additional improvements in water-exit performance beyond what traditional models predict.
3.1.3. Analysis of Cavity Morphology and Cavitation Mechanisms
Figure 6 shows the experimental images of conical-headed slender body water-exit at three different ejection velocities. It can be clearly observed that as velocity increases, cavity characteristics change significantly, which is directly related to the reduction in cavitation number.
In Case 1 (7.24 m/s), the cavity is relatively small and unstable, mainly distributed near the shoulder of the slender body, showing local cavitation phenomena. At this moment, the cavitation number σ = 3.775, which is much higher than the critical cavitation number (approximately 0.1), indicating that the flow field is dominated by partial cavitation. As the ejection velocity increases to 13.04 m/s (Case 2), the cavitation number drops to 1.164, forming a supercavity covering most of the slender body surface. When the velocity further increases to 17.93 m/s (Case 3), the cavitation number drops to 0.616, producing a larger supercavity completely enveloping the slender body, with both cavity length and diameter significantly increased. Based on Falvey’s research [
21], cavitation is virtually inevitable when σ < 0.1. In the experiments, the cavity size is obviously increasing as the cavitation number decreases and supercavitation occurs when σ = 0.616 in Case 3. The cavitation number σ when cavitation occurs is larger than in Falvey’s research, which is due to the remaining air entering the water from the tube.
Figure 7 and
Figure 8 provide quantitative characterization of cavity length and diameter evolution under the three experimental conditions investigated. The figures indicate that cavity size has a non-linear positive correlation with ejection velocity. At
, the maximum cavity length reaches 8.13 D (D is the diameter of the slender body), and the maximum diameter is about 1.99 D, while at
, these are only 5.98 D and 2.02 D, respectively.
At the same time, cavity morphology stability also exhibits significant velocity-dependent characteristics: at lower velocity (), the cavity boundary is smooth and regular; at medium velocity (), small-scale fluctuations begin to appear; at higher velocity (), obvious irregular morphology and boundary pulsation are present.
A series of phenomena illuminate the complex fluid dynamic mechanisms governing the water-exit process. Particularly noteworthy is that during t = 40–50 ms, although the cavity is relatively stable in the length direction, obvious pulsation characteristics in the cavity diameter direction were observed during the experiment. From the perspective of theoretical analysis, this pulsation can be attributed to the pressure fluctuation effect described in Rayleigh–Plesset’s [
22] cavity dynamics theory—when fluid pressure decreases, cavity volume increases; when fluid pressure increases, cavity volume decreases. Meanwhile, local instabilities on the cavity surface also lead to the formation and shedding of small-scale vortex structures, further enhancing the pulsating behavior of the cavity.
Above all, ejection velocity modulates cavity characteristics during slender body water-exit through its direct influence on the cavitation number. With the increasing velocity, the cavity dimensions increase accordingly and dynamic characteristics develop in a direction favorable for drag reduction. However, the stability of cavity deteriorates, leading to irregular breakage and gas–liquid mixing, which poses challenges for stability control in practical engineering applications.
The velocity-dependent characteristic has important guiding significance for optimizing water-exit conditions and improving water-exit stability.
3.2. Characteristics of Slender Body Water-Exit with Different Head Shapes
To systematically study the influence of head shape on slender body water-exit characteristics, four typical head shapes (conical, spherical, short truncated cone, and long truncated cone) were designed, with the geometric dimensions shown in
Figure 2. The experimental conditions are shown in
Table 5. In controlling the same ejection pressure (0.7 MPa), the initial kinetic energy basically remained consistent.
Figure 9 shows the velocity evolution curves of four slender bodies with different head shapes under the same pressure (0.7 MPa) during the water-exit process. It indicates that the deceleration trends are basically consistent for all head shapes, but there are significant differences in drag coefficients (
Table 6). The results directly reflect differences in the drag reduction performance of different head shapes, with the conical head having the lowest drag coefficient.
From the perspective of fluid dynamic principles, the drag reduction performance was influenced by head shapes through two mechanisms, i.e., streamline degree [
23,
24] and cavitation induction capability [
25]. The former determines the fluid separation point position and separated flow intensity. The latter affects the initiation conditions and stability of cavity formation. The conical head, with its gradual geometric profile, allows fluid to separate with minimal disturbance, while its sharp leading edge effectively induces cavitation, thus demonstrating the best drag reduction characteristics. The spherical head, although overall smooth, has greater curvature at its vertex, causing earlier fluid separation, resulting in the second-best drag reduction effect. The truncated cone heads, with blunter leading edges, move the fluid separation point forward and increase separated flow intensity, producing greater drag.
Figure 10 shows experimental images of slender bodies with different head shapes during water-exit, clearly demonstrating the profound influence of head shape on cavity morphology. The conical- and spherical-headed slender bodies formed complete and relatively stable supercavities with clear boundaries and continuous gas phase inside, while the long truncated cone and short truncated cone heads exhibited cavity collapse phenomena, with the rigid body surrounded by irregular gas–liquid mixtures. This difference can be explained through cavitation initiation theory [
26]. The fluid separation characteristics of conical and spherical heads create low-pressure regions near the separation points. When the local pressure drops below the saturated vapor pressure, stable cavitation is triggered. Due to geometric discontinuities, the truncated cone heads cause more violent but irregular fluid separation, forming unstable cavities prone to breakage.
Particularly noteworthy is that the cavity induced by the conical head is most uniform, exhibiting typical cigar-shaped supercavity characteristics, highly consistent with the morphology predicted by potential flow theory [
19]. The cavity formed by the spherical head is slightly ellipsoidal, with the maximum diameter position further back. By contrast, the two truncated cone heads produce more irregular cavities, accompanied by obvious collapse and regeneration phenomena. This difference originates from the different influence patterns of the head shape curvature distribution on separated fluid—the linear changing curvature distribution of the conical head produces relatively consistent fluid separation conditions, while the discontinuous curvature of the truncated cone heads creates locally unstable regions in the flow field.
3.3. Characteristics of Slender Body Water-Exit with Different Length-to-Diameter Ratios
To systematically study the influence of the length-to-diameter ratio on slender body water-exit characteristics, slender bodies with long truncated cone heads with length-to-diameter ratios of 7:1, 6:1, and 5:1 were selected to explore the impact of geometric proportion changes on water-exit dynamic characteristics. The experimental conditions for each case are shown in
Table 7.
Figure 11 shows the experimental images of long truncated cone slender bodies with three length-to-diameter ratios (7:1, 6:1, 5:1) during water-exit. Cavity formation can be observed in all conditions. Due to differences in slender body geometric dimensions, the cavity coverage areas show clear distinctions. As the length-to-diameter ratio decreases, the proportion of the slender body covered by cavities increases. In comparing the slender bodies with a 5:1 and 7:1 length-to-diameter ratio, the former is almost completely surrounded by cavities, while the latter has only about 60% of its surface area covered by cavities.
Figure 12 shows the velocity evolution curves of three slender bodies with different length-to-diameter ratios (5:1, 6:1, 7:1) during water-exit. The overall trends are basically consistent, with drag coefficients
during a deceleration of 0.27, 0.27, and 0.18, respectively, indicating that larger length-to-diameter ratios are beneficial for drag reduction. The drag performance in this paper is consistent with the experimental results in Ref. [
27], which revealed that the increase in length-to-diameter ratios and a long truncated cone would cause better drag reduction.
From the perspective of fluid dynamics, the length-to-diameter ratio influences drag reduction performance through two mechanisms, i.e., the ratio of frontal area to wetted surface area and the tail flow separation characteristics. As the length-to-diameter ratio increases, the ratio of frontal area to wetted surface area decreases, increasing the proportion of friction drag in the total drag while decreasing the proportion of pressure drag. Considering that friction drag is typically less than pressure drag, the overall drag coefficient therefore decreases. At the same time, slender bodies with larger length-to-diameter ratios have more gradual tail contraction angles, moving the fluid separation point backward, reducing the wake region size, and thereby lowering pressure drag.
Comprehensive analysis shows that the larger length-to-diameter ratio (7:1) demonstrates clear advantages in drag reduction characteristics and cavity dynamics. This finding has important guiding significance for underwater vehicle and cross-media equipment design. However, the increase in the length-to-diameter ratio also brings limitations in structural strength, internal space utilization, and other aspects, so optimized design considering multiple factors is needed in engineering practice.
3.4. Characteristics of Slender Body Water-Exit with Different Elastic Moduli
During the slender body water-exit process, the interaction between structure and fluid may cause obvious deformation. In the aforementioned conditions, slender bodies made of high-toughness resin can be considered rigid bodies, with no significant deformation observed. However, in practical engineering, fluid–structure coupling effects may cause bending, vibration, or even structural failure. To observe the influence of material elastic properties on water-exit behavior, slender bodies with different elastic moduli were designed for experiments, with experimental conditions shown in
Table 8.
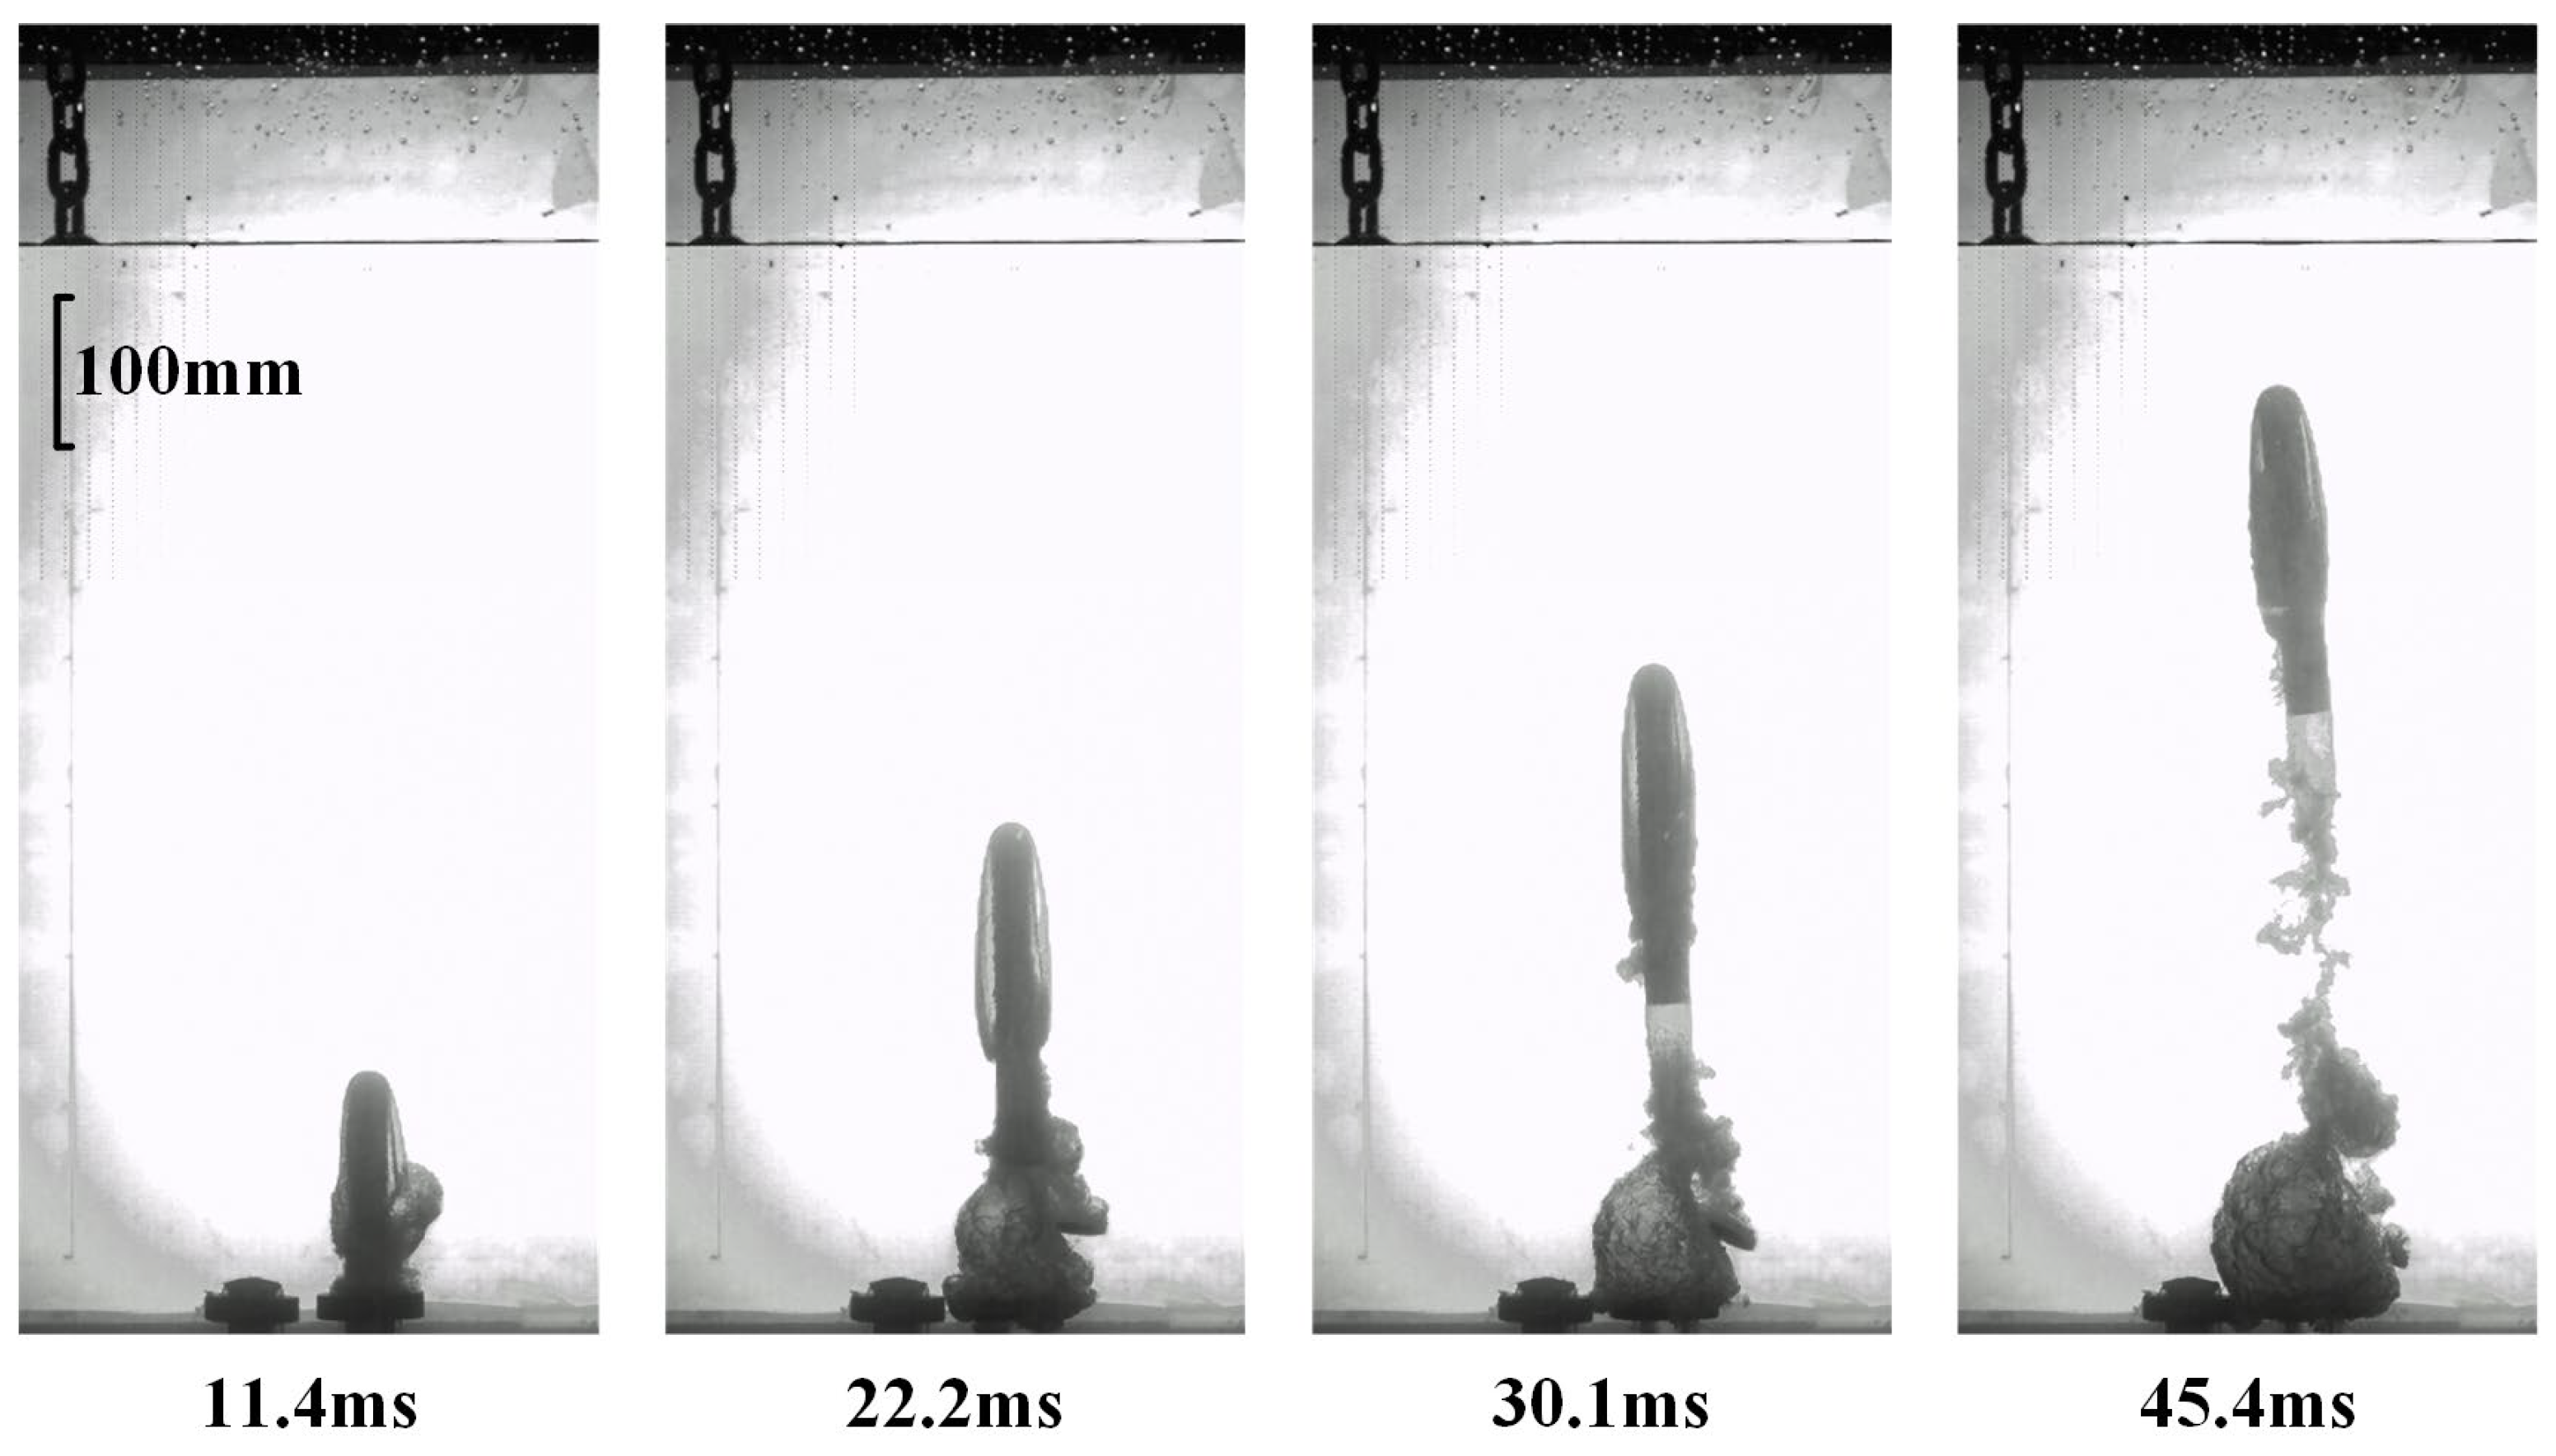
Figure 13 shows the water-exit process of the spherical-headed slender body with the lowest elastic moduli (227.36 MPa). At t = 12.6 ms, the slender body is partially out of the tube, and significant bending can be observed at the head, with a bending angle of approximately 15°. At the moment of tube exit, the static fluid in front of the slender body is compressed. The impact force in the opposite direction of the movement on the moving slender body causes the head bend due to lateral shear force. As the slender body continues to rise (t = 20 ms, 27.2 ms), due to the rightward bending of the head, the subsequent motion trajectory deviates toward the bending direction, and the deformation is further exacerbated. At t = 36.6 ms, the slender body’s bending angle exceeds 90°, the projectile head orientation begins to point downward, and the slender body’s movement direction turns downward, unable to exit from the water successfully.
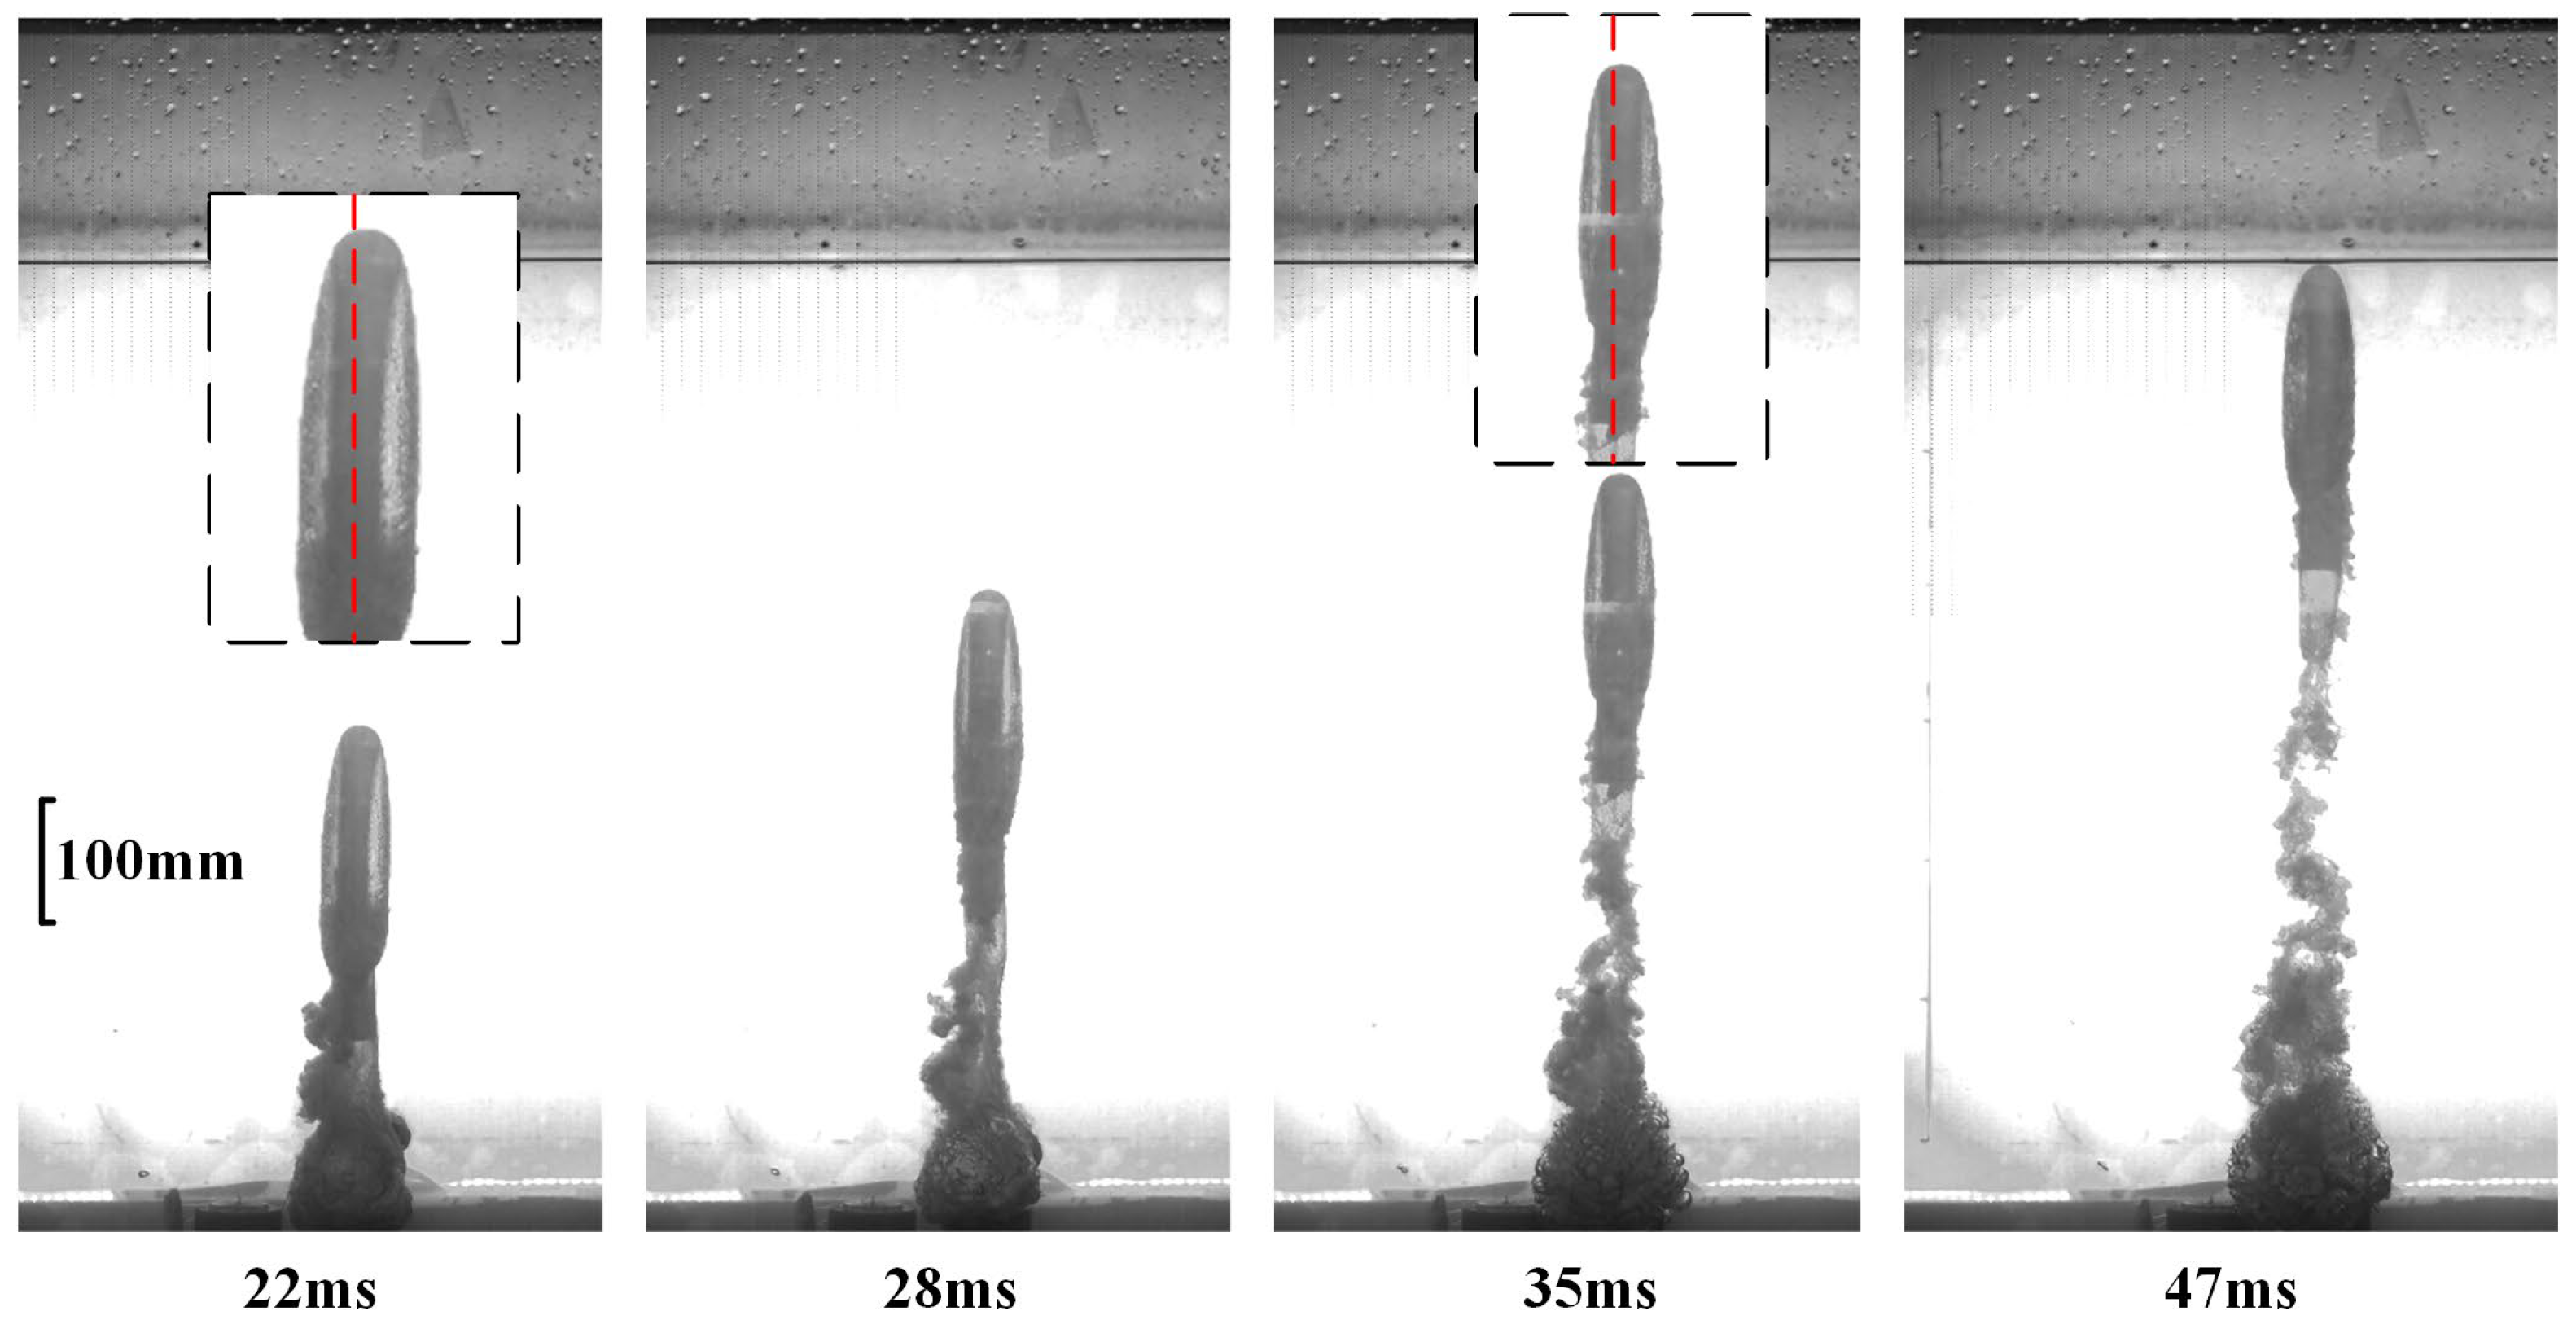
Figure 14 shows the water-exit process of the spherical-headed slender body with medium elastic moduli (253.02 MPa). Similarly to Case 11, at t = 22 ms, the head bends to the right under fluid action, but due to the increased elastic moduli, the degree of bending is reduced, with an angle of about 3°. As the movement continues (t = 50 ms), the degree of bending increases, and the trajectory deviates in the bending direction. At t = 28 ms, the head begins to straighten, guiding the slender body toward the water surface. At t = 35 ms, the head maintains a vertical upward orientation, while the tail bending decreases to about 5°, showing a recovery trend. At t = 47 ms, the slender body completely returns to a vertical state and continues to guide the upward movement.
Figure 15 shows the water-exit process of the spherical-headed slender body with the highest elastic moduli (279.14 MPa). Due to the increased stiffness, no obvious bending deformation is observed throughout the entire water-exit process, and its motion characteristics are similar to those of the rigid slender bodies described earlier, maintaining a stable upward trajectory.
In comparing the water-exit behavior of slender bodies with three different elastic moduli, a significant influence of material properties on water-exit stability can be clearly observed. The slender body with an elastic modulus of 227.36 MPa undergoes severe deformation under fluid impact, leading to trajectory deviation and ultimately failing to exit from the water. By contrast, the slender body with an elastic modulus of 253.02 MPa also initially produces deformation but can partially recover and complete the water-exit process, exhibiting relatively complex oscillation behavior. Furthermore, the slender body with an elastic modulus of 279.14 MPa shows almost no deformation, maintaining a stable trajectory.
From the perspective of structural dynamics, the deformation modes of the slender body are closely related to its natural frequencies and damping characteristics. Materials with lower elastic moduli not only have larger initial deformations but also weaker shape recovery capabilities, easily producing sustained deformation under fluid dynamic loads, while materials with higher elastic moduli have stronger shape maintenance ability, capable of resisting deformation caused by fluid impact.
In addition, deformation directly affects the flow field around the slender body and cavity morphology. In Case 11, due to the severe bending of the slender body, the cavity morphology is highly irregular, making it difficult to form a stable closed cavity, while in Cases 12 and 13, the cavity morphology is relatively regular and fully developed, similar to the cavity characteristics of rigid slender bodies.
In summary, material elastic properties have a critical influence on slender body water-exit behavior. In practical applications, it is necessary to select materials with appropriate stiffness according to the water-exit speed and conditions, ensuring that the structure can both resist fluid impact and maintain necessary buffering capability.
4. Conclusions
This experimental investigation systematically examined the water-exit dynamics of slender cylindrical bodies, revealing the complex interplay between ejection velocity, head geometry, length-to-diameter ratio, and material elastic modulus. Ejection velocity emerged as the dominant parameter, with velocity increases from 7.24 to 17.93 m/s resulting in 36% longer cavities and 54% reduced drag coefficients. Head geometry significantly influenced performance, with conical heads achieving 41% lower drag than truncated cone designs through optimized flow separation and enhanced cavity stability. Additionally, increasing the length-to-diameter ratio from 5:1 to 7:1 reduced drag coefficients by 33% through improved frontal area-to-wetted surface ratios.
Material elasticity proved critical for water-exit stability, with a threshold elastic modulus of approximately 253 MPa identified. Bodies with moduli below 227 MPa experienced severe deformation exceeding 90°, preventing successful water-exit, while those above 279 MPa maintained stable trajectories with minimal deformation (<3°). All specimens exhibited characteristic four-stage velocity evolution: initial acceleration, deceleration, secondary acceleration from cavity collapse, and final deceleration. These findings provide quantitative guidance for underwater vehicle design, though limitations include Reynolds number constraints (2.2 × 10⁵–5.5 × 10⁵) and measurement uncertainties (±0.5 mm displacement, ±0.2 m/s velocity).
Future research should employ coupled SPH (smoothed particle hydrodynamics) and FVM (fluid volume method) simulations to explore fluid–structure interaction mechanisms, implement PIV (Particle Image Velocimetry) measurements for comprehensive flow field characterization, and investigate active flow control techniques for performance enhancement. Scaling studies across broader parameter ranges would establish comprehensive design guidelines for diverse engineering applications. These results provide a robust experimental foundation for optimizing underwater launch systems and cross-media vehicles, offering critical insights for material selection, geometric design, and operational parameter optimization.


