Article

Marine Mammal Call Classification Using a Multi-Scale Two-Channel Fusion Network (MT-Resformer)

1
College of Oceanography and Space Information, China University of Petroleum (East China), Guzhenkou Campus, Qingdao 266000, China
2
Key Laboratory of Marine Environmental Survey Technology and Application, Guangzhou 510300, China
3
South China Sea Marine Survey Center, Ministry of Natural Resources, Guangzhou 510300, China
4
Chimelong Group Co., Guangzhou 511430, China
*
Authors to whom correspondence should be addressed.
J. Mar. Sci. Eng. 2025, 13(5), 944; https://doi.org/10.3390/jmse13050944
Submission received: 8 March 2025 / Revised: 11 April 2025 / Accepted: 16 April 2025 / Published: 13 May 2025
(This article belongs to the Section Marine Biology)

Abstract

:
The classification of high-frequency marine mammal vocalizations often faces challenges due to the limitations of acoustic features, which are sensitive to mid-to-low frequencies but offer low resolution in high-frequency ranges. Additionally, single-channel networks can restrict overall classification performance. To tackle these challenges, we introduce MT-Resformer, an innovative dual-channel model with a multi-scale framework designed for classifying marine mammal vocalizations. Our approach introduces a feature fusion strategy that combines the constant-Q spectrogram with Mel filter-based spectrogram features, effectively overcoming the low resolution of Mel spectrograms in high frequencies. The MT-Resformer model incorporates two key components: a multi-scale parallel residual network (MResNet) and a Transformer network channel. The model employs a multi-level neural perceptron (MLP) to dynamically regulate the weighting of the two channels, enabling flexible feature fusion. Experimental findings validate the proposed approach, yielding classification accuracies of 99.17% on the Watkins dataset and 95.22% on the ChangLong dataset. These results emphasize its outstanding performance.

1. Introduction

The growing intensity of human activity poses a significant threat to marine biodiversity [1]. To date, the analysis and conservation of marine mammal species remain prominent topics in marine research [2]. Studying their vocalizations is one of the most effective approaches to understanding their habitats and population interactions [3]. However, many existing studies rely on commonly used audio features such as MFCC and Log-Mel, which are more sensitive to mid-to-low frequencies but suffer from low resolution in the high-frequency range. Moreover, the use of single-channel networks imposes limitations on overall performance. Therefore, improving feature representation in the high-frequency range and enhancing network performance are of great importance for marine mammal vocalization analysis.
While the majority of marine mammal vocalization research has concentrated on interspecies discrimination, few studies have examined intraspecific call variations. Developing models capable of both species-level classification and fine-grained call type analysis within species is crucial for advancing our understanding of vocalization–behavior–emotion correlations in marine mammals.
Research on the classification of marine mammal vocalizations primarily focuses on two aspects: feature extraction and classification model design. Commonly used feature extraction methods in this field include zero-crossing rate [4], autocorrelation coefficients [5], time-domain envelope [6], Mel spectrogram [7], Mel-frequency cepstral coefficients (MFCCs) [8], gammatone frequency cepstral coefficients (GFCCs) [9], logarithmic Mel spectrogram (Log-Mel) [10], short-time Fourier transform (STFT) [11], and wavelet packet transform (WPT) [12]. Frequently employed classification models include decision trees [13], support vector machines (SVMs) [14], Gaussian mixture models (GMMs) [15], long short-term memory networks (LSTMs) [16], hidden Markov models (HMMs) [17], convolutional neural networks (CNNs) [18,19], residual neural networks (ResNets) [20], and Transformer models [21].
Numerous studies have shown that frequency-domain features generally perform better than time-domain ones in acoustic signal detection and classification [22]. This phenomenon is supported by intriguing evidence from biological evolution. In the human cochlea, evolved to process external sounds, the auditory system primarily interprets sound through its intensity and frequency, corresponding to power and pitch. Frequency-domain spectrograms inherently encapsulate this information. Harvey Fletcher’s work on equal-loudness contours and critical band theory showed that the link between critical bands and sound frequencies is nonlinear, aiding in the simplification of spectrogram representations. By applying matrix operations on spectrograms with nonlinear Mel filter banks, the Mel spectrogram—a common acoustic feature—was derived. Mel spectrograms have gained extensive application in fields like speech recognition and audio classification due to their ability to mimic human auditory sensitivity to mid-to-low frequencies, yielding impressive results. However, in the task of classifying marine mammal vocalizations, many species produce calls concentrated in the high-frequency range. Using conventional Mel spectrograms as features can lead to limitations in overall performance due to their inadequate resolution in the high-frequency domain.
Deep learning methods have demonstrated remarkable performance across various fields and are widely applied to the study of marine mammal vocalizations. Duan et al. proposed the use of convolutional neural networks (CNNs) for the classification of frame-spectrogram data from three species of marine mammals [23]. Luo et al. utilized CNNs to achieve the automated monitoring of echolocation clicks from toothed whales, demonstrating excellent stability and accuracy [24]. Lu et al. introduced an AlexNet-based approach for marine mammal monitoring tasks leveraging transfer learning, achieving high accuracy across three categories [19]. Murphy et al. developed a ResNet-based method for classifying vocalizations from up to 32 species of marine mammals, achieving commendable accuracy [20]. Additionally, Maldini et al. employed Transformer networks for monitoring endangered marine mammals, yielding promising results [21].
Deep learning methods have shown excellent performance in the task of classifying marine mammal species, and also perform well in the more fine-grained analysis of vocalizations within the same species. The use of spectrograms and recordings, combined with manual visual and auditory inspection, is an approach to studying dolphin vocalization types [25], while deep learning methods can improve the effectiveness and efficiency of such research. David Scaradozzi [26] and colleagues achieved good results in detecting dolphin whistles using a binary convolutional neural network (CNN). Guilherme Frainer and his research team used CNN and ResNet networks to detect the whistles of endangered dolphins, achieving an accuracy of 89.5% under conditions with a high signal-to-noise ratio [27]. Frants Havmand Jensen and his team used MobileNetV2 to classify signature whistles of bottlenose dolphins, achieving an accuracy of 95.8% [28].
This study investigates the unique characteristics of marine mammal vocalizations, which span a wide frequency range, including low, medium, and high frequencies. Species such as dolphins exhibit abundant acoustic information in the high-frequency range, which conventional Mel spectrograms struggle to capture effectively due to their limited high-frequency resolution. To address this limitation, we propose a novel feature extraction approach that combines Mel spectrograms, known for their sensitivity to low and medium frequencies, with constant-Q spectrograms, which perform better in the high-frequency range. Additionally, we introduce MT-Resformer, an innovative multi-scale dual-channel network designed to integrate local detail and global contextual relationships within cetacean acoustic signals. The architecture comprises two complementary channels: the MResNet channel, which excels at extracting localized features, and the Transformer channel, which captures global temporal dependencies and long-range relationships through attention mechanisms. While the MResNet channel focuses on fine-grained local details, it lacks the capacity to model global temporal patterns, a gap effectively addressed by the Transformer channel. By adaptively fusing the strengths of these two channels, MT-Resformer delivers a comprehensive representation of marine mammal vocalizations. Experimental evaluations demonstrate that this approach significantly enhances classification performance, achieving notable improvements in both single-species and multi-species vocalization classification tasks. The main contributions of our study are summarized as follows:
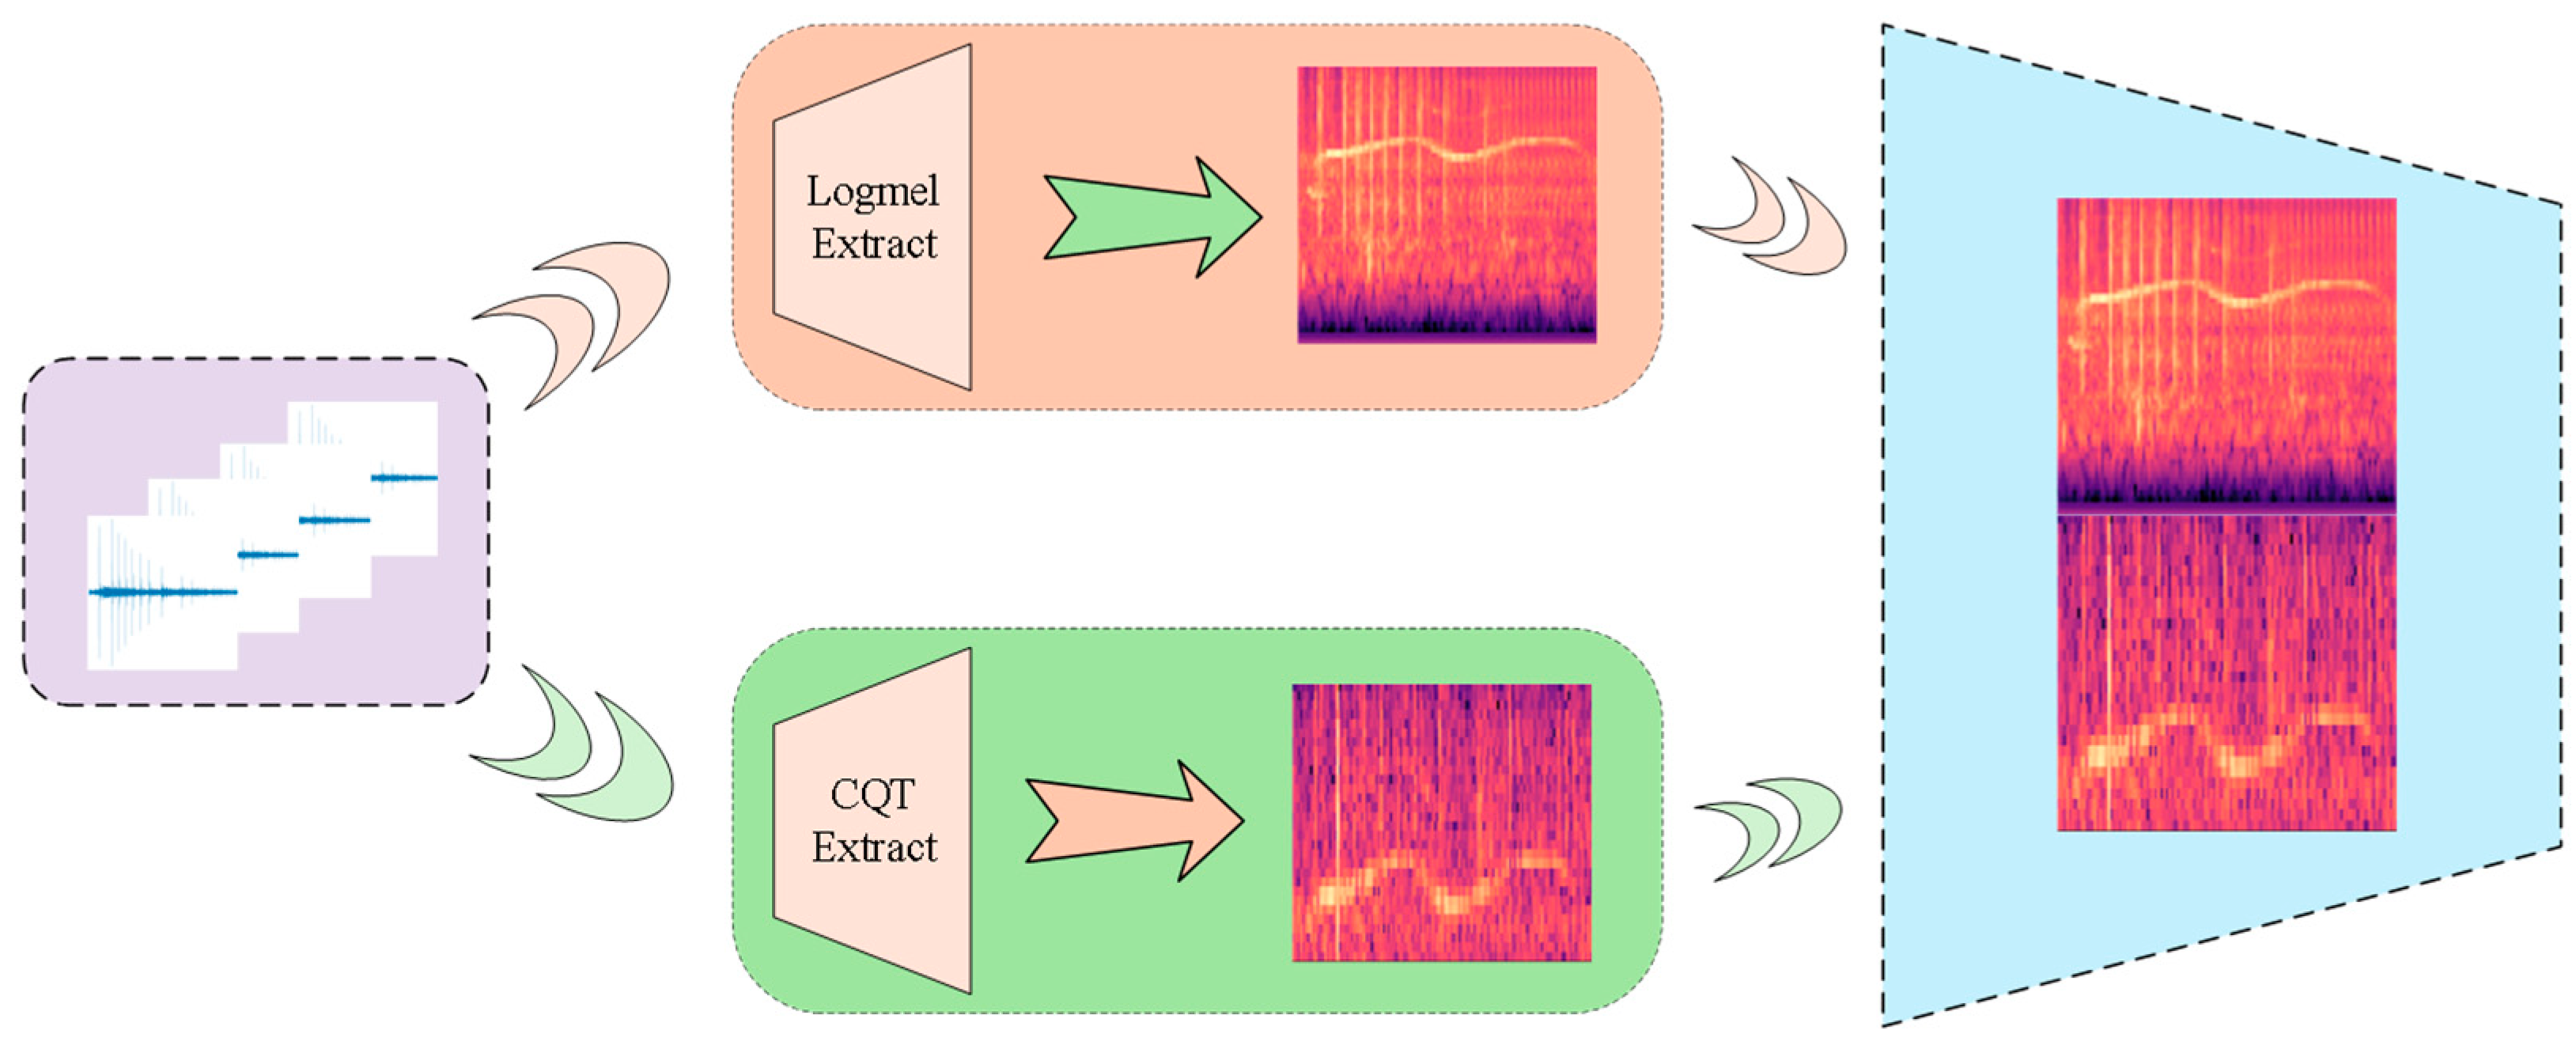
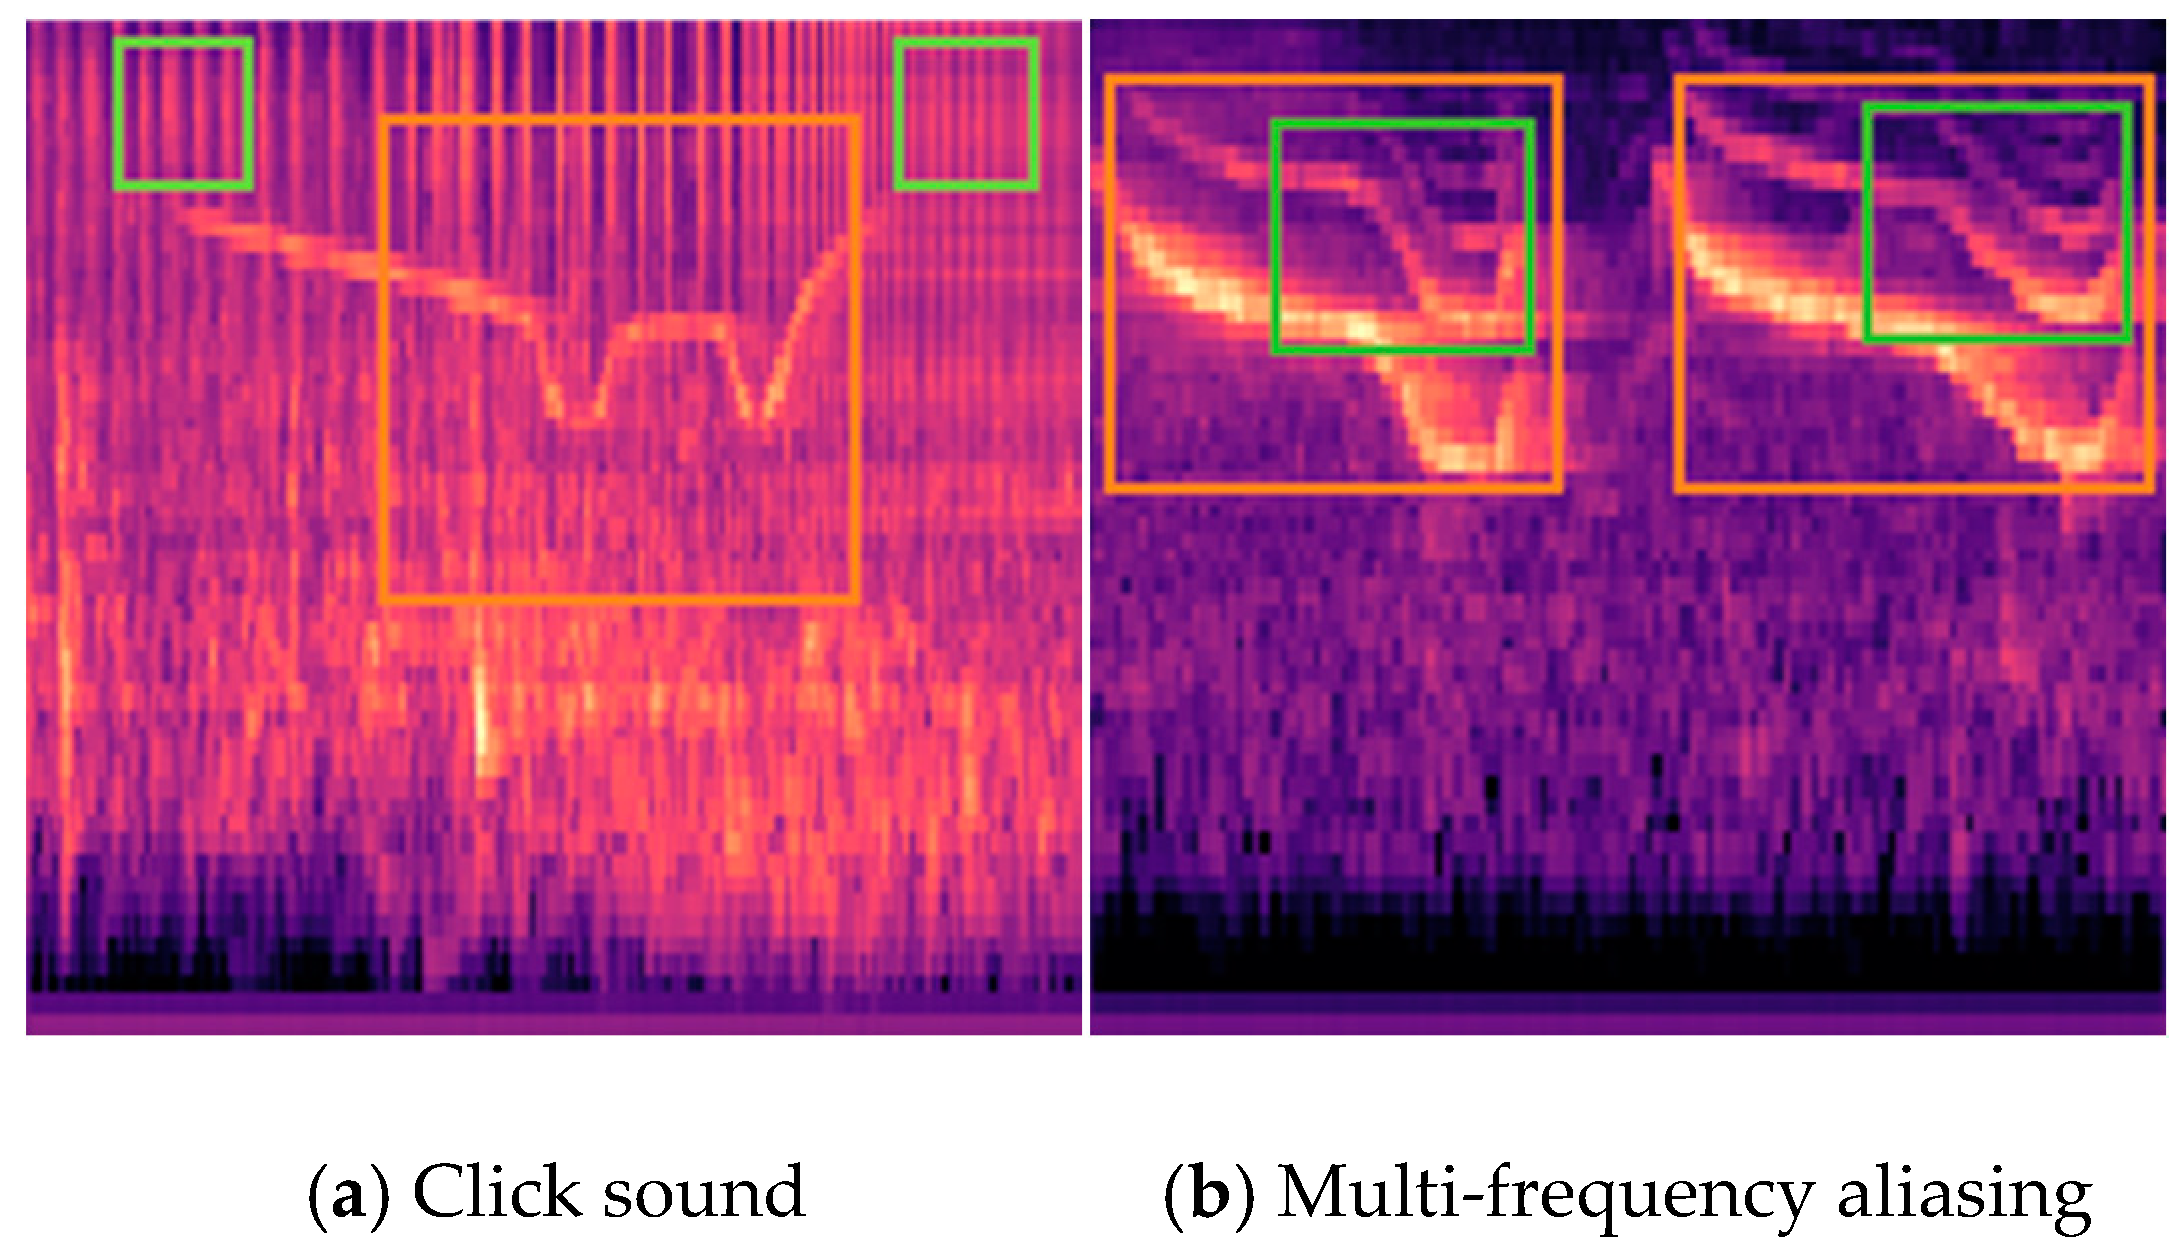
  • In the feature extraction process, this study combines Mel features with Constant-Q Transform (CQT) features, effectively addressing the limitations of single Mel features in capturing high-frequency information of marine mammal calls.
  • The ResNet architecture is further enhanced by incorporating a multi-scale parallel computation structure and integrating it with a Transformer network in a dual-channel design. This improves the model’s accuracy, adaptability, and robustness in classifying various marine mammal vocalizations.
The structure of the paper is outlined below: Section 2 presents a detailed explanation of the proposed methodology, covering feature extraction and fusion processes, as well as the design of the MT-Resformer model. Section 3 introduces the Watkins and Changlong datasets utilized in this study. Section 4 provides an in-depth analysis of the experimental results, while Section 5 wraps up the paper, presenting the key findings and their implications.

2. Materials and Methods

We first introduce our system, followed by an analysis of its two key components: the construction and integration of a multi-scale parallel computation architecture and a dual-channel model.

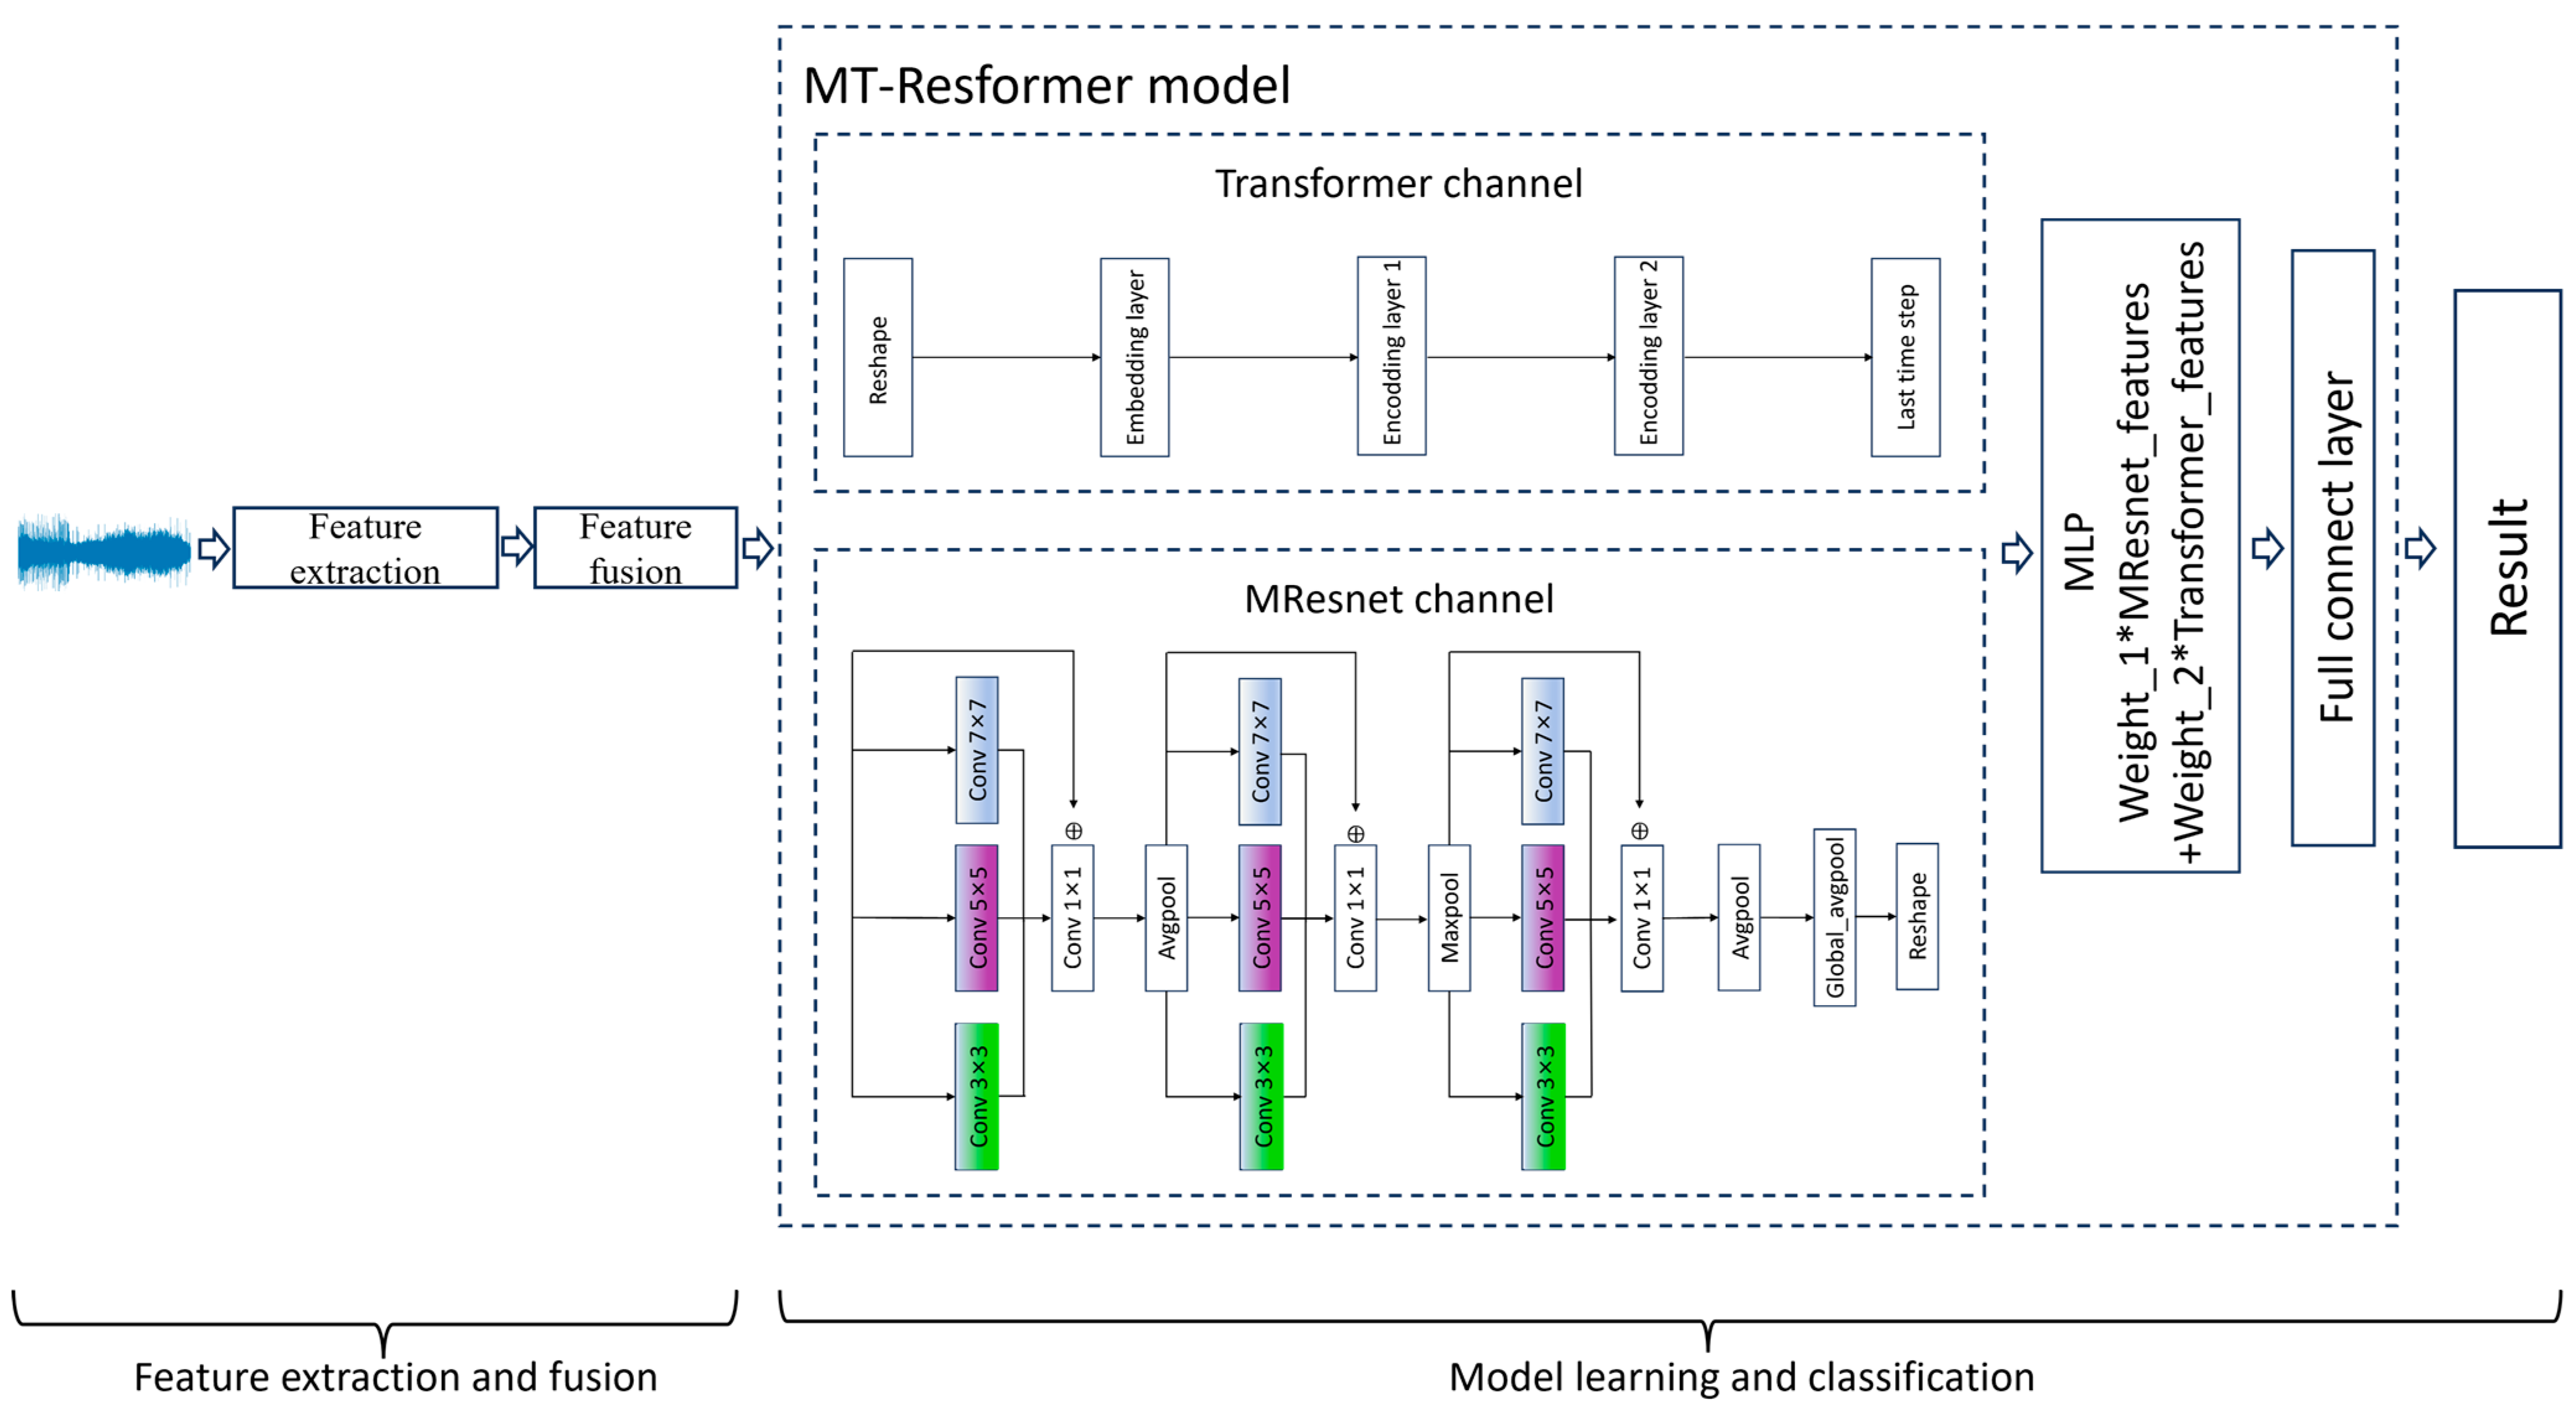
2.1. System Overview

This study utilizes the Watkins and Changlong datasets, with Figure 1 providing a concise overview of the proposed method as applied to these two datasets. Our system’s process consists of three main stages:
  • Data pre-processing: The long audio recordings captured by the audio acquisition devices were segmented into 2 s intervals. Silent segments were removed using a silence detection algorithm, and the audio clips were organized into separate folders based on their respective categories.
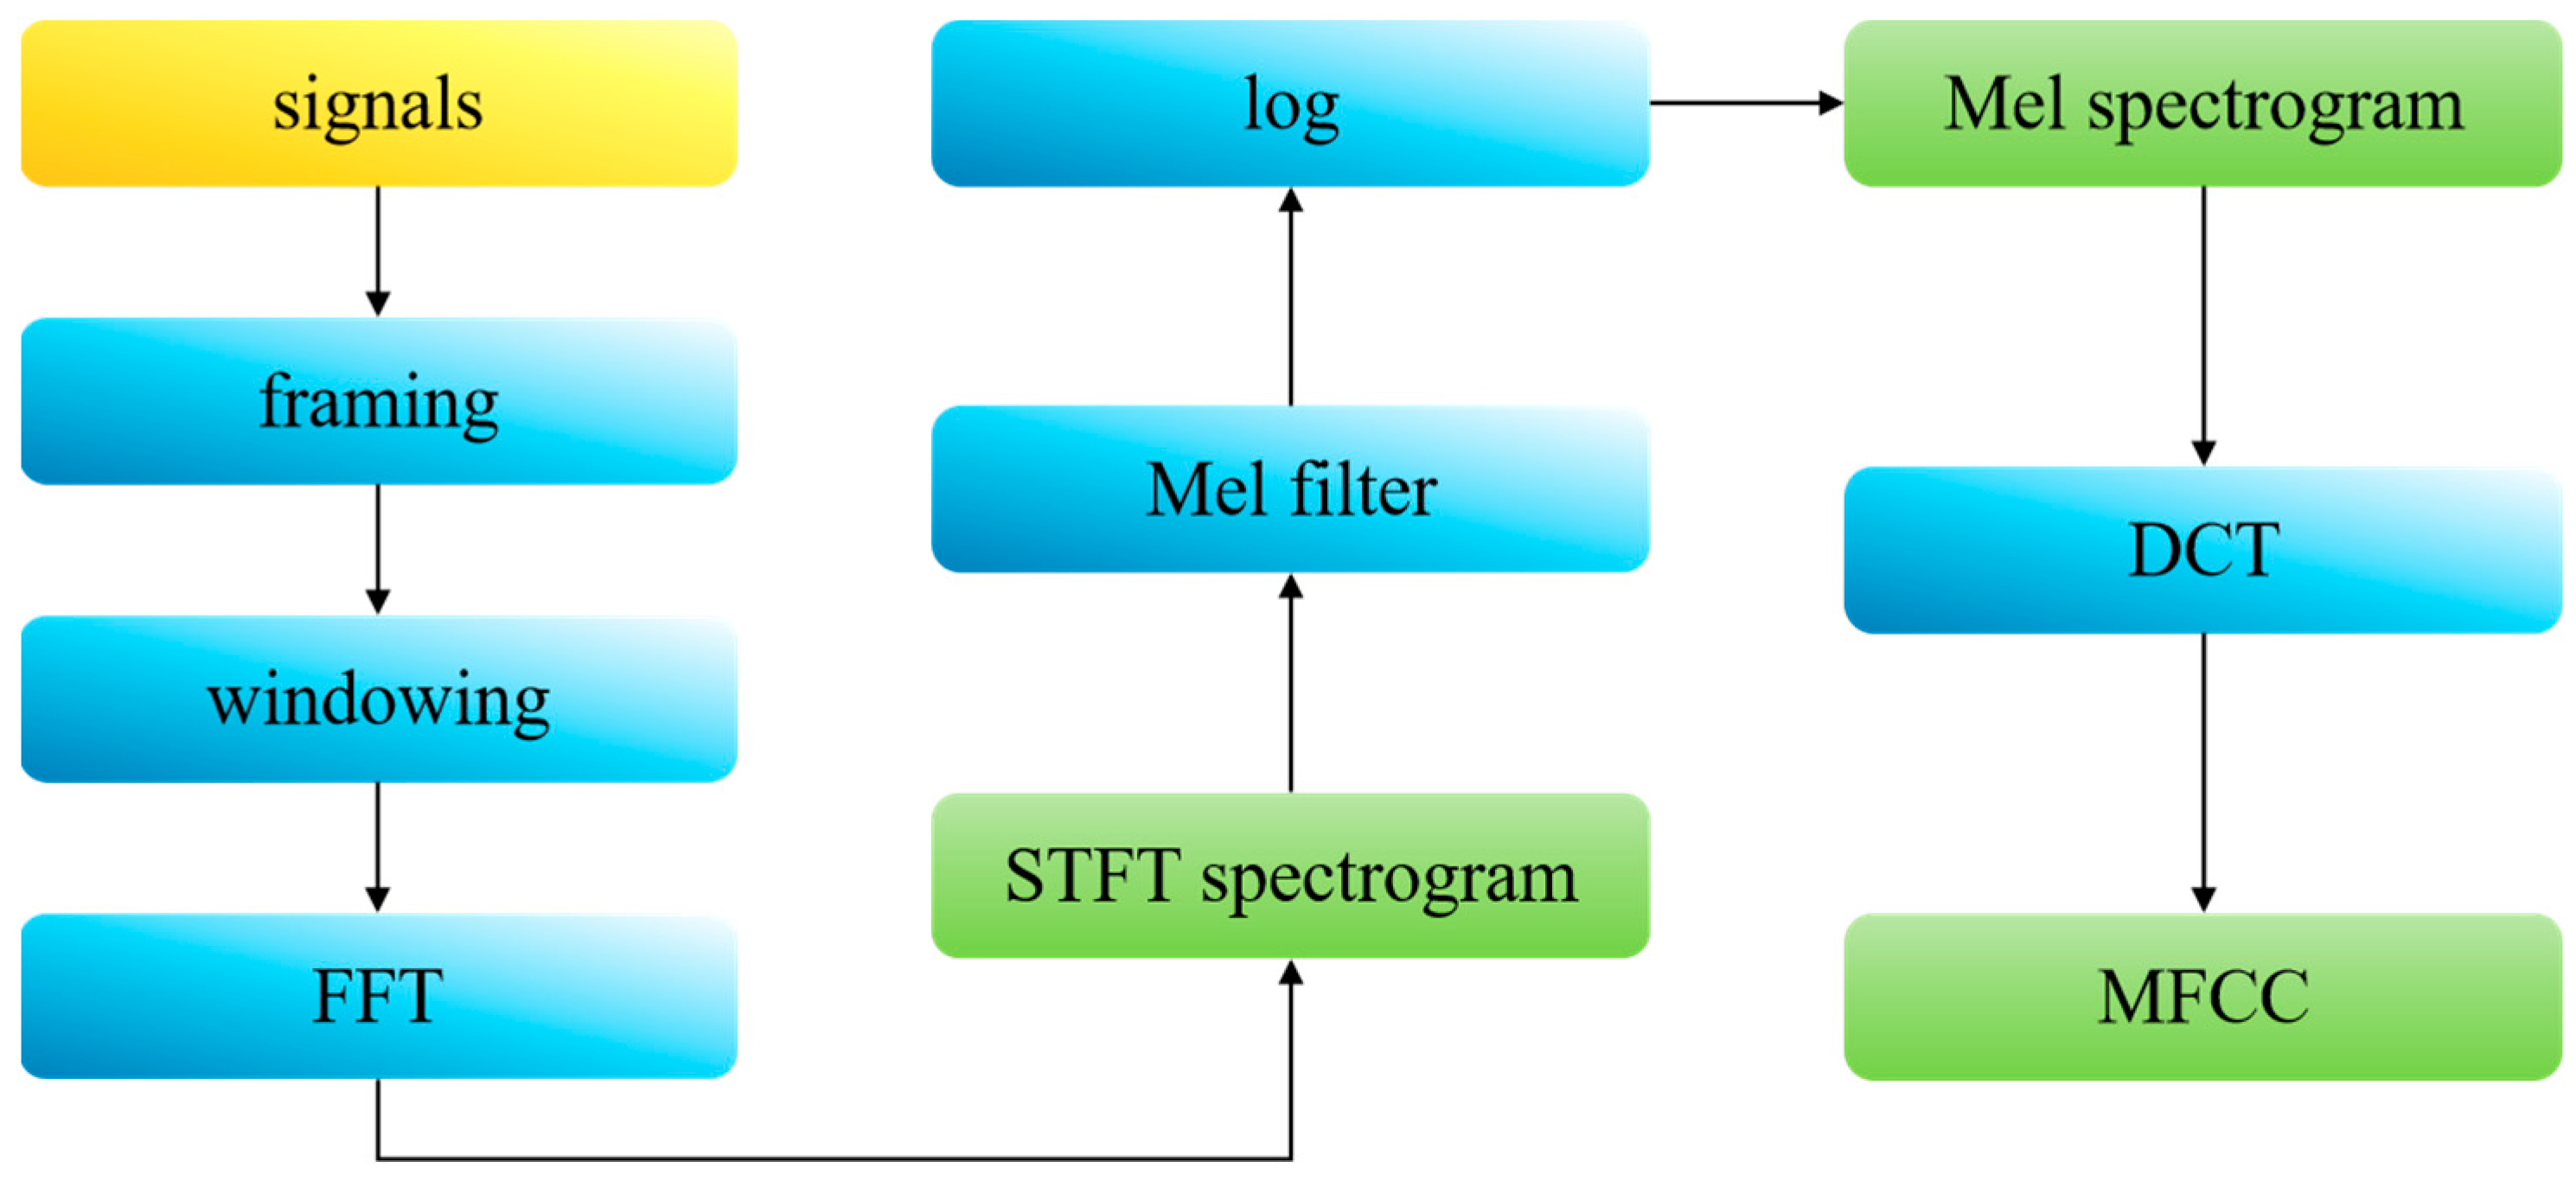
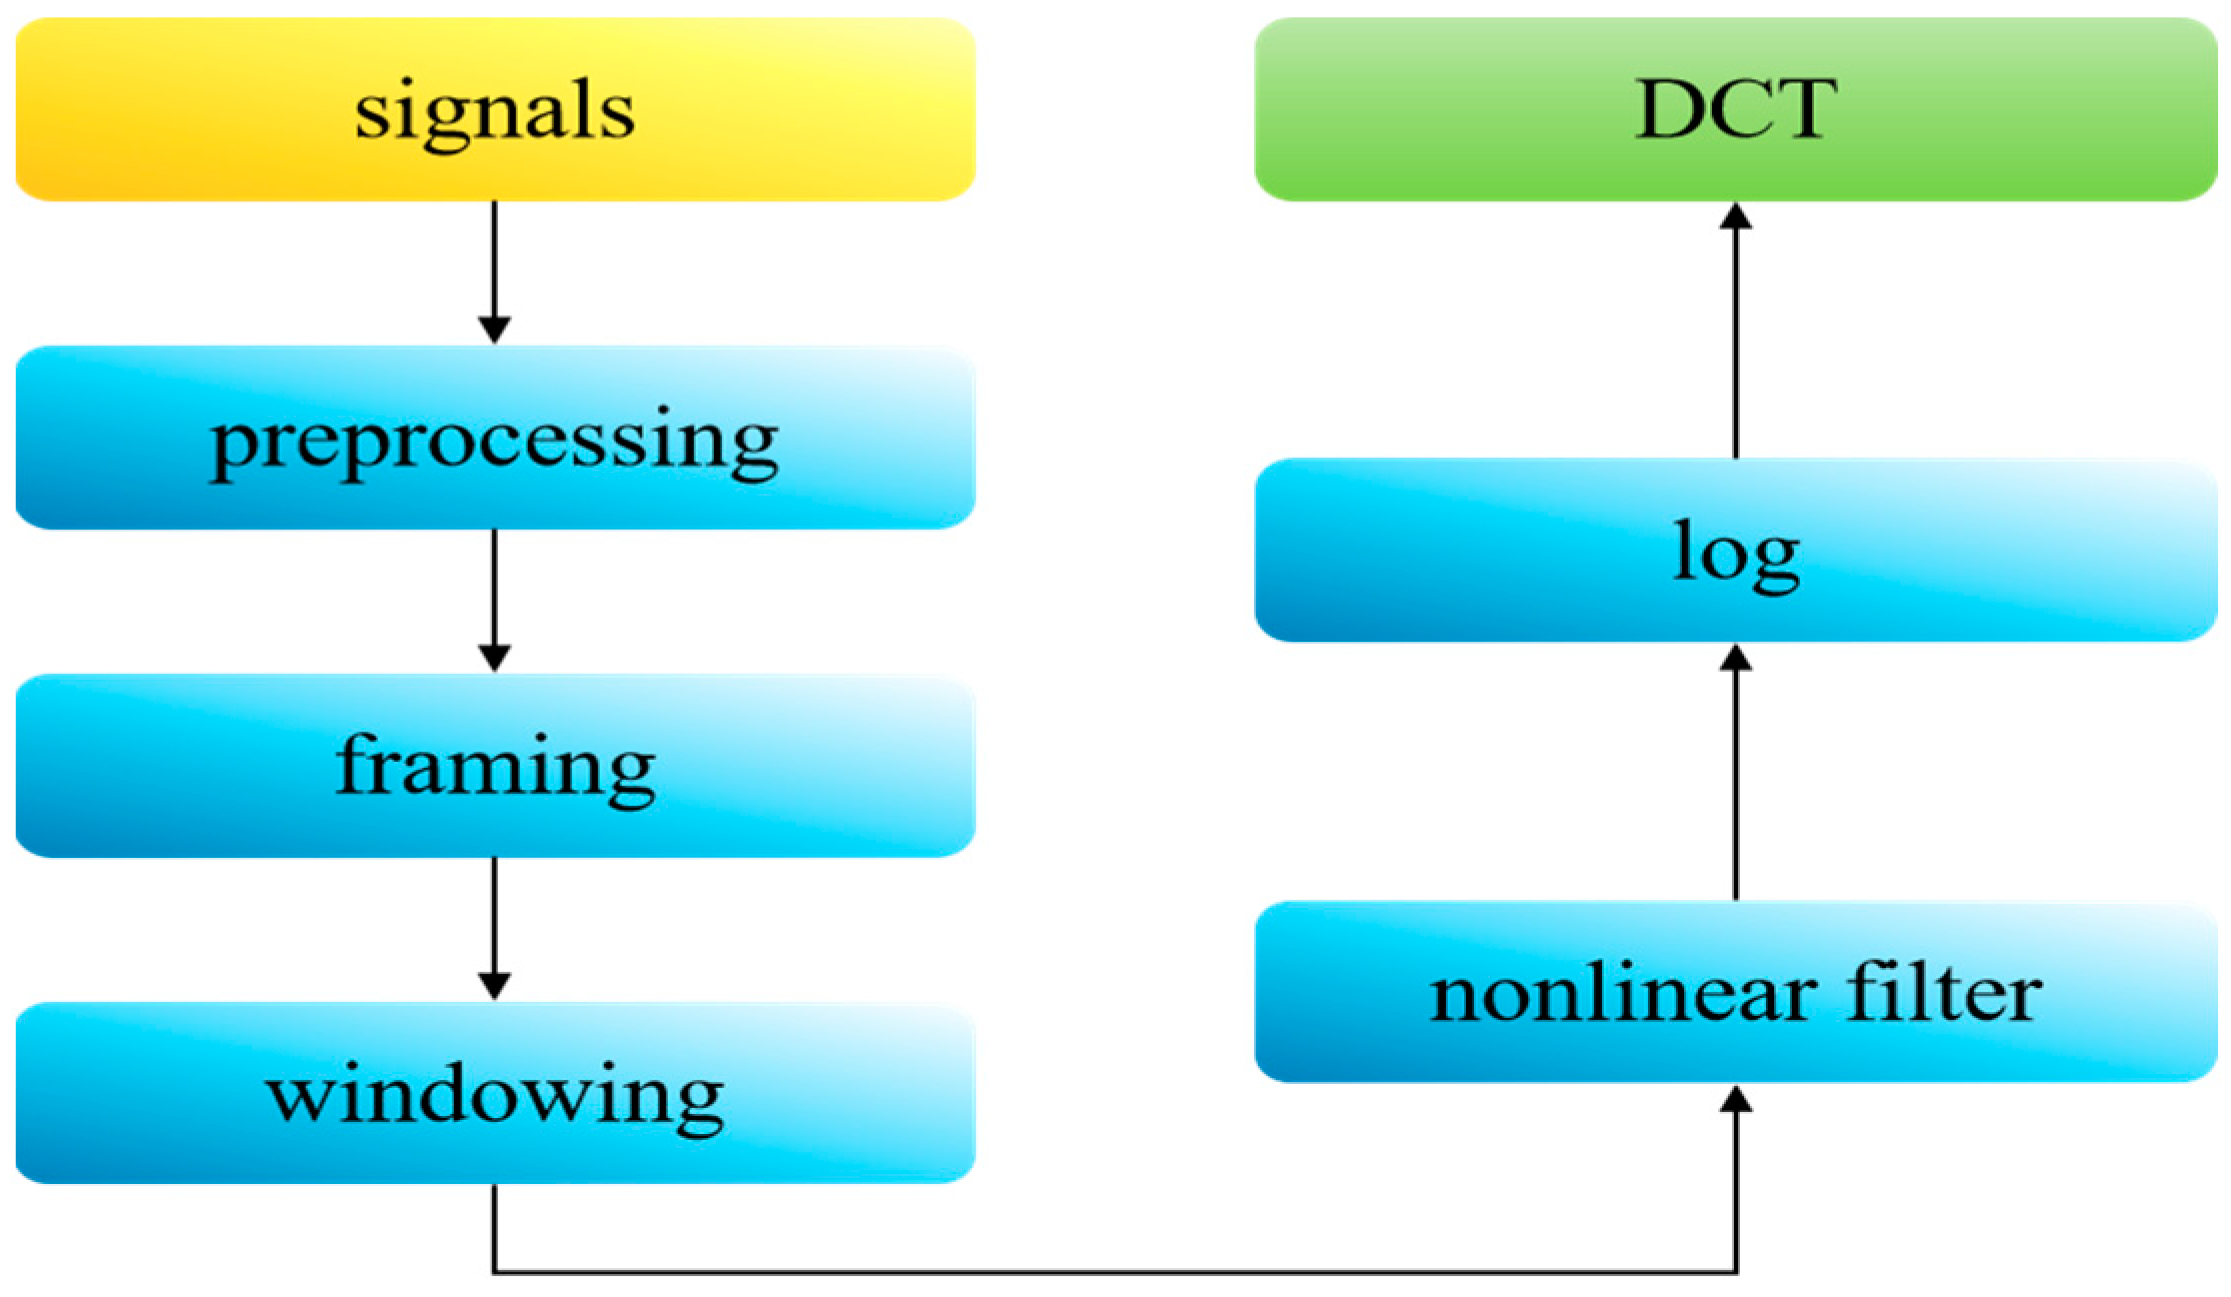
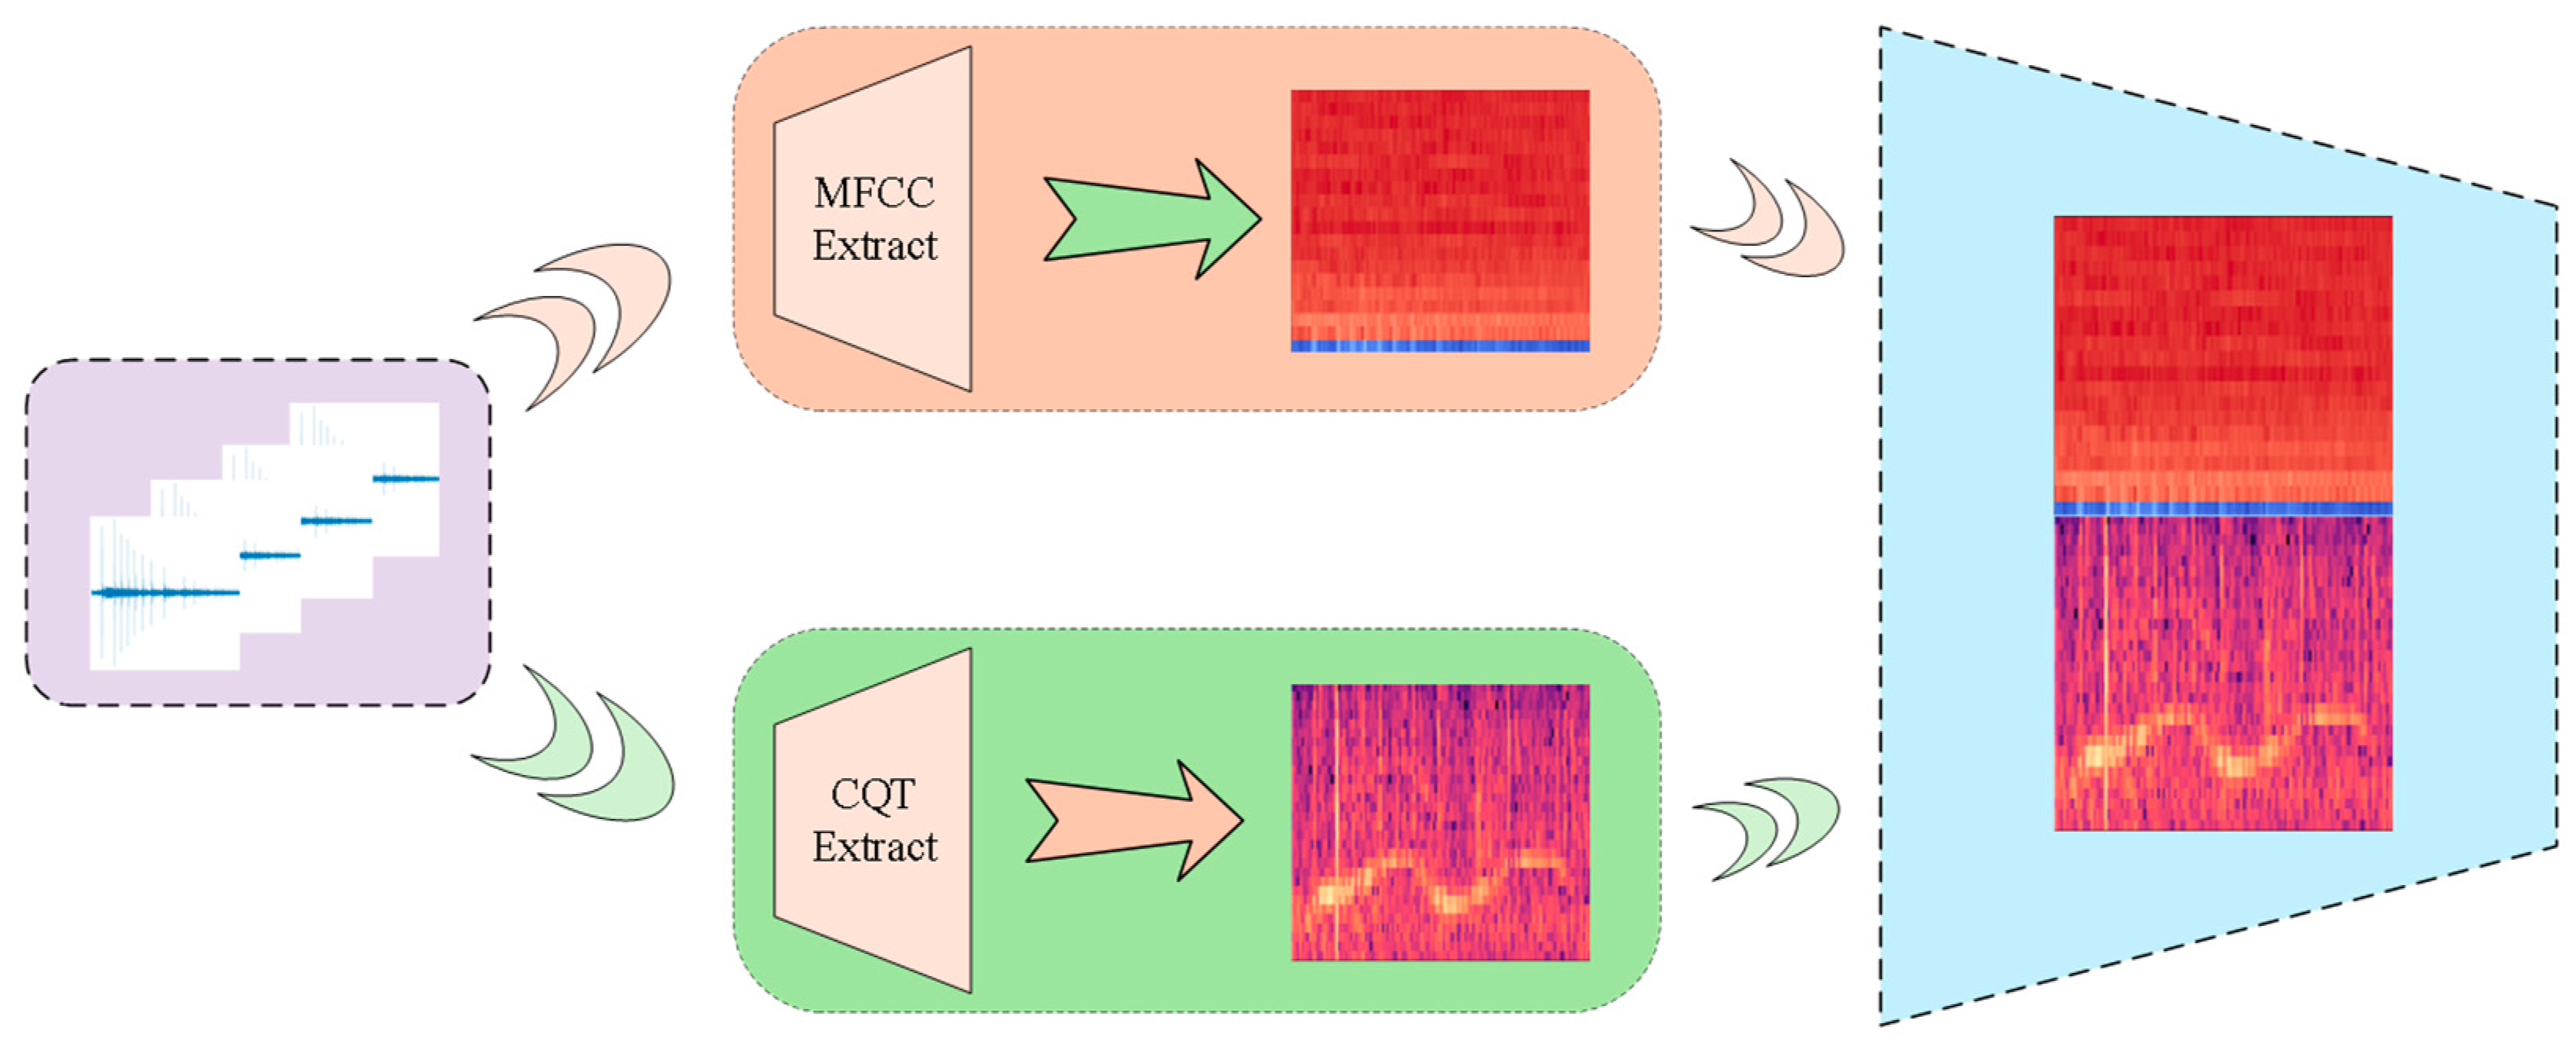
  • Feature extraction and fusion: we simultaneously extracted Log-Mel spectrograms and MFCCs, and then individually fused each with Constant-Q Transform spectrograms.
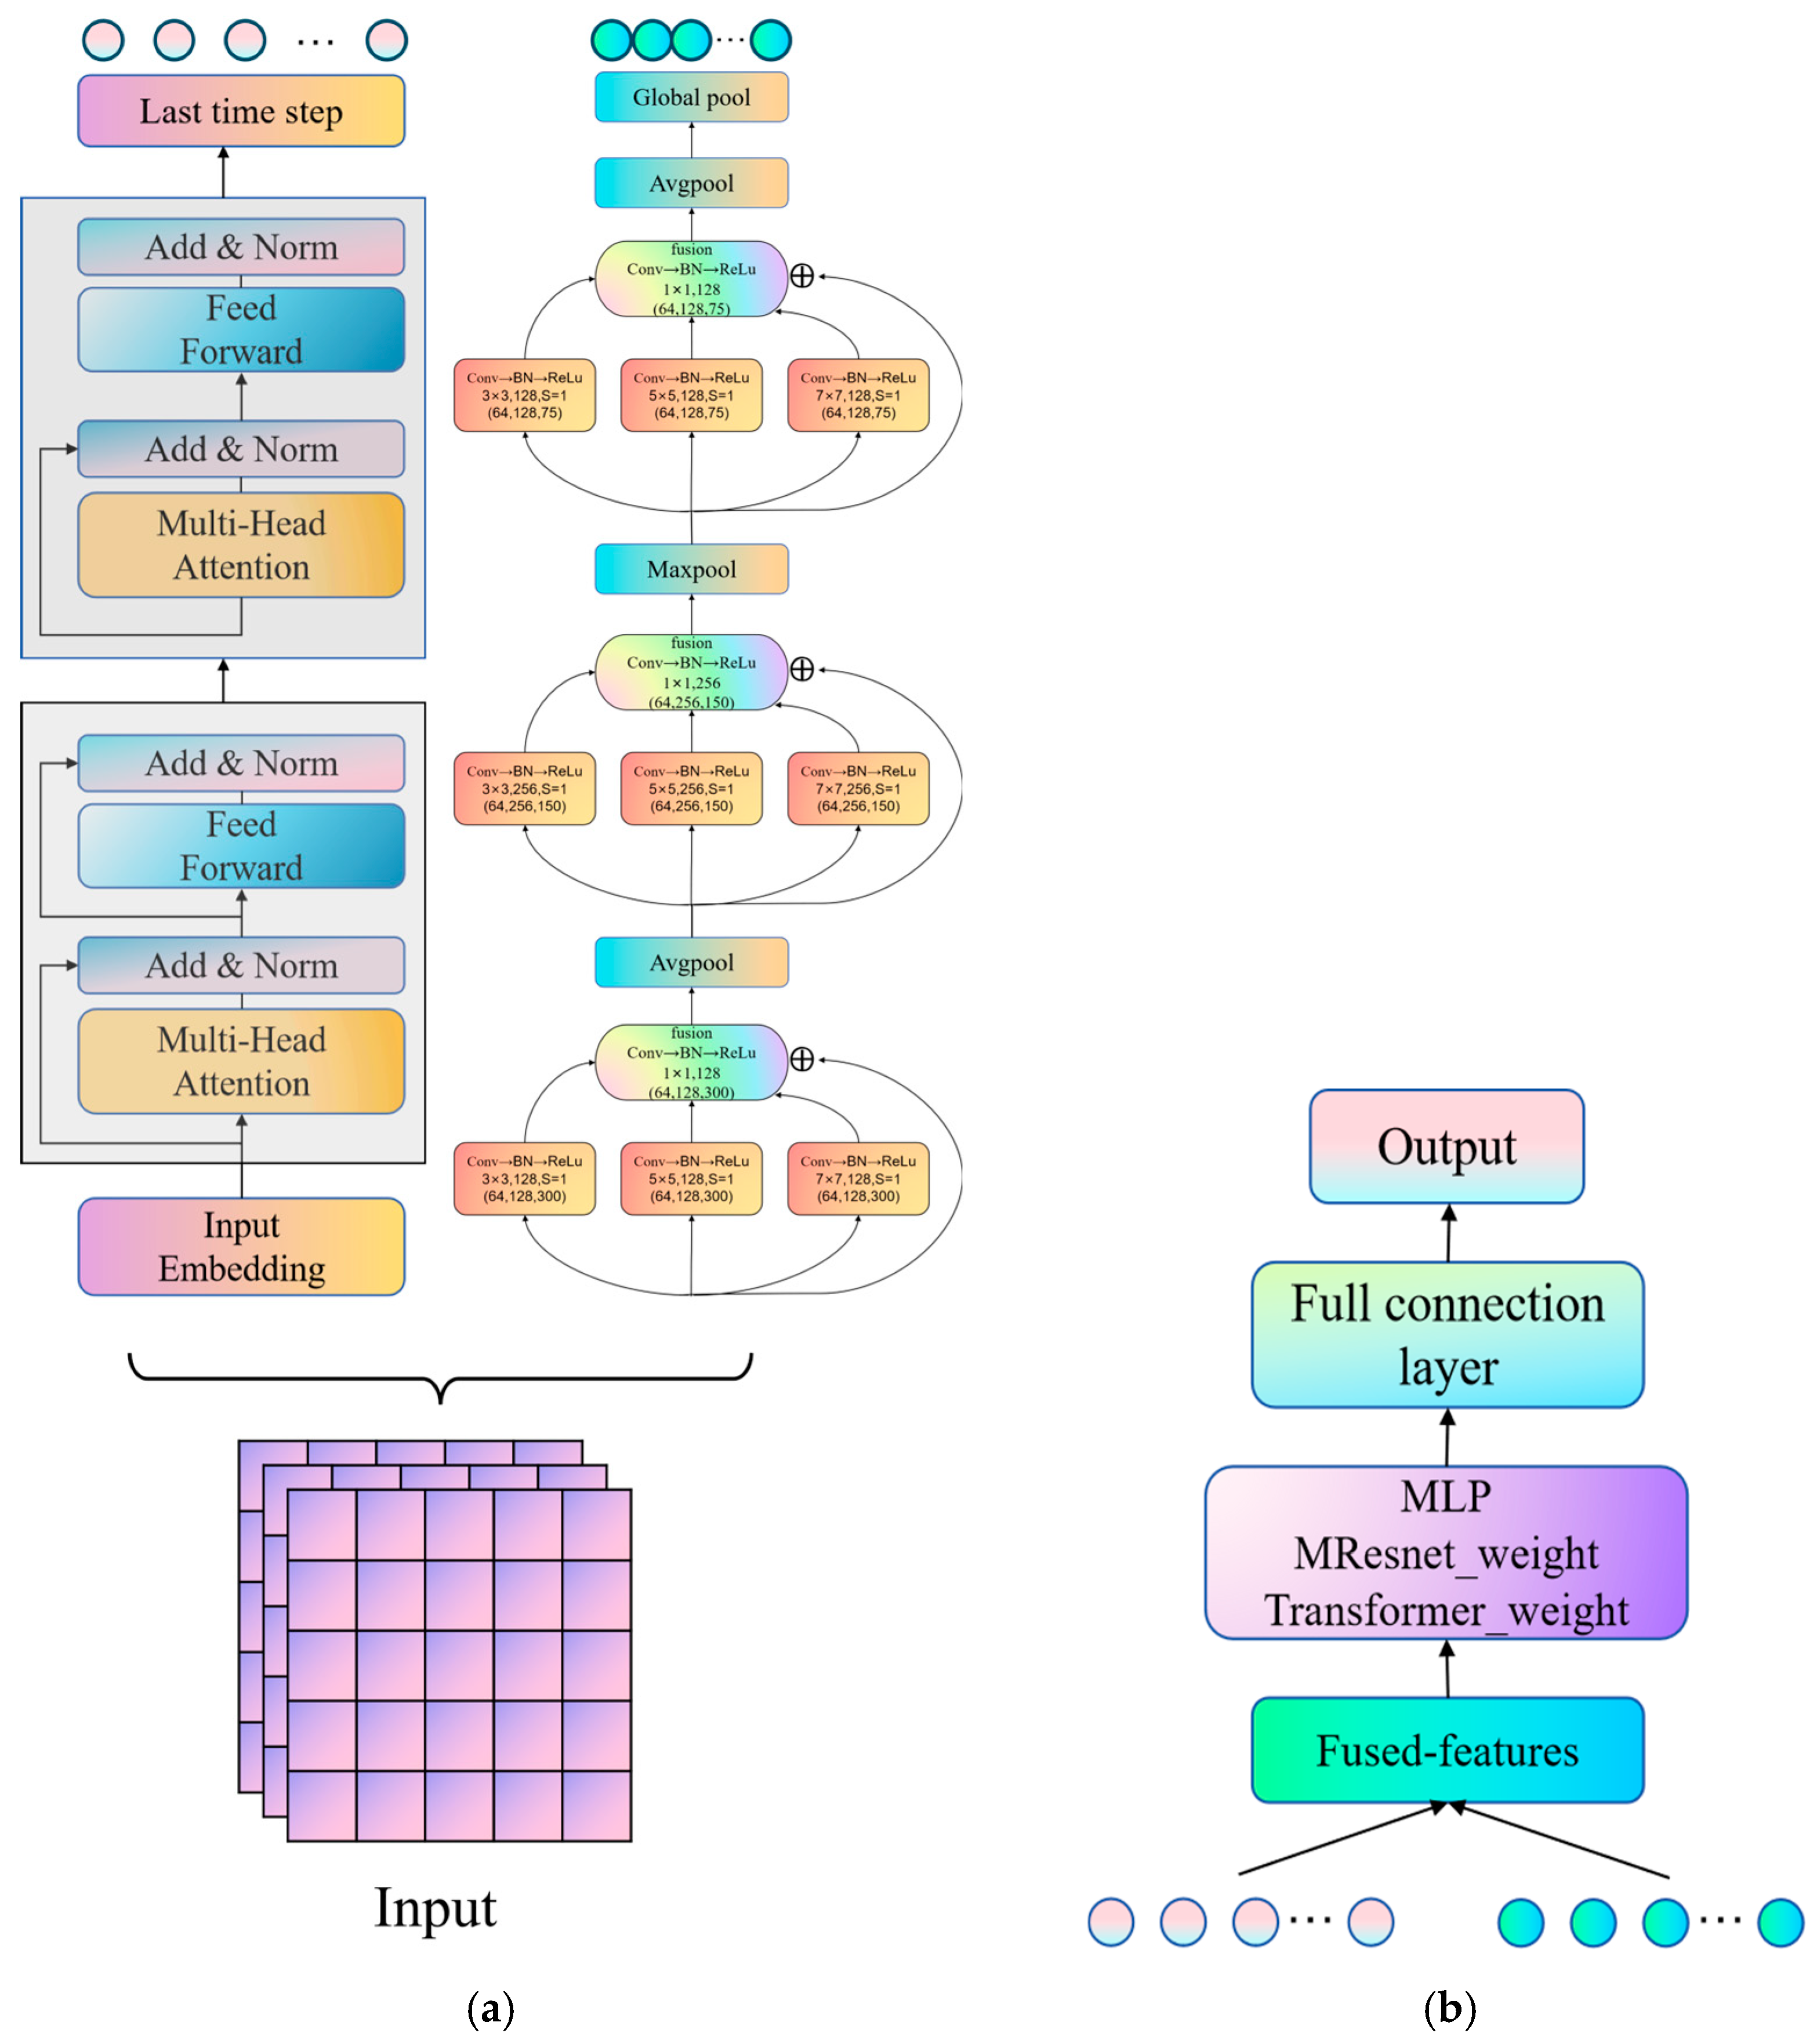
  • Model learning and classification: The fused features are fed into the MT-Resformer model. The MResnet channel employs a multi-scale parallel computation architecture to extract local information at different scales, while the Transformer channel captures global information from the features. A multi-layer perceptron (MLP) is utilized to adaptively adjust the weights of the two channels. Finally, the output passes through a fully connected layer to generate the predicted class labels.

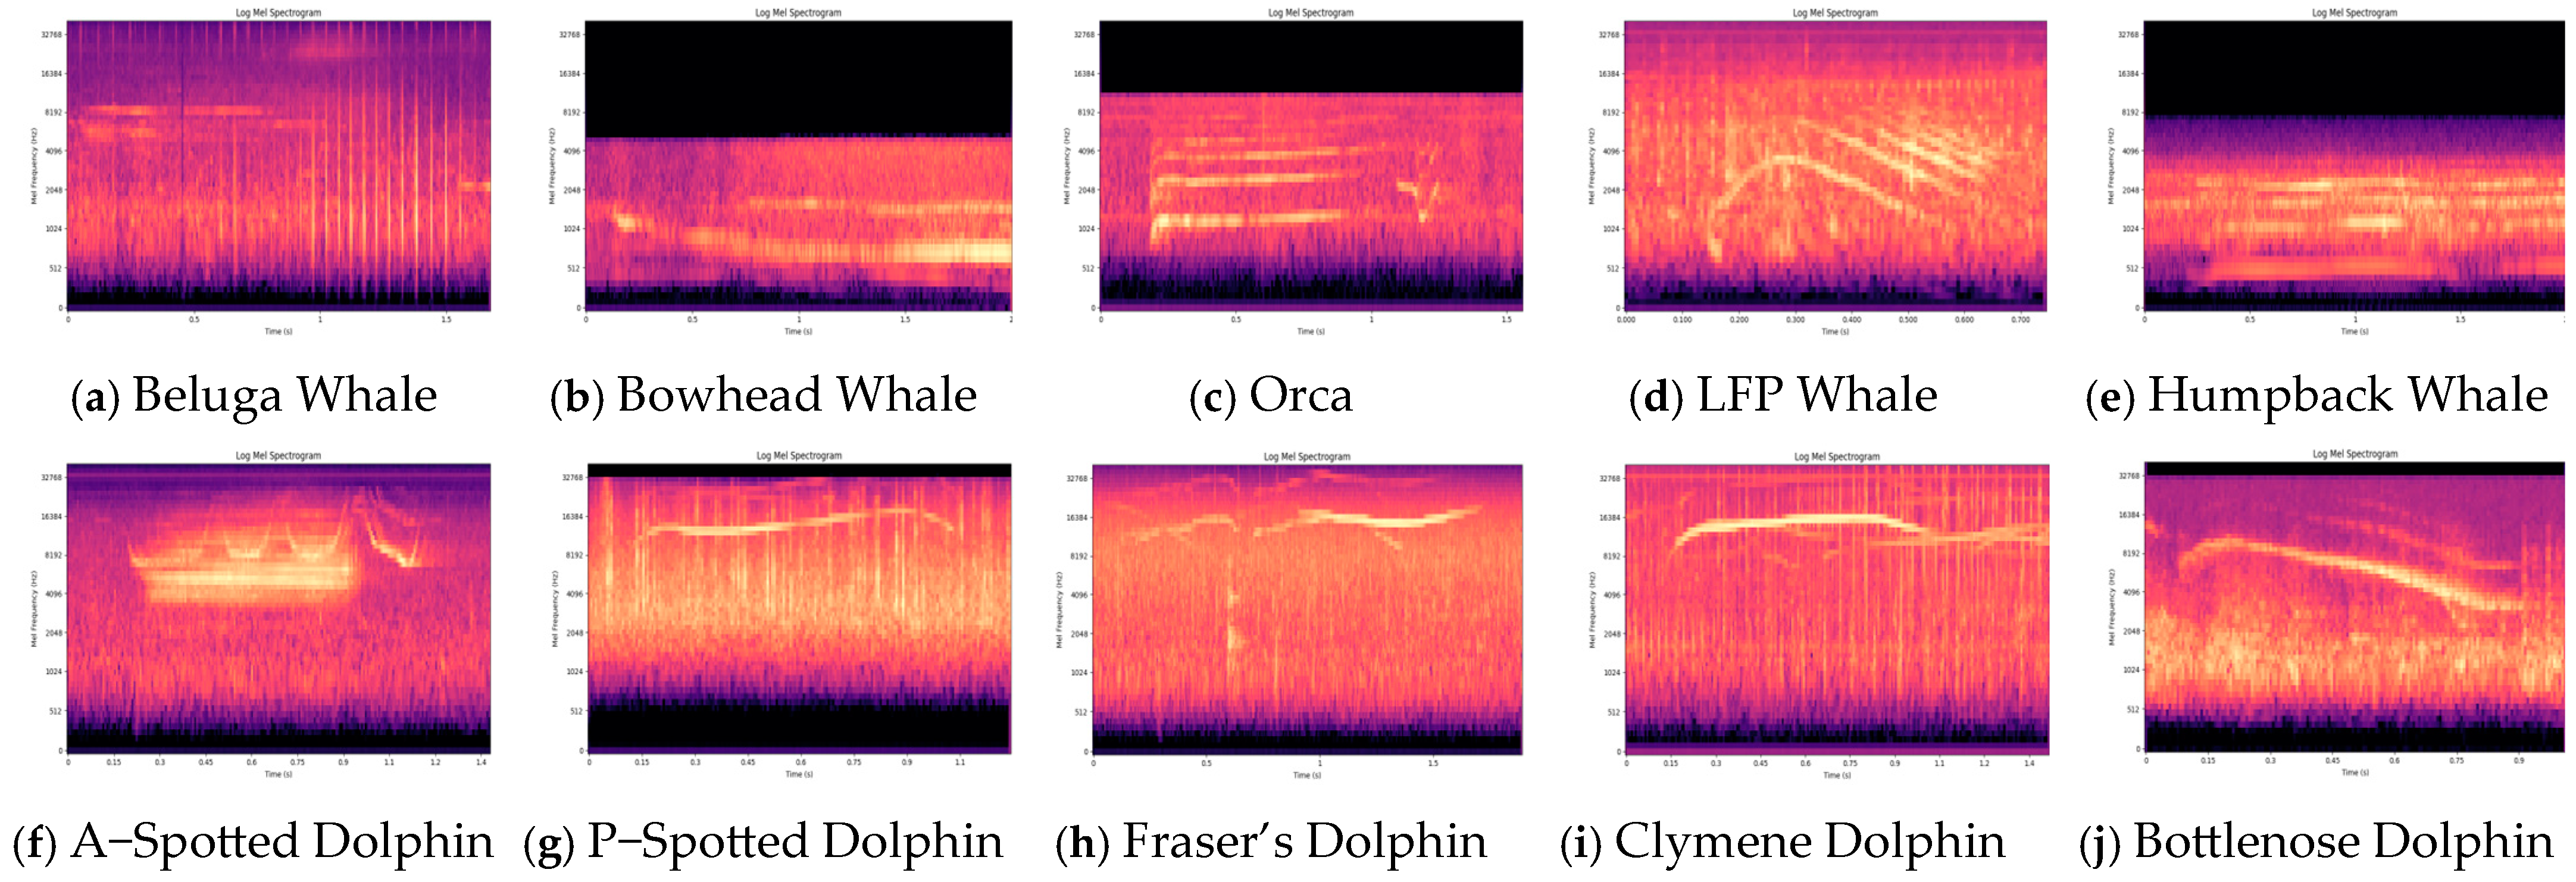
2.2. Feature Preparing

In the field of marine mammal audio classification, various spectrograms are frequently used as inputs for classification models. The Short-Time Fourier Transform (STFT) captures detailed acoustic features but includes redundant information, leading to high dimensionality and computational complexity [29]. Inspired by human auditory perception, Mel filter-based features, such as MFCC and Log-Mel spectrograms, are widely used. The Mel filter bank outperforms other time–frequency methods in recognizing underwater acoustic targets [30]. While MFCC is compact and effective in speech recognition, its discrete cosine transform (DCT) may filter out useful details [31]. Log-Mel spectrograms preserve more spectral details but also retain redundant information, which could negatively affect classification performance. Both Log-Mel and MFCC features are highly sensitive to low-frequency components but exhibit limited representation of high-frequency signals, thereby reducing their effectiveness for classifying high-frequency marine species. In contrast, the Constant-Q Transform (CQT), based on a nonlinear filter bank with exponentially growing center frequencies, offers lower detail at low frequencies but higher precision at high frequencies [32], making it particularly effective for analyzing pitch changes and signals with rich harmonic structures. Research has shown that CQT is especially suitable for timbre analysis, where timbral features are more pronounced compared to environmental sounds [33]. Many studies on animal acoustic classification have employed multi-spectrogram feature fusion methods to enhance classification performance [34,35,36]. Based on this understanding, we selected MFCC and Log-Mel spectrograms and fused them with CQT spectrograms, creating MFCC_CQT and Logmel_CQT features. These fused spectrograms were then used as inputs to the classification network, enabling the extraction of richer and more balanced features for marine mammal audio classification.
The extraction processes of Mel spectrograms and Constant-Q Transform (CQT) spectrograms are illustrated in Figure 2 and Figure 3, respectively. For the Mel spectrogram, the audio signal is first segmented into frames and windowed, followed by FFT computation to obtain the complex FFT spectrum. The STFT spectrogram is then generated through integration of the FFT spectrum. The formula for calculating the STFT is as follows:
Χ τ , k = n = 0 N 1 x n × w n τ × e j 2 π k n N
Here, x ( n ) represents the audio signal, w n τ is the window function, and e j 2 π k n N forms the fundamental component of the Fourier transform, which converts time-domain signals into frequency-domain representations, with k denoting the frequency. The STFT provides a joint time–frequency representation, but it inherently faces a resolution trade-off: shorter time windows yield higher time resolution at the expense of frequency resolution, while longer windows improve frequency resolution but reduce time resolution. In this study, N was fixed at 1024.
A Mel filter bank processes the spectrogram, and the resulting spectrum is converted into a Mel spectrogram through logarithmic scaling and integration. Finally, the discrete cosine transform (DCT) is used to derive the MFCC spectrogram. In contrast, the CQT spectrogram extraction begins with amplitude normalization during the preprocessing stage. The audio signal undergoes framing and windowing, followed by frequency component extraction using a nonlinear filter bank, with magnitudes computed. Logarithmic scaling is subsequently applied to generate the final CQT spectrogram. The fundamental formula of the CQT is as follows:
Χ C Q T k = 1 N k n = 0 N k 1 x n w N k n e j 2 π Q N k n
Here, Χ CQT k represents the Constant-Q Transform (CQT) coefficient at frequency bin k, where Q is the quality factor that governs the trade-off between frequency and time resolution. In this study, the analysis used 30 frequency bins in total, with 10 bins per octave. The lowest frequency analyzed was 5000 Hz.
The Mel spectrogram transforms frequency components to the Mel scale, which approximates human hearing characteristics to better represent perceptual differences across frequencies. This conversion process first computes the STFT of the audio signal to obtain its spectrum, and then applies the Mel-scale frequency mapping. The transformation formula for the Mel spectrum is as follows:
Mel f = 2595 × log 10 1 + f 700
Here, f represents the linear frequency in Hertz (Hz), while Mel( f ) maps it to the perceptual Mel scale. The Mel spectrum emphasizes frequency ranges that align with human auditory sensitivity, making it particularly valuable for speech recognition and music analysis applications.
Figure 4 presents the Log-Mel spectrograms of vocalizations from ten marine mammal species in the Watkins dataset, comprising five whale species and five dolphin species. The Log-Mel spectrogram offers detailed visualization across time and frequency, highlighting distinct differences in vocalization patterns between whales and dolphins. Specifically, the average vocalization frequency of whales ranges from 500 Hz to 2000 Hz, with species such as orcas and long-finned pilot whales reaching up to approximately 8000 Hz. In contrast, dolphin vocalizations span a higher frequency range, from 4000 Hz to 16,000 Hz, significantly exceeding that of whales. At a macroscopic level, these differences in frequency distribution provide a basis for broad classification. However, distinguishing between specific whale and dolphin species requires us to capture finer interspecies variations, which presents a challenge for traditional classification methods and necessitates the extraction of more discriminative features. To address this, we employ a feature fusion strategy that combines MFCCs and Log-Mel spectrograms—both commonly used in marine mammal sound classification—with Constant-Q Transform (CQT) features, which provide superior resolution in the high-frequency domain. Our feature fusion approach is inspired by the study of Du [36] et al. Unlike the method of Yu [34] et al., which performs cross-fusion of spectrogram features, we concatenate different spectrograms along separate channels. This approach preserves the internal integrity of each spectrogram while achieving spectrogram feature fusion. The specific process of feature fusion is illustrated in Figure 5 and Figure 6.

2.3. MT-Resformer Model

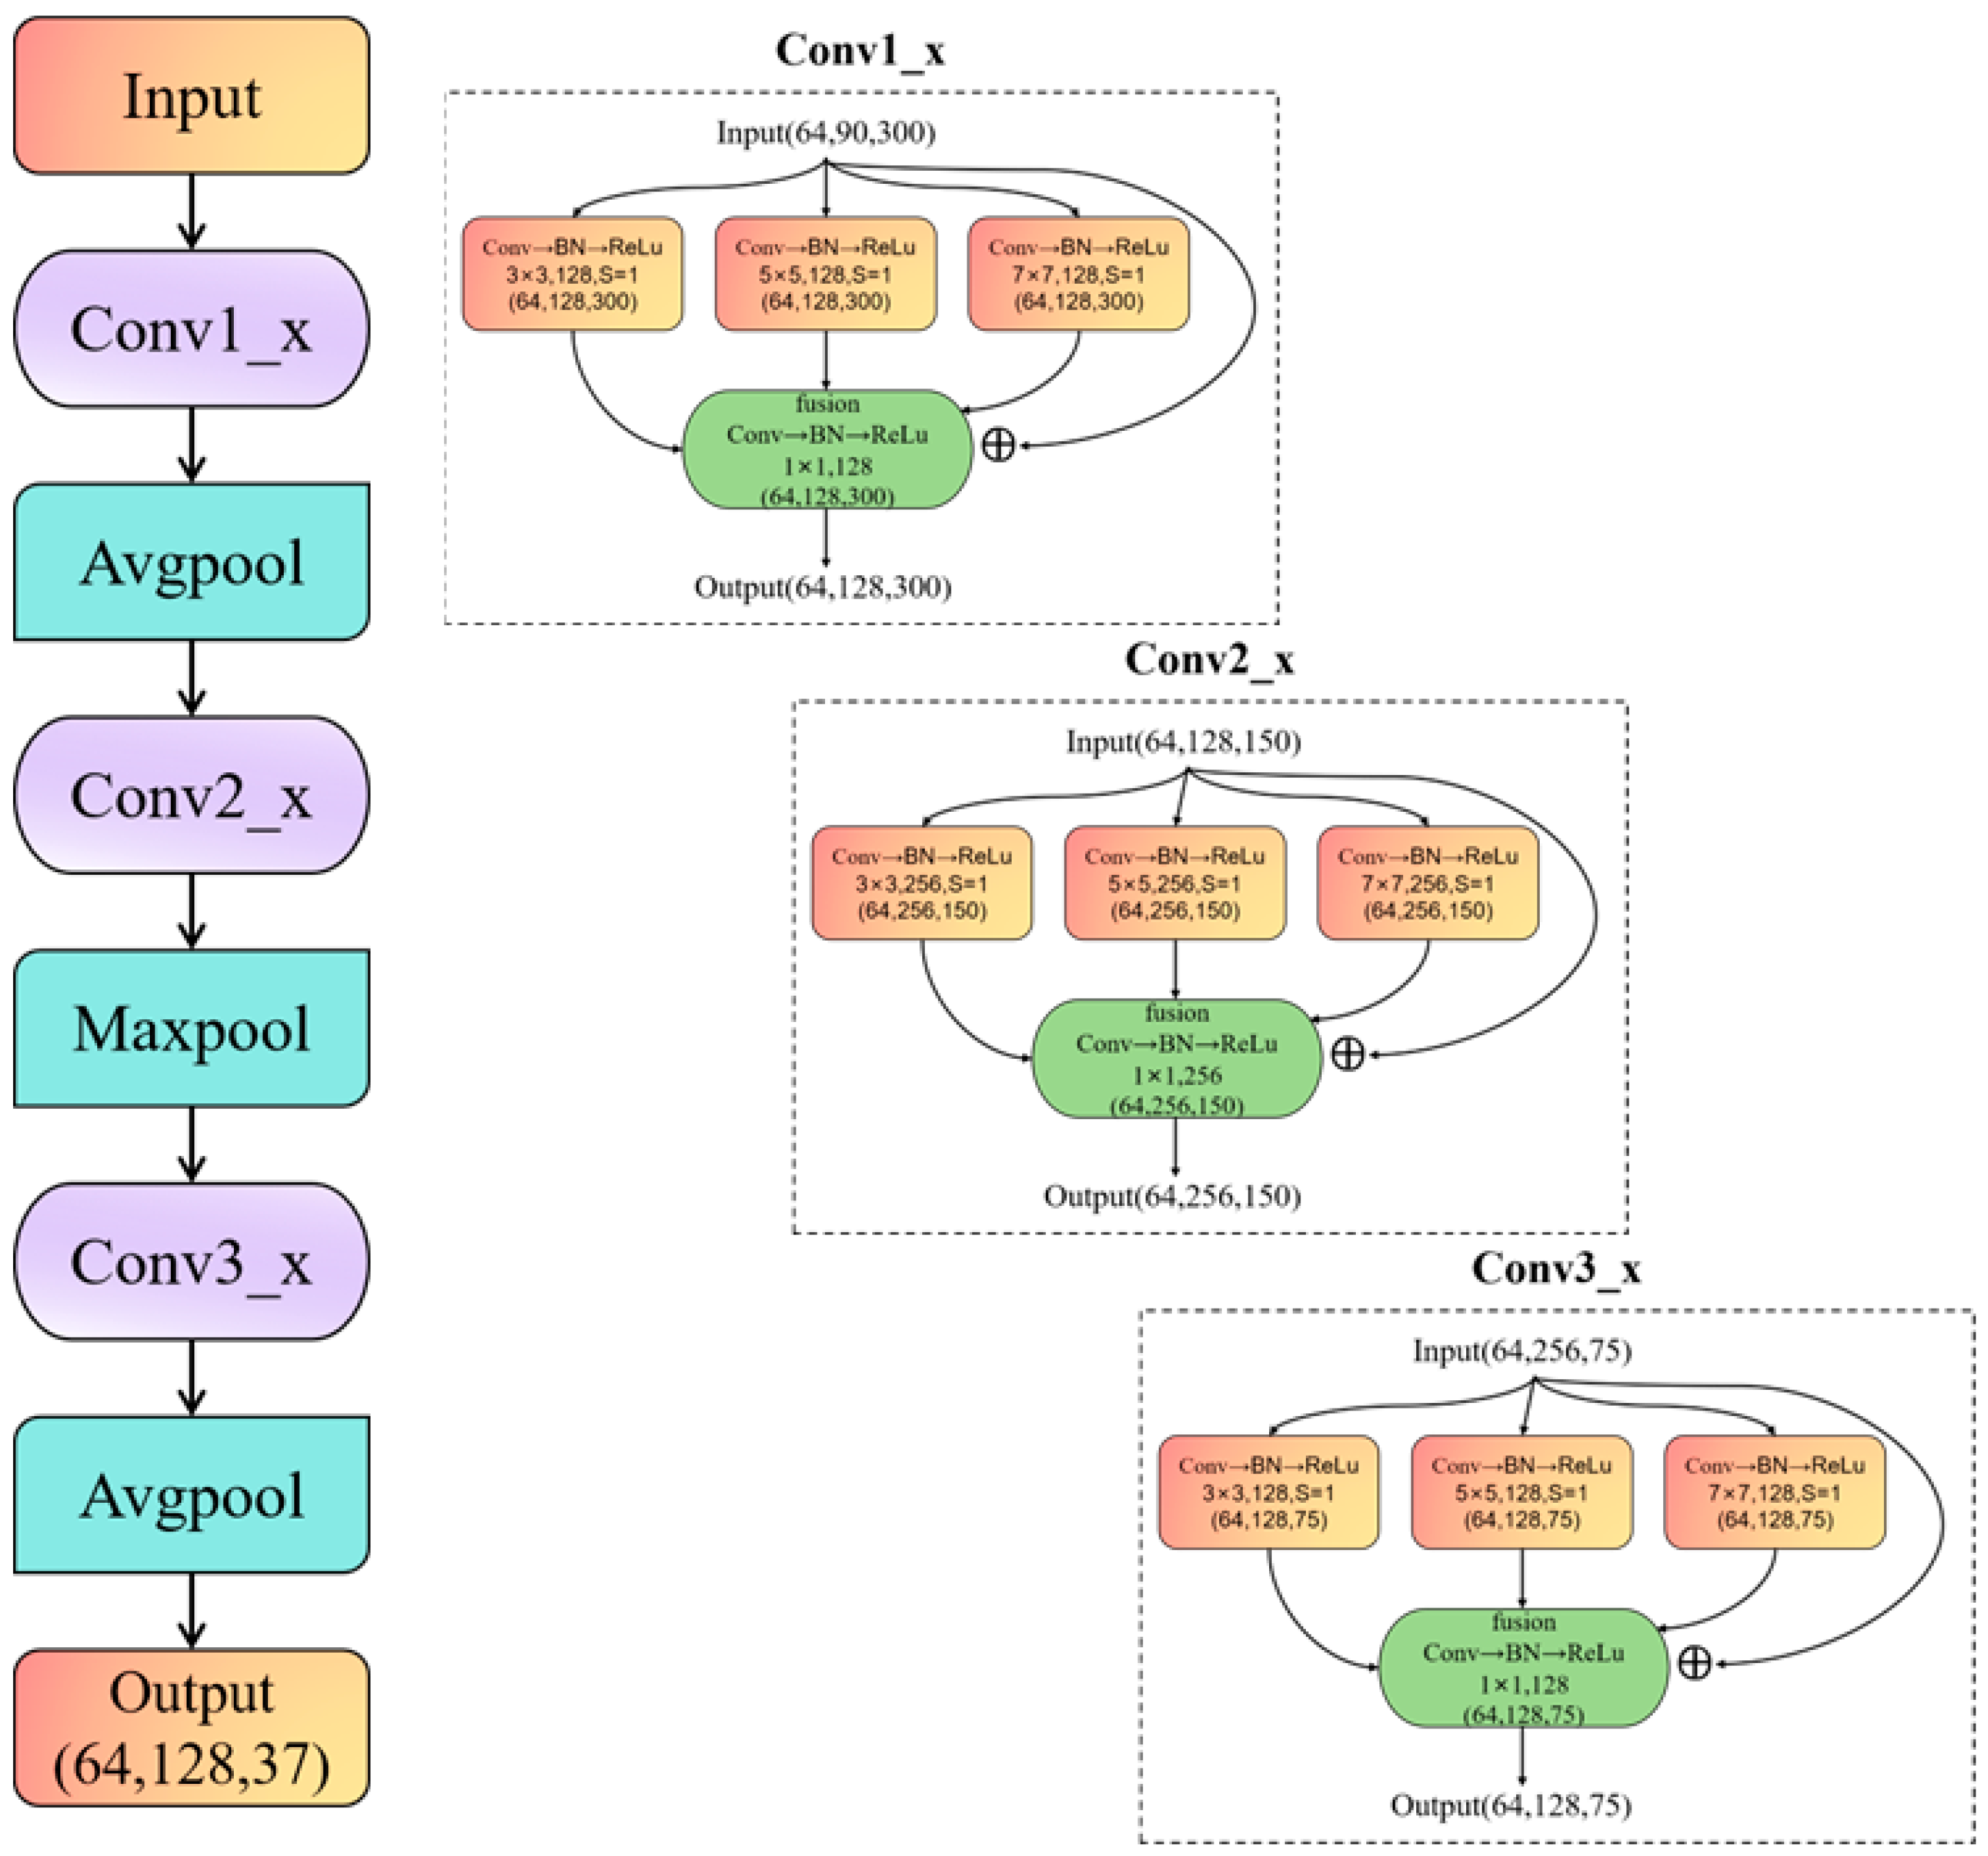
2.3.1. Multi-Scale Parallel Feature Extraction Framework

In marine mammal audio classification, spectrogram features exhibit multi-scale characteristics due to variations in both audio duration and frequency dynamics, as illustrated in Figure 7. Some recordings are relatively short, while others are longer, and the extent of frequency variation differs significantly across samples. Additionally, essential contextual information within audio signals may exist at different scales within the feature space. As shown in Figure 8, marine mammal vocalizations often contain multi-frequency aliasing and click sound. Furthermore, in fine-grained classification tasks, capturing information across multiple scales is critical for accurately interpreting the semantic content of vocalizations. Multi-scale feature extraction has been extensively validated and widely applied in computer vision [37]. Inspired by these advancements, integrating multi-scale feature extraction into marine mammal audio classification holds great potential for improving classification accuracy and model performance.
Traditional ResNet architectures typically process spectrograms using a convolutional layer with a fixed filter and stride. However, marine mammal vocalizations exhibit a wide frequency range, making it difficult for fixed-size convolutional kernels and strides to adapt to diverse signal variations. Smaller convolutional kernels have a limited receptive field, focusing on local features and capturing fine-grained details, while larger kernels offer a wider field, facilitating the extraction of global information for a more comprehensive understanding of the signal. As illustrated in Figure 9, in fine-grained dolphin call classification, the choice of convolutional kernel size significantly influences the interpretation of vocalization patterns. Therefore, employing multi-scale convolution in parallel helps expand the receptive field while maintaining a low computational cost, effectively balancing local detail preservation and global feature extraction.
To tackle the aforementioned challenges, we introduce a multi-scale parallel convolution approach to efficiently capture a variety of features from the spectrogram. As shown in Figure 10, the network utilizes residual blocks and incorporates a multi-scale parallel feature extraction framework. The architecture consists of four branches: three branches utilize convolutional kernels of different sizes (3 × 3, 5 × 5, and 7 × 7) to extract features at multiple scales, while the fourth branch incorporates a residual skip connection that directly passes the unprocessed input to the next layer. After feature extraction, the outputs from all four branches undergo channel fusion, followed by a 1 × 1 convolution to compress the channels. The use of multiple kernel sizes ensures the extraction of multi-scale discriminative features, while the residual skip connection mitigates gradient vanishing and gradient explosion issues, facilitating stable training. Additionally, the channel compression after fusion prevents excessive growth of feature channels, optimizing computational resources.

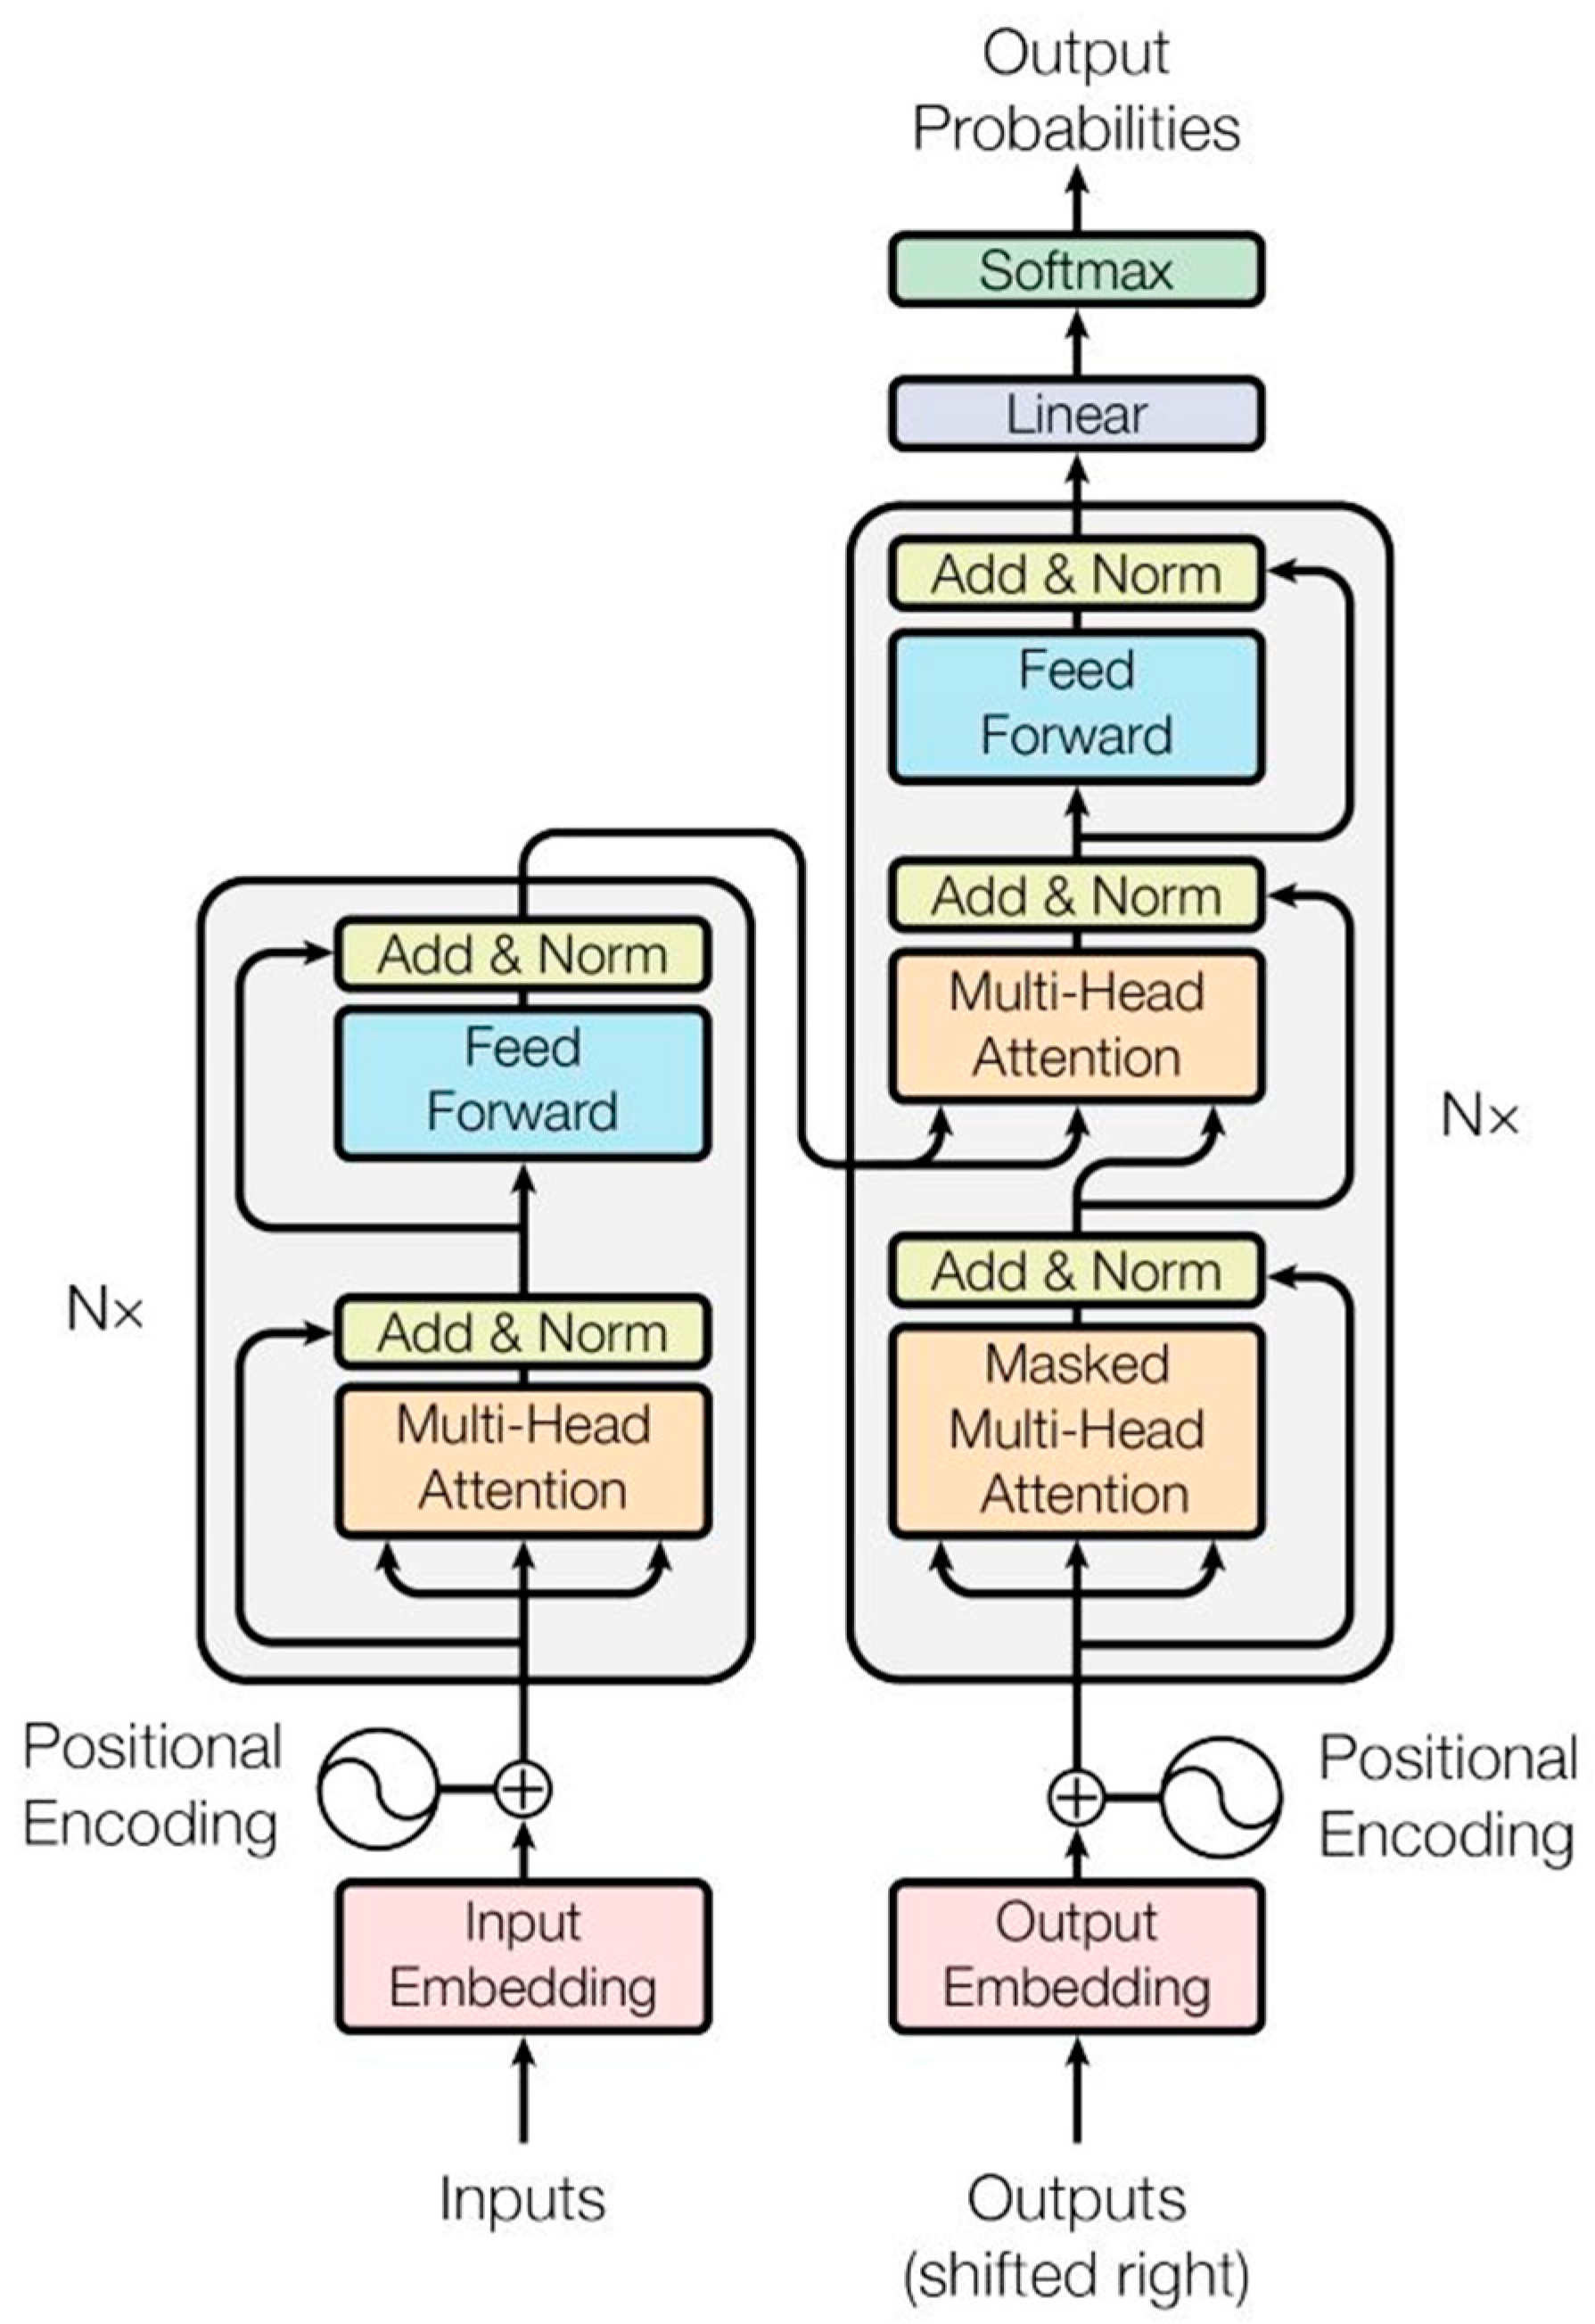
2.3.2. Architecture and Fusion of the Dual-Channel Model

To improve the model’s capacity for capturing global features, we introduce a Transformer channel alongside the MResNet channel, creating a dual-channel network. These two channels specialize in capturing different types of features: the MResNet channel excels at extracting local fine-grained details, while the Transformer channel is adept at capturing global contextual information. The Transformer network, composed of an encoder and a decoder, is entirely based on the attention mechanism, effectively addressing the limitations of RNNs and LSTM networks in capturing long-range dependencies in sequential data [38].
The Transformer architecture fundamentally revolutionizes sequence modeling by replacing recurrent structures with a fully attention-based mechanism. Unlike traditional RNNs and LSTMs that process sequences sequentially, the Transformer supports parallel computation, significantly enhancing efficiency while effectively managing long-range dependencies [38]. As illustrated in Figure 11, the Transformer consists of an encoder–decoder structure, with each encoder layer incorporating multi-head self-attention and feed-forward networks. The multi-head self-attention mechanism captures dependencies across various positions in the input sequence, making it especially effective for tasks that require a global contextual understanding. Moreover, residual connections and layer normalization further stabilize the training process and bolster feature propagation.
As shown in Figure 12, we introduce the MT-Resformer model, which comprises an MResNet channel and a Transformer channel. The MResNet channel primarily captures local fine-grained features, while the Transformer channel is dedicated to extracting global contextual information. In the MResNet channel, three parallel convolutional branches with varying kernel sizes (3 × 3, 5 × 5, and 7 × 7) are employed simultaneously, while a fourth branch—designed with residual skip connections—preserves feature information from the previous layer. This design not only facilitates multi-scale parallel convolution but also retains the original information through residual connections, thereby stabilizing the training process. The outputs of these four branches are then fused channel-wise, followed by channel compression and pooling operations to prevent an excessive increase in the number of channels. In the Transformer channel, after the embedding layer, the data are processed by a network composed of two Transformer encoder layers. Each encoder layer incorporates multi-head self-attention and a feed-forward network to capture global dependencies across time steps, with residual connections and layer normalization ensuring training stability. Ultimately, the feature from the final time step of the encoder output is selected as a comprehensive representation of the global context, providing rich information for subsequent feature fusion and classification tasks. These two channels, operating independently with their distinct feature extraction emphases, complement each other. Finally, a multi-layer perceptron dynamically adjusts the weighting between the local detail features and the global contextual features to accommodate various granularities in marine mammal vocalization classification tasks.

3. Experiments

3.1. Dataset

This experiment utilizes the Watkins Marine Mammal Sound Database [39] and the ChangLong dataset. The Watkins dataset is a widely used and publicly available resource in the field of marine mammal acoustic research, while the ChangLong dataset consists of dolphin vocalizations recorded in collaboration with Chimelong Ocean Kingdom. This study further explores their applications in marine mammal vocalization classification. Detailed information on these two datasets is provided below.
The Watkins dataset was created by William Watkins and William Schevill, both pioneers in marine mammal bioacoustics, at the Woods Hole Oceanographic Institution [39]. This extensive database includes around 2000 recordings of more than 60 marine mammal species, covering a wide temporal range and offering a diverse collection of vocalizations. Its significance in marine mammal bioacoustics research is indisputable. In this study, we selected 10 large marine mammal species for experimentation, including five whale species and five dolphin species. The purpose of using this dataset is to evaluate the model’s classification performance for different marine mammal vocalizations.
The ChangLong dataset is a collection of dolphin vocalizations recorded in collaboration with Chimelong Ocean Kingdom. This dataset collects seven distinct tonal variations from a single dolphin species. The recording process was conducted under a confidentiality agreement with Chimelong Ocean Kingdom. All recordings were made using professional-grade audio equipment within the dolphin activity areas, ensuring the dataset includes dolphin vocalizations, human noise, and occasional calls from other marine mammals. Comprising multiple WAV-format audio files of varying lengths, the dataset includes recordings ranging from 3 to 30 min.
The ChangLong dataset documents seven distinct dolphin vocalization patterns, as illustrated in Figure 13. These patterns are classified based on the shape of their spectral signals and are named Concave, Double Concave, Down Sweep, Constant, Sine, Up Sweep, and Convex.
This dataset aims to analyze and classify the specific vocalization type of a given dolphin audio sample. Compared to the Watkins dataset, which focuses on distinguishing different species of marine mammals, the ChangLong dataset presents a finer-grained classification task—differentiating between various vocalization patterns within a single species. By training the model on classification tasks with different levels of granularity, we can effectively assess its ability to adaptively adjust to varying classification demands. This adaptability was a key reason why these two datasets were selected for our experiments.
Dolphins primarily produce three functional acoustic signals: echolocation clicks for environmental navigation, burst pulses during aggressive encounters, and whistles for sophisticated social communication [40]. These whistles have evolved diverse tonal variations that function analogously to words in human language, enabling dolphins to convey complex semantic information through sequential combinations of distinct calls. Notably, geographic and behavioral variations have resulted in species-specific differences in whistle characteristics (e.g., frequency ranges and duration), creating population-specific “acoustic dialects” that parallel the cultural diversification of human languages across regions. This ecological–communicative adaptation underscores why contemporary bioacoustic research emphasizes intraspecific whistle analysis, as cross-species comparisons risk obscuring the unique signal–context relationships that develop within distinct dolphin populations. The specialized nature of these communication systems therefore necessitates focused studies on particular species or groups to accurately interpret the semantic richness of dolphin whistles.
Interspecific variations in dolphin whistles emerge from ecological and behavioral adaptations across different habitats. By cross-referencing our findings with established bioacoustic research, we achieved a more comprehensive understanding of these phylogenetically distinct acoustic signatures.
The double concave whistle identified in this study exhibits characteristics similar to dolphin signature whistles—a special tonal pattern distinct from basic whistle types, featuring a stereotyped and repetitive acoustic contour [41]. This phenomenon aligns with the findings of Fripp [42] et al., who demonstrated that, during their first few months of life, dolphins develop unique signature whistles through vocal learning from sounds in their immediate environment, creating acoustic identifiers functionally analogous to human ID cards that encode individual-specific information. Particularly in expansive marine habitats, these signature whistles serve as frequent contact calls for group cohesion, with each emission simultaneously broadcasting both the caller’s identity and spatial location information when responding to group members. Dolphins exhibit significant modifications to their signature whistles during the postpartum period while raising their calves, specifically increasing the maximum frequency, broadening the bandwidth, and shortening the duration of these vocalizations [43]. These acoustic variations not only reflect maternal behavioral adaptations but also serve as valuable bioindicators, as abnormal whistle patterns can provide important insights into individual health status [44]. Furthermore, dolphin vocal behavior demonstrates remarkable plasticity, with their communication patterns showing adaptive variations in response to environmental conditions, seasonal cycles, and reproductive status—a phenomenon particularly evident in their increased production of burst-pulse sounds during mating seasons as part of their complex reproductive behavior [45].
The upward-sweeping dolphin whistle proposed in this study is similar to the “chirp”-like signal [41], as both are characterized by an ascending frequency contour. This pattern may be associated with frequency scanning behavior, potentially used for environmental exploration or calling companions. In contrast, downward-sweeping whistles are often observed in contexts of disappointment, termination, or separation. Whistles that first rise and then fall in frequency, forming a convex shape on the spectrogram, are known as convex-shaped whistles. These typically occur during social interactions and may convey neutral or expectant messages. On the other hand, whistles that first fall and then rise in frequency, creating a concave spectrogram contour, are considered concave-shaped whistles and are sometimes observed in mother–calf communication, possibly serving to soothe or summon. Sinusoidal whistles, characterized by rhythmic rises and falls in frequency resembling a sine wave, are more frequently emitted during playful or joyful interactions, suggesting excitement or heightened emotional engagement. Finally, constant-frequency whistles, appearing as straight horizontal lines on the spectrogram, may reflect a calm or indifferent state, or be related to specific environmental conditions.
In this study, due to the varying audio lengths in the two original datasets and the presence of noise, silence, and other inconsistencies, a preprocessing step was necessary. This included noise reduction and silence removal, as well as segmenting long audio recordings into 3 s intervals. After preprocessing, the datasets were randomly divided into training and test sets (7:3 ratio), with the sample distributions for the Watkins and ChangLong datasets shown in Table 1 and Table 2.

3.2. Dataset Preprocessing

In this paper, we propose and evaluate two newly designed feature representations: MFCC_CQT and Logmel_CQT. Considering that many marine mammal vocalizations contain rich details in the high-frequency range, we set the sampling rate to 80 kHz to better capture these nuances. To balance time and frequency resolution, we use a window size of 1024, while for CQT feature extraction, we configure 30 frequency bins across the entire frequency axis to achieve higher resolution in the high-frequency region. After feature extraction and channel fusion, the final input feature dimensions for our proposed network model are (MFCC_CQT: (50, 300), Logmel_CQT: (90, 300)), ensuring a comprehensive representation of both spectral and temporal characteristics. Table 3 provides a detailed breakdown of these feature dimensions.

3.3. Network Training Parameter Setting

This paper proposes a dual-channel network, MT-Resformer, which integrates MResNet and a Transformer network in parallel for marine mammal vocalization classification. By optimizing the serial structure of the ResNet architecture, we introduce parallel multi-scale branches to enhance feature extraction capability while employing channel fusion and compression to prevent excessive channel expansion. Building upon the existing multi-scale residual network, we incorporate a two-layer Transformer encoder in parallel to form a dual-channel architecture. A multi-layer perceptron (MLP) dynamically adjusts the weights of both channels, and the computed weights are used to fuse their outputs. Finally, classification is performed using a fully connected layer. The proposed model effectively adapts to marine mammal vocalization classification tasks with different levels of granularity. The detailed network structure is presented in Table 4.
This study utilizes PyCharm as the development platform and PyTorch 2.4.0 + cu121 as the deep learning framework, employing Python 3.9.0. The hardware setup is as follows:
12th Gen Intel(R) Core(TM) i5-12400F (manufactor: Intel; city: Guangzhou; country: China);
RAM: 96GB DDR5 4000MHz (manufactor: Corsair Gaming, Inc.; city: Guangzhou; country: China);
CUDA Version: 12.6;
NVIDIA GeForce RTX 4070 (manufactor: ASUS; city: Guangzhou; country: China).
After establishing the multi-scale dual-channel network model, we set the training parameters as shown in Table 5. The model is optimized with cross-entropy loss, Adam, and the ReLU activation function. Based on comparative experiments evaluating training accuracy, data utilization efficiency, and training time, a batch size of 64 was selected. The number of training epochs was set to 100, and the trained models were retained. Finally, the model was evaluated on the test set, and the best-performing results were recorded.

4. Experimental Results and Analysis

After 100 iterations, the classification model was tested on the Watkins and ChangLong datasets, generating loss and accuracy curves along with confusion matrices. The training results are presented in Figure 14 and Figure 15. In these curves, the blue line represents the training set trend, while the red line indicates the test set trend.
Figure 14a–c show the loss curve, accuracy curve, and confusion matrix for the Watkins dataset after applying the classification model. In Figure 14a,b, the blue line indicates the training set, while the red line indicates the test set.
In Figure 14a, the training loss (blue line) drops quickly in the first 20 epochs, showing rapid initial convergence, while the test loss (red line) experiences significant fluctuations initially before stabilizing with smaller variations. The model attains a peak classification accuracy of 99.17%. This pattern of rapid early convergence followed by slower convergence with test loss fluctuations is attributed to the use of the cosine annealing learning rate scheduler, which dynamically adjusts the learning rate throughout training—starting high in the early stages to accelerate convergence and gradually decreasing later to enhance model stability and generalization performance. Similarly, in Figure 14b, the training accuracy (blue line) steadily increases, reaching nearly 1.0, while the test accuracy (red line) shows slight initial fluctuations before gradually rising and stabilizing just below the training accuracy. The model’s ability to achieve high accuracy on the test set within relatively few training epochs is a result of feature extraction and model architecture improvements specifically designed to capture the characteristics of marine mammal vocalizations effectively.
Figure 14c illustrates the model’s prediction results across different categories. The values along the main diagonal correspond to correctly classified samples, while the off-diagonal values represent misclassifications. The model demonstrates high accuracy across most categories, with only a few misclassified samples, resulting in overall satisfactory performance.
The model performs excellently in distinguishing specific marine mammal species based on their vocalizations in the Watkins dataset. Additionally, this study evaluates the model on the ChangLong dataset, where it is tasked with differentiating between different pitch variations in dolphin calls. This task presents a higher level of difficulty and finer granularity compared to classifying marine mammal species, making it a more challenging test for the model.
Figure 15a–c display the loss curve, accuracy curve, and confusion matrix for the ChangLong dataset after the model’s application. In Figure 15a,b, the blue curve corresponds to the training set, and the red curve corresponds to the test set.
In Figure 15a, the model shows strong learning ability throughout training. The training loss (blue line) steadily decreases as epochs increase, while the test loss (red line) fluctuates initially before stabilizing. In Figure 15b, both training and test accuracy improve over time, with test accuracy peaking at 95.22%, demonstrating high recognition performance.
As shown in Figure 15c, some degree of misclassification is present across nearly all categories. This is because the ChangLong dataset consists entirely of dolphin vocalizations, differing only in pitch. Overall, the model performs reasonably well, but misclassifications still occur for certain samples. To further enhance performance, strategies such as adjusting model parameters, expanding the training data, or utilizing a more complex model architecture could prove effective.
An in-depth analysis of the model’s classification results on both the Watkins and ChangLong datasets shows that the model performs more effectively on the Watkins dataset.
We randomly selected dolphin audio samples from the Watkins dataset and analyzed their vocalizations using a model trained on the ChangLong dataset. However, the experimental results did not meet expectations. This outcome was anticipated, as the Watkins dataset contains recordings from different dolphin species, whose vocalizations vary due to differences in their habitats and behaviors—much like how people from different regions develop distinct dialects. The poor performance of a model trained on a single species’ vocalizations when applied to other species indirectly highlights the vocal diversity that exists among different dolphin species.

4.1. Comparison of Recognition Accuracy Across Various Feature Extraction Methods

To investigate the effect of various feature extraction methods on the classification performance of marine mammal vocalizations, we performed comparative experiments, utilizing the ResNet18 network on both the Watkins and ChangLong datasets. To ensure fair comparisons, we maintained consistent hyperparameter settings and test set partitions across all experiments. By comparing the classification accuracy of STFT, Log-Mel, MFCC, and the proposed fusion features (Logmel_CQT and MFCC_CQT) for the same ResNet18 [46] architecture, we assessed the advantages of our three-dimensional fusion features using key evaluation metrics like accuracy, recall, and F1-score. This section will provide a detailed discussion of the classification results from three key aspects: accuracy, precision, recall; F1-score; and the confusion matrix.
  • Comparison of classification accuracy for the Watkins dataset
As shown in Figure 16, the highest recognition accuracies attained using STFT, Log-Mel, and MFCC features were 98.27%, 98.20%, and 98.76%, respectively. In contrast, the proposed fusion features, Logmel_CQT and MFCC_CQT, achieved peak accuracies of 98.65% and 98.76%. These results indicate that incorporating CQT features into Log-Mel improved recognition accuracy by 0.45%. However, integrating CQT with MFCC did not yield any additional accuracy gains.
2.
Evaluation of Accuracy, Precision, Recall, and F1-Score for the Watkins Dataset
To comprehensively assess the model’s overall performance, accuracy, precision, recall, and F1-score are employed as evaluation metrics. The mathematical formulations for each metric are as follows [47]:
a c c u r a c y = T P + T N T P + T N + F P + F N
p r e c i s i o n = T P T P + F P
r e c a l l = T P T P + F N
F 1 s c o r e = 2 T P 2 T P + F P + F N
where TP (true positive), TN (true negative), FP (false positive), and FN (false negative) represent true positive, true negative, false positive, and false negative cases, respectively.
As shown in Figure 17, the Logmel_CQT features outperform the Log-Mel features by 0.45% in accuracy, 0.79% in precision, 1.12% in recall, and 0.95% in F1 score. The MFCC_CQT features, compared to the MFCC features, show no improvement in accuracy but exhibit gains of 0.3%, 0.52%, and 0.41% in precision, recall, and F1 score, respectively. This indicates that the proposed feature fusion approach is more efficient in capturing relevant feature information from the data, improving the overall classification performance of the model. Furthermore, in the Watkins dataset, MFCC_CQT exhibits overall superior performance compared to Logmel_CQT.
3.
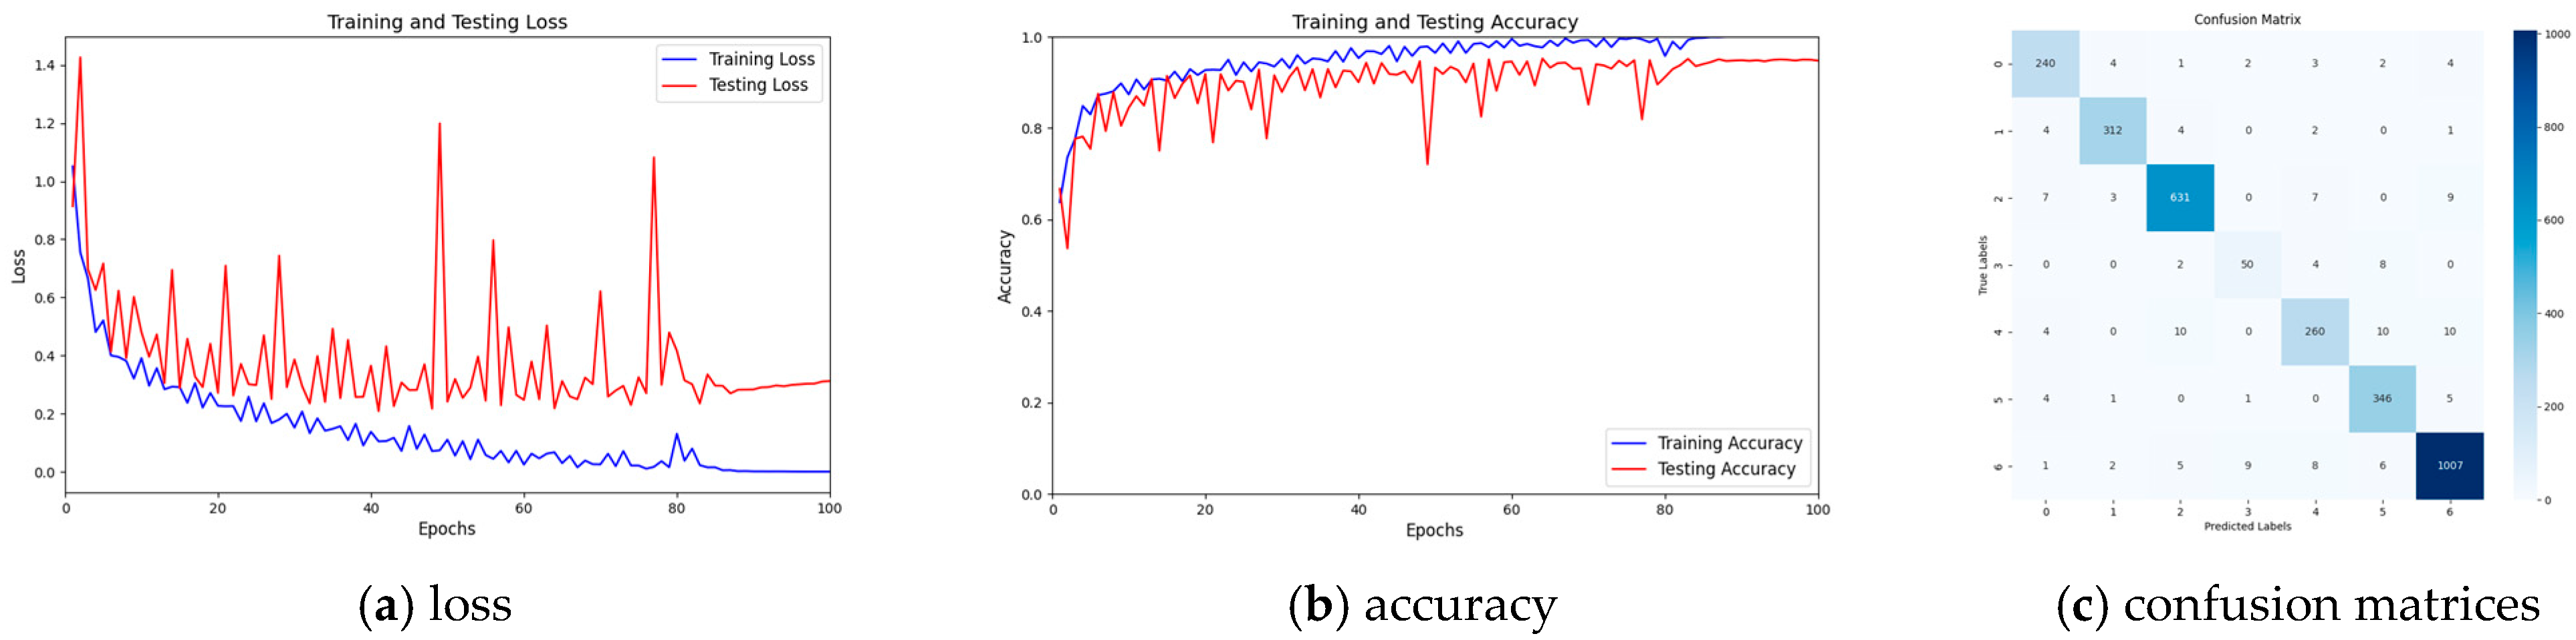
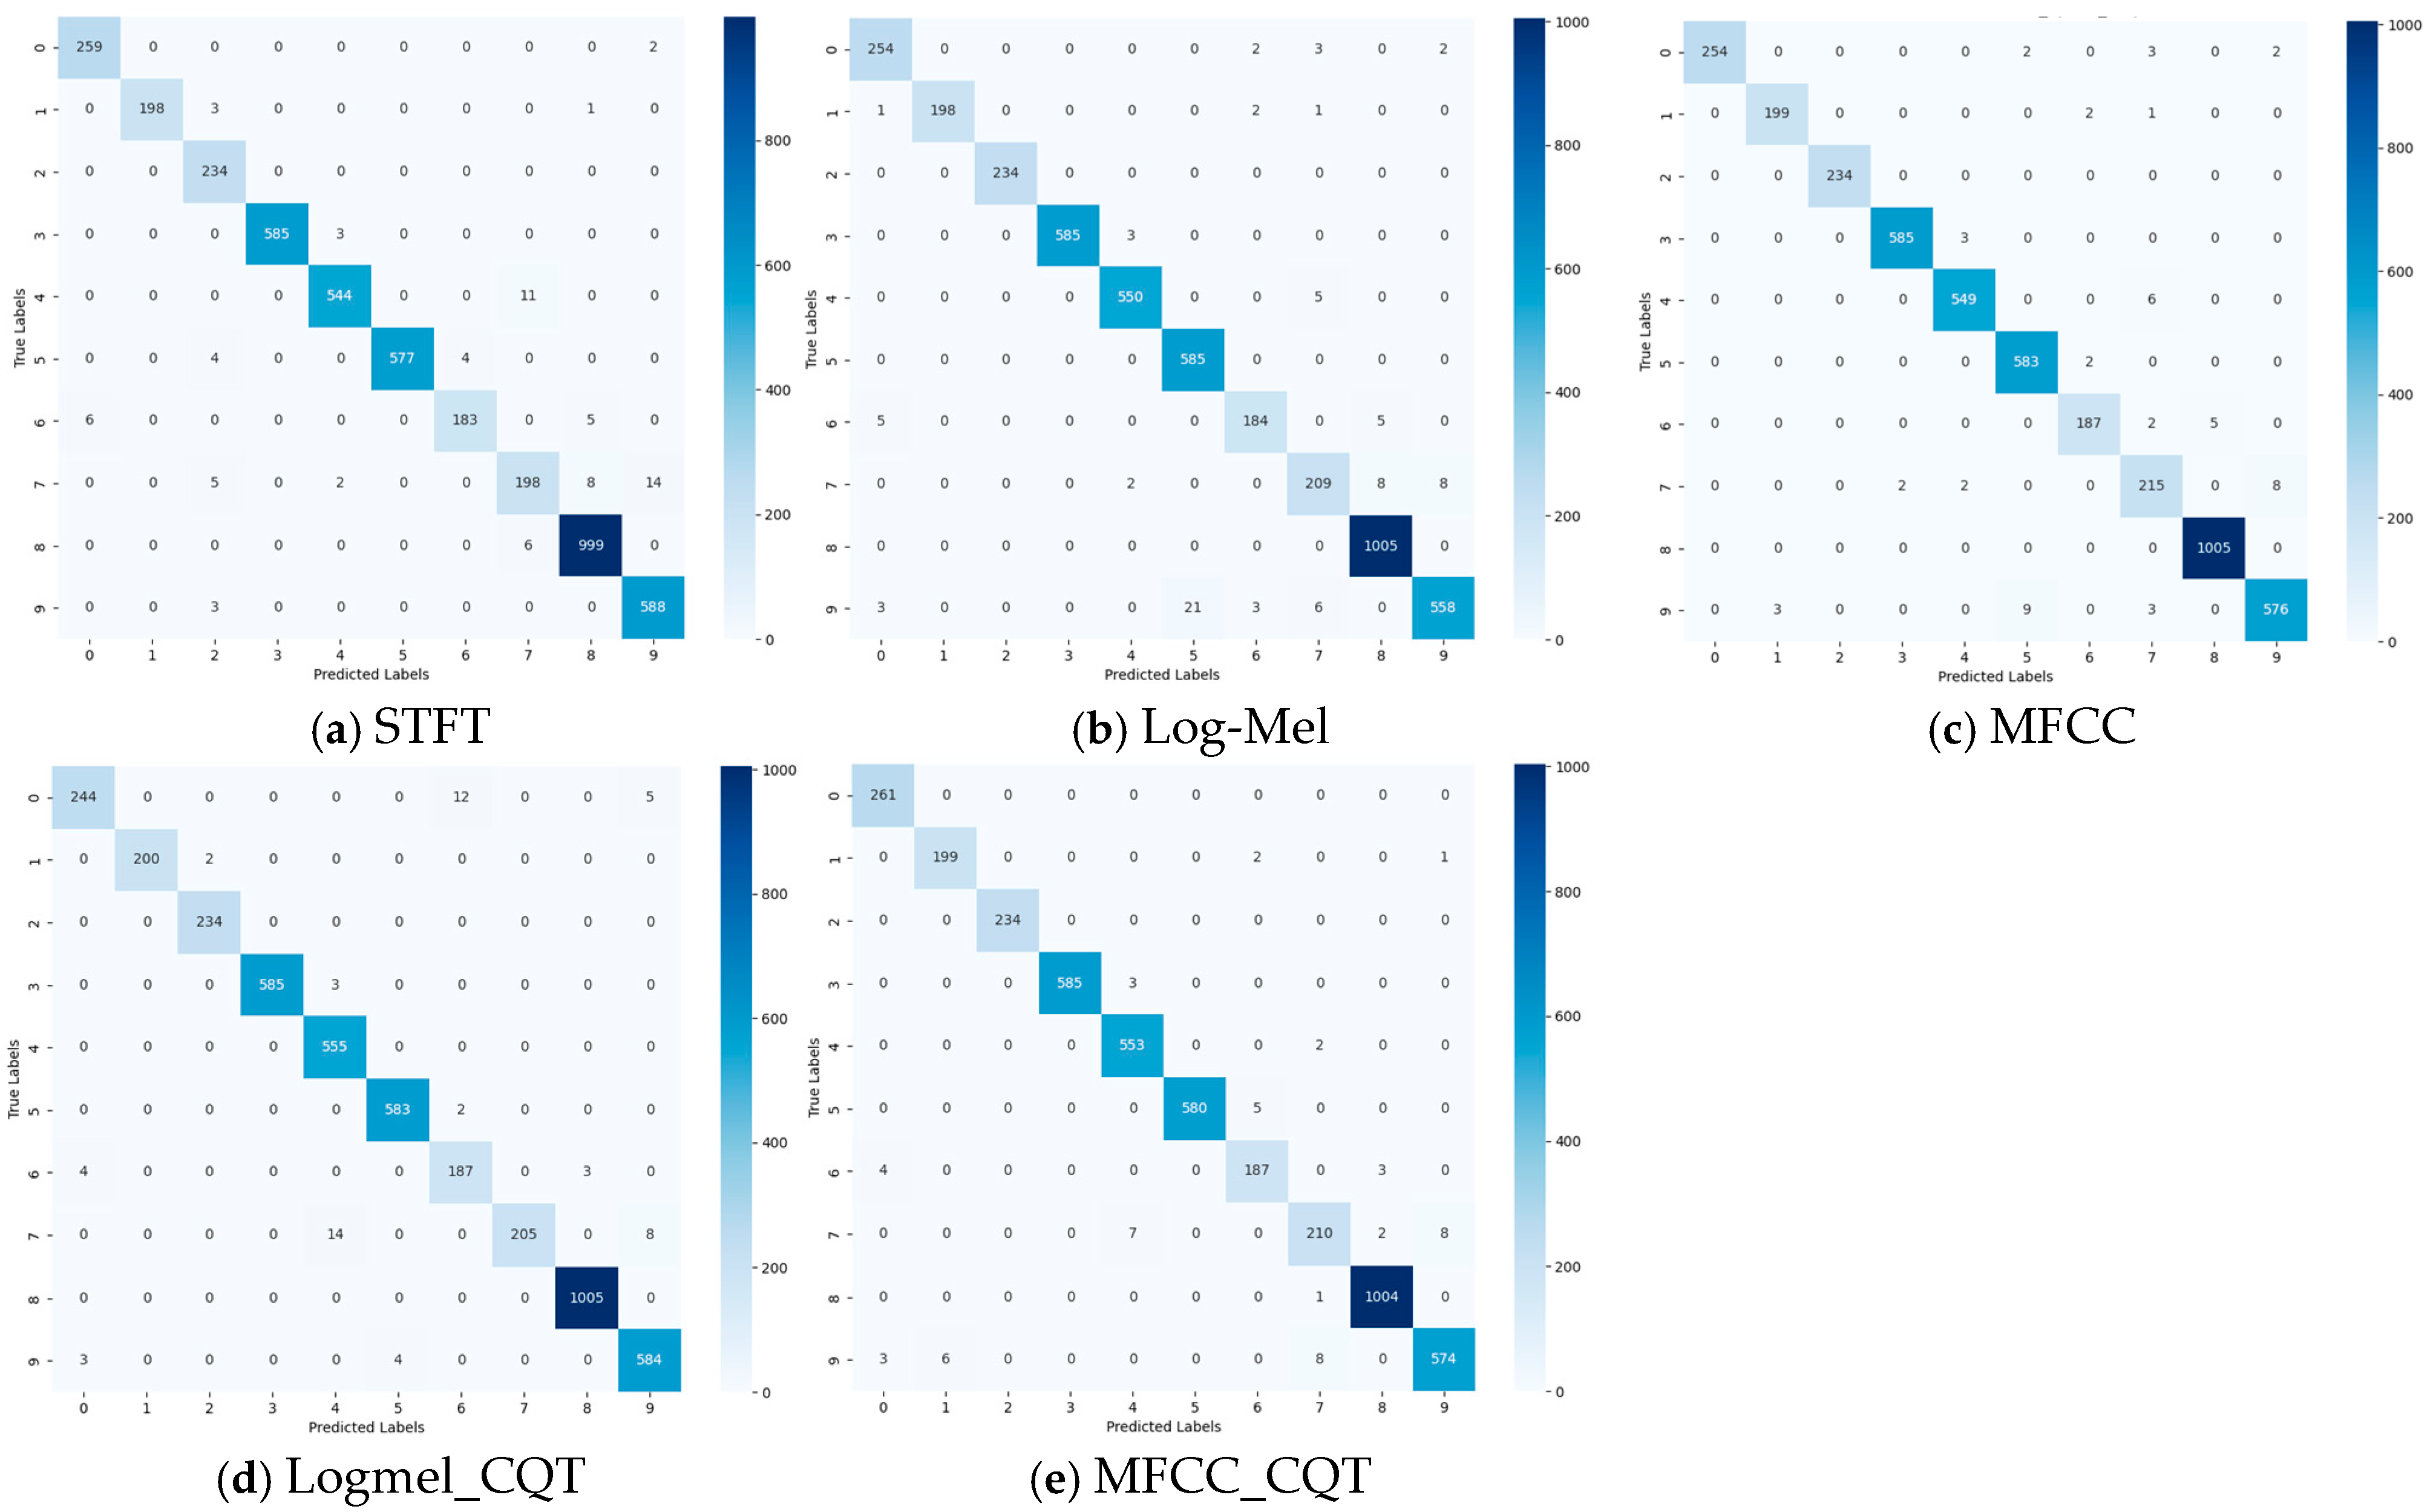
Comparison of Confusion Matrices for the Watkins Dataset
The confusion matrix for the Watkins dataset was calculated to evaluate the model’s classification performance across the distinct categories. Figure 18 illustrates the classification outcomes, with the x-axis (0–9) corresponding to ten marine mammal species, and the diagonal elements representing the count of accurately classified samples for each category. Compared to the three widely used features—STFT, Log-Mel, and MFCC—the two fusion features, Logmel_CQT and MFCC_CQT, demonstrate more balanced performance across all categories without any noticeable weaknesses. Overall, the fusion features provide the model with a more comprehensive and well-balanced inter-class representation. Therefore, employing a fusion feature strategy proves to be an effective approach to achieving more balanced enhancement in performance metrics such as accuracy, precision, recall, and F1 score.
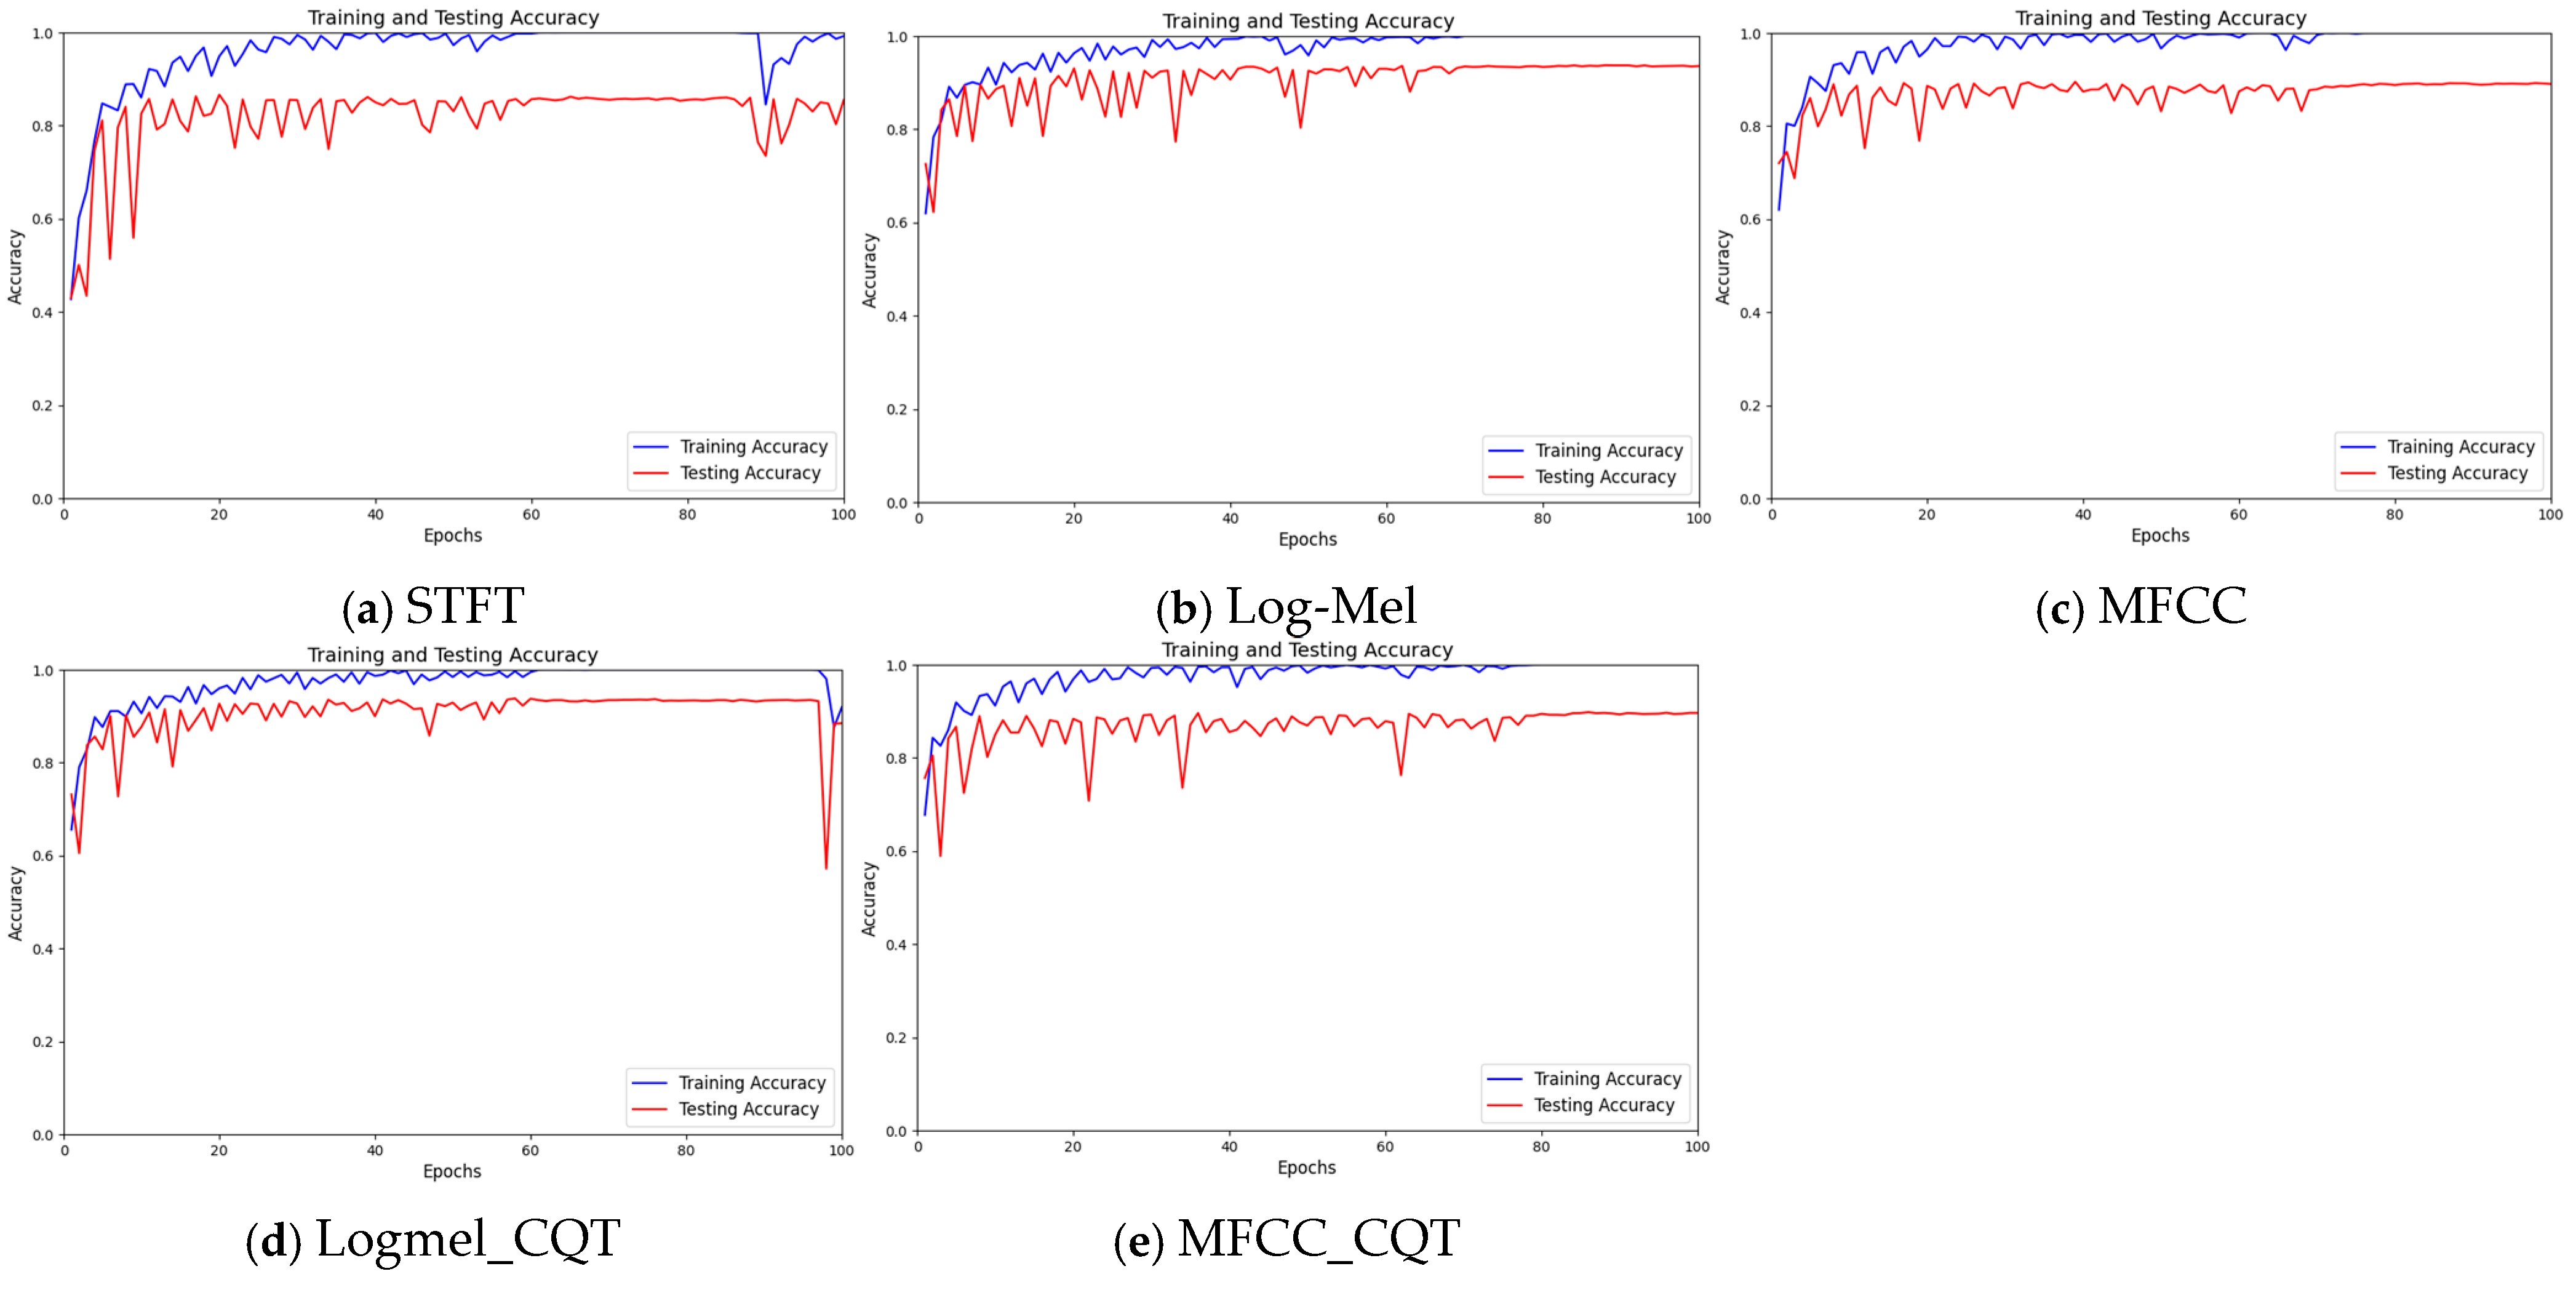
  • Comparison of Accuracy for the ChangLong Dataset
Figure 19 illustrates the experimental outcomes, where the highest recognition accuracies for STFT, Log-Mel, and MFCC are 86.65%, 93.74%, and 89.53%, respectively. Meanwhile, the proposed fusion features, Logmel_CQT and MFCC_CQT, achieve maximum recognition accuracies of 93.84% and 89.83%. These results indicate that incorporating CQT features into Log-Mel improves recognition accuracy by 0.1%, while integrating CQT with MFCC enhances accuracy by 0.3% on the ChangLong dataset.
2.
Comparison of the accuracy, precision, recall, and F1-score metrics for the ChangLong dataset
As illustrated in Figure 20, the fused feature Logmel_CQT demonstrates superior performance compared to Log-Mel, with improvements of 0.1% in accuracy, 3.37% in precision, 4.07% in recall, and 3.82% in F1-score, respectively. Similarly, the fused feature MFCC_CQT outperforms MFCC, achieving improvements of 0.3% in accuracy, 4.82% in precision, 4.61% in recall, and 4.74% in F1-score. These results indicate that the proposed fusion features effectively capture the underlying characteristics of the data, thereby improving the model’s classification performance. Furthermore, in the ChangLong dataset, Logmel_CQT exhibits an overall superior performance compared to MFCC_CQT.
3.
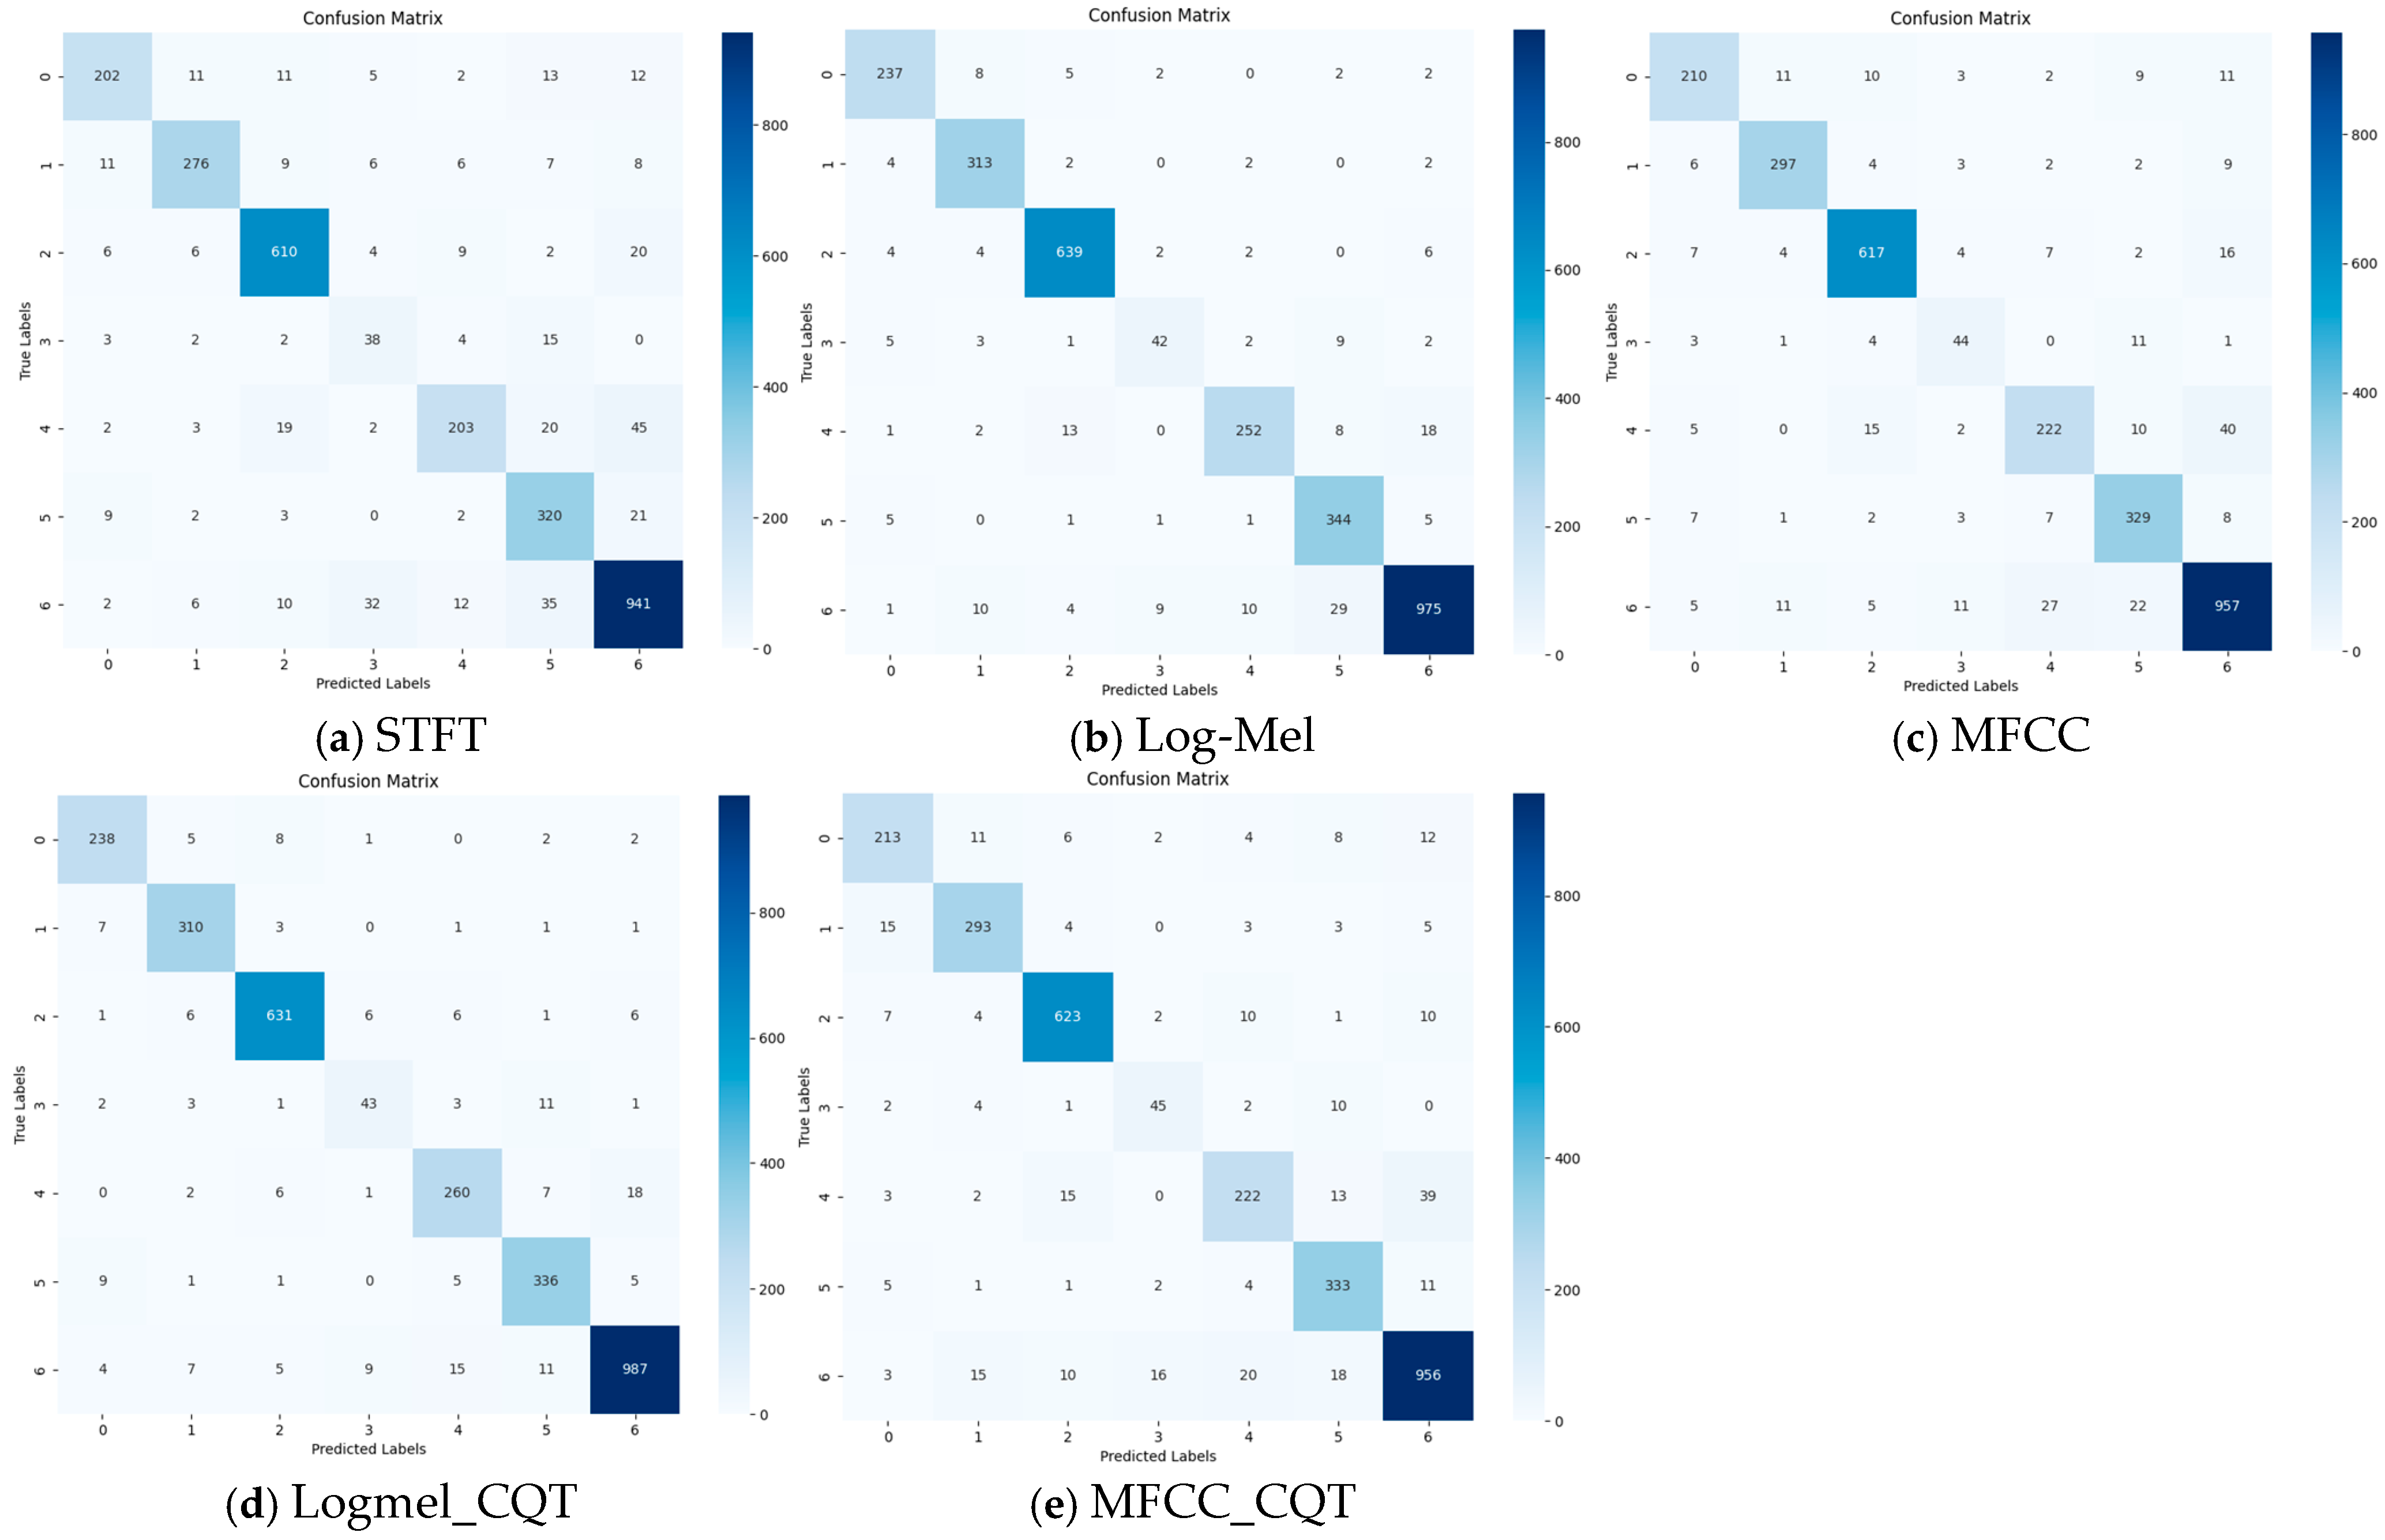
Comparison of confusion matrices for the ChangLong dataset
As shown in Figure 21, among the STFT, Log-Mel, and MFCC features, Log-Mel performs the best, followed by MFCC, while STFT shows the weakest performance. However, Log-Mel struggles with classification in categories 4 and 6; however, for the remaining categories, despite some misclassifications, its performance is relatively better. MFCC slightly outperforms Log-Mel in category 3, but in all other categories, it falls short compared to Log-Mel. Notably, the fused feature Logmel_CQT significantly improves classification performance in category 6 compared to Log-Mel alone. Overall, the fusion features demonstrate a well-balanced performance across all categories, enhancing both the accuracy and stability of the classification model.

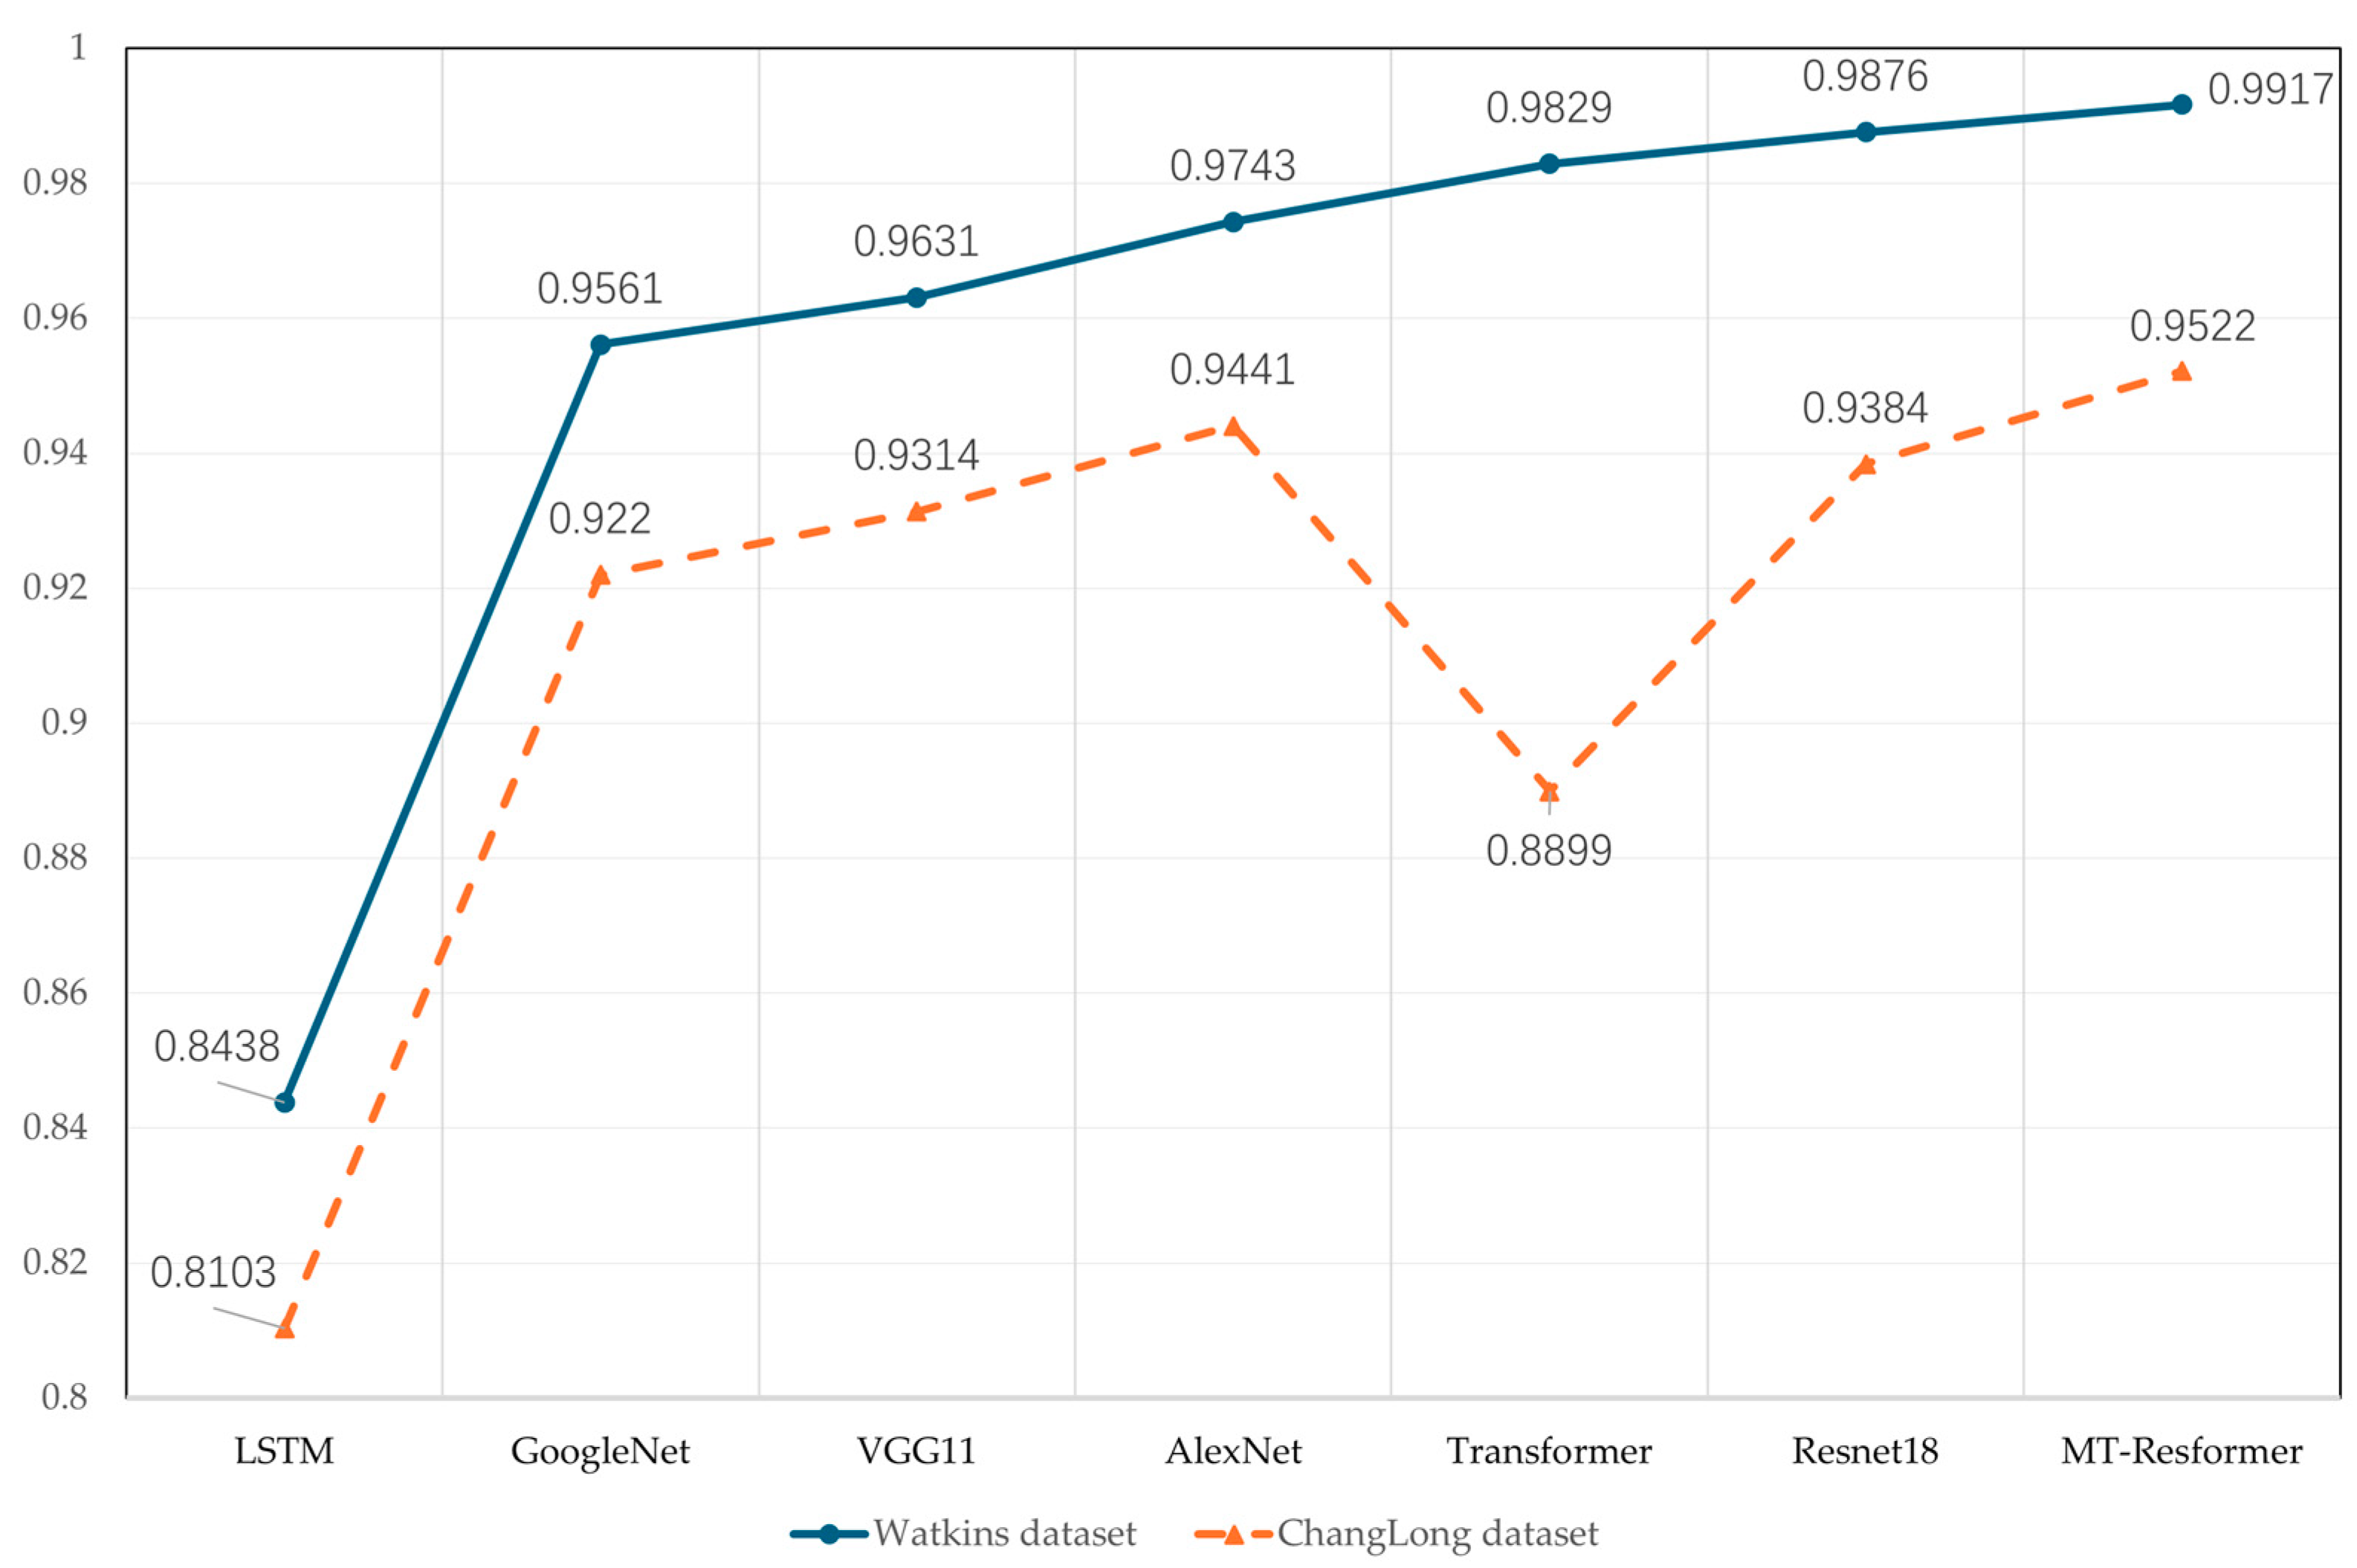
4.2. Comparison of Recognition Accuracy Across Various Neural Network Architectures

We compared the method proposed in this study with the work of other scholars in the same field, all of whom utilized datasets from the Watkins Marine Mammal Sound Database. As shown in Table 6, the comparison includes research teams, the number of classified categories, and the corresponding results. The findings indicate that the proposed method demonstrates excellent performance in marine mammal call classification. Our model not only recognizes a greater number of marine mammal categories than most existing models but also achieves high classification accuracy. Furthermore, it performs well in fine-grained marine mammal call classification tasks.
However, it is important to note that the accuracy of our model (99.17%) is slightly lower than that of the model proposed by Danyang Li’s team (99.39%), which is currently the state of the art in marine mammal acoustic classification. Compared to their approach, our method simplifies the feature extraction process and reduces model complexity. Although there is a slight decrease in accuracy, the trade-off remains within an acceptable range.
By comparing our research with studies from other scholars in the same field, we gained insights into the performance level of our proposed model in marine mammal call classification for species identification. To further evaluate the model’s adaptability to fine-grained marine mammal call classification tasks, we conducted experiments on the Watkins and ChangLong datasets. We compared our MT-Resformer model against several benchmark models, as shown in Figure 22, including LSTM [50], GoogleNet [51], VGG11 [52], AlexNet [53], Transformer [38], and ResNet18 [46].
As shown in Figure 22, all models exhibit a decline in accuracy when tackling finer-grained classification tasks. This is because fine-grained classification is inherently more challenging, with smaller differences between categories, placing higher demands on the model’s feature extraction and adaptability. The proposed MT-Resformer model, combined with the fusion features, achieves the best performance across different levels of granularity in marine mammal vocalization classification.

5. Conclusions

This paper introduces two fusion features, Logmel_CQT and MFCC_CQT, along with a multi-scale dual-channel model, MT-Resformer, designed specifically for marine mammal vocalization classification. Both fusion features share the same conceptual foundation: since the high-frequency components of marine mammal vocalizations contain rich details while commonly used features often lack expressiveness in these regions, we enhance high-frequency perception by integrating features that are more sensitive to high-frequency variations. To further improve feature extraction, the MT-Resformer model employs multi-scale parallel branches to capture more detailed and diverse features. It adopts a symmetric dual-channel architecture, consisting of a Transformer network with two stacked encoder layers and an MResNet network. The MResNet channel is responsible for capturing multi-scale fine-grained features, while the Transformer channel extracts global feature information, with both channels operating independently yet complementing each other. Finally, a multilayer perceptron (MLP) computes the channel weights to achieve dual-channel weight fusion. By integrating these fusion features with the multi-scale dual-channel architecture, the proposed approach demonstrates exceptional performance across various levels of granularity in marine mammal vocalization classification tasks.
By conducting comparative experiments on the Watkins and ChangLong datasets, this study demonstrates that the proposed feature fusion strategy can improve various model metrics in a balanced manner, enhancing the model’s overall performance in the task. Compared with research from other scholars in the same field, this method can recognize a wider variety of marine mammal vocalizations while maintaining a high level of accuracy. Additionally, through comparisons with other benchmark models in marine mammal vocalization classification tasks at different granularities, the MT-Resformer model exhibits strong adaptability to varying classification challenges.

Author Contributions

Conceptualization, Y.C.; methodology, X.L. and C.D.; validation, X.L.; formal analysis, X.C.; investigation, P.Z. and Z.L.; resources, G.D., P.Z. and Z.L.; data curation, G.D., P.Z. and Z.L.; writing—original draft, X.L.; writing—review and editing, C.D. and Y.C.; supervision, C.D. and G.D.; project administration, X.C. All authors have read and agreed to the published version of the manuscript.

Funding

This research was supported by Science and Technology Development Foundation of South China Sea Bureau, Ministry of Natural Resources (No. 220202), National Natural Science Foundation Young Scientist Fund Project under Grant 62201164, Guangdong Provincial Science and Technology Plan Project under Grant 2023A0505050097, National Key Research and Development Program of China (grant No. 2022YFF130160X). This work was supported by the National Natural Science Foundation of China under Grant 42227901.

Data Availability Statement

The marine mammal vocalization data used in this study come from the publicly available Watkins Marine Mammal Sound Database and dolphin calls collected at Chimelong Ocean Kingdom. For specific dataset information and source code, please contact Chao Dong.

Conflicts of Interest

Authors Guixin Dong, Peng Zhang and Zhanwei Li were employed by the company Chimelong Group Co. The remaining authors declare that the research was conducted in the absence of any commercial or financial relationships that could be construed as a potential conflict of interest.

References

  1. O’Hara, C.C.; Frazier, M.; Halpern, B.S. At-Risk Marine Biodiversity Faces Extensive, Expanding, and Intensifying Human Impacts. Science 2021, 372, 84–87. [Google Scholar] [CrossRef]
  2. Brando, S.; Broom, D.M.; Acasuso-Rivero, C.; Clark, F. Optimal Marine Mammal Welfare under Human Care: Current Efforts and Future Directions. Behav. Process. 2018, 156, 16–36. [Google Scholar] [CrossRef] [PubMed]
  3. Verfuss, U.K.; Gillespie, D.; Gordon, J.; Marques, T.A.; Miller, B.; Plunkett, R.; Theriault, J.A.; Tollit, D.J.; Zitterbart, D.P.; Hubert, P. Comparing Methods Suitable for Monitoring Marine Mammals in Low Visibility Conditions during Seismic Surveys. Mar. Pollut. Bull. 2018, 126, 1–18. [Google Scholar] [CrossRef] [PubMed]
  4. Ramaiah, V.S.; Rao, R.R. Multi-Speaker Activity Detection Using Zero Crossing Rate. In Proceedings of the 2016 International Conference on Communication and Signal Processing (ICCSP), Melmaruvathur, India, 6–8 April 2016; pp. 23–26. [Google Scholar]
  5. Shannon, B.J.; Paliwal, K.K. Feature Extraction from Higher-Lag Autocorrelation Coefficients for Robust Speech Recognition. Speech Commun. 2006, 48, 1458–1485. [Google Scholar] [CrossRef]
  6. Caetano, M.; Rodet, X. Improved Estimation of the Amplitude Envelope of Time-Domain Signals Using True Envelope Cepstral Smoothing. In Proceedings of the 2011 IEEE International Conference on Acoustics, Speech and Signal Processing (ICASSP), Prague, Czech Republic, 22–27 May 2011; pp. 4244–4247. [Google Scholar]
  7. Yang, S.; Jin, A.; Zeng, X.; Wang, H.; Hong, X.; Lei, M. Underwater Acoustic Target Recognition Based on Sub-Band Concatenated Mel Spectrogram and Multidomain Attention Mechanism. Eng. Appl. Artif. Intell. 2024, 133, 107983. [Google Scholar] [CrossRef]
  8. Ancilin, J.; Milton, A. Improved Speech Emotion Recognition with Mel Frequency Magnitude Coefficient. Appl. Acoust. 2021, 179, 108046. [Google Scholar] [CrossRef]
  9. Jeevan, M.; Dhingra, A.; Hanmandlu, M.; Panigrahi, B.K. Robust Speaker Verification Using GFCC Based I-Vectors. In Proceedings of the International Conference on Signal, Networks, Computing, and Systems; Lobiyal, D.K., Mohapatra, D.P., Nagar, A., Sahoo, M.N., Eds.; Lecture Notes in Electrical Engineering; Springer: New Delhi, India, 2017; Volume 395, pp. 85–91. ISBN 978-81-322-3590-3. [Google Scholar]
  10. Li, J.; Wang, B.; Cui, X.; Li, S.; Liu, J. Underwater Acoustic Target Recognition Based on Attention Residual Network. Entropy 2022, 24, 1657. [Google Scholar] [CrossRef]
  11. Aksenovich, T.V. Comparison of the Use of Wavelet Transform and Short-Time Fourier Transform for the Study of Geomagnetically Induced Current in the Autotransformer Neutral. In Proceedings of the 2020 International Multi-Conference on Industrial Engineering and Modern Technologies (FarEastCon), Vladivostok, Russky Island, 6–7 October 2020; IEEE: Piscataway, NJ, USA, 2020; pp. 1–5. [Google Scholar]
  12. Tohidypour, R.H.; Seyyedsalehi, S.A.; Behbood, H. Comparison between Wavelet Packet Transform, Bark Wavelet & MFCC for Robust Speech Recognition Tasks. In Proceedings of the 2010 The 2nd International Conference on Industrial Mechatronics and Automation, Wuhan, China, 30–31 May 2010; IEEE: Piscataway, NJ, USA, 2010; Volume 2, pp. 329–332. [Google Scholar]
  13. Esfahanian, M.; Erdol, N.; Gerstein, E.; Zhuang, H. Two-Stage Detection of North Atlantic Right Whale Upcalls Using Local Binary Patterns and Machine Learning Algorithms. Appl. Acoust. 2017, 120, 158–166. [Google Scholar] [CrossRef]
  14. Shen, W.; Tu, D.; Yin, Y.; Bao, J. A New Fusion Feature Based on Convolutional Neural Network for Pig Cough Recognition in Field Situations. Inf. Process. Agric. 2021, 8, 573–580. [Google Scholar] [CrossRef]
  15. Pentapati, H.; Vasamsetti, S.; Tenneti, M. MFCC for Voiced Part Using VAD and GMM Based Gender Recognition. Adv. Model. Anal. B 2017, 60, 581–592. [Google Scholar] [CrossRef]
  16. Ibrahim, A.K.; Zhuang, H.; Chérubin, L.M.; Schärer-Umpierre, M.T.; Erdol, N. Automatic Classification of Grouper Species by Their Sounds Using Deep Neural Networks. J. Acoust. Soc. Am. 2018, 144, EL196–EL202. [Google Scholar] [CrossRef] [PubMed]
  17. Trawicki, M.B. Multispecies Discrimination of Whales (Cetaceans) Using Hidden Markov Models (HMMS). Ecol. Inform. 2021, 61, 101223. [Google Scholar] [CrossRef]
  18. Mishachandar, B.; Vairamuthu, S. Diverse Ocean Noise Classification Using Deep Learning. Appl. Acoust. 2021, 181, 108141. [Google Scholar] [CrossRef]
  19. Lu, T.; Han, B.; Yu, F. Detection and Classification of Marine Mammal Sounds Using AlexNet with Transfer Learning. Ecol. Inform. 2021, 62, 101277. [Google Scholar] [CrossRef]
  20. Murphy, D.T.; Ioup, E.; Hoque, M.T.; Abdelguerfi, M. Residual Learning for Marine Mammal Classification. IEEE Access 2022, 10, 118409–118418. [Google Scholar] [CrossRef]
  21. Maldini, S.; Giovanni, S. Adaptative and Automatic Manatee Vocalization Detection Using Transformers. Master’s Thesis, Universidad de Chile, Santiago, Chile, 2024. [Google Scholar]
  22. Padovese, B.; Frazao, F.; Kirsebom, O.S.; Matwin, S. Data augmentation for the classification of North Atlantic right whales upcalls. J. Acoust. Soc. Am. 2021, 149, 2520–2530. [Google Scholar] [CrossRef]
  23. Duan, D.; Lü, L.; Jiang, Y.; Liu, Z.; Yang, C.; Guo, J.; Wang, X. Real-Time Identification of Marine Mammal Calls Based on Convolutional Neural Networks. Appl. Acoust. 2022, 192, 108755. [Google Scholar] [CrossRef]
  24. Luo, W.; Yang, W.; Zhang, Y. Convolutional neural network for detecting odontocete echolocation clicks. J. Acoust. Soc. Am. 2019, 145, EL7–EL12. [Google Scholar] [CrossRef]
  25. Luís, A.R.; May-Collado, L.J.; Rako-Gospić, N.; Gridley, T.; Papale, E.; Azevedo, A.; Silva, M.A.; Buscaino, G.; Herzing, D.; Dos Santos, M.E. Vocal Universals and Geographic Variations in the Acoustic Repertoire of the Common Bottlenose Dolphin. Sci. Rep. 2021, 11, 11847. [Google Scholar] [CrossRef]
  26. Scaradozzi, D.; De Marco, R.; Veli, D.L.; Lucchetti, A.; Screpanti, L.; Di Nardo, F. Convolutional Neural Networks for Enhancing Detection of Dolphin Whistles in a Dense Acoustic Environment. IEEE Access 2024, 12, 127141–127148. [Google Scholar] [CrossRef]
  27. Frainer, G.; Dufourq, E.; Fearey, J.; Dines, S.; Probert, R.; Elwen, S.; Gridley, T. Automatic Detection and Taxonomic Identification of Dolphin Vocalisations Using Convolutional Neural Networks for Passive Acoustic Monitoring. Ecol. Inform. 2023, 78, 102291. [Google Scholar] [CrossRef]
  28. Jensen, F.H.; Wolters, P.; Van Zeeland, L.; Morrison, E.; Ermi, G.; Smith, S.; Tyack, P.L.; Wells, R.S.; McKennoch, S.; Janik, V.M.; et al. Automatic Deep-Learning-Based Classification of Bottlenose Dolphin Signature Whistles. In The Effects of Noise on Aquatic Life; Popper, A.N., Sisneros, J.A., Hawkins, A.D., Thomsen, F., Eds.; Springer International Publishing: Cham, Switzerland, 2024; pp. 2059–2070. ISBN 978-3-031-50255-2. [Google Scholar]
  29. Liu, F.; Shen, T.; Luo, Z.; Zhao, D.; Guo, S. Underwater Target Recognition Using Convolutional Recurrent Neural Networks with 3-D Mel-Spectrogram and Data Augmentation. Appl. Acoust. 2021, 178, 107989. [Google Scholar] [CrossRef]
  30. Tiwari, V. MFCC and Its Applications in Speaker Recognition. Int. J. Emerg. Technol. 2010, 1, 19–22. [Google Scholar]
  31. Sheng, L.; Huang, D.-Y.; Pavlovskiy, E.N. High-Quality Speech Synthesis Using Super-Resolution Mel-Spectrogram. arXiv 2019, arXiv:1912.01167. [Google Scholar]
  32. Singh, P.; Waldekar, S.; Sahidullah, M.; Saha, G. Analysis of Constant-Q Filterbank Based Representations for Speech Emotion Recognition. Digit. Signal Process. 2022, 130, 103712. [Google Scholar] [CrossRef]
  33. Huzaifah, M. Comparison of Time-Frequency Representations for Environmental Sound Classification Using Convolutional Neural Networks. arXiv 2017, arXiv:1706.07156. [Google Scholar]
  34. Yu, Y.; Zhu, W.; Ma, X.; Du, J.; Liu, Y.; Gan, L.; An, X.; Li, H.; Wang, B.; Fu, X. Recognition of Sheep Feeding Behavior in Sheepfolds Using Fusion Spectrogram Depth Features and Acoustic Features. Animals 2024, 14, 3267. [Google Scholar] [CrossRef]
  35. Trapanotto, M.; Nanni, L.; Brahnam, S.; Guo, X. Convolutional Neural Networks for the Identification of African Lions from Individual Vocalizations. J. Imaging 2022, 8, 96. [Google Scholar] [CrossRef]
  36. Du, Z.; Xu, X.; Bai, Z.; Liu, X.; Hu, Y.; Li, W.; Wang, C.; Li, D. Feature Fusion Strategy and Improved GhostNet for Accurate Recognition of Fish Feeding Behavior. Comput. Electron. Agric. 2023, 214, 108310. [Google Scholar] [CrossRef]
  37. Licciardi, A.; Carbone, D. WhaleNet: A Novel Deep Learning Architecture for Marine Mammals Vocalizations on Watkins Marine Mammal Sound Database. IEEE Access 2024, 12, 154182–154194. [Google Scholar] [CrossRef]
  38. Vaswani, A.; Shazeer, N.; Parmar, N.; Uszkoreit, J.; Jones, L.; Gomez, A.N.; Kaiser, Ł.; Polosukhin, I. Attention Is All You Need. arXiv 2017, arXiv:1706.03762. [Google Scholar]
  39. Sayigh, L.; Daher, M.A.; Allen, J.; Gordon, H.; Joyce, K.; Stuhlmann, C.; Tyack, P. The Watkins Marine Mammal Sound Database: An Online, Freely Accessible Resource. Proc. Meet. Acoust. 2017, 27, 040013. [Google Scholar]
  40. Gallo, A.; De Moura Lima, A.; Böye, M.; Hausberger, M.; Lemasson, A. Study of Repertoire Use Reveals Unexpected Context-Dependent Vocalizations in Bottlenose Dolphins (Tursiops truncatus). Sci. Nat. 2023, 110, 56. [Google Scholar] [CrossRef] [PubMed]
  41. Jones, B.; Zapetis, M.; Samuelson, M.M.; Ridgway, S. Sounds Produced by Bottlenose Dolphins (Tursiops): A Review of the Defining Characteristics and Acoustic Criteria of the Dolphin Vocal Repertoire. Bioacoustics 2020, 29, 399–440. [Google Scholar] [CrossRef]
  42. Fripp, D.; Owen, C.; Quintana-Rizzo, E.; Shapiro, A.; Buckstaff, K.; Jankowski, K.; Wells, R.; Tyack, P. Bottlenose Dolphin (Tursiops truncatus) Calves Appear to Model Their Signature Whistles on the Signature Whistles of Community Members. Anim. Cogn. 2005, 8, 17. [Google Scholar] [CrossRef]
  43. Sayigh, L.S.; El Haddad, N.; Tyack, P.L.; Janik, V.M.; Wells, R.S.; Jensen, F.H. Bottlenose Dolphin Mothers Modify Signature Whistles in the Presence of Their Own Calves. Proc. Natl. Acad. Sci. USA 2023, 120, e2300262120. [Google Scholar] [CrossRef]
  44. Jones, B.; Sportelli, J.; Karnowski, J.; McClain, A.; Cardoso, D.; Du, M. Dolphin Health Classifications from Whistle Features. J. Mar. Sci. Eng. 2024, 12, 2158. [Google Scholar] [CrossRef]
  45. Díaz López, B. Context-Dependent and Seasonal Fluctuation in Bottlenose Dolphin (Tursiops truncatus) Vocalizations. Anim. Cogn. 2022, 25, 1381–1392. [Google Scholar] [CrossRef]
  46. He, K.; Zhang, X.; Ren, S.; Sun, J. Deep Residual Learning for Image Recognition. In Proceedings of the IEEE Conference on Computer Vision and Pattern Recognition, Las Vegas, NV, USA, 27–30 June 2016; pp. 770–778. [Google Scholar]
  47. Qi, P.; Yin, G.; Zhang, L. Underwater Acoustic Target Recognition Using RCRNN and Wavelet-Auditory Feature. Multimed. Tools Appl. 2024, 83, 47295–47317. [Google Scholar] [CrossRef]
  48. Li, D.; Liao, J.; Jiang, H.; Jiang, K.; Chen, M.; Zhou, B.; Pu, H.; Li, J. A Classification Method of Marine Mammal Calls Based on Two-Channel Fusion Network. Appl. Intell. 2024, 54, 3017–3039. [Google Scholar] [CrossRef]
  49. González-Hernández, F.R.; Sánchez-Fernández, L.P.; Suárez-Guerra, S.; Sánchez-Pérez, L.A. Marine Mammal Sound Classification Based on a Parallel Recognition Model and Octave Analysis. Appl. Acoust. 2017, 119, 17–28. [Google Scholar] [CrossRef]
  50. Ertam, F. An Effective Gender Recognition Approach Using Voice Data via Deeper LSTM Networks. Appl. Acoust. 2019, 156, 351–358. [Google Scholar] [CrossRef]
  51. Szegedy, C.; Liu, W.; Jia, Y.; Sermanet, P.; Reed, S.; Anguelov, D.; Erhan, D.; Vanhoucke, V.; Rabinovich, A. Going Deeper with Convolutions. In Proceedings of the 2015 IEEE Conference on Computer Vision and Pattern Recognition (CVPR), Boston, MA, USA, 7–12 June 2015; IEEE: Piscataway, NJ, USA, 2015; pp. 1–9. [Google Scholar]
  52. Simonyan, K.; Zisserman, A. Very Deep Convolutional Networks for Large-Scale Image Recognition. arXiv 2014, arXiv:1409.1556. [Google Scholar]
  53. Krizhevsky, A.; Sutskever, I.; Hinton, G.E. ImageNet Classification with Deep Convolutional Neural Networks. In Advances in Neural Information Processing Systems; Curran Associates, Inc.: Red Hook, NY, USA, 2012; Volume 25. [Google Scholar]
Figure 1. The MT-Resformer framework follows a structured design, consisting of audio preprocessing, feature extraction and fusion, as well as model training and classification stages.
Jmse 13 00944 g001
Figure 2. The detailed steps for extracting STFT, Log-Mel, and MFCC features are as follows: blue boxes represent operations, while green boxes denote the extracted two-dimensional features.
Jmse 13 00944 g002
Figure 3. The detailed steps for extracting CQT features are as follows: blue boxes represent operations, while green boxes indicate the extracted two-dimensional DCT features.
Jmse 13 00944 g003
Figure 4. Log−Mel spectrograms of (ae) five whale species, including the LFP whale (long−finned pilot whale), and (fj) five dolphin species, including the A−Spotted Dolphin (Atlantic spotted dolphin) and P−Spotted Dolphin (Pantropical spotted dolphin).
Jmse 13 00944 g004
Figure 5. Channel fusion of MFCC and CQT features.
Jmse 13 00944 g005
Figure 6. Channel fusion of Log_mel and CQT features.
Jmse 13 00944 g006
Figure 7. (a,b) Multi-scale Log-Mel spectrogram. The green box highlights the main signal.
Jmse 13 00944 g007
Figure 8. (a) The orange box highlights the main signal, while the green box indicates the click sound. (b) The orange box highlights the main signal, while the green box represents multi-frequency aliasing.
Jmse 13 00944 g008
Figure 9. Performance of different convolutional kernel sizes in dolphin call classification. Green boxes of different sizes represent receptive fields of different scales.
Jmse 13 00944 g009
Figure 10. The Multi-Scale Parallel Feature Extraction Block extracts features from three branches, with one branch utilizing a residual skip connection. Finally, the outputs are fused and compressed through channel integration.
Jmse 13 00944 g010
Figure 11. The structure of the Transformer network, including the encoder and decoder architecture.
Jmse 13 00944 g011
Figure 12. MT-Resformer model architecture. (a) dual-channel feature extraction structure; (b) dual-channel fusion process.
Jmse 13 00944 g012
Figure 13. Seven types of dolphin vocalizations in the ChangLong dataset (a) cv. (b) dc. (c) dw. (d) ff. (e) sin. (f) up. (g) vx. (cv: Concave, dc: Double Concave, dw: Down Sweep, ff: Constant, sin: Sine, up: Up Sweep, vx: Convex).
Jmse 13 00944 g013
Figure 14. The classification results of the Watkins dataset, after applying the model, are shown as follows: (a) loss curve, (b) accuracy curve, and (c) confusion matrix. The confusion matrix represents classification results using labels (0–9), with color intensity indicating the quantity distribution for each category.
Jmse 13 00944 g014
Figure 15. The classification results of the ChangLong dataset, after applying the model, are shown as follows: (a) loss curve, (b) accuracy curve, and (c) confusion matrix. The confusion matrix represents classification results using labels (0–6), with color intensity indicating the quantity distribution for each category.
Jmse 13 00944 g015
Figure 16. Recognition accuracy of the Watkins dataset based on ResNet-18 using different feature extraction methods: (a) STFT, (b) Log-Mel, (c) MFCC, (d) Logmel_CQT, and (e) MFCC_CQT.
Jmse 13 00944 g016
Figure 17. A comparative analysis of accuracy, precision, recall, and F1-score for STFT, Log-Mel, MFCC, Logmel_CQT, and MFCC_CQT features utilizing the ResNet18 network on the Watkins dataset.
Jmse 13 00944 g017
Figure 18. A comparison of classification performance for five feature extraction methods on the Watkins dataset using ResNet18: STFT, Log-Mel, MFCC, Logmel_CQT, and MFCC_CQT. Each panel displays the confusion matrix corresponding to a specific method: (a) STFT, (b) Log-Mel, (c) MFCC, (d) Logmel_CQT, and (e) MFCC_CQT. The matrices use labels (0–9) to represent the classification results, with the color intensity indicating the volume of predictions made.
Jmse 13 00944 g018
Figure 19. Recognition accuracy of the ChangLong dataset based on ResNet-18 using different feature extraction methods: (a) STFT, (b) Log-Mel, (c) MFCC, (d) Logmel_CQT, and (e) MFCC_CQT.
Jmse 13 00944 g019
Figure 20. A comparison of the STFT, Log-Mel, MFCC, Logmel_CQT, and MFCC_CQT features in terms of accuracy, precision, recall, and F1 score, based on the ResNet18 network using the ChangLong dataset.
Jmse 13 00944 g020
Figure 21. A comparison of classification performance for five feature extraction methods on the Watkins dataset using ResNet18: STFT, Log-Mel, MFCC, Logmel_CQT, and MFCC_CQT. The confusion matrices, labeled (ae) for each method, use labels (0–6) to indicate classification results, with color intensity representing the quantity of predictions.
Jmse 13 00944 g021
Figure 22. Multi-model comparative experiment on Watkins and ChangLong datasets (LSTM, GoogLeNet, VGG11, AlexNet, Transformer, ResNet18, and MT-Resformer).
Jmse 13 00944 g022
Table 1. Sample classification of Watkins dataset.
CategoryTotal NumberTrain Set SizeTest Set Size
Beluga758531227
Atlantic spotted dolphin676474202
Pantropic spotted dolphin647453194
Fraser dolphin19521367585
Bowhead whale18501295555
Killer whale335023451005
Clemene dolphin872611261
Bottlenose dolphin782548234
Longfin pilot whale19701379591
Humpbackwhale19621374588
Table 2. Sample classification of ChangLong dataset.
CategoryTotal NumberTrain Set SizeTest Set Size
Concave854598256
Double Concave1079756323
Down Sweep21931536657
Constant21515164
Sine983689294
Up Sweep1193836357
Convex346324251038
Table 3. Feature dimension details.
FeatureDimensionalityFeatureDimensionality
MFCC(20, 300)Log-Mel(60, 300)
CQT(30, 300)CQT(30, 300)
MFCC_CQT(50, 300)Logmel_CQT(90, 300)
Table 4. Multi-scale dual-channel model (Input: MFCC_CQT(50,300)).
MResnetLayerOutput Shape
Input(None, 50, 300)
Conv_1(None, 128, 300)
Avg_pool(None, 128, 150)
Conv_2(None, 256, 150)
Max_pool(None, 256, 75)
Conv_3(None, 128, 75)
Avg_pool(None, 128, 37)
Global_avg_pool(None, 128, 1)
Flatten(None, 128)
TransformerInput(None, 50, 300)
Transposition(None, 300, 50)
Embedded(None, 300, 128)
Encodded 1(None, 300, 128)
Encodded 2(None, 300, 128)
Last time step(None, 128)
FusionConcatenation(None, 256)
Weighted fusion(None, 128)
ClassificationFull connect 1(None, 128)
Full connect 2(None, 10)
Table 5. Parameters used in network training.
Parameter NameParameter Setting
Epochs100
OptimizerAdam
MetricAccuracy
ActivationReLU
Batch size64
LossCategorical_crossentropy
Table 6. Accuracy comparison of different recognition network models.
StudyNumber of ClassesAccuracy
Danyang Li et al. [48]9 classes99.39%
Tao Lu et al. [19]3 classes97.42%
Dexin Duan et al. [23]3 classes91.28%
Fernando RubénGonzález-Hernández et al. [49]11 classes90.00%
Marek B. Trawicki. [17]9 classes82.72%
Our work10 classes99.17%
Disclaimer/Publisher’s Note: The statements, opinions and data contained in all publications are solely those of the individual author(s) and contributor(s) and not of MDPI and/or the editor(s). MDPI and/or the editor(s) disclaim responsibility for any injury to people or property resulting from any ideas, methods, instructions or products referred to in the content.

