Article

Risk Assessment Method for Flooding Incident Emergency Operating Procedure Considering Mutual Dependence Between Human Error and Available Time

School of Reliability and Systems Engineering, Beihang University, Beijing 100191, China
*
Author to whom correspondence should be addressed.
J. Mar. Sci. Eng. 2025, 13(5), 853; https://doi.org/10.3390/jmse13050853
Submission received: 19 March 2025 / Revised: 17 April 2025 / Accepted: 20 April 2025 / Published: 25 April 2025
(This article belongs to the Section Ocean Engineering)

Abstract

:
An emergency operating procedure (EOP) for flooding incidents is used to assist crews in preventing ships from capsizing. However, under a flooding scenario, failure to complete the EOP within a limited time may result in the risk of capsizing. Human performance is the major factor in the EOP execution process, which is influenced by available time. There is a mutual dependence between human error and available time: (a) shorter available time will increase time pressure and the human error probability (HEP); (b) human error will either be recovered, which may require more response time and result in shortened available time, or be uncorrected, which may worsen the system state and reduce the time limitation, thereby shortening the available time. This mutual dependence can affect EOP risk, which is not considered in current studies. This paper proposes a method based on a Dynamic Bayesian Network (DBN) to assess EOP risk considering this mutual dependence. To model the mutual dependence, a continuous SPAR-H method is proposed in the intra-slice network to determine the conditional probability distribution of human error for dependence (a), and a dynamic available time model is proposed in the inter-slice network to determine the conditional probability distribution of available time for dependence (b). The Ro-Ro flooding incident is used to illustrate the proposed method.

1. Introduction

Flooding is one of the largest contributors to marine accidents, accounting for 23% of all casualties between 2014 and 2020 [1,2]. In order to ensure the rapid and effective implementation of emergency response actions in flooding incidents, an emergency operating procedure (EOP) is usually pre-established. The EOP makes prearrangements for emergency personnel, equipment, actions, etc. [3], which can guide crew members to prevent the escalation of flood incidents and mitigate the consequences of such accidents. However, time is limited when implementing the EOP for flooding incidents, usually between 20 and 30 min [4,5]. As the flooding time increases, the water will create a large free surface inside the ship, which can significantly affect the stability of the vessel and cause it to list [6]. Therefore, failure to complete the EOP within the limited time may lead to serious financial loss and casualties [7]. For example, in the MV Estonia accident, the crew failed to complete the EOP within the limited time, resulting in 852 fatalities [4]. In the Sewol accident, the captain made inappropriate decisions and failed to promptly implement the EOP, ultimately causing the Ro-Ro passenger ship to capsize within 18 min [6]. As a result, it is important to incorporate the limited time into the risk assessment of an EOP for flooding incidents.
In the execution of an EOP for flooding incidents, human error is a significant contributor to EOP failure [8,9]. When human error occurs, personnel may spend additional recovery time (e.g., when personnel open the wrong emergency bilge valve, they need to spend additional time closing the wrong valve and opening the correct one), or the error may not be recovered in time, which can result in the ineffectiveness of the necessary emergency functions, thereby worsening the system state and decreasing the time limitation for EOP execution (e.g., failure to open the emergency pump may reduce the outflow velocity, thus accelerating the ship’s capsizing). The increased personnel response time and the decreased time limitation can dynamically shorten the available time for subsequent tasks, thereby increasing the time pressure on personnel. Time pressure is a significant factor influencing human error, as it can facilitate the occurrence of mistakes. In some human reliability methods such as the Cognitive Reliability and Error Analysis Method [10,11,12,13] and the Standardized Plant Analysis of Risk–Human Reliability Analysis (SPAR-H) [14,15], it is considered as one of the performance shaping factors (PSFs). Time pressure will become greater as the available time decreases, which in turn increases the human error probability (HEP). Therefore, there is a mutual dependence between human error and available time: (a) shorter available time may increase time pressure and thus increase the occurrence probability of human error; (b) human error may increase the response time or shorten the time limitation, thereby shortening the available time for subsequent tasks. This mutual dependence can cyclically increase the EOP risk and should be incorporated into the risk assessment of flooding incident EOPs.
Currently, the assessment of EOPs has been widely studied. Some studies have focused on subjective assessment by constructing indicators. They developed a series of models to evaluate an EOP in terms of effectiveness, robustness, and so on, to subjectively assess the elements of the EOP [16,17]. Such studies are based on expert experience and historical data, enabling the multidimensional analysis of EOPs. Some studies have employed methods such as the System-Theoretic Accident Model and Process (STAMP) [18] and the Functional Resonance Analysis Method (FRAM) [19] to conduct qualitative evaluations of emergency response. By developing systematic frameworks, these studies identify potential risks and vulnerabilities in emergency response processes. Other studies have focused on the temporal analysis of EOP. In these studies, the effectiveness of the EOP is highly dependent on the response time of the action [20], and emergency actions are considered as continuous processes. They have redefined time as the assessment criterion, and used methods such as Monte Carlo [3,21], Markov [22] and Petri-net [23,24,25,26] to simulate the personnel response time and assess the probability of the EOP being completed within the limited time. These studies effectively capture the importance of time; however, they have yet to consider the impact of time on human errors and the human–machine interaction process.
In order to consider the impact of human and machine factors on the system, some studies have used probabilistic risk assessment (PRA) methods to analyze the EOP risk. Conventional PRA methods characterize the deterministic relationships between risk factors that combine to form various risk scenarios. This is achieved using Boolean logic methods, such as event trees (ETs) and fault trees (FTs) [27]. The Boolean logic-based ET-FT approaches have proven to be very effective in analyzing risks in complex systems with deterministic causal relationships [28]. To model complex systems with non-deterministic causal factors, Mosleh et al. [29] proposed the Hybrid Causal Logic (HCL) modeling method. The HCL method combines the Boolean logic-based PRA methods with the Bayesian Network (BN) approach as a multi-layer modeling approach. Wang et al. [30] applied the HCL method to the emergency response in ship collision accidents. Zhang et al. [31] used the HCL method to assess the emergency response in contact scenarios involving maritime autonomous surface ships. However, the BN in HCL is unable to capture the dynamic changes of variables over time [32], making it incapable of modeling the mutual dependence present in emergency response processes.
Dynamic Bayesian Network (DBN) is an extension of BN over time, addressing the limitations of BN in dynamic analysis. This method allows the incorporation of events, conditions, and interrelationships that may change over time [32]. Currently, DBN is widely applied in the emergency response assessment of marine accidents. Wang et al. [33] assessed the dynamic risk of riserless well intervention systems performing the plugging and abandonment action based on DBN. Liu et al. [34] comprehensively considered the risk factors leading to blowout accidents and established a DBN model for emergency operation assessment. An et al. [35] integrated the STAMP with DBN to evaluate emergency operations for deepwater blowout accidents. Liu et al. [36] proposed a hybrid approach that incorporates DBN with the Graphical Evaluation and Review Technique to achieve hybrid assessment and optimization of emergency plans. Guo et al. [37] combined the FRAM with DBN to assess the risk of emergency response processes in ship collision scenarios.
To address the mutual dependence between human error and available time in the EOP, this paper proposes a mutual dependence model based on DBN. This model includes dependence (a) and dependence (b). To model dependence (a), this paper proposes a continuous SPAR-H method, which models the HEP as a linear function due to the continuous time pressure caused by the available time. To model dependence (b), this paper proposes a dynamic available time model, where the response time is regarded as a continuous variable, and the response time and time limitation depend on whether human error occurs or is recovered. In DBN, each time-slice represents the failure logic of a subtask in the EOP, and the connections between time-slices represent the failure evolution logic between subtasks. The continuous SPAR-H method is used to determine the conditional probability distribution (CPD) of human error in the intra-slice network of DBN, and the dynamic available time model is used to determine the CPD of available time in the inter-slice network of DBN. Based on the mutual dependence model, this paper proposes a risk assessment method for EOP and takes the Ro-Ro ship Estonia flooding incident as an example to establish the DBN model for analysis and discussion.
The contributions of this study are summarized as follows. This is the first work to investigate the mutual dependence between human error and available time in the risk assessment of flooding incident EOP, and a mutual dependence model is proposed based on the DBN. In the mutual dependence model, a continuous SPAR-H method is proposed to determine the CPD of human error for dependence (a), and a dynamic available time model is proposed to determine the CPD of available time in the next time-slice for dependence (b).
The paper is organized as follows. Section 2 introduces the DBN model and the SPAR-H method. Section 3 describes the mutual dependence between human error and available time in the EOP, and proposes the mutual dependence model based on DBN and the risk assessment method for EOP. Section 4 takes the Ro-Ro ship flooding incident EOP as an example to develop and discuss the proposed method. Section 5 presents the conclusions of this study.

2. Background of Research Methods

This paper focuses on the mutual dependence between human error and available time, and the impact of this mutual dependence on the EOP risk. Before presenting the proposed risk assessment method, this section gives a brief introduction to the DBN with continuous variables, which is used to describe the mutual dependence and dynamics of the system, and the SPAR-H method, which is used to quantify the HEP.

2.1. DBN

A DBN is a stochastic model with the ability to handle time series data, taking full account of the effect of time in the study of uncertainty problems [38]. Similar to BNs, DBNs are represented as a set of variables and their conditional dependencies by directed acyclic graphs. A DBN consists of multiple BNs, and each BN corresponds to a time-slice [39]. Compared with BN, the conditional probabilities of DBN are more complex. BNs can only be used to represent relationships between variables in the same time-slice, whereas DBNs can be used to represent relationships between variables in different time-slices [33]. DBN can be represented as B 0 , B , where B 0 is the initial Bayesian network, defining the prior distribution P X t = 1 of the variables; B is the transfer network, defining the transfer model from time-slice t 1 to t with conditional probabilities of
P X t | X t 1 = i = 1 n P X i t | p a X t i ,
where X t i is the node of time-slice t ; p a X t i is the parent node of X t i , which may be the node of the same time-slice or the node of the previous time-slice. When the nodes in a DBN are discrete variables, the network is referred to as a discrete DBN; when the nodes in a DBN are continuous variables, the network is referred to as a continuous DBN. For a simple network containing three nodes ( X 1 and X 2 are the parents of Y ), when the nodes are continuous variables, the marginal probability distributions of the parents X 1 and X 2 can be directly specified according to experience, and the CPD of the child nodes Y can be determined through linear or nonlinear regression analysis. The CPD can be represented in two ways: (1) Y = f X 1 , X 2 + ε , where f · represents a linear or nonlinear function of X 1 and X 2 , and ε represents a random variable; (2) Y | X 1 , X 2 ~ N μ , σ 2 , where μ = f X 1 , X 2 , α with coefficients α [40]. In this paper, a continuous DBN is used for modelling the network, and the first way is applied to represent the CPD.

2.2. SPAR-H

The SPAR-H method has been developed to estimate the HEP associated with the diagnosis and actions of crews. The method sets the nominal human error probability (NHEP) for two tasks, with NHEP = 0.01 for the diagnostic task and NHEP = 0.001 for the action task. Based on the NHEP, the PSFs will modify the HEP. Time is used as one of the PSFs in the SPAR-H method and will directly affect the HEP. In addition, stressors, experience and training, complexity, ergonomics, including human–mechanical interfaces, procedures, fitness for duty, and work processes, are all considered as PSFs to modify the HEP [41]. When the levels of the eight PSFs are determined, the final HEP is the product of the nominal HEP and the multipliers of the PSFs, which is expressed as
H E P = N H E P × i = 1 8 P S F i ,
H E P = N H E P × i = 1 8 P S F i N H E P × i = 1 8 P S F i 1 + 1 .
The calculation of HEP depends on the number of negative PSFs (i.e., the PSF with a multiplier greater than 1). When the number of negative PSFs is less than three, HEP is calculated with Equation (2). When three or more negative PSFs are present, HEP is calculated with Equation (3).
SPAR-H has been widely used to assess human reliability in marine emergency tasks. For example, Ahn et al. [41] evaluated the reliability of the human involved in the emergency task of the rescue boat drill based on SPAR-H with a fuzzy multiple attribute group decision-making method. Parhizkar et al. [42] applied the SPAR-H method to estimate the effect of PSFs on the HEP to assess the risk of decision making in emergency situations of dynamically positioned drilling units.

3. Methodology

This section analyzes the mutual dependence between human error and available time in EOP, and develops a mutual dependence model based on DBN. In the mutual dependence model, a continuous SPAR-H method and a dynamic available time model are proposed to model the dependence (a) and the dependence (b), respectively. To evaluate the EOP risk considering the mutual dependence, this section introduces the framework of the risk assessment method based on the established model.

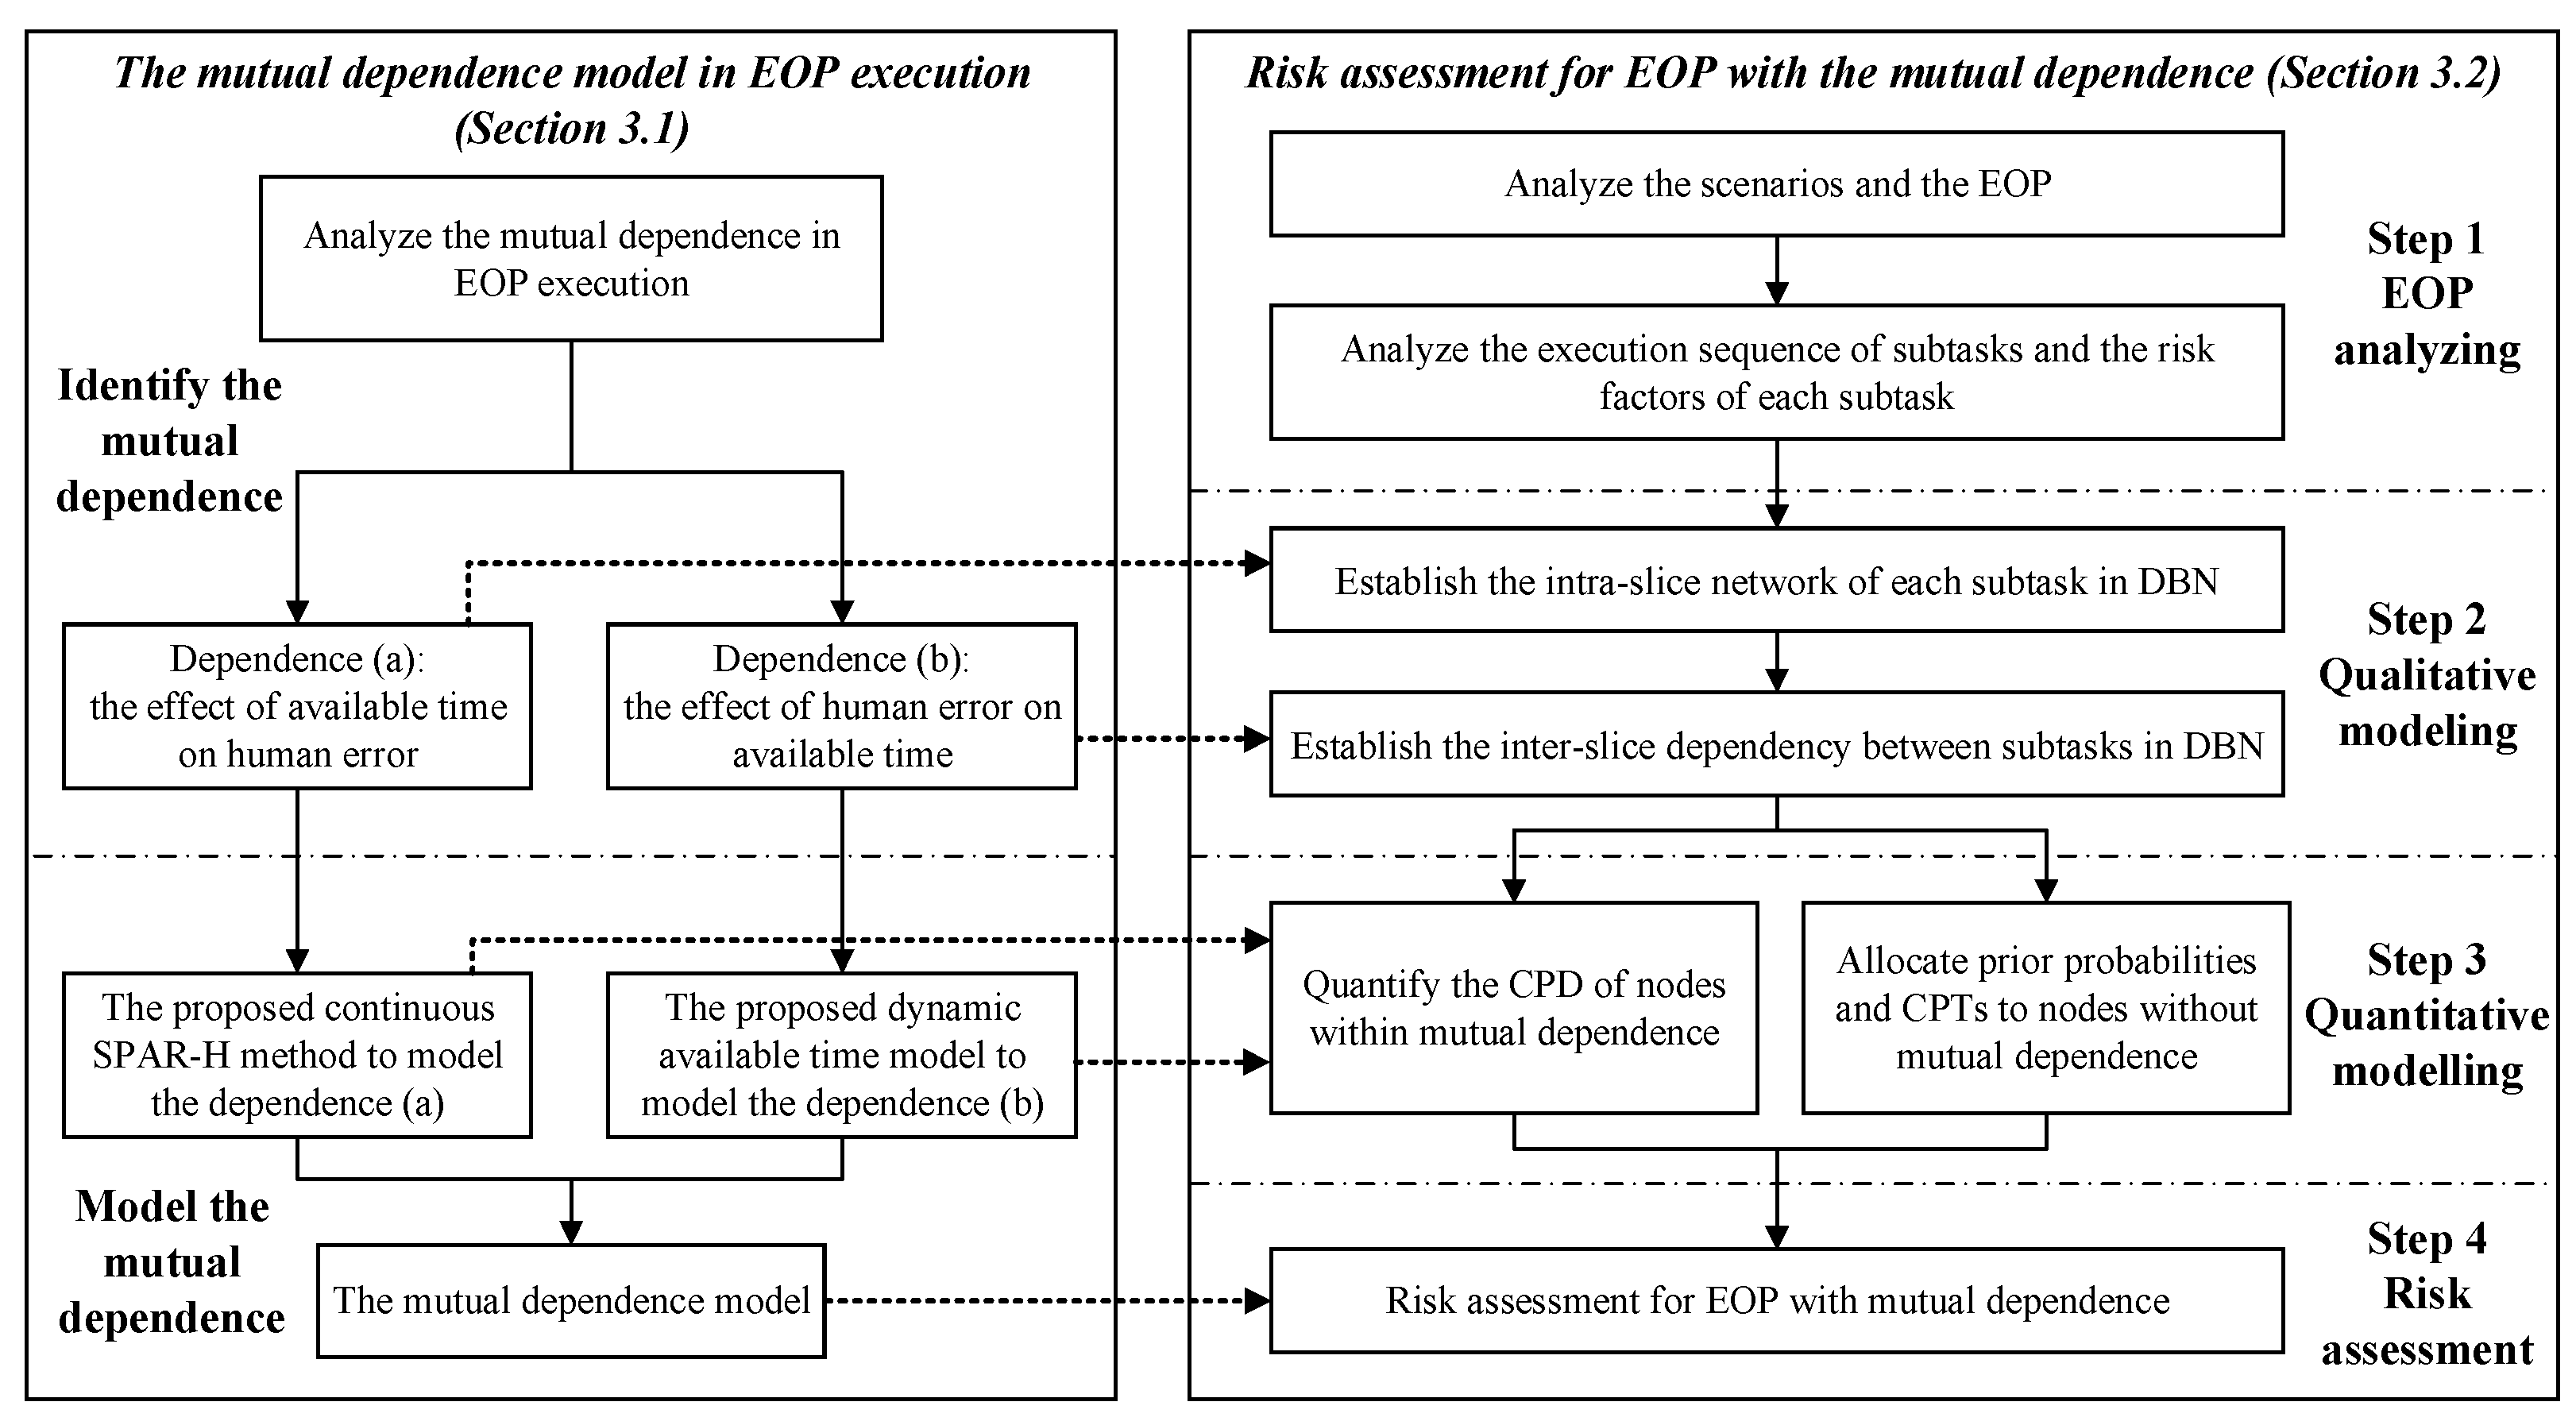
3.1. Modeling the Mutual Dependence in the Execution of EOP

To effectively prevent the escalation of the incident, EOP is usually developed in advance and takes the form of a brief flowchart or checklist to help the crew understand the required emergency tasks during the response process, thus reducing errors of the crew [43]. Typically, EOP is required to include (1) operating procedures for the full range of possible accident scenarios, including methods to protect life, the marine environment, and property; (2) the responsibilities of personnel, including master, chief engineer, chief officer, etc.; (3) information on the availability and location of response equipment; (4) procedures for reporting and communicating on board and so on [43]. However, the operating procedures in EOP need to be executed within a limited time, i.e., personnel have a defined amount of available time to perform the operation. Human factors play an important role in the execution of EOP, and there is a mutual dependence between human error and available time.

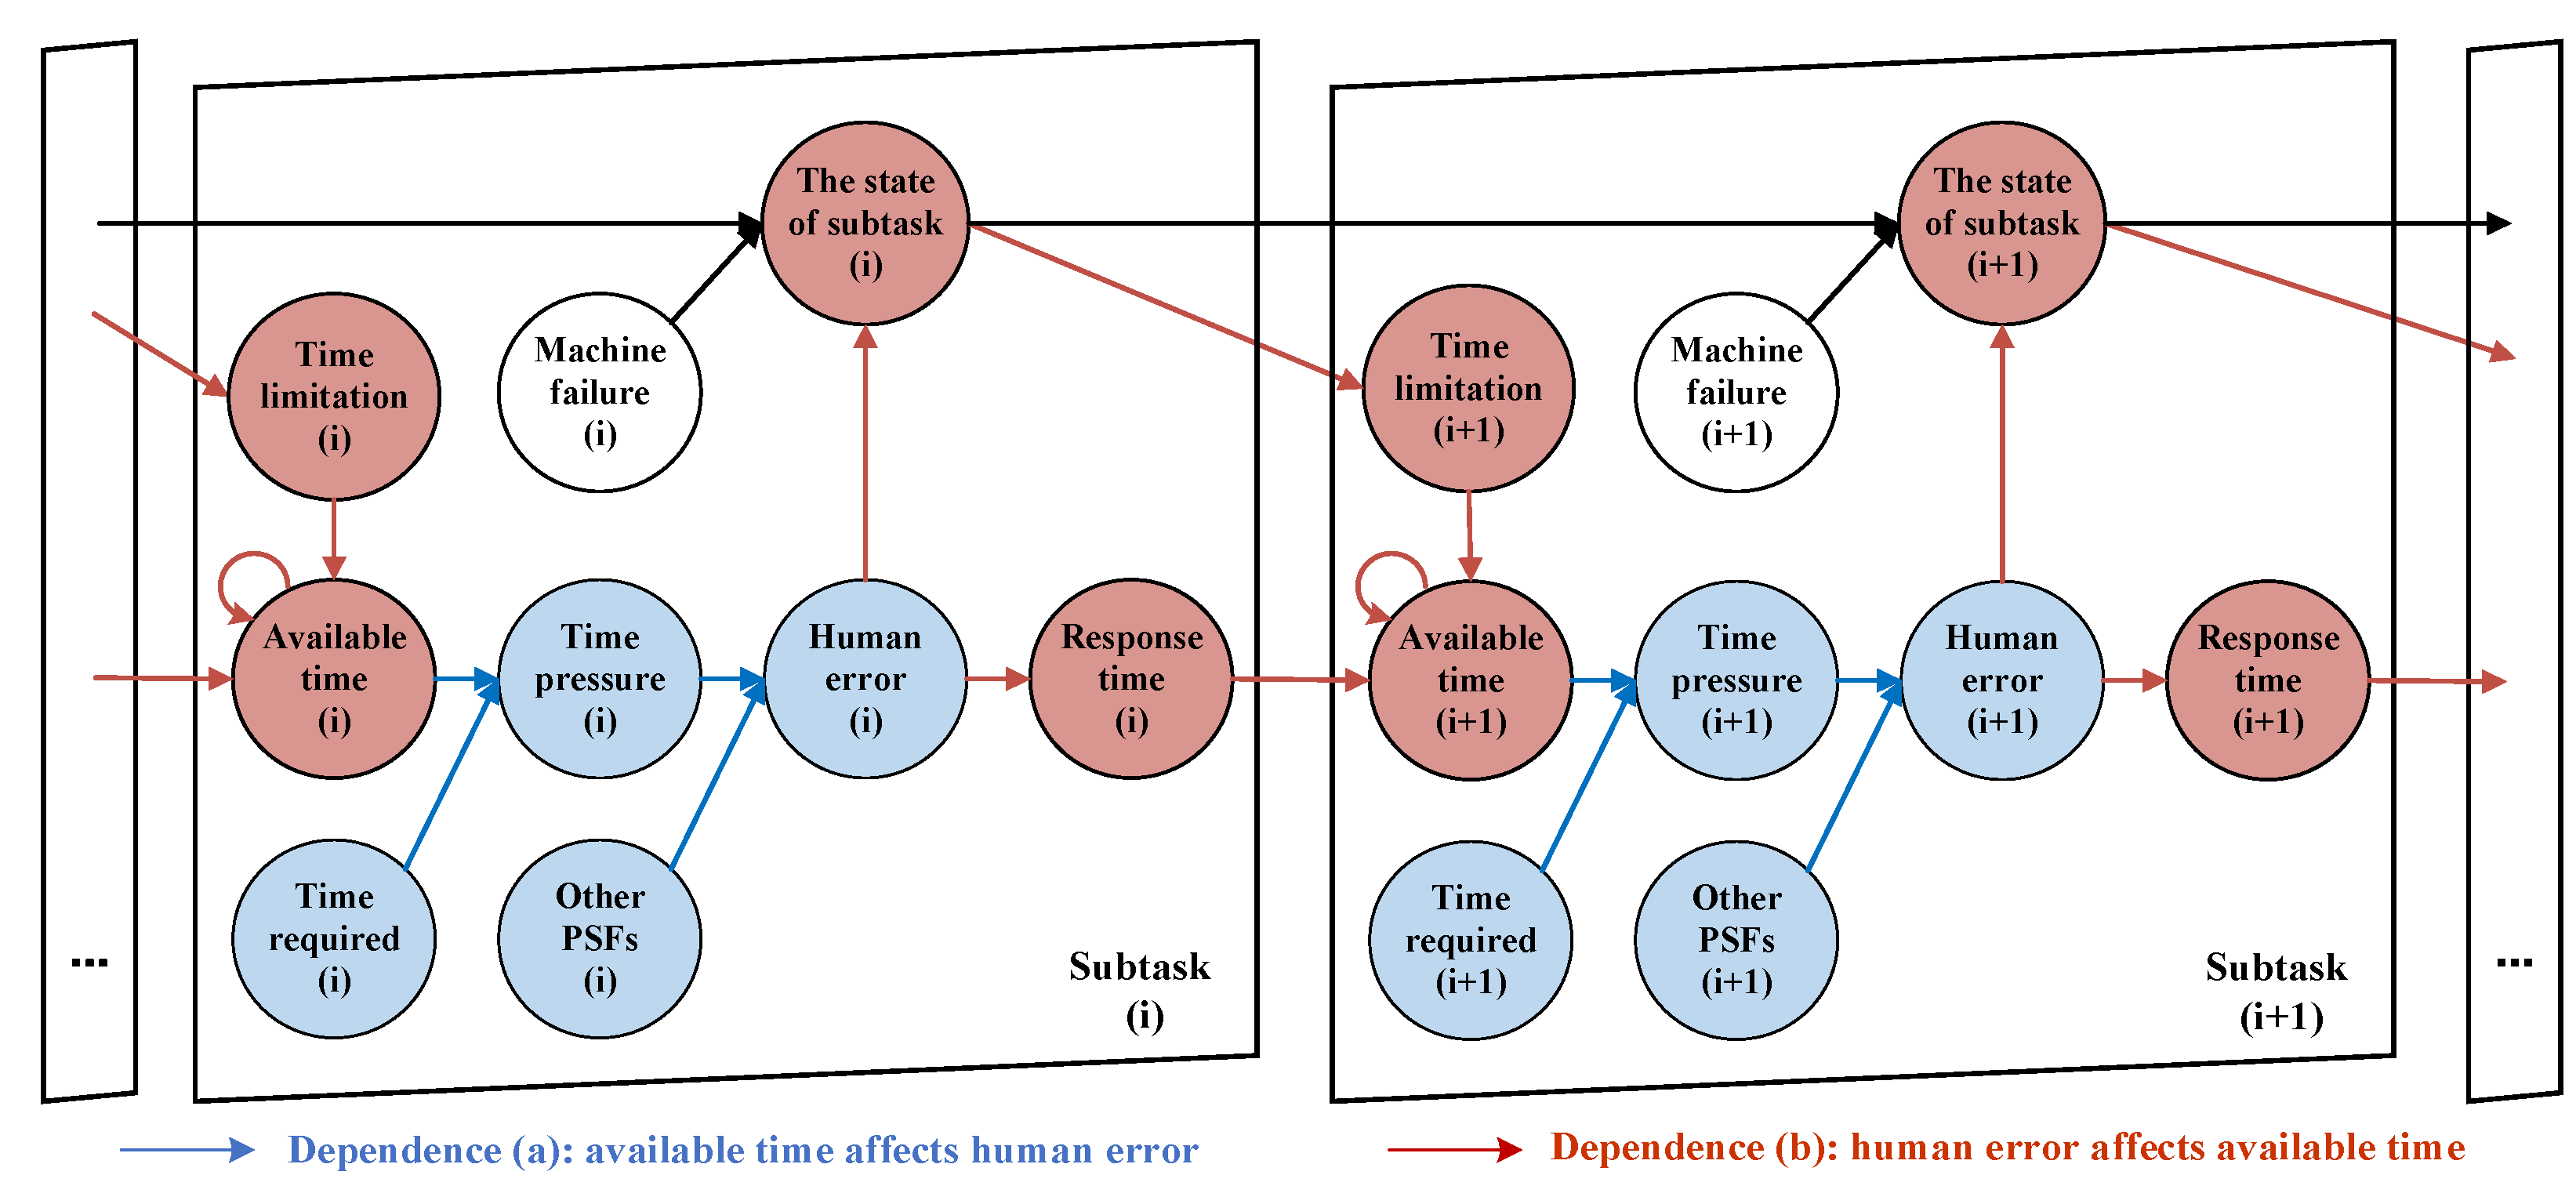
3.1.1. The Mutual Dependence Between Human Error and Available Time

In the execution of EOP, human error and available time are mutually dependent, as shown in Figure 1: (a) shorter available time may increase time pressure and thus increase the occurrence probability of human error, as shown by the blue arrows; (b) human error may increase personnel response time or shorten time limitation, further shortening the available time for subsequent tasks, as shown by the red arrows.
(1)
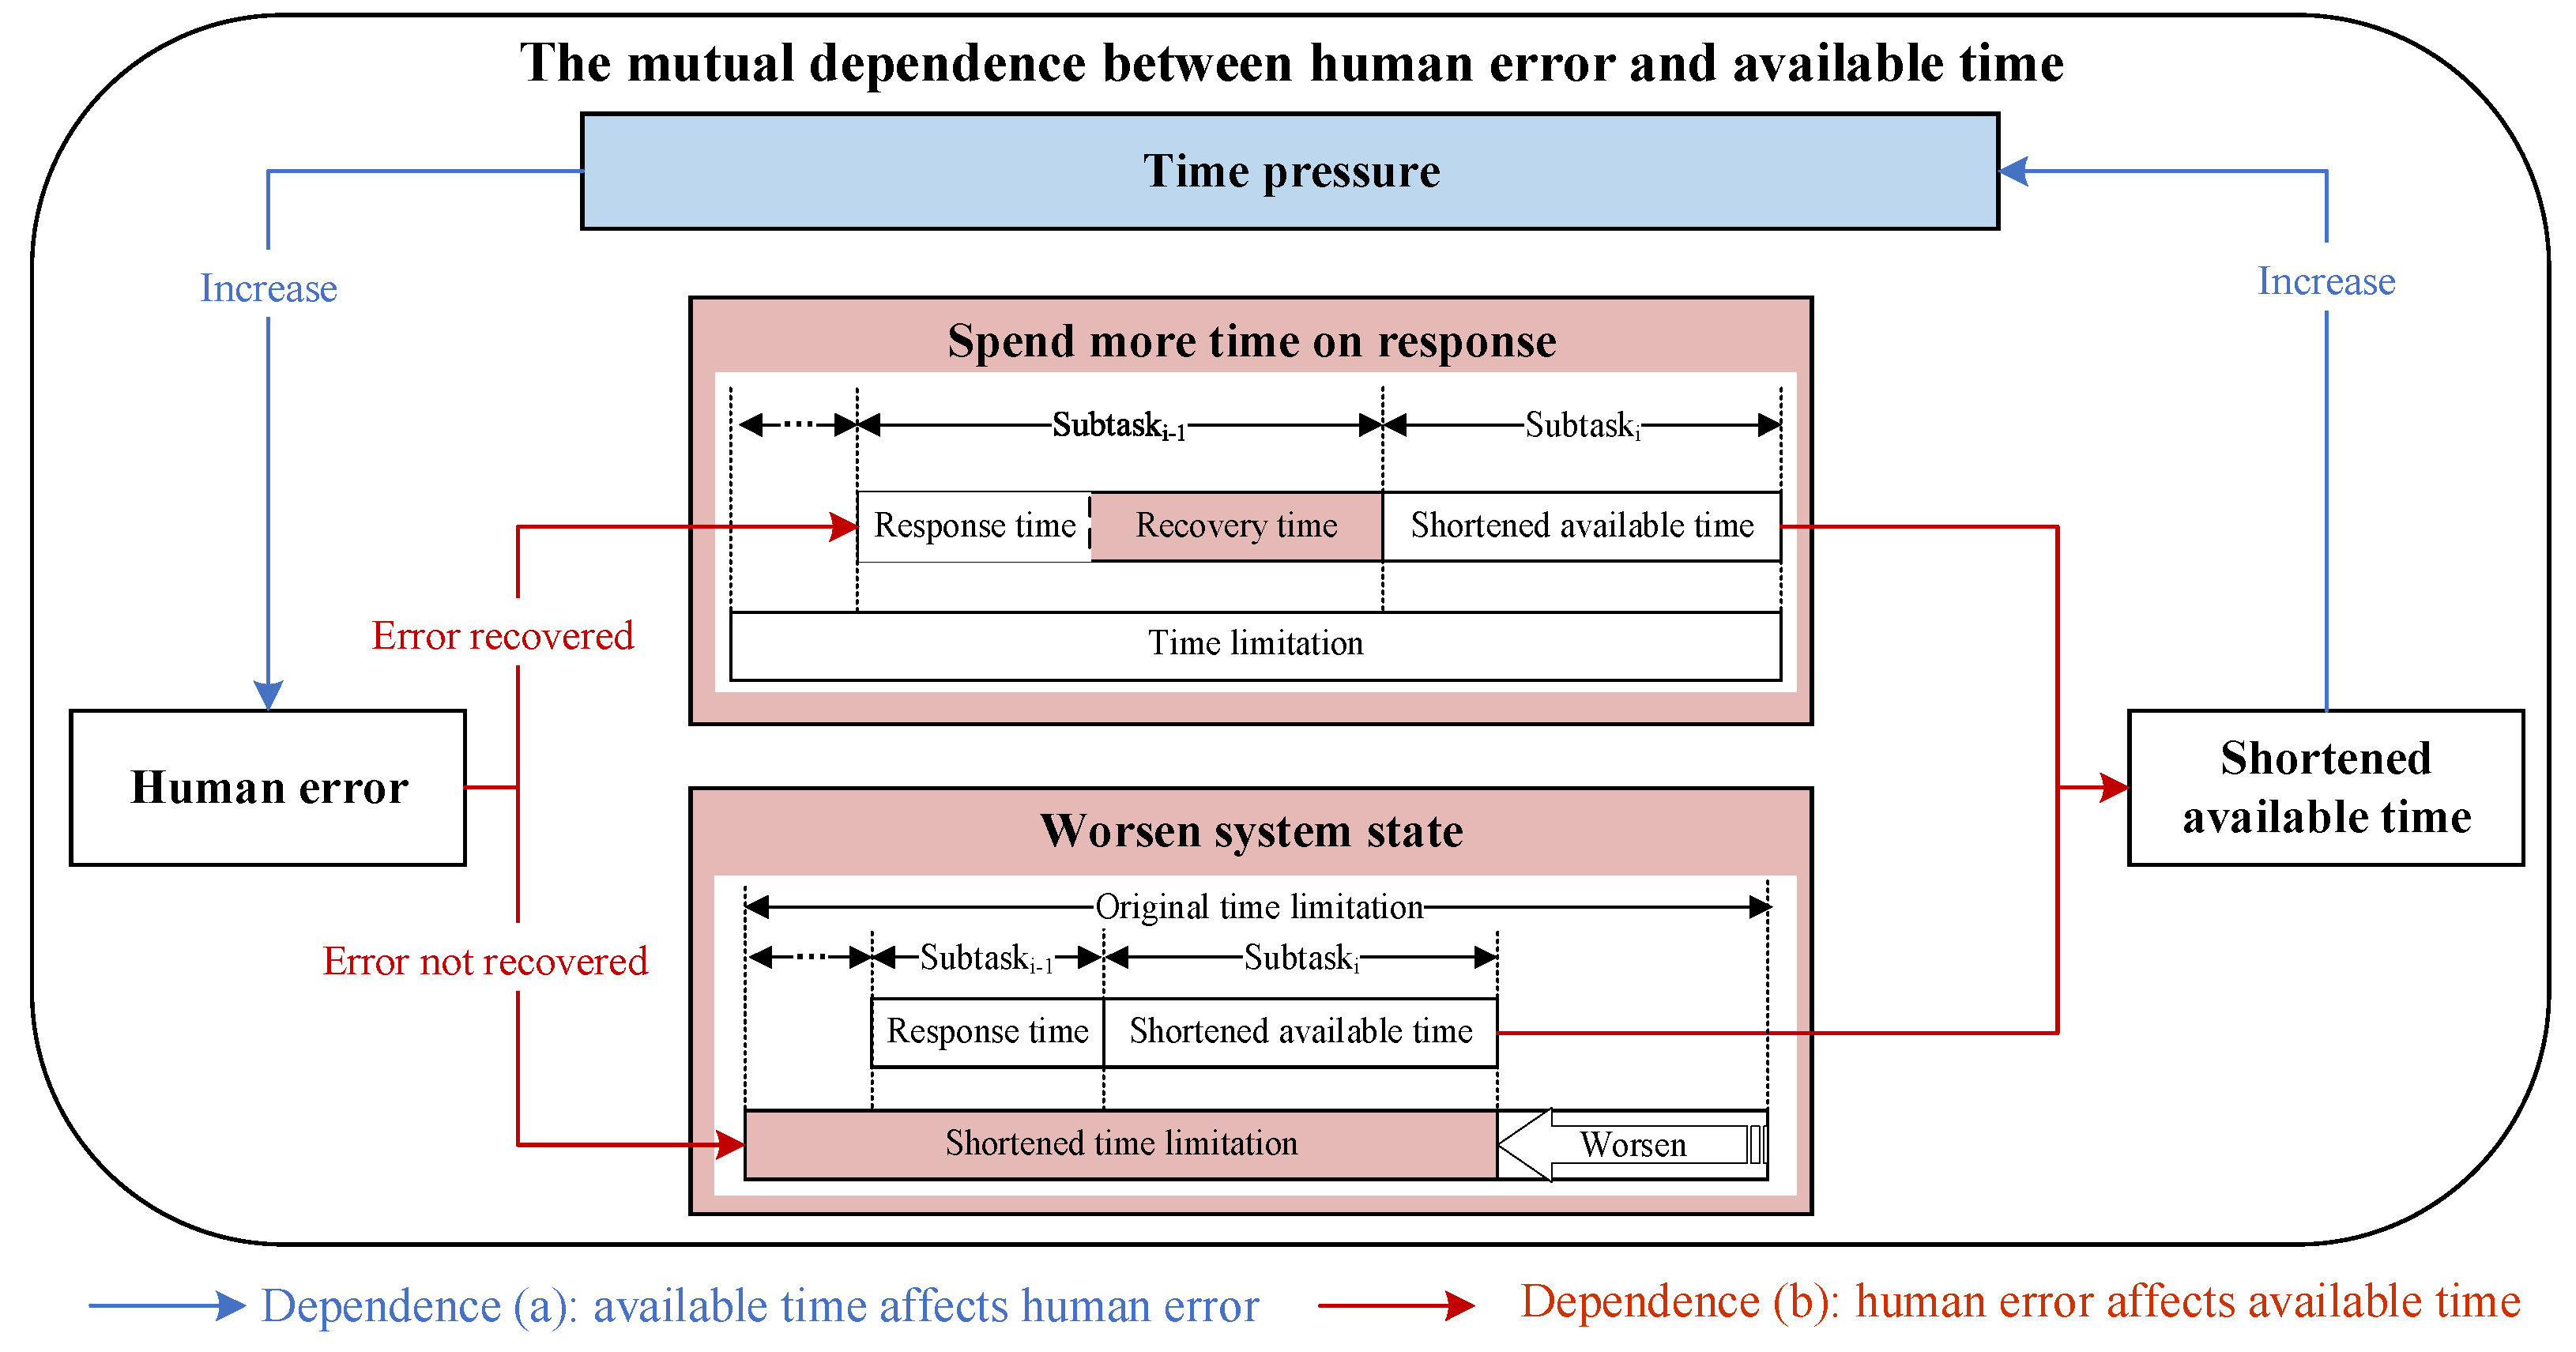
Dependence (a): Available time affects human error. During the execution of the EOP, the available time for a task can be defined as the difference between the time limitation of all tasks in the EOP and the response time spent on preceding tasks. Shorter available time can induce emotions such as tension and anxiety, serving as factors triggering time pressure [40]. Time pressure is a significant factor influencing human error [41] and is incorporated as one of the PSFs in many HRA methods to adjust the HEP. It will become higher as the available time decreases. Higher time pressure can have a negative impact on personnel’s psychological state, triggering emotions such as anxiety and stress, which in turn weaken cognitive functions and operational performance [42]. HRA methods, such as SPAR-H, categorize time pressure into several levels to evaluate its effect on human error. At the highest level of time pressure, it is assumed that operators have no time to carry out the required actions, making human error nearly unavoidable. Conversely, at the lowest level, it is assumed that the operator has sufficient time to complete the task and that the time pressure has no effect on the task execution [38].
(2)
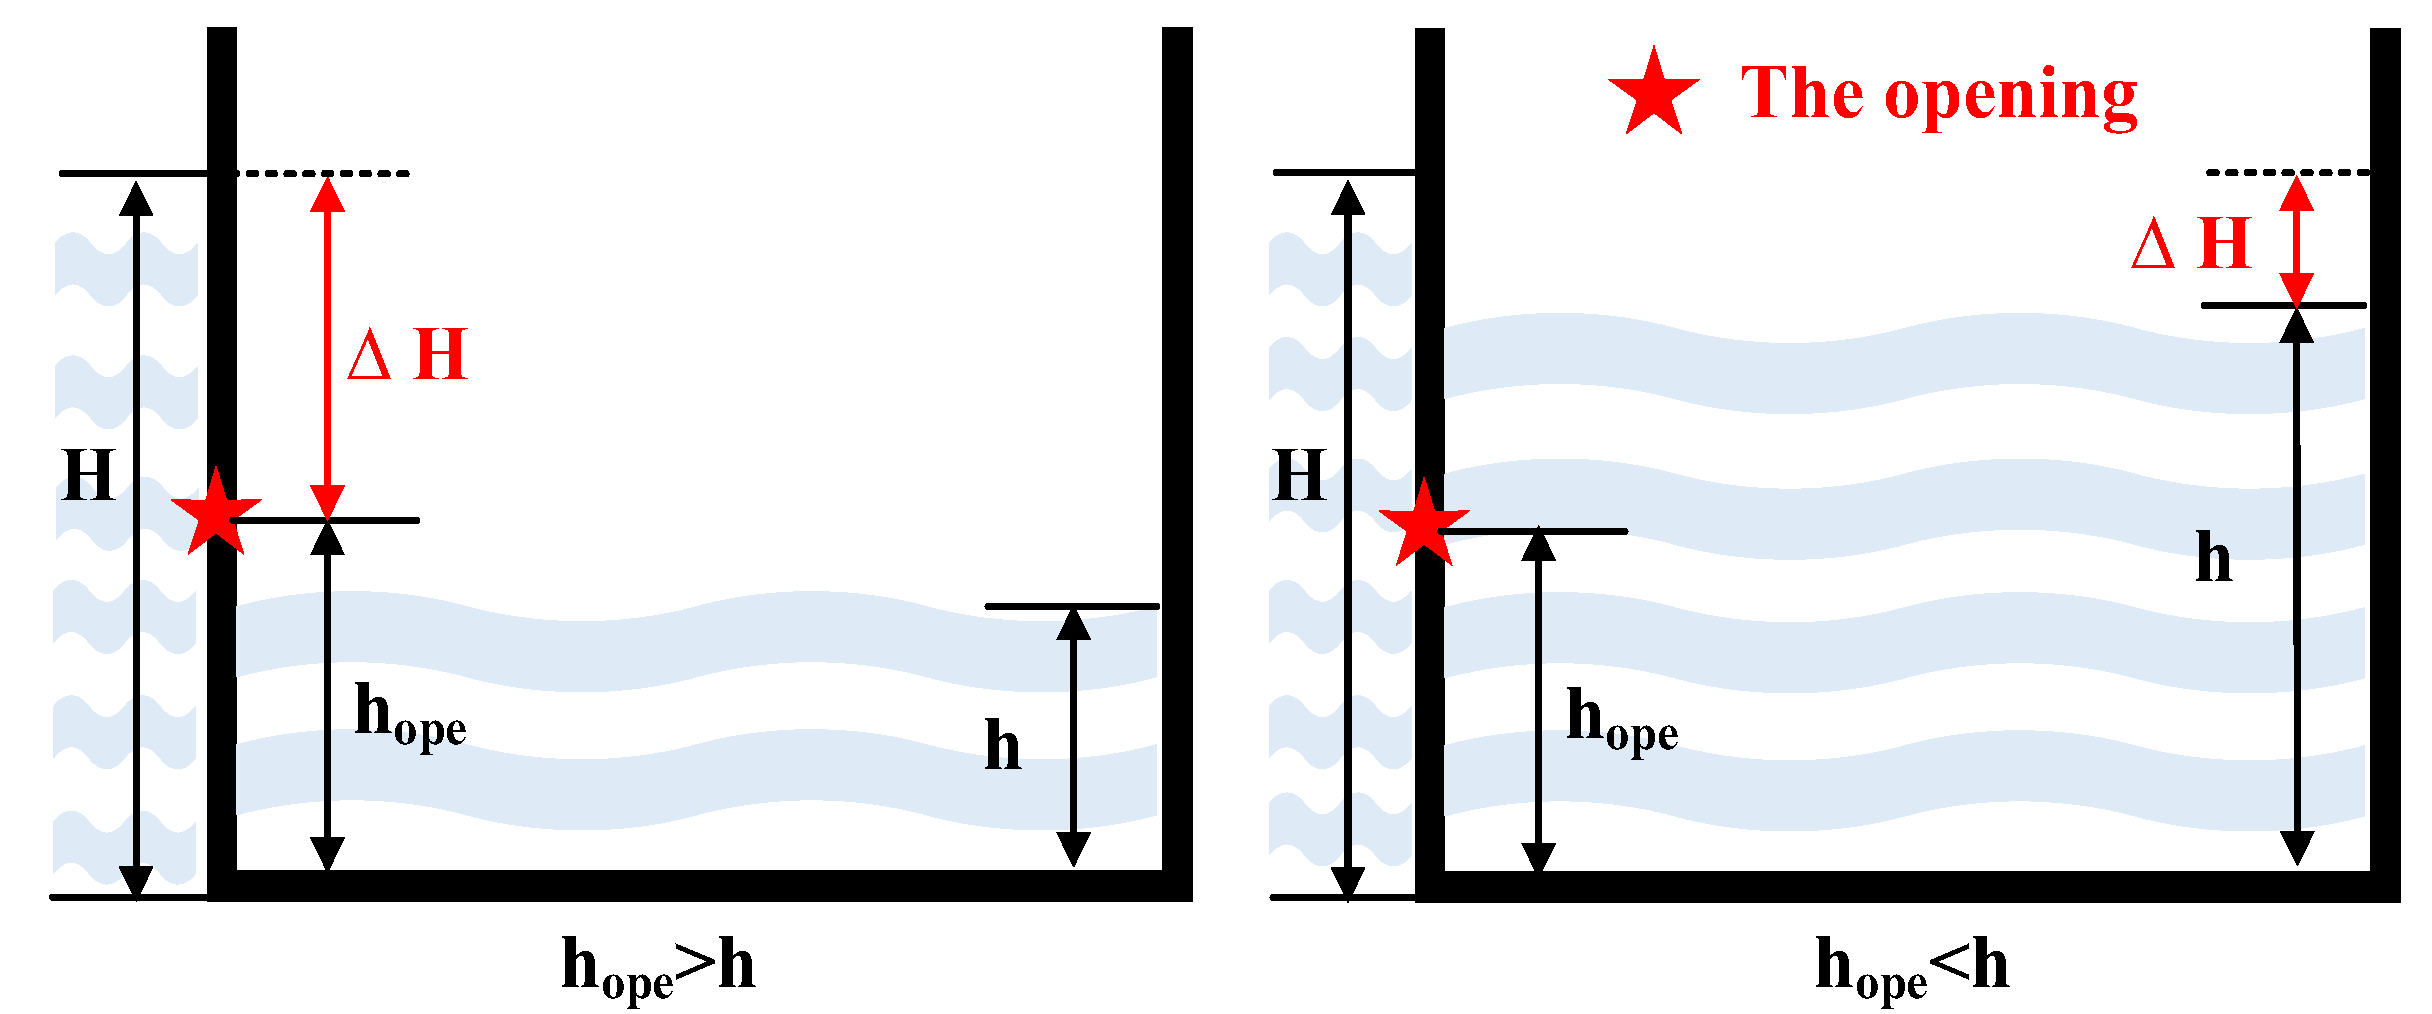
Dependence (b): Human error affects available time. Human error can dynamically affect available time in two ways, depending on whether the error is recovered. On the one hand, when human error occurs, personnel may discover and recover the error [43]. This requires personnel to respond again and spend more time on the task. For example, in the EOP of the flooding incident, if a crew member opens the wrong valve when opening the emergency bilge pump and notices the error, the crew needs to spend additional time closing the wrong valve and opening the correct one. The longer the response time for the current task, the shorter the available time for subsequent tasks. On the other hand, if the personnel fail to detect the error, the required emergency function will not be activated effectively. This will worsen the system state and shorten the time limitation for EOP execution, which in turn will shorten the available time for subsequent tasks. For example, according to SOLAS regulations, when adjacent compartments or multiple compartments are flooded simultaneously, a roll angle of 12° can be tolerated, while a single compartment flooding allows a roll angle of 15° [44]. Failure to close the watertight door will reduce the maximum tolerable heeling angle of the ship and accelerate the capsizing of the ship, thus shortening the time limitation and the time available for personnel to execute subsequent emergency tasks.

3.1.2. Modeling Dependence (a)

As described in Section 3.1.1, available time affects human error by influencing time pressure. Available time determines the level of time pressure. To quantify time pressure, researchers generally (1) compare the required time to complete the task with the available time to maintain system safety, or (2) calculate the time interval between the required time and the available time [44]. In this study, Siegel et al.’s time pressure formula [45] is employed to calculate time pressure, which can be expressed as
T P = T R / T A ,
where T P is time pressure, the time required T R is the time needed to execute subsequent subtasks and the available time T A is the time available to execute the subsequent subtasks.
Considering that time pressure may be a continuous variable under the influence of continuous available time, HEP should follow a linear function [42] to make it continuous with time pressure. Therefore, this paper proposes a continuous SPAR-H method to model the dependence (a). In the continuous SPAR-H method, the HEP at each level is connected to follow a linear function [42], as shown in Figure 2. The multipliers of time at different levels in the SPAR-H method are shown in Table 1 [14]. Based on Equations (2) and (3) in Section 2.2, it can be seen that the calculation of HEP depends on the number of negative PSFs. In this paper, the continuous variation of HEP with time pressure is analyzed for different amounts of negative PSF. Detailed formulas for calculating HEP at different numbers of negative PSFs are shown in Appendix A.

3.1.3. Modeling Dependence (b)

As described in Section 3.1.1, human error may increase personnel response time or shorten time limitation, causing the available time to dynamically change as the task progresses. Therefore, this paper proposes a dynamic available time model to model the dependence (b). On the one hand, when human error occurs, personnel may recover the error, which increases the personnel response time. Due to the uncertainty of human behavior [46], the personnel response time is regarded as a continuous variable [42]. According to the literature review, the normal response time R T follows the gamma distribution [47], as shown in Figure 3. The gamma distribution is a two-parameter category of continuous probability distributions, and the response time R T without human error for the i-th subtask can be expressed as
R T , i x | ¬ H E i = β α x α 1 e β x Γ α ,
where α is the shape parameter, usually taking values between 2 and 3 [47], β is the inverse scale parameter, ¬ H E i represents that no human error occurs in the i-th subtask. After a human error occurs, personnel need to detect and take corrective action, which may result in the time required for the current subtask doubling or even more, thereby affecting the response time parameters. The response time when the i-th subtask experiences human error and the error is recovered can be expressed as
R T , i x | H E i , D i = β α x α 1 e β x Γ α + λ β α x α 1 e λ β x Γ α ,
where H E i represents that a human error occurs in the i-th subtask, D i represents that the human error is detected and recovered, and λ represents the parameter coefficient of the response time used to recover the error, depending on the personnel and environmental characteristics.
On the other hand, if human error is not detected and recovered, the response time distribution will be the same as when no human error occurs, i.e., R T , i x | H E i , ¬ D i = β α x α 1 e β x Γ α . If the human error is an omission, the personnel will not spend time on this task, which also results in R T , i x | H E i = 0 . As described in Section 3.1.1, human error or machine failure can result in the ineffectiveness of necessary emergency response functions, which will worsen the system state and shorten the time limitation for the execution of the EOP. The shortened time limitation can be expressed as
Δ f L , i = f L , i Θ i | 1 i 1 = 1 f L , i Θ i | 1 i 1 i = 2 , , n ,
where 1 i 1 represents the state of the i − 1-th subtask. 1 i 1 = 1 and 1 i 1 = 0 represent the successful and failed execution of the i − 1-th subtask, respectively. The success or failure of the subtask depends on the impacts of human errors and machine failures. Θ represents a set of parameters that influence the time limitation, and the values of these parameters change based on the execution state of the subtask. Different values of the parameters will result in variations in the calculated time limitation. f L , i · measures the time limitation T L , i , and the function needs to be analyzed according to the specific incident scenario and can be determined through methods such as analytical calculations, simulations or experiments. According to Equation (7), it can be inferred that when the i − 1-th subtask is successfully executed, the variation of the time limitation is zero.
For the first task, the time limitation of EOP execution is the personnel’s available time. For subsequent tasks, the available time continues to change dynamically. If no human error occurs, the time limitation for EOP execution remains unchanged, and the personnel’s available time is the difference between the personnel’s available time and the response time in the previous task. In contrast, if a human error occurs, the time limitation for EOP execution will change, and the personnel’s available time will need to be further adjusted by calculating the shortening of the time limitation. If the response time of the previous task exceeds the available time, the available time for subsequent tasks will be set to zero. Therefore, the personnel’s available time for the i-th subtask can be expressed as
T A , i = T L , i i f   i = 1 max T A , i 1 R T , i 1 Δ f L , i , 0 i f   i = 2 , , n .

3.1.4. Modeling Mutual Dependence Based on DBN

To model the mutual dependence within EOP, this paper establishes a DBN model that incorporates both dependence (a) and dependence (b), as shown in Figure 4.
EOP often consists of multiple subtasks that are performed with multiple risk factors, including human error, machine failure, etc. In the DBN model of EOP, each time-slice represents the failure logic of a subtask in the EOP, and the risk factors such as human error and machine failure in the subtask are represented as nodes in the intra-slice network. The connections between subtasks across time-slices represent the fault evolution logic between emergency response tasks and are modeled as inter-slice networks within the DBN. The logical relationship between risk factors can be defined through conditional probability tables (CPTs). The probability modeling process of the DBN is illustrated in Figure 5.
For dependence (a), shorter available time will increase the occurrence probability of human errors within the same time-slice by increasing the time pressure. Therefore, this paper adds the nodes pointed to by the blue arrows into DBN’s intra-slice network to model dependence (a). Among them, the continuous variation of time pressure is influenced by the available time and time required, while time pressure and the levels of other PSFs can affect the occurrence of human error. The continuous SPAR-H method proposed in Section 3.1.2 can be used to quantify dependence (a). The CPD of time pressure can be determined according to Equation (4), and the CPD of human error can be determined according to Equations (A1) and (A2).
For dependence (b), human error can shorten the available time in the next time-slice by increasing the personnel response time or decreasing the time limitation. Therefore, this paper adds the nodes pointed to by the red arrows into DBN’s inter-slice network to model dependence (b). On the one hand, human error affects the response time within the current time-slice, and thus affects the available time within the next time-slice. On the other hand, human error affects the progression of the incident by affecting the state of the subtasks, which in turn affects the available time by affecting the time limitation of the EOP within the next time-slice. The dynamic available time model proposed in Section 3.1.3 can be used to quantify dependence (b). The CPDs of the personnel response time and the time limitation can be determined by Equations (5) and (6) and Equation (7), respectively, with their CPDs influenced by human errors and subtask states. The CPD of the available time can be determined by Equation (8).

3.2. The Framework of the Risk Assessment Method for EOP with the Mutual Dependence

This paper proposes a DBN-based method for the risk assessment of EOP with the mutual dependence. The framework of the method is shown in Figure 6, and consists of four main steps. The details of each step are presented in this section.
Step 1: EOP analysis. Analyze the accident scenario and EOP to determine the risk factors associated with each subtask in the EOP, and the operational sequence between subtasks, which can provide the basis for subsequent modelling. By analyzing each subtask, various failure modes can be identified and their impact on the EOP can be assessed. In addition, subtasks in the EOP are not isolated, but follow a strict sequence or interdependence, i.e., the success or failure of one subtask can significantly impact subsequent tasks. When a subtask fails, other alternative subtasks usually need to be quickly adopted to prevent the incident.
Step 2: Qualitative modelling. The DBN includes both an intra-slice network and an inter-slice network. The intra-slice network describes the logical relationships between risk factors within each subtask, and the inter-slice network describes the sequential relationship between subtasks. The dependency structure of the network is established by linking nodes with directed edges, reflecting the logical relationships between risk factors. Considering the mutual dependence between human error and available time, dependence (a) is modelled in the intra-slice network to describe the effect of available time on human error, and dependence (b) is modelled in the inter-slice network to describe the effect of human error in the previous subtask on the available time in the next subtask.
Step 3: Quantitative modelling. In order to assess the EOP risk, the prior probabilities as well as the conditional probabilities in the DBN need to be determined. The prior probability of the root node can be set by consulting relevant literature, handbooks, or domain experts [48]. The CPTs for nodes without considering mutual dependence can be determined based on the system failure logic. The continuous SPAR-H method presented in Section 3.1.2 can be used to quantify the CPD of human error in dependence (a), and the dynamic available time model presented in Section 3.1.3 can be used to quantify the CPD of available time in dependence (b).
Step 4: Risk assessment. This study focuses on analyzing how the upstream and downstream coupling relationships [37], arising from continuous operations, influence the successful completion of all tasks within the specified time frame. As a result, the EOP risk can be reflected by evaluating the success probability of the final operation in the EOP. Based on the results of the assessment, sensitivity analysis of the elements involved in the EOP can be performed.

4. Case Study

The proposed risk assessment method for EOP with mutual dependence is demonstrated within the context of the Ro-Ro passenger ship Estonia flooding incident. Ro-Ro passenger ships tend to carry a large number of passengers and have fewer transverse bulkheads to facilitate the rolling of cargo [49]. They have poor sink resistance, and present more urgency in flooding incidents. In September 1994, the Ro-Ro passenger ship Estonia sank in the Baltic Sea, and the accident resulted in 852 deaths [4]. In order to apply the proposed method, this paper uses the data from this Ro-Ro passenger ship case to assess the EOP risk.

4.1. The Flooding Scenario

The flooding scenarios for ships are generally categorized into three types [50]: (1) no free surface water inside the flooded compartment; (2) the presence of a free surface inside the flooded compartment that is not connected to the external environment; (3) water level inside the flooded compartment remains at the same level as the sea outside the ship. Different flooding scenarios have different effects on ships. This paper takes the second type of flooded compartment as an example and assesses the case. The schematic diagram for the second type of flooded compartment is shown in Figure 7.
In Figure 7, W L and W L 1 represent the waterline before and after flooding, respectively. c x , y , z is the gravity center of the flooded compartment, and δ d represents the average draft increment of the ship after flooding. In flooding incidents, the ship will experience a heeling angle caused by the water ingress. The stability of the ship will be destroyed when the ship reaches a certain heeling angle, which is defined as the maximum tolerable heeling angle ϕ [51]. Personnel need to successfully execute the EOP before the ship reaches this angle; otherwise, they will be required to evacuate the ship quickly due to the destroyed stability of the ship. Therefore, the time interval from the occurrence of the opening to the ship reaching its maximum heeling angle ϕ is regarded as the time limitation for implementing the EOP [52]. Besides being related to the maximum tolerable heeling angle ϕ , the time limitation is also related to the inflow velocity Q i n and the outflow velocity Q o u t of the ship [50]. A higher inflow velocity Q i n or a lower outflow velocity Q o u t will accelerate the capsizing of the ship and shorten the time limitation [4]. Many scholars have explored flooding scenarios from different perspectives. Some have employed system dynamics approaches to simulate the evolution of system states over time [53,54,55], while others have used analytical methods to perform deterministic calculations of flooding processes [56]. In this study, the primary focus is on the mutual dependence between human error and available time. Therefore, the analysis of the flooding scenario is simplified to an estimation of water ingress into the compartment using Bernoulli’s theorem. A detailed explanation of this estimation process is provided in Section 4.2.

4.2. Application of Proposed Method
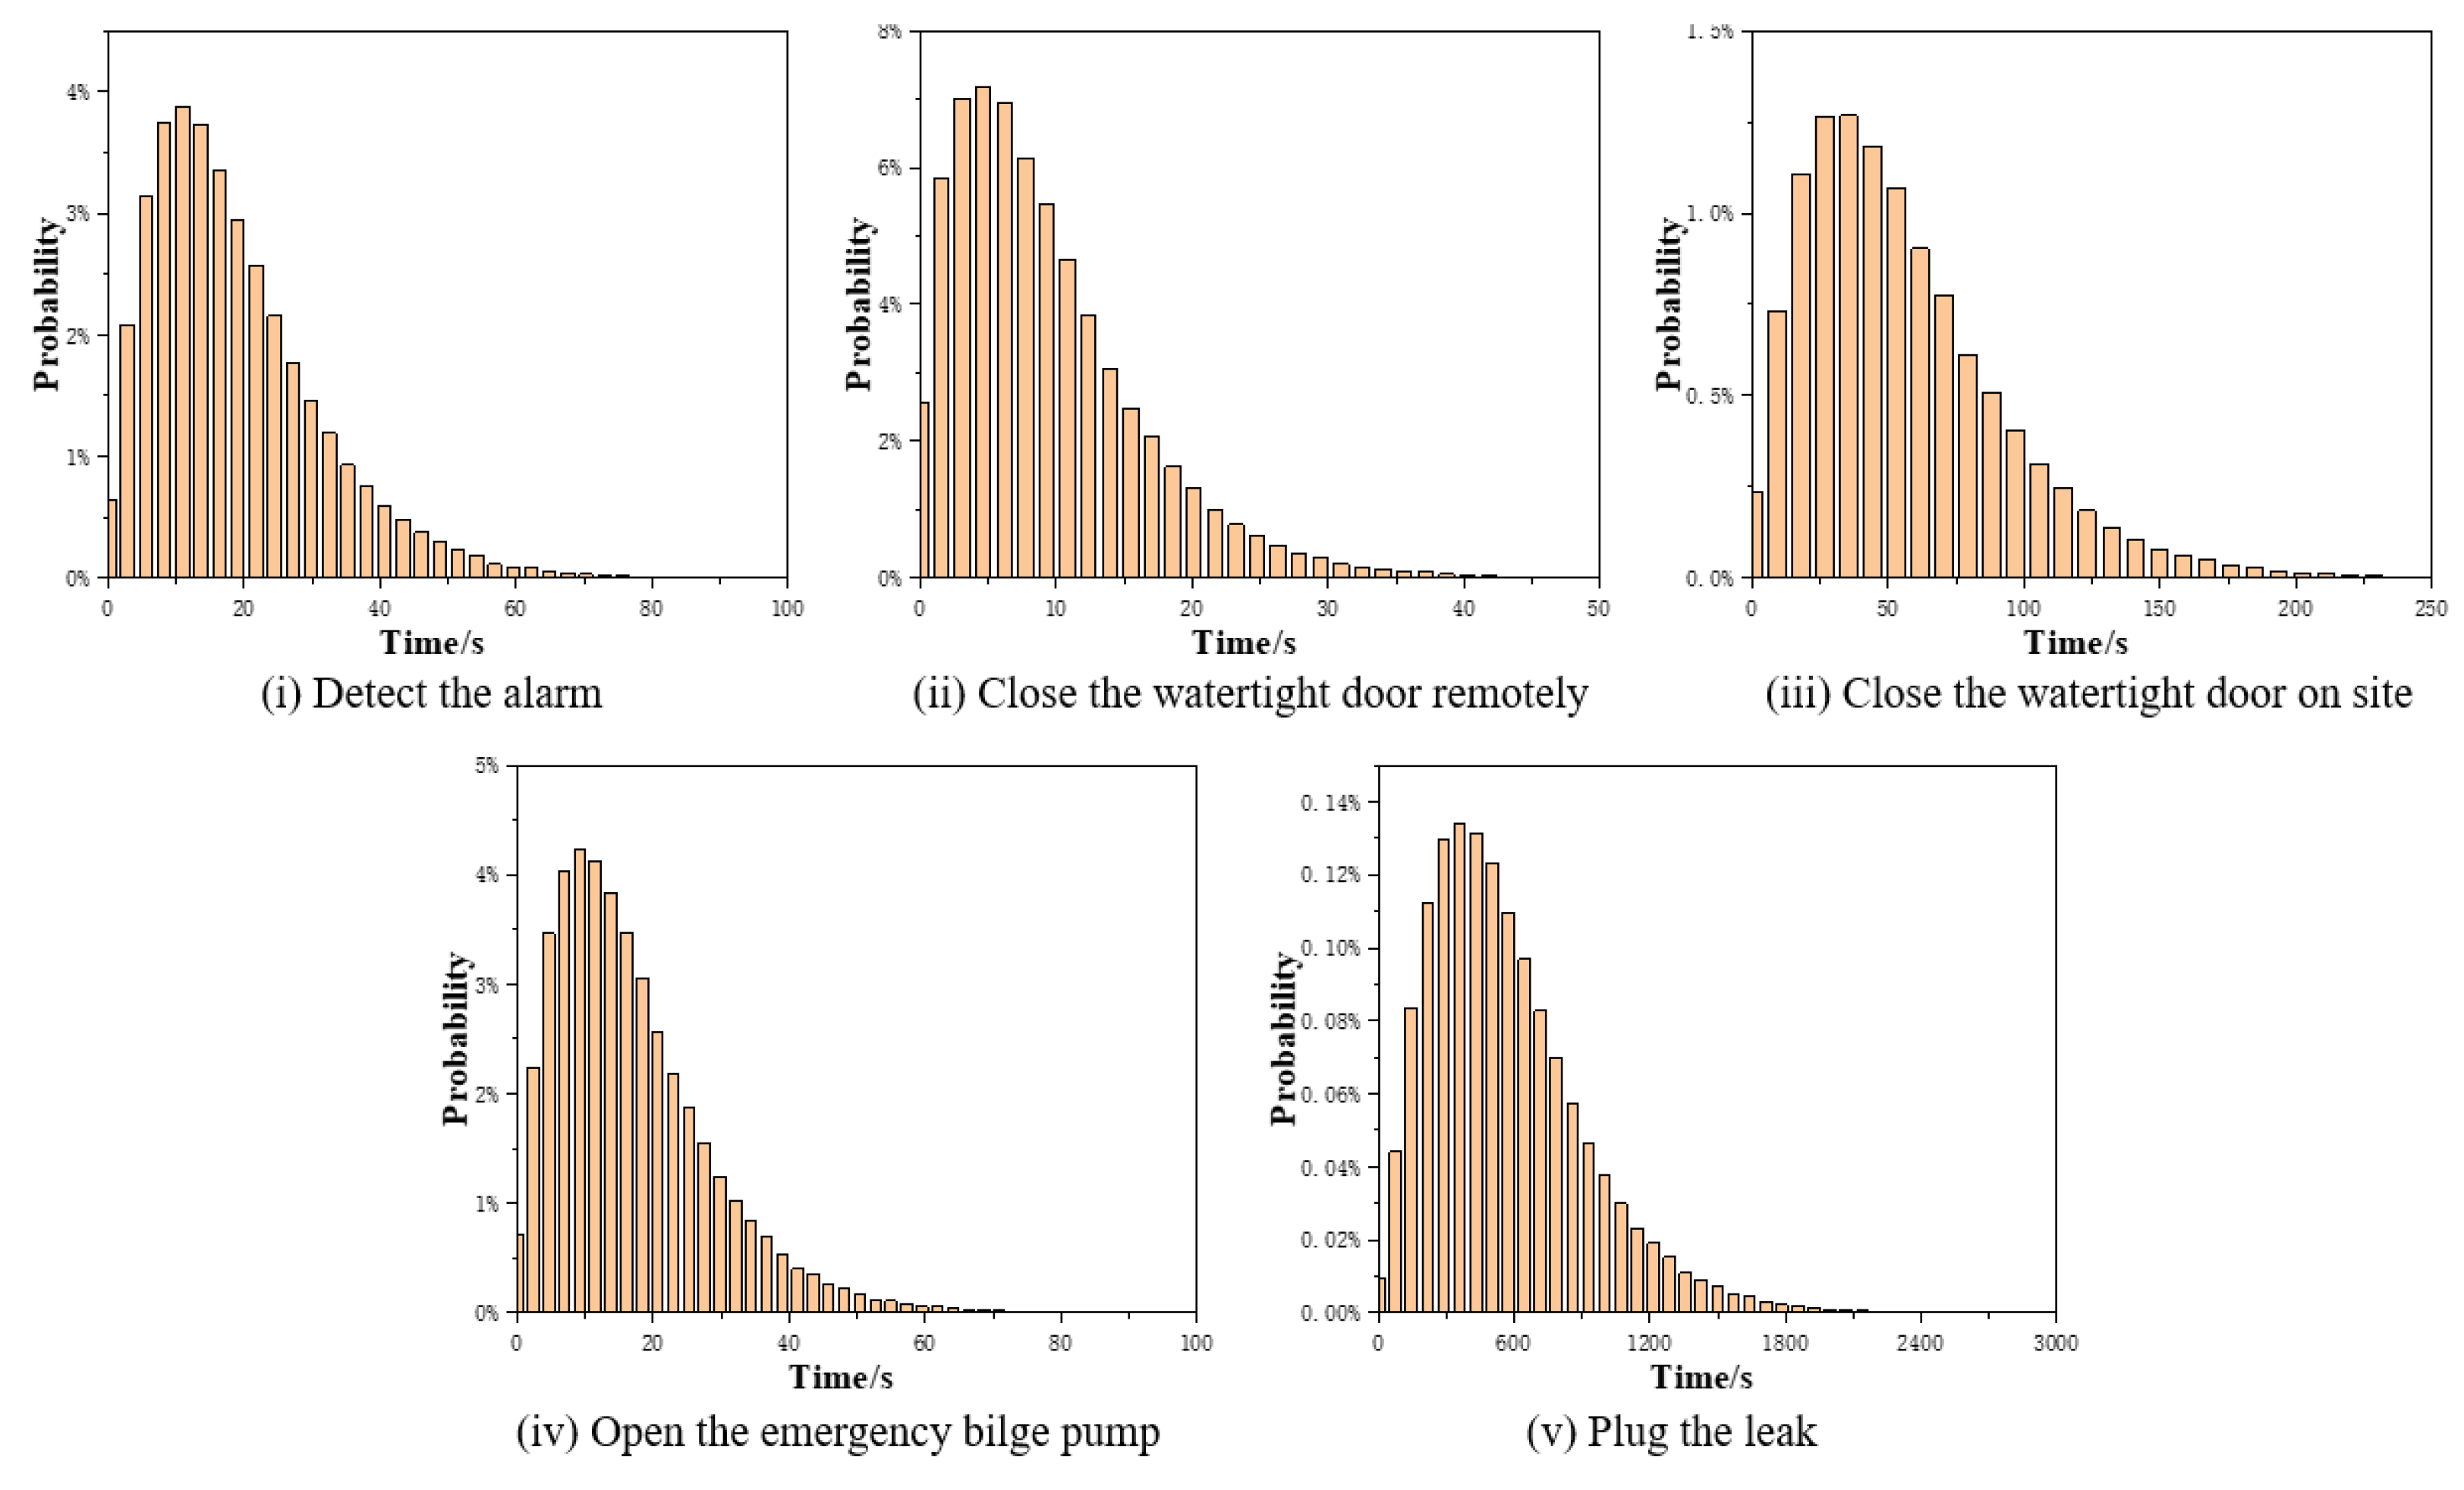
4.2.1. EOP Analysis

The EOP for Ro-Ro flooding incidents is intended to provide the crew with clear information on the operating procedures so that, in the event of damage to the ship causing flooding, proper and effective actions can be taken to mitigate and recover the ship’s loss of stability. At present, several organizations have issued EOPs for flooding incidents. For example, the Australian Maritime Safety Authority states the emergency procedure for ship flooding, and SQE Marine issued the flooding emergency checklist. The guidance document for damage control plans proposed by the International Maritime Organization states that all watertight devices should be closed immediately after damage occurs, the safety of persons on board should be established and the main water pump should be initiated to control the ingress of water [57]. Based on these, this paper only considers the main operating procedures of the master in the flooding incident EOP:
(i)
detect the alarm;
(ii)
close watertight doors remotely;
(iii)
close watertight doors on site if (ii) fails;
(iv)
open the emergency bilge pump;
(v)
plug the leak.
During the execution of subtask (i), if the alarm device malfunctions [10], the crew will be unable to detect emergencies, resulting in a direct failure of emergency response. If the alarm device works properly but the crew does not detect the alarm in time, it will increase the response time of the subtask and affect the process of the emergency operation task.
During the execution of subtasks (ii) and (iii), if there is an electrical system failure (occurring during the remote closing process) or a structural failure (occurring during the onsite closing process), the crew will be unable to close the watertight doors to prevent flooding from spreading to other compartments [51,58]. If the relevant machine is working properly but the crew neglects to close the watertight doors, flooding will also spread to other compartments. Therefore, in both of these subtasks, the consequences of human error and machine failure are consistent. Personnel will no longer spend response time in these tasks when human error and machine failure occur.
During the execution of subtask (iv), if there is a mechanical failure or electrical system failure in the pump [59], the crew will be unable to activate the pump to drain floodwater from the vessel. At this point, the crew is no longer spending response time on this subtask, but the time limitation is also relatively short. If the equipment associated with the emergency pumps is in normal condition, the crew may also mistakenly turn on the wrong pump due to the proximity of the valve, resulting in additional response time to compensate for the error.
During the execution of subtask (v), if the plugging equipment is missing or damaged [60], and the rate of water inflow exceeds the rate of water outflow, the emergency response will fail and the crew will need to evacuate the damaged vessel quickly. If the plugging equipment is intact but the crew plugs the leak incorrectly, resulting in the response time exceeding the time limitation, the consequences are the same as the former.

4.2.2. Qualitative Modeling

Based on the EOP analysis in Section 4.2.1, machine failures and human errors for each subtask are modelled as nodes in the DBN’s intra-slice network, with directed edges representing the relationships between these nodes. The occurrence of either human error or machine failure can lead to the failure of the subtask. In addition, according to dependence (a), the available time affects the human error by influencing the time pressure along with the required time. For the first time-slice, the time limitation for EOP execution is the personnel’s available time. As the task progresses, available time gradually decreases.
The connections between time-slices represent the failure evolution logic between subtasks and are modeled as inter-slice networks within the DBN. Due to the uncertainty in the execution of EOP subtasks, the failure of one subtask may necessitate compensatory actions by other subtasks, while the successful execution of that subtask might render these additional tasks unnecessary. Therefore, in addition to the typical “Success” and “Failure” states, each subtask should also include a “Null” state to account for situations where the task is not executed. In the flooding incident EOP, if “close watertight doors remotely” is successfully executed, “close watertight doors on site” is not required, and the state of this action is “Null”. In addition, according to dependence (b), the human error affects the time limitation and the available time in the next time-slice by affecting the task state as well as the response time in the previous time-slice.
Based on the modelling steps provided in Section 3, the DBN for the flooding incident EOP can be constructed as shown in Figure 8. The blue nodes and arrows indicate dependence (a), while the red nodes and arrows indicate dependence (b). The EOP risk is defined as the failure probability of “plug the leak”.

4.2.3. Quantitative Modeling

In order to quantify the DBN model, this paper determines the prior probabilities of the root nodes, and establishes the continuous SPAR-H method and the dynamic available time model for flooding incidents to determine the CPDs of the nodes in dependence (a) and dependence (b), respectively. The occurrence probability of the nodes related to the machine failures is shown in Table 2.
(a)
Quantify dependence (a) with the continuous SPAR-H method
In the continuous SPAR-H method to quantify dependence (a), the available time and the required time determine the time pressure, while the time pressure and the level of other PSFs determine the HEP. In this paper, it is assumed that the multipliers of other PSFs are all set to 1. Under this condition, the CPD of the human error can be calculated using the following equations:
H E P = 1 2.85 T P , 1 T P < 1 3 , 0.09 0.12 T P , 1 3 1 T P < 2 3 . 0.028 0.027 T P , 2 3 1 T P < 1 ,
(b)
Quantify dependence (b) with the dynamic available time model
In the dynamic available time model to quantify dependence (b), human error on the one hand affects the available time by influencing the response time. Based on Section 3.1, it is known that the response time follows a gamma distribution [47]. This study collects the assessments of three experts in the field on the response time of each emergency response program. The Dempster–Shafer (D-S) theory of evidence is used to integrate the assessments of the three experts. The experts’ assessments of the response times for different emergency actions are presented in Table 3. The basic probability assessments (BPAs) provided by the three experts are 0.85, 0.8, and 0.95. The detailed calculation procedure of D-S evidence theory can be obtained from the literature [62]. By applying the D-S theory of evidence to the integration of the experts’ data, we have obtained the mean values and associated parameters [47] of each emergency response procedure in the flood scenario, as shown in Table 4, and the corresponding gamma-distributed shapes of these response times as shown in Figure 9. This paper assumes that the recovery time is the same as the time taken for the initial execution of the task, i.e., the parameter coefficient λ = 1 .
On the other hand, human error can work with machine failures to cause the failure of subtasks and make necessary emergency functions ineffective, thereby reducing the time limitation for EOP execution and shortening the available time. According to Section 4.1, the maximum tolerable heeling angle ϕ , the inflow velocity Q i n and the outflow velocity Q o u t can affect the time limitation [50]. Among these capsizing parameters, whether the watertight door is closed will affect the maximum tolerable heeling angle ϕ , and can be represented as [51]
ϕ j = 12 ° , 1 j 1 = 0 15 ° , 1 j 1 = 1 ,
where ϕ j represents the maximum tolerable heeling angle after the execution of the j − 1-th subtask “Close the watertight door”. The maximum tolerable heeling angle ϕ determines the amount of water that the ship can tolerate [56], thereby determining the maximum tolerable water level h L that the flooded compartments can tolerate. The outflow velocity Q o u t depends on the power of the emergency bilge pump. Whether the emergency bilge pump is opened will affect the outflow velocity Q o u t , and can be expressed as
Q o u t , m = 0 , 1 m 1 = 0 μ , 1 m 1 = 1 ,
where Q o u t m represents the outflow velocity after the execution of the m − 1-th subtask “Open the emergency bilge pump”. μ represents the power of the emergency bilge pump. Whether the leak is plugged will affect the inflow velocity Q i n , and can be expressed as
Q i n , k = C d S 2 g Δ H , 1 k 1 = 0 0 , 1 k 1 = 1 ,
where Q i n k represents the inflow velocity after the execution of k − 1-th subtask “Plug the leak”. C d is the effective discharge coefficient of the opening, which is usually 0.66. S is the area of the opening. g is the acceleration of gravity. Δ H is the difference of water level on both sides of the opening [4,63]. The inflow velocity Q i n and outflow velocity Q o u t determine the rising rate of the water level inside the flooded compartments, which can be expressed as q = d h d t = Q i n Q o u t A μ . Therefore, the time limitation for the flooding scenario can be expressed as
T L , i = 0 h L ϕ i A μ Q i n , i Q o u t , i d h ,
where h L ϕ i represents the maximum water level height that the flooded compartment can tolerate under the condition of the maximum tolerable heeling angle of ϕ i . The detailed calculation process is provided in Appendix B. Equation (13) can be substituted into Equation (8) to calculate the CPD of the available time. The main dimensions for the passenger ship Estonia are given in Table 5.

4.3. Result Analysis and Discussion

4.3.1. The Result of the Assessment

To simplify the calculation, this paper uses the commercially available software GeNIe developed by the Decision Systems Laboratory, University of Pittsburgh, Pittsburgh, PA, USA to quantify the joint distribution of DBN [67]. Based on the DBN model established in Section 4.2 and the relevant data from the case ship, the EOP risk is calculated as 9.4%.
Based on Section 3.1, it is clear that human error has mutual dependence on available time in the EOP for flooding incidents. This study compares the calculation results considering the mutual dependence with those of the existing method, which usually ignores the time limitation and the ensuing mutual dependence. The comparison of the results is presented in Table 6. When the time limitation and the ensuing mutual dependence are not considered, the EOP risk is 4.1%, which is 56% lower than the result with such considerations. This is because when the mutual dependence is not considered, the HEP will not change as the task progresses, i.e., the HEP will no longer increase as the task deadline approaches. Therefore, not considering the mutual dependence is not beneficial to the assessment of the EOP and may result in the crew underestimating the risk and missing the optimal escape time.

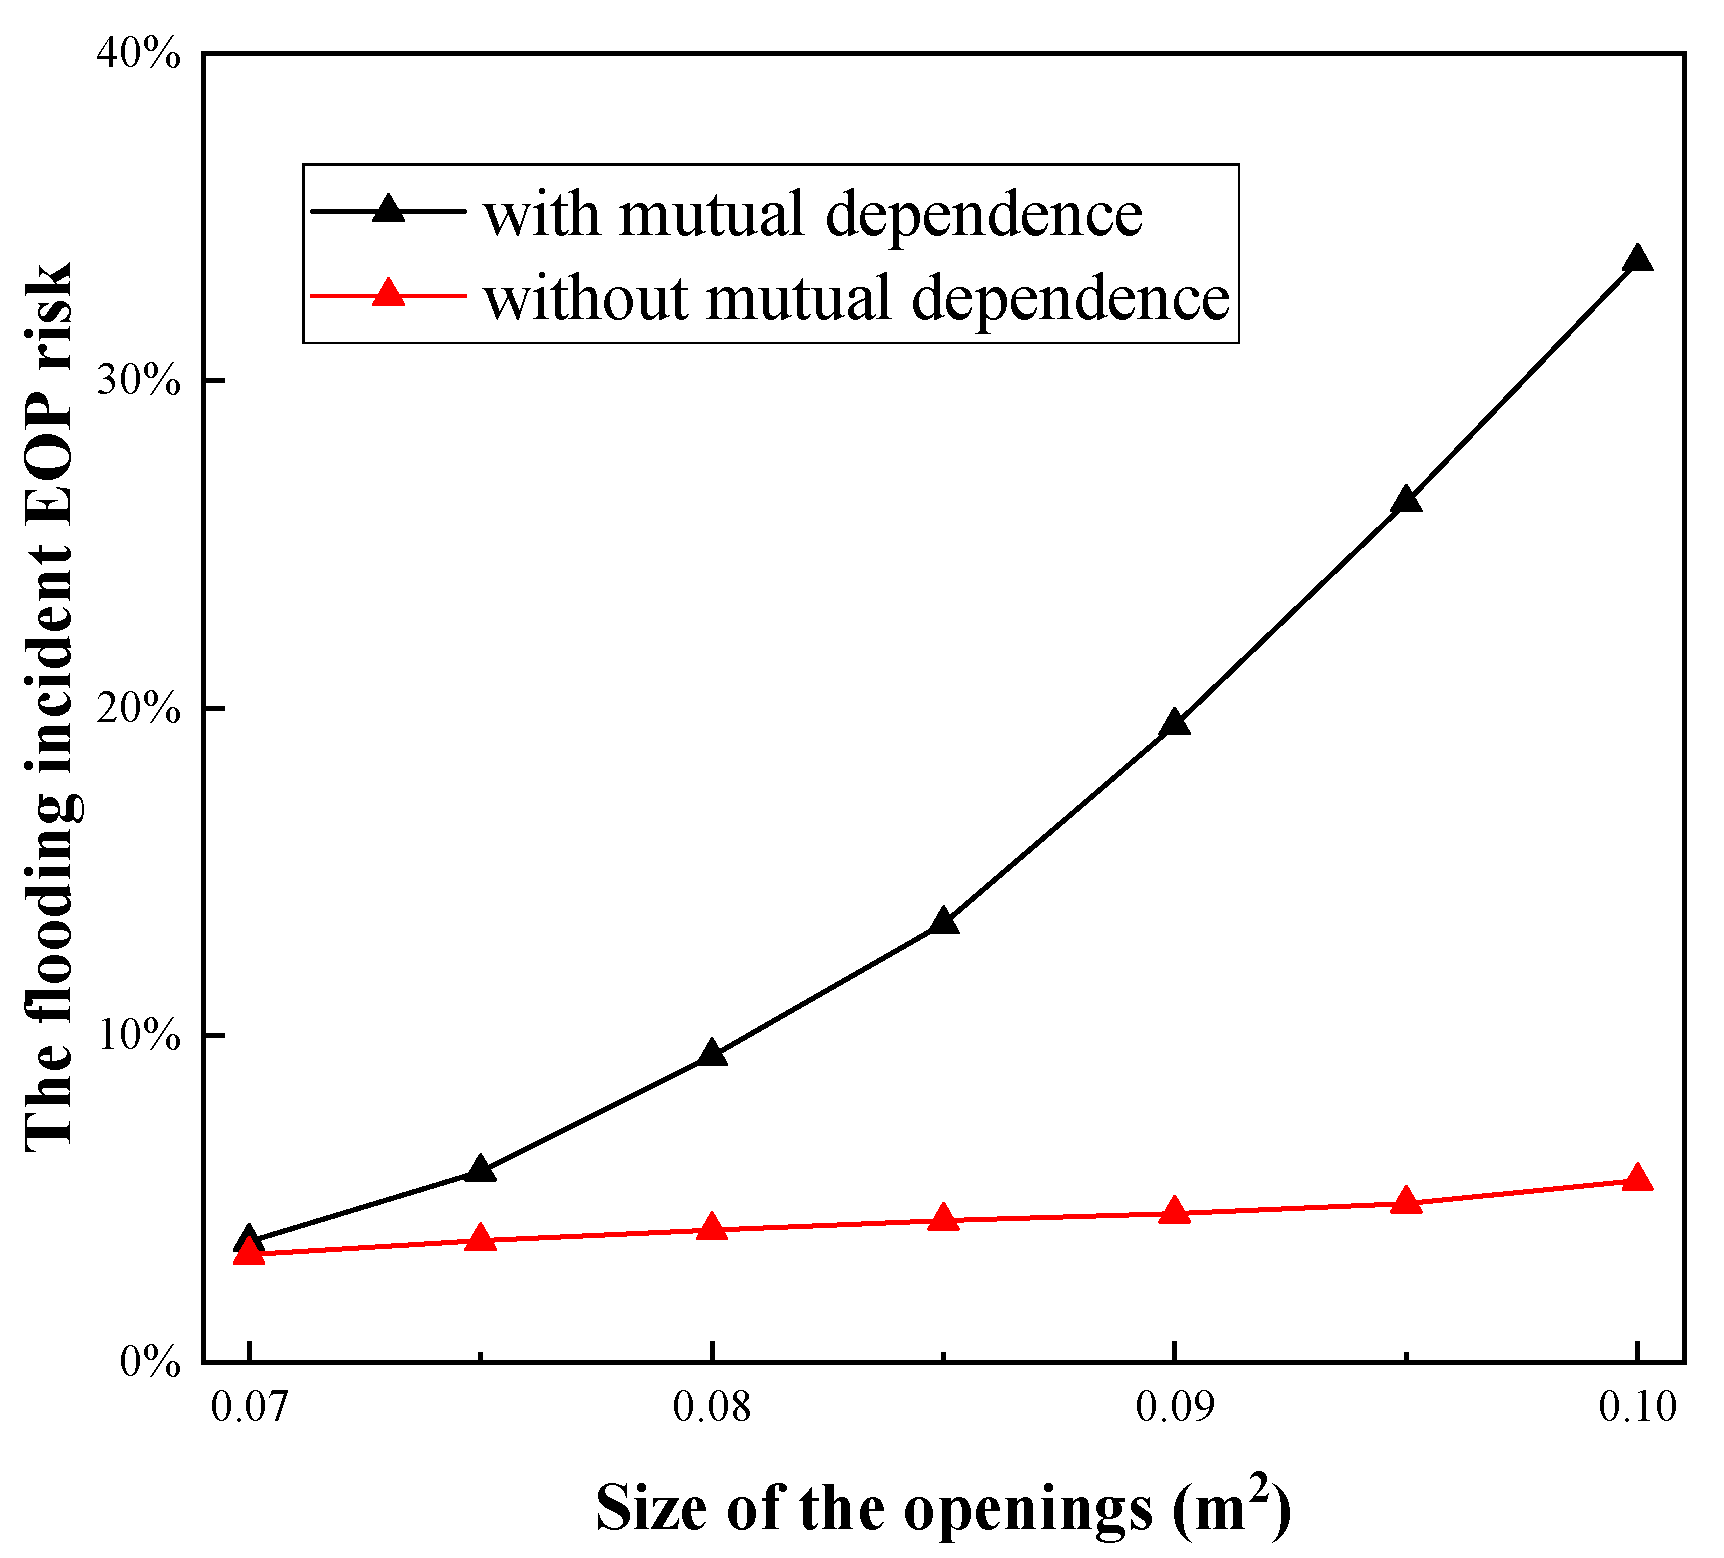
4.3.2. Sensitivity Analysis

Factors such as the size of the openings, the transverse stability, and the type of the flooded compartment can affect the time limitation for executing the EOP. The crew’s experience level can affect both the HEP and the personnel response time. This paper discusses the effect of these factors on the EOP risk and compares the differences with and without considering the mutual dependence.
(1)
Effect of the opening size
Openings in Ro-Ro ships can be classified as small openings, medium openings, large openings and cracks. Small openings usually refer to holes with an area of less than 0.05 m2, and medium openings are usually between 0.05 m2 and 0.2 m2. Large openings are mainly caused by torpedoes, missiles, bombs, and other attacks, and are generally larger than 0.2 m2. Among these, medium and large openings can cause a rapid loss of buoyancy [60]. This paper mainly analyzes the effect of the medium opening size on EOP execution, and the EOP risk under different opening sizes is shown in Figure 10.
The black and red lines in Figure 10 represent the EOP risk with and without considering the mutual dependence, respectively. Since the size of the opening in the damaged Ro-Ro ship will directly affect the inflow velocity Qin of the floodwater, the EOP risk will increase as the opening becomes larger. However, it is worth noting that when the mutual dependence is considered, the EOP risk increases more rapidly, whereas without considering the time limitation and the ensuing mutual dependence, the risk increases more slowly. This is because, under the influence of the mutual dependence, human errors in the previous task influence the available time for the next task, thereby affecting the likelihood of human error in the subsequent task. As the size of the opening increases, the time limitation and the available time for personnel shorten, making human errors more likely and their impact on subsequent tasks more significant. When the mutual dependence is not taken into account, the slow increase in EOP risk is primarily due to the increased opening area affecting the stress levels of personnel at their initial state, leading to an increase in HEP. At the same time, without the mutual dependence, tasks become independent of each other, meaning that human errors in the previous task do not influence the likelihood of errors in subsequent tasks. When the opening area is less than 0.07 m2, personnel have sufficient available time, resulting in lower time pressure and minimal impact from mutual dependence. Consequently, the differences in results between considering and ignoring mutual dependence are relatively small. As the opening area increases, the available time for personnel gradually decreases, and the effects of mutual dependence become more pronounced, leading to a growing difference in the results between the two methods.
(2)
Effect of the transverse stability
The initial transverse stability is one of the most important aspects of ship design, determining the vessel’s stability and resistance to heeling during lateral motion, directly impacting its safety during navigation. The influence of transverse stability is not only evident during the vessel’s normal operation but also becomes particularly significant when encountering unexpected situations. For instance, in adverse weather conditions or instances of water ingress, good transverse stability helps maintain vessel stability, reducing the risk of heeling and minimizing the likelihood of accidents. In general, large marine vessels usually have a high degree of transverse stability in order to remain stable in harsh sea conditions. However, some vessels may compromise a certain degree of transverse stability in exchange for increased cargo capacity or speed.
This paper compares the EOP risk under different initial transverse stability, as shown in Figure 11. The black and red lines in Figure 11 represent the EOP risk with and without considering the mutual dependence, respectively. It is evident that the EOP risk decreases with the improvement of transverse stability. Designers can maximize transportation efficiency while ensuring safety during the design process. However, it can be observed that when mutual dependence is considered, the EOP risk decreases more rapidly, while without considering the time limitation and the ensuing mutual dependence, the risk decreases more slowly. Consequently, as transverse stability decreases, the differences between the results with and without the mutual dependence become progressively smaller. This is because, with greater transverse stability, the available time for personnel increases, leading to a reduction in the HEP, which in turn lowers the likelihood of triggering interdependencies between tasks. When the transverse stability exceeds 1.3 m, personnel have relatively sufficient available time, and the impact of mutual dependence on task interdependencies becomes less significant for EOP risk. As a result, the difference between the two scenarios is minimal.
(3)
Effect of the compartment type
The compartments of the ship contain various components, equipment, machinery, and cargo, which already occupy a certain amount of space within the compartments. Therefore, the actual volume of water in the compartment is always less than the volume of the empty compartment. The ratio of them is referred to as the permeability. The size of the permeability depends on the purpose and configuration of the compartments, and the permeability of various compartments is listed in Table 7 [51].
This paper analyzes different scenarios of water leakage in various ship compartments and presents the EOP risk as shown in Table 8. Based on Table 8, it can be seen that the accident probability after water ingress in storage compartments is significantly less than the remaining three types of compartments. This is because the water level rises at a faster rate when the permeability is small. According to Bernoulli’s theorem, the inflow velocity Q i n will become smaller as the water level rises. In the same amount of time, the volume of water ingress in compartments with lower permeability is less than in compartments with higher permeability, thereby providing more available time. In the event of a flooding incident, the crew can make an initial assessment of the incident based on the type of water ingress compartment. In addition, it is evident that the risk assessment results for the EOP are significantly lower when mutual dependence is not considered, compared to when it is accounted for. Moreover, this difference becomes more pronounced as permeability increases.
(4)
Effect of the crew’s experience level
Experienced crews often possess stronger adaptability and decision-making ability, enabling them to remain calm under pressure and respond quickly and correctly. Conversely, inexperienced crews may get into trouble due to a lack of experience, resulting in an inefficient emergency response and even causing the incident to expand. In the SPAR-H method, the experience level of the personnel is classified as high, normal, and low, with weights of 0.5, 1, and 3, respectively [68]. In this paper, the experience level of crew members is assumed to be normal in the case calculations. Different experience levels will have different effects on HEP. In addition, the experience level of the personnel will affect the response time, with weights of 0.78, 1, and 1.44 [69] corresponding to high, moderate, and low levels, respectively. Therefore, the mean response times of personnel under different experience levels are shown in Table 9. The response time distributions of personnel executing each operational procedure at different experience levels are shown in Figure 12.
By incorporating the above parameters into the model, the EOP risk under different crew experience levels can be obtained, as shown in Table 10. The EOP risk is found to be 1.3% when crew experience is at a high level, representing an 8.1% reduction compared to the normal level. Conversely, when crew experience is at a low level, the EOP risk rises to 55.7%, an increase of 46.3% relative to the normal level. Therefore, enhancing the experience level of emergency personnel through regular training, simulation exercises, and knowledge updates is crucial for decreasing the risk of emergency response.
In addition, Table 10 demonstrates the EOP risk with and without considering the mutual dependence. It can be observed that when crew members have a high level of experience, the results exhibit negligible differences; when the experience level is normal, the differences are small; and when the experience level is low, the differences are more significant. This is because, when the mutual dependence is considered, the experience level influences both the HEP and the response time of personnel. In the case of lower experience levels, personnel tend to spend more time responding and are more prone to making errors, which will reduce the available time for subsequent tasks. When the time limitation and the ensuing mutual dependence are not considered, the experience level only considers the effect on HEP and the performance of the previous task has no effect on the next task.

4.3.3. Findings and Discussion

The method proposed in this paper takes into account the mutual dependence between human error and available time, and presents the EOP risk of a flooding incident obtained by the DBN-based method. The main difference between the proposed method and the existing method lies in the risk factors affecting the EOP risk, i.e., human error and available time, which are mutually dependent. This will result in (a) time pressure continuously changing over time under the influence of available time and increasing the HEP, and (b) human error resulting in uncertain response time and variable time limitation, which may decrease the available time. In the existing model, the influence relationships between risk factors are unidirectional, and the states of risk factors do not change over time [25,28,29]. Therefore, it cannot describe the mutual dependence. By comparing with the result obtained by the existing method, it can be found that the mutual dependence significantly affects the EOP risk. The proposed method can help crew members more accurately assess risk in emergency situations, avoiding delays in evacuation timing. It can also provide guidance in ship design or EOP design to ensure safe navigation.
The results of the assessment by the proposed method are probabilistic and can be updated by obtaining relevant information. The model presented in this paper is a generic form that can be easily extended to other time-limited tasks. It should be noted that the DBN in the model should be adapted to each system accordingly. However, the concepts and the steps to be followed should remain the same as in the proposed method, as described in Section 3. To further enhance the depth and accuracy of future research, advanced techniques such as machine learning and neural networks [70,71,72] could be integrated to improve the model’s capability in capturing complex patterns and dynamic dependencies in emergency scenarios.

5. Conclusions

This study considers the mutual dependence between human error and available time in the risk assessment of flooding incident EOP, and a mutual dependence model is proposed based on the DBN. To quantify the mutual dependence, this paper proposes a continuous SPAR-H method to determine the HEP given time pressure caused by available time, and a dynamic available time model to determine the available time of the subsequent tasks after calculating the increased response times or decreased time limitation caused by human error in the previous task. The continuous SPAR-H method and the dynamic available time model are used in DBN to calculate the CPD of human error and available time, respectively. To quantify the EOP risk, this paper proposes a framework for the assessment process, and builds a DBN model with the example of the Ro-Ro ship Estonia flooding incident. The model can be integrated into a crew decision support system to provide real-time risk assessment and decision-making assistance in the event of a flood. At the same time, the model can also help authorities evaluate existing emergency response procedures by simulating different scenarios and can provide support for developing more effective regulations and training programs.
To the best of our knowledge, this work is the first attempt to use the DBN model to assess the EOP risk considering the mutual dependence between human error and available time. Taking into account the effects caused by the mutual dependence, the EOP risk can be effectively studied, which is more realistic. However, there are limitations in this work. Firstly, the flooding rate modeling is relatively simple and does not take into account complex factors such as ship motion or dynamic environmental conditions. Future work may incorporate advanced techniques to enable more precise and dynamic modeling of flooding scenarios. Secondly, this paper only considers the dynamic effect of the time pressure on HEP. Consideration of multiple PSFs that change over time could improve the effectiveness of the risk assessment, so a further extension of the model could take into account the effect of fatigue, stress and other factors on HEP. Moreover, the 1994 Estonia Ro-Ro ship accident is selected due to the completeness and richness of the available accident investigation data. In future work, we plan to apply the proposed assessment method to modernized ships with more complex automation, enhanced safety systems, and updated operating procedures that would exhibit different human–machine interaction characteristics.

Author Contributions

Conceptualization, K.L., S.Z. and H.C.; methodology, K.L. and H.C.; validation, K.L.; formal analysis, S.Z., J.G. and H.C.; writing—original draft preparation, K.L. and H.C.; writing—review and editing, K.L., S.Z., J.G. and H.C.; visualization, K.L. and H.C.; supervision, S.Z. and J.G.; funding acquisition, H.C. All authors have read and agreed to the published version of the manuscript.

Funding

This research was funded by the National Natural Science Foundation of China under Grant No. 72201018, and the Funding Project of Science and Technology on Reliability and Environmental Engineering Laboratory under Grant No. 614200420230102.

Data Availability Statement

The original contributions presented in this study are included in the article. Further inquiries can be directed to the corresponding author.

Conflicts of Interest

The authors declare no conflicts of interest.

Appendix A

In the continuous SPAR-H method, when the number of negative PSFs is less than three, the HEP can be calculated using the following equations:
H E P = 1 3 0.15 i = 1 7 P S F i T P , 1 T P < 1 3 , 0.09 i = 1 7 P S F i 0.12 i = 1 7 P S F i T P , 1 3 1 T P < 2 3 , 0.028 i = 1 7 P S F i 0.027 i = 1 7 P S F i T P , 2 3 1 T P < 1 ,
where i = 1 7 P S F i represents the product of the corresponding state level multipliers of the remaining PSFs except time. When the number of negative PSFs is three or more, the HEP can be calculated using the following equations:
H E P = 1 2.997 0.05 i = 1 7 P S F i + 0.999 1 T P , 1 T P < 1 3 , 0.11988 i = 1 7 P S F i 0.01 i = 1 7 P S F i + 0.999 0.05 i = 1 7 P S F i + 0.999 1 T P 1 3 + 0.05 i = 1 7 P S F i 0.05 i = 1 7 P S F i + 0.999 , 1 3 1 T P < 2 3 . 0.026973 i = 1 7 P S F i 0.001 i = 1 7 P S F i + 0.999 0.01 i = 1 7 P S F i + 0.999 1 T P 2 3 + 0.01 i = 1 7 P S F i 0.01 i = 1 7 P S F i + 0.999 , 2 3 1 T P < 1 ,

Appendix B

The transverse stability determines the stability of the ship in the transverse direction (i.e., the direction of the ship’s width). After flooding, the transverse stability G M ¯ will be changed to [73]
G M 1 ¯ = G M ¯ + p Δ + p H + δ d 2 z G M ¯ w i x Δ + p ,
where ∆ is the displacement before flooding, and H is the draught depth. δ d = p w A is the average draft increment of the ship in the flooded compartment [73], p = w v is the increased liquid weight, v is the flooded compartment volume, A is the waterline area, and w is the seawater density. i x = 1 12 l b 3 is the transverse inertia moment of the free surface in the compartment. Under the new transverse stability G M 1 ¯ , the ship’s transverse heeling angle ϕ is [73]
tan ϕ = p y Δ + p G M 1 ¯ .
Therefore, the maximum water level inside the flooded compartment when the ship reaches its maximum transverse heeling angle is
h L = tan ϕ max H y + tan ϕ max H y 2 2 tan ϕ max 2 1 w A 1 w A w i x Δ G M ¯ 0.5 tan ϕ max 1 w A 1 w A w A μ ,
where A is the area of the flooded compartment, and μ is the permeability of the compartment.
The time limitation is not only associated with the water level but also influenced by the flow velocity of floodwater. The flow velocity of the floodwater is affected by the size and location of the opening, which can be calculated using the modified Bernoulli’s theorem [4,63]:
Q = C d S 2 g Δ H ,
where C d is the effective discharge coefficient of the opening, which is usually 0.66. S is the area of the opening, g is the acceleration of gravity and Δ H is the difference of water level on both sides of the opening [4,63]:
Δ H = H max ( h o p e , h ) ,
where h o p e is the height of the opening above the bottom of the boat and h is the height of the water level inside the ship, as shown in Figure A1.
Figure A1. The flood flow characteristics under Bernoulli’s theorem.
Jmse 13 00853 g0a1
Based on the above Equations (A6) and (A7), it is clear that the flow velocity of the floodwater will be higher when the opening is larger in area and lower in position, which directly affects the time limitation. If the opening is at the bottom of the compartment, i.e., h o p e = 0 , the flow velocity of the floodwater will decrease as the water level rises, and can be expressed as
q = d h d t = Q A μ = C d S A μ 2 g H h ,
where A is the area of the flooded compartment, and μ is the permeability of the compartment. Since the flow rate of the flood increases as the location of the opening decreases, this paper assumes that the bottom of a watertight compartment on the ship is damaged, i.e., the most severe scenario. Therefore, the time limitation for emergency response is the time required to reach the maximum water level h L , and can be expressed as
T L = 0 h L 1 q d h = A μ C d S 2 g H H h L .

References

  1. Kujala, P.; Goerlandt, F.; Way, B.; Smith, D.; Yang, M.; Khan, F.; Veitch, B. Review of Risk-Based Design for Ice-Class Ships. Mar. Struct. 2019, 63, 181–195. [Google Scholar] [CrossRef]
  2. Sepehri, A.; Vandchali, H.R.; Siddiqui, A.W.; Montewka, J. The Impact of Shipping 4.0 on Controlling Shipping Accidents: A Systematic Literature Review. Ocean Eng. 2022, 243, 110162. [Google Scholar] [CrossRef]
  3. Zhou, J.; Reniers, G.; Khakzad, N. Application of Event Sequence Diagram to Evaluate Emergency Response Actions during Fire-Induced Domino Effects. Reliab. Eng. Syst. Saf. 2016, 150, 202–209. [Google Scholar] [CrossRef]
  4. Spanos, D.; Papanikolaou, A. On the Time for the Abandonment of Flooded Passenger Ships Due to Collision Damages. J. Mar. Sci. Technol. 2014, 19, 327–337. [Google Scholar] [CrossRef]
  5. Wu, B.; Yip, T.L.; Yan, X.; Guedes Soares, C. Review of Techniques and Challenges of Human and Organizational Factors Analysis in Maritime Transportation. Reliab. Eng. Syst. Saf. 2022, 219, 108249. [Google Scholar] [CrossRef]
  6. Kim, T.; Nazir, S.; Øvergård, K.I. A STAMP-Based Causal Analysis of the Korean Sewol Ferry Accident. Saf. Sci. 2016, 83, 93–101. [Google Scholar] [CrossRef]
  7. Kaptan, M. Analysis of Accidents during Vehicle Stowage on RO-RO Vessels by Using Fuzzy Bayesian Networks. Ocean Eng. 2022, 260, 111997. [Google Scholar] [CrossRef]
  8. Maternová, A.; Materna, M.; Dávid, A.; Török, A.; Švábová, L. Human Error Analysis and Fatality Prediction in Maritime Accidents. J. Mar. Sci. Eng. 2023, 11, 2287. [Google Scholar] [CrossRef]
  9. Zeng, S.; You, Q.; Guo, J.; Che, H. Situation Awareness-Based Safety Assessment Method for Human–Autonomy Interaction Process Considering Anchoring and Omission Biases. J. Mar. Sci. Eng. 2025, 13, 158. [Google Scholar] [CrossRef]
  10. Ahn, S.I.; Kurt, R.E. Application of a CREAM Based Framework to Assess Human Reliability in Emergency Response to Engine Room Fires on Ships. Ocean Eng. 2020, 216, 108078. [Google Scholar] [CrossRef]
  11. Hollnagel, E. Cognitive Reliability and Error Analysis Method: CREAM, 1st ed.; Elsevier: Oxford, UK; New York, NY, USA, 1998; ISBN 978-0-08-042848-2. [Google Scholar]
  12. Fan, H.; Enshaei, H.; Jayasinghe, S.G. Human Error Probability Assessment for LNG Bunkering Based on Fuzzy Bayesian Network-CREAM Model. J. Mar. Sci. Eng. 2022, 10, 333. [Google Scholar] [CrossRef]
  13. Li, K.; Guo, J.; Zeng, S.; Che, H. Reliability Assessment of Man-machine Systems Subject to Probabilistic Common Cause Errors. Qual. Reliab. Eng. Int. 2024, 40, 2399–2422. [Google Scholar] [CrossRef]
  14. Bye, A.; Laumann, K.; Taylor, C.; Rasmussen, M.; Øie, S.; van de Merwe, K.; Øien, K.; Boring, R.; Paltrinieri, N.; Wærø, I.; et al. The Petro-HRA Guideline; Institutt for Energiteknikk: Kjeller, Norway, 2017; ISBN 978-82-7017-901-5. [Google Scholar]
  15. Xi, Y.T.; Yang, Z.L.; Fang, Q.G.; Chen, W.J.; Wang, J. A New Hybrid Approach to Human Error Probability Quantification–Applications in Maritime Operations. Ocean Eng. 2017, 138, 45–54. [Google Scholar] [CrossRef]
  16. Ruan, F.; Chen, C.-H.; Cheng, Y.; Wang, J.-Y.; Chen, L.-W. Study on Evaluation Method for Nuclear Emergency Rescue Measures at Containment Vessel. Ann. Nucl. Energy 2021, 151, 107942. [Google Scholar] [CrossRef]
  17. Zou, Y.; Zhao, F.; Xu, S.; Zou, S. Evaluation of Emergency Response Measures for the LOCA of A Marine Reactor. Sustainability 2022, 14, 13873. [Google Scholar] [CrossRef]
  18. Ceylan, B.O.; Akyuz, E.; Arslan, O. Systems-Theoretic Accident Model and Processes (STAMP) Approach to Analyse Socio-Technical Systems of Ship Allision in Narrow Waters. Ocean Eng. 2021, 239, 109804. [Google Scholar] [CrossRef]
  19. Peng, C.; Zhen, X.; Huang, Y. A Multi-Layer FRAM Based Approach to Short-Term Human-Automation Resilience Assessment: A Case Study on Dynamic Positioning System in Offshore Tandem Offloading Process. Ocean Eng. 2022, 266, 112728. [Google Scholar] [CrossRef]
  20. Chen, C.; Reniers, G.; Khakzad, N. A Thorough Classification and Discussion of Approaches for Modeling and Managing Domino Effects in the Process Industries. Saf. Sci. 2020, 125, 104618. [Google Scholar] [CrossRef]
  21. Ricci, F.; Yang, M.; Reniers, G.; Cozzani, V. Emergency Response in Cascading Scenarios Triggered by Natural Events. Reliab. Eng. Syst. Saf. 2024, 243, 109820. [Google Scholar] [CrossRef]
  22. Zhou, C.; Qin, S.; Jiahao, Z.; Du, L.; Zhang, F. Modeling and Analysis of External Emergency Response to Ship Fire Using HTCPN and Markov Chain. Ocean Eng. 2024, 297, 117089. [Google Scholar] [CrossRef]
  23. Zhou, J.; Reniers, G.; Cozzani, V. A Petri-Net Approach for Firefighting Force Allocation Analysis of Fire Emergency Response with Backups. Reliab. Eng. Syst. Saf. 2023, 229, 108847. [Google Scholar] [CrossRef]
  24. Zhou, J.; Reniers, G. Petri Net Simulation of Multi-Department Emergency Response to Avert Domino Effects in Chemical Industry Accidents. Process Saf. Environ. Prot. 2021, 146, 916–926. [Google Scholar] [CrossRef]
  25. Liu, Q.; Guo, K.; Wu, X.; Xiao, Z.; Zhang, L. Simulation-Based Rescue Plan Modeling and Performance Assessment towards Resilient Metro Systems under Emergency. Reliab. Eng. Syst. Saf. 2024, 241, 109642. [Google Scholar] [CrossRef]
  26. Liu, Q.; He, R.; Zhang, L. Simulation-Based Multi-Objective Optimization for Enhanced Safety of Fire Emergency Response in Metro Stations. Reliab. Eng. Syst. Saf. 2022, 228, 108820. [Google Scholar] [CrossRef]
  27. Groth, K.; Wang, C.; Mosleh, A. Hybrid Causal Methodology and Software Platform for Probabilistic Risk Assessment and Safety Monitoring of Socio-Technical Systems. Reliab. Eng. Syst. Saf. 2010, 95, 1276–1285. [Google Scholar] [CrossRef]
  28. Jiang, C.; He, Z.; Li, F.; Xie, F.; Zheng, L.; Yang, J.; Yang, M. A Hybrid Computing Framework for Risk-Oriented Reliability Analysis in Dynamic PSA Context: A Case Study. Qual. Reliab. Eng. Int. 2022, 39, 3445–3471. [Google Scholar] [CrossRef]
  29. Mosleh, A.; Dias, A.; Eghbali, G.; Fazen, K. An Integrated Framework for Identification, Classification, and Assessment of Aviation Systems Hazards. In Probabilistic Safety Assessment and Management; Spitzer, C., Schmocker, U., Dang, V.N., Eds.; Springer: London, UK, 2004; pp. 2384–2390. ISBN 978-1-4471-1057-6. [Google Scholar]
  30. Wang, T.; Wu, Q.; Diaconeasa, M.A.; Yan, X.; Mosleh, A. On the Use of the Hybrid Causal Logic Methodology in Ship Collision Risk Assessment. J. Mar. Sci. Eng. 2020, 8, 485. [Google Scholar] [CrossRef]
  31. Zhang, D.; Han, Z.; Zhang, K.; Zhang, J.; Zhang, M.; Zhang, F. Use of Hybrid Causal Logic Method for Preliminary Hazard Analysis of Maritime Autonomous Surface Ships. J. Mar. Sci. Eng. 2022, 10, 725. [Google Scholar] [CrossRef]
  32. Meng, H.; An, X. Dynamic Risk Analysis of Emergency Operations in Deepwater Blowout Accidents. Ocean Eng. 2021, 240, 109928. [Google Scholar] [CrossRef]
  33. Wang, C.; Liu, Y.; Lian, X.; Luo, J.; Liang, C.; Ma, H. Dynamic Risk Assessment of Plugging and Abandonment Operation Process of Offshore Wells Based on Dynamic Bayesian Network. Ocean Eng. 2023, 270, 113625. [Google Scholar] [CrossRef]
  34. Liu, Z.; Ma, Q.; Cai, B.; Liu, Y.; Zheng, C. Risk Assessment on Deepwater Drilling Well Control Based on Dynamic Bayesian Network. Process Saf. Environ. Prot. 2021, 149, 643–654. [Google Scholar] [CrossRef]
  35. An, X.; Yin, Z.; Tong, Q.; Fang, Y.; Yang, M.; Yang, Q.; Meng, H. An Integrated Resilience Assessment Methodology for Emergency Response Systems Based on Multi-Stage STAMP and Dynamic Bayesian Networks. Reliab. Eng. Syst. Saf. 2023, 238, 109445. [Google Scholar] [CrossRef]
  36. Liu, X.; Wang, C.; Yin, Z.; An, X.; Meng, H. Risk-Informed Multi-Objective Decision-Making of Emergency Schemes Optimization. Reliab. Eng. Syst. Saf. 2024, 245, 109979. [Google Scholar] [CrossRef]
  37. Guo, Y.; Jin, Y.; Hu, S.; Yang, Z.; Xi, Y.; Han, B. Risk Evolution Analysis of Ship Pilotage Operation by an Integrated Model of FRAM and DBN. Reliab. Eng. Syst. Saf. 2023, 229, 108850. [Google Scholar] [CrossRef]
  38. Wang, Y.; Fu, S. Framework for Process Analysis of Maritime Accidents Caused by the Unsafe Acts of Seafarers: A Case Study of Ship Collision. J. Mar. Sci. Eng. 2022, 10, 1793. [Google Scholar] [CrossRef]
  39. Xi, Y.; Zhang, X.; Han, B.; Zhu, Y.; Fan, C.; Kim, E. Advanced Human Reliability Analysis Approach for Ship Convoy Operations via a Model of IDAC and DBN: A Case from Ice-Covered Waters. J. Mar. Sci. Eng. 2024, 12, 1536. [Google Scholar] [CrossRef]
  40. Qian, S.S.; Miltner, R.J. A Continuous Variable Bayesian Networks Model for Water Quality Modeling: A Case Study of Setting Nitrogen Criterion for Small Rivers and Streams in Ohio, USA. Environ. Model. Softw. 2015, 69, 14–22. [Google Scholar] [CrossRef]
  41. Ahn, S.I.; Kurt, R.E.; Akyuz, E. Application of a SPAR-H Based Framework to Assess Human Reliability during Emergency Response Drill for Man Overboard on Ships. Ocean Eng. 2022, 251, 111089. [Google Scholar] [CrossRef]
  42. Parhizkar, T.; Utne, I.B.; Vinnem, J.E.; Mosleh, A. Dynamic Probabilistic Risk Assessment of Decision-Making in Emergencies for Complex Systems, Case Study: Dynamic Positioning Drilling Unit. Ocean Eng. 2021, 237, 109653. [Google Scholar] [CrossRef]
  43. IMO. Guidelines for a Structure of an Integrated System of Contingency Planning for Shipboard Emergencies; International Maritime Organization: Lambeth, London, 1997. [Google Scholar]
  44. Kim, Y.; Kim, J.; Park, J.; Choi, S.Y.; Kim, S.; Jung, W.; Kim, H.E.; Shin, S.K. An Algorithm for Evaluating Time-Related Human Reliability Using Instrumentation Cues and Procedure Cues. Nucl. Eng. Technol. 2021, 53, 368–375. [Google Scholar] [CrossRef]
  45. Siegel, A.I. Man-Machine Simulation Models: Psychosocial and Performance Interaction; Wiley-Interscience: Hoboken, NJ, USA, 1969. [Google Scholar]
  46. Hu, L.; Pan, X.; Kang, R.; Chu, J.; Gao, Y.; Xue, Z.; Baoyin, H. Dynamic Risk Assessment of Uncertain Random System Considering Operator’s Simple Emergency-Stop Action in Short Time Window. Reliab. Eng. Syst. Saf. 2024, 252, 110479. [Google Scholar] [CrossRef]
  47. Palmer, E.M.; Horowitz, T.S.; Torralba, A.; Wolfe, J.M. What Are the Shapes of Response Time Distributions in Visual Search? J. Exp. Psychol. Hum. Percept. Perform. 2011, 37, 58–71. [Google Scholar] [CrossRef]
  48. Wang, Z.; Zeng, S.; Guo, J.; Che, H. A Bayesian Network for Reliability Assessment of Man-Machine Phased-Mission System Considering the Phase Dependencies of Human Cognitive Error. Reliab. Eng. Syst. Saf. 2021, 207, 107385. [Google Scholar] [CrossRef]
  49. Endrina, N.; Rasero, J.C.; Konovessis, D. Risk Analysis for RoPax Vessels: A Case of Study for the Strait of Gibraltar. Ocean Eng. 2018, 151, 141–151. [Google Scholar] [CrossRef]
  50. Papanikolaou, A. (Ed.) Risk-Based Ship Design; Springer: Berlin/Heidelberg, Germany, 2009; ISBN 978-3-540-89041-6. [Google Scholar]
  51. IMO. SOLAS Consolidated Edition 2020; International Maritime Organization: London, UK, 2020; p. 576. [Google Scholar]
  52. Ruponen, P. Progressive Flooding of a Damaged Passenger Ship; Helsinki University of Technology: Espoo, Finland, 2007; p. 130. [Google Scholar]
  53. Ignjatović, L.; Stojković, M.; Ivetić, D.; Milašinović, M.; Milivojević, N. Quantifying Multi-Parameter Dynamic Resilience for Complex Reservoir Systems Using Failure Simulations: Case Study of the Pirot Reservoir System. Water 2021, 13, 3157. [Google Scholar] [CrossRef]
  54. Stojkovic, M.; Simonovic, S.P. System Dynamics Approach for Assessing the Behaviour of the Lim Reservoir System (Serbia) under Changing Climate Conditions. Water 2019, 11, 1620. [Google Scholar] [CrossRef]
  55. Stojković, M.; Mijić, A.; Dobson, B.; Marjanović, D.; Majkić-Dursun, B. Novel Perspectives on Environmental Dynamic Resilience: Adapting Urban Water Systems to a Changing Climate. Water Resour. Manag. 2024, 38, 4455–4472. [Google Scholar] [CrossRef]
  56. Lee, G.J.; Lee, D.; Choi, J.; Kang, H.J. A Concept Study on Design Alternatives for Minimizing Accident Consequences in Maritime Autonomous Surface Ships. J. Mar. Sci. Eng. 2023, 11, 907. [Google Scholar] [CrossRef]
  57. Guidelines for Damage Control Plans and Information to the Master 2010. International Maritime Organization (IMO), London, United Kingdom. Available online: https://imorules.com/MSCCIRC_1245.html (accessed on 20 March 2024).
  58. Ruponen, P.; Montewka, J.; Tompuri, M.; Manderbacka, T.; Hirdaris, S. A Framework for Onboard Assessment and Monitoring of Flooding Risk Due to Open Watertight Doors for Passenger Ships. Reliab. Eng. Syst. Saf. 2022, 226, 108666. [Google Scholar] [CrossRef]
  59. Minette, R.S.; SilvaNeto, S.F.; Vaz, L.A.; Monteiro, U.A. Experimental Modal Analysis of Electrical Submersible Pumps. Ocean Eng. 2016, 124, 168–179. [Google Scholar] [CrossRef]
  60. Xin, G.; Cheng, Z.; Gao, C. Design of Marine Automatic Leakage Stoppage System Based on Artificial Eddy Current. IOP Conf. Ser. Mater. Sci. Eng. 2019, 563, 042030. [Google Scholar] [CrossRef]
  61. Parhizkar, T.; Hogenboom, S.; Vinnem, J.E.; Utne, I.B. Data Driven Approach to Risk Management and Decision Support for Dynamic Positioning Systems. Reliab. Eng. Syst. Saf. 2020, 201, 106964. [Google Scholar] [CrossRef]
  62. Fan, X.; Zuo, M.J. Fault Diagnosis of Machines Based on D–S Evidence Theory. Part 1: D–S Evidence Theory and Its Improvement. Pattern Recognit. Lett. 2006, 27, 366–376. [Google Scholar] [CrossRef]
  63. Jalonen, R.; Ruponen, P.; Weryk, M.; Naar, H.; Vaher, S. A Study on Leakage and Collapse of Non-Watertight Ship Doors under Floodwater Pressure. Mar. Struct. 2017, 51, 188–201. [Google Scholar] [CrossRef]
  64. Final Report Research Study on the Sinking Sequence of MV Estonia 2008. Swedish National Maritime and Transport Engineering Research Institute (SSPA), Gothenburg, Sweden. Available online: https://estonia1994.ee/en/news/sspa-consortium-final-report (accessed on 20 March 2024).
  65. Jasionowski, A. Decision Support for Ship Flooding Crisis Management. Ocean Eng. 2011, 38, 1568–1581. [Google Scholar] [CrossRef]
  66. Lee, K.W.; Han, G.Y.; Kim, M.E. Proposed Design Criteria for a Bilge Pumping System for Large Container Ships. Int. J. Marit. Eng. 2021, 163, A71–A79. [Google Scholar] [CrossRef]
  67. You, Q.; Guo, J.; Zeng, S.; Che, H. A Dynamic Bayesian Network Based Reliability Assessment Method for Short-Term Multi-Round Situation Awareness Considering Round Dependencies. Reliab. Eng. Syst. Saf. 2024, 243, 109838. [Google Scholar] [CrossRef]
  68. Groth, K.M.; Swiler, L.P. Bridging the Gap between HRA Research and HRA Practice: A Bayesian Network Version of SPAR-H. Reliab. Eng. Syst. Saf. 2013, 115, 33–42. [Google Scholar] [CrossRef]
  69. Ramezani, A.; Nazari, T.; Rabiee, A.; Hadad, K.; Faridafshin, M. Human Error Probability Quantification for NPP Post-Accident Analysis Using Cognitive-Based THERP Method. Prog. Nucl. Energy 2020, 123, 103281. [Google Scholar] [CrossRef]
  70. Stojković, M.; Marjanović, D.; Rakić, D.; Ivetić, D.; Simić, V.; Milivojević, N.; Trajković, S. Assessment of Water Resources System Resilience under Hazardous Events Using System Dynamic Approach and Artificial Neural Networks. J. Hydroinform. 2023, 25, 208–225. [Google Scholar] [CrossRef]
  71. Simic, V.; Stojkovic, M.; Milivojevic, N.; Bacanin, N. Assessing Water Resources Systems’ Dynamic Resilience under Hazardous Events via a Genetic Fuzzy Rule-Based System. J. Hydroinform. 2023, 25, 318–331. [Google Scholar] [CrossRef]
  72. Milivojević, V.; Ćirović, V.; Stojković, M.; Mirković, U.; Kuzmanović, V.; Milivojević, N.; Stojanović, B. Machine Learning-Based Interactive Dynamic Resilience Assessment for Complex Hydropower Systems. J. Big Data 2025, 12, 44. [Google Scholar] [CrossRef]
  73. Sheng, Z. Principles of Naval Architecture, 2nd ed.; Shanghai Jiao Tong University Press: Shanghai, China, 2017; ISBN 978-7-313-17996-8. [Google Scholar]
Figure 1. The mutual dependence between human error and available time.
Jmse 13 00853 g001
Figure 2. The linear function of HEP.
Jmse 13 00853 g002
Figure 3. Gamma distribution of response time.
Jmse 13 00853 g003
Figure 4. Schematic diagram of DBN with mutual dependence.
Jmse 13 00853 g004
Figure 5. The probability modeling process of the DBN.
Jmse 13 00853 g005
Figure 6. The overall framework of the method.
Jmse 13 00853 g006
Figure 7. The schematic diagram of the second type of flooded compartment.
Jmse 13 00853 g007
Figure 8. The DBN structure for flooding incident EOP.
Jmse 13 00853 g008
Figure 9. The distribution of the response time.
Jmse 13 00853 g009
Figure 10. The EOP risk under different opening sizes.
Jmse 13 00853 g010
Figure 11. The EOP risk under different initial transverse stability.
Jmse 13 00853 g011
Figure 12. The response time distribution of personnel at different experience levels.
Jmse 13 00853 g012
Table 1. SPAR-H time multipliers for action tasks.
SPAR-H LevelsMultipliers
Inadequate time-
Barely adequate time: 1/3 the average time50
Barely adequate time: 2/3 the average time10
Nominal time1
Table 2. The occurrence probability of the machine failures.
Operating ProcedureMachine FailureProbabilitySources
Detect the alarmSensor failure1.22 × 10−7[61]
Hardware component failure1.22 × 10−7[61]
Close the watertight door remotelyController failure1.22 × 10−7[61]
Switch failure1.22 × 10−7[61]
Close the watertight door on siteBulkhead deformation2.44 × 10−7Assumed
Deck deformation2.44 × 10−7Assumed
Open the emergency bilge pumpHardware component failure1.22 × 10−7[61]
Blocked pipe1.22 × 10−7[61]
Controller failure1.22 × 10−7[61]
Switch failure1.22 × 10−7[61]
Plug the leakLack of equipment2.44 × 10−7Assumed
Leak plugging equipment breakdown2.44 × 10−7Assumed
Table 3. The experts’ assessments of the response times for different emergency actions.
Operating ProcedureExperts
P1P2P3
Detect the alarm[17, 21][18, 22][19, 23]
Close the watertight door remotely[10, 12][9, 13][8, 11]
Close the watertight door on site[56, 61][58, 64][59, 65]
Open the emergency bilge pump[15, 18][16, 19][18, 21]
Plug the leak[287, 302][292, 312][300, 307]
Table 4. Parameters of the response time distribution.
Operating ProcedureMean Value α
Detect the alarm202.5
Close the watertight door remotely102
Close the watertight door on site602.5
Open the emergency bilge pump182.4
Plug the leak3003
Table 5. The main dimensions of the passenger Ro-Ro ship Estonia.
DimensionValueSources
The permeability of the compartment   μ 0.85[51]
The   transverse   stability   G M ¯ 1.17 m[64,65]
Length of the ship   L 137.4 m[64,65]
Width of the ship   B 24.2 m[64,65]
Draught depth   H 5.4 m[64,65]
Length of the watertight compartment   l 6 mAssumed
Width of the watertight compartment   b 5 mAssumed
Area of the openings   S 0.08 m2Assumed
Flow rate of the emergency bilge pump0.15 m3/s[66]
Maximum transverse heeling angle   ϕ (flooding in single compartment)15°[51]
Maximum transverse heeling angle   ϕ (flooding in adjacent compartments)12°[51]
Table 6. The EOP risk under different scenarios.
ScenarioThe EOP Risk
With mutual dependence9.4%
Without mutual dependence4.1%
Table 7. The permeability of various compartments.
Compartment TypePermeability
Appropriated to stores0.6
Occupied by machinery0.85
Occupied by accommodation0.95
Void spaces0.95
Table 8. Comparison of EOP risk assessment results under different compartment types.
Compartment TypeWith Mutual DependenceWithout Mutual Dependence
Appropriated to stores4.5%3.5%
Occupied by machinery9.4%4.1%
Occupied by accommodation10.6%4.2%
Void spaces10.6%4.2%
Table 9. Mean values of the response time distribution at different experience levels.
Operating ProcedureHighNormalLow
Detect the alarm15.62028.8
Close the watertight door remotely7.81014.4
Close the watertight door on site46.86086.4
Open the emergency bilge pump14.041825.92
Plug the leak234300432
Table 10. Comparison of EOP risk assessment results at different crew experience levels.
ScenarioHighNormalLow
With mutual dependence1.3%9.4%55.7%
Without mutual dependence1.1%4.1%25.9%
Disclaimer/Publisher’s Note: The statements, opinions and data contained in all publications are solely those of the individual author(s) and contributor(s) and not of MDPI and/or the editor(s). MDPI and/or the editor(s) disclaim responsibility for any injury to people or property resulting from any ideas, methods, instructions or products referred to in the content.

