Abstract
The impact of anthropogenic disturbances during reservoir development on the ecological system—encompassing both environmental and microbial components—has long been overlooked. This study pioneers the investigation into the effects of microbially activated water flooding on both reservoir environments and indigenous microbial communities. We conducted a comprehensive analysis of the B9 Reservoir’s parameters before and after field testing, including the pH, redox potential, conductivity, chemical oxygen demand, biochemical oxygen demand, aqueous-phase cell concentration, aqueous-phase deoxyribonucleic acid (DNA) concentration, oil-phase DNA concentration, and microbial population data. The results demonstrate that environmental parameters exhibit high sensitivity to microbially activated water flooding and effectively explain microbial blooms, while microbial blooms reciprocally alter the environmental conditions, forming a mutually influencing dynamic interplay. The 183-day microbially activated water flooding, while causing detectable impacts on the reservoir environment and microorganisms, did not pose a threat to its ecological stability and contributed to enhanced oil production. In contrast, the 60-month pilot test concluded 27 months earlier exhibited potential destabilization risks to the reservoir ecology. By simultaneously monitoring reservoir environments and microbial dynamics, this research not only addresses potential ecological risks associated with human-driven reservoir development but also provides actionable insights to optimize reservoir management strategies.
1. Introduction
Microbially Enhanced Oil Recovery (MEOR) is a tertiary oil extraction technology [] that employs microbial cells, their metabolites (including biogases, bioacids, biosolvents, biosurfactants, biopolymers, and enzymatic systems) [,], or microbially induced biochemical reactions [] to modify crude oil’s in situ physicochemical state, spatial distribution, flow capacity, and migration pathways, thereby enhancing the crude oil mobilization efficiency. This process fundamentally alters the oil–water interfacial tension through biosurfactant secretion [], reduces the crude viscosity via hydrocarbon biodegradation [,], and improves reservoir permeability through organic acid-mediated dissolution of carbonate deposits []. The technology achieves an enhanced displacement efficiency by optimizing the multiphase flow dynamics in reservoir formations [].
For ultra-low-permeability (0.1–1 mD) reservoirs [], the extremely small pore throat radius makes it difficult for microbial cells to directly enter and migrate []. Therefore, microbially activated water flooding technology (a type of MEOR)—without the direct injection of microbial cells—is more suitable [,,]. This technique involves fermenting the injected water at the surface to carry microbial metabolites [,]. When injected into the formation, it achieves the following effects: reducing the oil–water mobility ratio [], expanding the sweep efficiency [,], enhancing the crude oil displacement efficiency [], and ultimately improving oil recovery.
In MEOR operations, researchers typically employ biotechnological methods to monitor microbial populations in reservoirs [,,,,], aiming to regulate the microbial activity and ensure the continuous, stable, and efficient enhancement of oil recovery []. However, such studies are often confined to analyzing microbial community shifts [,,,,,] and fail to contribute to sustaining the functional stability and efficiency of microbial consortia. This limitation may stem from overlooking the reservoir environment’s response to MEOR interventions and the lack of dynamic environmental parameter integration, which could explain the suboptimal success rates of many MEOR projects. Furthermore, we note that this situation is not unique to MEOR processes [,,]. Few studies have focused on the impacts of oilfield development operations (e.g., water flooding, polymer injection, and chemical agent injection for enhanced oil recovery) on reservoirs’ environmental parameters. Research on the environmental impacts of the oil industry tends to focus on areas that are closer to human habitats (e.g., the soil, the atmosphere, rivers, and oceans) [,,,,] rather than subsurface oil/gas reservoirs that are separated by hundreds or thousands of meters of rock strata. While this is understandable, the approach appears somewhat unduly utilitarian and lacking in macro-perspective. Any environmental impact caused by human activities ultimately manifests its consequences upon humanity itself. It is imperative that we exercise the utmost prudence in meticulously documenting and studying the reservoir environment’s response to oilfield development operations [,,], particularly given that such research holds critical importance in supporting decision-making for oilfield production. For example, adjusting microbial consortia to prevent reservoir acidification or hydrogen sulfide (H2S) generation, optimizing injection formulations to activate specific functional microbes, and modifying aqueous-phase mobility ratios to improve the sweep efficiency and displacement coverage are important strategies. Admittedly, had microbially activated water flooding not exhibited such a high dependency on the reservoir’s environmental parameters, this oversight might have persisted.
To elucidate the effects of microbially activated water flooding on reservoir ecosystems during anthropogenic reservoir development processes, this investigation targets structurally integrated ultra-low-permeability reservoirs as its research subject. Employing large-scale sampling protocols and regional-scale analytical methodologies, it constitutes the first systematic report elucidating the impacts of 183-day microbially activated water flooding on a reservoir’s environmental parameters. Through the synergistic integration of reservoir microbial biomass quantification and community dynamics profiling, the study not only deciphers the response mechanisms of both geochemical parameters and indigenous microbial consortia to the stimulation of microbially activated water flooding, but also demonstrates enhancements in the crude oil recovery rate and optimization of reservoir development dynamics.
2. Materials and Methods
2.1. Field Test Area
This study focuses on the ultra-low-permeability B9 Reservoir (this is a code name; as per the confidentiality agreement, the actual name of the reservoir and precise reservoir data cannot be provided), located in the Ordos Basin. The primary oil-producing layer is the Triassic Yanchang Formation, with an average burial depth of about 2000 m, an effective thickness of about 20 m, a reservoir pressure of about 15 MPa, and an original oil saturation of about 50%. The recoverable reserves are estimated at 4.8941 million tons, with an original reservoir temperature of 69.7 °C. The current development utilizes a diamond-shaped nine-spot well pattern, with a well spacing of 480 m and a row spacing of 130 m. The field currently operates 92 water injection wells and 258 production wells. The permeability and porosity of the reservoir exhibit significant spatial variations across the entire formation, with the porosity ranging from 8% to 16% and a permeability between 0.20 and 1.40 mD (Figure 1). The calculated permeability parameters include a coefficient of variation of 0.78, a breakthrough coefficient of 3.41, and a permeability ratio of 7. All wells underwent hydraulic fracturing prior to production to enhance the flow capacity. Prior to field testing, the B9 Reservoir was in the early stage of water flooding development, with a composite water cut of 42% and a recovery factor of 2.83%.
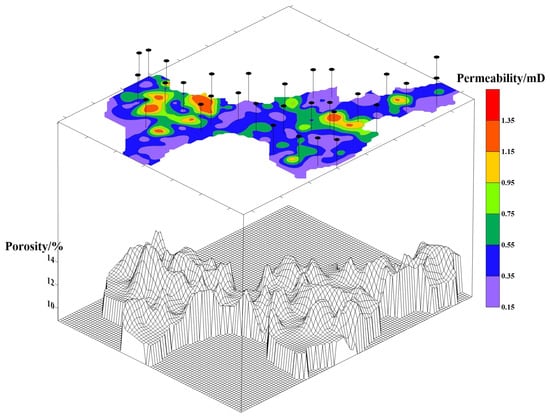
Figure 1.
Permeability, porosity, and sampling well locations of the B9 Reservoir. Note: The upper section displays the permeability map, the lower section shows the 3D wireframe model of porosity, and the pin symbols represent the sampling well locations.
It is particularly noteworthy that a microbially activated water flooding pilot test—utilizing Candida viswanathii-treated injection water with an activation process that is analogous to the current field test (refer to Section 2.2.)—was concluded 27 months prior to the current field test. This pilot test involved 3 injection wells and their corresponding 14 production wells (Figure 2), with a duration of approximately 60 months.
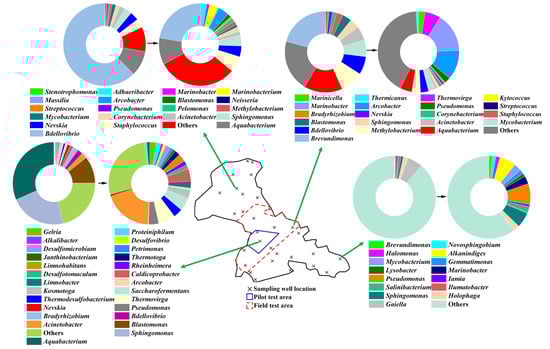
Figure 2.
Schematic diagram of the B9 Reservoir pilot test area, field test area, and sampling well locations, along with the gene sequence analysis results of the oil-phase in produced fluids from selected sampling wells.
2.2. Field Test Methods
The current field test injected microbially activated water through 21 central injection wells, corresponding to 80 production wells. This field test operation fully encompassed the scope of the prior pilot test (Figure 2). Meanwhile, the remaining 71 injection wells outside the field test area in the B9 Reservoir (Figure 2) continued to inject formation water, maintaining the same injection operation as all wells prior to the commencement of the field test. The formation water was sourced from the Yijun-Luohe Formation of the Quaternary System at a depth of 400 m (Table 1).

Table 1.
The properties of the microbially activated water and formation water.
The microbially activated water that is used in field tests refers to the aqueous-phase, which is obtained through the separation of the produced fluid from the production wells and subsequently treated with microorganisms. The specific treatment process is as follows (Figure 3):
- ①
- The aqueous-phase of the produced fluid first enters a buffer tank for flow regulation, quality homogenization, and preliminary oil removal.
- ②
- Subsequently, it flows into a cooling tower, where mechanical ventilation controls the inlet water temperature.
- ③
- Then, it enters an oil removal tank for further oil separation through sedimentation.
- ④
- Next, it passes through the bioreactor system, and Pseudomonas aeruginosa is introduced into the primary reaction tank, while Bacillus cereus and Acinetobacter lwoffii are added to the secondary and tertiary reaction tanks, enabling the progressive enrichment of bacterial cells and their metabolic byproducts. The strains of P. aeruginosa, B. cereus, and A. lwoffii are L1SHX-6X, J2SHX-9X, and L2SHX-11X, respectively (all aerobic strains; Figure 4). They were isolated from oil reservoirs and identified by the Research Centre for Geomicrobial Resources and Application, China University of Petroleum (Beijing), China. The culture medium of all three reaction tanks contains yeast extract (0.5 g/L), tryptone (0.25 g/L), peptone (0.75 g/L), glucose (0.5 g/L), soluble starch (0.5 g/L), dipotassium hydrogen phosphate (0.3 g/L), magnesium sulfate (0.024 g/L), and sodium pyruvate (0.3 g/L). The reaction tanks are sealed vessels where oxygen is replenished by pumping filtered air into the system using an aeration blower, and daily nutrient supplementation maintains the aforementioned concentration of the culture medium (Figure 3). Continuous monitoring for microbial contamination is implemented; when the contamination exceeds 37%, the culture medium is purged and replaced. All culture medium components used in this step were industrial-grade and purchased from Hebei Jinmaiwei Feed Technology Co., Ltd, Shijiazhuang, China.
- ⑤
- The product proceeds to a high-efficiency sedimentation tank for impurity removal via gravity settling.
- ⑥
- Finally, the microbially activated water is filtered and transferred to a water tank for injection.
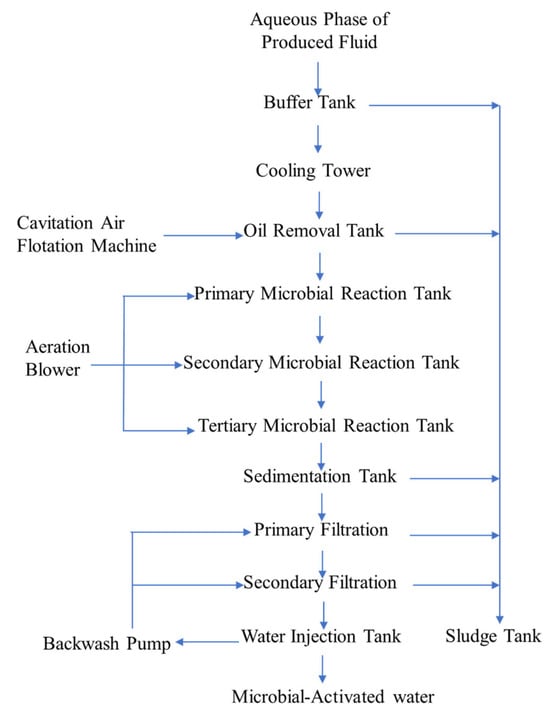
Figure 3.
A schematic diagram of the microbially activated water treatment process.
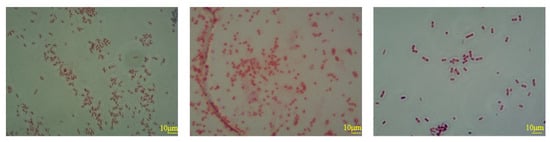
Figure 4.
Microscope images of P. aeruginosa strain L1SHX-6X (left), B. cereus strain J2SHX-9X (middle), and A. lwoffii strain L2SHX-11X (right) in their respective reaction tanks.
All 92 injection wells maintain an injection pressure of 18.4 MPa, with a flowing pressure differential of 8.0–9.0 MPa. After stabilization, the total daily water injection volume of all 92 injection wells reaches approximately 2154 m3. The field test lasted for 183 days. Following the completion of the field test, key production parameters, including the injection profile, formation pressure, oil recovery rate, and others, were systematically measured.
In the B9 Reservoir, 30 production wells were selected as sampling wells (Figure 1 and Figure 2). Before the start of the field test and after its completion, their produced fluids were collected for analytical testing of the pH, redox potential, conductivity, chemical oxygen demand (COD), biochemical oxygen demand (BOD), cell concentration, and DNA concentration and for a gene sequence analysis.
2.3. Measurement of Production Parameters
Barium-131 is injected as a tracer through water injection wells to monitor the radioisotope tracer curve in production wells [,]. This tracer profile is cross-analyzed with natural gamma baseline measurements [] to determine the formation injection profiles. Downhole pressure gauges are deployed through production wellbores to determine the real-time formation pressure []. Surface-mounted multiphase flowmeters are utilized to quantify the oil-phase mass flow rates in the produced fluids. All these operations mandate execution by China National Petroleum Corporation (CNPC)-certified technical professionals in petroleum engineering.
2.4. Measurements of Reservoir’s Environmental Parameters
The pH, redox potential, and conductivity were measured using three probes (Inlab Expert Pro pH, Inlab Redox, and Inlab 731, respectively) on a SevenMulti™ instrument (Mettler Toledo, Columbus, OH, USA) [].
The COD measurement of the aqueous-phase in the produced fluid was performed using a HACH DR900 multi-parameter water quality analyzer (HACH, Loveland, CO, USA) in conjunction with a HACH 2125915-CN reagent (HACH, Loveland, CO, USA) [,]. The 5-day biochemical oxygen demand (BOD5) of the aqueous-phase of the produced fluid was determined using the manometric method (differential pressure method) [].
2.5. Microbial Analysis
We allowed the production fluid to stand and then separated the lower aqueous-phase for the cell concentration measurement. We used an Eclipse Ni-U phase contrast microscope (Nikon, Tokyo, Japan) and blood cell counting plate to determine the concentration of microbial cells [,].
The aqueous-phase of the produced fluid was filtered using a 0.2 μm membrane (Whatman, Maidstone, Kent, UK). Microorganisms retained on the filter membrane were collected. We used the QIAamp DNA Stool Mini Kit (Qiagen Inc., Valencia, CA, USA) to extract the DNA []. The DNA concentration was determined using an Invitrogen Qubit fluorometer (Thermo Fisher Scientific, Waltham, MA, USA) with standard curves [].
The oil-phase of the produced fluid was washed with 2,2,4-trimethylpentane and thoroughly mixed with some glass beads (diameter: 3–4 mm) by vortex, followed by centrifugation (7870× g, 20 min at 4 °C). The resulting supernatant was discarded, and the precipitate was retained []. Using the QIAamp DNA Stool Mini Kit (Qiagen Inc., Valencia, CA, USA) [] and the Invitrogen Qubit fluorometer (Thermo Fisher Scientific, Waltham, MA, USA), we determined the DNA concentration [].
DNA from the oil-phase of the produced fluid was analyzed by the 16s rRNA gene sequence using the forward primer 341f (5′-CCTACGGAGGCAGCAGCAG-3′) and reverse primer 518r (5′-ATTACCGCGCTGCTGG-3′). The genes were sequenced on a MiSeqTM System (Illumina, San Diego, DA, USA) [] and analyzed using the Galaxy Platform [] (https://galaxyproject.org/). We compared the sequencing results with Gene-Bank or Eztaxon.
The aforementioned measurement results and geodetic coordinates from 30 sampling wells were integrated and processed using Surfer software (Version 13.0.383, Golden Software, LLC, Golden, CO, USA). For data processing, the Kriging method was selected, with a grid spacing set to half of the original data point interval, and the Z-values were normalized [].
All chemical agents, except those used in Step ④, were of an analytical grade and supplied by Tianjin Fuchen Chemical Reagents Factory, Tianjin, China.
3. Results and Discussion
3.1. The Production Performance of Microbially Activated Water Flooding
The water injection profile of oil reservoirs serves as a critical metric for evaluating the volumetric sweep efficiency of injection, where under constant reservoir thickness conditions, an expanded injection profile correlates with enhanced sweep efficiency and, consequently, a higher crude oil recovery rate [], as evidenced by field tests demonstrating an increased total water intake thickness from 5.1 m to 11.4 m (Figure S1) and improved water flooding utilization efficiency from 65.4% to 70.1%, collectively optimizing the water flood development performance.
Contrary to conventional water flooding development patterns, where the formation pressure progressively declines over time [], post-field test monitoring in B9 Reservoir demonstrated localized formation pressure rebound, with the average formation pressure increasing from 13.7 MPa to 14.3 MPa (Figure 5 and Figure S2).
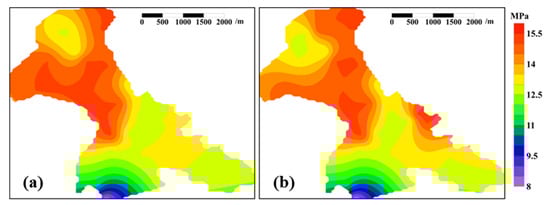
Figure 5.
Images of formation pressure of B9 Reservoir before and after microbially activated water flooding field test. Note: (a) denotes before field test, (b) denotes after field test.
After the field test, the production of the field test area increased by 2%. Under the condition of reduced water injection, both the daily liquid production and daily oil production rose, while the injection–production ratio decreased, leading to improved economic efficiency. Additionally, both the natural decline rate and water cut rise rate declined, demonstrating that the field test achieved the expected results (Table 2).
Table 2.
Production parameters of field test area before and after microbially activated water flooding in B9 Reservoir.
Other production wells that were located within the B9 Reservoir but outside the field test area exhibited only minor fluctuations, which remained within the normal range of daily production operations and were therefore excluded from the validity assessment of this field test.
3.2. The Impact of Microbially Activated Water Flooding on the Reservoir Environment
The production parameters failed to capture changes outside the test area, while the environmental parameters demonstrated sufficient sensitivity to detect the disturbances that were caused by microbially activated water flooding throughout the entire B9 Reservoir (Figure 6). The extensive regional response of these environmental parameters was unanticipated (Figure 6), as the swept volume of microbially activated water that was injected over the 183 days—estimated based on the injection rates alone—appeared to be insufficient to extend significantly beyond the field test area. The only plausible explanation is that the hydraulic fracturing fractures have created a pervasive high-permeability channel network throughout the reservoir, enabling the microbially activated water to break through beyond the field test area without fully saturating the reservoir pore space of the field test area first.
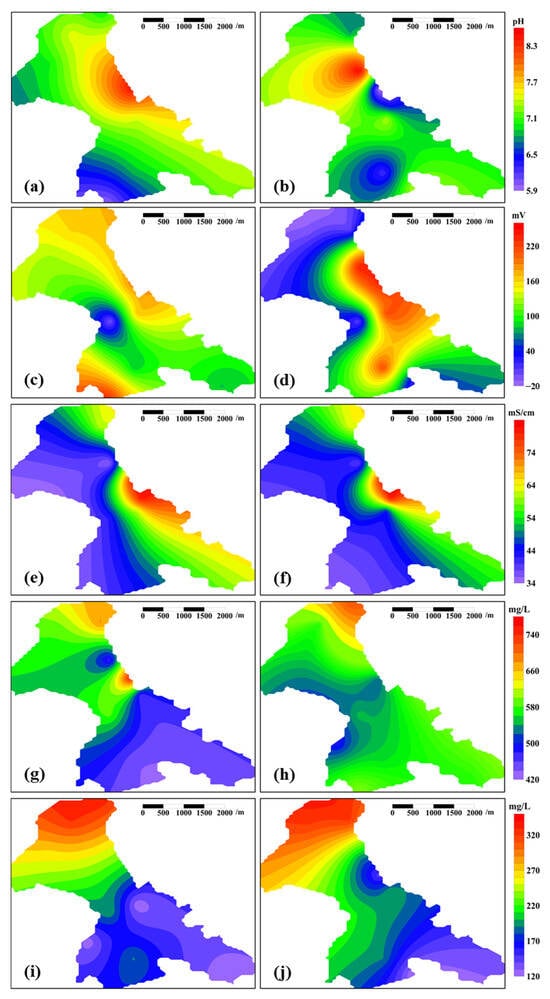
Figure 6.
Heatmaps of environmental parameters across the entire B9 Reservoir pre- and post-field test. Note: (a) pH before the field test, (b) pH after the field test, (c) redox potential before the field test, (d) redox potential after the field test, (e) conductivity before the field test, (f) conductivity after the field test, (g) COD before the field test, (h) COD after the field test, (i) BOD before the field test, (j) BOD after the field test.
3.2.1. pH
Prior to the microbially activated water flooding, the B9 Reservoir exhibited alkaline conditions, attributed to the prolonged injection of alkaline formation water (pH 7.8, Table 1). Post-field test, the acidic microbially activated water (pH 6.6, Table 1) drove a downward pH trend, while the microbial metabolic activity—whether from a minor influx from the microbially activated water or activated indigenous populations—further promoted reservoir acidification []. The degree of acidification serves as a partial indicator of the intensity of the microbial metabolic activity, which explains the significant spatial overlap between areas with severe acidification (Figure 6a,b) and regions of microbial proliferation (Figure 7a,b). Oil reservoir acidification suppresses the microbial proliferation potential, necessitating prioritized monitoring of severely acidified zones to prevent exceeding critical ecological thresholds []. In cases of threshold breaches, mitigation strategies such as the intermittent cessation of microbially activated water flooding and injection of formation water (pH 7.8, Table 1) may restore the system’s functionality.
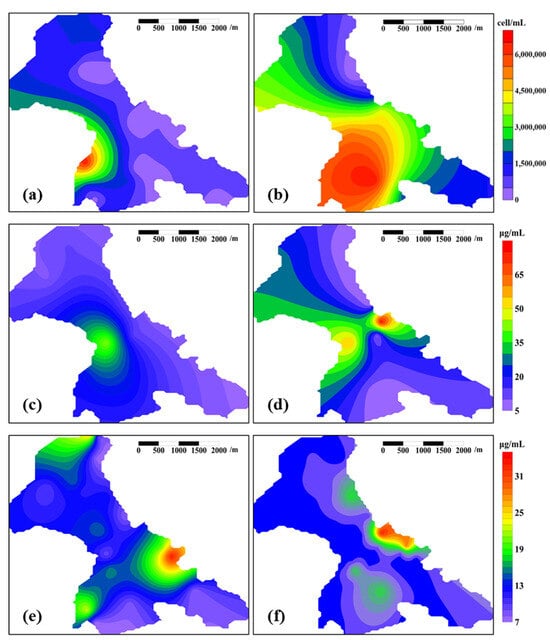
Figure 7.
Heatmaps of microbial biomass across the entire B9 Reservoir pre- and post-field test. Note: (a) cell concentration before the field test, (b) cell concentration after the field test, (c) DNA concentration in the aqueous-phase before the field test, (d) DNA concentration in the aqueous-phase after the field test, (e) DNA concentration in the oil-phase before the field test, (f) DNA concentration in the oil-phase after the field test.
3.2.2. Redox Potential
Prior to the field test, the B9 Reservoir exhibited redox potential minima exclusively within the historical pilot test area (Figure 6c), which is potentially attributable to elevated microbial populations (Figure 7a). Under normal conditions, microorganisms consume oxidizing substances during metabolism, leading to a reduction in redox potential []. Prolonged pilot testing in the past has resulted in sustained elevated microbial populations in this area compared to surrounding regions, creating localized redox potential minima. Most zones of the B9 Reservoir maintained positive redox potential values that were conducive to facultative/aerobic microbial proliferation (Figure 6c).
Following the field test, the redox potential in both the test area and adjacent regions demonstrated an upward trend (Figure 6d), surpassing the redox potential of the injected microbially activated water (Table 1). This oxidative shift likely originated from mechanical aeration during pumping operations. This may also account for the observed microbial proliferation (Figure 7b). Under these conditions, the pilot test area maintained the lowest redox potential (Figure 6d), likely due to its elevated microbial biomass and correspondingly high metabolic consumption rates (Figure 7b).
3.2.3. Conductivity
The electrical conductivity reflects the concentration of conductive ions in the aqueous-phase of the produced fluid, which may originate from either injected water or reservoir formations. However, the pre- and post-field test conductivity measurements in the B9 Reservoir showed no statistically significant variation (Figure 6e,f), indicating a negligible impact of the microbially activated water flooding on the reservoir conductivity. It is widely accepted that microbial metabolism requires conductive particles, with optimal conductivity levels facilitating microbial proliferation []. Within the B9 Reservoir, proliferating microorganisms appear to exert no detectable influence on the electrical conductivity. Simultaneously, the electrical conductivity does not act as a limiting factor for microbial proliferation in this system.
3.2.4. COD
The COD, as an indicator of the organic matter content in water, is conventionally employed to reflect water pollution levels []. In this context, it quantifies the impact of microbially activated water on a reservoir’s water quality. The COD of the microbially activated water ranged from 361 to 650 mg/L (Table 1). Microbial activity further increased the solubility of crude oil in water [], leading to widespread COD elevation in the central field test area and adjacent areas (Figure 6g,h).
3.2.5. BOD
The BOD indicates the concentration of organic matter in water that is biodegradable by microorganisms [,]. Microbial metabolic activity enhances the solubility of crude oil in water [], thereby increasing the BOD of the aqueous-phase (Figure 6i,j). The increase in BOD caused by the dissolution of crude oil into the aqueous-phase exceeds the trend of BOD reduction driven by microbial metabolic activity; this mechanism likely explains the observed upward BOD trend in the central field test area.
3.3. The Impact of Microbially Activated Water Flooding on the Reservoir Microorganisms
3.3.1. Microbial Biomass
Prior to the commencement of field testing, cell concentration hotspots were observed within the pilot test area (Figure 7a). These hotspots spatially coincided with the peak aqueous-phase DNA concentrations in the produced fluids (Figure 7c). Collectively, these findings demonstrate that the pilot test exerted a persistent impact on subsurface biogeochemical processes, even 27 months after the conclusion of pilot test operations.
In the bioreactor system, the implementation of microbial immobilization technology combined with dual-stage filtration effectively restricted the massive influx of the three microbial species (P. aeruginosa, B. cereus, and A. lwoffii) into the reservoir (Figure 3). The post-field test cell concentration elevation in the reservoir (Figure 7b) can likely be attributed to the nutrient-rich culture medium activating indigenous reservoir microbes. Coupled with the fracture-enhanced connectivity of the formation, the increasing trend radiates from the injection zones to peripheral areas (Figure 7b).
The DNA concentration in the aqueous-phase also indicates a microbial proliferation within the microbially activated water flooding area (Figure 7d). However, the peak concentrations of DNA and cell counts do not fully align spatially (Figure 7b,d), which may stem from fundamental methodological differences between the two measurement approaches (refer to Section 2.5). Nevertheless, both parameters collectively demonstrate an increasing microbial population and their migration into the surrounding areas of the microbially activated water flooding area.
Unlike the aqueous-phase, prior to this field test, the peak DNA concentration in the oil-phase of the produced fluid was not located within the pilot test area (Figure 7e). After the field test, the position of the peak DNA concentration of the oil-phase showed minor changes, and the distribution pattern exhibited limited variation (Figure 7e,f). This indicates that short-term (183 d) microbially activated water flooding had a lesser impact on the oil-phase compared to its effects on the aqueous-phase (Figure 7c–f). Under normal reservoir conditions, while microorganisms fundamentally require aqueous environments for metabolic exchange and cannot survive in a pure oil-phase [], the complex oil–water distribution patterns—particularly the intense hydrodynamic disturbances induced during oilfield development—enable microbial colonization in three distinct habitats: aqueous-phases, interfacial zones (the oil–water interface), and water droplets that are encapsulated within the oil-phase, which collectively explain the observed low DNA concentrations in the oil-phase and their limited responsiveness to microbially enhanced water flooding compared to their aqueous-phase counterparts. The phenomenon of distinct microorganisms in the oil- and water-phases of the produced fluids from oil reservoir production wells has also been documented in other studies [].
Based on an integrated analysis of the reservoir parameters and production data (under binding non-disclosure agreements), this microbially activated water flooding field test induced a more than two-fold increase in the subsurface microbial biomass within the B9 Reservoir.
3.3.2. Microbial Species Composition
A genetic analysis was performed using DNA that had been extracted from the oil-phase of produced fluids, because the oil-phase exhibits significantly higher microbial diversity than the corresponding water-phase, despite the latter having a higher DNA concentration (Figure 7). This phenomenon has also been observed in other studies [], in addition to our findings.
Genomic sequencing revealed a field test biogeographic gradient where the proximal pilot test area exhibited the highest microbial diversity, with progressive diminution at increasing radial distances (Figure 2)—a spatial pattern that is consistent with the biomass distribution trend (Figure 7). In the former pilot test area, 26 microbial genera were detected, while only 15 genera were identified in the distal southeastern section of the B9 Reservoir. Additionally, 20 genera were observed in the field test area and its adjacent regions (Figure 4). Notably, the former two regions exhibited significantly higher proportions of unique microbial genera (non-overlapping with other regions) at 61.5% and 66.7%, respectively, whereas the field test area and its vicinity showed fewer unique genera (15–30%) (Figure 2).
The sole two genera that were ubiquitously present across all areas in the B9 Reservoir were Pseudomonas and Sphingomonas, both demonstrating metabolic competence in polycyclic aromatic hydrocarbon degradation []. The obligate aerobic characteristics shared by both genera [] were mutually corroborated by the redox potential results across the entire B9 Reservoir (Figure 6c,d). They epitomize the most universal functional traits of reservoir-associated microbial communities. Other microbial genera that are commonly found in the B9 Reservoir exhibit distinctive characteristics, such as adaptation to high-salinity environments (Mycobacterium, Marinobacter) [], participation in sulfur cycling (Arcobacter) [], predation of other bacteria (Bdellovibrio), or thriving in oligotrophic conditions (Nevskia) [] (Figure 2).
The unique microbial genera that were identified in the distal southeastern section of the field test area (Figure 2) include thermotolerant (Ilumatobacter) [], halotolerant (Salinibacterium) [], marine environment-specialized (Halomonas) [], and hydrocarbon-degrading (Novosphingobium, Holophaga, and Alkanindiges) species []. This may result from limited anthropogenic disturbance (Figure 2) and well-preserved original reservoir conditions [].
In contrast to this mechanism, the pilot test area experienced prolonged eutrophic conditions, resulting in enhanced microbial activation (Figure 5). The unique microbial genera in the pilot test area primarily included sulfate-reducing bacteria (Desulfomicrobium, Desulfotomaculum, and Desulfovibrio) [], extremophiles (Caldicoprobacter, Kosmotoga, and Alkalibacter) [], ecologically functional taxa (Limnobacter, Limnohabitans, Petrimonas, and Proteiniphilum) [], and thermophiles (Saccharofermentans, Thermodesulfobacterium, and Thermotoga) [].
After microbially activated water flooding, the microbial diversity increased: previously undetected species (due to low concentrations) became detectable, low-abundance species exhibited population growth, and the community structure shifted, with reduced abundance of originally dominant microbial taxa (Figure 2).
3.4. The Effects of Reservoir’s Ecological System on Oilfield Development
Microbially activated water containing nutrients can impact reservoir ecosystems: it directly alters the environmental chemical parameters of the reservoir (Figure 6) and activates indigenous microbial communities (Figure 2). Within the oil reservoir ecosystem, these two elements (environmental parameters and microbial communities) dynamically interact: changes in environmental parameters exert influence on microbial communities, while microbial metabolic activities reciprocally modify environmental conditions. Notably, environmental parameters are more sensitive to external engineering interventions (e.g., microbially activated water flooding), and their fluctuations can be detected promptly and accurately. In contrast, biological changes exhibit delayed and ambiguous responses. Relying solely on biological parameters not only hinders the optimization of petroleum engineering practices but also compromises the management of environmental risks in reservoirs. If this ecosystem is healthy, its metabolic processes can generate beneficial effects for oilfield development. Therefore, to achieve these outcomes, it is only necessary to monitor key environmental parameters, supplemented by limited microbial analysis, rather than relying on the previous approach of conducting complex and extensive microbial analyses while being limited to their results. We should recognize that more representative weighting parameters that are capable of covering reservoir ecosystems and gaining broad consensus, along with more sophisticated mathematical operations [], should play a crucial role in this process, which also requires further in-depth research.
According to this study, a healthy reservoir ecosystem for production comprises a neutral pH environment, an oxidation-biased metabolic environment, conductive particle environments that are obtainable from external sources or within the reservoir itself, appropriate nutrient supplies, and appropriate microbial abundance and composition. These factors collectively drive the optimization of production parameters (refer to Section 3.1).
4. Conclusions
To the best of our knowledge, this is the first report on the ecological responses encompassing both environmental and microbial factors during microbially activated water flooding in ultra-low-permeability reservoirs. Although short-term (183 days) microbially activated water flooding demonstrates a broad impact coverage on ecological parameters (environmental and microbial), the actual magnitude of this effect remains limited. Therefore, adopting multiple short-duration operational cycles is recommended. Environmental parameters exhibit higher sensitivity to artificial interventions while requiring simpler and more cost-effective monitoring compared to microbial analyses, making them viable alternatives for routine data collection. By integrating environmental analysis rather than solely relying on microbial monitoring during MEOR implementation, this approach not only enhances ecological risk management but also shows potential for improved operational success rates. Although data on reservoirs’ environmental parameters and microbial diversity have not yet been widely applied in oilfield production optimization, the advancement of artificial intelligence technologies and reservoir environmental data acquisition systems will not only enable significant MEOR but also pave the way for establishing subsurface microbial factories.
Supplementary Materials
The following supporting information can be downloaded at https://www.mdpi.com/article/10.3390/jmse13050836/s1. Figure S1. Comparison of water injection profiles before and after microbially activated water flooding field test in B9 Reservoir. Figure S2. Heatmaps and contour maps of formation pressure of B9 Reservoir before and after microbially activated water flooding field test.
Author Contributions
Methodology, formal analysis, investigation, data curation, writing—original draft, and writing—review and editing, L.L.; Conceptualization, resources, writing—review and editing, project administration, and funding acquisition, C.Z.; Writing—review and editing and resources, P.S.; Data curation, H.M. All authors have read and agreed to the published version of the manuscript.
Funding
This work was financially supported by the National Natural Science Foundation of China (No. 52170096), the Erdos City Science and Technology Cooperation Major Project (No. 2022EEDSKJZDZX015–2), and the Fundamental Research Funds for the Central Universities (Top Innovative Talents Fund of CUMTB) (No. BBJ2024051).
Data Availability Statement
The raw data supporting the conclusions of this article will be made available by the authors on request.
Acknowledgments
The primary content of this study is derived from the doctoral dissertation of the corresponding author, Li Lei, completed at the China University of Petroleum (Beijing), under the supervision of Wan Yunyang. According to the confidentiality agreement, the 3-year restricted disclosure period (July 2020–July 2023) has now expired. We sincerely appreciate Wan Yunyang for his inspiration on scientific issues and the formation of early ideas. The early work of Wan Yunyang and his team is of great reference value to this study. We acknowledge the staff of CNPC Changqing Oilfield Company for providing data and assistance during the sampling process. We also thank Zhang Yue for assisting in the data analysis. We also thank Li Weiheng and Tian Xiukun for their personal financial assistance at the initial stage.
Conflicts of Interest
The authors declare that they have no known competing financial interests or personal relationships that could have appeared to influence the work reported in this paper.
References
- Brown, L.R. Microbial enhanced oil recovery (MEOR). Curr. Opin. Microbiol. 2010, 13, 316–320. [Google Scholar] [CrossRef] [PubMed]
- Zhu, W.; Zhao, J.; Han, H.; Sun, G.; Song, Z. High-pressure microscopic investigation on the oil recovery mechanism by in situ biogases in petroleum reservoirs. Energy Fuels 2015, 29, 7866–7874. [Google Scholar] [CrossRef]
- Patel, J.; Borgohain, S.; Kumar, M.; Rangarajan, V.; Somasundaran, P.; Sen, R. Recent developments in microbial enhanced oil recovery. Renew. Sustain. Energy Rev. 2015, 52, 1539–1558. [Google Scholar] [CrossRef]
- Cui, K.; Wang, C.J.; Li, L.; Zou, J.G.; Huang, W.H.; Zhang, Z.Z.; Wang, H.M.; Guo, K. Controlling the hydro-swelling of smectite clay minerals by Fe(III) reducing bacteria for enhanced oil recovery from low-permeability reservoirs. Energies 2022, 15, 4393. [Google Scholar] [CrossRef]
- Zhao, F.; Zhang, J.; Shi, R.; Han, S.; Ma, F.; Zhang, Y. Production of biosurfactant by a Pseudomonas aeruginosa isolate and its applicability to in situ microbial enhanced oil recovery under anoxic conditions. RSC Adv. 2015, 5, 36044–36050. [Google Scholar] [CrossRef]
- Gudina, E.J.; Pereira, J.F.B.; Rodrigues, L.R.; Coutinho, J.A.P.; Teixeira, J.A. Isolation and study of microorganisms from oil samples for application in Microbial Enhanced Oil Recovery. Int. Biodeterior. Biodegrad. 2012, 68, 56–64. [Google Scholar] [CrossRef]
- Gudina, E.J.; Pereira, J.F.B.; Costa, R.; Coutinho, J.A.P.; Teixeira, J.A.; Rodrigues, L.R. Biosurfactant-producing and oil-degrading Bacillus subtilis strains enhance oil recovery in laboratory sand-pack columns. J. Hazard. Mater. 2013, 261, 106–113. [Google Scholar] [CrossRef]
- Fernandes, P.L.; Rodrigues, E.M.; Paiva, F.R.; Ayupe, B.A.L.; McInerney, M.J.; Totola, M.R. Biosurfactant, solvents and polymer production by Bacillus subtilis RI4914 and their application for enhanced oil recovery. Fuel 2016, 180, 551–557. [Google Scholar] [CrossRef]
- Sivasankar, P.; Kumar, G.S. Modelling the influence of interaction between injection and formation brine salinities on in-situ microbial enhanced oil recovery processes by coupling of multiple-ion exchange transport model with multiphase fluid flow and multi-species reactive transport models. J. Pet. Sci. Eng. 2018, 163, 435–452. [Google Scholar]
- SY/T 6219-2023; China National Energy Administration Oilfield Development Level Classification. Petroleum Industry Press: Beijing, China, 2023.
- Tan, F.; Zhao, R.; Zhao, Y.; Pan, Z.; Li, H. A case study: Evaluating low-porosity and ultra-low-permeability Triassic reservoir rocks in the Ordos Basin by the integration of logs and core. Pet. Geosci. 2017, 23, 454–465. [Google Scholar] [CrossRef]
- Yao, C.; Lei, G.; Ma, J.; Zhao, F.; Cao, G. Laboratory experiment, modeling and field application of indigenous microbial flooding. J. Pet. Sci. Eng. 2012, 90–91, 39–47. [Google Scholar] [CrossRef]
- Wu, B.; Xiu, J.L.; Yu, L.; Huang, L.X.; Yi, L.N.; Ma, Y.D. Biosurfactant production by Bacillus subtilis SL and its potential for enhanced oil recovery in low permeability reservoirs. Sci. Rep. 2022, 12, 7785. [Google Scholar] [CrossRef] [PubMed]
- Ghojavand, H.; Vahabzadeh, F.; Shahraki, A.K. Enhanced oil recovery from low permeability dolomite cores using biosurfactant produced by a Bacillus mojavensis (PTCC 1696) isolated from Masjed-I Soleyman field. J. Pet. Sci. Eng. 2012, 81, 24–30. [Google Scholar] [CrossRef]
- Seok, O.K. Brief review on microbial enhanced oil recovery. J. Korean Appl. Sci. Technol. 2021, 38, 1010–1019. [Google Scholar]
- Niu, J.; Liu, Q.; Lv, J.; Peng, B. Review on microbial enhanced oil recovery: Mechanisms, modeling and field trials. J. Pet. Sci. Eng. 2020, 192, 107350. [Google Scholar] [CrossRef]
- Khademolhosseini, R.; Jafari, A.; Mousavi, S.M.; Hajfarajollah, H.; Noghabi, K.A.; Manteghian, M. Physicochemical characterization and optimization of glycolipid biosurfactant production by a native strain of Pseudomonas aeruginosa HAK01 and its performance evaluation for the MEOR process. RSC Adv. 2019, 9, 7932–7947. [Google Scholar] [CrossRef]
- Zhu, H.; Carlson, H.K.; Coates, J.D. Applicability of anaerobic nitrate-dependent Fe(II) oxidation to Microbial Enhanced Oil Recovery (MEOR). Environ. Sci. Technol. 2013, 47, 8970–8977. [Google Scholar] [CrossRef]
- Kwon, T.; Ajo-Franklin, J.B. High-frequency seismic response during permeability reduction due to biopolymer clogging in unconsolidated porous media. Geophysics 2013, 78, 117–127. [Google Scholar] [CrossRef]
- Zekri, A.Y. Microbial enhanced oil recovery—A short review. Oil Gas Eur. Mag. 2001, 27, 22–25. [Google Scholar]
- You, J.; Wu, G.; Ren, F.; Chang, Q.; Yu, B.; Xue, Y.; Mu, B. Microbial community dynamics in Baolige oilfield during MEOR treatment, revealed by Illumina MiSeq sequencing. Appl. Microbiol. Biotechnol. 2016, 100, 1469–1478. [Google Scholar] [CrossRef]
- Gao, P.; Tian, H.; Li, G.; Sun, H.; Ma, T. Microbial diversity and abundance in the Xinjiang Luliang long-term water-flooding petroleum reservoir. Microbiologyopen 2015, 4, 332–342. [Google Scholar] [CrossRef] [PubMed]
- Nazina, T.N.; Feng, Q.; Kostryukova, N.K.; Shestakova, N.M.; Babich, T.L.; Ni, F.; Wang, J.; Min, L.; Ivanov, M.V. Microbiological and production characteristics of the Dagang high-temperature heavy oil reservoir (Block no. 1) during trials of the biotechnology for enhanced oil recovery. Microbiology 2017, 86, 653–665. [Google Scholar] [CrossRef]
- Halim, A.Y.; Pedersen, D.S.; Nielsen, S.M.; Lantz, A.E. Profiling of indigenous microbial community dynamics and metabolic activity during enrichment in molasses-supplemented crude oil-brine mixtures for improved understanding of microbial enhanced oil recovery. Appl. Biochem. Biotechnol. 2015, 176, 1012–1028. [Google Scholar] [CrossRef] [PubMed]
- Wang, J.; Ma, T.; Zhao, L.; Lv, J.; Li, G.; Zhang, H.; Zhao, B.; Liang, F.; Liu, R. Monitoring exogenous and indigenous bacteria by PCR-DGGE technology during the process of microbial enhanced oil recovery. J. Ind. Microbiol. Biotechnol. 2008, 35, 619–628. [Google Scholar] [CrossRef]
- Xiang, T.; Liu, X.; Zhang, M.; Liu, F.; Li, B.; Fu, H.; Zhao, L.; Hu, W. Distribution of the indigenous microorganisms and mechanisms of their orientational activation in Daqing Oilfield. Sci. China Ser. D Earth Sci. 2009, 52, 128–134. [Google Scholar] [CrossRef]
- Astuti, D.I.; Purwasena, I.A.; Priharto, N.; Ariadji, T.; Afifah, L.N.; Saputro, R.B.; Aditiawati, P.; Persada, G.P.; Ananggadipa, A.A.; Abqory, M.H.; et al. Bacterial community dynamics during MEOR biostimulation of an oil reservoir in sumatera Indonesia. J. Pet. Sci. Eng. 2022, 208, 109558. [Google Scholar] [CrossRef]
- Fu, Z.; Chen, W.; Qi, G.; Hou, Z.; Liu, Y.; Shou, L.; Zhou, L.; Yang, S.; Wu, X.; Gu, J.; et al. Microbiome changes and characteristics under nutrient injection for enhanced oil production at Daqing oilfield. Int. Biodeterior. Biodegrad. 2025, 196, 105934. [Google Scholar] [CrossRef]
- Alkan, H.; Mukherjee, S.; Kogler, F. Reservoir engineering of in-situ MEOR; impact of microbial community. J. Pet. Sci. Eng. 2020, 195, 107928. [Google Scholar] [CrossRef]
- Cheng, W.; Fan, H.; Yun, Y.; Zhao, X.; Su, Z.; Tian, X.; Liu, D.; Ma, T.; Li, G. Effects of nutrient injection on the Xinjiang oil field microbial community studied in a long core flooding simulation device. Front. Microbiol. 2023, 14, 1230274. [Google Scholar] [CrossRef]
- Yang, G.; Zhou, L.; Mbadinga, S.M.; You, J.; Yang, H.; Liu, J.; Yang, S.; Gu, J.; Mu, B. Activation of CO2-reducing methanogens in oil reservoir after addition of nutrient. J. Biosci. Bioeng. 2016, 122, 740–747. [Google Scholar] [CrossRef]
- Zhao, F.; Wang, B.; Cui, Q.; Wu, Y. Genetically modified indigenous Pseudomonas aeruginosa drove bacterial community to change positively toward microbial enhanced oil recovery applications. J. Appl. Microbiol. 2024, 135, lxae168. [Google Scholar] [CrossRef] [PubMed]
- Zhao, L.; Ma, T.; Gao, M.; Gao, P.; Cao, M.; Zhu, X.; Li, G. Characterization of microbial diversity and community in water flooding oil reservoirs in China. World J. Microbiol. Biotechnol. 2012, 28, 3039–3052. [Google Scholar] [CrossRef] [PubMed]
- Bodtker, G.; Lysnes, K.; Torsvik, T.; Bjornestad, E.O.; Sunde, E. Microbial analysis of backflowed injection water from a nitrate-treated North Sea oil reservoir. J. Ind. Microbiol. Biotechnol. 2009, 36, 439–450. [Google Scholar] [CrossRef]
- Ren, H.; Zhang, X.; Song, Z.; Rupert, W.; Gao, G.; Guo, S.; Zhao, L. Comparison of microbial community compositions of injection and production well samples in a long-term water-flooded petroleum reservoir. PLoS ONE 2011, 6, e23258. [Google Scholar] [CrossRef]
- Akhmetov, I.L.; Puntus, I.F.; Narmanova, R.A.; Appazov, N.O.; Funtikova, V.T.; Regepova, A.A.; Filonov, A.E. Recent advances in creating biopreparations to fight oil spills in soil ecosystems in sharply continental climate of Republic of Kazakhstan. Processes 2022, 10, 549. [Google Scholar] [CrossRef]
- Abdullah, S.R.S.; Al-Baldawi, I.A.; Almansoory, A.F.; Purwanti, I.F.; Al-Sbani, N.H.; Sharuddin, S.S.N. Plant-assisted remediation of hydrocarbons in water and soil: Application, mechanisms, challenges and opportunities. Chemosphere 2020, 247, 125932. [Google Scholar] [CrossRef]
- Gabhane, L.R.; Kanidarapu, N. Environmental risk assessment using neural network in liquefied petroleum gas terminal. Toxics 2023, 11, 348. [Google Scholar] [CrossRef]
- Wang, M.; Sha, C.; Wu, J.; Su, J.; Wu, J.; Wang, Q.; Tan, J.; Huang, S. Bacterial community response to petroleum contamination in brackish tidal marsh sediments in the Yangtze River Estuary, China. J. Environ. Sci. 2021, 99, 160–167. [Google Scholar] [CrossRef]
- White, H.K.; Hsing, P.; Cho, W.; Shank, T.M.; Cordes, E.E.; Quattrini, A.M.; Nelson, R.K.; Camilli, R.; Demopoulos, A.W.J.; German, C.R.; et al. Impact of the Deepwater Horizon oil spill on a deep-water coral community in the Gulf of Mexico. Proc. Natl. Acad. Sci. USA 2012, 109, 20303–20308. [Google Scholar] [CrossRef]
- Aguilera, F.; Mendez, J.; Pasaro, E.; Laffon, B. Review on the effects of exposure to spilled oils on human health. J. Appl. Toxicol. 2010, 30, 291–301. [Google Scholar] [CrossRef]
- Jerneloev, A. The threats from oil spills: Now, Then, and in the Future. Ambio 2010, 39, 353–366. [Google Scholar] [CrossRef] [PubMed]
- Barron, M.G.; Vivian, D.N.; Heintz, R.A.; Yim, U.H. Long-term ecological impacts from oil spills: Comparison of Exxon Valdez, Hebei Spirit, and Deepwater Horizon. Environ. Sci. Technol. 2020, 54, 6456–6467. [Google Scholar] [CrossRef] [PubMed]
- Coronado, M.; Ramirez-Sabag, J. Analytical model for tracer transport in reservoirs having a conductive geological fault. J. Pet. Sci. Eng. 2008, 62, 73–79. [Google Scholar] [CrossRef]
- Gao, Y.; Zhao, M.; Wang, J.; Zong, C. Performance and gas breakthrough during CO2 immiscible flooding in ultra-low permeability reservoirs. Petroleum Explor. Dev. 2014, 41, 88–95. [Google Scholar] [CrossRef]
- Pemper, R. A history of nuclear spectroscopy in well logging. Petrophysics 2020, 61, 523–548. [Google Scholar] [CrossRef]
- Ouyang, L.B. A novel flow profiling approach using permanent downhole pressure gauges. Pet. Sci. Technol. 2005, 23, 1221–1245. [Google Scholar] [CrossRef]
- Zhao, J.Y.; Li, L.; Wan, Y.Y.; Li, Z.G.; Luo, N.; Mu, H.M.; Li, W.H.; Zhang, Y. Interaction between in-situ oil reservoir microorganisms and minerals. J. China Univ. Pet. (Ed. Nat. Sci.) 2021, 45, 121–130. [Google Scholar]
- Li, J.; Tao, T.; Li, X.; Zuo, J.; Li, T.; Lu, J.; Li, S.; Chen, L.; Xia, C.; Liu, Y.; et al. A spectrophotometric method for determination of chemical oxygen demand using home-made reagents. Desalination 2009, 239, 139–145. [Google Scholar] [CrossRef]
- HJ 828-2017; National Ministry of Environmental Protection Water Quality—Determination of the Chemical Oxygen Demand—Dichromate Method. China Environmental Science Press: Beijing, China, 2017.
- HJ 505-2009; National Ministry of Environmental Protection Water Quality—Determination of Biochemical Oxygen Demand After 5 Days (BOD5) for Dilution and Seeding Method. China Environmental Science Press: Beijing, China, 2009.
- Wan, Y.Y.; Dong, H.L. Environmental Geomicrobiology Experiments; Petroleum Industry Press: Beijing, China, 2014; pp. 100–105. [Google Scholar]
- Whitehouse, C.A.; Hottel, H.E. Comparison of five commercial DNA extraction kits for the recovery of Francisella tularensis DNA from spiked soil samples. Mol. Cell. Probes 2007, 21, 92–96. [Google Scholar] [CrossRef]
- Schofield, G.G. PicoGmeter, a custom-made fluorometer for the quantification of dsDNA by PicoGreen® fluorescence. Biotechniques 2004, 37, 778. [Google Scholar] [CrossRef]
- Yoshida, N.; Yagi, K.; Sato, D.; Watanabe, N.; Kuroishi, T.; Nishimoto, K.; Yanagida, A.; Katsuragi, T.; Kanagawa, T.; Kurane, R.; et al. Bacterial communities in petroleum oil in stockpiles. J. Biosci. Bioeng. 2005, 99, 143–149. [Google Scholar] [CrossRef] [PubMed]
- Li, M.; Gong, J.; Cottrill, M.; Yu, H.; de Lange, C.; Burton, J.; Topp, E. Evaluation of QIAamp® DNA Stool Mini Kit for ecological studies of gut microbiota. J. Microbiol. Methods 2003, 54, 13–20. [Google Scholar] [CrossRef]
- Krakova, L.; Soltys, K.; Otlewska, A.; Pietrzak, K.; Purkrtova, S.; Savicka, D.; Puskarova, A.; Buckova, M.; Szemes, T.; Budis, J.; et al. Comparison of methods for identification of microbial communities in book collections: Culture-dependent (sequencing and MALDI-TOF MS) and culture-independent (Illumina MiSeq). Int. Biodeterior. Biodegrad. 2018, 131, 51–59. [Google Scholar] [CrossRef]
- Goecks, J.; Nekrutenko, A.; Taylor, J. Galaxy Team Galaxy: A comprehensive approach for supporting accessible, reproducible, and transparent computational research in the life sciences. Genome Biol. 2010, 11, R86. [Google Scholar] [CrossRef] [PubMed]
- Zheng, S.; Shouyi, L.; Lingzhi, H.; Yaolong, C. Visualization programming for batch processing of contour maps based on VB and Surfer software. Adv. Eng. Softw. 2010, 41, 962–965. [Google Scholar]
- Brown, L.R.; Vadie, A.A.; Stephens, J.O. Sowing production decline and extending the economic life of an oil field: New MEOR technology. SPE Reserv. Eval. Eng. 2002, 5, 33–41. [Google Scholar] [CrossRef]
- Wang, Y.; Song, X.; Tian, C.; Shi, C.; Li, J.; Hui, G.; Hou, J.; Gao, C.; Wang, X.; Liu, P. Dynamic fractures are an emerging new development geological attribute in water-flooding development of ultra-low permeability reservoirs. Pet. Explor. Dev. 2015, 42, 247–253. [Google Scholar] [CrossRef]
- Hidalgo, K.J.; Sierra-Garcia, I.N.; Dellagnezze, B.M.; de Oliveira, V.M. Metagenomic insights into the mechanisms for biodegradation of polycyclic aromatic hydrocarbons in the oil supply chain. Front. Microbiol. 2020, 11, 561506. [Google Scholar] [CrossRef]
- Liu, J.; Liu, M.; Wu, M.; Jiang, C.; Chen, X.; Cai, Z.; Wang, B.; Zhang, J.; Zhang, T.; Li, Z. Soil pH rather than nutrients drive changes in microbial community following long-term fertilization in acidic Ultisols of southern China. J. Soils Sediments 2018, 18, 1853–1864. [Google Scholar] [CrossRef]
- Oktyabrskii, O.N.; Smirnova, G.V. Redox potential changes in bacterial cultures under stress conditions. Microbiology 2012, 81, 131–142. [Google Scholar] [CrossRef]
- Kato, S.; Hashimoto, K.; Watanabe, K. Microbial interspecies electron transfer via electric currents through conductive minerals. Proc. Natl. Acad. Sci. USA 2012, 109, 10042–10046. [Google Scholar] [CrossRef] [PubMed]
- Guo, X.; Ho, M.S.; You, L.; Cao, J.; Fang, Y.; Tu, T.; Hong, Y. Industrial water pollution discharge taxes in China: A multi-sector dynamic analysis. Water 2018, 10, 1742. [Google Scholar] [CrossRef]
- Tian, W.; Yao, J.; Liu, R.; Zhu, M.; Wang, F.; Wu, X.; Liu, H. Effect of natural and synthetic surfactants on crude oil biodegradation by indigenous strains. Ecotoxicol. Environ. Saf. 2016, 129, 171–179. [Google Scholar] [CrossRef] [PubMed]
- Koda, E.; Miszkowska, A.; Sieczka, A. Levels of organic pollution indicators in groundwater at the old landfill and waste management site. Appl. Sci. 2017, 7, 638. [Google Scholar] [CrossRef]
- Duhamel, S. The microbial phosphorus cycle in aquatic ecosystems. Nat. Rev. Microbiol. 2024, 23, 239–255. [Google Scholar] [CrossRef]
- Liang, B.; Zhang, K.; Wang, L.; Liu, J.; Yang, S.; Gu, J.; Mu, B.Z. Different diversity and distribution o archaeal community in the aqueous and oil phases of production fluid from high-temperature petroleum reservoirs. Front. Microbiol. 2018, 9, 841. [Google Scholar] [CrossRef]
- Zhou, L.; Li, H.; Zhang, Y.; Han, S.; Xu, H. Sphingomonas from petroleum-contaminated soils in Shenfu, China and their PAHs degradation abilities. Braz. J. Microbiol. 2016, 47, 271–278. [Google Scholar] [CrossRef]
- Mutyala, S.; Kim, C.; Song, Y.E.; Khandelwal, H.; Baek, J.; Seol, E.; Oh, Y.; Kim, J.R. Enabling anoxic acetate assimilation by electrode-driven respiration in the obligate aerobe, Pseudomonas putida. Bioelectrochemistry 2021, 138, 107690. [Google Scholar] [CrossRef]
- Atlas, R.M.; Stoeckel, D.M.; Faith, S.A.; Minard-Smith, A.; Thorn, J.R.; Benotti, M.J. Oil biodegradation and oil-degrading microbial populations in marsh sediments impacted by oil from the Deepwater Horizon well blowout. Environ. Sci. Technol. 2015, 49, 8356–8366. [Google Scholar] [CrossRef]
- Aranda, C.P.; Valenzuela, C.; Matamala, Y.; Godoy, F.A.; Aranda, N. Sulphur-cycling bacteria and ciliated protozoans in a Beggiatoaceae mat covering organically enriched sediments beneath a salmon farm in a southern Chilean fjord. Mar. Pollut. Bull. 2015, 100, 270–278. [Google Scholar] [CrossRef]
- Rendulic, S.; Jagtap, P.; Rosinus, A.; Eppinger, M.; Baar, C.; Lanz, C.; Keller, H.; Lambert, C.; Evans, K.J.; Goesmann, A.; et al. A predator unmasked: Life cycle of Bdellovibrio bacteriovorus from a genomic perspective. Science 2004, 303, 689–692. [Google Scholar] [CrossRef] [PubMed]
- Palleroni, N.J.; Port, A.M.; Chang, H.K.; Zylstra, G.J. Hydrocarboniphaga effusa gen. nov., sp nov., a novel member of the γ-Proteobacteria active in alkane and aromatic hydrocarbon degradation. Int. J. Syst. Evol. Microbiol. 2004, 54, 1203–1207. [Google Scholar] [CrossRef] [PubMed]
- Matsumoto, A.; Kasai, H.; Matsuo, Y.; Omura, S.; Shizuri, Y.; Takahashi, Y. Ilumatobacter fluminis gen. nov., sp nov., a novel actinobacterium isolated from the sediment of an estuary. J. Gen. Appl. Microbiol. 2009, 55, 201–205. [Google Scholar] [CrossRef]
- Han, S.K.; Nedashkovskaya, O.I.; Mikhailov, V.V.; Kim, S.B.; Bae, K.S. Salinibacterium amurskyense gen. nov., sp nov., a novel genus of the family Microbacteriaceae from the marine environment. Int. J. Syst. Evol. Microbiol. 2003, 53, 2061–2066. [Google Scholar] [CrossRef]
- Ibacache-Quiroga, C.; Ojeda, J.; Dinamarca, M.A. 16S rRNA amplicon sequencing of seawater microbiota from Quintero Bay, Chile, affected by oil spills, shows the presence of an oil-degrading marine bacterial guild structured by the bacterial genera Alcanivorax, Cobetia, Halomonas, and Oleiphilus. Microbiol. Resour. Announc. 2018, 7, 1318–1366. [Google Scholar] [CrossRef]
- Yun, S.H.; Choi, C.; Lee, S.; Lee, Y.G.; Kwon, J.; Leem, S.H.; Chung, Y.H.; Kahng, H.; Kim, S.J.; Kwon, K.K.; et al. Proteomic characterization of plasmid pLA1 for biodegradation of polycyclic aromatic hydrocarbons in the marine bacterium, Novosphingobium pentaromativorans US6-1. PLoS ONE 2014, 9, e90812. [Google Scholar] [CrossRef]
- Qiu, X.; Wang, Y. Evaluation of sedimentary characteristics of the Chang 9 Oil Layer Formation in the Yanchang Formation, Ordos Basin. Appl. Sci. 2024, 14, 4035. [Google Scholar] [CrossRef]
- Tian, H.; Gao, P.; Chen, Z.; Li, Y.; Li, Y.; Wang, Y.; Zhou, J.; Li, G.; Ma, T. Compositions and abundances of sulfate-reducing and sulfur oxidizing microorganisms in water-flooded petroleum reservoirs with different temperatures in China. Front. Microbiol. 2017, 8, 143. [Google Scholar] [CrossRef]
- Bouanane-Darenfed, A.; Fardeau, M.; Gregoire, P.; Joseph, M.; Kebbouche-Gana, S.; Benayad, T.; Hacene, H.; Cayol, J.; Ollivier, B. Caldicoprobacter algeriensis sp nov a new thermophilic anaerobic, xylanolytic bacterium isolated from an Algerian hot spring. Curr. Microbiol. 2011, 62, 826–832. [Google Scholar] [CrossRef]
- Yang, Y.; Li, S.; Gao, Y.; Chen, Y.; Zhan, A. Environment-driven geographical distribution of bacterial communities and identification of indicator taxa in Songhua River. Ecol. Indic. 2019, 101, 62–70. [Google Scholar] [CrossRef]
- Yamane, K.; Hattori, Y.; Ohtagaki, H.; Fujiwara, K. Microbial diversity with dominance of 16S rRNA gene sequences with high GC contents at 74 and 98 °C subsurface crude oil deposits in Japan. FEMS Microbiol. Ecol. 2011, 76, 220–235. [Google Scholar] [CrossRef] [PubMed]
- Guo, Y.C.; Mohapatra, S.C.; Guedes Soares, C. Composite breakwater of a submerged horizontal flexible porous membrane with a lower rubble mound. Appl. Ocean Res. 2020, 104, 102371. [Google Scholar] [CrossRef]
Disclaimer/Publisher’s Note: The statements, opinions and data contained in all publications are solely those of the individual author(s) and contributor(s) and not of MDPI and/or the editor(s). MDPI and/or the editor(s) disclaim responsibility for any injury to people or property resulting from any ideas, methods, instructions or products referred to in the content. |
© 2025 by the authors. Licensee MDPI, Basel, Switzerland. This article is an open access article distributed under the terms and conditions of the Creative Commons Attribution (CC BY) license (https://creativecommons.org/licenses/by/4.0/).