1. Introduction
Imaging sonar denotes one of the most crucial high-tech marine exploration devices in the field of contemporary ocean engineering. Imaging sonars have had extensive applications in the tasks of submarine construction and maintenance, marine mapping, and oceanic resource exploration [
1,
2,
3]. However, the detection performance of imaging sonars during their practical operations is significantly affected by several factors, including complex and variable marine acoustic fields, environmental noise, and unstable platform motion. This can result in the problems of a low signal-to-noise ratio (SNR) of target echoes, prevalent speckle noise in sonar images, and inconsistent imaging quality [
4,
5,
6]. Therefore, achieving reliable target detection while maintaining low values of false alarm rate (FAR) and missed detection rate (MDR) in complex environments remains a critical challenge in the field of sonar signal processing. Constant false alarm rate (CFAR) detection technology has demonstrated superior capability in controlling false alarms in environments with Gaussian-distributed backgrounds [
7,
8]. Recently, with continuous advancements in CFAR detection methods, this technique has gained widespread adoption in sonar imaginary applications [
9,
10].
To enable autonomous target detection in side-scan sonar imagery, Villar et al. [
11,
12] extended the cell-averaging CFAR (CA-CFAR) detection methodology from one-dimensional to two-dimensional processing and achieved satisfactory performance in pipeline detection using side-scan sonar systems. However, although the CA-CFAR algorithm can achieve good computational efficiency and optimal performance in homogeneous backgrounds, its detection capability significantly deteriorates in heterogeneous environments, particularly under the condition of multiple target interference scenarios. To address these limitations, Verma et al. [
13] developed a variability index CFAR (VI-CFAR) detection algorithm by integrating the CA method with the greatest of (GO) and smallest of (SO) techniques for sonar target detection. The results indicated that the VI-CFAR method could reduce the CFAR loss in homogeneous environments while maintaining reasonable robustness for heterogeneous backgrounds characterized by interference targets and clutter transitions. However, its detection performance degraded when there were interference targets in the two reference windows simultaneously. Wang et al. [
14] designed an enhanced detection method by considering the distinct noise distribution characteristics in both the azimuth and range dimensions of sonar imagery. They extended the weighted-cell-averaging CFAR (WCA-CFAR) technique to two-dimensional sonar image processing and achieved balanced target detection performance using multibeam bathymetric sonar water column imagery. Nevertheless, using this approach in practice requires prior knowledge of background statistics, which might limit its implementation in dynamic underwater environments. The aforementioned methods belong to the category of mean-based CFAR detection methods.
Another significant category of CFAR detection methods includes ordered-statistics (OS)-based methods, such as ordered-statistics CFAR (OS-CFAR) [
15], censored-mean CFAR (CM-CFAR) [
16], and weighted-window CFAR (WW-CFAR) [
17]. The OS-based methods have demonstrated superior robustness compared to their mean-based counterparts in heterogeneous environments.
Villar et al. [
15] applied the 2D OS-CFAR detection method to the field of side-scan sonar imagery. They proposed a new approach to improve the algorithmic efficiency of the 2D OS-CFAR using distributive histograms and the optimal breakdown point concept. Wang et al. [
16] developed the censored-mean CFAR (CM-CFAR) detection method specifically for detecting terrain targets in multibeam bathymetric sonar water column imagery. This approach outperformed the OS-CFAR method in terms of detection accuracy. The enhanced adaptability is due to the use of an expanded reference cell configuration, which provides more comprehensive environmental sampling. However, this CM-CFAF demonstrates an elevated MDR at low SNR, which is a common scenario in sonar target detection applications. Meng et al. [
17] introduced a weighted window technique into the OS-based detection, applied reduced weighting coefficients to both the higher- and lower-order samples, and proposed the weighted-window CFAR (WW-CFAR) detection method for radar target detection. The WW-CFAR could maintain a superior detection rate in low-SNR environments but exhibited increased susceptibility to false alarms in heterogeneous backgrounds, such as sonar imagery.
Therefore, maintaining an optimal detection performance in complex sonar imaging environments still represents a significant technical challenge. Furthermore, advanced detection algorithms, such as the CM-CFAR and WW-CFAR methods, exhibit substantial computational complexity. In addition, comprehensive detection processing of full-frame sonar imagery requires extensive computational resources and long processing times, which indicates the necessity of the development of efficient detection methods to enhance real-time operational capabilities in practical sonar target detection applications.
To address the aforementioned challenges, this study proposes a segmentation–detection framework for rapid CFAR detection in sonar imagery. The proposed framework employs a dual-stage approach, where the global target region segmentation is performed by Otsu’s thresholding method first, and then local advanced two-dimensional CFAR detection is conducted. In high-resolution sonar images where targets occupy minimal pixel areas, using Otsu’s segmentation method can effectively eliminate both non-target regions and obvious interference sources that can trigger false alarms, thus significantly reducing the computational complexity and FAR value in subsequent detection processes. Based on the proposed detection framework, a segmented-ordered-weighting CFAR (SOW-CFAR) detection method is developed. In the proposed method, the local detection phase incorporates a hybrid method that combines rectangular and trapezoidal ordered weighting windows. The rectangular weighting window is employed under high-SNR conditions to suppress strong interference, whereas the trapezoidal weighting window is used in low-SNR scenarios to prevent missed detections. Such an adaptive weighting strategy enhances the proposed method’s robustness in complex sonar imaging environments and improves its overall detection performance. The effectiveness of the proposed segmentation–detection framework and SOW-CFAR method is verified by the target detection experiments conducted on the water column images acquired by multibeam bathymetric sonar, evaluating the related performance metrics.
The main contributions of this work can be summarized as follows:
- (1)
A segmentation–detection framework that integrates global Otsu segmentation with local two-dimensional CFAR detection is proposed, which can significantly reduce the computational complexity and FAR in subsequent detection processes;
- (2)
A SOW-CFAR detection method is developed. Considering the identification results of potential target regions, this method employs a hybrid framework that combines rectangular and trapezoidal ordered weighting windows in the local refined CFAR detection phase. This approach enhances the algorithm’s adaptability to complex sonar imaging environments, reduces the MDR value, and improves the overall detection performance;
- (3)
Comprehensive lake trials are conducted to perform a detailed comparative analysis of the proposed segmentation–detection framework and SOW-CFAR detection method. The empirical evaluation results validate the proposed algorithm’s performance against the widely used CA and OS-CFAR methods.
The remainder of this paper is organized as follows.
Section 2 introduces a one-dimensional CFAR detection model, describes a segmentation–detection framework for rapid target detection in the sonar imagery field in detail, and provides a detailed explanation of the SOW-CFAR detection method.
Section 3 provides a comparative performance analysis of various CFAR detection methods through lake trials and demonstrates the effectiveness of the proposed approaches.
Section 4 discusses the advantages of the proposed method, and analyzes the underlying reasons for its superior performance over the existing methods.
Section 5 analyzes the proposed method’s limitations and outlines potential directions for future research. Finally,
Section 6 concludes this study and briefly presents future application directions.
2. Proposed Method
2.1. Fundamental Principles of CFAR Detection
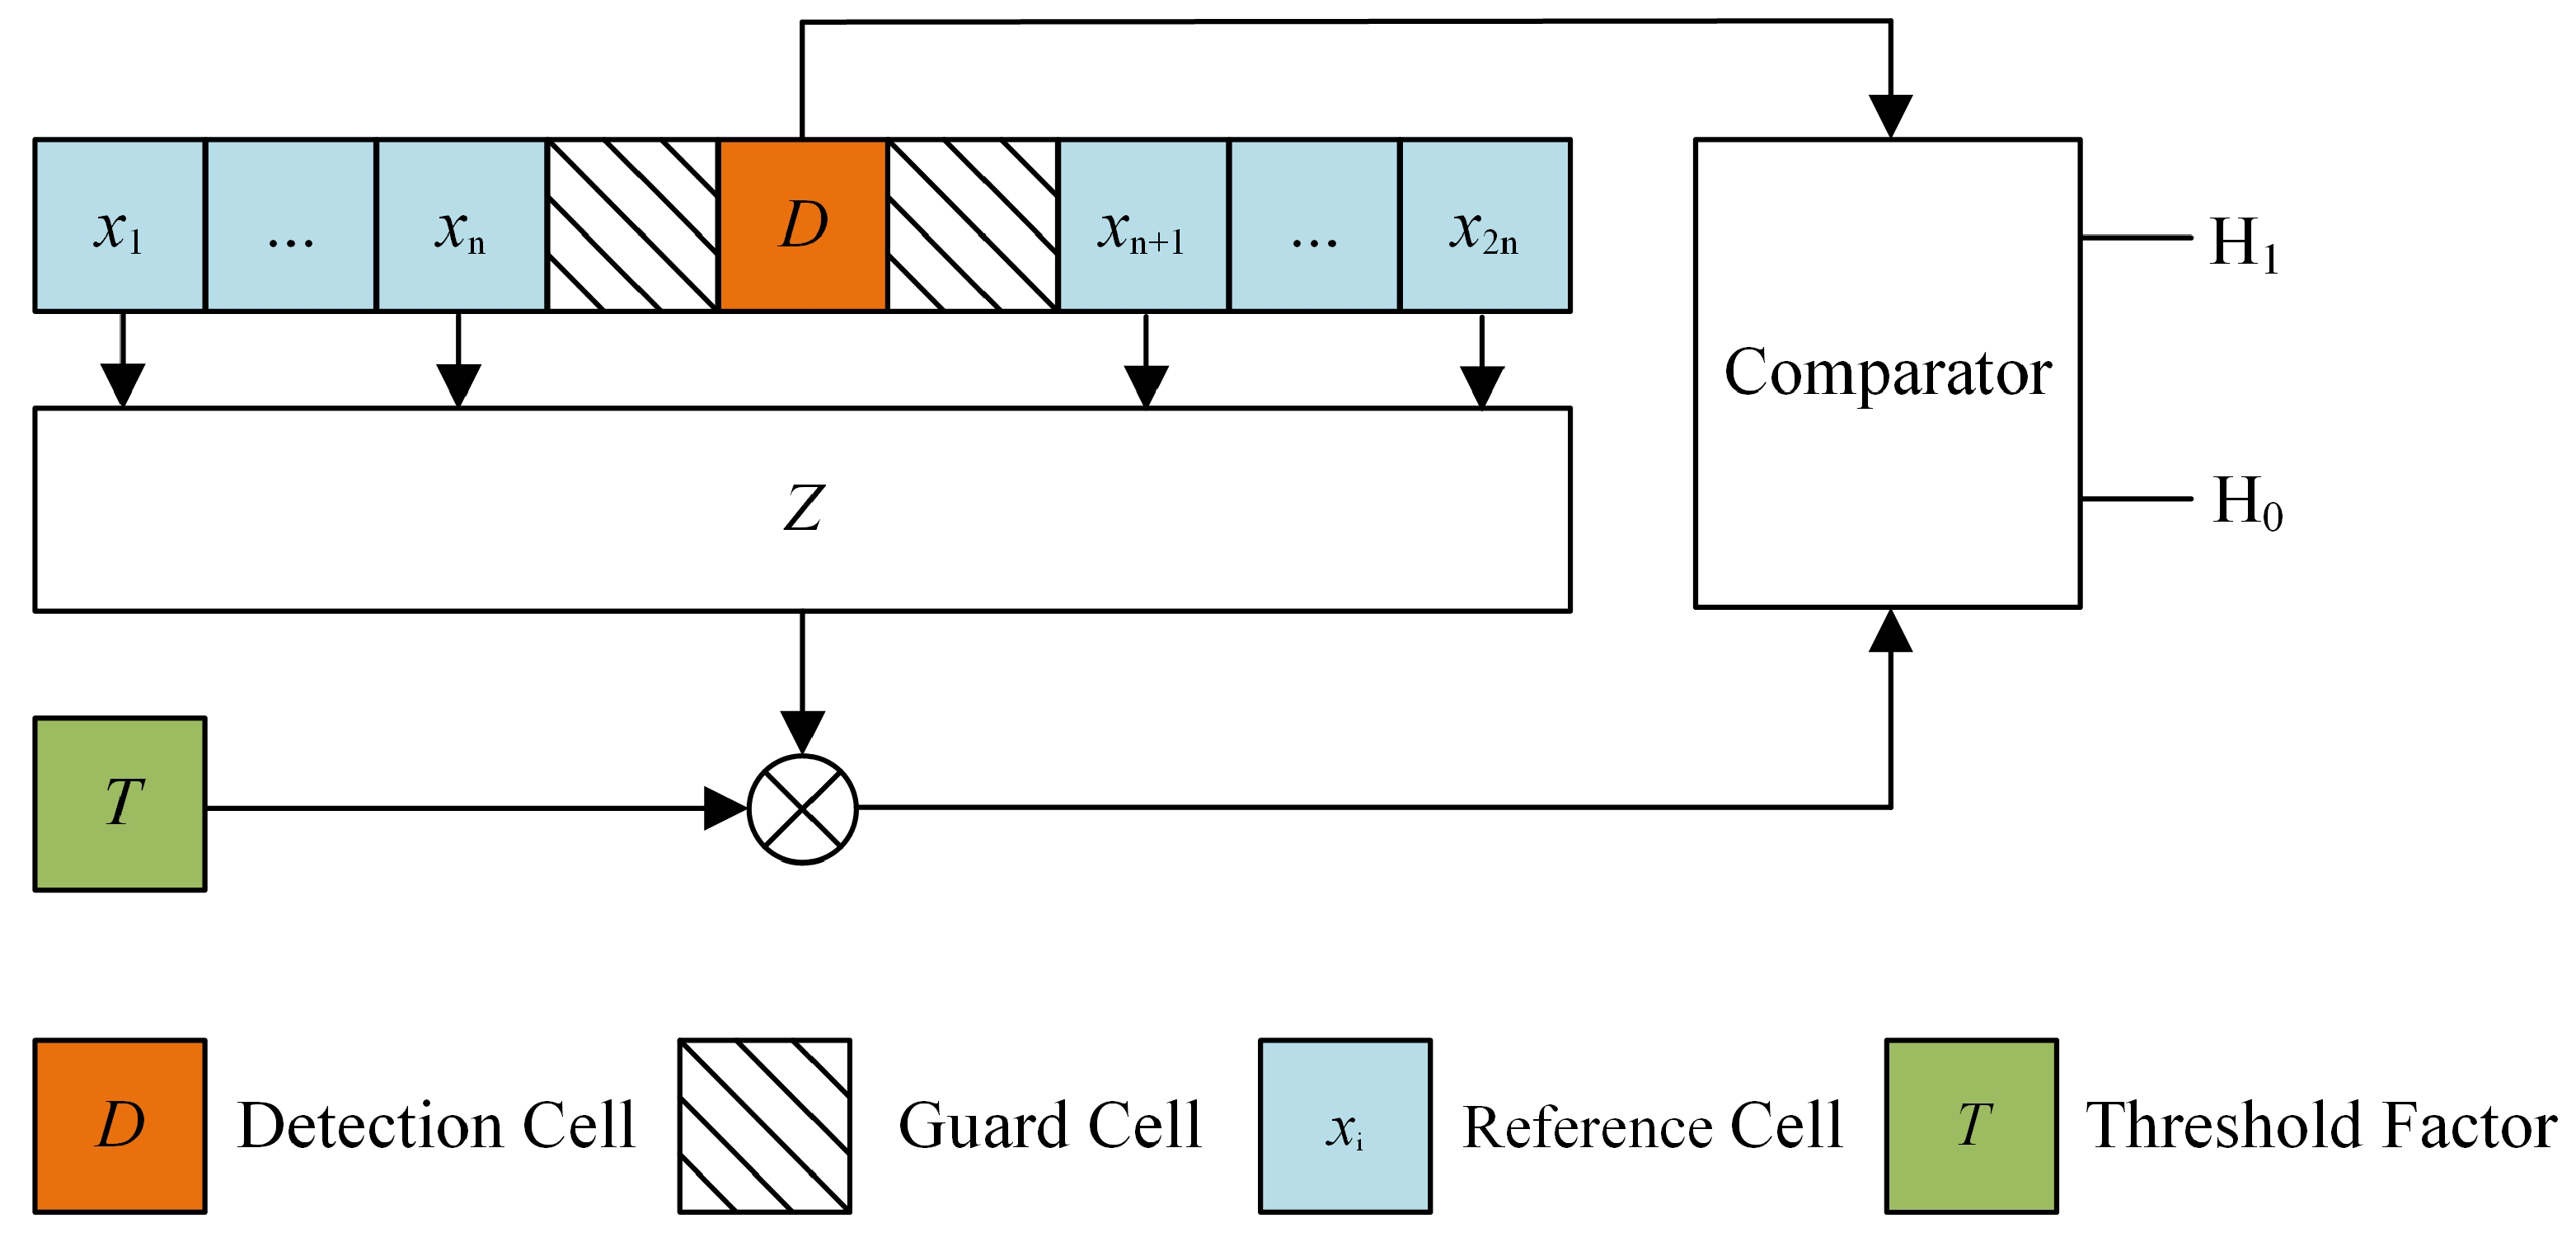
The segmentation–detection framework and SOW-CFAR method based on the fundamental principles of one-dimensional CFAR theory are proposed to achieve rapid and reliable target detection in the field of sonar imagery. To facilitate a comprehensive analysis of the proposed solutions, this study first introduces the theoretical framework of one-dimensional CFAR detection. The schematic diagram of a one-dimensional CFAR detector structure is displayed in
Figure 1.
A CFAR detector uses a sliding window structure and generates adaptive thresholds locally to maintain a relatively CFAR under ideal conditions. In
Figure 1, the orange cell, denoted by
D, represents the detection statistic in the cell under test (CUT) in the presented framework. Next to the CUT, there are two guard cells, which prevent target energy leakage into the reference cells, thus preserving the accuracy of the local clutter power estimation process. The cells on both sides of the CUT, marked in a light blue color, denote the reference cells, which are represented by
, where
defines the total length of the reference sliding window, and
n is the length of the single-sided reference window. Assume that
Z denotes the local estimate of clutter power derived from a reference cell
, and
T represents the threshold multiplier; then, the adaptive decision criterion can be expressed as follows:
where
represents the hypothesis of target presence, and
denotes the hypothesis of target absence.
The envelope of Gaussian-distributed clutter follows a Rayleigh distribution. However, after the square-law detection, each reference cell sample in the detection window exhibits an exponential distribution, which is characterized by the probability density function (PDF) expressed by
Under hypothesis
, where no target is present in reference cells, the parameter
denotes the total average power level of the background clutter plus the noise denoted by
. In contrast, under the hypothesis
, where a target exists in reference cells,
is expressed by
, where
denotes the ratio of the signal power to the average power of the clutter-plus-noise interference. Thus, it can be written that
Assume the reference cell samples are independent and identically distributed (IID) and their
is equal to
; then, under a threshold
, which is a random variable, the false alarm probability
is calculated using the statistical expectation over
Z as follows:
where
is the PDF of variable
Z, and
is the moment-generating function (MGF) of variable
Z.
When
, Equation (
4) reduces to the detection probability (
) formula under a uniform clutter background, which is expressed by
In the CA-CFAR method, the estimation of the background power level is conducted based on the mean value of
R reference cell samples, which is expressed by
where
follows an exponential distribution, which represents a special case of the Gamma distribution when
, that is,
.
Further, considering that all reference cell samples are IID, it follows that
; thus, the MGF of
can be expressed by
By employing the MGF, the
and
values of the CA-CFAR detection method can be respectively obtained by
However, in the OS-CFAR detection method, the detection process begins by sorting
R reference cell samples in ascending order, which can be expressed by
Next, the
kth ordered sample is selected as an estimate of the background power level
Z, which is defined by
The PDF of
is expressed by
The MGF value of
is calculated by
Using the MGF value calculated by Equation (
13), the
and
values of the OS-CFAR detection method are respectively obtained by
Based on all the aforementioned, it can be concluded that both the CA-CFAR and OS-CFAR methods exhibit a CFAR property because their and values are independent of .
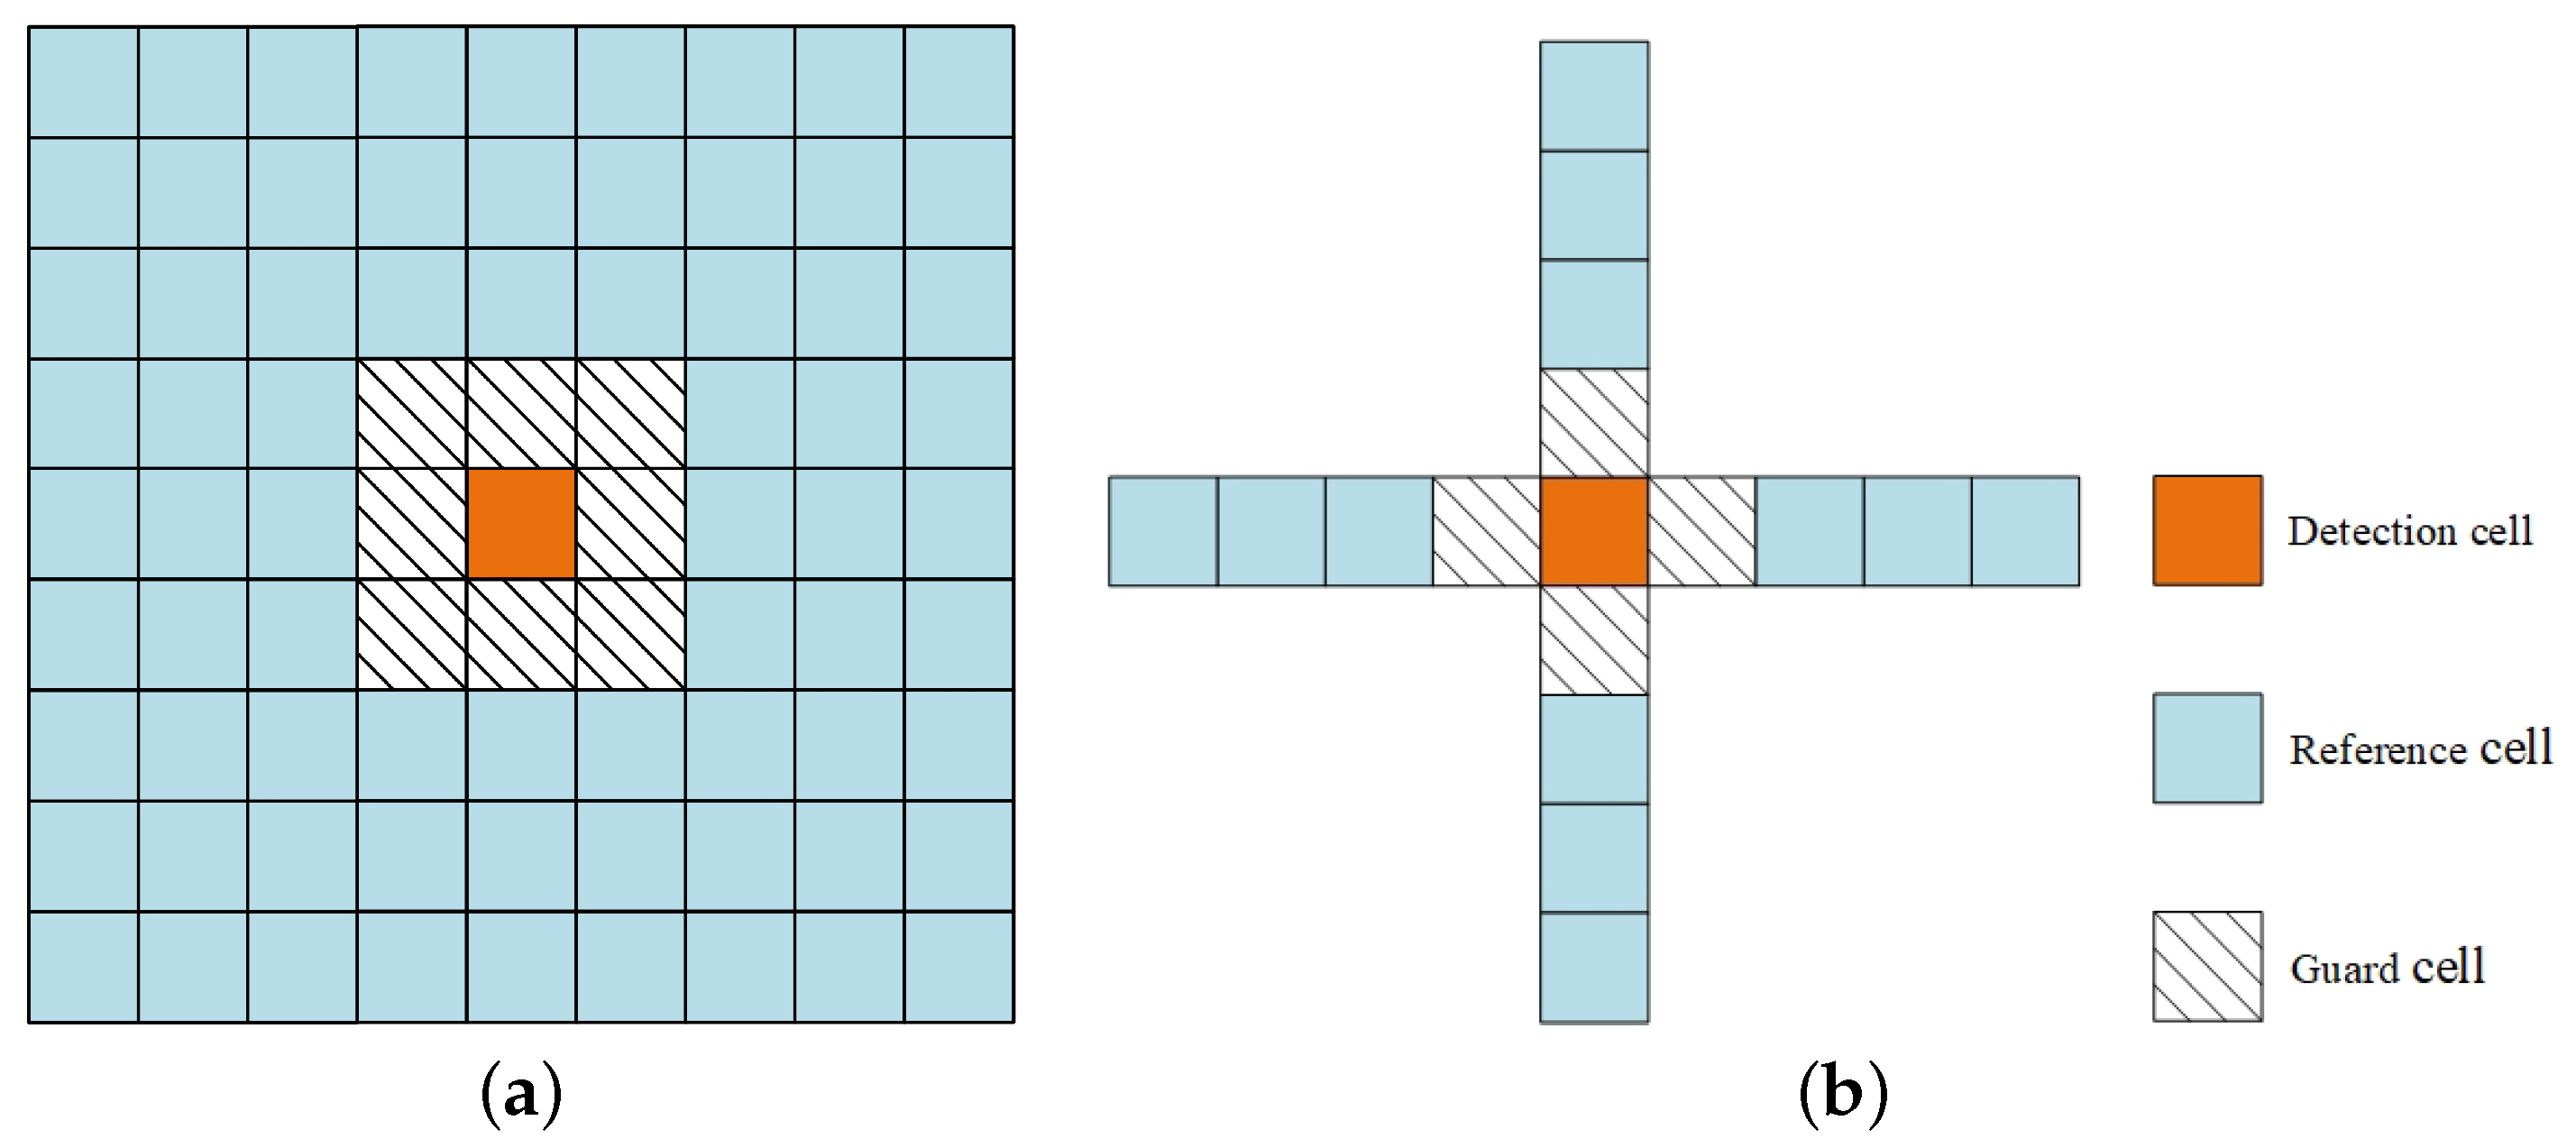
Traditional one-dimensional CFAR detectors employ a detection window that slides along a single axis, which can significantly reduce their robustness when background characteristics exhibit rapid variations. Further, due to the complex marine environment and the application of spatial filtering algorithms, sonar imagery often shows substantial noise fluctuations in both the azimuth and range dimensions. Therefore, to achieve superior detection performance, this study adopts a two-dimensional detection window approach. The schematic diagram of two common types of two-dimensional detection windows is illustrated in
Figure 2. Unlike one-dimensional detection windows, two-dimensional detection windows that include rectangular and cross detection window configurations offer distinct advantages by considering the noise characteristics in the vertical range and horizontal azimuth dimensions simultaneously. The cross detection window configuration has substantially fewer reference cells than rectangular windows of the same dimensions, which reduces computational complexity significantly. Consequently, this study employs a cross detection window to maintain computational efficiency. When the background clutter power is estimated using a two-dimensional cross detection window, the total number of reference cells is given by
.
2.2. Segmentation–Detection Framework
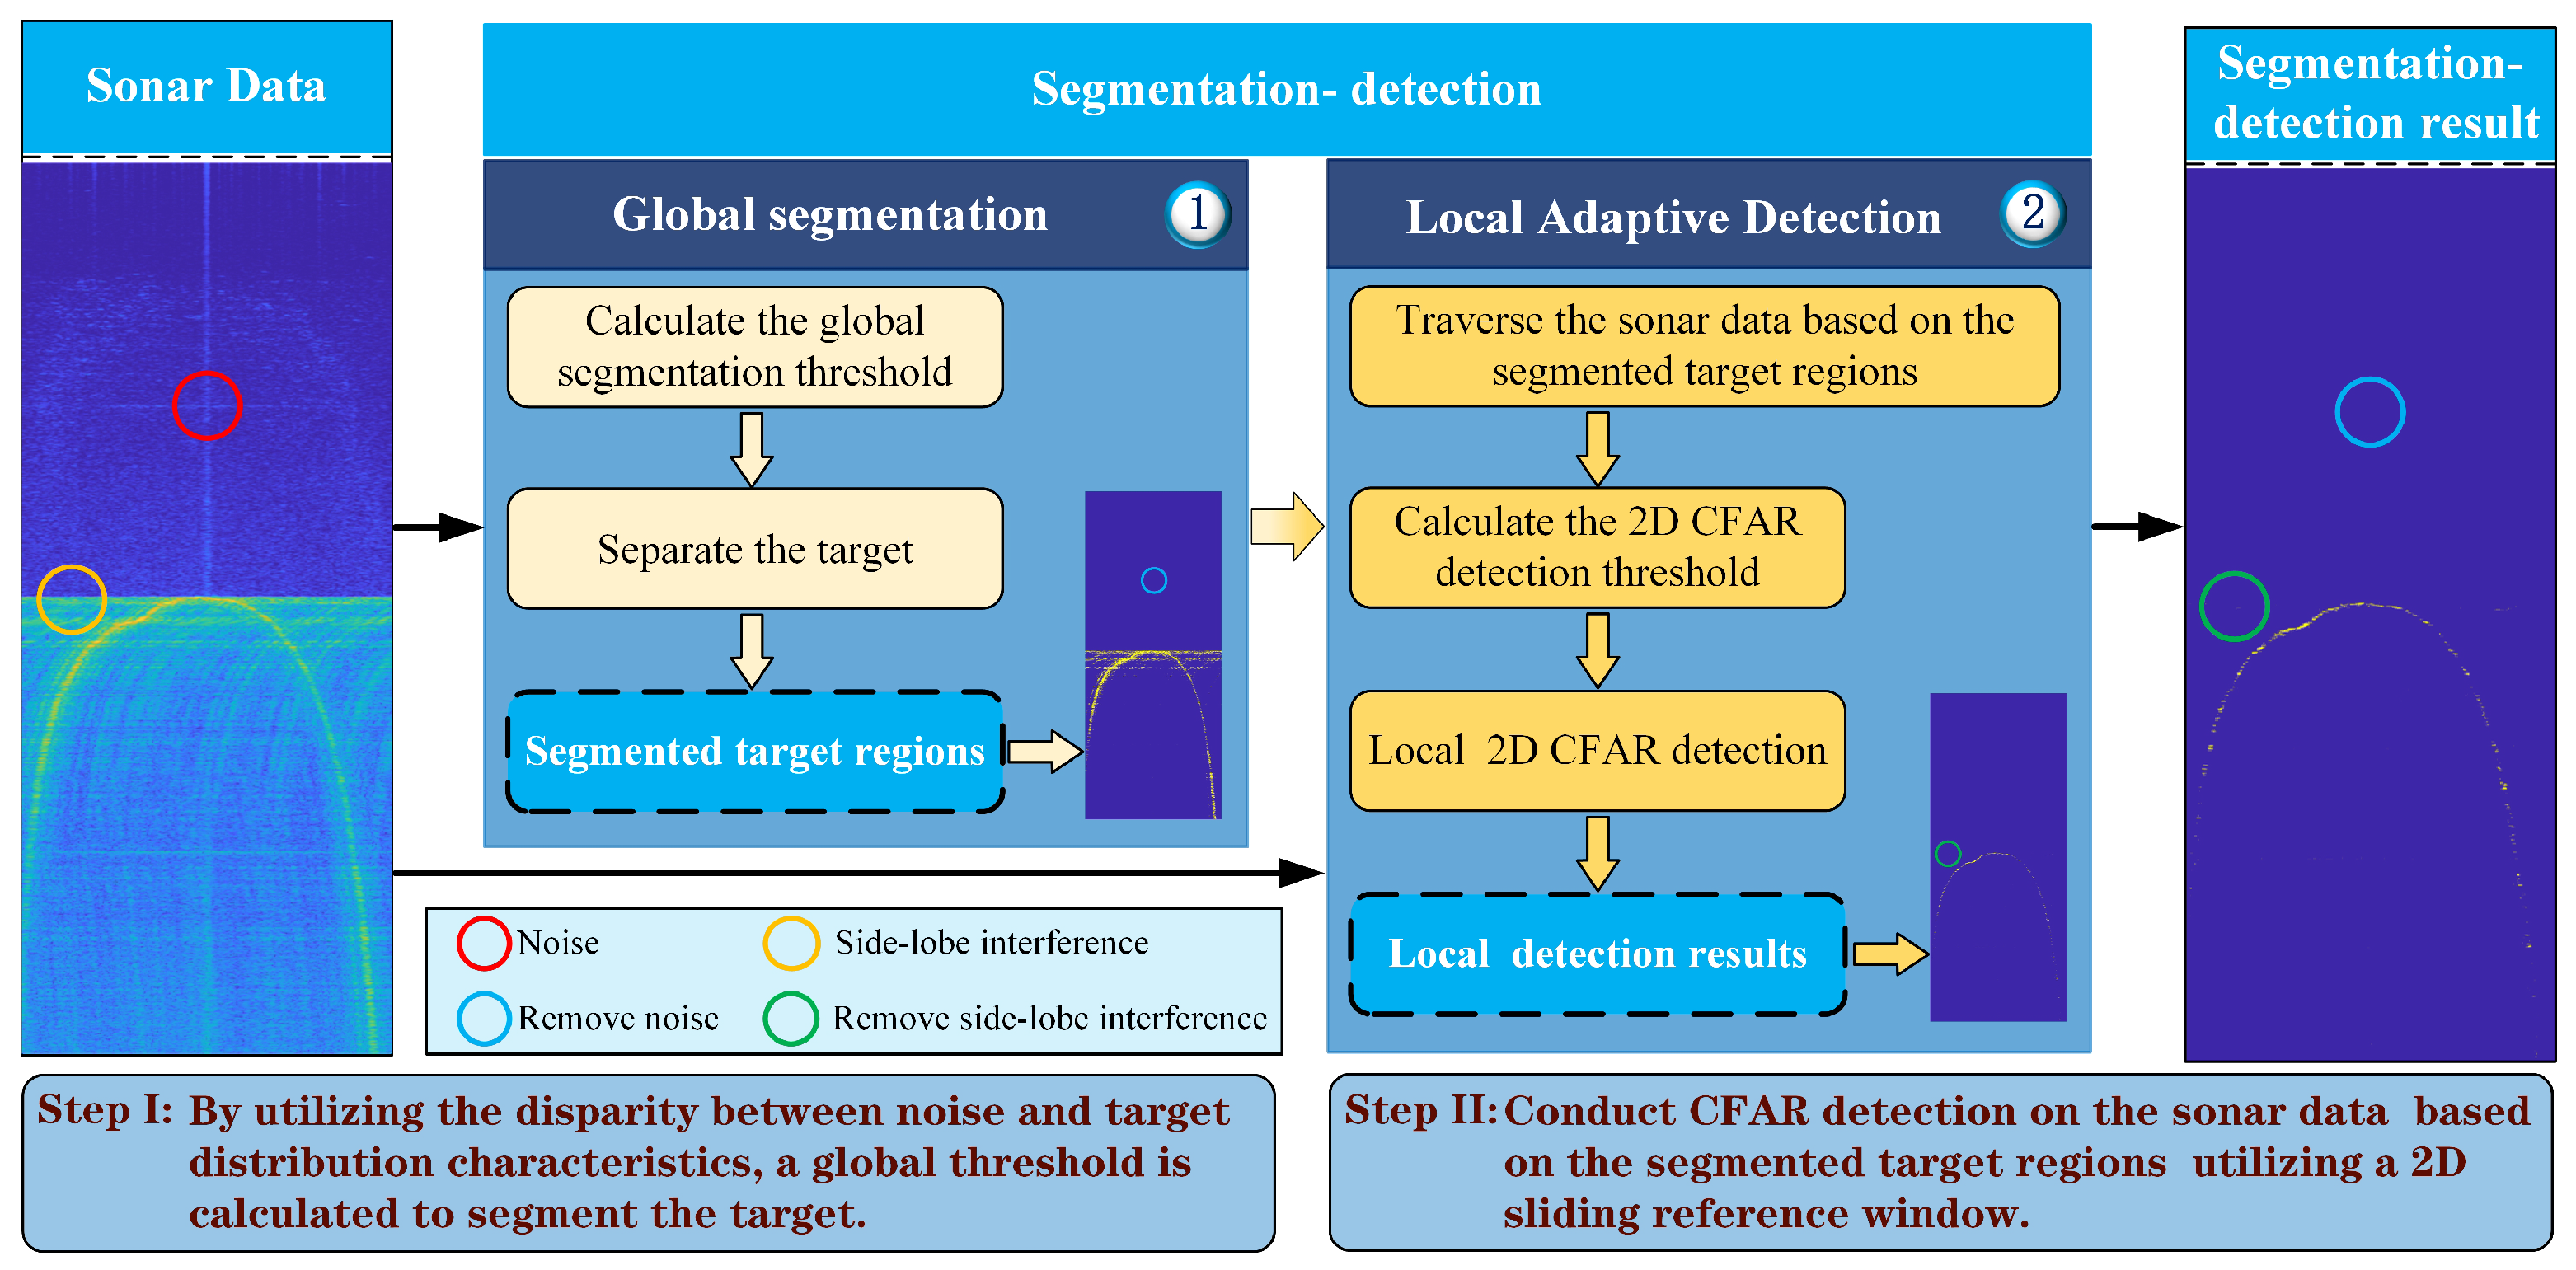
In sonar imagery data, targets occupy an extremely small fraction of data points, and therefore, performing two-dimensional CFAR detection on every pixel would require extensive computational resources and processing times. To address this challenge, this study proposes a segmentation–detection framework for rapid CFAR-based target detection in sonar images. The proposed segmentation–detection framework is illustrated in
Figure 3, where it can be seen that it includes two sequential stages, which are as follows:
- (1)
Global Segmentation Stage: In this stage, a global threshold is calculated based on the distinct distribution characteristics between the target and background data, which enables rapid segmentation of potential target regions, yielding precisely segmented target regions.
- (2)
Local Adaptive Detection Stage: In this stage, a two-dimensional CFAR sliding window is applied to the sonar data based on the segmented target regions to calculate localized adaptive thresholds. Subsequently, localized 2D-CFAR detection is performed, generating precise target detection results.
Figure 3.
The block diagram of the proposed segmentation–detection framework.
Figure 3.
The block diagram of the proposed segmentation–detection framework.
Consider a sonar image frame with a size of
, where the intensity level range is
, and let
denote the frequency of an intensity level
i. Then, the probability of occurrence for intensity
i is expressed by
By using an intensity threshold k as a boundary, data whose intensity levels belong to the set
are classified as a background (
), and data whose intensity levels are form the set
are classified as a target (
), thus partitioning the entire dataset into two classes denoted by
and
. The probabilities
of the two classes, and their mean intensities
, are respectively defined as follows:
The global mean intensity of an image is expressed by
The inter-class variance between classes
and
is calculated by
Otsu’s method [
18] selects an optimal intensity threshold
by maximizing the inter-class variance value, that is the
value, which quantifies the separation between the two classes. The optimal threshold is defined by
By iterating through the sonar data, any data point whose intensity is larger than the predetermined optimal intensity segmentation threshold is classified as a target; otherwise, it is classified as a background. The application of Otsu’s method can effectively isolate target regions while removing the majority of the background, thus significantly reducing the computational load of subsequent detection algorithms. In addition, the segmentation process based on Otsu’s method can also remove some obvious interference sources that could potentially trigger false alarms, which further reduces the false alarm rate of a detection system.
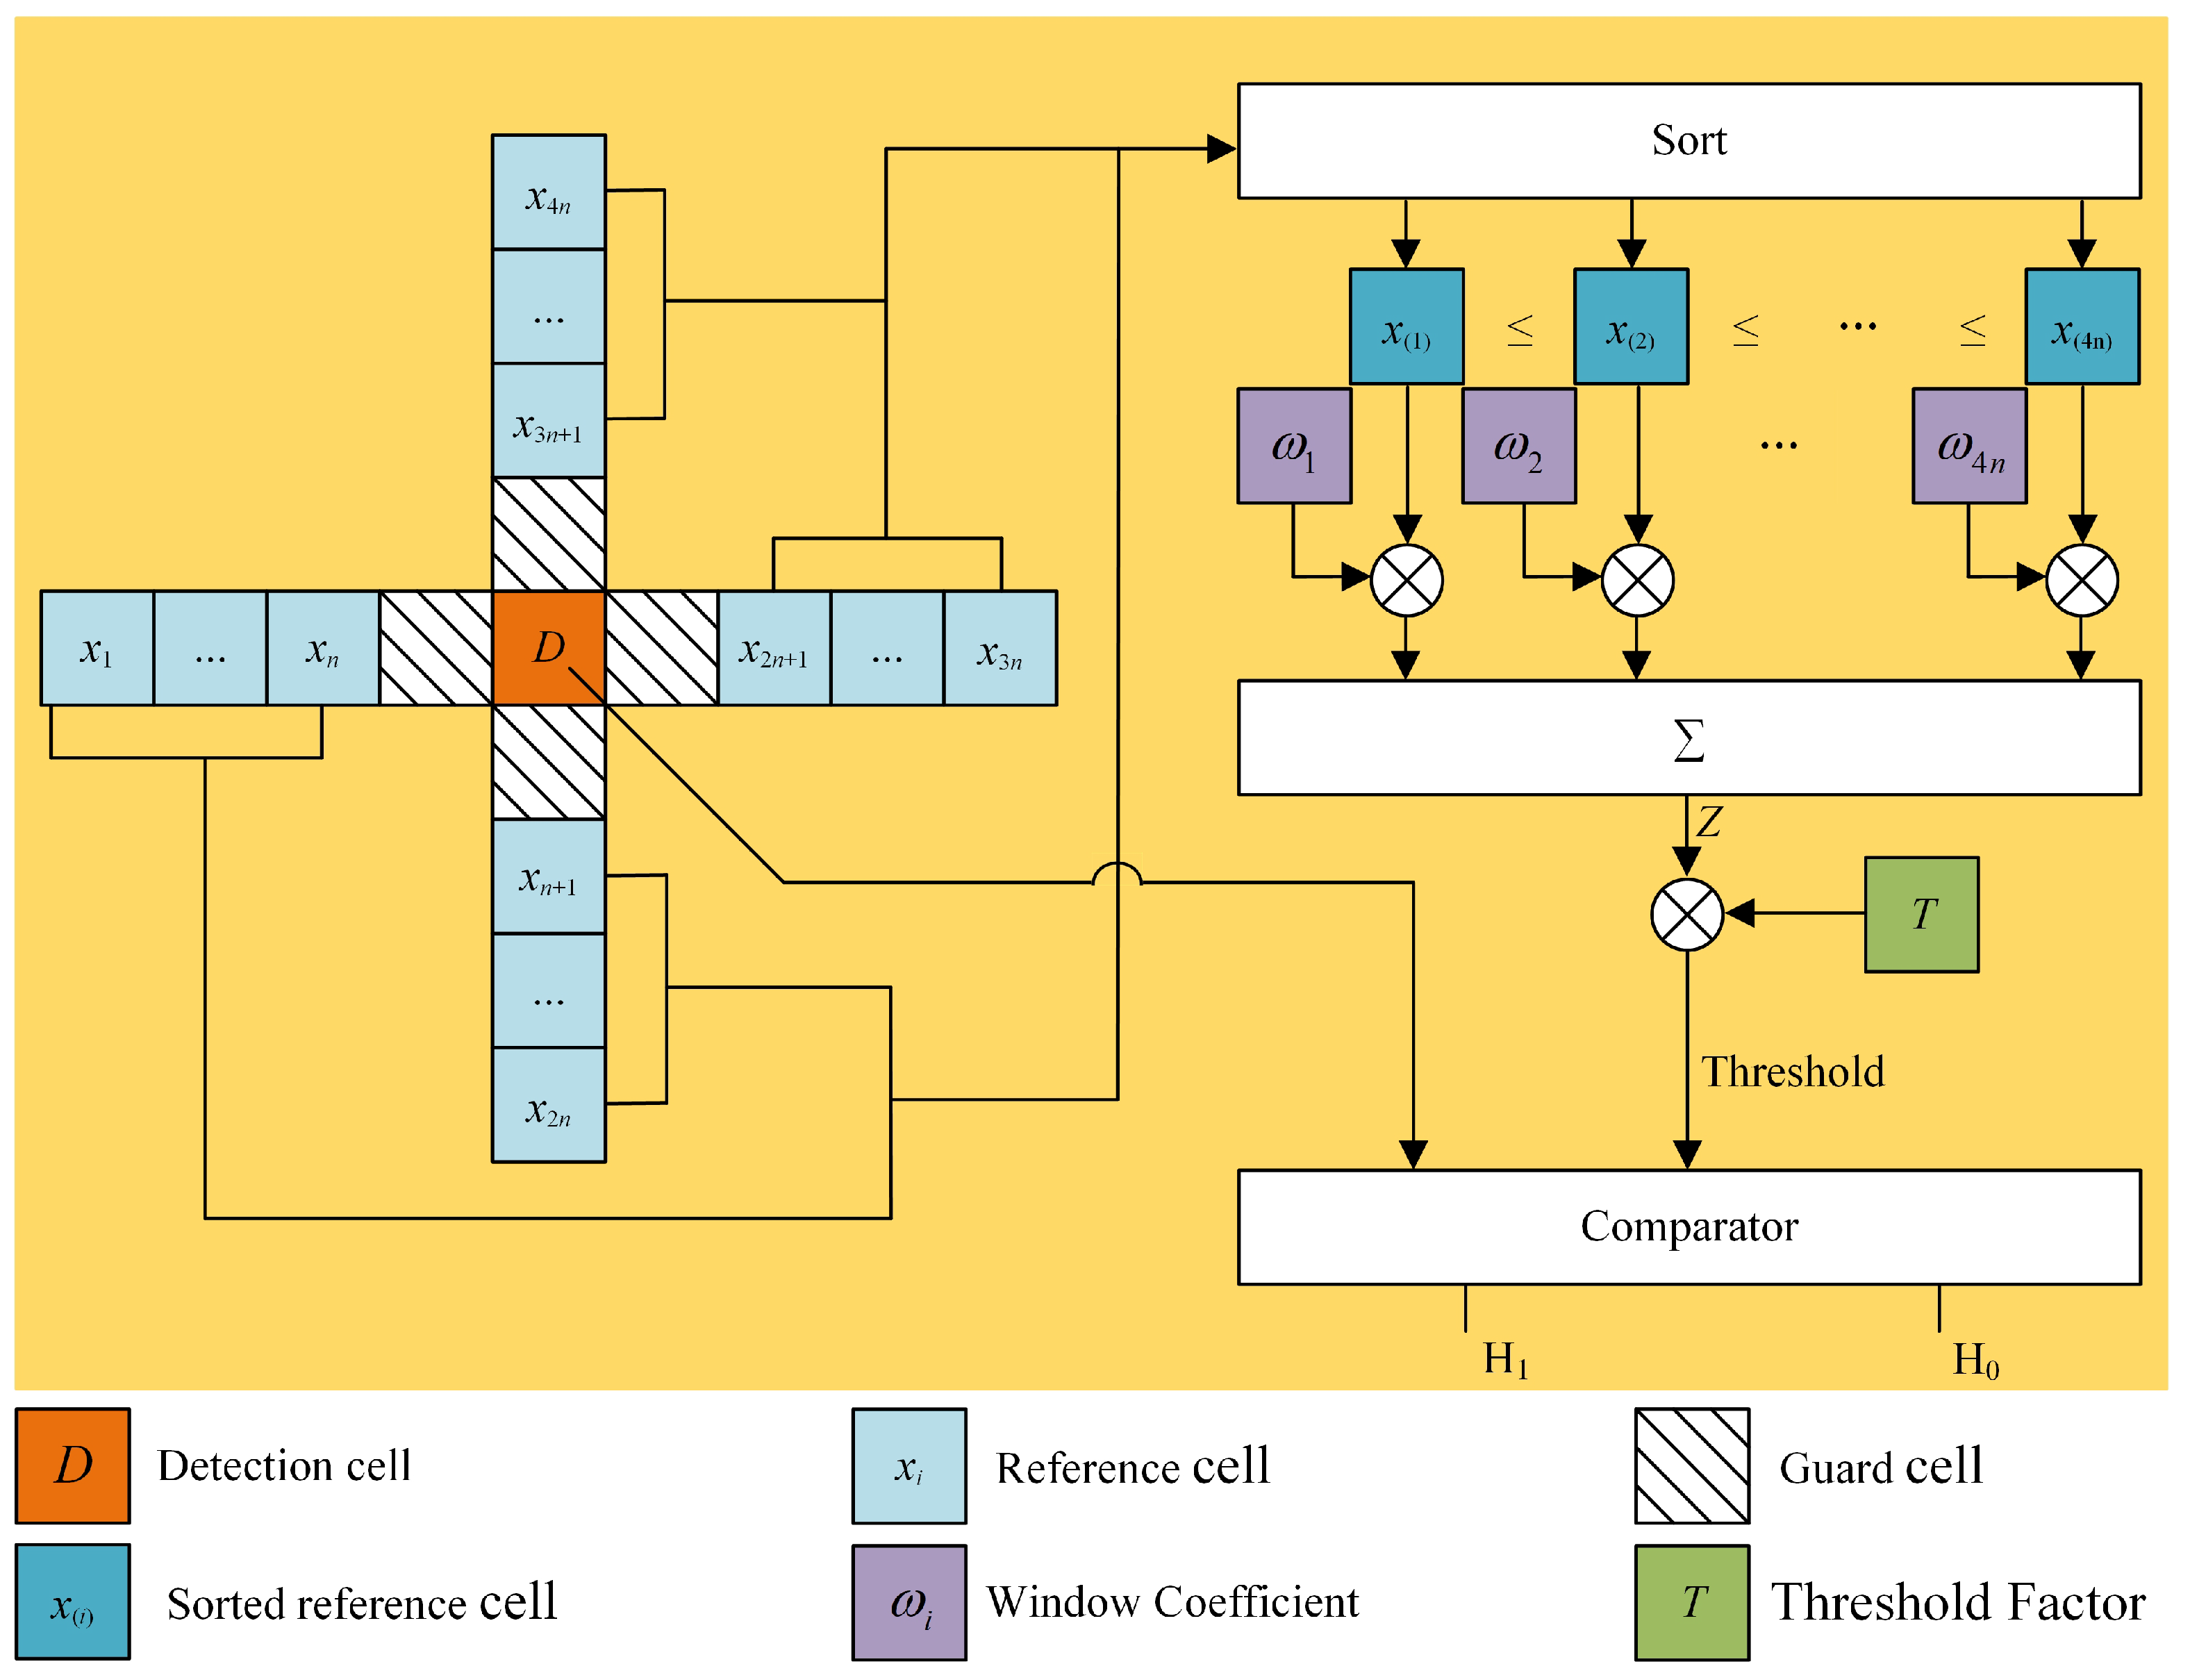
2.3. CFAR Detection Based on Segmented Ordered Weighting
Based on the segmentation–detection framework proposed in
Section 2.2, this study presents the SOW-CFAR detection method. First, Otsu’s method is employed to segment the region where the targets are located. Then, a local two-dimensional ordered-weighting CFAR detection is performed using a cross detection window that simultaneously considers the noise characteristics in both the azimuth and range dimensions. The schematic diagram of the local two-dimensional ordered-weighting CFAR detection in SOW-CFAR is displayed in
Figure 4.
Inspired by the OS-based methods, the proposed SOW-CFAR method sorts the reference cells in ascending order (i.e., from the smallest to the largest) in the sliding window, yielding ordered samples, which can be expressed as
It should be noted that higher-order samples (e.g.,
) might overestimate the background power, thus suppressing weak targets; in contrast, lower-order samples (e.g.,
) might underestimate the background power, thus increasing false alarms. To address this problem, the proposed method assigns weighted coefficients
to the ordered samples and uses the weighted sum for background power estimation. The weighted sum is defined by
Although the original reference cells are statistically independent, the ordered statistics are not. To resolve this problem, this study introduces auxiliary variables [
19], and an auxiliary variable
is defined as follows:
The auxiliary variables are all IID and follow an exponential distribution defined by
Through algebraic manipulation, a weighted sum
Z can be expressed as follows:
where
Thus, the MGF of weighted sum
Z becomes
Further, using the MGF, the
and
values are respectively calculated by
In scenarios, the weighting coefficients can be configured as rectangular or trapezoidal, depending on a particular scenario. When the weighting coefficients are set as a rectangular window, the weighting coefficients are defined as follows:
where
A rectangular window assigns zero weighting coefficients to both the lower- and higher-order samples, thus effectively excluding these extremes, and uses the average of the remaining samples to estimate the background power. However, conventional detection methods, including the CA, OS, and CM-CFAR methods, can be regarded as specialized implementations of a rectangular window framework.
The weighting coefficients of the CA, OS, and CM-CFAR methods using a rectangular window as a weighting function are respectively expressed by
However, when a trapezoidal window is applied as a weighting function,
is defined as follows:
A trapezoidal window assigns small weighting coefficients to both the lower- and higher-order samples rather than discarding them completely and uses the weighted sum of all ordered samples to estimate the background power. This approach ensures a more balanced and robust estimation compared to the rectangular window, particularly in heterogeneous clutter environments. The WW-CFAR method implements a trapezoidal window framework, which provides an enhanced detection performance by adaptively incorporating all reference samples while mitigating the impact of the extreme values.
A rectangular window enhances a detection algorithm’s robustness against multi-target interference, making it particularly suitable for short-range, high-SNR scenarios. However, its performance can significantly degrade in low-SNR environments and often result in missed detections. In contrast, a trapezoidal window ensures better target detection across different SNR conditions at the cost of increased false alarms. However, when a trapezoidal window is combined with a segmentation algorithm, its false alarm rate can be effectively mitigated. Therefore, by strategically integrating the rectangular and trapezoidal windows, a detection system can achieve superior overall performance, thus balancing robustness against interference with reliable target detection under diverse operational conditions. The SOW-CFAR employs a hybrid window strategy, where a rectangular window is used at close ranges to suppress strong sidelobe interference, and a trapezoidal window is adopted at long ranges to reduce missed detections of low-SNR marginal terrain echoes.
4. Discussion
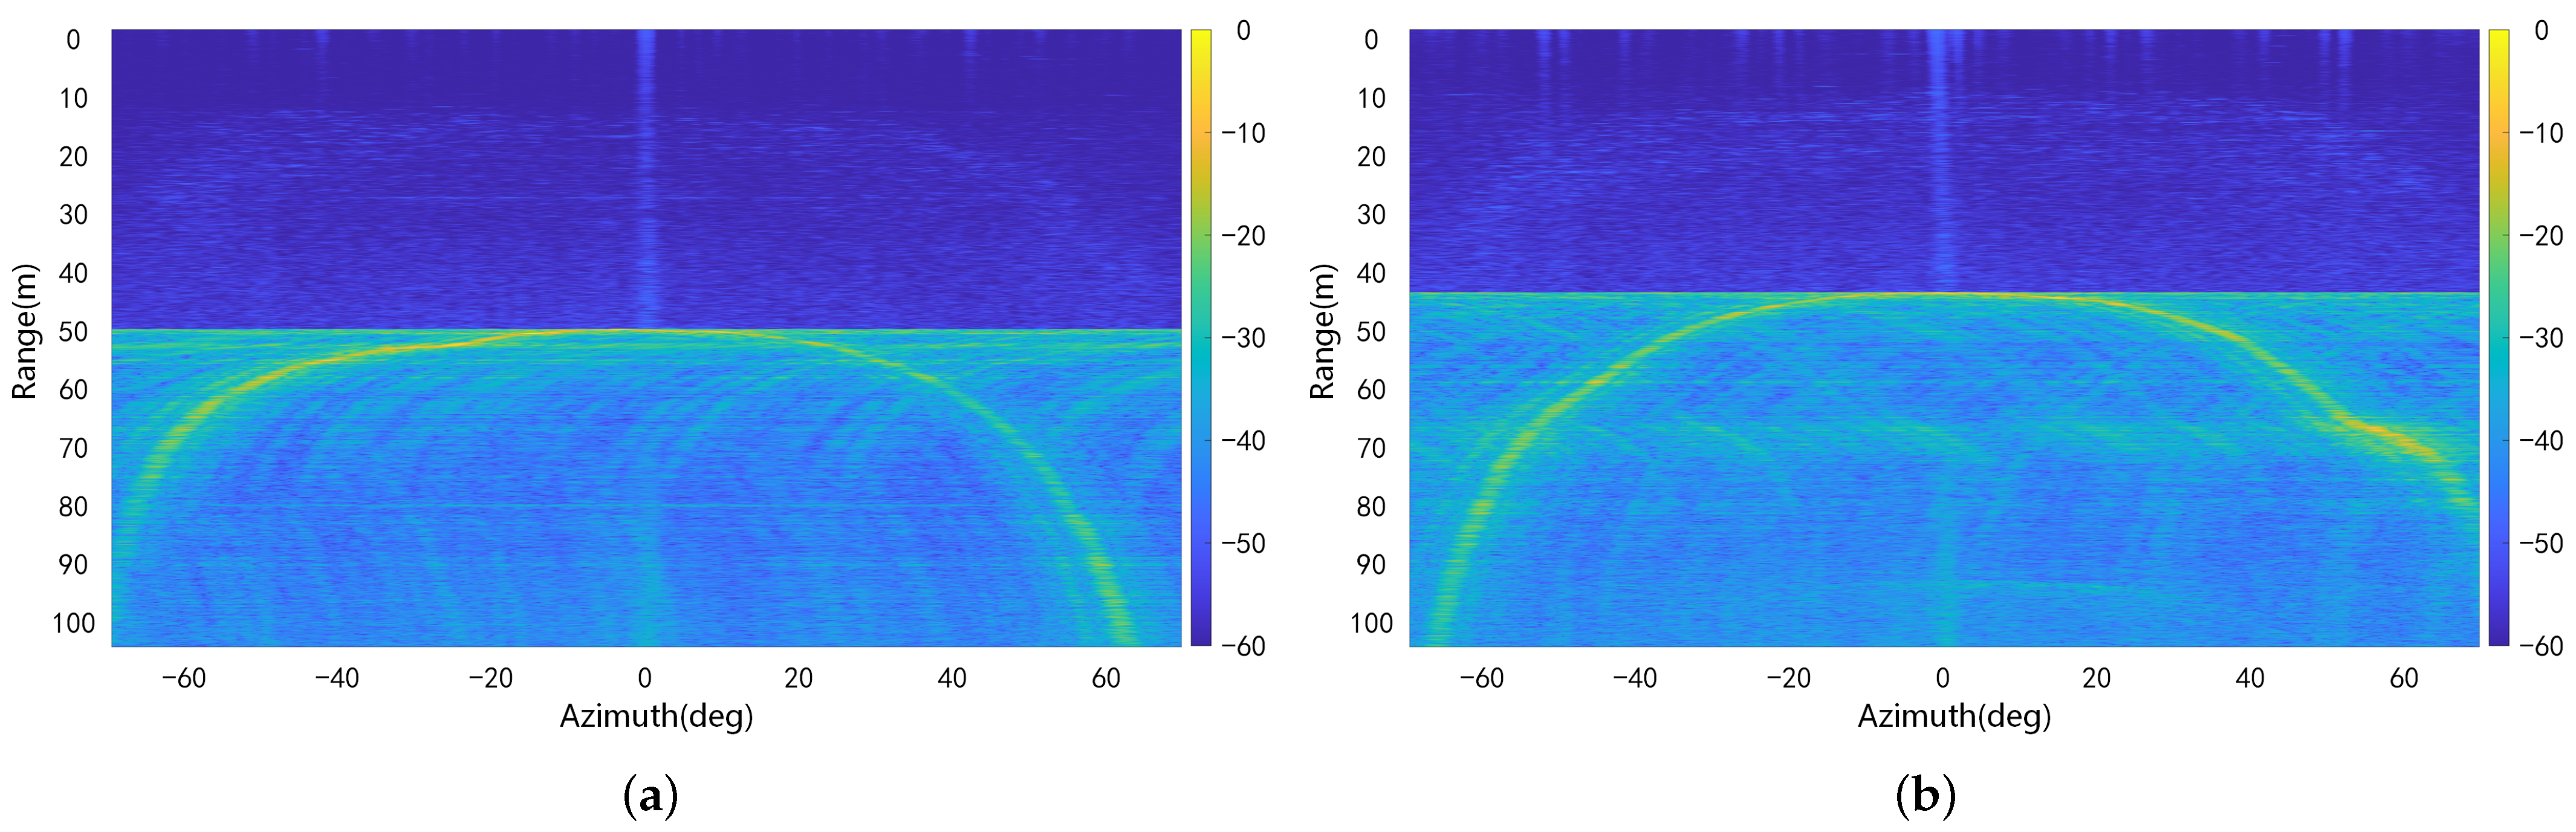
In the proposed segmentation–detection framework, a global segmentation threshold, which is calculated based on the distinct distribution characteristics between the target and background data, is applied to the entire image, which can significantly reduce the number of pixels required for refined 2D-CFAR detection. This approach can drastically reduce the computational time while enhancing efficiency. As explained in
Section 3.3.1, although the CA-CFAR method achieved the shortest detection time of 0.313 s in the experimental tests, the OS-CFAR method exhibited the most substantial computational speed improvement, reducing the detection time from 10.687 s to 0.498 s. Notably, the OS-CFAR method involved sorting operations, which inherently imposed higher computational complexity compared to the CA-CFAR method. This implies that the proposed framework can provide higher computational acceleration for algorithms with elevated complexity. As presented in
Section 3.3.2, leveraging the segmentation–detection framework, the SOW-CFAR method, despite having the highest inherent complexity, achieved a runtime of 0.607 s in the experiments, outperforming both the CA (4.016 s) and OS-CFAR (10.855 s) methods and demonstrating real-time processing capability.
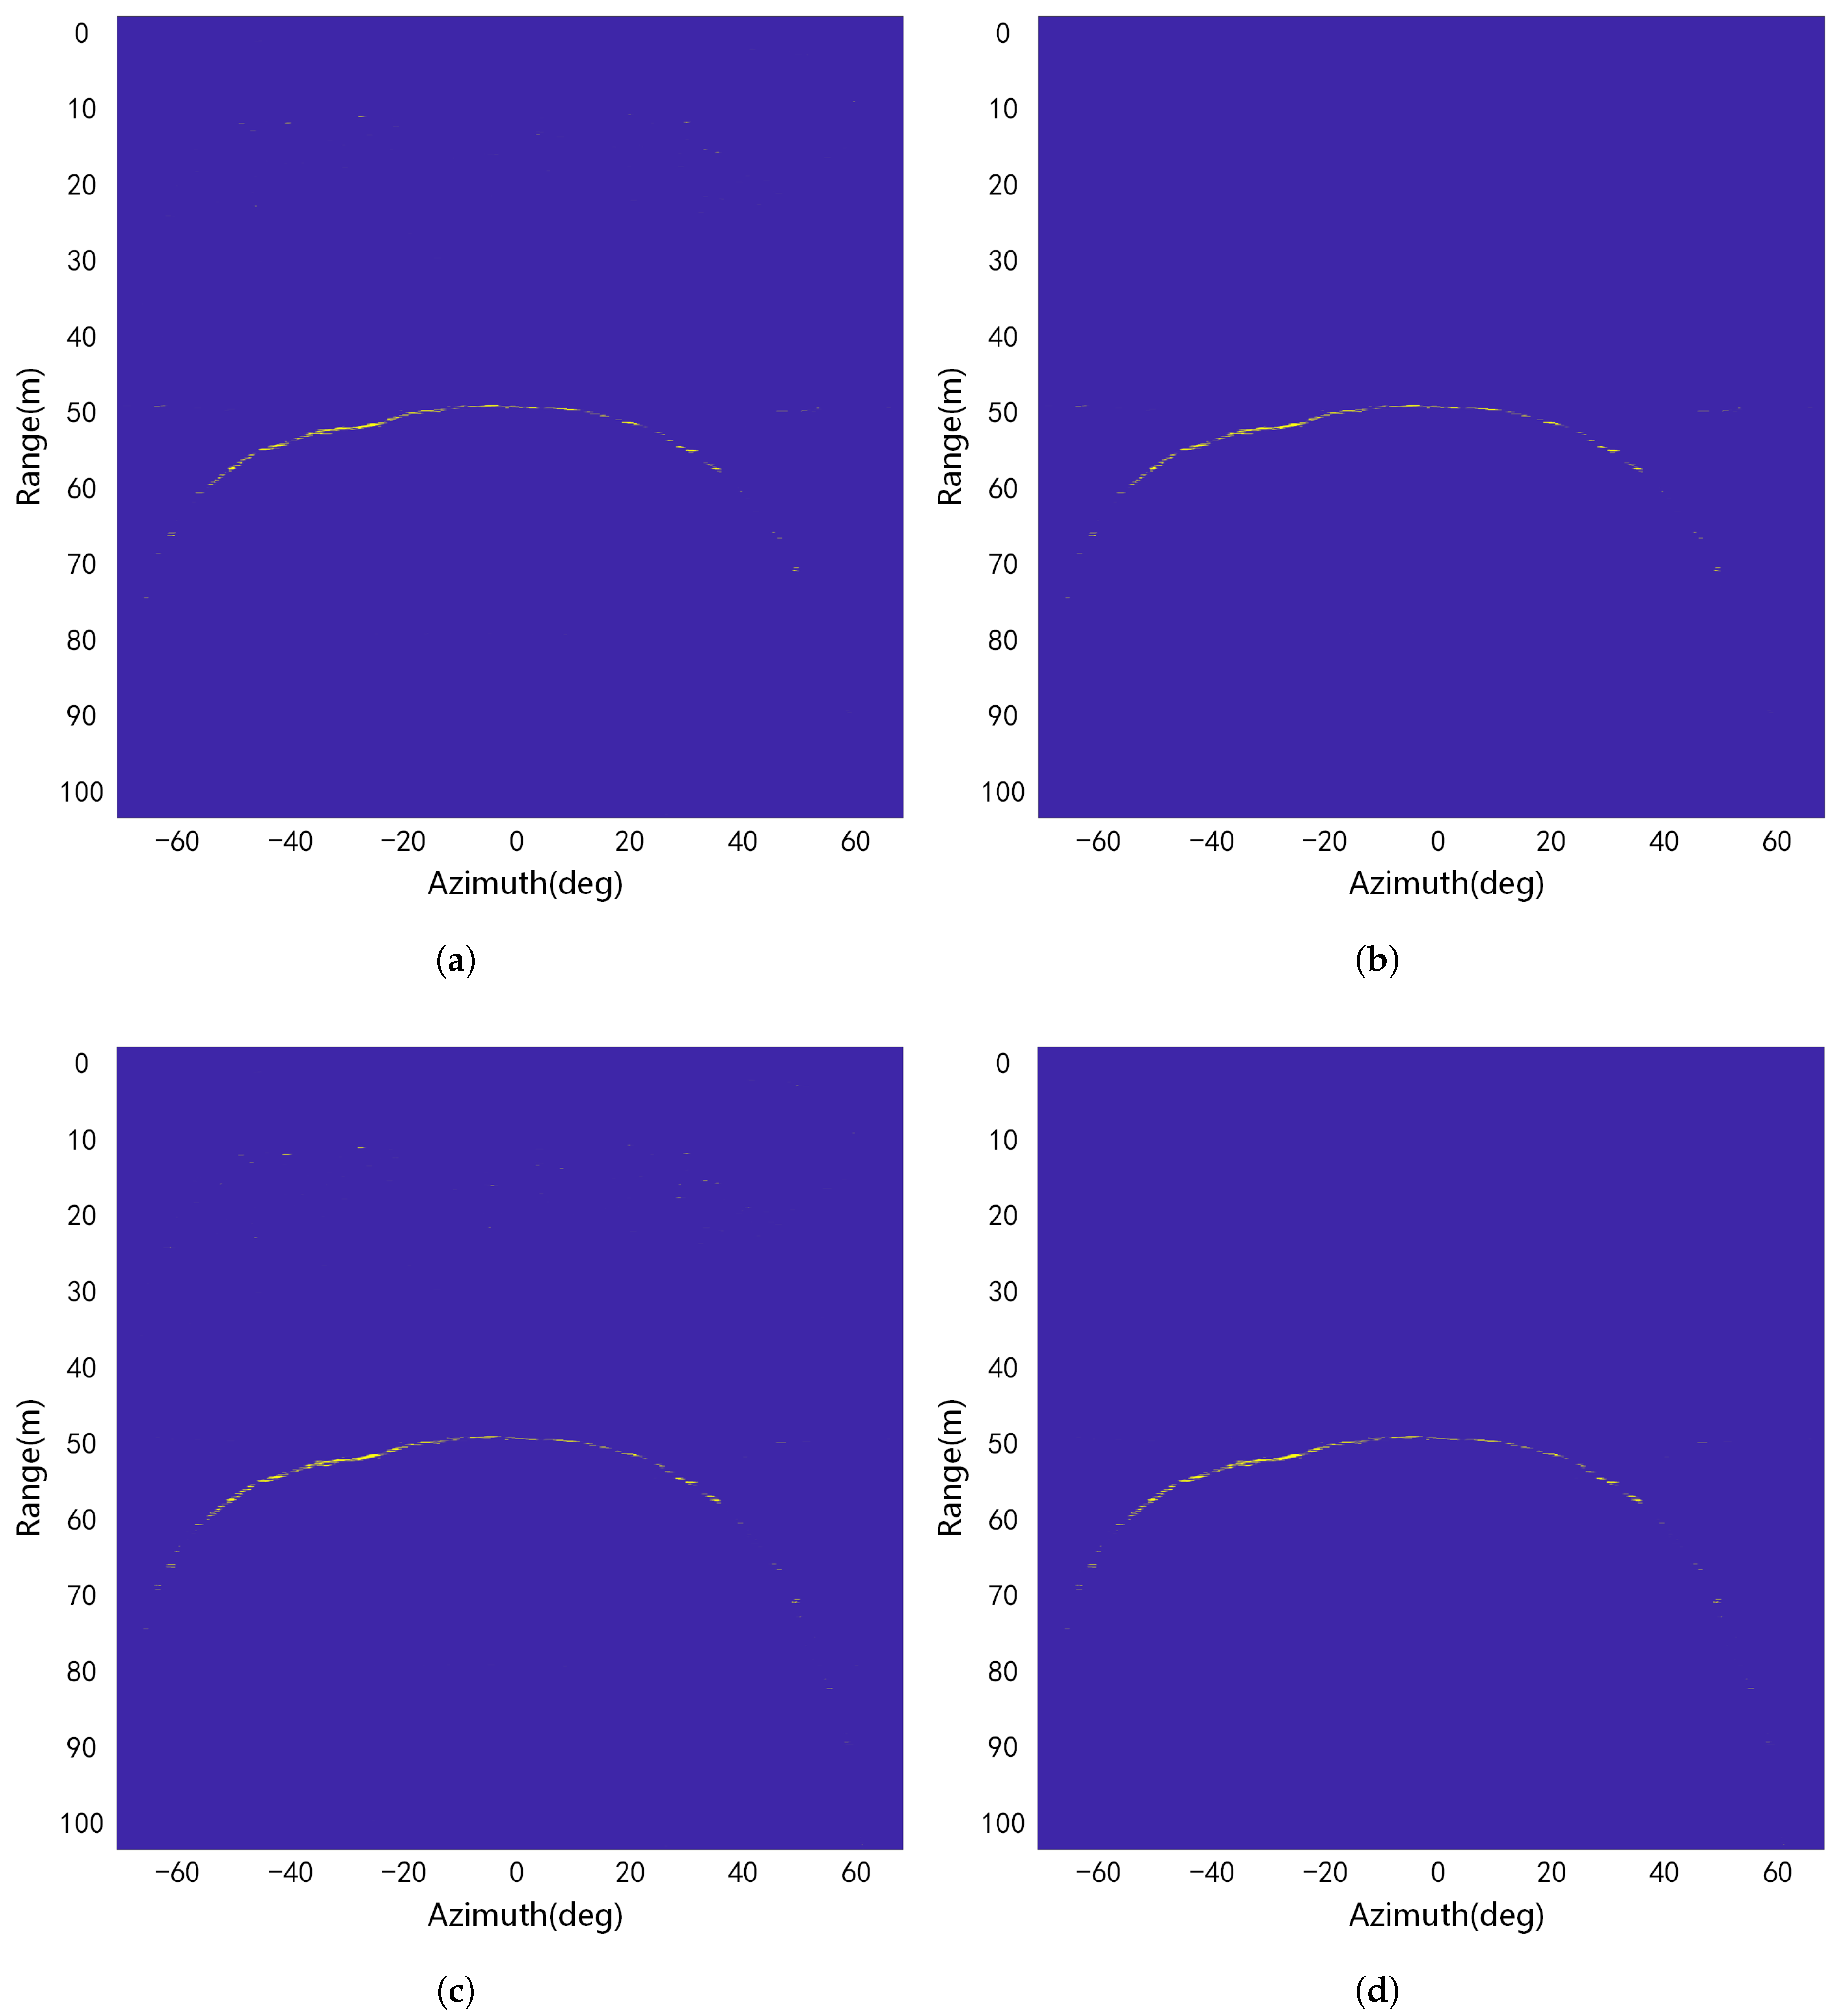
The SCA and SOS-CFAR methods achieved lower FAR compared to the CA and OS-CFAR methods in
Section 3.3.1. This performance enhancement can be attributed to the global segmentation stage, which determined an optimal intensity threshold by maximizing inter-class variance values. Through iterative sonar data processing, interference sources with intensity values less than this optimized segmentation threshold were systematically classified as background noise and eliminated. Experimental results demonstrated that prominent false-alarm-inducing interference could be effectively suppressed during rapid target region isolation. However, the proposed framework exhibited limited effectiveness in mitigating tunnel-effect interference caused by strong direct-path reflections, as evidenced by retained high-amplitude artifacts being incorrectly classified as valid targets during the segmentation phase.
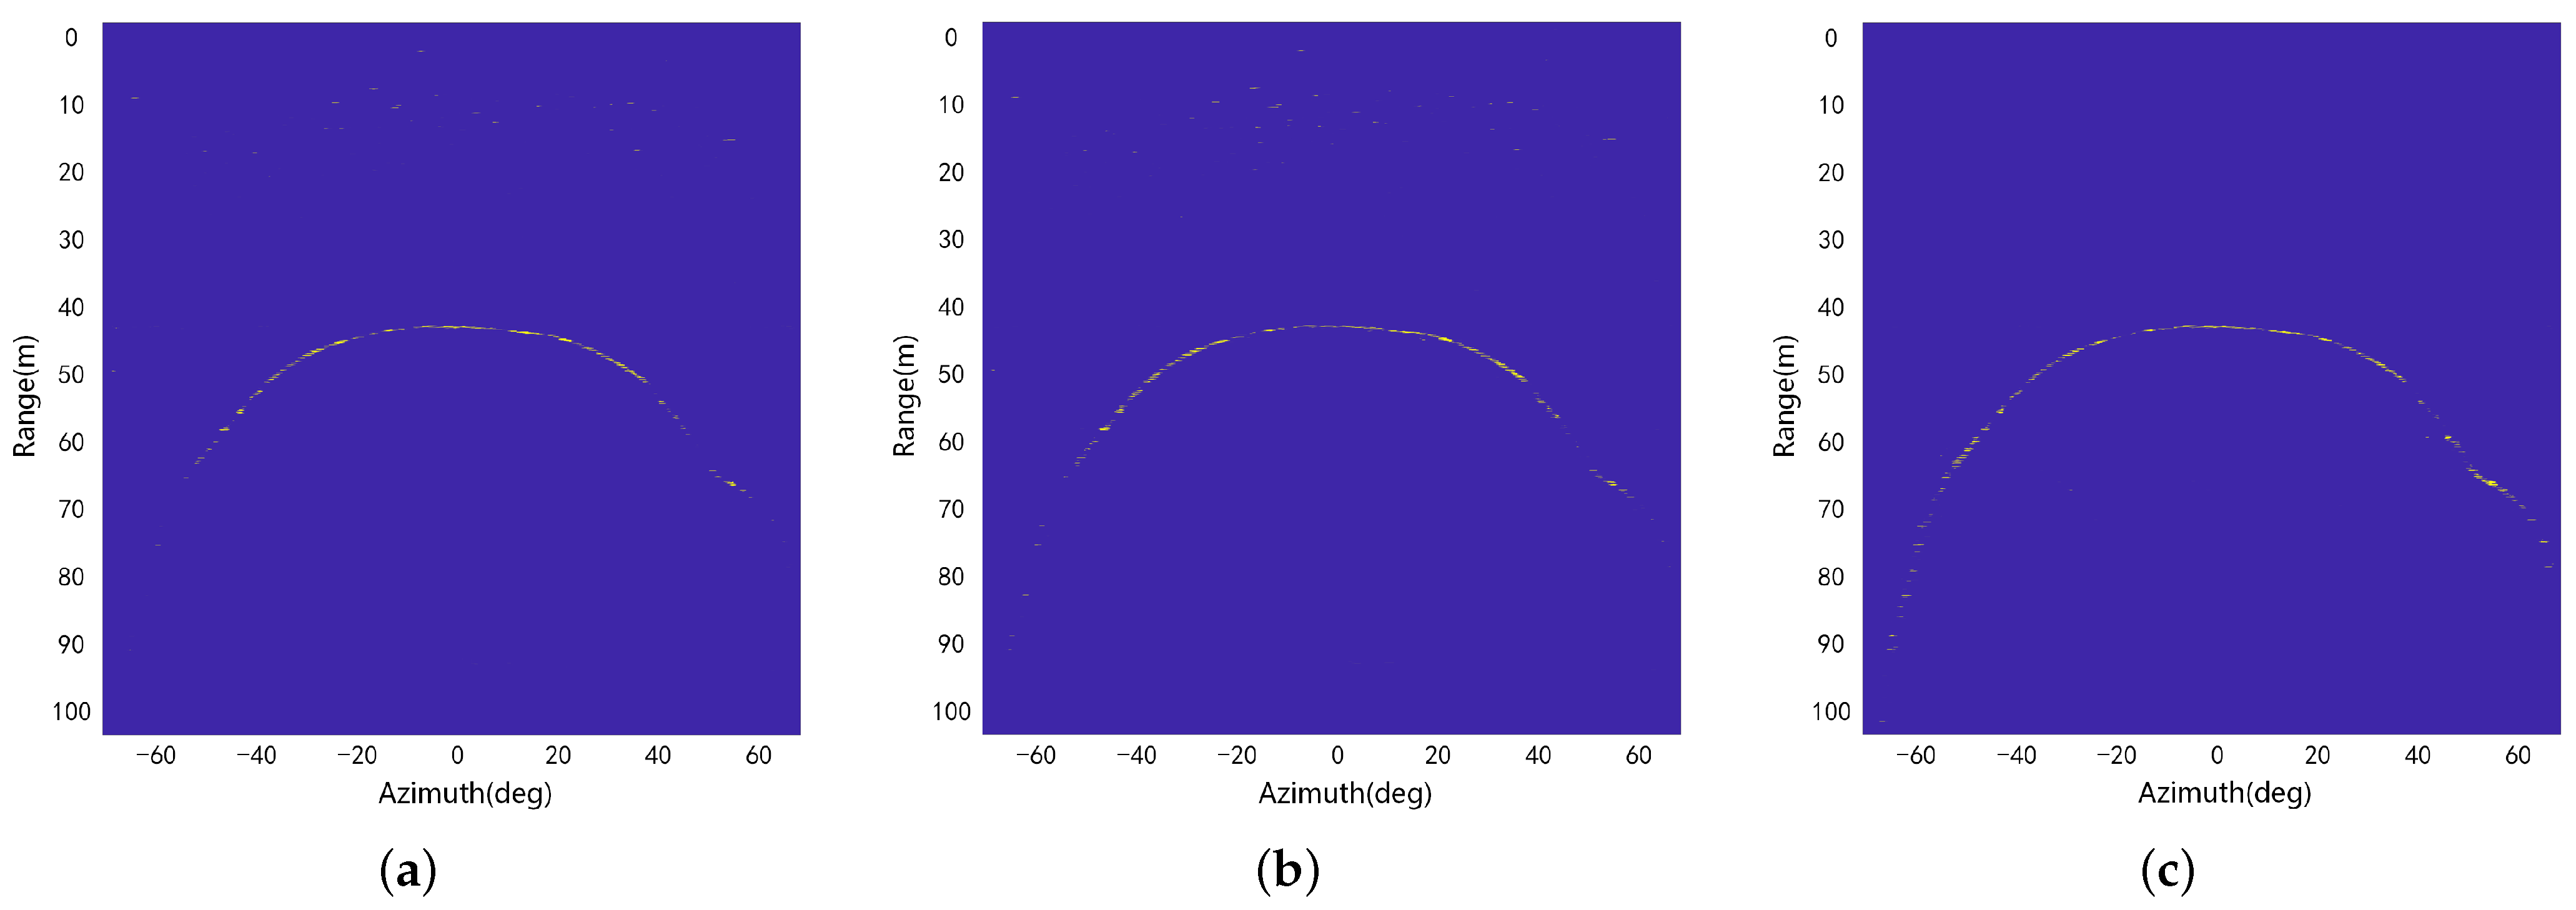
By strategically integrating rectangular and trapezoidal windows, the SOW-CFAR method achieved lower FAR and MDR values compared to the other methods in
Section 3.3.2. In high-SNR near-range regions, even when strong interferences evaded global segmentation, the rectangular window could partially mitigate them by discarding high-order ordered samples during background power estimation, thus suppressing artifacts like tunnel effects. In low-SNR far-range marginal terrain regions, unlike the rectangular window, the trapezoidal window assigned smaller weights to low- and high-order samples instead of fully discarding them, using a weighted sum of all ordered samples to estimate background power. Compared to the rectangular window, the trapezoidal approach engaged more reference cells in background estimation, enhancing equilibrium and robustness. This resulted in a lower detection threshold, thus significantly improving the terrain target recall rate and reducing the MDR value. As shown in
Table 2, the SOW-CFAR method achieved an MDR of 21.148%, outperforming the CA (57.443%) and OS-CFAR (46.038%) methods.
5. Limitations
Although the proposed segmentation–detection framework and SOW-CFAR method perform exceptionally well in sonar image target detection, several limitations remain in real-time practical applications:
First, global segmentation processing may prevent weak target detection. During the global segmentation stage, while the global threshold calculated based on the distinct distribution characteristics of targets and background allows for rapid segmentation of potential target regions, it runs the risk of misclassifying low-intensity targets as background, increasing the likelihood of missed detections. Implementing a hybrid segmentation strategy that integrates global thresholds with locally adaptive thresholds could improve weak target preservation and overall detection performance.
Second, the exponential distribution assumption may not adequately capture the spatiotemporal statistical characteristics of actual sonar backgrounds. Modern multibeam bathymetric sonar systems with high-range resolution and narrow beam patterns significantly reduce the number of scatterers per resolution cell, resulting in reverberation amplitude probability density functions that differ from traditional Rayleigh distributions. Although this study prioritized computational efficiency by using the exponential distribution for tail approximation of sonar signal intensity statistics (which is superior to the Rayleigh distribution), the observed 3.643% false alarm rate of SOW-CFAR in practical detection still exceeds the theoretical parameter 2%, indicating model mismatch in certain reverberation regions. Systematic research in [
20] reveals that the K-distribution and generalized Pareto distribution can more accurately describe sonar data statistics. However, complex distribution models often prevent closed-form expressions for calculating false alarm and detection probabilities in CFAR implementations, increasing computational complexity and limiting practical applicability. Future research will focus on finding the best balance between model accuracy and computational efficiency for CFAR detectors.


 ,
, 

