Article

Integrated Approach to Marine Engine Maintenance Optimization: Weibull Analysis, Markov Chains, and DEA Model

1
Faculty of Transport and Traffic Sciences, University of Zagreb, 10000 Zagreb, Croatia
2
Faculty of Maritime Studies, University of Split, Ruđera Boškovića 37, 21000 Split, Croatia
3
University of Applied Sciences “Nikola Tesla”, Bana Ivana Karlovića 16, 53000 Gospić, Croatia
*
Author to whom correspondence should be addressed.
J. Mar. Sci. Eng. 2025, 13(4), 798; https://doi.org/10.3390/jmse13040798
Submission received: 28 March 2025 / Revised: 12 April 2025 / Accepted: 14 April 2025 / Published: 16 April 2025
(This article belongs to the Section Ocean Engineering)

Abstract

:
This study addresses the growing need for predictive maintenance in the maritime industry by proposing an optimized strategy for ship engine maintenance. The aim is to reduce unplanned failures that cause significant financial losses and disrupt global logistics flows. The methodology integrates Weibull reliability analysis, Markov chains, and Data Envelopment Analysis (DEA). A dataset of 512 diesel engine components from container ships was analysed, where the Weibull distribution (β = 1.8; α = 18,500 h) accurately modelled failure patterns, and Markov chains captured transitions between operational states (normal, degraded, failure). DEA was used to evaluate the efficiency of different maintenance strategies. Results indicate that targeting interventions in the degraded state significantly reduces downtime and improves component reliability, particularly for high-pressure fuel pumps and turbochargers. Optimizing maintenance extended the Mean Time to Failure (MTTF) up to 22,000 h and reduced the proportion of failures in critical components from 64.3% to 40%. These findings support a transition from reactive to proactive maintenance models, contributing to enhanced fleet availability, safety, and cost-effectiveness. The approach provides a quantitative foundation for predictive maintenance planning, with potential application in fleet management systems and smart ship platforms.

1. Introduction

1.1. Background of the Problem

Ensuring the reliability and efficiency of ship engines is a critical challenge in maritime transport. Container ships, as key players in global trade, rely on the uninterrupted operation of their main engines to maintain supply chain continuity. However, unplanned failures of critical engine components cause substantial financial losses, extended downtime, and disruptions in global logistics networks [1]. Recent analyses highlight a direct correlation between fleet reliability and the economic performance of global trade [2].
An analysis of operational data reveals a concerning trend: 64.3% of ship engine components experience failures (S3 state), indicating systemic deficiencies in current maintenance strategies. Traditional preventive maintenance, based on fixed intervals, fails to account for actual operating conditions, leading to increased costs and prolonged downtimes. According to reference [3], the average downtime per failure can reach up to 14 days, posing a significant challenge in maintaining schedules within global supply chains. Such data serve as a benchmark within models based on reliability analysis and enable the simulation of the effectiveness of various maintenance strategies. Furthermore, fuel quality—particularly variations in sulphur content—significantly impacts the wear of components such as high-pressure pumps. While moderate amounts of sulphur contribute to lubrication, excess or deficiency can cause abrasive and chemical wear. In this paper, this parameter is used as part of scenarios within the analytical model, and precise quantification of the relationship requires additional empirical research and monitoring using integrated fuel monitoring systems.
Studies indicate that 72% of pump failures occur before reaching their recommended service interval, underscoring the need for more advanced maintenance planning approaches [4].
These challenges demonstrate the need for the development of predictive maintenance models that enable early detection of component degradation and optimized scheduling of interventions [5]. The integration of Weibull reliability analysis, Markov chains, and DEA models offers a promising approach to improving ship engine maintenance strategies, minimizing operational risks, and enhancing overall fleet efficiency.

1.2. Review of Existing Approaches to Marine Engine Maintenance

The maintenance of ship engines has evolved from traditional reactive approaches to advanced predictive strategies driven by data analytics. Reactive maintenance, which is performed only after a component failure, has long dominated the maritime industry due to its simplicity, but it results in significant financial losses and disruptions in global logistics networks [1]. A shift towards preventive maintenance, based on fixed time intervals, represented an improvement but failed to consider actual operating conditions, often leading to inefficient intervention timing.
Recent studies emphasize the importance of Reliability-Centred Maintenance (RCM), which optimizes resource allocation and reduces unexpected failures [6]. This approach integrates advanced analytical methods to assess reliability and predict failures. The Weibull distribution has been identified as one of the most precise methods for modelling ship engine failures, enabling accurate estimation of component lifespan and improved scheduling of maintenance activities [7].
Recent analyses highlight the use of Markov models for maintenance optimization, particularly in challenging offshore contexts [8]. A review demonstrates that approaches such as Hidden Markov Models (HMMs) and Partially Observable Markov Decision Processes (POMDPs) can effectively capture multiple engine states—normal, degraded, and failed—thus supporting diagnostics, prognostics, and efficient scheduling. Although harsh offshore conditions complicate maintenance, Markov-based methods show promise in enhancing reliability.
Dynamic reliability analysis is becoming increasingly important in modern maintenance frameworks. One study [9] developed a tool for dynamic reliability analysis of ship systems using differential equations to mathematically model system conditions and predict maintenance needs. Another technique applies a semi-Markov decision algorithm to a deteriorating system with buffer capacity—where repair times follow continuous distributions—and operates on a class of control-limit policies, converging to an optimal maintenance strategy [10].
The latest trends involve the implementation of AI and IoT technologies for real-time monitoring of ship systems [11,12]. In recent research, a framework was developed for reliability assessment in container shipping, highlighting the role of continuous data collection and analysis in optimizing maintenance schedules [13]. The integration of real-time condition monitoring with predictive analytics enables a shift from traditional scheduled maintenance to data-driven, condition-based strategies, improving both operational efficiency and cost-effectiveness.

1.3. Research Objectives and Hypotheses

This study has three primary objectives. The first objective is to identify critical failure points using Weibull analysis, which enables modelling the failure intensity of key marine engine components. By estimating the shape parameter (β) and characteristic life (α), the MTTF is determined, identifying the components most susceptible to failure. Special attention is given to high-pressure fuel pumps and turbochargers, as 72% of failures occur before the recommended service intervals.
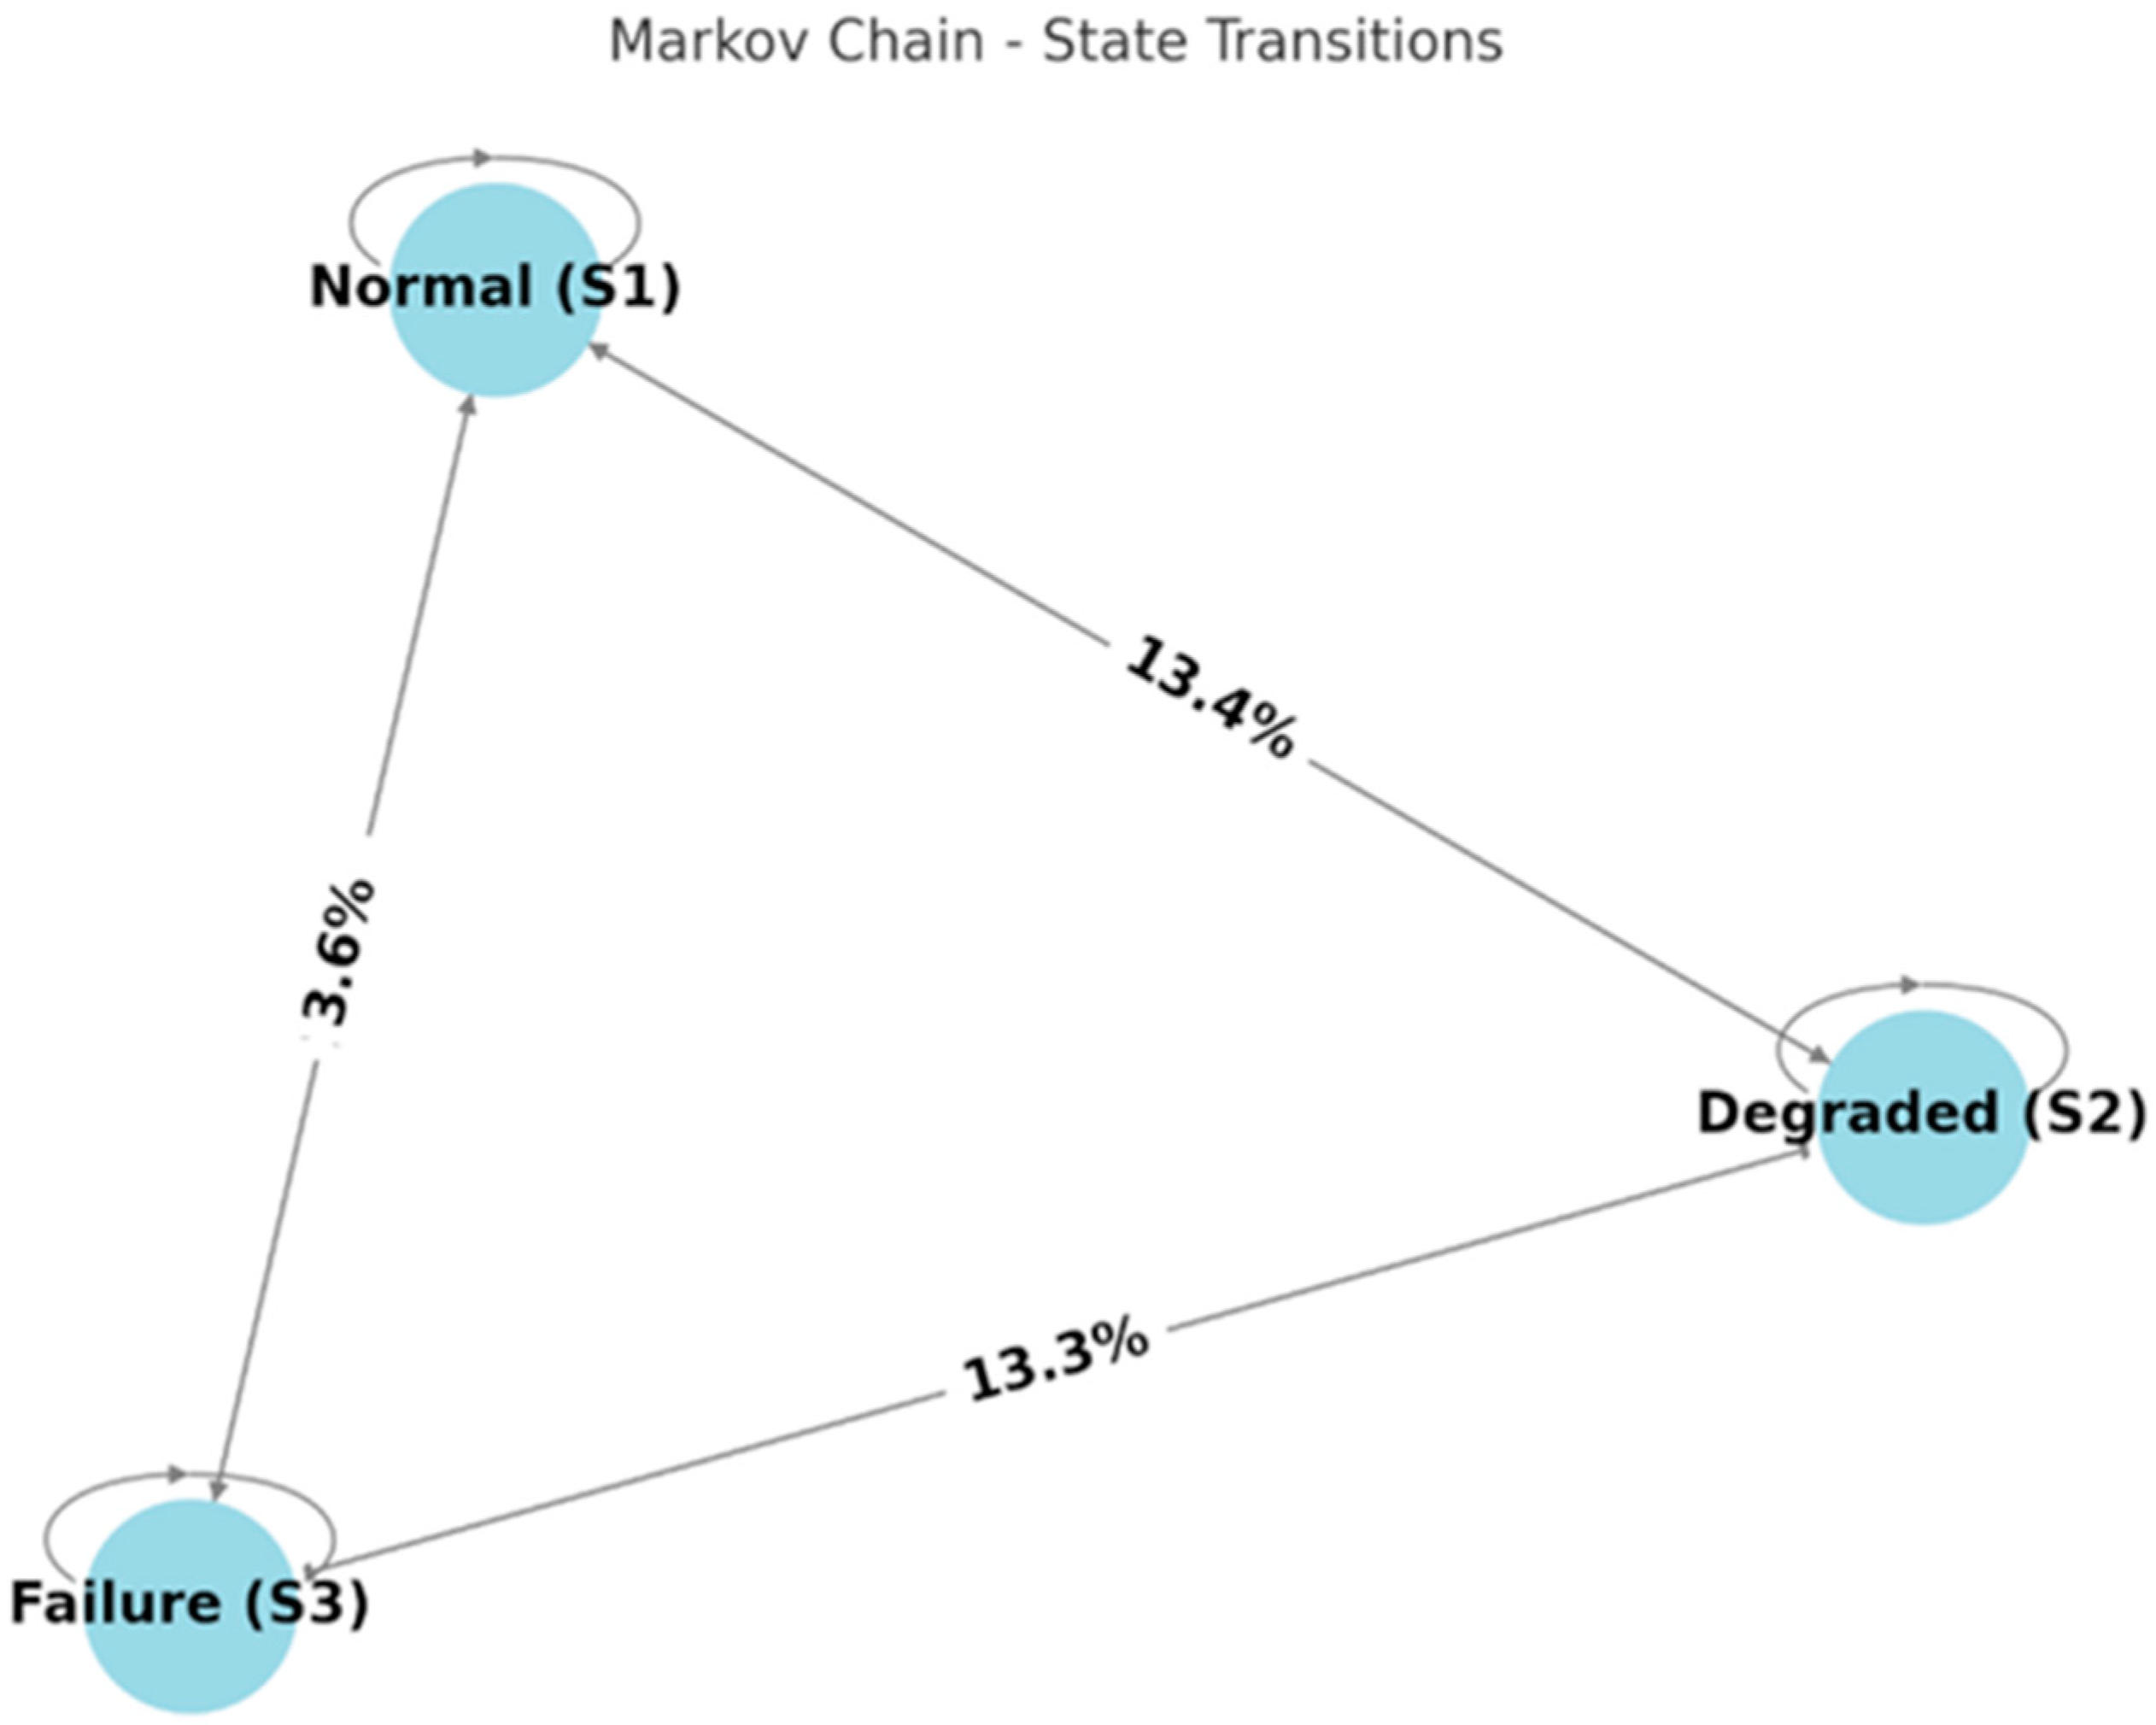
The second objective focuses on optimizing maintenance scheduling through Markov chains for dynamic intervention planning. Analysing transition probabilities between operational states (S1—normal, S2—degraded, S3—failure) allows the development of a strategy that reduces transitions from degraded (S2) to failure (S3), particularly for components with a transition probability exceeding 50%.
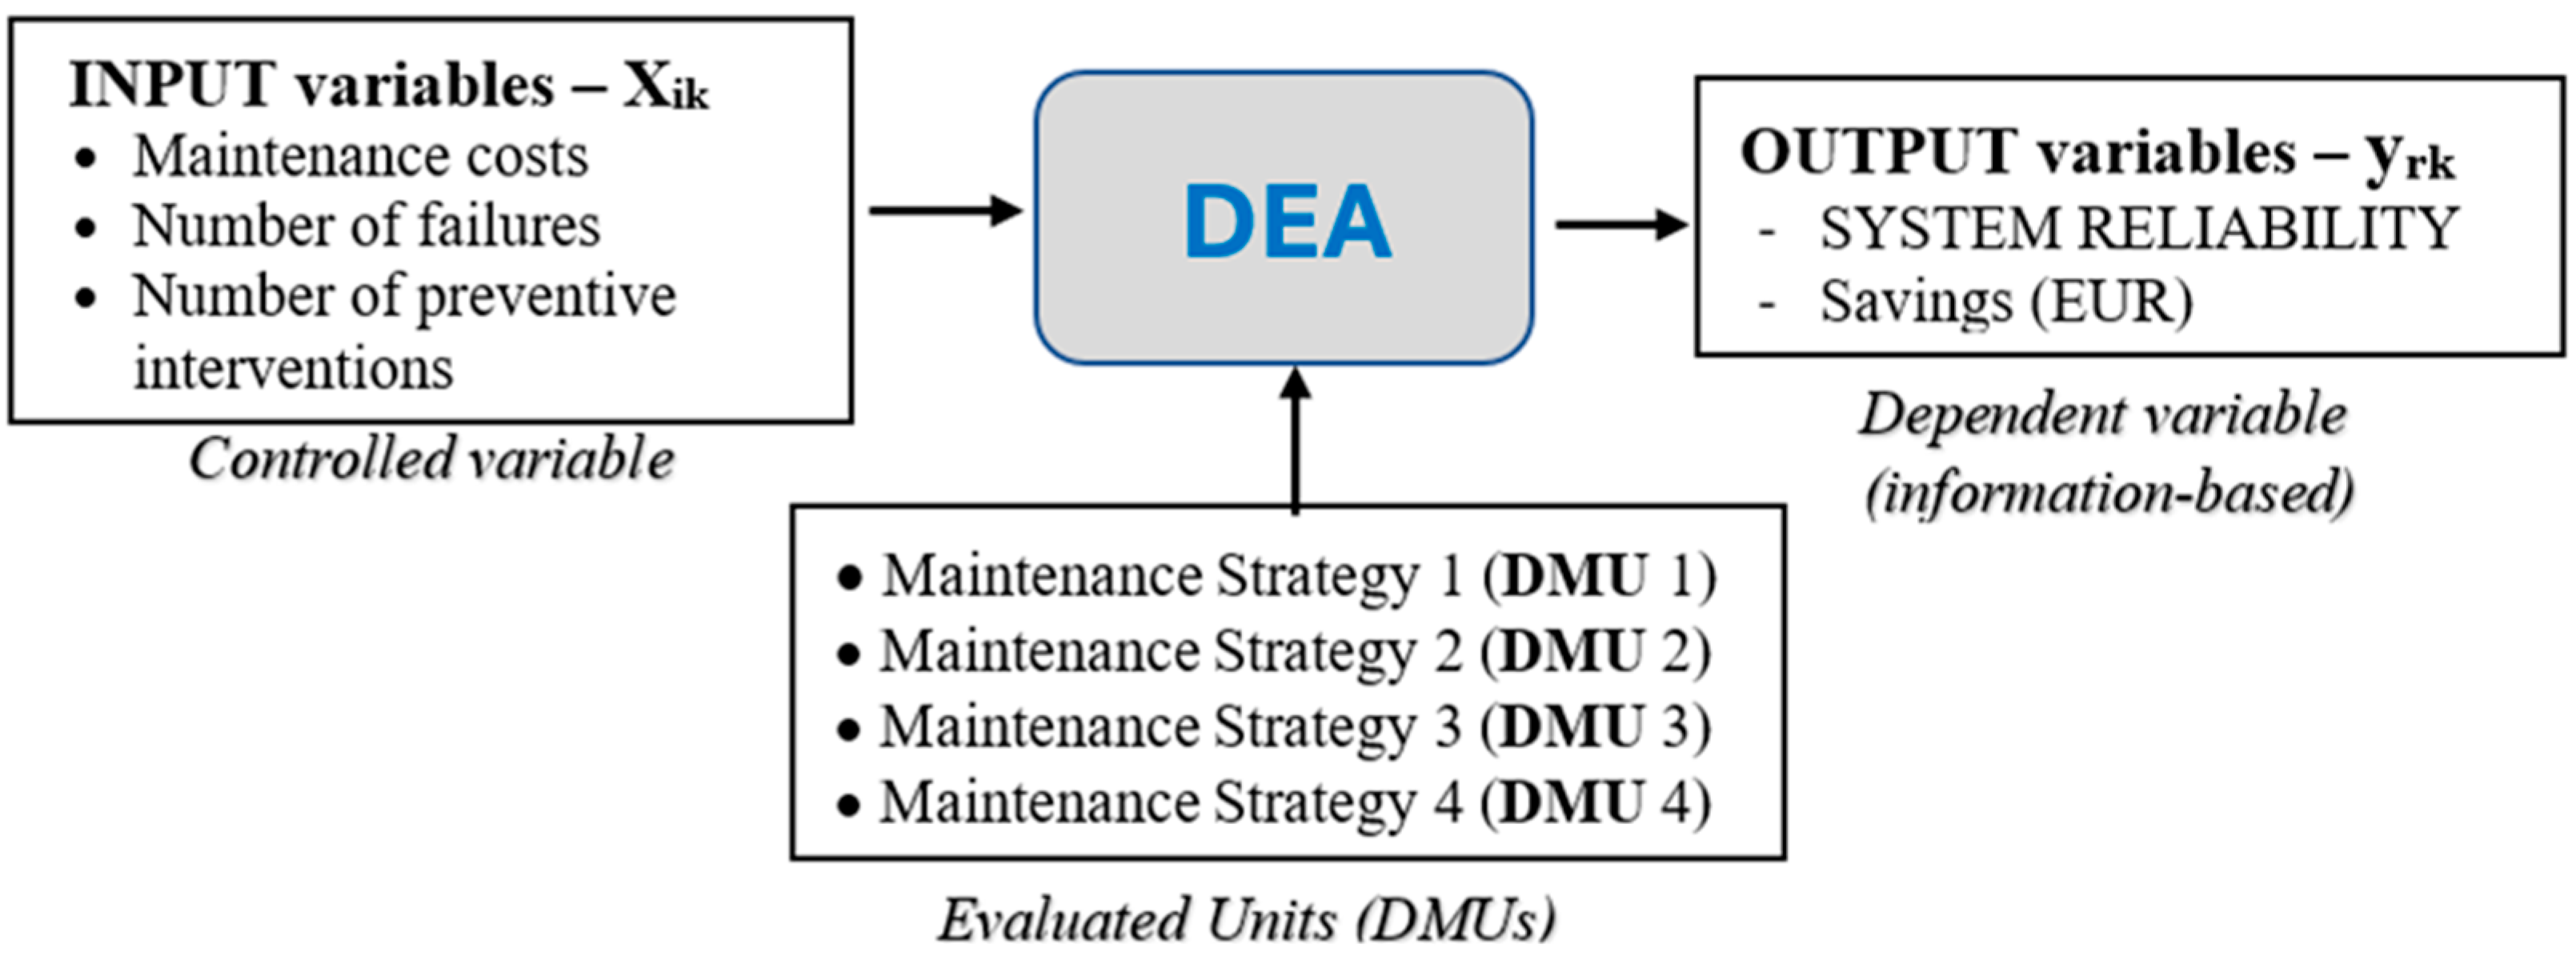
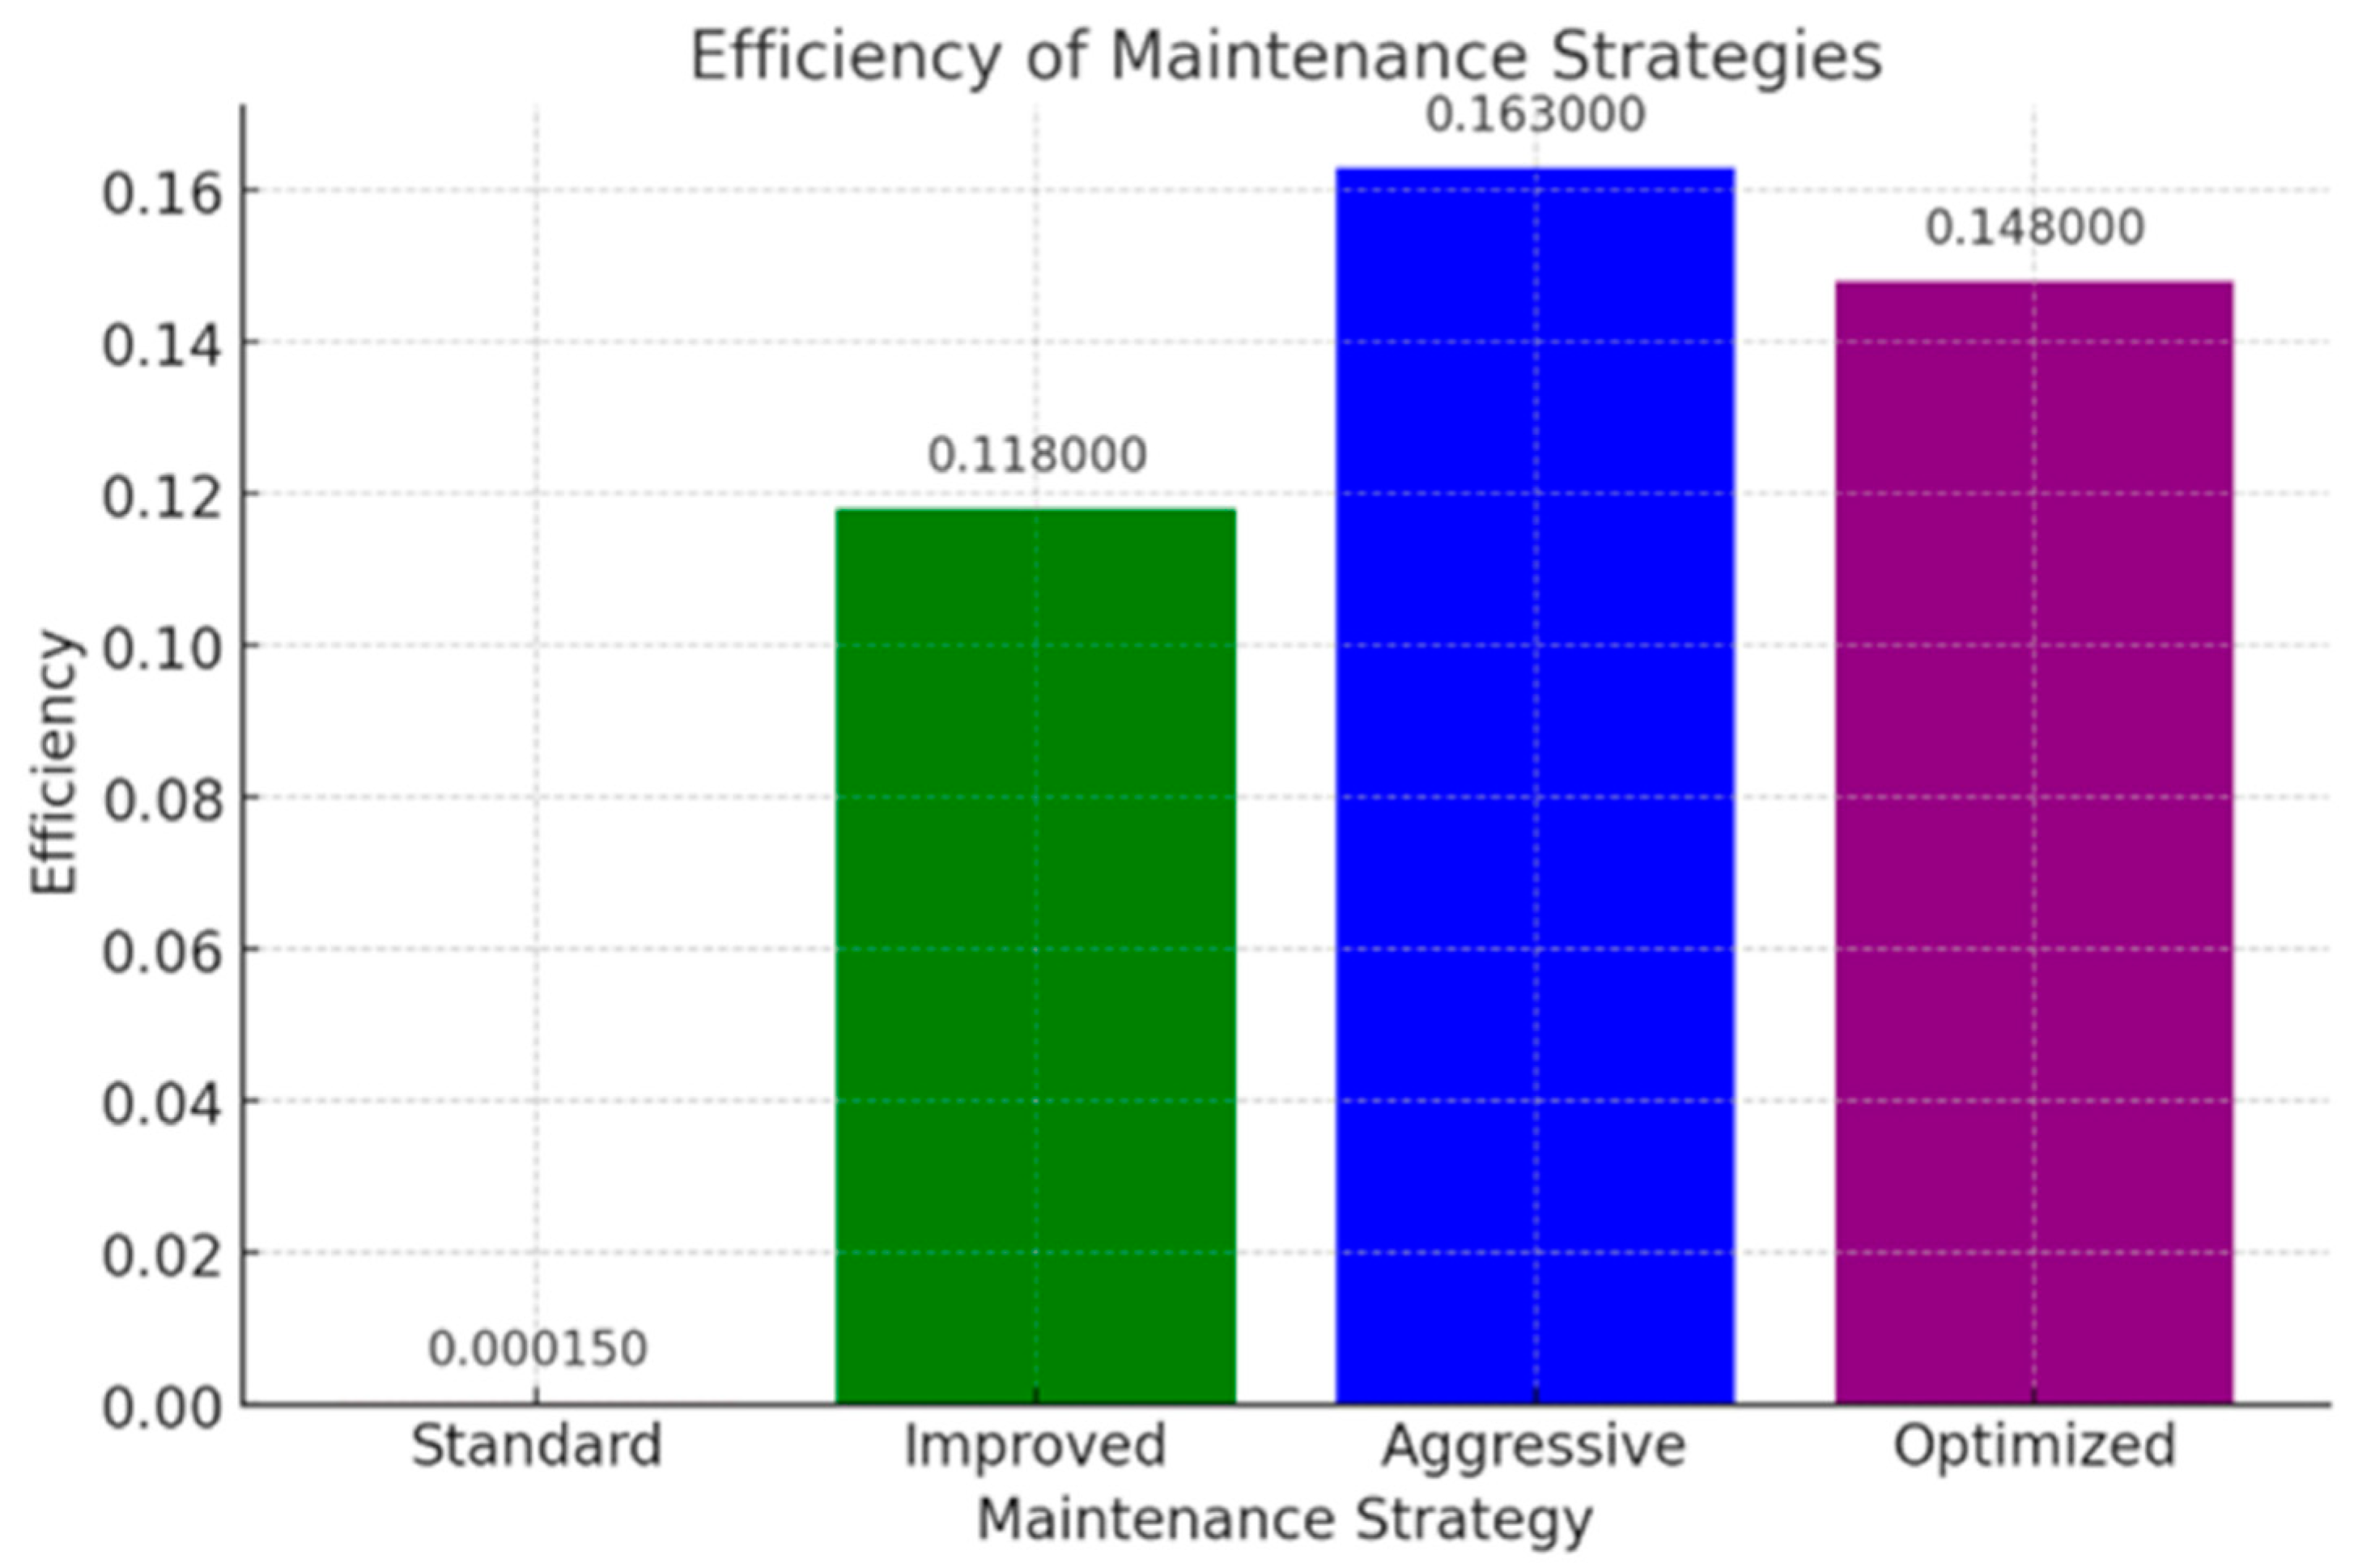
The third objective is the evaluation of maintenance strategies using the DEA model, which provides a quantitative comparison of four strategies: standard, improved preventive, aggressive preventive, and optimized preventive maintenance. The goal is to identify the most cost-effective approach based on the cost–reliability ratio.
Based on these objectives, the main hypothesis is formulated: integrating Markov chains and the DEA model into maintenance strategies enables optimization by reducing unplanned failures, increasing operational efficiency, and rationalizing costs.
This hypothesis is built on three key assumptions. First, Markov chains facilitate early detection of component degradation (S2 state), reducing the risk of transition to failure (S3). Second, the DEA model identifies inefficient strategies and optimizes resource allocation based on the criticality of individual components. Third, Weibull analysis provides precise lifetime estimations, which are essential for planning preventive interventions.
The expected outcomes of the research include a reduction in the proportion of components in the S3 state from 64.3% to 40%, an increase in MTTF for high-pressure pumps from 18,500 to 22,000 h, and the implementation of sensor systems for continuous condition monitoring.
When interpreting the results, certain research limitations must be considered. The analysis was conducted exclusively on VLCS/ULCS container ships during the 2022–2023 period, which may affect the generalization of findings. Future research should encompass a broader sample of different ship types and an extended timeframe to further validate the effectiveness of the proposed model.
Unlike existing approaches that focus solely on diagnostics or risk analysis, the proposed algorithm integrates three complementary methods—Weibull analysis (for modelling wear), Markov chains (for tracking state over time), and DEA (for quantitative efficiency assessment). This enables multidimensional optimisation that not only improves system availability but also supports decision-making based on objective performance indicators.
The novelty of this research lies in the integration of three complementary methodologies—Weibull reliability analysis, Markov chains, and DEA—into a unified framework for maintenance optimisation. Unlike conventional Reliability-Centred Maintenance (RCM), which relies on static failure analysis, or Condition-Based Maintenance (CBM), which responds to sensor signals without strategic evaluation, the proposed model introduces dynamic monitoring of degradation states and quantitative assessment of strategy effectiveness.
Recent literature highlights the importance of Risk-Based Maintenance (RBM) approaches; however, such models often do not include stochastic state modelling or objective ranking of strategies [5].
This research enables dynamic adjustment of maintenance intervals (e.g., α = 18,500 h; β = 1.8), a reduction in transitions from the degradation state (S2) to failure (S3) from 52.4% to 30%, and an economic efficiency assessment of strategies using the CCR DEA model (efficiency of the optimised strategy = 0.148). The framework is specifically adapted to large container ship fleets, where variable operating conditions require adaptable maintenance plans.
By combining reliability theory with operational analytics, this study provides a structured foundation for the implementation of predictive maintenance in smart ship systems and within the context of Industry 4.0.

2. Literature Review and Theoretical Framework

The optimization of marine engine maintenance requires a multidisciplinary approach that integrates various analytical and modelling techniques. While traditional maintenance strategies are still widely applied, they increasingly prove insufficient in the dynamic conditions of the modern maritime industry. In response to these challenges, advanced data-driven methods have been developed, focusing on reliability assessment and maintenance scheduling optimization. This literature review presents the key methodological approaches that form the foundation of the proposed integrated maintenance optimization model.

2.1. Maintenance Strategies in the Maritime Industry

The evolution of maintenance strategies in the maritime sector has undergone significant development—from reactive maintenance to preventive and, ultimately, predictive maintenance. Reactive maintenance, which is performed only after a failure occurs, has long dominated the maritime industry due to its simple implementation and lower initial costs. However, this approach results in high operational losses due to unplanned downtime and disruptions in global logistics networks [1].
A more advanced approach is Reliability-Centred Maintenance (RCM), which enables resource optimization and minimizes the risk of unexpected failures [6]. The application of this strategy in the maritime industry has shown positive economic effects, with recent analyses indicating a direct correlation between fleet reliability and global trade efficiency [2].
Beyond traditional methods, failure impact analysis of critical components on operational processes is increasingly being used. One study emphasizes that high-pressure fuel pump failures can significantly prolong port stays, increasing operational costs [14]. These findings support the transition from fixed service intervals to adaptive maintenance approaches, which account for actual operating conditions.
Modern trends include the use of digital twins, which allow real-time simulation of operational conditions and failure prediction [13]. These tools improve operational reliability and reduce the costs associated with unplanned interventions.
Several studies have developed scientifically validated maintenance models for marine propulsion systems, employing advanced statistical methods [15,16]. Their research confirms the necessity of dynamic maintenance approaches, which allow optimal resource allocation and a better balance between cost and operational reliability.

2.2. Weibull Analysis of Component Reliability

The Weibull distribution is one of the most effective mathematical models for describing the reliability of technical systems throughout their life cycle. Its application in marine engine failure analysis enables precise prediction of component lifespan and optimization of maintenance strategies. The two-parameter Weibull distribution, defined by the shape parameter (β) and characteristic life (α), has proven to be the most accurate approximation of operational reliability in complex technical systems, including marine engines [7].
The primary advantage of Weibull analysis lies in its ability to model different phases of a component’s life cycle using the shape parameter β. When β < 1, the distribution describes the infant mortality failure phase, often caused by manufacturing defects or improper break-in procedures. When β = 1, failures occur randomly at a constant rate, typical for systems without significant wear. When β > 1, the failure intensity increases over time due to wear-out mechanisms, which is common for high-pressure fuel pumps and turbochargers. One study applied this approach to diesel locomotives, demonstrating the universality of Weibull analysis in transport system reliability assessments [17].
Mathematically, the failure rate function λ(t) is defined as follows:
λ t = f ( t R ( t = β α · t α β 1
The unreliability function is expressed as follows:
F t = 1 e t / α β
These models allow for the calculation of MTTF, given by the following equation:
M T T F = α ·   Γ 1 + 1 β
where Γ represents the gamma function.
The practical application of Weibull analysis in the maritime industry includes predicting the lifespan of critical components and optimizing preventive interventions. For example, an analysis of high-pressure fuel pumps indicates that their characteristic life is 18,500 h, with β = 1.8, suggesting that failures are predominantly caused by wear-out mechanisms. These insights enable more precise maintenance planning, reducing the risk of unexpected failures and enhancing the operational efficiency of marine systems.

2.3. Application of Markov Chains in Predictive Maintenance

In the optimization of marine engine maintenance, Markov chains enable precise modelling of degradation and failures by analysing transition probabilities between different operational states. Their key advantage lies in their ability to predict system behaviour without requiring complete failure history, making them particularly useful for stochastic degradation processes. In this context, Markov models quantify transitions between three fundamental component states: normal (S1), degraded (S2), and failure (S3), facilitating the optimization of maintenance scheduling.
In [9], a dynamic reliability analysis tool for marine systems is developed, integrating Markov models with system dynamics. Their approach employs differential equations to mathematically model system conditions and predict future maintenance requirements. A major advantage of Markov chains is their ability to calculate the stationary distribution, which represents the long-term distribution of component states after multiple cycles.
The application of this methodology in the maritime industry allows for optimized resource planning, reduced frequency of emergency repairs, and extended service life of critical components such as high-pressure fuel pumps and turbochargers. This not only enhances the operational reliability of marine systems but also significantly reduces unplanned maintenance costs, improving the economic sustainability of the fleet.

2.4. DEA Methodology for Efficiency Evaluation

Data Envelopment Analysis (DEA) is a non-parametric productivity analysis method that enables the quantitative assessment of the relative efficiency of comparable Decision-Making Units (DMUs). In the context of marine system maintenance optimization, DEA facilitates an objective comparison of maintenance strategies by analysing the relationship between input resources (maintenance costs, number of failures, number of preventive interventions) and output results (system reliability, MTBF extension, overall savings). A model with a classification of variables is presented in Figure 1.
The application of the DEA methodology in the evaluation of maintenance strategies allows for the identification of the most efficient approaches and the quantification of potential improvements for strategies that demonstrate low efficiency. One study successfully applied the DEA method to assess the efficiency of traffic solutions, confirming the broad applicability of this method in technical and logistics systems [18].
One of the most commonly used models within the DEA methodology is the CCR model (Charnes, Cooper, and Rhodes model), which is based on constant returns to scale. This model calculates the efficiency of each DMU as the ratio of weighted outputs to weighted inputs, with the weights optimized to maximize the efficiency of individual units relative to others [19].
A mathematical representation of the CCR model is as follows:
m a x Θ = r = 1 s u r · y r k r = 1 m v i · x i k   subject   to   constraints   r = 1 s u r · y r k r = 1 m v i · x i k 1 ,   j
where:
  • maxθ—efficiency measure of the unit (DMU);
  • xik—input variables for DMU k (k—strategy designation);
  • yrk—output variables for DMU k (k—strategy designation);
  • vi—weights of input variables;
  • ur—weights of output variables;
  • s—number of output variables;
  • m—number of input variables.
The advantage of this model lies in its ability to objectively evaluate the efficiency of various maintenance strategies without the need to predefine the relative importance of variables. A proposed framework underlines the DEA method’s significance in optimizing maintenance resource allocation within complex logistics systems [13]. This methodology enables the dynamic adjustment of maintenance strategies according to operational requirements, improving efficiency and reducing overall costs.
The application of the DEA methodology in marine engine maintenance allows for the precise determination of the most effective strategies and optimization of resource allocation. By integrating the CCR model into maintenance analysis, it becomes possible to quantify the impact of individual strategies, identify inefficient approaches, and enhance the operational reliability of the fleet.
When combined with Markov models and Weibull analysis, DEA proves to be a powerful tool for the long-term optimization of maintenance strategies in the maritime industry, providing a solid foundation for data-driven decision-making. These findings confirm that an integrated efficiency analysis approach can significantly improve the operational performance of marine systems and reduce total maintenance costs through more precise preventive intervention planning.

2.5. Comparative Analysis of Existing Approaches and Identified Limitations

Traditional maintenance models in the maritime industry have evolved from reactive methods towards more structured strategies such as Reliability-Centred Maintenance (RCM), Condition-Based Maintenance (CBM), and Risk-Based Maintenance (RBM) [20]. Although each of these approaches represents a step forward, they all exhibit significant limitations in the context of dynamic systems such as the engines of large container vessels.
RCM effectively identifies critical failure points and modes but does not incorporate stochastic modelling of component degradation over time. CBM relies on sensor-based condition monitoring (e.g., vibration, temperature) but lacks a comprehensive decision-making framework that optimises maintenance across multiple criteria. RBM prioritises components with a high risk of failure but typically does not include lifetime models (e.g., Weibull) or state-transition models (e.g., Markov chains), which are essential for accurate predictive planning.
The integrated model proposed in this study overcomes these limitations by combining the following:
  • Weibull analysis to identify wear mechanisms (β > 1 for 72% of components);
  • Markov chains to model state transitions (e.g., reducing transitions from S2 → S3 from 52.4% to 30%);
  • DEA methodology to quantify the economic efficiency of strategies (the optimised strategy achieves 90.8% of the efficiency of an aggressive approach with 26.6% fewer failures) [4].
This approach enables dynamic adjustment of service intervals based on actual operating conditions, improves component reliability, and provides a structured decision-support tool for high-risk environments such as VLCS/ULCS vessels.

3. Methodology and Research Results

The research is structured around an integrated approach that combines statistical reliability analysis, component degradation modelling, and quantitative evaluation of maintenance strategies. This approach enables the identification of critical points in the maintenance cycle and the development of customized strategies for different operational scenarios to enhance the reliability of marine systems.

3.1. Collection and Processing of Operational Data

The operational data used in this analysis were collected from multiple sources: crew maintenance logs, manufacturer service reports, performance monitoring systems, and failure and repair reports. The Planned Maintenance System (PMS), into which shipping companies input actual service data, is based on the manufacturer’s technical guidelines and is regularly updated through collaboration between onboard crew and shore-based service departments. Due to commercial confidentiality, some operational data have been anonymised in the Supplementary Materials, which are provided for transparency and reproducibility. Due to commercial confidentiality, the identities of the vessels and the company are not disclosed. All data refer to main engines of VLCS/ULCS class vessels (e.g., WinGD/Wärtsilä X92) during the 2022–2023 period, with a focus on components such as high-pressure fuel pumps and turbochargers.
The analysis is based on operational data collected from a fleet of VLCSs (Very Large Container Ships) and ULCSs (Ultra Large Container Ships). The study includes 512 components of diesel engines manufactured by Hyundai-MAN B&W, MAN B&W, and WinGD/Wärtsilä. The data were obtained through collaboration with a company specialised in the servicing of ship engines and included information on failures, service intervals, recorded downtime, and operating conditions. Based on documented cases of failures over one year, a Weibull analysis was performed to determine the characteristic life (α) and the shape of the distribution (β).
The main engines of the observed vessels range in age from 5 to 15 years, with older engines exhibiting a higher failure rate due to prolonged operational exposure. The data were collected over a one-year period (2022–2023), with key sources including the following:
  • Technical logs from ship crews;
  • Manufacturer service reports;
  • Performance monitoring systems;
  • Failure and repair reports.
For each component, key operational parameters were recorded, including operating hours since the last maintenance, recommended service intervals, current runtime, and component status (S1, S2, S3). These data facilitate the analysis of component degradation and the definition of optimal maintenance strategies.
The MTTF was calculated using the Weibull distribution, based on actual failure records obtained from service logs, which included the number of operating hours until failure. From this data, Weibull parameters (α = 18,500, β = 1.8) were calculated, and the MTTF was derived using the Formula (3). To ensure consistency in the subsequent analysis with Weibull’s method and Markov chains, the data were structured into a standardised format (Table 1).
To ensure data accuracy, verification and data cleaning procedures were conducted, including comparison with historical records, exclusion of incomplete data (23% of components), and normalization of values. The classification of components into states S1 (normal), S2 (degraded), and S3 (failure) was carried out based on manufacturer guidelines regarding service intervals, standard practices from the PMS system, and the experience of shipboard personnel and maintenance engineers. The thresholds defining these states (e.g., 80% of the service interval for S2) were also empirically validated using operational data obtained from technical documentation and records. The three operational states are defined as follows:
  • S1 (normal state): the component shows no signs of degradation (present RHrs. < 80% of the service interval).
  • S2 (degraded state): visible signs of wear are present (80% ≤ present RHrs. ≤ 100% of the service interval).
  • S3 (failure state): the component has exceeded the service interval or has failed (present RHrs. > 100%).
The distribution analysis of component states (Table 2) revealed the dominance of the S3 state, indicating deficiencies in existing maintenance strategies.

3.2. Identification of Trends and Key Factors

Preliminary data analysis revealed several critical trends in maintenance, as follows:
  • High-pressure fuel pumps exhibit the highest failure frequency.
  • Poor fuel quality (sulphur content > 0.5%) has been identified as the leading cause of high-pressure fuel pump failures [4].
These results clearly indicate that current maintenance strategies are not optimal and highlight the need for implementing predictive models and optimizing intervention schedules.

3.3. Weibull Analysis of Failures in Key Components

The Weibull distribution is one of the most essential methods for statistical reliability analysis in maintenance engineering, enabling precise failure modelling and maintenance strategy optimization. In this study, it was applied to analyse key marine engine components, with a particular focus on high-pressure fuel pumps, turbochargers, and pistons.
The two-parameter Weibull distribution is defined as follows:
  • Shape parameter (β) determines the degradation pattern of a component. A value of β > 1 indicates failures due to wear-out mechanisms, while β < 1 suggests that random failures dominate.
  • Characteristic life (α) represents the time at which 63.2% of the component population is expected to fail.
The technical logs used in this research refer to manually completed maintenance records and service logs, rather than automatically generated data from the ship’s monitoring systems. They were collected through collaboration with a maritime service company and include hours worked until failure, type of damage, duration of downtime, and information about interventions. The database encompassed a total of 512 records for various components of ship diesel engines, of which 42 were used for modelling failure rates using the Weibull distribution method. Although the analysis of maintenance reports is not new, in this paper, it was used as an input into an integrated predictive maintenance model that combines reliability analysis methods and relative efficiency, with the aim of optimising maintenance strategies. The collected data included the following:
  • Time to failure (TTF);
  • Time between failures (TBFs);
  • Operating conditions (temperature, vibrations, pressure);
  • Failure causes (poor fuel quality, wear, excessive load).
The estimation of Weibull distribution parameters was performed using the Maximum Likelihood Estimation (MLE) method, with result verification via graphical analysis on Weibull probability paper.

3.3.1. Analysis Results

The estimation of the Weibull parameters was performed using the Maximum Likelihood Estimation (MLE) method, applying the weibull_min.fit() function from the Python library scipy.stats (https://github.com/araith/pyDEA, accessed on 13 April 2025). This function allows for straightforward estimation of the shape (β) and scale (α) parameters based on the available data. The Kolmogorov–Smirnov test (scipy.stats.kstest) was also used to verify the goodness-of-fit of the data to the Weibull distribution.
It is important to note that the operational data were obtained from the Planned Maintenance System (PMS) of a VLCS/ULCS fleet, in collaboration with a certified service company. Due to confidentiality, the company name and vessel identification numbers are not disclosed. The dataset includes records for 42 high-pressure fuel pumps (β = 1.8) and 18 turbochargers (β = 2.1).
The most critical components are high-pressure fuel pumps, with parameters β = 1.8 and α = 18,500 h. The β > 1 value confirms that the dominant failure mechanism is gradual wear, indicating the need for maintenance interval adjustments. For instance, the results show that 72% of high-pressure fuel pumps fail before the recommended interval of 18,000 h, clearly highlighting the need for redefining maintenance intervals [4].
The analysis revealed significant differences in the reliability of various components, as shown in Table 3.
The most common causes of failures include poor fuel quality, excessive vibrations, and inadequate operating conditions of components.

3.3.2. Optimization of Preventive Maintenance Intervals

Based on the Weibull analysis, optimal maintenance intervals have been defined to reduce the risk of failures, as shown in Table 4.
These values represent a compromise between maximizing component utilization and minimizing the risk of unplanned downtime. By implementing optimized maintenance intervals, the predicted reduction in high-pressure fuel pump failures is 35%, while the MTTF increases to 22,000 h.
Additionally, the results enable the estimation of the remaining reliability of components for different maintenance intervals, providing a foundation for the implementation of Reliability-Centred Maintenance (RCM). The integration of Weibull analysis with the RCM approach allows for dynamic adjustments to maintenance strategies based on actual operating conditions, further enhancing the operational efficiency of marine systems.

3.4. Modelling and Analysis of Transition States Using Markov Chains

Markov chains serve as an analytical tool for modelling the degradation dynamics of marine engine components. This approach enables the quantification of transitions between key operational states—normal (S1), degraded (S2), and failure (S3)—based on operational data. Modelling these state transitions provides a foundation for predictive maintenance and optimized intervention scheduling, significantly reducing the frequency of unplanned failures and improving the reliability of marine systems.
State definitions are as follows:
  • S1 (normal state)
    o
    The component operates within 80% of the service interval.
    o
    Parameters (vibrations, temperature, pressure) are within normal limits.
  • S2 (degraded state)
    o
    The component is at 80–100% of the service interval.
    o
    Visible signs of wear are present (e.g., vibrations > 5 mm/s).
  • S3 (failure state)
    o
    The service interval has been exceeded, or a complete failure has been recorded.
    o
    The component requires immediate intervention.

3.4.1. Transition Probability Matrix

The transition probability matrix (Table 5) was developed through an analysis of operational data from technical logs of 512 marine engine components collected during the 2022–2023 period. Transition probabilities were calculated as the ratio of the number of observed transitions to the total number of components in the initial state, enabling the quantification of degradation dynamics.
The transition probability matrix represents the dynamics of state changes in marine engine components, where rows indicate the current state and columns represent the future state. Each value in the matrix denotes the probability of transitioning from one state to another, enabling the analysis of degradation patterns and failure prediction.
For example, the probability of transitioning from the degraded state (S2) to the failure state (S3) is 52.4%, indicating a high risk of unplanned failures and the need for preventive interventions.
A visual representation of state transitions is provided in Figure 2, illustrating the relationships between the normal (S1), degraded (S2), and failure (S3) states, offering a better understanding of change dynamics and optimization of maintenance strategies.
The visualization of state transitions clearly highlights the need for more effective preventive maintenance strategies, particularly in S2, where the risk of transitioning to failure (S3) is exceptionally high. The low probability of returning from S3 to S1 suggests that repairs are often insufficient for complete component restoration, further emphasizing the importance of timely interventions.
These findings confirm that maintenance optimization should focus on reducing transitions from S2 to S3 through targeted preventive measures, thereby improving the reliability of marine engines and reducing operational costs.

3.4.2. Long-Term State Analysis (Stationary Distribution)

The long-term (stationary) distribution of states was calculated by solving the system of linear Equation (5), as follows:
π × P = π (subject to: ∑πi = 1)
where π represents the stationary probability vector, describing the long-term probabilities of marine engine component states after multiple maintenance cycles.
To calculate the stationary distribution of the Markov chain, the NumPy and SciPy libraries in Python were used. The process included the following steps:
Definition of the Transition Matrix P:
python
import numpy as np
P = np.array([[0.78, 0.10, 0.12],
[0.134, 0.341, 0.524],
[0.036, 0.133, 0.829]])
Finding the Eigenvector corresponding to Eigenvalue 1 using SciPy’s null_space function:
python
from scipy.linalg import null_space
A = P.T − np.eye(3)
pi = null_space(A).flatten()
pi = pi/pi. sum () # Normalization
Results of the Stationary Analysis
  • π1 (S1) = 16.0%—in the long term, only 16% of components remain in optimal condition.
  • π2 (S2) = 63.7%—the dominance of the degraded state indicates the gradual wear of most components.
  • π3 (S3) = 20.3%—a significant proportion of components remain in failure, requiring urgent replacements.
The analysis results clearly highlight the need for timely interventions in the S2 state to reduce transitions to failure (S3) and improve the long-term reliability of the system. Focusing resources on preventive measures during the degradation phase can significantly decrease the proportion of critical failures and enhance the operational efficiency of marine engines.
By implementing optimized maintenance strategies, including targeted interventions and improved diagnostics, the S2 → S3 transition rate can be reduced from 52.4% to approximately 30%, leading to lower operational costs and increased fleet availability. Furthermore, the analysis confirms that, in the long run, more than 20% of components remain in a failure state, while the majority of the fleet (63.7%) remains in a degraded condition.
Optimization of maintenance results in reduced costs and increased reliability of key components. In the performance analysis, the following indicators were used: reduction in the proportion of components in a failure state (S3), extension of MTTF, and an increase in the relative efficiency of strategies according to the DEA model. In the baseline scenario, 64.3% of components were in a failure state, while in the optimized scenario, this proportion was reduced to 40%, representing a reduction of 37.8%. The MTTF of high-pressure pumps was extended from 18,500 to 22,000 h (an increase of 18.9%). The efficiency of the optimized strategy was also confirmed by the analysis of relative efficiency, where this strategy achieved the highest score compared to all other tested options.
These findings strongly indicate the need for dynamic adjustments to service intervals and the implementation of sensor systems for continuous condition monitoring, which would significantly enhance the efficiency of marine engine maintenance.

3.5. DEA Model for Maintenance Strategy Comparison

Optimizing maintenance strategies is crucial for reducing operational costs, increasing reliability, and maximizing resource efficiency. In this study, the efficiency of marine engine maintenance strategies was analysed using the Data Envelopment Analysis (DEA) methodology, which provides a quantitative comparison of strategies based on the ratio of input resources (maintenance costs, number of interventions) to output results (failure reduction, MTBF, savings).
Four maintenance approaches were identified: standard reactive maintenance, improved preventive maintenance, aggressive preventive maintenance, and an optimized strategy. The implemented CCR model with constant returns to scale allowed for the quantification of each strategy’s efficiency, with weights optimized to maximize the efficiency of each DMU.
The data used in the analysis were obtained from technical logs, financial reports, and Weibull analysis, and were normalized by adjusting costs for inflation and removing outliers. The model was implemented using the Python PyDEA library, enabling the automated efficiency assessment of each maintenance strategy.
Implementation of predictive maintenance enables the transition from a reactive to a proactive approach, thereby increasing the safety and economic sustainability of maritime operations. Although this research utilised summary service records, further development of the model anticipates the inclusion of condition monitoring data for each device, which would ensure even more precise failure prediction and real-time maintenance optimisation. Such an upgrade would provide a greater level of adaptation of the model to specific operating conditions and contribute to the full realisation of the study’s objectives.

3.5.1. DEA Analysis Results and Interpretation

The maintenance strategy is based on a combination of three analytical approaches—Weibull analysis, Markov chains, and DEA method—and can be operationally implemented through the following steps:
  • Collecting available data on failures and maintenance.
  • Analysing component reliability and determining key failure parameters.
  • Classifying the current state of components (S1–S3) using Markov transition probabilities.
  • Identifying components at high risk of transitioning to failure (S2 → S3).
  • Selecting a maintenance strategy with the best cost–availability ratio (DEA).
  • Conducting maintenance before failure occurs (proactive).
  • Continuously updating the model with new operational data.
Maintenance costs include direct costs of labour, spare parts, and vessel downtime. The data were collected from the operational financial reports of shipping companies and normalized on an annual basis for all analysed strategies.
The DEA analysis allows for an objective comparison of maintenance strategies based on costs, number of interventions, and output performance indicators. The results are presented in Table 6.
Although the aggressive strategy shows the highest efficiency (0.163), the optimised strategy, with a score of 0.148, achieves 90.8% of that efficiency with fewer interventions and lower operational pressure. This result stems from better selection of maintenance timing—interventions are directed toward components in a degraded state (S2), effectively reducing transitions to failure (S3). Such precise resource allocation makes the optimised strategy highly competitive and sustainable for real-world application.
The results reveal clear differences between maintenance strategies. Aggressive maintenance achieves the highest efficiency (0.163) but requires significant resources and operational support. The optimized strategy reaches 90.8% of the efficiency of the aggressive approach, but with lower operational demands and better-balanced costs. Standard maintenance exhibits extremely low efficiency, confirming the unsustainability of the reactive approach.
Figure 3 presents a visual analysis of the DEA model efficiency, highlighting key trends among maintenance strategies. Standard maintenance (red) shows the lowest efficiency at 0.00015, as it does not include preventive measures, leading to high costs and frequent failures. Improved preventive maintenance (green) achieves moderate efficiency of 0.118, with a cost reduction of 10.6% compared to the reactive approach. Aggressive preventive maintenance (blue) achieves the highest efficiency at 0.163, but requires the highest number of interventions—34.1 per year. The optimized strategy (purple) provides the best balance between cost and reliability, with an efficiency of 0.148, an MTBF of 0.139, and 26.6% fewer failures compared to other approaches.

3.5.2. Evaluation of Maintenance Strategies

Preventive interventions in this study include targeted actions such as replacing high-pressure fuel pumps based on operating hours and performance degradation, servicing turbochargers before the onset of air delivery oscillations, and timely replacement of consumable components such as seals and filters. These interventions are conducted while the component is still in a degraded state (S2), thus avoiding the transition to failure (S3) and ensuring greater operational reliability.
The adaptive maintenance strategy in this study is based on dynamically determining intervention priorities using transition probabilities from the Markov model. Preventive intervention is carried out only when the probability of a component transitioning from a degraded state (S2) to a failure state (S3) exceeds the 50% threshold. In this way, maintenance is adapted to actual operating conditions and the state of components, reducing unnecessary costs and increasing overall system efficiency.
The results show that timely intervention during the degradation phase (S2), based on the analysis of the probability of transitioning to failure (S3), leads to a reduction in the number of failures. The proposed model is not based on fixed service intervals, but employs a condition-based approach, in which maintenance decisions are made adaptively, depending on component behaviour and estimated reliability. This avoids excessive or premature maintenance, which is a common drawback of traditional approaches based on manufacturer recommendations that are often conservative. The model allows for both the extension and shortening of intervals, depending on actual operating conditions.
Four marine engine maintenance strategies were analysed, assessing their efficiency, economic impact, and applicability. The analysis considered input parameters (maintenance costs, number of preventive interventions) and output results (failure reduction, MTBF, total savings), enabling an objective comparison of their effectiveness. The DEA model quantified the efficiency of each strategy, providing a foundation for data-driven decision-making on optimal maintenance resource allocation.
  • Standard Reactive Maintenance
This strategy does not include preventive measures and follows the principle of “fix it when it breaks”, leading to high operational costs and frequent downtime.
  • Cost: the highest among all strategies (EUR 146,666 annually), primarily due to unplanned failures and emergency repairs.
  • Preventive interventions: 0 (no planned preventive interventions).
  • Effects: shortest MTBF (0.102), resulting in frequent operational disruptions.
  • DEA analysis: efficiency of 0.00015—the lowest among all strategies.
This strategy is not sustainable, as it causes high operational losses and increases the proportion of components in failure (S3), making it the least efficient option for managing marine engine maintenance.
2.
Improved Preventive Maintenance
This approach involves planned interventions at fixed time intervals, reducing unplanned failures while keeping costs under control.
  • Cost: EUR 131,159 annually (10.6% reduction compared to standard maintenance).
  • Preventive interventions: 33.2 annually, focusing on critical components.
  • Effects: improved MTBF (0.131), with a 21.9% failure reduction.
  • DEA analysis: efficiency of 0.118—a moderate improvement over reactive maintenance.
This strategy is suitable for fleets with limited budgets looking to enhance reliability without significant initial investments. However, it does not achieve maximum efficiency in preventing failures.
3.
Aggressive Preventive Maintenance
This approach maximizes preventive interventions to minimize failure probability.
  • Cost: EUR 126,083 annually (the lowest among all strategies).
  • Preventive interventions: 34.1 annually (the highest among all strategies).
  • Effects: highest MTBF (0.149), with a 31.5% failure reduction.
  • DEA analysis: efficiency of 0.163—the highest among all analysed strategies.
This strategy is particularly suitable for critical marine systems where downtime is unacceptable (e.g., vessels carrying high-value cargo). However, it requires significant operational resources and a highly structured maintenance management system.
4.
Optimized Maintenance Strategy
This strategy uses adaptive preventive interventions based on component condition, achieving the best balance between cost and performance.
  • Cost: EUR 127,813 annually (only 1.3% more than the aggressive strategy).
  • Preventive interventions: 33.6 annually, focused on components in an S2 (degraded) state.
  • Effects: very good MTBF (0.139), with a 26.6% failure reduction.
  • DEA analysis: efficiency of 0.148, which is close to the efficiency of the aggressive strategy but with better resource control.
This strategy is recommended as the optimal choice, as it achieves 90.8% of the efficiency of aggressive maintenance while ensuring rational resource utilization. Focusing on critical components increases system reliability with minimal additional costs.

4. Discussion

The obtained results confirm the findings of [5,6], where the advantages of proactive and predictive models in reducing failure frequency were emphasized. In [4], in a similar context, it was demonstrated that timely intervention with respect to high-pressure pumps can reduce the probability of failure by more than 30%, which is consistent with our findings.
The integration of Weibull analysis, Markov chains, and the DEA model has proven to be an effective framework for optimizing marine engine maintenance. The key findings highlight that the optimized strategy reduces failures by 26.6%, while aggressive maintenance achieves the highest efficiency (0.163) but requires intensive resources. For example, 72% of high-pressure fuel pump failures occur before the recommended 18,000-h interval, requiring a revision of operational conditions, particularly stricter fuel quality control (sulphur content > 0.5%) and vibration monitoring (>5 mm/s).
These findings confirm the superiority of adaptive strategies over traditional reactive approaches. Reducing service intervals for high-pressure fuel pumps (15,000 h) and turbochargers (30,000 h) has led to a reduction in the proportion of components in a failure state (S3) from 64.3% to 40%, demonstrating the importance of dynamic adjustments based on real operational conditions. The integration of IoT technologies, such as vibration sensors, has shown potential for reducing unplanned downtime by enhancing predictive maintenance strategies, which allow for early anomaly detection and proactive maintenance scheduling [21,22]. However, the lack of standardized data exchange protocols between ships and ports remains a major barrier to broader implementation.
A critical challenge is the absence of interoperable real-time data analysis systems. While the optimized strategy provides the best balance between cost and reliability, its implementation requires collaboration among operators, regulators, and manufacturers to develop unified maintenance standards. This study emphasizes that the transition to predictive maintenance is not merely a technical challenge but an organizational shift for the entire industry.
Our model builds upon the principles of RCM by adding a dynamic decision-making layer, which enables a reduction in transitions from a degraded state (S2) to a failure state (S3) to just 30%, thereby extending system lifespan under real operating conditions.
The limitations include the assumption of stationary Markov transitions and the lack of in-depth quantification of uncertainty in Weibull parameters—areas that are well suited for future development, for example, through approaches such as the Rashomon analysis [23].

5. Conclusions and Recommendations

This study demonstrates that the combination of reliability analysis, state transition modelling, and efficiency evaluation provides a practical framework for optimising marine engine maintenance strategies. The integrated model enables more accurate planning and timely interventions, particularly for components in the early stages of degradation. Such an approach contributes to increased fleet availability and reduced overall maintenance costs.
In a broader context, the model supports global maritime goals by enabling more efficient and sustainable operation of ship systems. The results are relevant for maritime operators, engine manufacturers, and technology partners aiming to enhance predictive capabilities and system interoperability. Future research should focus on expanding the model through real-time sensor data, automated decision-making, and standardised protocols for maintenance coordination.
The research results confirm the effectiveness of an integrated approach in optimizing marine engine maintenance strategies, combining statistical failure analysis, transition state modelling, and strategy evaluation using the DEA method. The optimized maintenance strategy offers the best balance between cost and reliability, while aggressive maintenance is recommended only for critical systems.
The DEA analysis confirms that the optimized strategy provides the best trade-off between cost and reliability, whereas aggressive maintenance can be beneficial for critical systems but requires significant resources and complex organization. Improved preventive maintenance represents a good compromise for operators with budget constraints, while the standard approach is the least sustainable due to high operational losses and frequent failures.
Implementing targeted interventions with respect to components in the S2 state can reduce the transition to failure (S3) from 52.4% to 30%, resulting in significant cost savings and increased operational reliability. The application of IoT sensors for continuous monitoring of vibrations and temperature could reduce downtime by 30%, further improving maintenance efficiency.

5.1. Recommendations for the Industry

  • Dynamic adjustment of service intervals—high-pressure pumps (15,000 h), turbochargers (30,000 h).
  • Integration of IoT systems—implement sensors for vibrations (>5 mm/s) and fuel quality (sulphur > 0.5%).
  • Prioritizing S2 state interventions—addressing degraded components prevents 64% of failures, reducing maintenance costs.
  • Avoiding standard maintenance—reactive approaches lead to high costs and frequent failures.

5.2. Future Research Directions

Maintenance management in maritime operations should be based on quantitative analyses such as DEA, considering system-specific requirements and operational priorities. Future research should focus on advanced predictive analysis models, integration of sensor data, and IoT technologies to further improve marine engine maintenance strategies and enhance overall efficiency.
It is critical to develop standardized protocols for data exchange between ships, ports, and manufacturers to enable the implementation of predictive maintenance.
The long-term implementation of these models can increase the reliability of marine systems, reduce operational costs, and enhance the safety of maritime operations. The transformation of the sector towards smart maintenance, in collaboration with industry operators, regulators, and technology partners, is essential to ensure the sustainability and economic efficiency of maritime transport.

Supplementary Materials

The following supporting information can be downloaded at: https://www.mdpi.com/article/10.3390/jmse13040798/s1, Container Ship #1_F5 Engine_Maintenance_Schedule, Anonymized Data_for Calculation_Metadata, Eq faliure

Author Contributions

Conceptualization, D.B. and V.R.; methodology, M.K., D.M. and D.B.; software, M.K.; validation, D.B., V.R. and M.K.; formal analysis, D.M.; investigation, D.B.; resources, V.R. and D.M.; data curation, D.M. and D.B.; writing—original draft preparation, V.R., M.K., D.M. and D.B.; writing—review and editing, M.K. and D.M.; visualization, V.R. and D.B.; supervision, D.M. and D.B. All authors have read and agreed to the published version of the manuscript.

Funding

This research received no external funding.

Data Availability Statement

The original contributions presented in this study are included in the article and Supplementary Materials. Further inquiries can be directed to the corresponding authors.

Conflicts of Interest

The authors declare no conflicts of interest.

Abbreviations

The following abbreviations are used in this manuscript:
CCRCharnes, Cooper, and Rhodes model
DEAData Envelopment Analysis
DMUDecision-Making Unit
HMMsHidden Markov Models
MLEMaximum Likelihood Estimation
MTTFMean Time to Failure
POMDPsPartially Observable Markov Decision Processes
TBFsTime between failures
TTFTime to failure
ULCSsUltra Large Container Ships
VLCSsVery Large Container Ships

References

  1. Karatuğ, Ç.; Ceylan, B.O.; Arslanoğlu, Y. A Hybrid Predictive Maintenance Approach for Ship Machinery Systems: A Case of Main Engine Bearings. J. Mar. Eng. Technol. 2025, 24, 12–21. [Google Scholar] [CrossRef]
  2. Unctad Review of Maritime Transport 2022. Available online: https://unctad.org/system/files/official-document/rmt2022_en.pdf (accessed on 13 April 2025).
  3. Stopford, M. (Ed.) Maritime Economics, 3rd ed.; Routledge: Abingdon-on-Thames, UK, 2012; ISBN 9780415275583. [Google Scholar]
  4. Knežević, V.; Stazić, L.; Orović, J.; Pavin, Z. Optimisation of Reliability and Maintenance Plan of the High-Pressure Fuel Pump System on Marine Engine. Polish Marit. Res. 2022, 29, 97–104. [Google Scholar] [CrossRef]
  5. Teixeira, Â.P.; Kalafatelis, A.S.; Nomikos, N.; Giannopoulos, A.; Alexandridis, G.; Karditsa, A.; Trakadas, P. Towards Predictive Maintenance in the Maritime Industry: A Component-Based Overview. J. Mar. Sci. Eng. 2025, 13, 425. [Google Scholar] [CrossRef]
  6. Pilatis, A.N.; Pagonis, D.N.; Serris, M.; Peppa, S.; Kaltsas, G. A Statistical Analysis of Ship Accidents (1990–2020) Focusing on Collision, Grounding, Hull Failure, and Resulting Hull Damage. J. Mar. Sci. Eng. 2024, 12, 122. [Google Scholar] [CrossRef]
  7. Zaman, M.B.; Siswantoro, N.; Priyanta, D.; Pitana, T.; Prastowo, H.; Semin; Busse, W. The Combination of Reliability and Predictive Tools to Determine Ship Engine Performance Based on Condition Monitoring. IOP Conf. Ser. Earth Environ. Sci. 2021, 698, 012015. [Google Scholar] [CrossRef]
  8. Dawid, R.; McMillan, D.; Revie, M. Review of Markov Models for Maintenance Optimization in the Context of Offshore Wind. In Proceedings of the Annual Conference of the PHM Society; Prognostics and Health Management Society, Portland, OR, USA, 18 October 2015; Volume 7, pp. 269–279. [Google Scholar]
  9. Dikis, K.; Lazakis, I.; Theotokatos, G. Dynamic Reliability Analysis Tool for Ship Machinery Maintenance. In Towards Green Marine Technology and Transport; CRC: Press Boca Raton, FL, USA, 2015; pp. 619–626. [Google Scholar] [CrossRef]
  10. Dimitrakos, T.D.; Kyriakidis, E.G. A Semi-Markov Decision Algorithm for the Maintenance of a Production System with Buffer Capacity and Continuous Repair Times. Int. J. Prod. Econ. 2008, 111, 752–762. [Google Scholar] [CrossRef]
  11. Simion, D.; Postolache, F.; Fleacă, B.; Fleacă, E. AI-Driven Predictive Maintenance in Modern Maritime Transport—Enhancing Operational Efficiency and Reliability. Appl. Sci. 2024, 14, 9439. [Google Scholar] [CrossRef]
  12. Richardson, W.B.; Meyer, J.; Von Solms, S. Towards Machine Learning and Low Data Rate IoT for Fault Detection in Data Driven Predictive Maintenance. In Proceedings of the 2021 IEEE World AI IoT Congress (AIIoT), Seattle, WA, USA, 10–13 May 2021; pp. 202–208. [Google Scholar] [CrossRef]
  13. Yue, Z.; Mangan, J. A Framework for Understanding Reliability in Container Shipping Networks. Marit. Econ. Logist. 2024, 26, 523–544. [Google Scholar] [CrossRef]
  14. Martin, J.; Martin, S.; Pettit, S. Container Ship Size and the Implications on Port Call Workload. Int. J. Shipp. Transp. Logist. 2015, 7, 553–569. [Google Scholar] [CrossRef]
  15. Bukša, A. Modeliranje Održavanja Brodskog Porivnog Sustava; University of Rijeka, Faculty of Maritime Studies: Rijeka, Croatia, 2005. [Google Scholar]
  16. Mihanović, L. Istraživanje Eksploatacijske Pouzdanosti i Pogodnosti Održavanja Brzookretnih Brodskih Motora; Sveučilište u Rijeci, Pomorski Fakultet u Rijeci: Rijeka, Croatia, 2015. [Google Scholar]
  17. Bose, D.; Ghosh, G.; Mandal, K.; Sau, S.; Kunar, S. Measurement and Evaluation of Reliability, Availability and Maintainability of a Diesel Locomotive Engine. IOSR J. Mech. Civ. Eng. 2013, 8, 31–46. [Google Scholar] [CrossRef]
  18. Budimir, D.; Šoštarić, M.; Vidović, K. Data Envelopment Analysis for Determining the Efficiency of Variant Solutions for Traffic Flow Organisation. Promet Traffic Transp. 2019, 31, 341–353. [Google Scholar] [CrossRef]
  19. Charnes, A.; Cooper, W.W.; Rhodes, E. Measuring the Efficiency of Decision Making Units. Eur. J. Oper. Res. 1978, 2, 429–444. [Google Scholar] [CrossRef]
  20. Mat Esa, M.A.; Muhammad, M. Adoption of Prescriptive Analytics for Naval Vessels Risk-Based Maintenance: A Conceptual Framework. Ocean Eng. 2023, 278, 114409. [Google Scholar] [CrossRef]
  21. Mittal, V.; Devi, P.S.; Pandey, A.K.; Singh, T.; Dhingra, L.; Beliakov, S.I. IoT-Enabled Predictive Maintenance for Sustainable Transportation Fleets. E3S Web Conf. 2024, 511, 01012. [Google Scholar] [CrossRef]
  22. Çalışkan, M.; Cicioğlu, M.; Çalhan, A.; Dirik, A.E. Machine Learning-Based Failure Detection Using Internet of Things: A Case Study for Proactive Maintenance. SSRN 2024. [Google Scholar] [CrossRef]
  23. Müller, S.; Toborek, V.; Beckh, K.; Jakobs, M.; Bauckhage, C.; Welke, P. An Empirical Evaluation of the Rashomon Effect in Explainable Machine Learning. In Machine Learning and Knowledge Discovery in Databases: Research Track: European Conference, ECML PKDD 2023, Turin, Italy, 18–22 September 2023, Proceedings, Part III; Springer: Berlin/Heidelberg, Germany, 2023; pp. 462–478. [Google Scholar] [CrossRef]
Figure 1. Classification of variables for DEA evaluation of maintenance strategies.
Jmse 13 00798 g001
Figure 2. Illustration of transitions between three marine engine states.
Jmse 13 00798 g002
Figure 3. Visualization of DEA analysis results.
Jmse 13 00798 g003
Table 1. Structured operational data of key components.
ComponentRun. Hours Last Mainten.O/H IntervalNext Due Hrs.Present RHrs.StatusEstimated Time to Failure (h)
Piston N°1 (12 cylinders)41,20028,00069,20072,500S365,000
Fuel Pump N°1 (12 cylinders)31,35616,00047,35652,000S348,500
Exhaust Valve N°1 (8 cylinders)26,66430,00056,66458,000S257,000
Turbocharger N°1 (12 cylinders)35,78340,00075,78378,200S376,000
High-Pressure Pump N°238,50018,00056,50058,200S320,000
Piston N°3 (8 cylinders)22,30025,00047,30024,800S227,500
Exhaust Valve N°2 (12 cylinders)18,90024,00042,90019,200S122,000
Turbocharger N°4 (12 cylinders)32,40040,00072,40078,500S337,500
M/E N°2 HP Fuel Rail Supply Pump44,87818,00044,87829,692S220,000
M/E N°4 HP Fuel Rail Supply Pump23,74318,00023,74329,692S320,000
Table 2. Distribution of Component States (Total: 512).
StateNumber of ComponentsPercentage
Normal (S1)10119.7%
Degraded (S2)8216.0%
Failure (S3)32964.3%
Table 3. Weibull analysis parameters of key components.
Componentβα (h)MTTF (h)
High-Pressure Fuel Pumps1.818,50016,450
Turbochargers2.232,00028,340
Pistons1.524,00021,650
Exhaust Valves1.627,00024,280
Table 4. Optimal maintenance intervals for key components derived from Weibull analysis.
ComponentRecommended Interval (h)Optimal Interval (h)Failure Reduction (%)
High-Pressure Fuel Pumps18,00015,00035%
Turbochargers40,00030,00025%
Pistons25,00022,00020%
Table 5. Transition probability matrix.
Previous State →S2S3S1
S2 (Degraded)0.3410.5240.134
S3 (Failure)0.1340.8300.036
S1 (Normal)0.1000.1200.780
Table 6. DEA analysis results.
StrategyCosts (EUR)Preventive InterventionsFailure Reduction (%)MTBFSavings (EUR)Efficiency
Standard146,6660.021.90.10200.00015
Improved131,15933.221.90.13115,5070.118
Aggressive126,08334.131.50.14920,5830.163
Optimized127,81333.626.60.13918,8530.148
Disclaimer/Publisher’s Note: The statements, opinions and data contained in all publications are solely those of the individual author(s) and contributor(s) and not of MDPI and/or the editor(s). MDPI and/or the editor(s) disclaim responsibility for any injury to people or property resulting from any ideas, methods, instructions or products referred to in the content.

