Abstract
Rip currents are fast-moving, narrow channels of water that flow seaward from the shoreline, typically forming within the surf zone and extending beyond the wave-breaking region. These currents pose significant hazards to swimmers, contributing to numerous drowning incidents, especially with the increasing popularity of ocean recreation. Despite their prevalence, rip currents remain difficult to detect visually, and no universally reliable method exists for their identification by beachgoers. To address this challenge, this study presents a novel approach for detecting rip currents in optical images using wavelet-based edge detection and image convolution techniques. Five identification criteria were established based on previous literature and expert observations. The proposed program incorporates image augmentation, averaging, and frame aggregation to enhance generalization and accuracy. Experimental analysis involving four iterations and four wavelet bases demonstrated that using two iterations with the Daubechies wavelet yielded the highest interpretation accuracy (88.3%). Performance evaluation using a confusion matrix further confirmed an accuracy rate of 83.0%. The results indicate that the proposed method identifies rip currents in images, offering a valuable tool for researchers studying rip current patterns. This approach lays the groundwork for future advancements in rip current detection and related research.
1. Introduction
Rip currents are jet-like currents that flow outward at nearly perpendicular angles to the shoreline, primarily occurring within the surf zone and expanding beyond the area where waves break [1,2,3]. Occasionally, individuals swimming in coastal waters may find themselves being carried away from the shore. The most likely culprit behind these incidents is the presence of rip currents. In recent years, with the development of recreational activities in the ocean, drowning incidents caused by rip currents have continued to occur incessantly [4,5,6]. According to 20-year research by the US Lifesaving Association, rip currents account for 81.9% of annual beach rescues [3]. Brighton et al. [7] indicated that 57.4% of drowning events in Australian coastal waters from 2004 to 2011 were attributed to rip currents.
Unlike waves and tides, the occurrence of a rip current is difficult to see. There is a lack of a universally effective and dependable method to recognize rip currents, regardless of their location, for the majority of beachgoers. Rip currents have been a long-term research topic in the field of oceanography [8,9,10]. The mechanism of occurrence of rip currents is changes in the coastal topography. When waves propagate towards the shoreline, flow generates an offshore force in response to the radiation stress generated by the waves. Many methods and equipment designs have been proposed for observing rip currents based on the mechanisms and characteristics of rip current occurrence [8,11,12,13]. Shepard et al. [8] pointed out that rip currents are most visible on long, sandy beaches, as sediment- and bubble-laden rip currents exiting the surf zone are more easily identified. Subsequently, the Particle Image Velocimetry (PIV) method was applied, allowing for the calculation of rip current velocity and direction [14,15]. As technology advanced, fixed electromagnetic current meters were used in arrays to measure the alongshore variability of the nearshore circulation, even revealing more spatial details of rip currents based on Lagrange measurements of GPS drifters equipment or Acoustic Doppler Current Profilers (ADCPs) [11,16,17].
Bathymetric measurements can also be inferred from video and radar systems, which can view the beach and surf zone for a long time and extensively without being limited by power and terrain. Punzo et al. [18] used X-band radar to observe the spatial and temporal variation of sea-state parameters and detected strong rip currents. Due to the close relationship between rip current occurrence and the dissipation of wave-breaking energy, rip currents can be monitored by observing changes in the characteristics of the surf zone. Shepard et al. [8] mentioned that when rip currents occur, there are noticeable breaks in the surf zone on the sea surface. Holman et al. [19] conducted rip current observations in embayed beaches by averaging image data spanning over four years. They investigated the periodic variations in rip current occurrence. The Korean Meteorological Administration also employs real-time monitoring using CCTV footage to promptly alert the public when rip currents occur [20,21].
Current rip current observation techniques, whether through direct velocity measurements using instruments [22,23] or remote sensing via optical imagery and breaking wave characteristics in the surf zone [13,24], still face challenges in terms of long-term monitoring, large-scale observation, and general applicability. Bruneau et al. [22] and Lee et al. [23] measured rip current velocities using ADCPs and GPS drifters, respectively. However, such instruments typically provide only point-based velocity data, and conducting large-scale observations would require significant financial investment. PIV techniques estimate flow fields by tracking the movement of suspended particles. However, this method often suffers from a lack of distinct and sufficient surface tracers. In such cases, researchers must resort to the use of dyes. For example, Brander [25] applied potassium permanganate dye to back-calculate the surface flow field, revealing that rip current channels narrow over time and that rip current velocity peaks during ebb tides.
As a result, analysis of breaking wave features in imagery is more suitable for long-term and large-scale monitoring. Although various image-based feature extraction techniques have been proposed, most rip current identification methods still rely heavily on manual interpretation and have not yet achieved full automation. Maia et al. [24] introduced qualitative criteria for identifying rip currents in images. Turner et al. [13] and Mouragues et al. [26] applied long-term image averaging and intensity analysis to distinguish between breaking zones and rip channels. However, these methods ultimately still require manual verification of rip current locations. Some studies have attempted to automate rip current detection. For instance, Liu and Wu [27] and Borra et al. [28] used K-means clustering to segment pixels, then determined areas of breaking waves or foam based on predefined baselines to locate rip currents. However, since each coastal region has a different baseline, this method lacks general applicability in areas without predefined references. Borra et al. [28] also proposed using satellite imagery to identify rip current locations, but manual verification was still required. Moreover, these studies highlighted that their methods are sensitive to environmental conditions such as strong sunlight, rain, and sea surface reflections, which can degrade performance. Recently, AI-based object detection techniques have been used to identify rip currents [29,30]. Nevertheless, such methods require large datasets for training and demand considerable training time and computational resources; furthermore, due to the black-box nature of AI, it is often difficult to interpret the reasons behind misclassifications.
Wavelet transform, as a signal processing tool with multi-scale and time-frequency localization properties, offers clear advantages in image feature detection and presents a promising solution to the challenges mentioned above. First proposed by Morlet et al. [31], wavelet transform differs from traditional Fourier Transform in that it not only analyzes frequency characteristics but also preserves localized signal variations in time or space, making it particularly suitable for capturing fast and irregular changes in images. Over time, many different wavelet basis functions have been developed, such as Haar [32], Daubechies [33], and Mexican Hat wavelets [34], each with its own unique characteristics and application contexts. Due to its multi-scale analysis capability, wavelet transform has been widely applied in various fields for effective edge detection. For example, Sun et al. [35] used wavelet transform to analyze infrared thermal images of photovoltaic modules and successfully detected thermal defects. Altaie et al. [36] applied it to infrared imagery of high-voltage transmission lines to accurately and rapidly identify abnormal thermal hotspots.
In the field of oceanography, wavelet transform has also seen widespread application. Majidiyan et al. [37] analyzed six-degree-of-freedom acceleration data from ships using wavelet transform to establish a real-time sea-state analysis system. Bang et al. [38] used wavelet analysis to identify a link between rip current occurrences and long-period waves, suggesting that such waves may be a cause of rip current formation. Of particular note is the edge detection capability of wavelet transform, which can be used to extract various features in marine imagery. For instance, Antony and Murenzi [39] successfully identified mesoscale features such as oil slicks, fronts, eddies, and ship wakes using wavelet transform, demonstrating its strong potential and effectiveness in marine image analysis.
To achieve the goals of long-term, large-scale, and generalizable automated rip current detection, this study develops a method for identifying rip currents based on breaking wave features in optical imagery. To enhance the visual distinction of surf-zone breaking waves and to reduce errors caused by environmental lighting conditions, we propose the use of wavelet-based edge detection. Leveraging its multi-scale analytical advantage, the method suppresses background noise while retaining edge features across different scales, thereby strengthening the contrast between breaking wave zones and water bodies.
This study explores how different wavelet types and iteration levels of wavelet transform affect the representation of breaking wave features and identifies the optimal image processing configuration. Ultimately, rip current locations are automatically detected using convolution and frame aggregation techniques. Additionally, image augmentation is employed to improve the generalizability of the detection method, making it applicable to both satellite and camera-based imagery
2. Rip Current Image Recognition Method
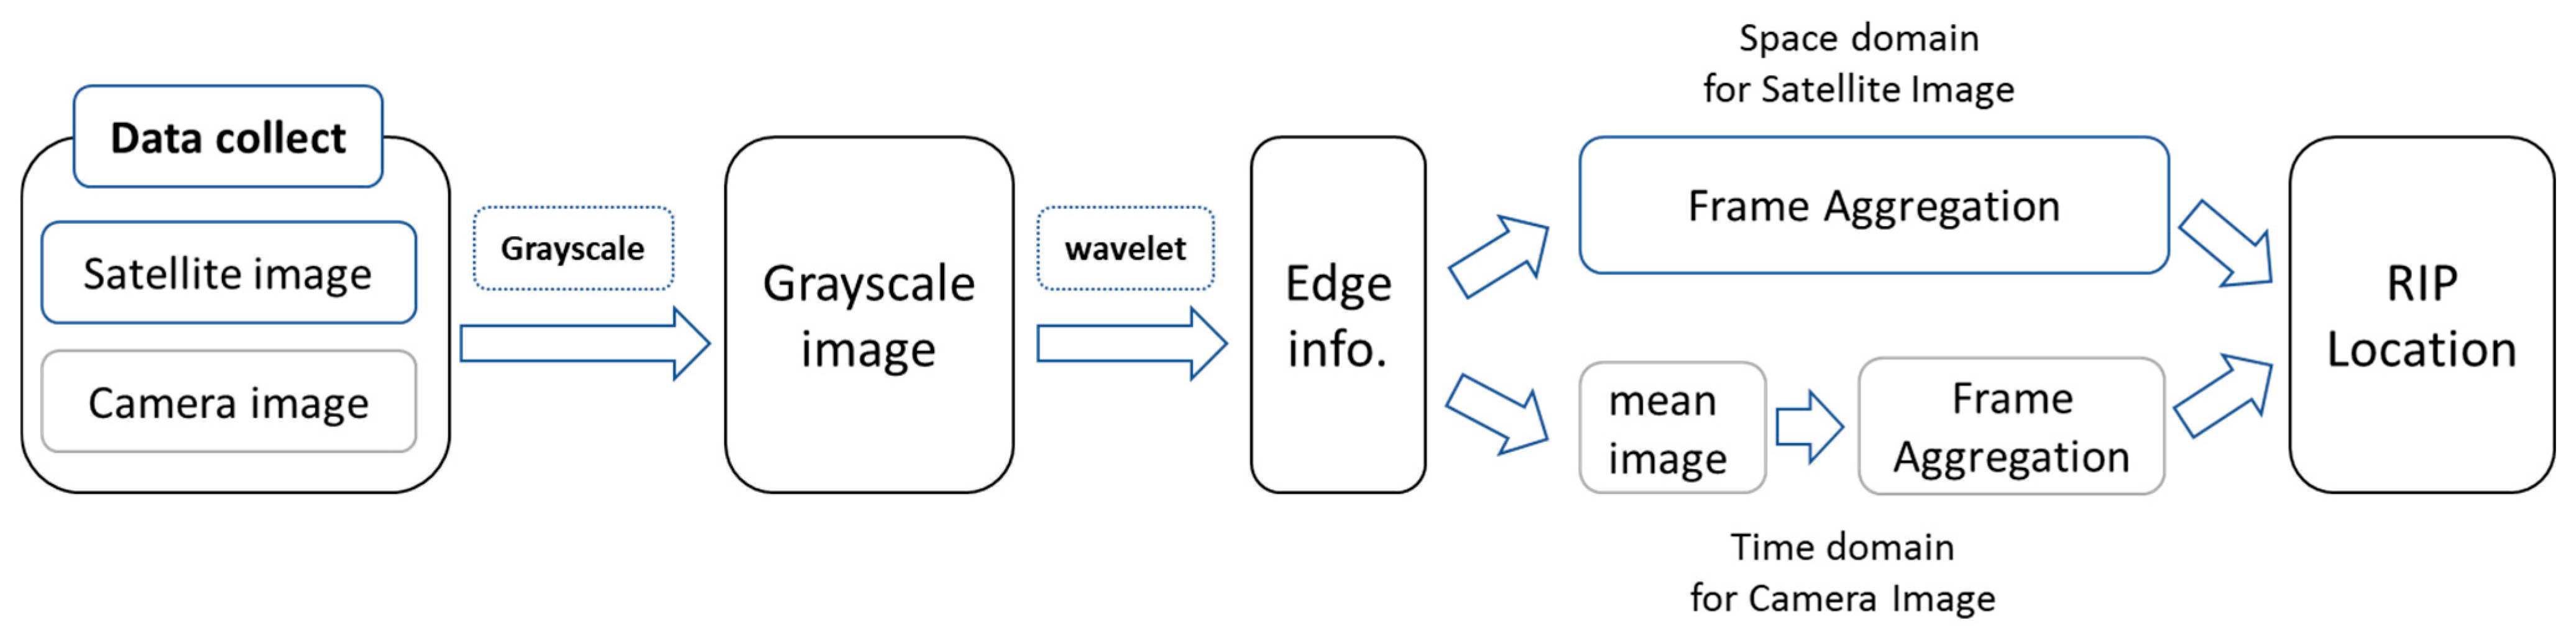
In order to establish a generalized and fully automated image interpretation method for long-term and large-scale rip current monitoring, this study proposes a set of criteria for identifying rip currents in imagery. These criteria are based on previous research regarding the surface characteristics and formation mechanisms of rip currents. The overall workflow of the proposed method is illustrated in Figure 1.

Figure 1.
Workflow of the proposed rip current detection system. The left section illustrates data acquisition from satellite and video sources, followed by grayscale conversion. The center shows wavelet edge detection using the Daubechies wavelet basis. The right section depicts image convolution with rip current masks, supported by image augmentation and frame aggregation techniques for enhancing robustness and interpretability.
First, satellite or camera images are collected and converted into grayscale format. Then, a wavelet-based edge detection method is applied to enhance the contrast between breaking waves and the surrounding water. After that, convolution analysis is conducted using rip current masks to identify the possible locations of rip currents. Finally, to improve the accuracy and stability of the detection results, image enhancement and temporal frame aggregation techniques are introduced.
2.1. Rip Current Detection Based on Defined Criteria
The most reliable method for identifying rip currents is by measuring their flow velocity and direction; however, this is often challenging in practice. As an alternative, this study employs image-based analysis to detect rip current occurrences by examining characteristic patterns in optical imagery.
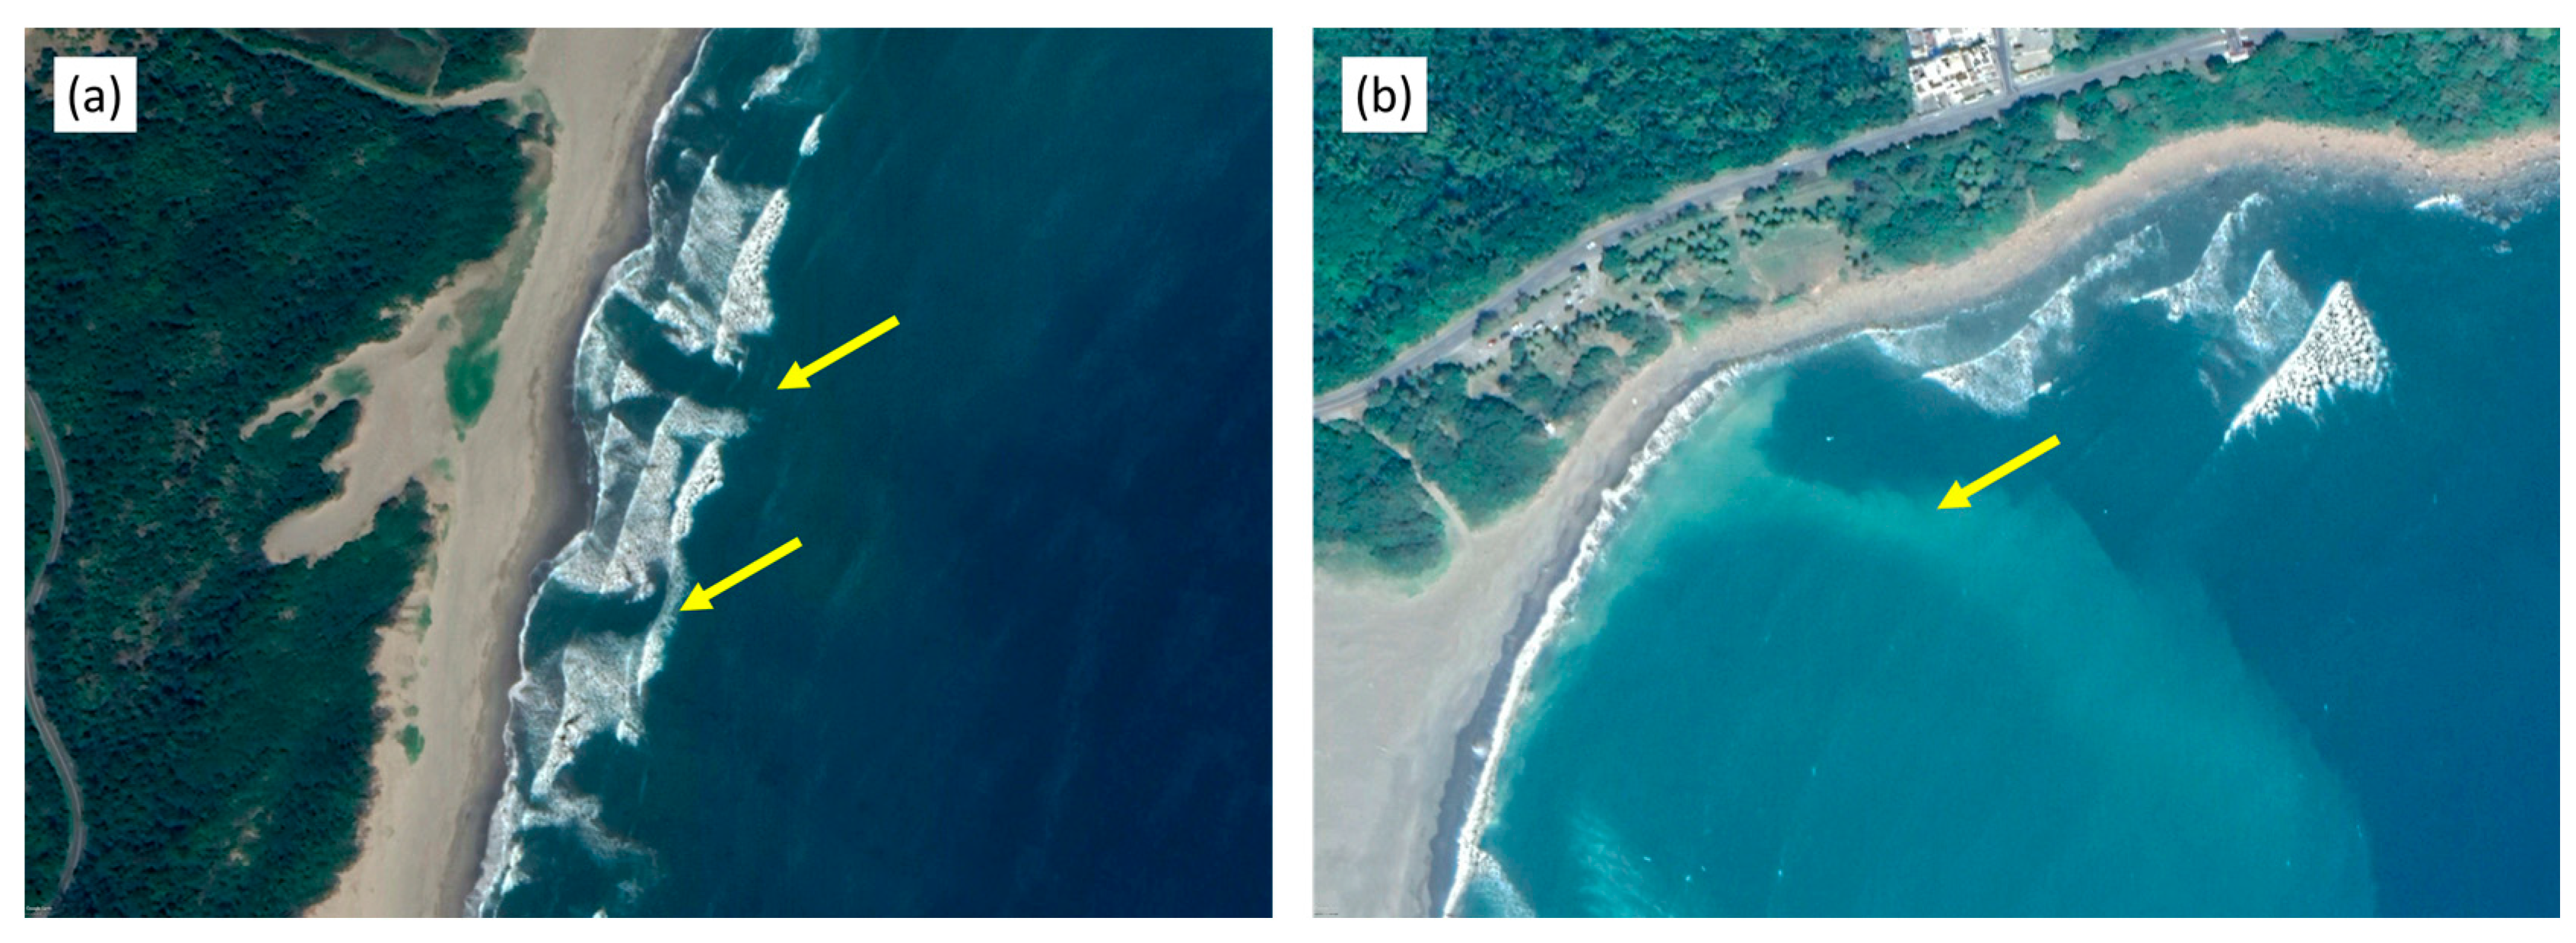
Longuet-Higgins and Stewart [40] established a relationship between rip current formation and wave-breaking energy dissipation. When a rip current occurs, the offshore movement of water dissipates wave energy, preventing the necessary conditions for wave breaking. This phenomenon results in visible gaps in the wave-breaking zone, as illustrated in Figure 2a [8,41]. In cases where suspended materials (such as sand, driftwood, or foam) are present on the sea surface, their movement trajectories can serve as indicators of current direction, thereby aiding in the identification of rip current locations (Figure 2b) [1,25].
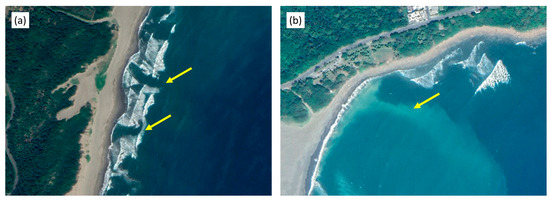
Figure 2.
Illustration of Criteria 1 and 2, where yellow arrows indicate the locations of wave-breaking fractures. (a) The presence of distinct rifts in the wave-breaking zone; (b) seaward motion of spray and suspended material, signaling the presence of a rip current.
Another key factor in image-based rip current detection is the temporal persistence of these currents. Rip current durations vary significantly, ranging from several minutes to multiple hours [2]. Thus, to enhance detection accuracy, methods such as image averaging and frame aggregation are applied to analyze the temporal continuity of disruptions in the breaker zone [19,20,29]. These techniques help minimize false positives caused by transient disturbances such as wind-driven wave dispersion.
Topography also plays a crucial role in rip current formation. Wright and Short [42] categorized beach types based on field observations and identified specific topographical features that favor rip current development. For example, areas with the presence of channels on the seabed or gaps in sandbars are commonly associated with rip current occurrences [8,43,44,45]. Interestingly, the oceanic and meteorological conditions required for rip current generation are not necessarily extreme [4,46], and rip currents often recur at the same locations. Therefore, this study proposes Criterion 4: “When the topography is stable (i.e., in the absence of typhoons, storm surges, or human-induced changes), a rip current must appear at least twice in the same location”. This condition serves as an additional verification measure for the reliability of rip current detection results in cases where the exact time of occurrence cannot be confirmed from satellite imagery. Additionally, previous studies have shown that the spacing between rip currents typically exceeds 40 m [47,48,49]. Based on these insights, the following five criteria were established to detect rip currents in optical images:
- Criterion 1: A visible gap or rift in the wave-breaking zone must be present.
- Criterion 2: Suspended materials (e.g., spray, sediment, or driftwood) must be seen extending seaward.
- Criterion 3: The discontinuity in the surf zone must persist for at least 10 min.
- Criterion 4: Rip currents tend to recur at the same location over time.
- Criterion 5: The spacing between rip currents is generally greater than 40 m.
2.2. Data Collection
2.2.1. Satellite Images
Most rip current case studies are derived from rescue records, which are often limited in number and may not provide sufficient data for comprehensive analysis. To overcome this limitation, satellite imagery offers a vast dataset with broad spatial coverage, making it an ideal resource for capturing rip current phenomena. In this study, satellite images provided by the Center for Space and Remote Sensing Research (CSRSR) of Taiwan and Google Earth (GE) are utilized. The satellite platforms used include SPOT 5/6/7, Pléiades, IKONOS, and QuickBird, with an image resolution of 2.5 m. Dalrymple et al. [2] reviewed multiple studies and pointed out that rip currents typically extend from the shoreline to several tens or even hundreds of meters offshore, with a width approximately three times that of the surf zone. Turner et al. [13] successfully identified rip currents using imagery with a resolution ranging from 0.5 to 5.0 m and even used images with resolutions as low as 16 m near the image boundaries. Borra et al. [28] also successfully identified rip currents using satellite imagery from the same sources as this study (Pléiades and Google Earth Pro). In addition, numerical modeling studies of rip currents, such as that by Castelle et al. [50], have commonly used grid resolutions between 0.5 and 10 m. Therefore, based on these previous research experiences, satellite imagery can be considered sufficient for rip current identification. A substantial dataset of high-resolution satellite imagery from 2013 to 2017 covering the entire Taiwan region is used. Since satellite imagery typically covers large areas and may include multiple beaches within a single image, this study segmented the satellite images into beach-based analysis units. These images were distributed across more than 200 beaches in Taiwan. The satellites regularly pass over Taiwan and capture images, resulting in at least 10 images per beach annually, with the total dataset exceeding 10,000 images.
Rip currents were observed at 101 beaches, and a total of 714 images containing rip currents were collected. The remaining images were also retained to form a comprehensive database, which was later used to validate the proposed automated rip current image recognition technique.
2.2.2. Coastal Video Images
The Central Weather Administration (CWA) of Taiwan has established a rip current optical monitoring station to observe coastal dynamics. The station is situated on a hillside approximately 1 km from Waiou Beach, Yilan County, Taiwan. Due to the considerable length of the beach and the need to clearly capture the surf zone, three high-resolution cameras (each with 2-megapixel resolution) were installed. The cameras are positioned at angles exceeding 30 degrees to minimize distortion and compression of the surf zone, with an image resolution ranging from 0.1 to 0.5 m per pixel. These three cameras respectively cover the northern, central, and southern sections of Waiou Beach. Each camera captures a segment approximately 400 m in length. A slight overlap between the coverage areas of the cameras ensures that the entire beach is fully captured.
The system records images at a frame rate of 30 fps (frames per second), ensuring detailed monitoring of rip current formation and dissipation, which can last from minutes to hours. However, as optical cameras are affected by lighting conditions, only daytime images (6:00 AM to 6:00 PM) were used in this study. Over the period from October 2021 to October 2022, the monitoring station captured 4211 h of image data, providing a substantial dataset for rip current analysis.
2.3. Wavelet Edge Detection
Traditional edge detection methods based on color value gradients using two-dimensional difference operators [51,52] are susceptible to environmental influences. Chaple et al. [53] and Meester and Baslamisli [54] pointed out that traditional edge detection methods such as those proposed by Roberts, Prewitt, and Sobel show significantly reduced performance under conditions such as image blurriness, weak or unclear lighting variations, speckle noise, low contrast, complex textures, and low image resolution. In real-world coastal environments, it is common to encounter challenges such as overcast weather causing insufficient lighting, interference from wave patterns or sea spray, and even disturbances caused by increased boat traffic or human activity, all of which can degrade image quality and adversely affect edge detection results [55].
To overcome this limitation, this study utilizes a two-dimensional wavelet transform for edge detection. By employing Short-Time Fourier Transform (STFT) with an adjustable packet, the method can effectively remove background noise while preserving the characteristics of the breaking wave zone.
According to the wavelet theory proposed in [56], the grayscale image is regarded as a 2D signal matrix (), and nts the Fourier transform. The 2D Fourier transform of the equation expressed as is defined as Equation (1).
According Equation (1), the 2D wavelet transform equation for the image matrix () can be expressed as Equation (2).
where is a function of the wavelet, which can be obtained by mother function translation and scale expansion as Equation (3).
Then, the 2D wavelet transform is described through Fast Fourier Transform (FFT) and inverse 2D Fourier transform. The 2D Fourier transform of the wavelet function can be written as Equation (4).
Under assumptions of scale expansion, translation (Equation (5)), 2D convolution (Equation (6)), and conjugation properties (Equation (7)), i.e.,
the 2D Fourier transform of the wavelet function can be rewritten as Equation (8).
where and can be obtained through fast Fourier transform (FFT). The result of the 2D wavelet transformation of the image can be calculated by Equation (4). Finally, after calculating edge strengths at multiple scales using wavelet transform, the detected edge information is normalized, then processed through a binarization procedure. The threshold used for binarization is the maximum value within the two-dimensional edge strength matrix. Pixels reaching this maximum value are considered edge points and are marked as true (1), while all other pixels are marked as false (0). After removing the regions marked as false (i.e., those with zero coefficients), the remaining true-marked positions clearly define the boundaries of the breaking wave zones.
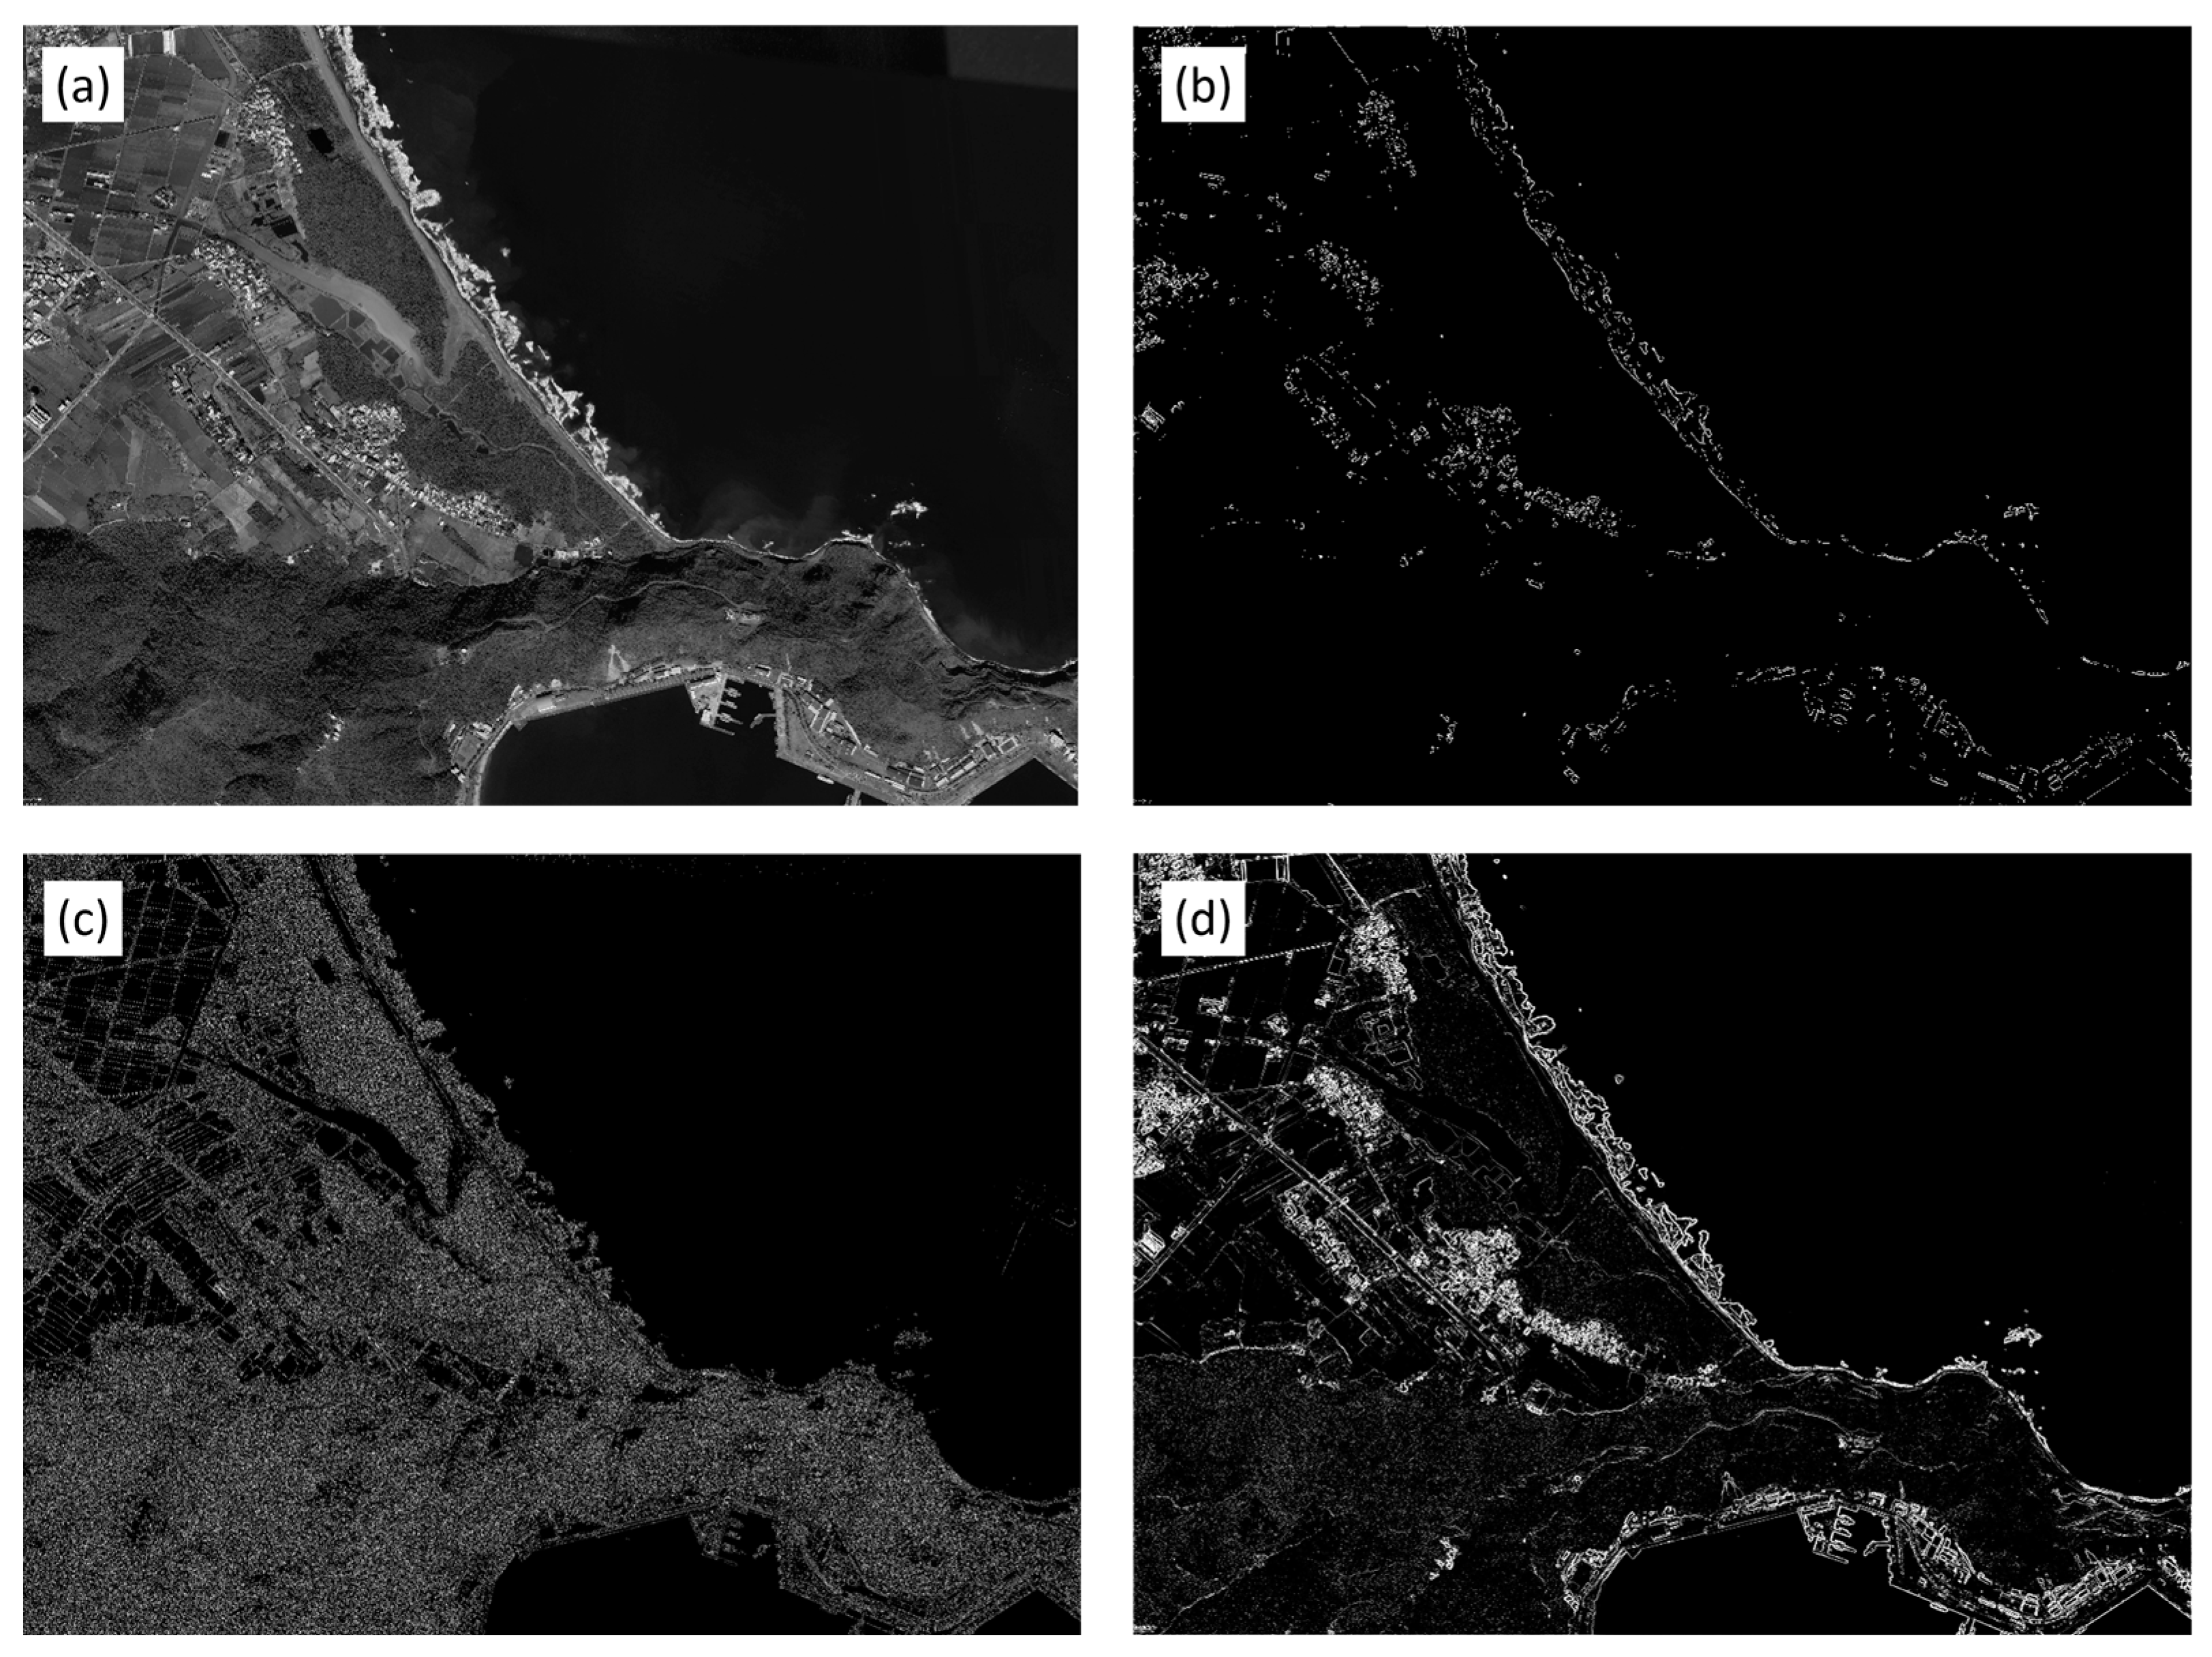
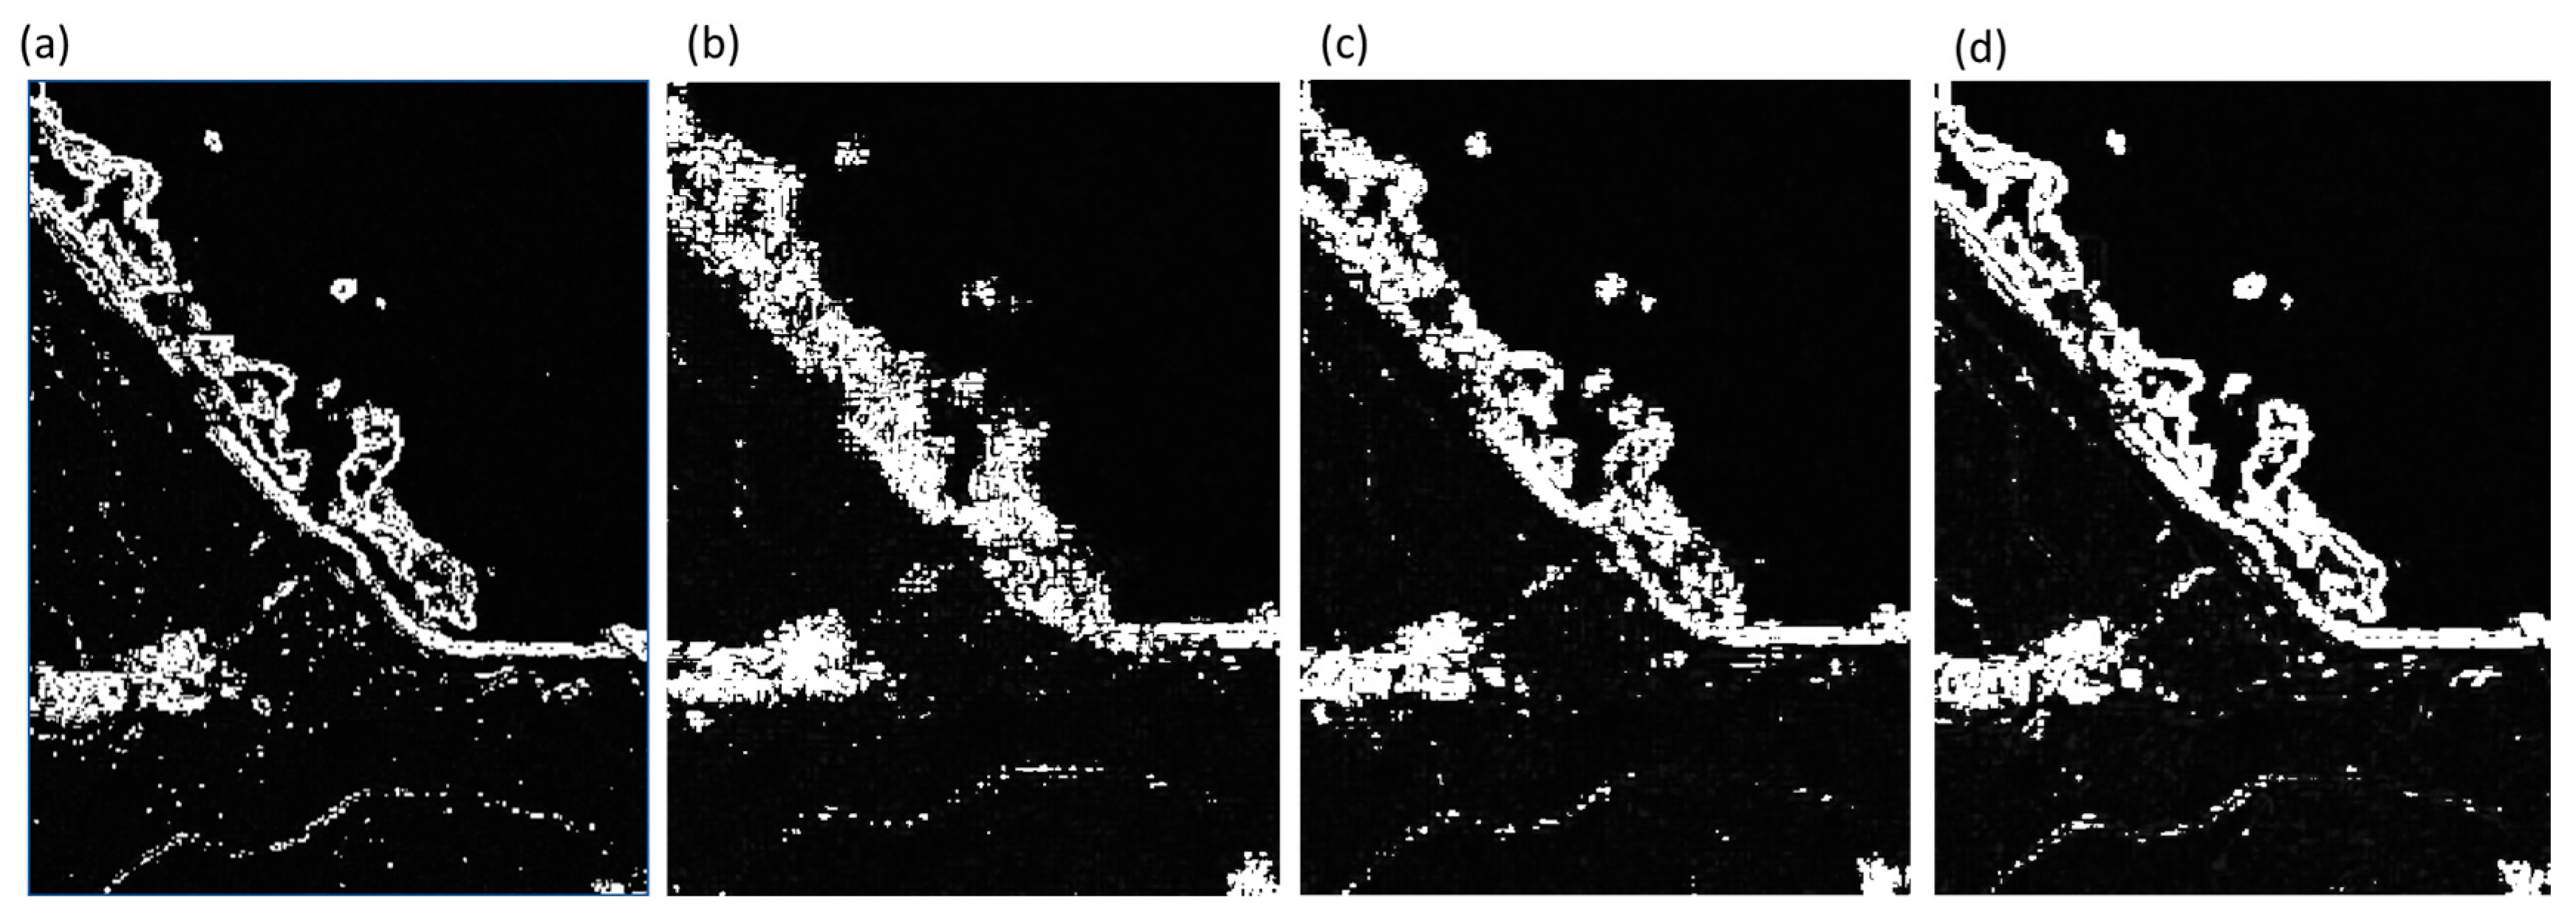
This study compares the results of wavelet-based edge detection with those of traditional Sobel and Canny algorithms. For wavelet edge detection, custom-defined filters were used: a low-pass filter [0.01, 0.04, 0.04, 0.01] and a high-pass filter [0.01, −0.01]. The scales were set as powers of 2, and convolution was applied point by point across the entire image. As a result, the output image has the same dimensions as the original. In contrast, the Sobel and Canny algorithms detect edges by first computing image gradients using their respective filters, then applying a threshold set at 30% of the maximum gradient value. The Sobel method retains only regions with strong gradients (Figure 3b). The Canny algorithm, on the other hand, applies smoothing through its filtering process, resulting in more consistent gradient calculations and allowing for more detailed edge retention. However, it lacks the ability to differentiate between large-scale and small-scale edges, often producing outputs with considerable noise (Figure 3c). As shown in Figure 3d, the wavelet-based edge detection method effectively removes low-frequency noise while preserving high-frequency edge information across multiple scales. Therefore, both large-scale features such as coastlines and small-scale features such as breaking waves can be clearly identified. Based on these results, this study adopts the wavelet edge detection method to enhance the breaking wave features in nearshore surf zones, thereby facilitating the subsequent image convolution process for identifying rip current locations.

Figure 3.
The results of different edge detection methods applied to satellite image processing. (a) Original image; (b) Sobel edge detection; (c) Canny edge detection; (d) wavelet transform edge detection. The results indicate that using wavelet transform edge detection can better preserve the features in the original image.
One-dimensional discrete wavelet transform is used in this work for denoising purposes. Based on the mathematical properties of different wavelet bases, four types—Haar, Daubechies, Symlet, and biorthogonal—were identified as suitable for enhancing breaking wave features in the nearshore region. The Haar wavelet, characterized by its step-like discontinuous mother function, offers strong first-order edge detection capability and high computational efficiency. It is particularly suitable for quickly detecting sharp intensity changes and boundary signals in the breaking wave zone. The Daubechies wavelet, with its high-order vanishing moments and compact support, enables multi-scale analysis of both fine textures and local edge structures in the surf zone. The Symlet wavelet, a symmetrized version of the Daubechies wavelet, retains the vanishing moments while improving phase-delay characteristics, making it more stable in detecting directional and continuous edge features of breaking waves. The biorthogonal wavelet, with its biorthogonality and perfect linear phase properties, allows for high-precision reconstruction without edge displacement, making it especially suitable for applications that require accurate localization of breaking wave boundaries.
Thus, four different types of wavelets are used in this work for denoising of telephonic speech signals in the Haar, Daubechies, Symlet, and biorthogonal wavelets. The first wavelet packet transform is the Haar wavelet packet. It is a sequence of rescaled “square-shaped” functions that, together, form a wavelet family [57]; it can be defined as Equation (9).
The Haar wavelet is limited for general harmonic waves in DWT. Daubechies introduced compact orthonormal wavelets, which are valuable for discrete wavelet analysis. These wavelets lack a closed form; a scaling function is iteratively derived with 2N coefficients, yielding a wavelet function with the same coefficients. Coefficients for N = 1 to N = 45 are tabulated. Daubechies wavelets are denoted as dbN, with N indicating their order and the vanishing moments they possess (Equation (10)).
The Symlet wavelet is an orthogonal wavelet. Its waveform is more symmetric compared to the Daubechies wavelet, with its maximum value located at the center of the waveform. Finally, a biorthogonal wavelet refers to a type of wavelet whose corresponding wavelet transform is reversible, although not strictly orthogonal. Creating biorthogonal wavelets offers greater flexibility compared to orthogonal wavelets. An extra level of freedom lies in the ability to create symmetric wavelet functions, so the numbers (M and N) of coefficients in the scaling sequences (, ) may differ. The scaling sequences must satisfy the following biorthogonality condition, expressed as Equation (11).
Then, the wavelet sequences can be determined as in Equation (12).
2.4. Rip Current Location Detection
2.4.1. Packet of Rip Current Convolution
After applying wavelet transform, the image is redefined such that black regions represent water bodies (assigned a value of +1) and white regions represent breaking waves (assigned a value of −1). This results in a wavelet-transformed image that reflects the environmental characteristics of the coastal zone. To enable automated rip current detection, this study introduces the concept of a rip current mask. Based on previous research on the surface characteristics of rip currents [8], a pixel-based mask is constructed to describe the typical rip current pattern in imagery. According to the previously defined coastal features, the mask consists of white areas (representing breaking waves) on both sides and a black region (representing the rip current channel) in the center. This concept is similar to AI-based image feature learning; however, manually extracting object features significantly reduces the training cost typically required by machine learning models. By convolving the two matrices, it is possible to calculate the similarity between the rip current mask and each local region of the wavelet-transformed image as the mask slides across every pixel position, and the similarity at each position can be represented by (Equation (13)).
where m and n are the width and height of the rip current mask image, respectively, and denote the convolution operator. Experimental results show that when the similarity between the wavelet transform edge detection image and the rip current mask image reaches 80%, the position is a clear breaking point of the surf zone and a suspected location of rip current occurrence. It should be noted that the quantitative threshold of 80% similarity was determined empirically through iterative adjustments during preliminary experiments.
2.4.2. Image Augmentation
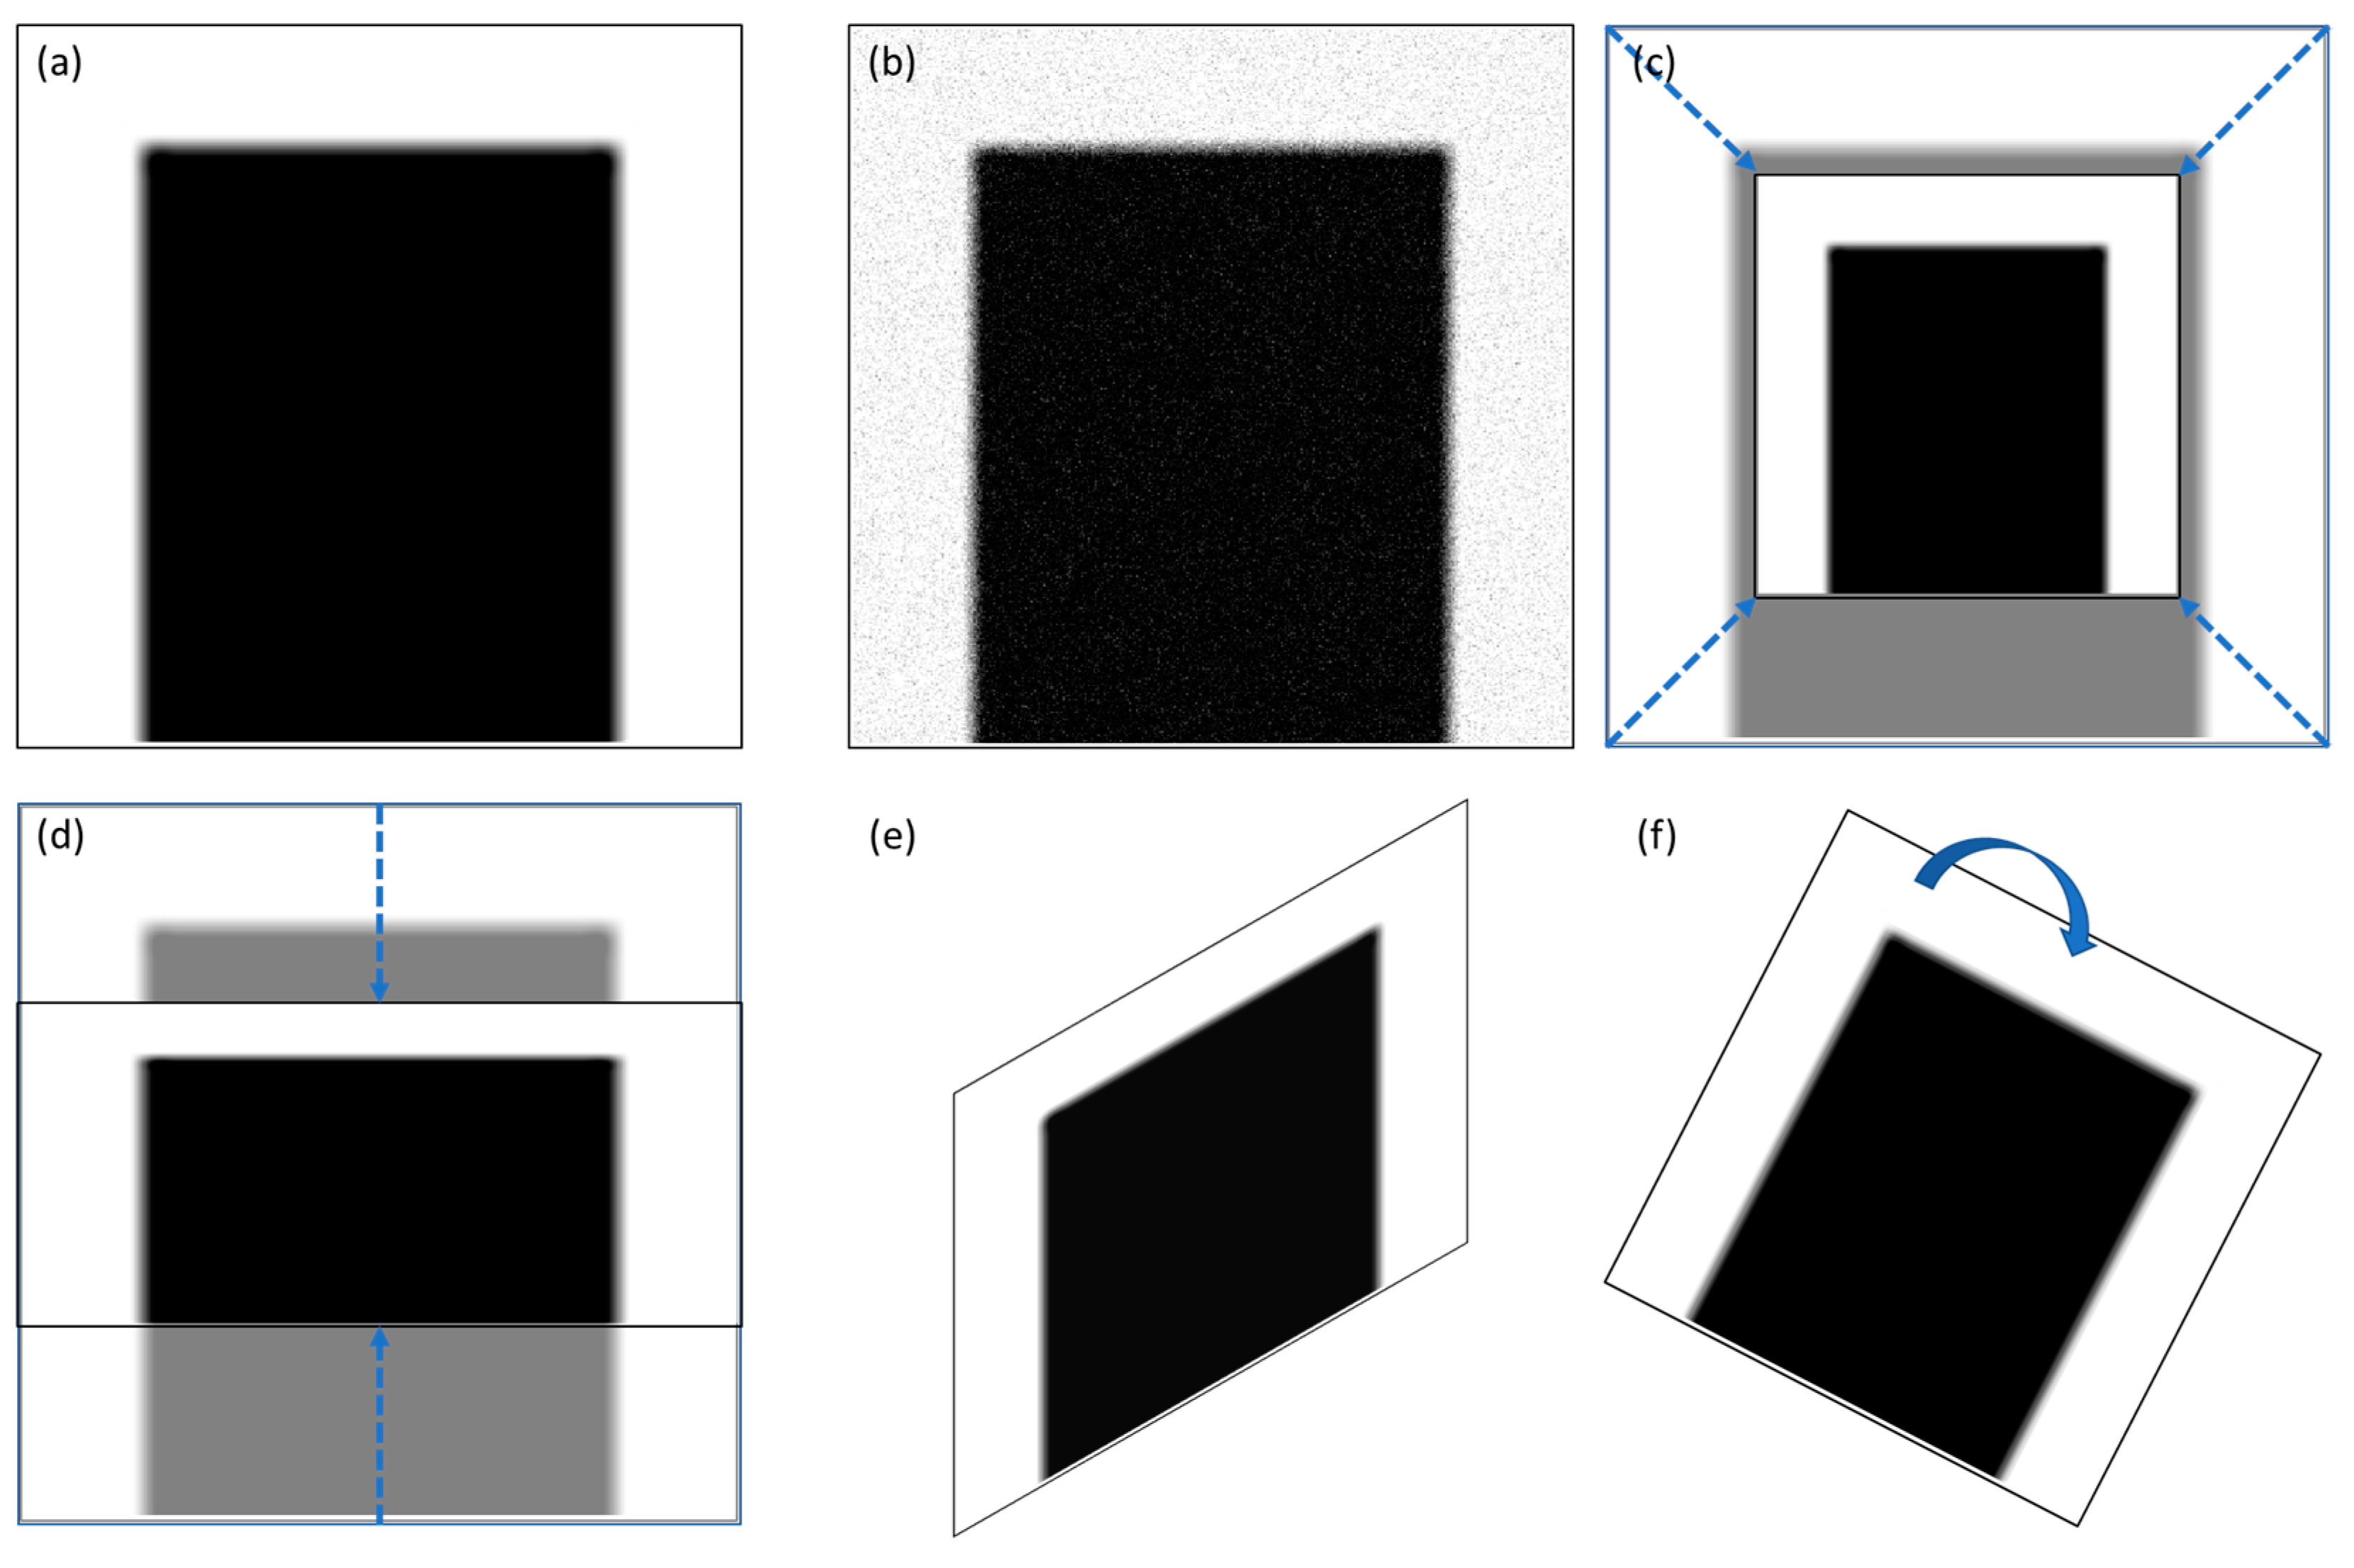
To enhance the generalizability of rip current image masks, image augmentation was applied to the rip current masks to account for variations in rip current patterns and differences caused by camera angle or distance during image acquisition. This approach enhances the generalizability of the rip current masks during image convolution. Five common augmentation methods, including rotation, vertical flipping, horizontal flipping, scaling, and distortion, are utilized. After image augmentation, the originally simple masks—comprising white pixels on both sides (representing the breaking wave zones) and black pixels in the center (representing the rip current channel)—can be adapted to simulate more realistic scenarios. These include variations in coastline orientation, distorted or non-perpendicular rip channels, and the presence of breaking wave noise within the rip channel. This process enhances the model’s ability to adapt to various types of rip current imagery. The parameters for image augmentation were set based on realistic conditions under which rip currents are likely to occur in actual images. The rotation angle ranges from 0 to 360 degrees in 30-degree intervals, the scaling parameter ranges from 0.5 to 3 in steps of 0.5, and the distortion level is set at 0.5 in increments of 0.1, as shown in Figure 4. In the actual detection process, convolution is first performed using the simplest rip current mask (Figure 4a) to calculate the similarity. If no sufficiently similar region is found, image augmentation is applied in the following order: rotation, scaling, stretching, distortion, and the addition of noise. If a region in the image reaches a similarity of 80% or higher with the augmented mask, that area is identified as a potential rip current zone. If no region meets this threshold, the image is considered to contain no rip current.
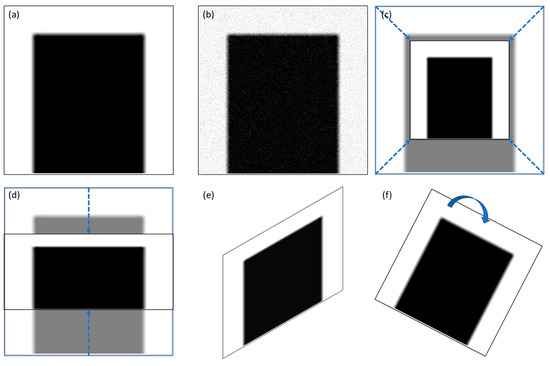
Figure 4.
Rip current mask image augmentation: (a) original image; (b) with noise; (c) zoomed in/out; (d) extended; (e) distorted; (f) rotation. The blue dashed lines indicate the direction of scaling, and the blue curves represent the direction of rotation.
2.4.3. Frame Aggregation
Static object detection models typically focus on the current frame, neglecting the dynamic nature of rip currents, which can vary in shape and texture due to external factors like weather, wind speed, wave characteristics, water flow, debris, and sediment. Unlike objects with well-defined edges, rip currents have amorphous boundaries, resulting in bounding boxes of variable sizes and locations across adjacent video frames. To address this, we adopt temporal smoothing and frame aggregation techniques to improve the accuracy and usability of the results. This also ensures that the detection results meet the conditions of the third criterion for rip current identification proposed in this study based on image analysis [29].
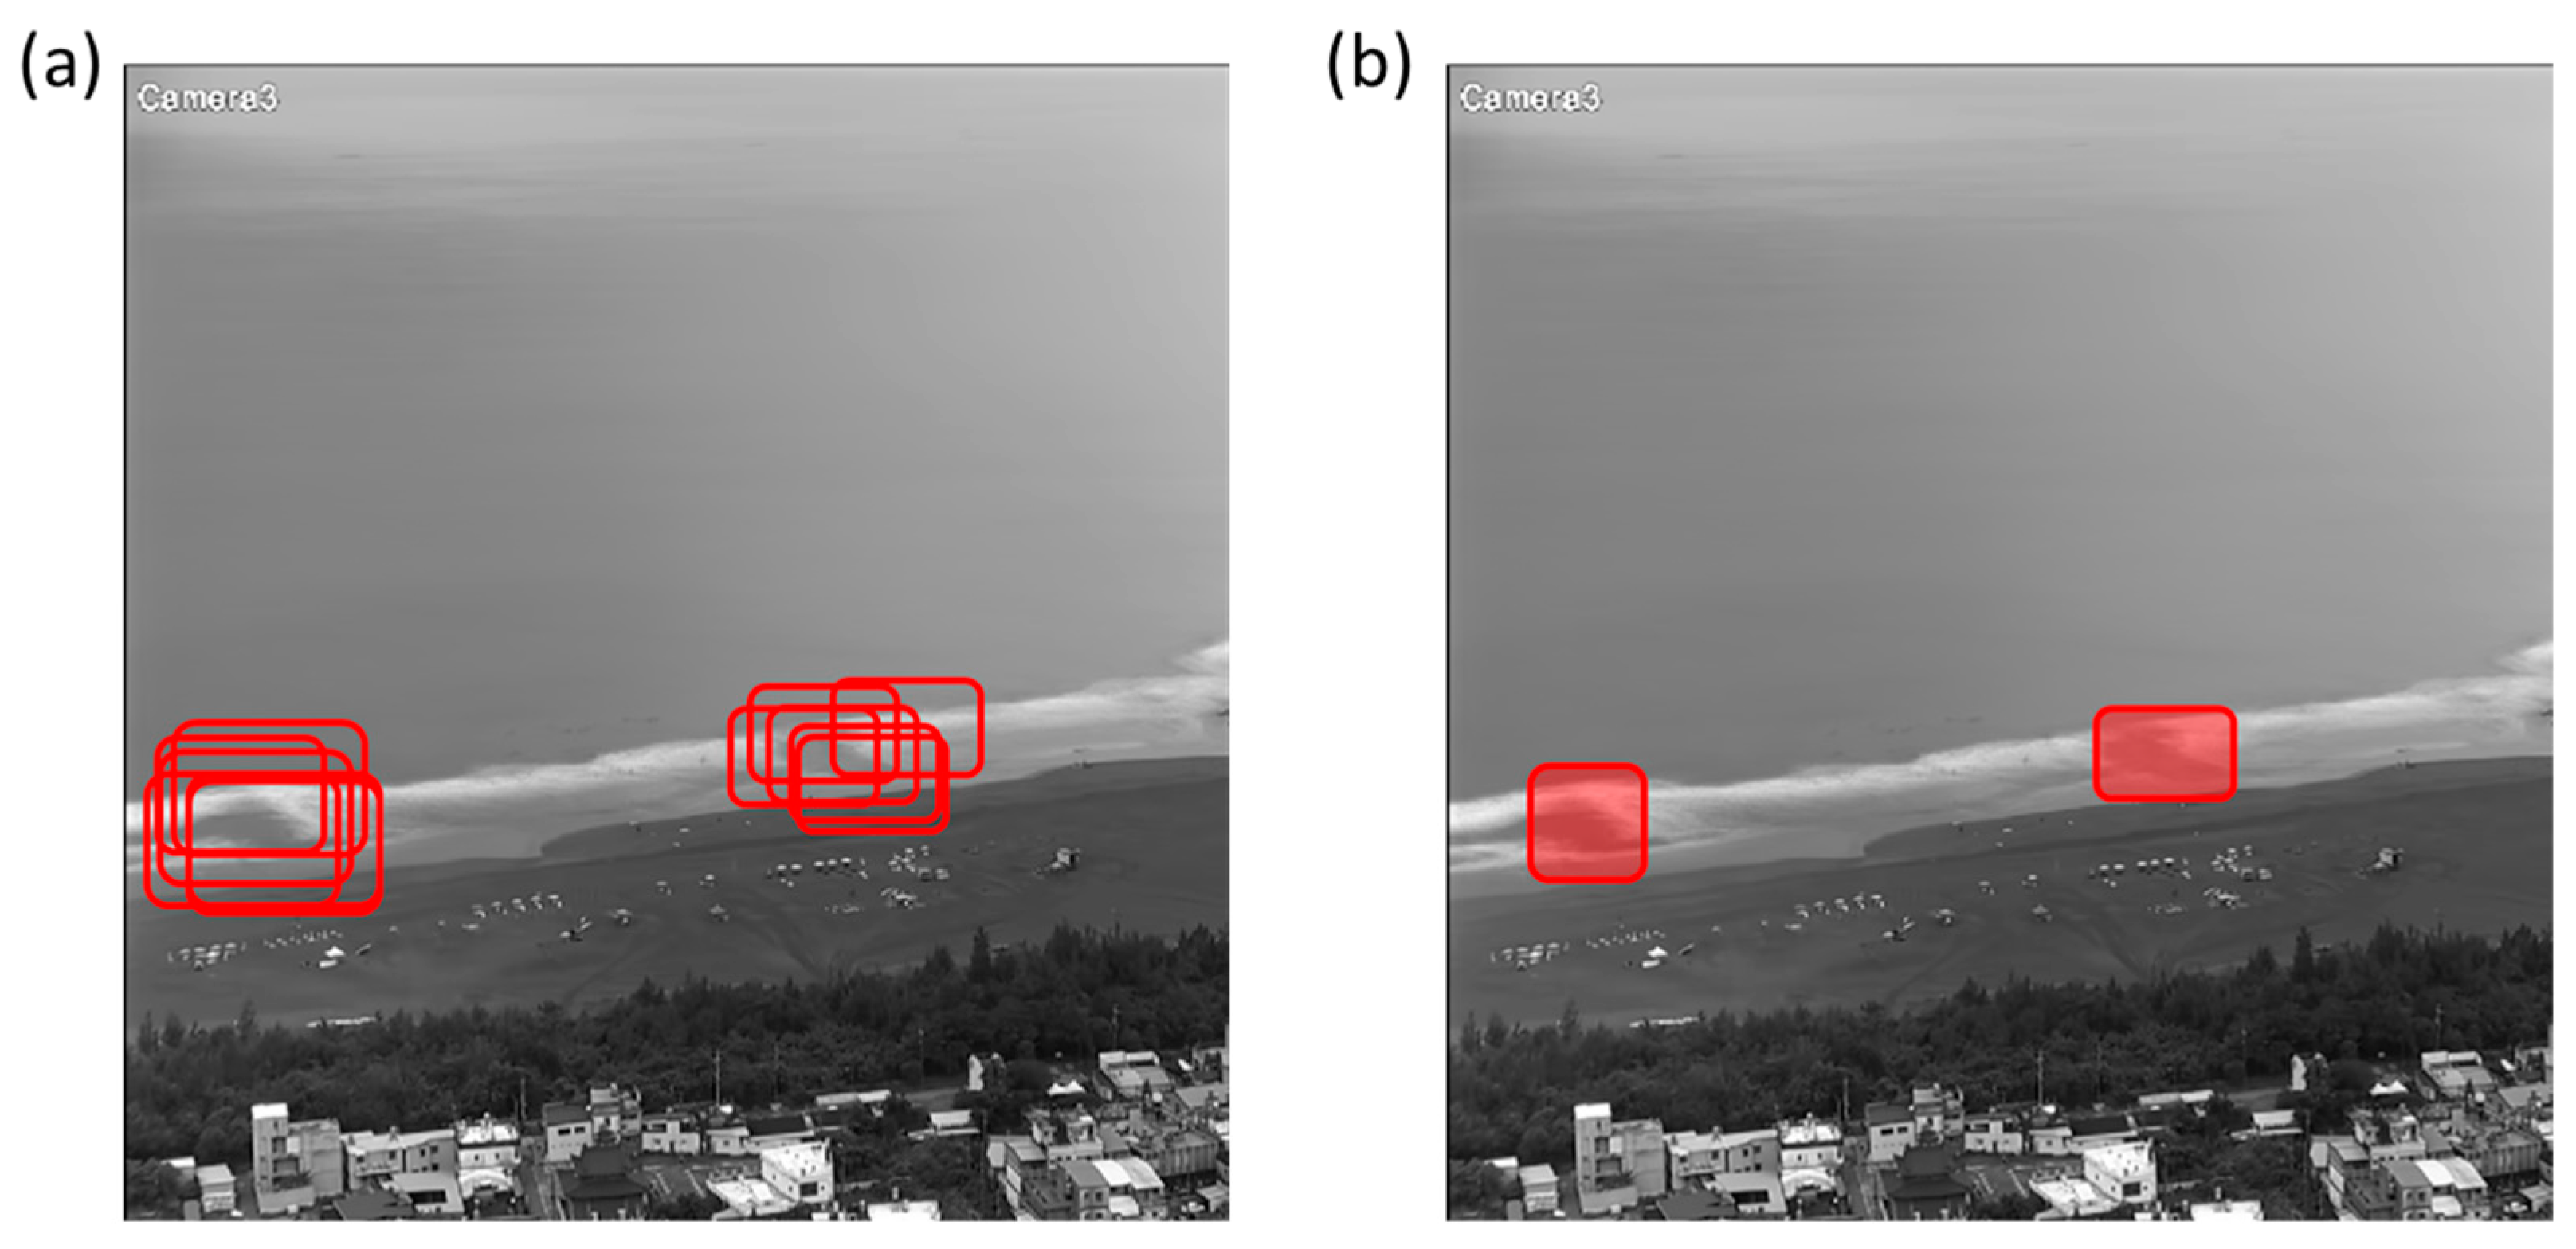
This method applies different processing approaches for satellite imagery and camera imagery. When applied to satellite images, the primary purpose of the frame aggregation method is to more accurately delineate the location of rip current occurrences. A cumulative buffer matrix with the same dimensions as the input image is used to record overlapping areas where the similarity between the mask and the wavelet-transformed image exceeds 80%. Each time such a region is detected, its corresponding pixel count (T) in the cumulative buffer is incremented by 1. If a total of N valid detections are recorded, the coverage ratio (T/N) can be calculated for each pixel in the cumulative buffer. When the pixel coverage ratio in a specific region reaches 0.8—meaning that 80% of the detected images indicate the same location—this region is identified as the primary rip current occurrence zone, as shown in Figure 5.
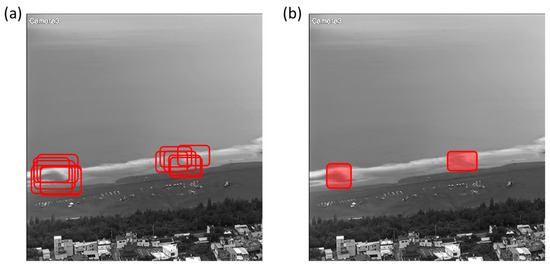
Figure 5.
The main locations of rip current occurrence within a certain period in a time-lapse video can be identified through the frame aggregation method. (a) The bounding boxes marking the boundaries of detected rip currents from individual frames of a video segment are superimposed onto the most recent frame. (b) A visualization of the resulting accumulation buffer values.
In camera image data, we similarly employ an accumulation buffer with the same size as the input frame to identify overlapping regions of detected bounding boxes. A temporal packet of the N average images is considered to build the accumulation buffer. The buffer increments by 1 for each region within a detection bounding box in each average images. From frame N onwards, the area covered by a detection bounding box increments by 1, capped at a maximum of N. Regions not covered by a detection bounding box are unchanged, with a minimum of 0 in the accumulation buffer. This sliding packet approach allows us to track the bounding boxes across N average images. The accumulated regions in the buffer, where the value is at least T, are used to draw the tightest possible axis-aligned bounding box around the area. This aggregated detection process helps identify a single bounding box from the collection of bounding boxes. Our implementation uses N = 10 and T = 8 for optimal results.
Finally, to satisfy the fifth criterion for rip current identification, when two rip current regions are detected simultaneously, the regions delineated by the frame aggregation method are used to calculate their respective centroids. Based on the image resolution and the pixel distance between the two centroids, the actual physical distance between the rip currents can be determined. If this distance exceeds 40 m, the two regions are considered independent rip currents. Otherwise, they are regarded as part of the same rip current channel.
3. Results and Discussions
The previous section outlined the development of a rip current detection method based on wavelet edge detection and packet convolution applied to optical images. To enhance the universality and accuracy of this approach, techniques such as image augmentation and frame aggregation are incorporated.
However, throughout the analysis process, the effectiveness of wavelet edge detection plays a pivotal role in the success or failure of shear flow interpretation. Therefore, this section evaluates the performance of wavelet edge detection across different decomposition levels and wavelet bases in capturing key features of wave breaking. Finally, a manual interpretation approach is employed to obtain the ground truth, and the accuracy of the rip current detection method is assessed using a confusion matrix.
3.1. Result of Wave Edge Transform
3.1.1. Number of Wavelet Edge Detection Overlays
The number of iterations in wavelet transform determines how often a signal decomposes into low-frequency and high-frequency components. Different iteration numbers extract signals from different spatial frequency domains in an image. With fewer iterations, edge detection focuses on larger scales, while more iterations capture finer details. In this study, the convolution method is used to measure the similarity between the original image and the mask. The goal is to detect fractured zone edges while preserving fracture characteristics. Three iteration numbers (1, 2, and 3) are tested to evaluate their impact on edge detection using wavelet transform.
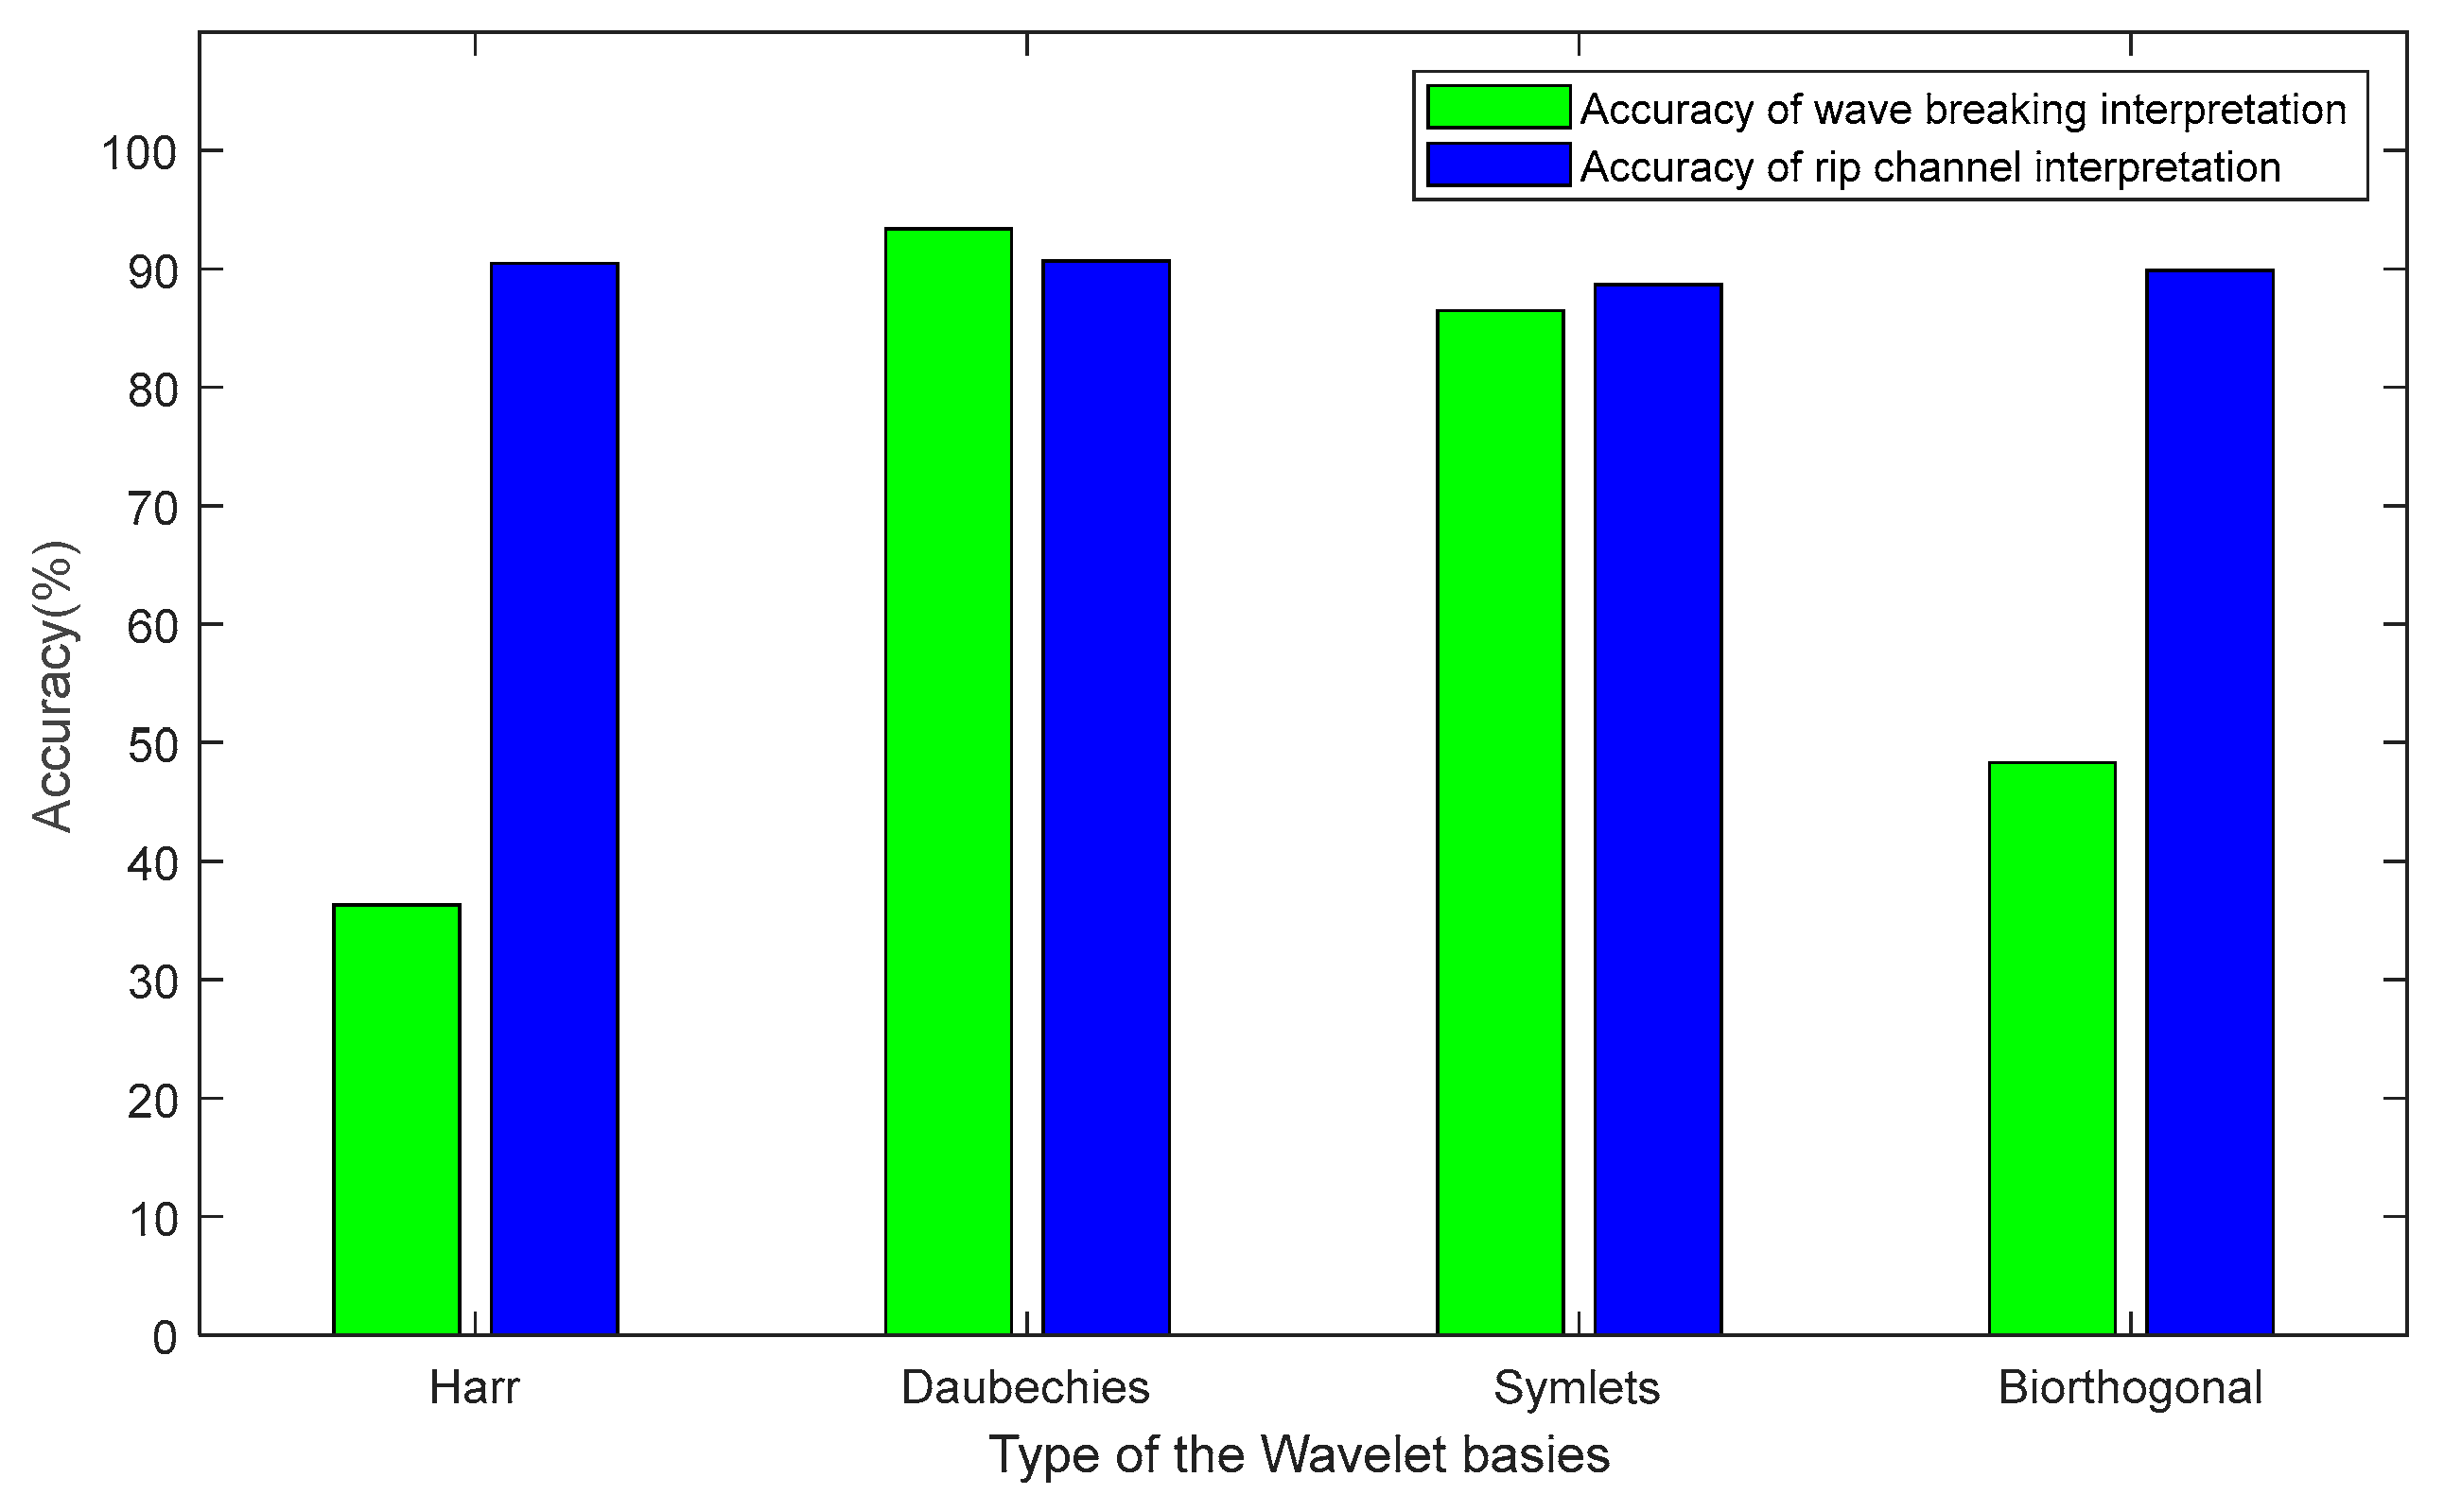
The results presented in Figure 6 show that one iteration detects fractured zone edges but overlooks fracture features, while three iterations introduce noise and compress fracture channels. The ground truth, determined manually by pixel positions, is used to calculate the success rates in interpreting fractured and non-fractured regions. Figure 7 show that the best results are obtained with two iterations, achieving success rates of 87.5% for wave-breaking interpretation and 89.4% for rip channel interpretation. One iteration performs poorly in detecting wave breaking (36.3% accuracy rate), and three iterations struggle with non-fractured zone detection (70.5% accuracy rate).

Figure 6.
Wavelet transform edge detection based on image edge detection at different decomposition levels ((a) one level; (b) two levels; (c) three levels). the case of one level, it has the same problem as traditional Sobel and Canny edge detection, ignoring too many features in the original image, while in the case of three levels, it receives too much high-frequency noise. Therefore, a two-level decomposition is performed when using the wavelet transform edge detection method.
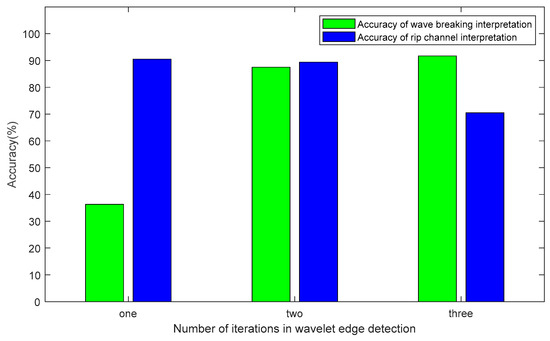
Figure 7.
Success rates of wavelet edge detection in interpreting wave breaking and rip channels under different numbers of iterations. Green represents the accuracy rate of wave-breaking interpretation, while blue represents the accuracy rate of rip channel interpretation.
3.1.2. Type of Wavelet Packet
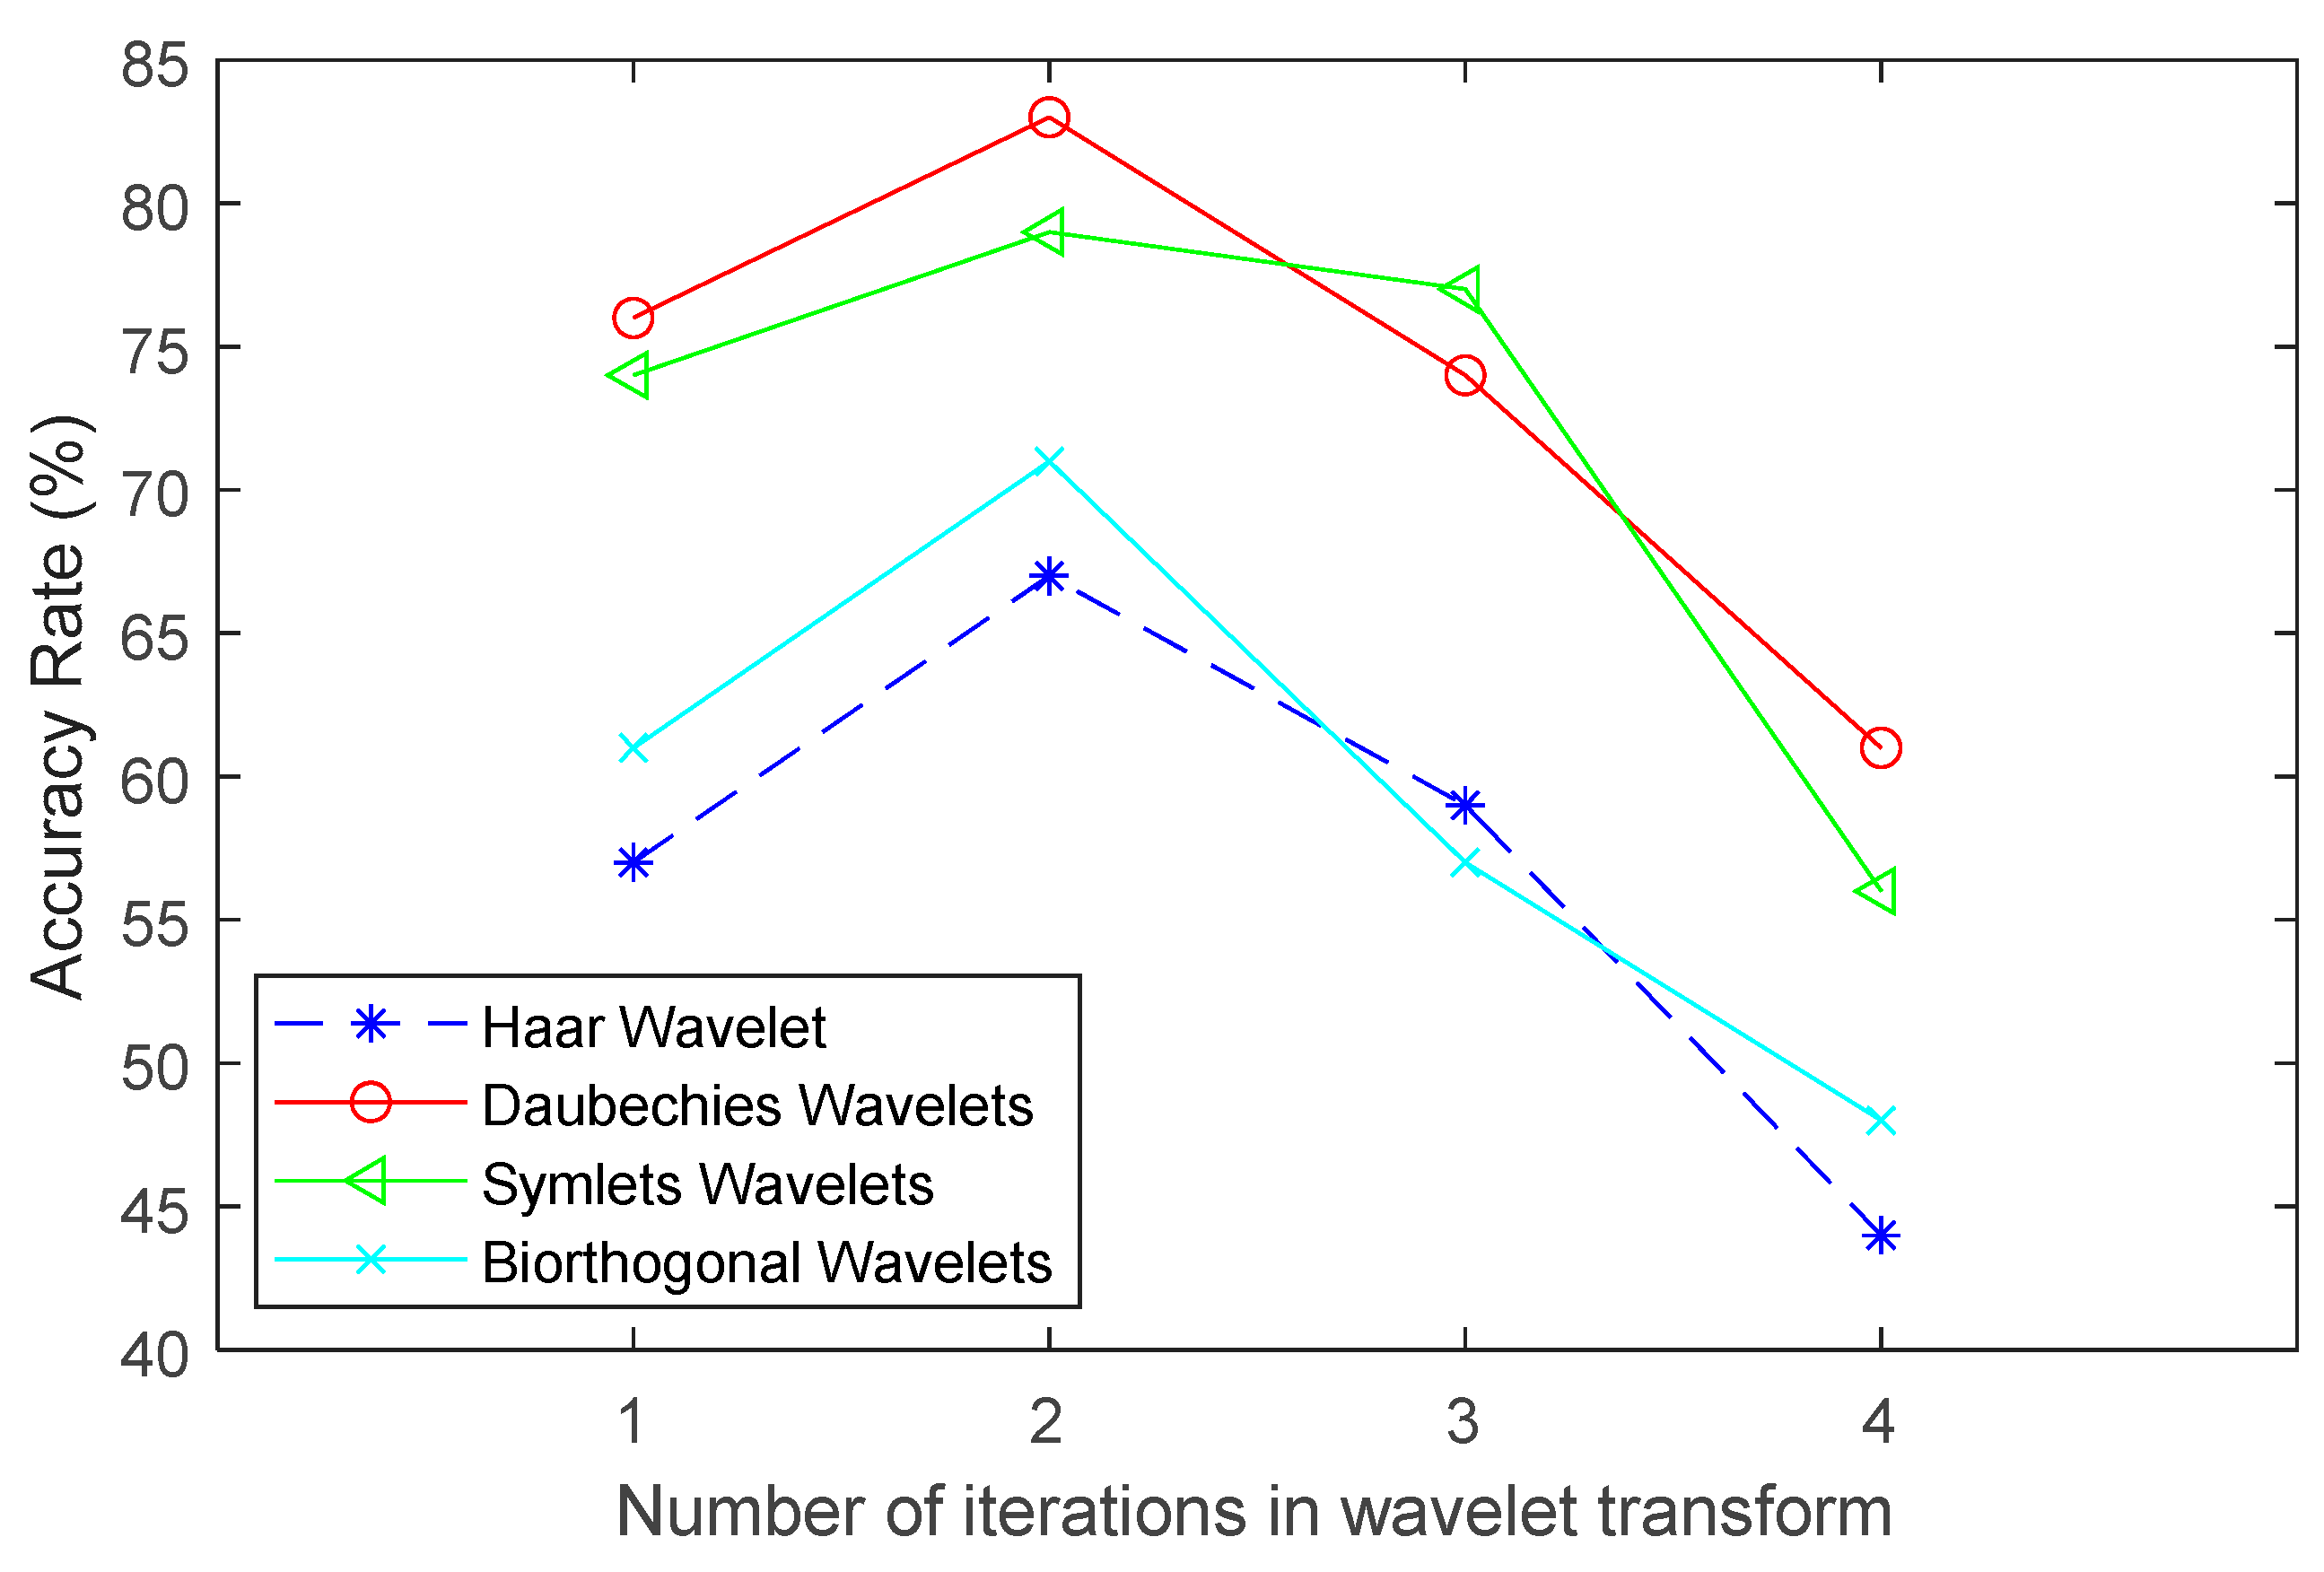
Wavelet transform uses a set of basis functions called wavelets to represent signals. Different basis functions provide different frequency, time, and spatial characteristics, making them suitable for various application domains and enabling flexible and precise signal analysis and processing capabilities [58]. There are four different wavelet bases implemented for image processing of optical images in this research, including Haar, Daubechies, Symlet, and biorthogonal wavelets. Following the approach outlined in the previous section, the interpretability of different wavelet bases for objects in the coastal wave-breaking zone was evaluated by comparing the results of manual interpretation and program analysis.
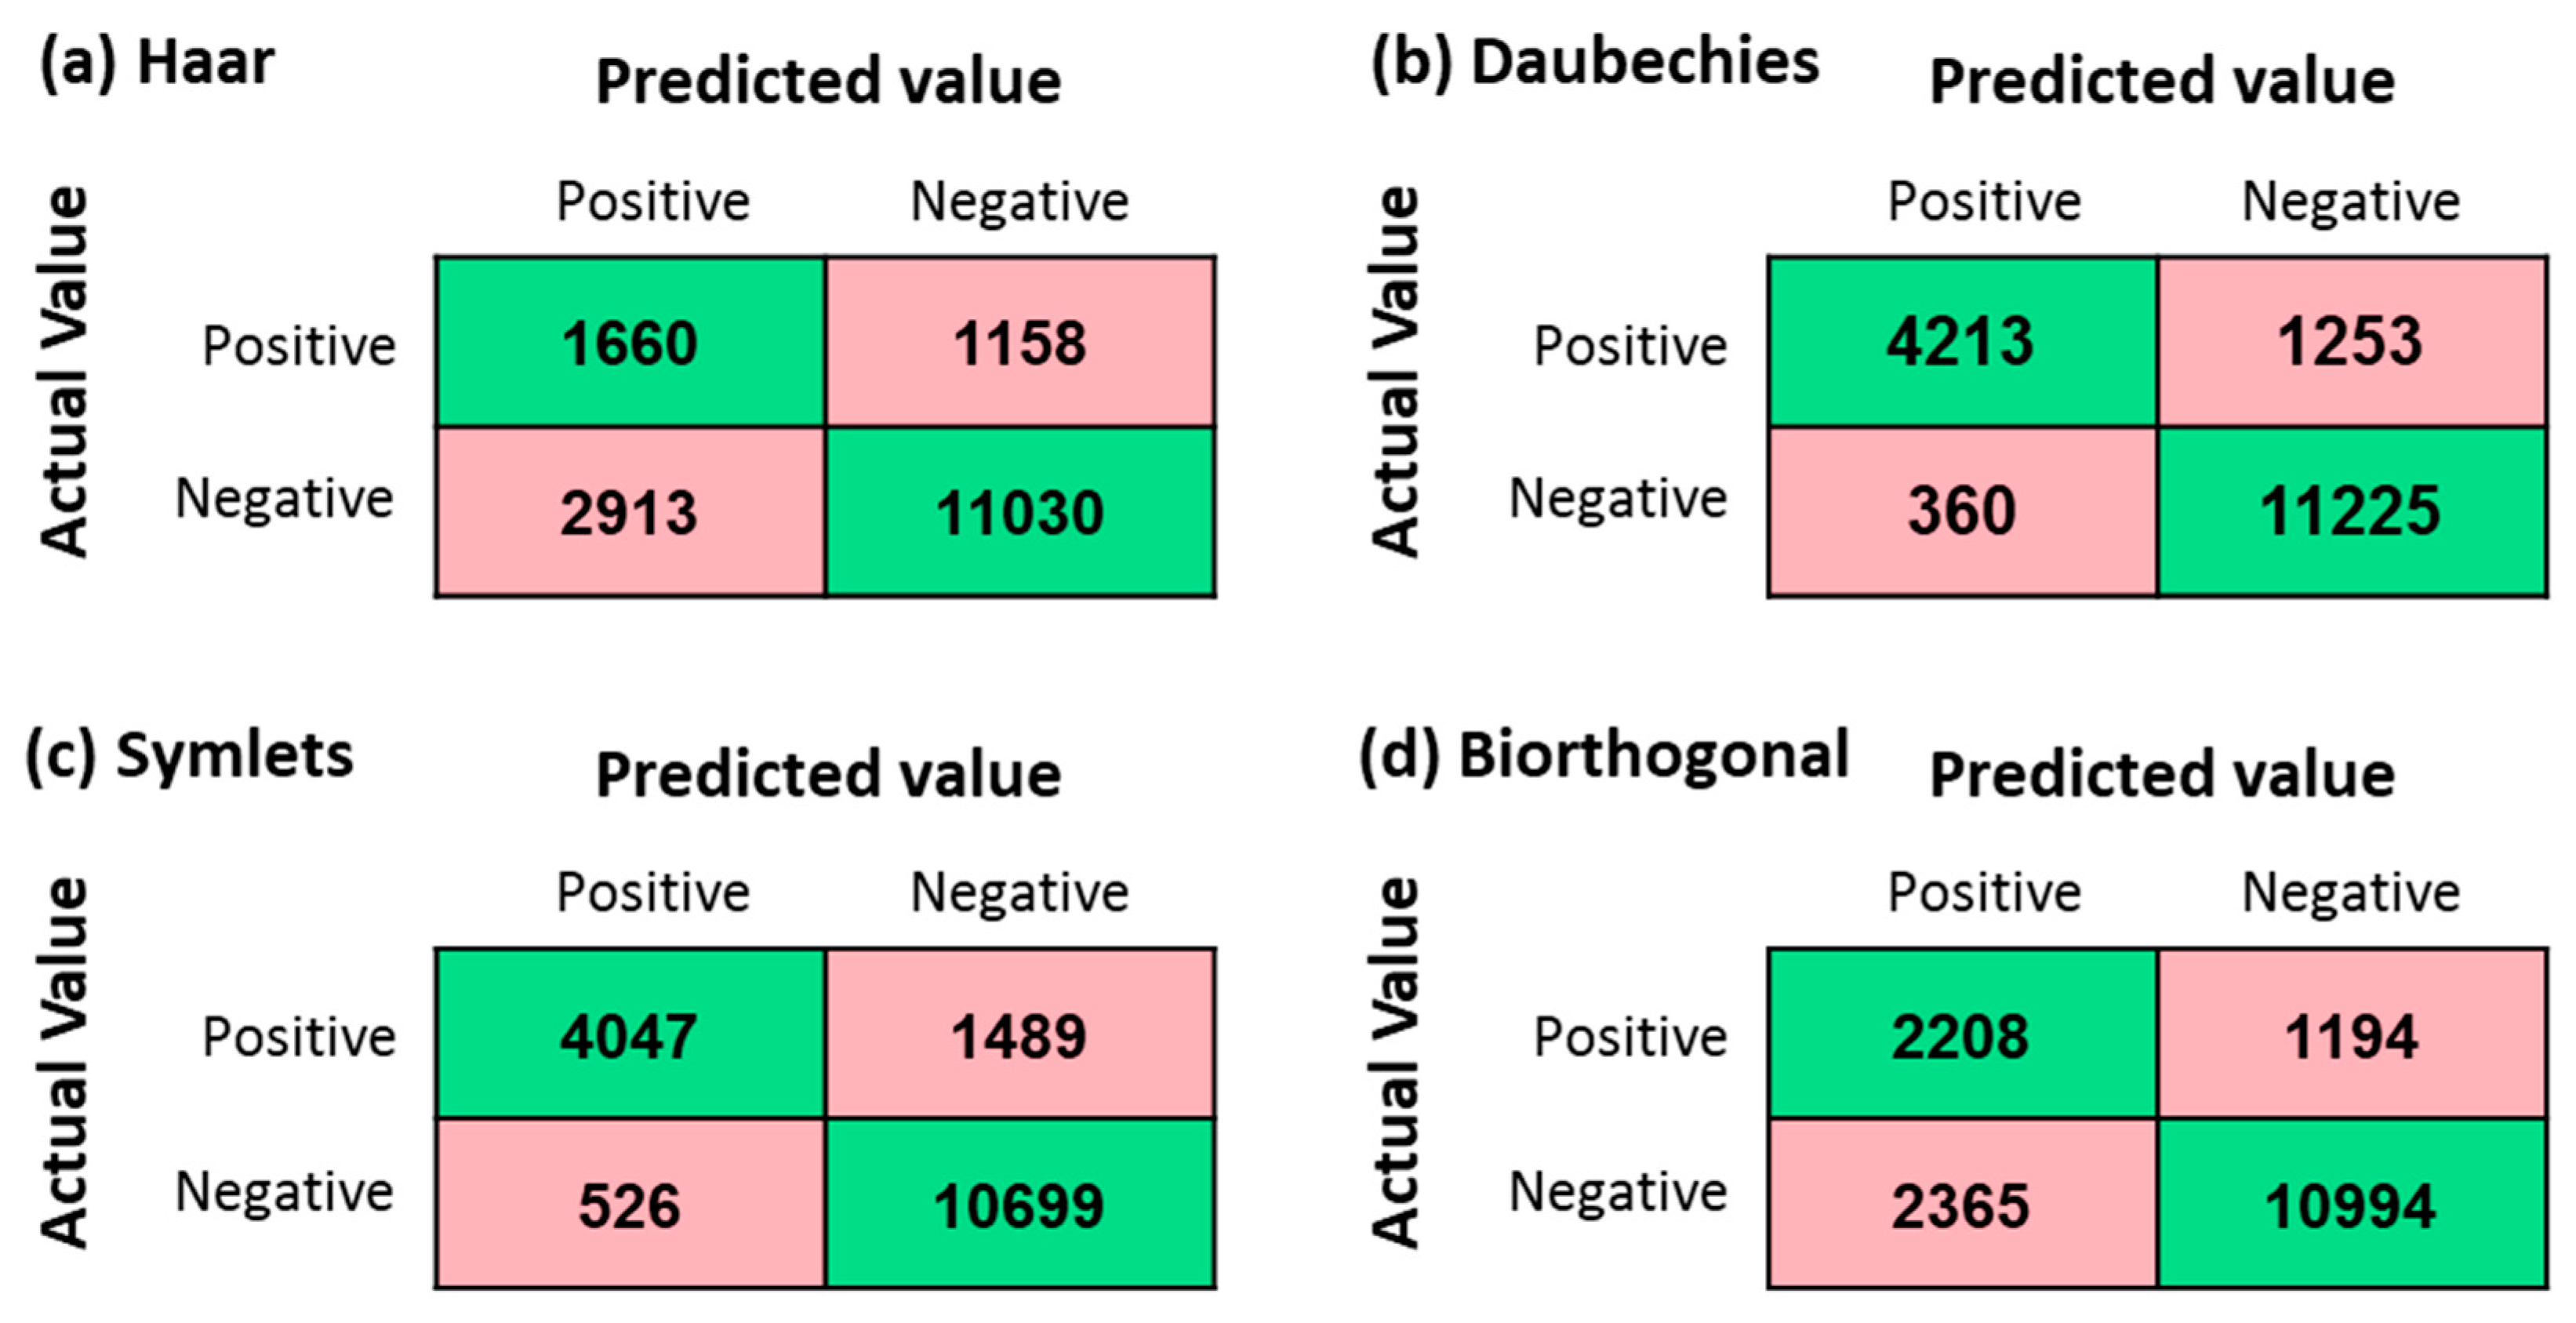
As shown in Figure 8, Figure 9 and Figure 10, to quantify the accuracy of wavelet-based edge detection in distinguishing between breaking waves and water bodies, this study first manually identified the number of pixels representing breaking waves and water in the image, which served as the ground truth. The number of breaking wave pixels was 4573, and the number of water body pixels was 12,188. Using four different wavelet bases, the numbers of pixels identified as breaking waves and water bodies were calculated. In this evaluation, breaking waves were defined as positive and water bodies as negative, and confusion matrices were used to calculate the classification accuracy for each category. According to the results from the confusion matrix, the Daubechies wavelet base achieved the best performance among all tested methods. Of the 4573 manually identified breaking wave pixels, 4213 were correctly detected, yielding an accuracy of 89.7%. Additionally, 11,225 out of 12,188 water pixels were correctly classified, resulting in a water detection accuracy of 92.1%.
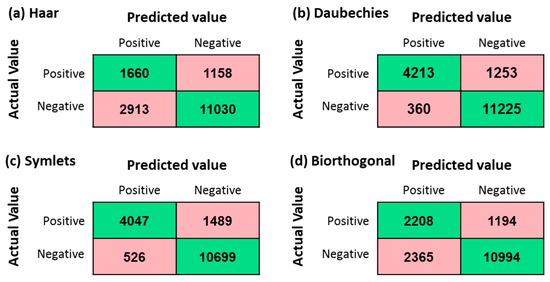
Figure 8.
Edge detection of breaking waves using different wavelet bases and the resulting confusion matrix distinguishing between breaking waves and water. The ground-truth pixel counts identified through manual interpretation were 4573 for breaking waves and 12,188 for water. In this context, “Positive” refers to breaking waves, while “Negative” refers to water. (a) Haar; (b) Daubechies; (c) Symlet; (d) biorthogonal.
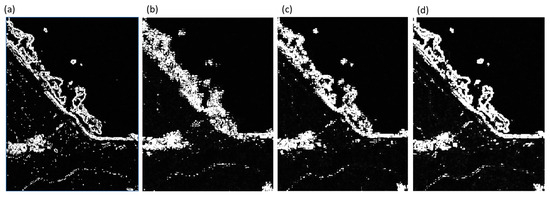
Figure 9.
Images are transformed using different wavelet bases. (a) Haar wavelet; (b) Daubechies wavelet; (c) Symlet wavelet; (d) biorthogonal wavelet.

Figure 10.
Success rates of wavelet edge detection in interpreting wave breaking and rip channels with different types of wavelet bases. Green represents the accuracy rate of wave-breaking interpretation, while blue represents the accuracy rate of rip channel interpretation).
The results of the Haar wavelet transform, despite performing well for rip channel interpretation, ignore most of the breaking wave information. The same situation applies to the biorthogonal wavelet transform. The success rate for interpreting breaking waves with Haar and biorthogonal wavelet bases is about 70%. The results of Symlet wavelet transform are slightly inferior to those of Daubechies wavelet transform.
The mathematical properties of each wavelet basis can explain the differences in detection performance. The Haar wavelet is the simplest orthogonal wavelet. Although its mother wavelet has strong edge detection capabilities, it is a first-order discontinuous function and possesses only one vanishing moment (as shown in Equation (9)). This limits its ability to capture the continuous and fine textures of white foam in the breaking wave zone. The biorthogonal wavelet, on the other hand, offers symmetry and employs dual filter banks to support perfect reconstruction, with separate wavelet and scaling functions used for decomposition and reconstruction. However, this structure results in a wider spatial support, which reduces its ability to resolve high-frequency and localized variations—such as those found in breaking waves. In contrast, the Daubechies wavelet has higher-order vanishing moments, meaning it can analyze higher-order powers of the spatial variable, as described in Equation (10). It also features compact support and good regularity, which enable it to simultaneously resolve both local edges and overall textures through multi-scale analysis. This provides strong spatial localization capability, making it particularly effective for handling the various sizes and patterns of white foam in surf zones. The Symlet wavelet is a symmetrized version of the Daubechies wavelet, designed to achieve filter coefficients closer to the linear phase. While this improves image smoothness, it also reduces sensitivity to texture, resulting in slightly lower edge detection performance compared to the original Daubechies wavelet.
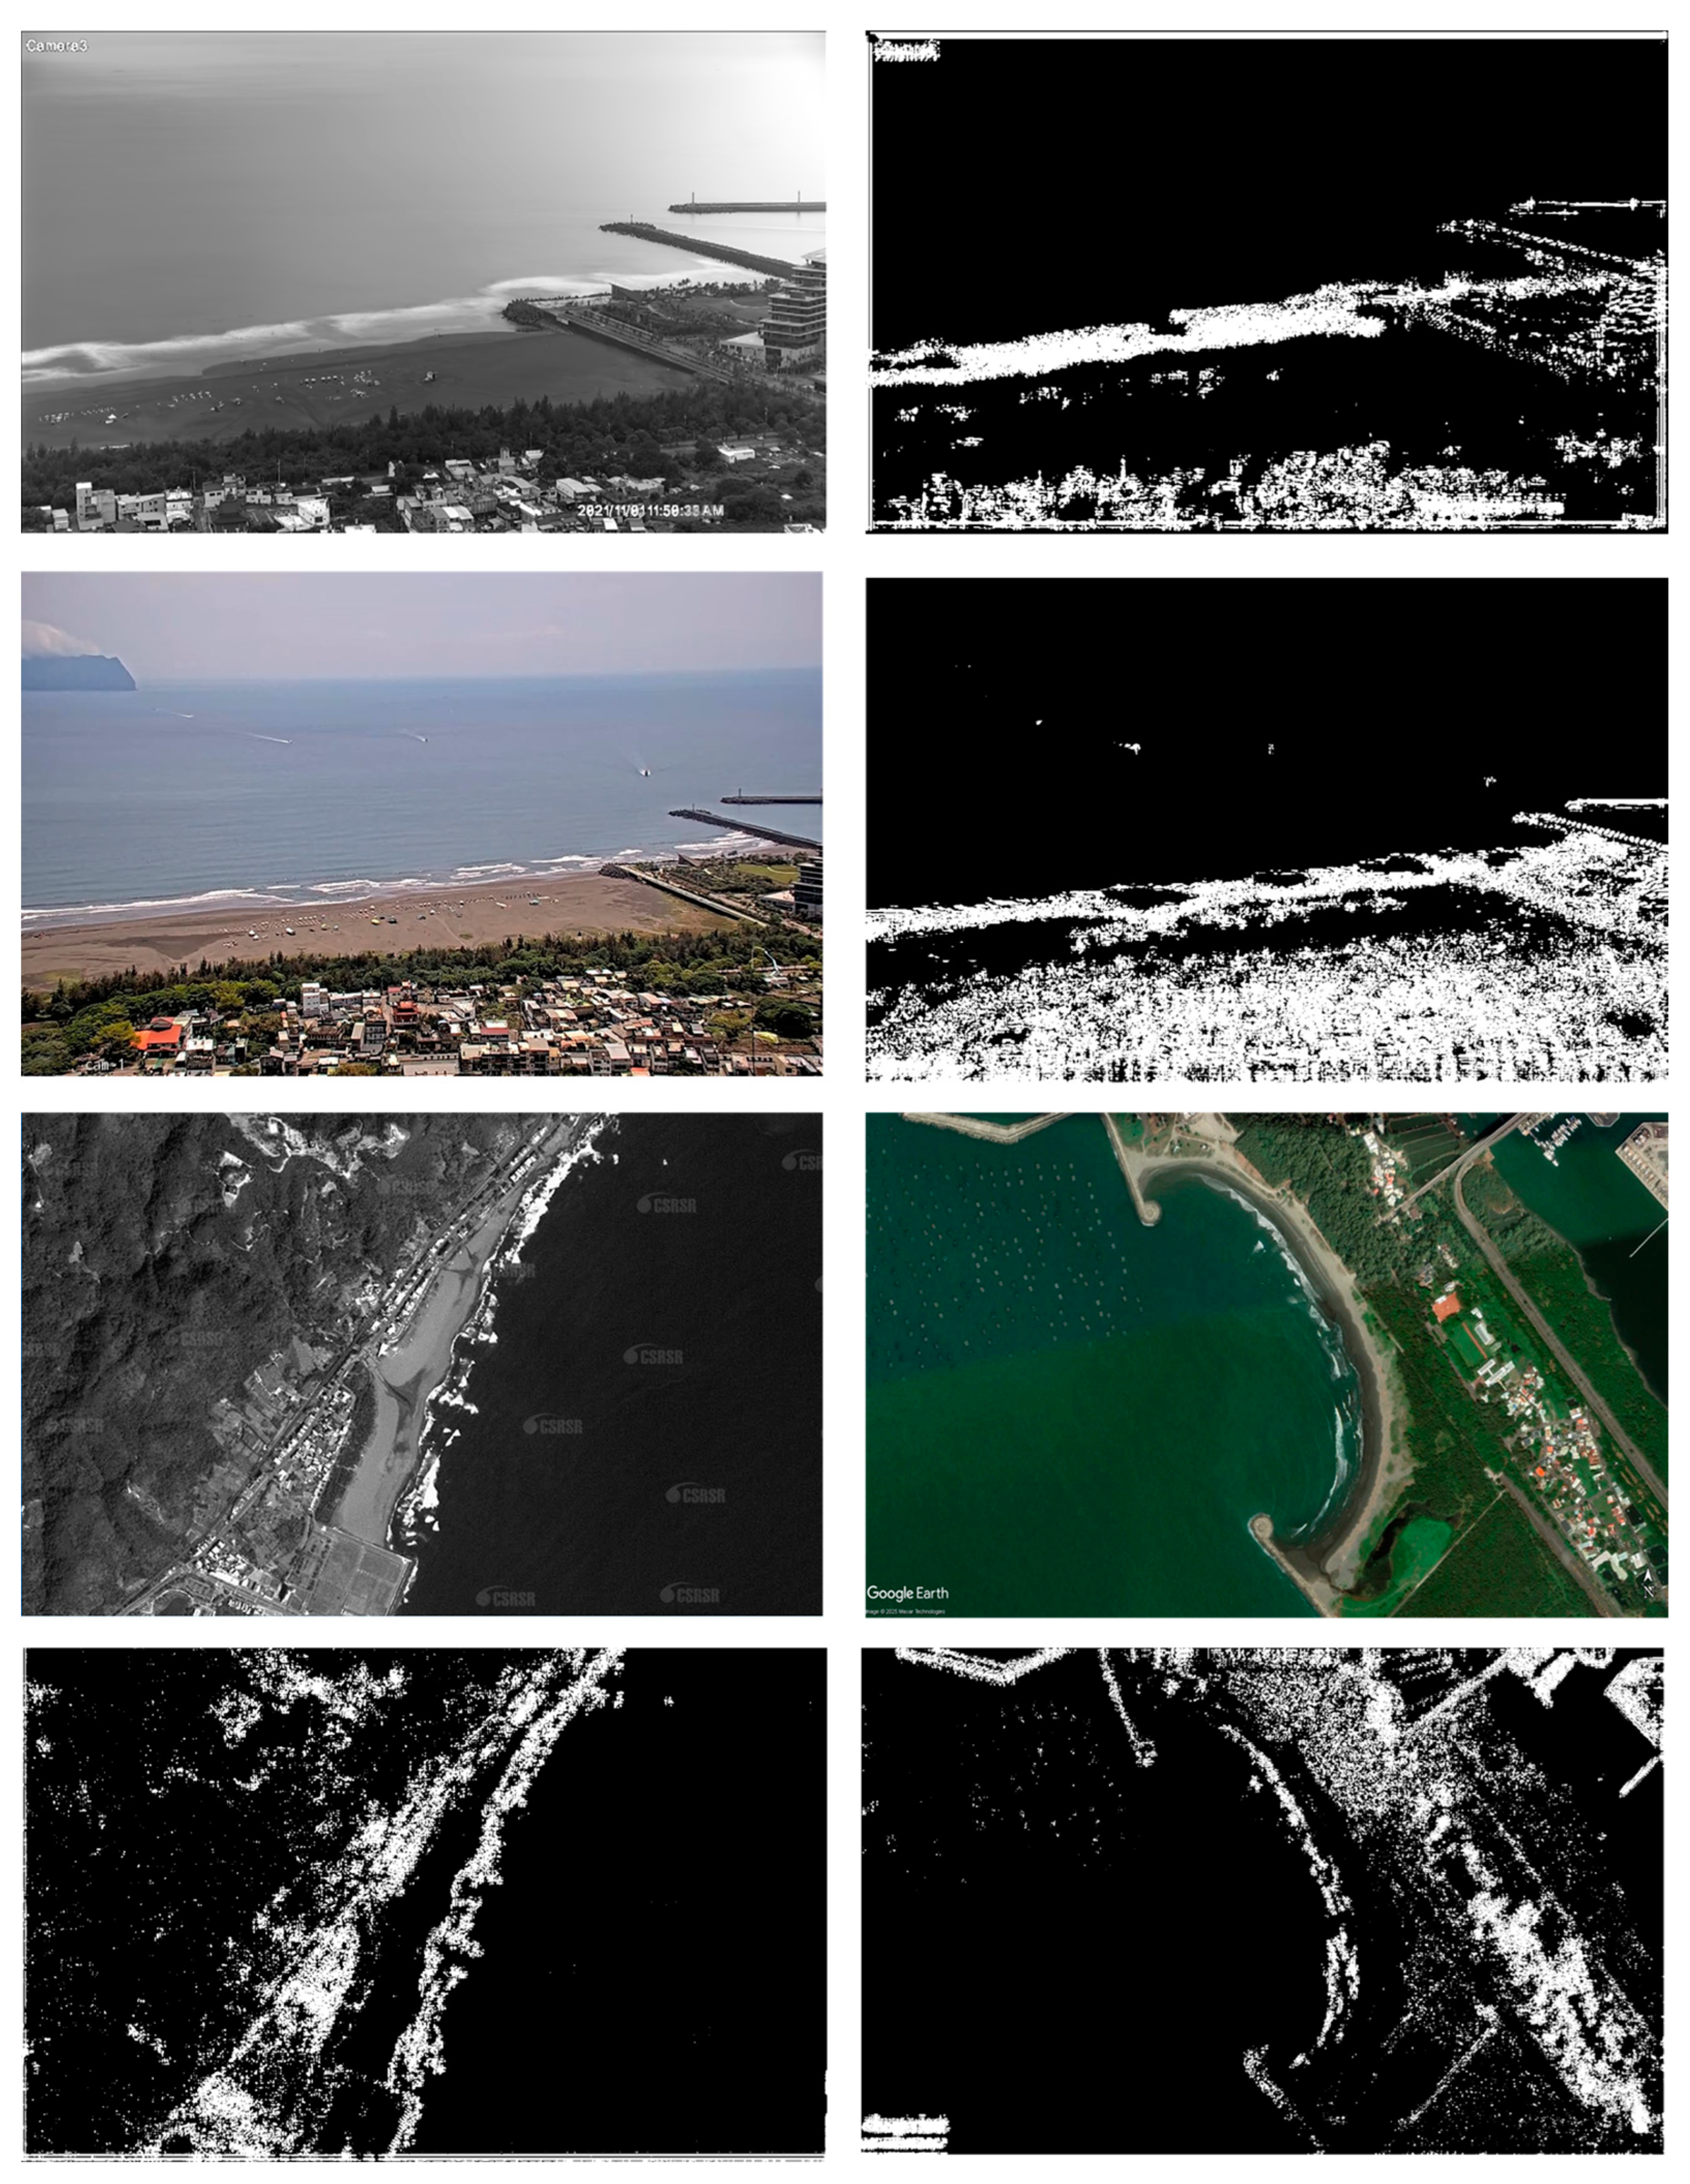
As shown by the results presented in Figure 11, using Daubechies as the wavelet basis effectively enhances the pixel-level distinction between breaking waves and water bodies in coastal imagery. This method can be applied across various types of image data, including temporally averaged camera images, original RGB camera images, CSRSR satellite imagery, and Google Earth satellite imagery. Moreover, the approach remains robust under different coastal morphologies—such as sandy beaches, rocky shores, seawalls, and bays—and is not significantly affected by environmental variations, demonstrating strong and consistent detection performance. In summary, using a double iteration of Daubechies wavelet transform provides the most accurate extraction of information in wave-breaking and rip channels.
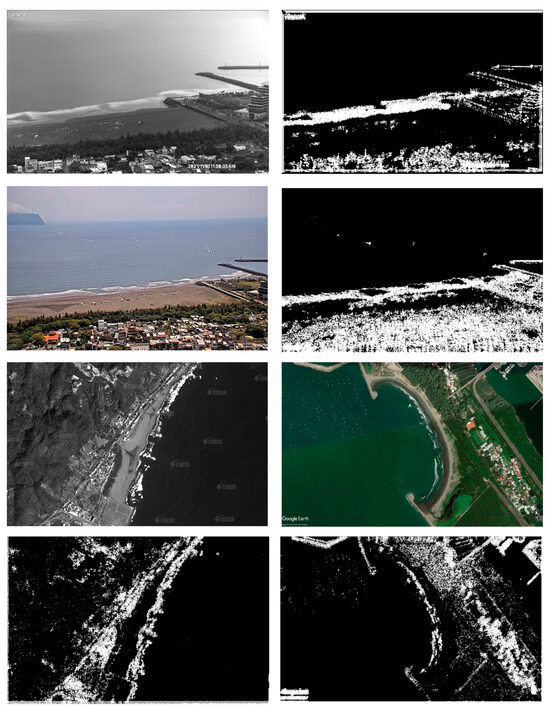
Figure 11.
Using wavelet edge detection based on the Daubechies algorithm as the wavelet basis, the image contrast between breaking waves and surrounding water in the nearshore surf zone is enhanced. In the upper part of the figure, from left to right, are the time-averaged camera image, the original camera image, the CSRSR satellite image, and the Google Earth satellite image. The lower part shows the corresponding results after applying wavelet edge detection to each of the images above.
3.2. Result of Rip Current Image Convolution
3.2.1. Rip Current Image Recognition Verification
Based on the tests presented in the previous section, applying wavelet transform using the Daubechies wavelet basis to coastal imagery effectively enhances the pixel intensity contrast between breaking waves and water bodies. To evaluate the accuracy of image convolution in detecting rip currents, a confusion matrix used to analyze the program’s ability that detects rip current locations was assessed based on accuracy, recall, and precision rates.
Using the confusion matrix, detection results were classified into four categories: successful detection of images with rip currents (True Positive, TP), successful detection of images without rip currents (True Negative, TN), erroneous detection of images with rip currents (False Positive, FP), and erroneous detection of images without rip currents (False Negative, FN). The accuracy rate measures the proportion of correctly detected images out of all images (TP + TN/TP + TN + FP + FN). The recall rate measures the proportion of actual rip current occurrences correctly detected among the images detected as having rip currents (TP/TP + FP), and the precision rate measures the proportion of rip current occurrences correctly detected among the actual occurrences (TP/TP + FN). Validation data comprised 100 images with rip currents and 100 images without rip currents, all of which were manually selected.
Analysis of different combinations of iterations and wavelet bases revealed that the two-layer iteration of the Daubechies wavelet with convolution achieved the highest performance in interpreting rip currents, with an accuracy of 83.0%. The results also indicated recall and precision rates above 80%, as shown in Figure 12 and Table 1. This indicates that better distinguishing the features of wave-breaking zones and shear flow channels during image processing significantly impacts the subsequent image convolution. Although the recall rate was relatively lower, suggesting some false positives (images without rip currents incorrectly interpreted as having rip currents), the recall rate reached 86.0%. The program successfully interpreted the majority of images with actual occurrences of rip currents. Given the hazardous nature of rip currents, it is preferable to have a higher false-positive rate than to risk missing rip current detections.
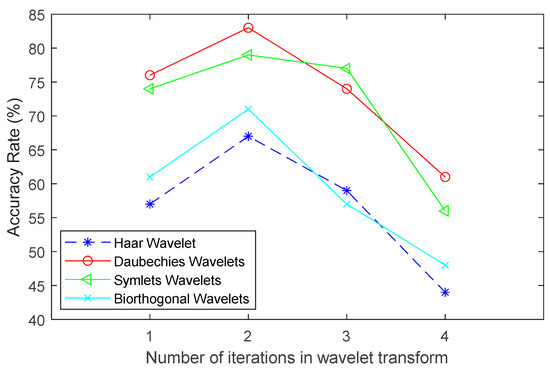
Figure 12.
Accuracy of rip current image interpretation program using different wavelet bases at different levels.

Table 1.
Confusion matrix showing all possible conditions between the rip current detection results and the actual simulation.
3.2.2. Observational Results from Imagery
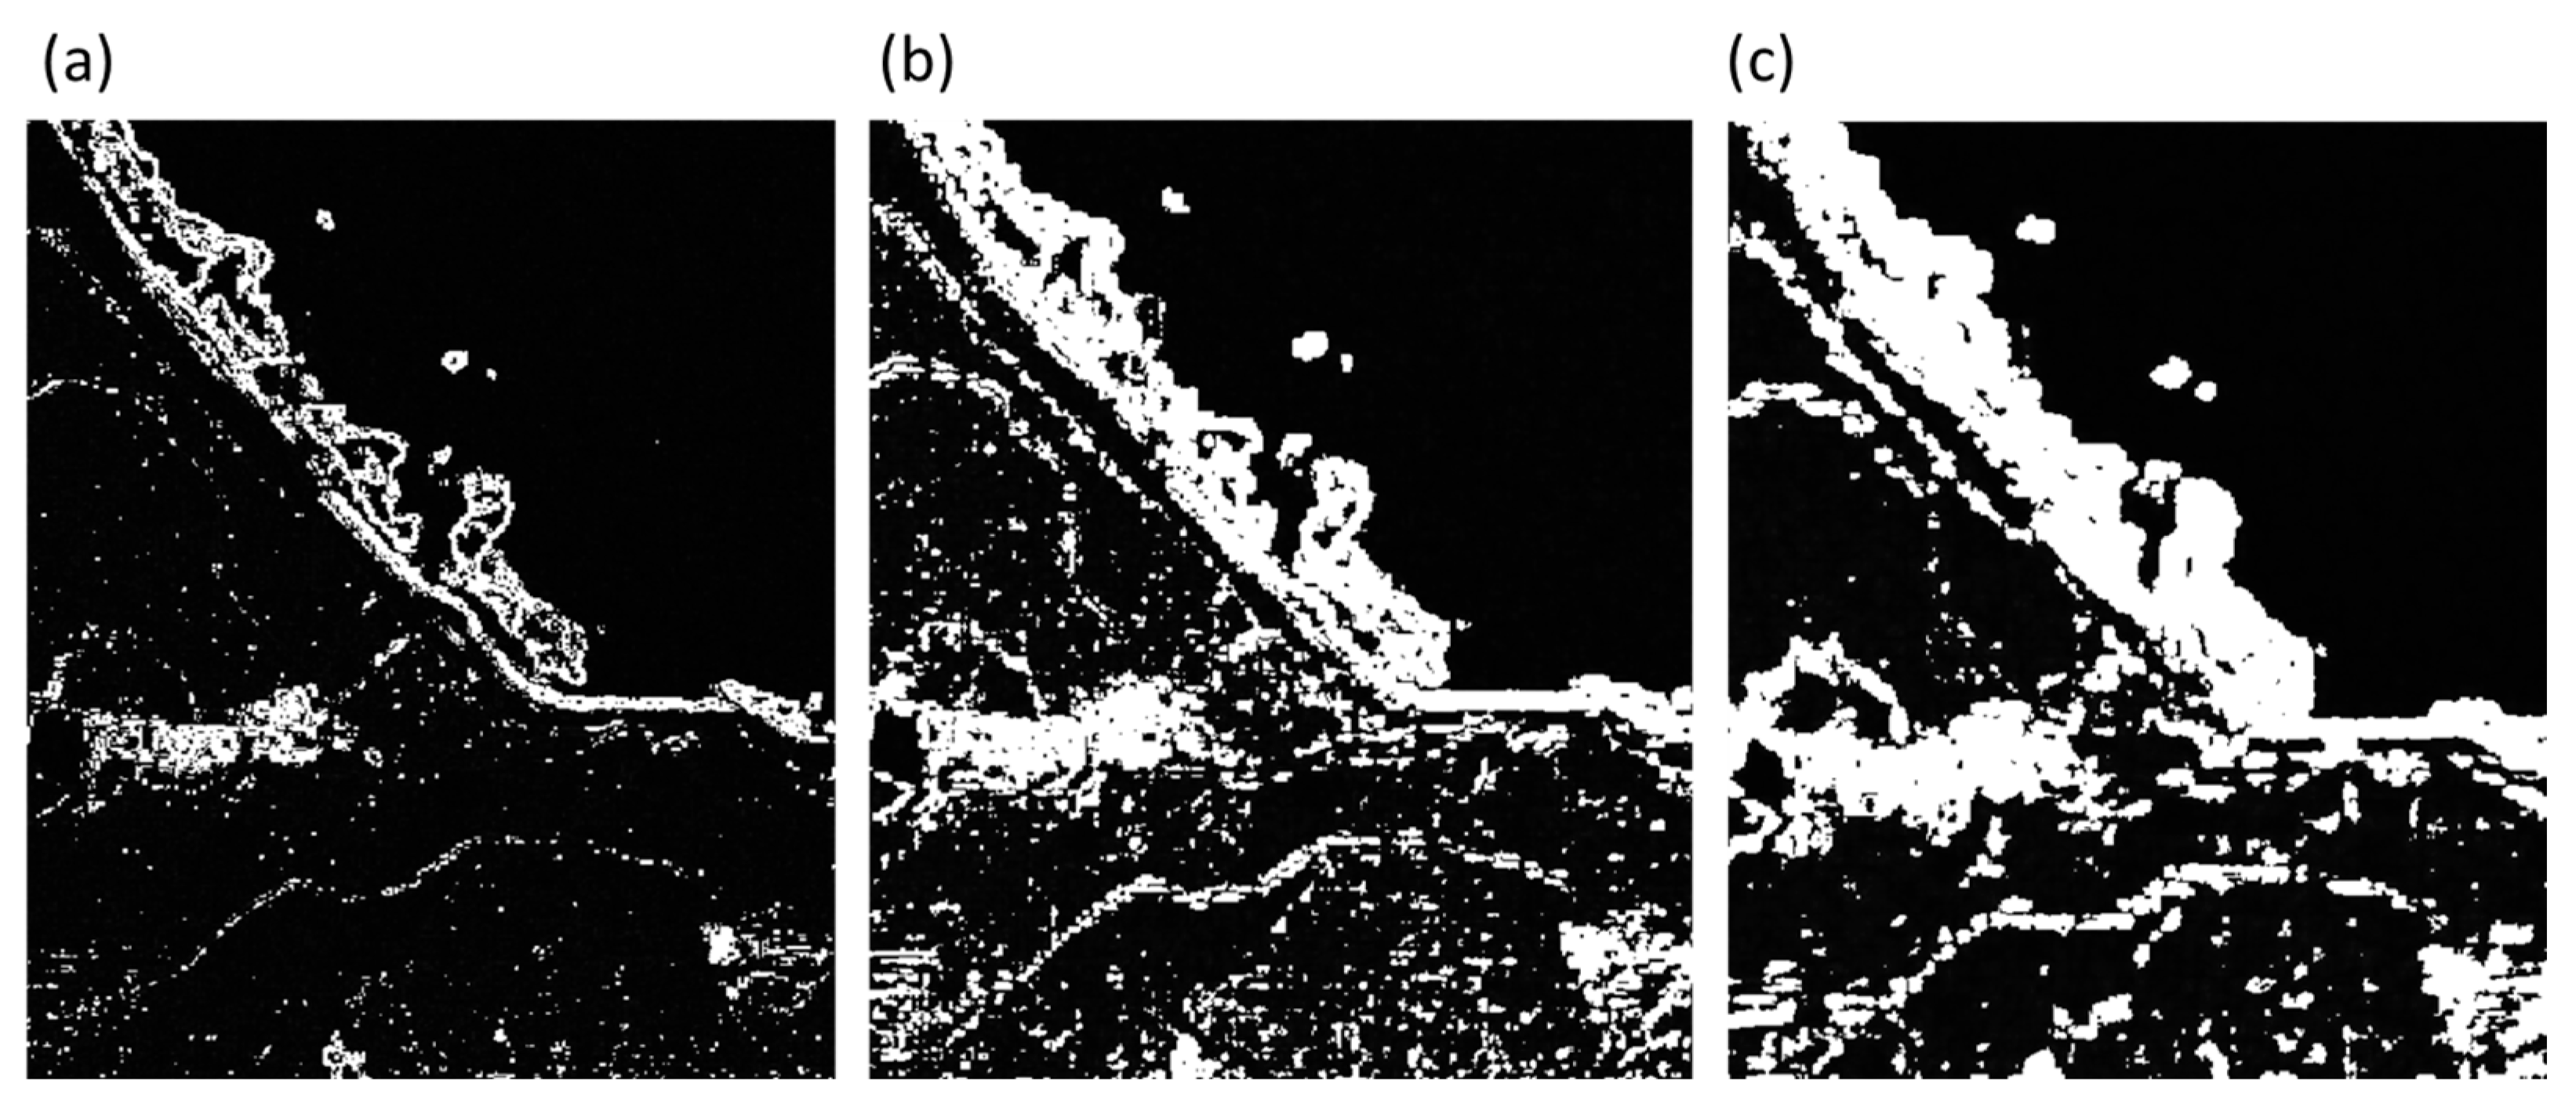
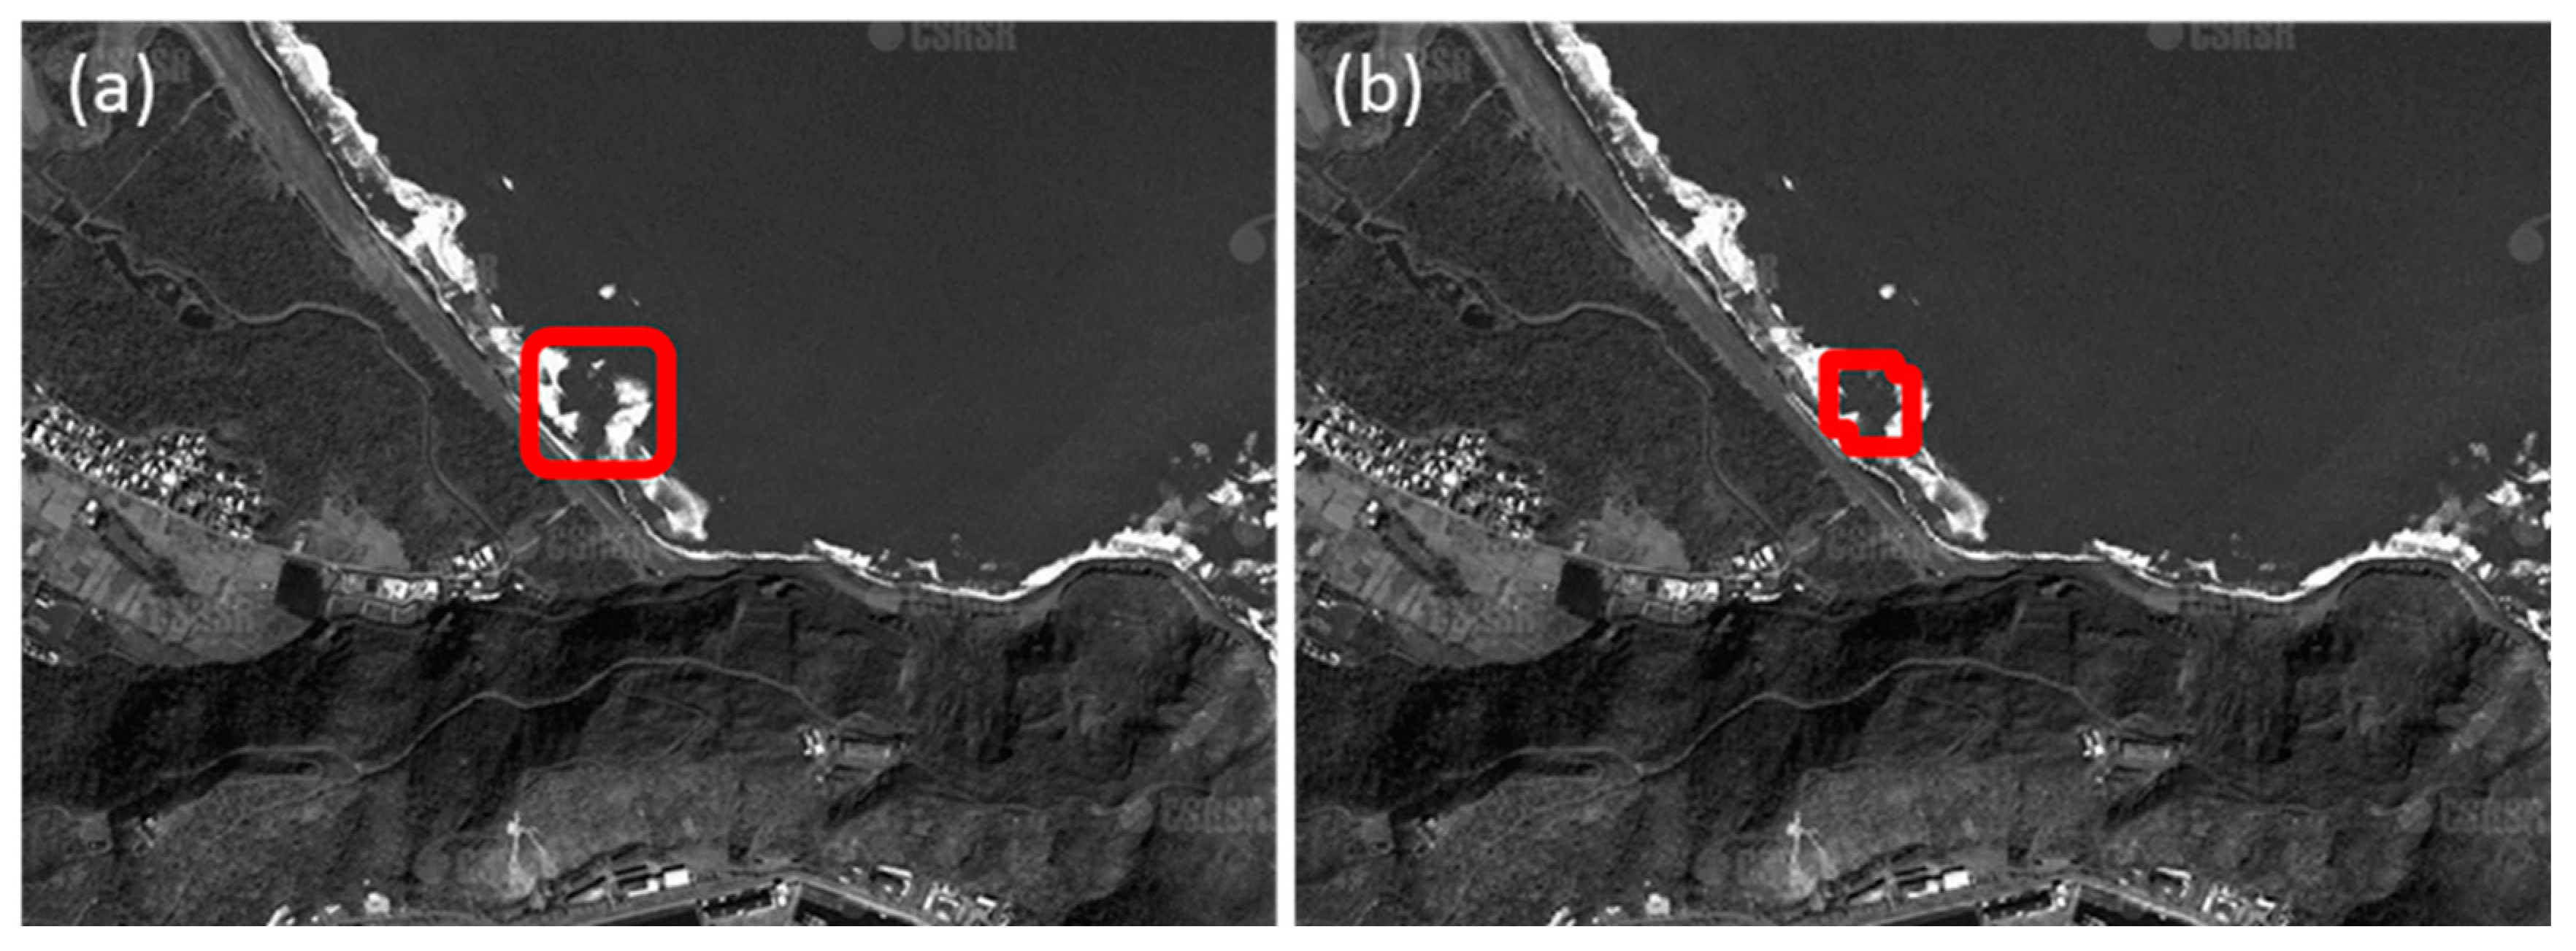
In addition to validating the system’s ability to detect the presence of rip currents, this project also analyzed the accuracy of location detection. Due to the use of the frame aggregation method in this study, the identified rip current locations can be precisely bounded, effectively outlining the rip current channels. As shown in Figure 13, when the frame aggregation method is not applied, the size of the bounding box used to indicate the rip current location is directly determined by the scale of the augmented rip current mask. As a result, the identified area often fails to accurately correspond to the actual rip current channel (Figure 13a). In contrast, when the rip current location is determined through the frame aggregation method—whether through spatial aggregation in satellite imagery or temporal averaging in video frames—the bounding box more accurately reflects the main rip current channel (Figure 13b).
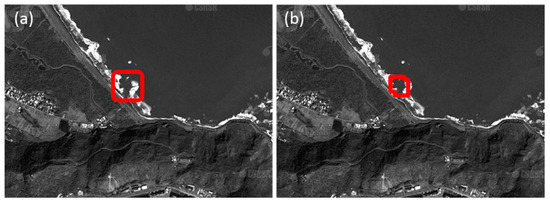
Figure 13.
Comparison of accuracy differences in rip current region detection using frame aggregation. (a) The rip current detection result without frame aggregation identifies the occurrence location based on the size of the rip current mask; however, the bounding box does not align well with the edges of the rip channel. (b) The result using frame aggregation provides a more accurate bounding box that closely fits the rip channel boundaries.
To further demonstrate the generalizability of the proposed automated rip current image recognition technique, six diverse image samples were selected. In Figure 14, the left column presents results from satellite imagery (Figure 14a,c,e), covering three different beach types: a long, straight beach (Figure 14a); a beach adjacent to a seawall (Figure 14c); and a bay-shaped beach (Figure 14e). The right column presents rip current detection results from three cameras installed at the Waiou monitoring station (Figure 14b,d,f). The proposed method demonstrates high adaptability across various image formats and environmental conditions, showing consistent performance, even when camera viewing angles, coverage areas, and focal lengths differ. This confirms the robustness and generalizability of the proposed technique.
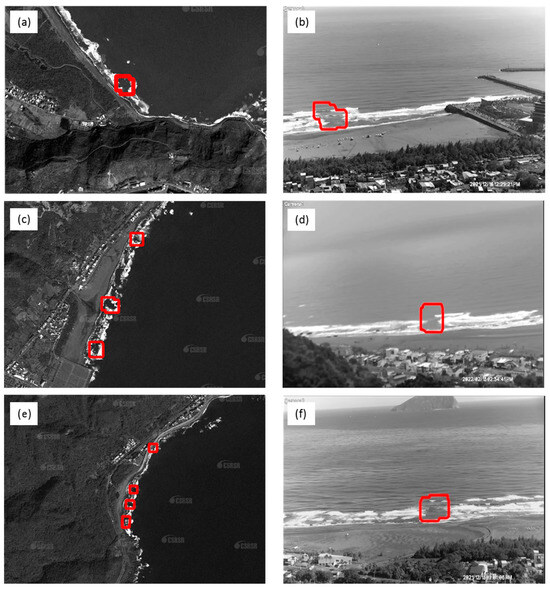
Figure 14.
Rip current detections in optical images. Red bounding boxes show correctly detected rip currents. (a) Long, straight beach; (c) beach adjacent to a jetty; (e) embayed beach. The left half shows the interpretation results from satellite imagery, while the right half presents the monitoring results from the Waiou observation station, captured by the south, north, and central cameras, respectively: (b) southern Waiou beach; (d) northern Waiou beach; (f) central Waiou beach.
Furthermore, based on prior studies and practical experience, combining this method with long-term, wide-area surveillance from shore-based cameras—which are capable of continuous image capture—can greatly reduce the labor cost associated with manual image interpretation. Since the entire detection process is automated based on the five proposed criteria, the technique also helps minimize errors resulting from subjective human judgment.
4. Conclusions
In this research, we propose a program for interpreting rip currents from images. Five criteria for rip currents on images are also proposed based on the literature and experience. The core concepts of the interpretation method involve wavelet edge detection and image convolution. The wavelet edge detection method can enhance regions of breaking waves, and image convolution can interpret the locations of rip currents in images. To increase the generality and accuracy of the image interpretation results, three techniques are used: image augmentation, image averaging, and frame aggregation. Image augmentation involves rotation, distortion, scaling, noise addition, and extension. Image averaging and frame aggregation involve image averaging every minute and frame aggregation (N = 10) every ten minutes, with rip current coverage exceeding 80% (T = 8).
However, there are significant differences in the results of signal extraction from images when using different numbers of iterations and various types of wavelet bases. We experimented with four iterations and four different types of wavelet bases for the wavelet edge detection method. The results show that two iterations yielded the best results, with an overall interpretation success rate of 88.3% when compared to manually interpreted results. Therefore, four wavelet bases were experimented with, including Haar, Daubechies, Symlet, and biorthogonal wavelet bases. The results indicate that the Haar and biorthogonal wavelets yielded similar outcomes, both failing to capture most of the breaking wave features in the imagery. In contrast, the Daubechies and Symlet wavelets performed well in identifying both breaking waves and rip current channels. Among these, the Daubechies wavelet—characterized by high-order vanishing moments and relatively asymmetric properties—demonstrated the best performance in enhancing breaking wave features, achieving an accuracy of up to 90.7%.
Eventually, the confusion matrix was used to evaluate the rip current image interpretation program. As previously analyzed, the Daubechies wavelet with two iterations showed the best interpretation ability, achieving an accuracy rate of 83.0%. This result is closely related to the ability of wavelet-based edge detection to enhance the intensity contrast of breaking wave zones in imagery. In addition, the use of frame aggregation enables the bounding boxes for rip current detection to precisely delineate rip current channels. The method was successfully tested across various environments, image sources, and camera configurations, consistently identifying rip current locations. These results demonstrate the high generalizability of the proposed approach.
The rip current positions interpreted by the program were located at significant breaks in the breaking wave. This study suggests that the proposed rip current image interpretation program can assist researchers in collecting rip current cases from imagery, serving as a foundation for future rip current-related research. For instance, the collected rip current images can be used to train and validate artificial intelligence (AI) models for automated rip current detection. The rip current mask proposed in this study represents a form of manually extracted features, which can be used for model pre-training or as part of the data preprocessing pipeline, potentially reducing the time required for model training. Moreover, if the proposed method is extended to radar imagery, it may further enable rip current detection and analysis in night-time conditions, thereby enhancing the system’s capability for round-the-clock monitoring.
Author Contributions
Conceptualization, D.-J.D.; Formal analysis, H.-M.W.; Investigation, H.-M.W.; Data curation, J.-W.L.; Writing—original draft, H.-M.W.; Writing—review & editing, D.-J.D. and J.-W.L. All authors have read and agreed to the published version of the manuscript.
Funding
This research was funded by Central Weather Administration in Taiwan grant number MOTC-CWA-114-O-02 and The APC was funded by National Science and Technology Council of Taiwan grant number NSTC 113-2218-E-006-010.
Data Availability Statement
The original contributions presented in this study are included in the article. Further inquiries can be directed to the corresponding author.
Acknowledgments
The authors would like to express their sincere gratitude to the Central Weather Administration and the National Academy of Marine Research, Ocean Affairs Council, Taiwan, for their full support of this research, including the provision of funding and research data, which made the successful completion of this study possible. The authors also wish to thank the anonymous reviewers for their constructive comments and suggestions, which have significantly improved the quality, readability, and academic contribution of this work.
Conflicts of Interest
The authors declare no conflict of interest.
References
- Short, A.D. Rip current type, spacing and persistence, Narrabeen Beach, Australia. Mar. Geol. 1985, 65, 47–71. [Google Scholar] [CrossRef]
- Dalrymple, R.A.; MacMahan, J.H.; Reniers, A.J.; Nelko, V. Rip currents. Annu. Rev. Fluid Mech. 2011, 43, 551–581. [Google Scholar] [CrossRef]
- Brewster, B.C.; Gould, R.E.; Brander, R.W. Estimations of rip current rescues and drowning in the United States. Nat. Hazards Earth Syst. Sci. 2019, 19, 389–397. [Google Scholar] [CrossRef]
- Lushine, J. A study of rip current drownings and related weather factors. Natl. Weather Dig. 1991, 16, 13–19. [Google Scholar]
- Klein, A.H.; Santana, G.G.; Diehl, F.L.; Menezes, J.T. Analysis of hazards associated with sea bathing: Results of five years work in oceanic beaches of Santa Catarina state, Southern Brazil. J. Coast. Res. 2003, 35, 107–116. [Google Scholar]
- Kumar, S.V.; Prasad, K.V. Rip current-related fatalities in India: A new predictive risk scale for forecasting rip currents. Nat. Hazards 2014, 70, 313–335. [Google Scholar] [CrossRef]
- Brighton, B.; Sherker, S.; Bradstreet, A. Rip current related drowning deaths and rescues in Australia 2004–2011. Nat. Hazards Earth Syst. Sci. 2013, 13, 1069–1075. [Google Scholar] [CrossRef]
- Shepard, F.P.; Emery, K.O.; La Fond, E.C. Rip currents: A process of geological importance. J. Geol. 1941, 49, 337–369. [Google Scholar] [CrossRef]
- Bowen, A.J. Rip currents, 1: Theoretical investigations. J. Geophys. Res. 1969, 74, 5467–5478. [Google Scholar] [CrossRef]
- Houser, C.; Trimble, S.; Brander, R.; Brewster, B.C.; Dusek, G.; Jones, D.; Kuhn, J. Public perceptions of a rip current hazard education program: “Break the Grip of the Rip!”. Nat. Hazards Earth Syst. Sci. 2017, 17, 1003–1024. [Google Scholar] [CrossRef]
- Guza, R.T.; Thornton, E.B. Measuring surf zone dynamics: A. General measurements. In Nearshore Sediment Transport; Seymour, R.J., Ed.; Plenum Press: New York, NY, USA, 1989; pp. 51–60. [Google Scholar]
- Stockdon, H.F.; Holman, R.A. Estimation of wave phase speed and nearshore bathymetry from video imagery. J. Geophys. Res. Oceans 2000, 105, 22015–22033. [Google Scholar] [CrossRef]
- Turner, I.L.; Whyte, D.; Ruessink, B.G.; Ranasinghe, R. Observations of rip spacing, persistence and mobility at a long, straight coastline. Mar. Geol. 2007, 236, 209–221. [Google Scholar] [CrossRef]
- Sonu, C.J. Field observations of nearshore circulation and meandering currents. J. Geophys. Res. 1972, 77, 3232–3247. [Google Scholar] [CrossRef]
- MacMahan, J.; Brown, J.; Thornton, E. Low-cost handheld global positioning system for measuring surfzone currents. J. Coast. Res. 2009, 25, 744–754. [Google Scholar] [CrossRef]
- Johnson, D.; Stocker, R.; Head, R.; Imberger, J.; Pattiaratchi, C. A compact, low-cost GPS drifter for use in the oceanic nearshore zone, lakes, and estuaries. J. Atmos. Ocean. Technol. 2003, 20, 1880–1884. [Google Scholar] [CrossRef]
- Francisco, F.; Nemers, D.D.; Gallo, M.N. Rip currents dynamic of a swell dominated microtidal beach. J. Coast. Res. 2019, 92, 121–127. [Google Scholar] [CrossRef]
- Punzo, M.; Lanciano, C.; Tarallo, D.; Bianco, F. Application of X-band wave radar for coastal dynamic analysis: Case test of Bagnara Calabra. J. Sens. 2016, 2016, 6236925. [Google Scholar] [CrossRef]
- Holman, R.A.; Symonds, G.; Thornton, E.B.; Ranasinghe, R. Rip spacing and persistence on an embayed beach. J. Geophys. Res. Oceans 2006, 111, C01006. [Google Scholar] [CrossRef]
- Holman, R.A.; Stanley, J. The history and technical capabilities of Argus. Coast. Eng. 2007, 54, 477–491. [Google Scholar] [CrossRef]
- Song, D.; Bae, H.K. Observation and forecasting of rip current generation in Haeundae Beach, Korea: Plan and experiment. J. Coast. Res. 2011, SI 64, 946–950. [Google Scholar]
- Bruneau, N.; Castelle, B.; Bonneton, P.; Pedreros, R.; Almar, R.; Bonneton, N.; Bretel, P.; Parisot, J.-P.; Sénéchal, N. Field observations of an evolving rip current on a meso-macrotidal well-developed inner bar and rip morphology. Cont. Shelf Res. 2009, 29, 1650–1662. [Google Scholar] [CrossRef]
- Lee, J.; Kim, D.H.; Lee, S.; Lee, J.L. Lagrangian observation of rip currents at Haeundae Beach using an optimal buoy type GPS drifter. J. Coast. Res. 2016, 75, 1177–1181. [Google Scholar] [CrossRef]
- Maia, J.C.B.; de Souza Pereira, P.; Lessa, R.P. Variação espaço-temporal das correntes de retorno em municípios da região metropolitana do Recife. Quat. Environ. Geosci. 2014, 5, 166–176. [Google Scholar]
- Brander, R.W. Field observations on the morphodynamic evolution of a low-energy rip current system. Mar. Geol. 1999, 157, 199–217. [Google Scholar] [CrossRef]
- Mouragues, A.; Castelle, B.; Bonneton, P.; Marieu, V.; Scott, T.; Brander, R.W.; Almar, R.; Bonneton, N.; Sénéchal, N. Field observations of wave-induced headland rips. J. Coast. Res. 2020, 95, 578–582. [Google Scholar] [CrossRef]
- Liu, Y.; Wu, C.H. Lifeguarding Operational Camera Kiosk System (LOCKS) for flash rip warning: Development and application. Coast. Eng. 2019, 152, 103537. [Google Scholar] [CrossRef]
- Borra, S.; Nair, T.M.B.; Joseph, S.; Kumar, S.V.V.A.; Sridevi, T.; Harikumar, R.; Srinivas, K.; Yatin, G.; Gireesh, B.; Venkateswararao, K.; et al. Identifying rip channels along RK Beach, Visakhapatnam using video and satellite imagery analysis. J. Indian Soc. Remote Sens. 2022, 50, 1585–1602. [Google Scholar] [CrossRef]
- de Silva, A.; Mori, I.; Dusek, G.; Davis, J.; Pang, A. Automated rip current detection with region based convolutional neural networks. Coast. Eng. 2021, 166, 103859. [Google Scholar] [CrossRef]
- Zhu, D.; Qi, R.; Hu, P.; Su, Q.; Qin, X.; Li, Z. YOLO-Rip: A modified lightweight network for rip currents detection. Front. Mar. Sci. 2022, 9, 930478. [Google Scholar] [CrossRef]
- Morlet, J.; Arens, G.; Fourgeau, E.; Giard, D. Wave propagation and sampling theory—Part II: Sampling theory and complex waves. Geophysics 1982, 47, 222–236. [Google Scholar] [CrossRef]
- Haar, A. Zur Theorie der orthogonalen Funktionensysteme. Math. Ann. 1910, 69, 331–371. [Google Scholar] [CrossRef]
- Daubechies, I. Orthonormal bases of compactly supported wavelets. Commun. Pure Appl. Math. 1988, 41, 909–996. [Google Scholar] [CrossRef]
- Mallat, S.; Zhong, S. Characterization of signals from multiscale edges. IEEE Trans. Pattern Anal. Mach. Intell. 1992, 14, 710–732. [Google Scholar] [CrossRef]
- Sun, L.; Li, Z.; Li, K.; Liu, H.; Liu, G.; Lv, W. Cross-well lithology identification based on wavelet transform and adversarial learning. Energies 2023, 16, 1475. [Google Scholar] [CrossRef]
- Altaie, A.S.; Majeed, A.A.; Fichouche, M.A.; Alkhazraji, A. Fault detection on power transmission line based on wavelet transform and scalogram image analysis. Energies 2023, 16, 7914. [Google Scholar] [CrossRef]
- Majidiyan, H.; Enshaei, H.; Howe, D.; Wang, Y. An integrated framework for real-time sea-state estimation of stationary marine units using wave buoy analogy. J. Mar. Sci. Eng. 2024, 12, 2312. [Google Scholar] [CrossRef]
- Bang, I.; Kim, K.; Gu, J.B.; Shin, S.M.; Kim, J.B.; Kang, B. A Kinematic approach for rip current identification from ADCP observation data at Haeundae beach, Korea. Ocean Sci. J. 2024, 59, 65. [Google Scholar] [CrossRef]
- Antoine, J.-P.; Murenzi, R. Two-dimensional directional wavelets and the scale-angle representation. Signal Process. 1996, 52, 259–281. [Google Scholar] [CrossRef]
- Longuet-Higgins, M.S.; Stewart, R.W. Radiation stresses in water waves; a physical discussion, with applications. Deep Sea Res. Oceanogr. Abstr. 1964, 11, 529–562. [Google Scholar] [CrossRef]
- Lippmann, T.C.; Holman, R.A. The spatial and temporal variability of sand bar morphology. J. Geophys. Res. 1990, 95, 11575–11590. [Google Scholar] [CrossRef]
- Wright, L.D.; Short, A.D. Morphodynamic variability of surf zones and beaches: A synthesis. Mar. Geol. 1984, 56, 93–118. [Google Scholar] [CrossRef]
- Dalrymple, R.A.; Eubanks, R.A.; Birkemeier, W.A. Wave-induced circulation in shallow basins. J. Waterw. Port Coast. Ocean Div. 1977, 103, 117–135. [Google Scholar] [CrossRef]
- Wind, H.G.; Vreugdenhil, C.B. Rip-current generation near structures. J. Fluid Mech. 1986, 171, 459–476. [Google Scholar] [CrossRef]
- Cook, D.O. The occurrence and geologic work of rip currents off southern California. Mar. Geol. 1970, 9, 173–186. [Google Scholar] [CrossRef]
- Lascody, R.L. East central Florida rip current program. Natl. Weather Dig. 1998, 22, 25–30. [Google Scholar]
- Aagaard, T.; Greenwood, B.; Nielsen, J. Mean currents and sediment transport in a rip channel. Mar. Geol. 1997, 140, 25–45. [Google Scholar] [CrossRef]
- Brander, R.W.; Short, A.D. Morphodynamics of a large-scale rip current system at Muriwai Beach, New Zealand. Mar. Geol. 2000, 165, 27–39. [Google Scholar] [CrossRef]
- Maryan, C.C. Detecting Rip Currents from Images. Master’s Thesis, University of New Orleans, New Orleans, LA, USA, 2018. [Google Scholar]
- Castelle, B.; Scott, T.; Brander, R.; McCarroll, R.J.; Tellier, E.; de Korte, E.; Simonnet, B.; Salmi, L.R. Wave and tide controls on rip current activity and drowning incidents in Southwest France. J. Coast. Res. 2020, 95, 769–774. [Google Scholar] [CrossRef]
- Prewitt, J.M.S. Object enhancement and extraction. In Picture Processing and Psychopictorics; Lipkin, B.S., Rosenfeld, A., Eds.; Academic Press: New York, NY, USA, 1970; pp. 75–149. [Google Scholar]
- Gonzalez, R.C.; Wintz, P. Digital Image Processing, 2nd ed.; Addison-Wesley: Boston, MA, USA, 1987. [Google Scholar]
- Chaple, G.N.; Daruwala, R.D.; Gofane, M.S. Comparisons of Robert, Prewitt, Sobel operator based edge detection methods for real time uses on FPGA. In Proceedings of the 2015 International Conference on Technologies for Sustainable Development (ICTSD-2015), Mumbai, India, 4–6 February 2015; IEEE: Piscataway, NJ, USA, 2015; pp. 1–4. [Google Scholar] [CrossRef]
- Meester, M.J.; Başlamişli, A.S. SAR image edge detection: Review and benchmark experiments. Int. J. Remote Sens. 2022, 43, 5372–5438. [Google Scholar] [CrossRef]
- Paravolidakis, V.; Ragia, L.; Moirogiorgou, K.; Zervakis, M.E. Automatic coastline extraction using edge detection and optimization procedures. Geosciences 2018, 8, 407. [Google Scholar] [CrossRef]
- Mallat, S. A Wavelet Tour of Signal Processing: The Sparse Way, 3rd ed.; Academic Press: Burlington, MA, USA, 2009. [Google Scholar]
- Hari, O.; Biswas, M. An improved adaptive wavelet thresholding image denoising method. Int. J. Comput. Appl. 2015, 975, 23–27. [Google Scholar]
- Kumar, G.; Kumar, S.; Kumar, N. Comparative study of wavelet and wavelet packet transform for denoising telephonic speech signal. Int. J. Comput. Appl. 2015, 110, 1–5. [Google Scholar] [CrossRef]


Disclaimer/Publisher’s Note: The statements, opinions and data contained in all publications are solely those of the individual author(s) and contributor(s) and not of MDPI and/or the editor(s). MDPI and/or the editor(s) disclaim responsibility for any injury to people or property resulting from any ideas, methods, instructions or products referred to in the content. |
© 2025 by the authors. Licensee MDPI, Basel, Switzerland. This article is an open access article distributed under the terms and conditions of the Creative Commons Attribution (CC BY) license (https://creativecommons.org/licenses/by/4.0/).