1. Introduction
Rip currents are jet-like currents that flow outward at nearly perpendicular angles to the shoreline, primarily occurring within the surf zone and expanding beyond the area where waves break [
1,
2,
3]. Occasionally, individuals swimming in coastal waters may find themselves being carried away from the shore. The most likely culprit behind these incidents is the presence of rip currents. In recent years, with the development of recreational activities in the ocean, drowning incidents caused by rip currents have continued to occur incessantly [
4,
5,
6]. According to 20-year research by the US Lifesaving Association, rip currents account for 81.9% of annual beach rescues [
3]. Brighton et al. [
7] indicated that 57.4% of drowning events in Australian coastal waters from 2004 to 2011 were attributed to rip currents.
Unlike waves and tides, the occurrence of a rip current is difficult to see. There is a lack of a universally effective and dependable method to recognize rip currents, regardless of their location, for the majority of beachgoers. Rip currents have been a long-term research topic in the field of oceanography [
8,
9,
10]. The mechanism of occurrence of rip currents is changes in the coastal topography. When waves propagate towards the shoreline, flow generates an offshore force in response to the radiation stress generated by the waves. Many methods and equipment designs have been proposed for observing rip currents based on the mechanisms and characteristics of rip current occurrence [
8,
11,
12,
13]. Shepard et al. [
8] pointed out that rip currents are most visible on long, sandy beaches, as sediment- and bubble-laden rip currents exiting the surf zone are more easily identified. Subsequently, the Particle Image Velocimetry (PIV) method was applied, allowing for the calculation of rip current velocity and direction [
14,
15]. As technology advanced, fixed electromagnetic current meters were used in arrays to measure the alongshore variability of the nearshore circulation, even revealing more spatial details of rip currents based on Lagrange measurements of GPS drifters equipment or Acoustic Doppler Current Profilers (ADCPs) [
11,
16,
17].
Bathymetric measurements can also be inferred from video and radar systems, which can view the beach and surf zone for a long time and extensively without being limited by power and terrain. Punzo et al. [
18] used X-band radar to observe the spatial and temporal variation of sea-state parameters and detected strong rip currents. Due to the close relationship between rip current occurrence and the dissipation of wave-breaking energy, rip currents can be monitored by observing changes in the characteristics of the surf zone. Shepard et al. [
8] mentioned that when rip currents occur, there are noticeable breaks in the surf zone on the sea surface. Holman et al. [
19] conducted rip current observations in embayed beaches by averaging image data spanning over four years. They investigated the periodic variations in rip current occurrence. The Korean Meteorological Administration also employs real-time monitoring using CCTV footage to promptly alert the public when rip currents occur [
20,
21].
Current rip current observation techniques, whether through direct velocity measurements using instruments [
22,
23] or remote sensing via optical imagery and breaking wave characteristics in the surf zone [
13,
24], still face challenges in terms of long-term monitoring, large-scale observation, and general applicability. Bruneau et al. [
22] and Lee et al. [
23] measured rip current velocities using ADCPs and GPS drifters, respectively. However, such instruments typically provide only point-based velocity data, and conducting large-scale observations would require significant financial investment. PIV techniques estimate flow fields by tracking the movement of suspended particles. However, this method often suffers from a lack of distinct and sufficient surface tracers. In such cases, researchers must resort to the use of dyes. For example, Brander [
25] applied potassium permanganate dye to back-calculate the surface flow field, revealing that rip current channels narrow over time and that rip current velocity peaks during ebb tides.
As a result, analysis of breaking wave features in imagery is more suitable for long-term and large-scale monitoring. Although various image-based feature extraction techniques have been proposed, most rip current identification methods still rely heavily on manual interpretation and have not yet achieved full automation. Maia et al. [
24] introduced qualitative criteria for identifying rip currents in images. Turner et al. [
13] and Mouragues et al. [
26] applied long-term image averaging and intensity analysis to distinguish between breaking zones and rip channels. However, these methods ultimately still require manual verification of rip current locations. Some studies have attempted to automate rip current detection. For instance, Liu and Wu [
27] and Borra et al. [
28] used K-means clustering to segment pixels, then determined areas of breaking waves or foam based on predefined baselines to locate rip currents. However, since each coastal region has a different baseline, this method lacks general applicability in areas without predefined references. Borra et al. [
28] also proposed using satellite imagery to identify rip current locations, but manual verification was still required. Moreover, these studies highlighted that their methods are sensitive to environmental conditions such as strong sunlight, rain, and sea surface reflections, which can degrade performance. Recently, AI-based object detection techniques have been used to identify rip currents [
29,
30]. Nevertheless, such methods require large datasets for training and demand considerable training time and computational resources; furthermore, due to the black-box nature of AI, it is often difficult to interpret the reasons behind misclassifications.
Wavelet transform, as a signal processing tool with multi-scale and time-frequency localization properties, offers clear advantages in image feature detection and presents a promising solution to the challenges mentioned above. First proposed by Morlet et al. [
31], wavelet transform differs from traditional Fourier Transform in that it not only analyzes frequency characteristics but also preserves localized signal variations in time or space, making it particularly suitable for capturing fast and irregular changes in images. Over time, many different wavelet basis functions have been developed, such as Haar [
32], Daubechies [
33], and Mexican Hat wavelets [
34], each with its own unique characteristics and application contexts. Due to its multi-scale analysis capability, wavelet transform has been widely applied in various fields for effective edge detection. For example, Sun et al. [
35] used wavelet transform to analyze infrared thermal images of photovoltaic modules and successfully detected thermal defects. Altaie et al. [
36] applied it to infrared imagery of high-voltage transmission lines to accurately and rapidly identify abnormal thermal hotspots.
In the field of oceanography, wavelet transform has also seen widespread application. Majidiyan et al. [
37] analyzed six-degree-of-freedom acceleration data from ships using wavelet transform to establish a real-time sea-state analysis system. Bang et al. [
38] used wavelet analysis to identify a link between rip current occurrences and long-period waves, suggesting that such waves may be a cause of rip current formation. Of particular note is the edge detection capability of wavelet transform, which can be used to extract various features in marine imagery. For instance, Antony and Murenzi [
39] successfully identified mesoscale features such as oil slicks, fronts, eddies, and ship wakes using wavelet transform, demonstrating its strong potential and effectiveness in marine image analysis.
To achieve the goals of long-term, large-scale, and generalizable automated rip current detection, this study develops a method for identifying rip currents based on breaking wave features in optical imagery. To enhance the visual distinction of surf-zone breaking waves and to reduce errors caused by environmental lighting conditions, we propose the use of wavelet-based edge detection. Leveraging its multi-scale analytical advantage, the method suppresses background noise while retaining edge features across different scales, thereby strengthening the contrast between breaking wave zones and water bodies.
This study explores how different wavelet types and iteration levels of wavelet transform affect the representation of breaking wave features and identifies the optimal image processing configuration. Ultimately, rip current locations are automatically detected using convolution and frame aggregation techniques. Additionally, image augmentation is employed to improve the generalizability of the detection method, making it applicable to both satellite and camera-based imagery
2. Rip Current Image Recognition Method
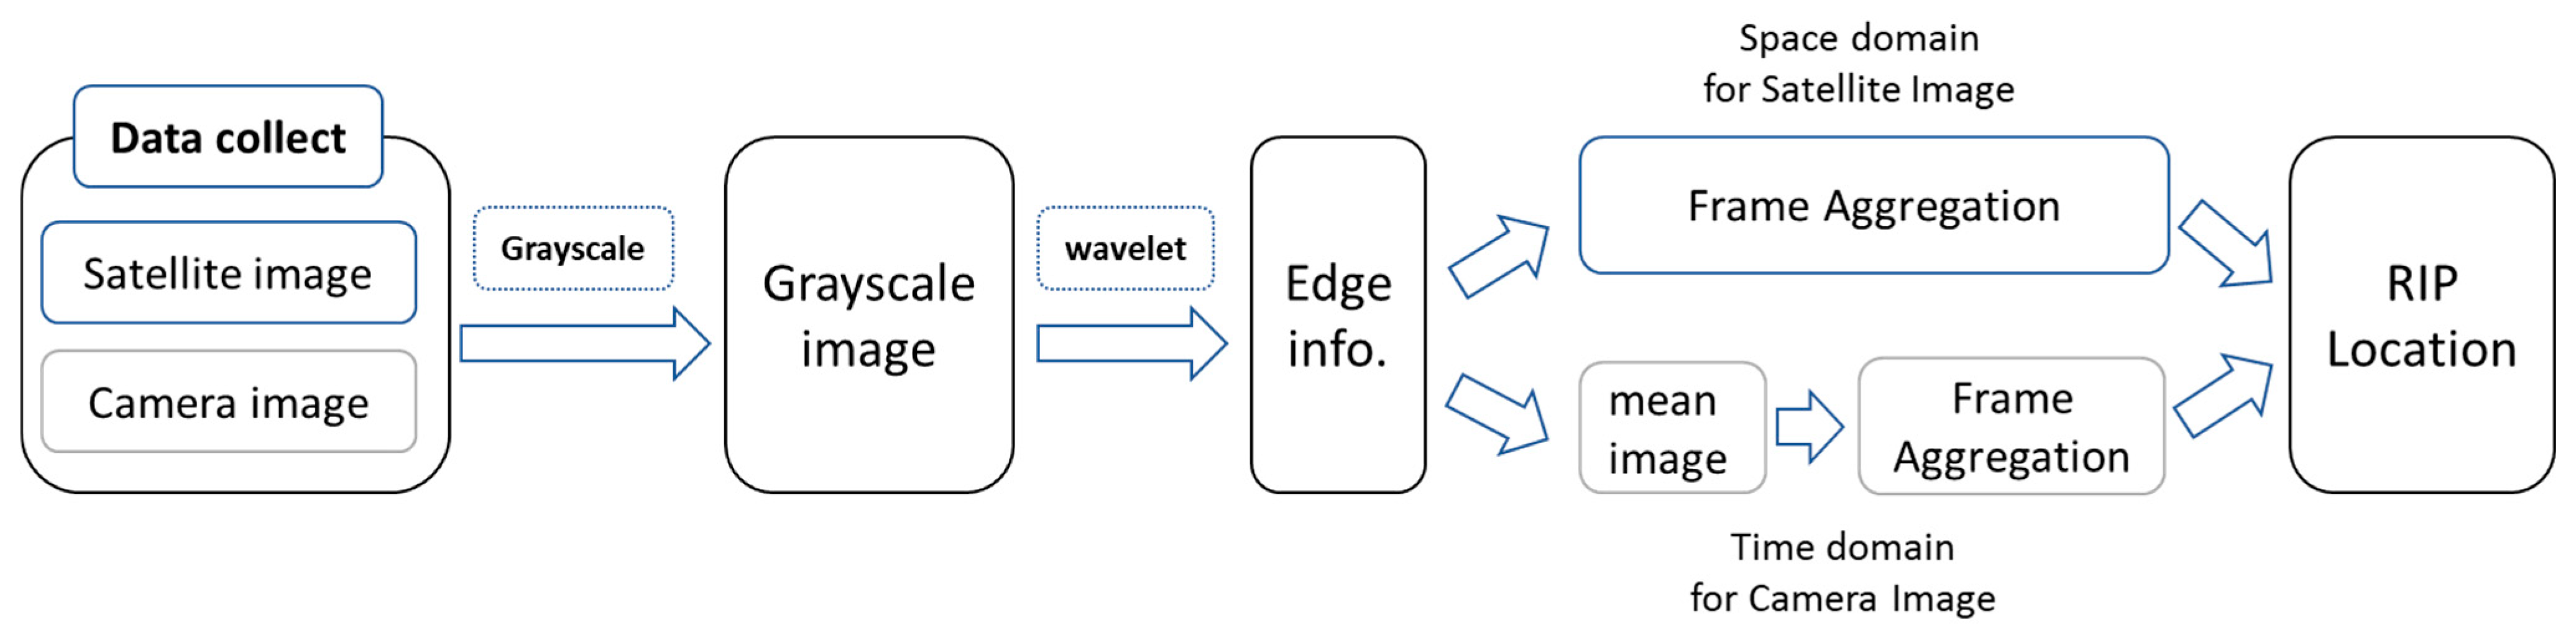
In order to establish a generalized and fully automated image interpretation method for long-term and large-scale rip current monitoring, this study proposes a set of criteria for identifying rip currents in imagery. These criteria are based on previous research regarding the surface characteristics and formation mechanisms of rip currents. The overall workflow of the proposed method is illustrated in
Figure 1.
First, satellite or camera images are collected and converted into grayscale format. Then, a wavelet-based edge detection method is applied to enhance the contrast between breaking waves and the surrounding water. After that, convolution analysis is conducted using rip current masks to identify the possible locations of rip currents. Finally, to improve the accuracy and stability of the detection results, image enhancement and temporal frame aggregation techniques are introduced.
2.1. Rip Current Detection Based on Defined Criteria
The most reliable method for identifying rip currents is by measuring their flow velocity and direction; however, this is often challenging in practice. As an alternative, this study employs image-based analysis to detect rip current occurrences by examining characteristic patterns in optical imagery.
Longuet-Higgins and Stewart [
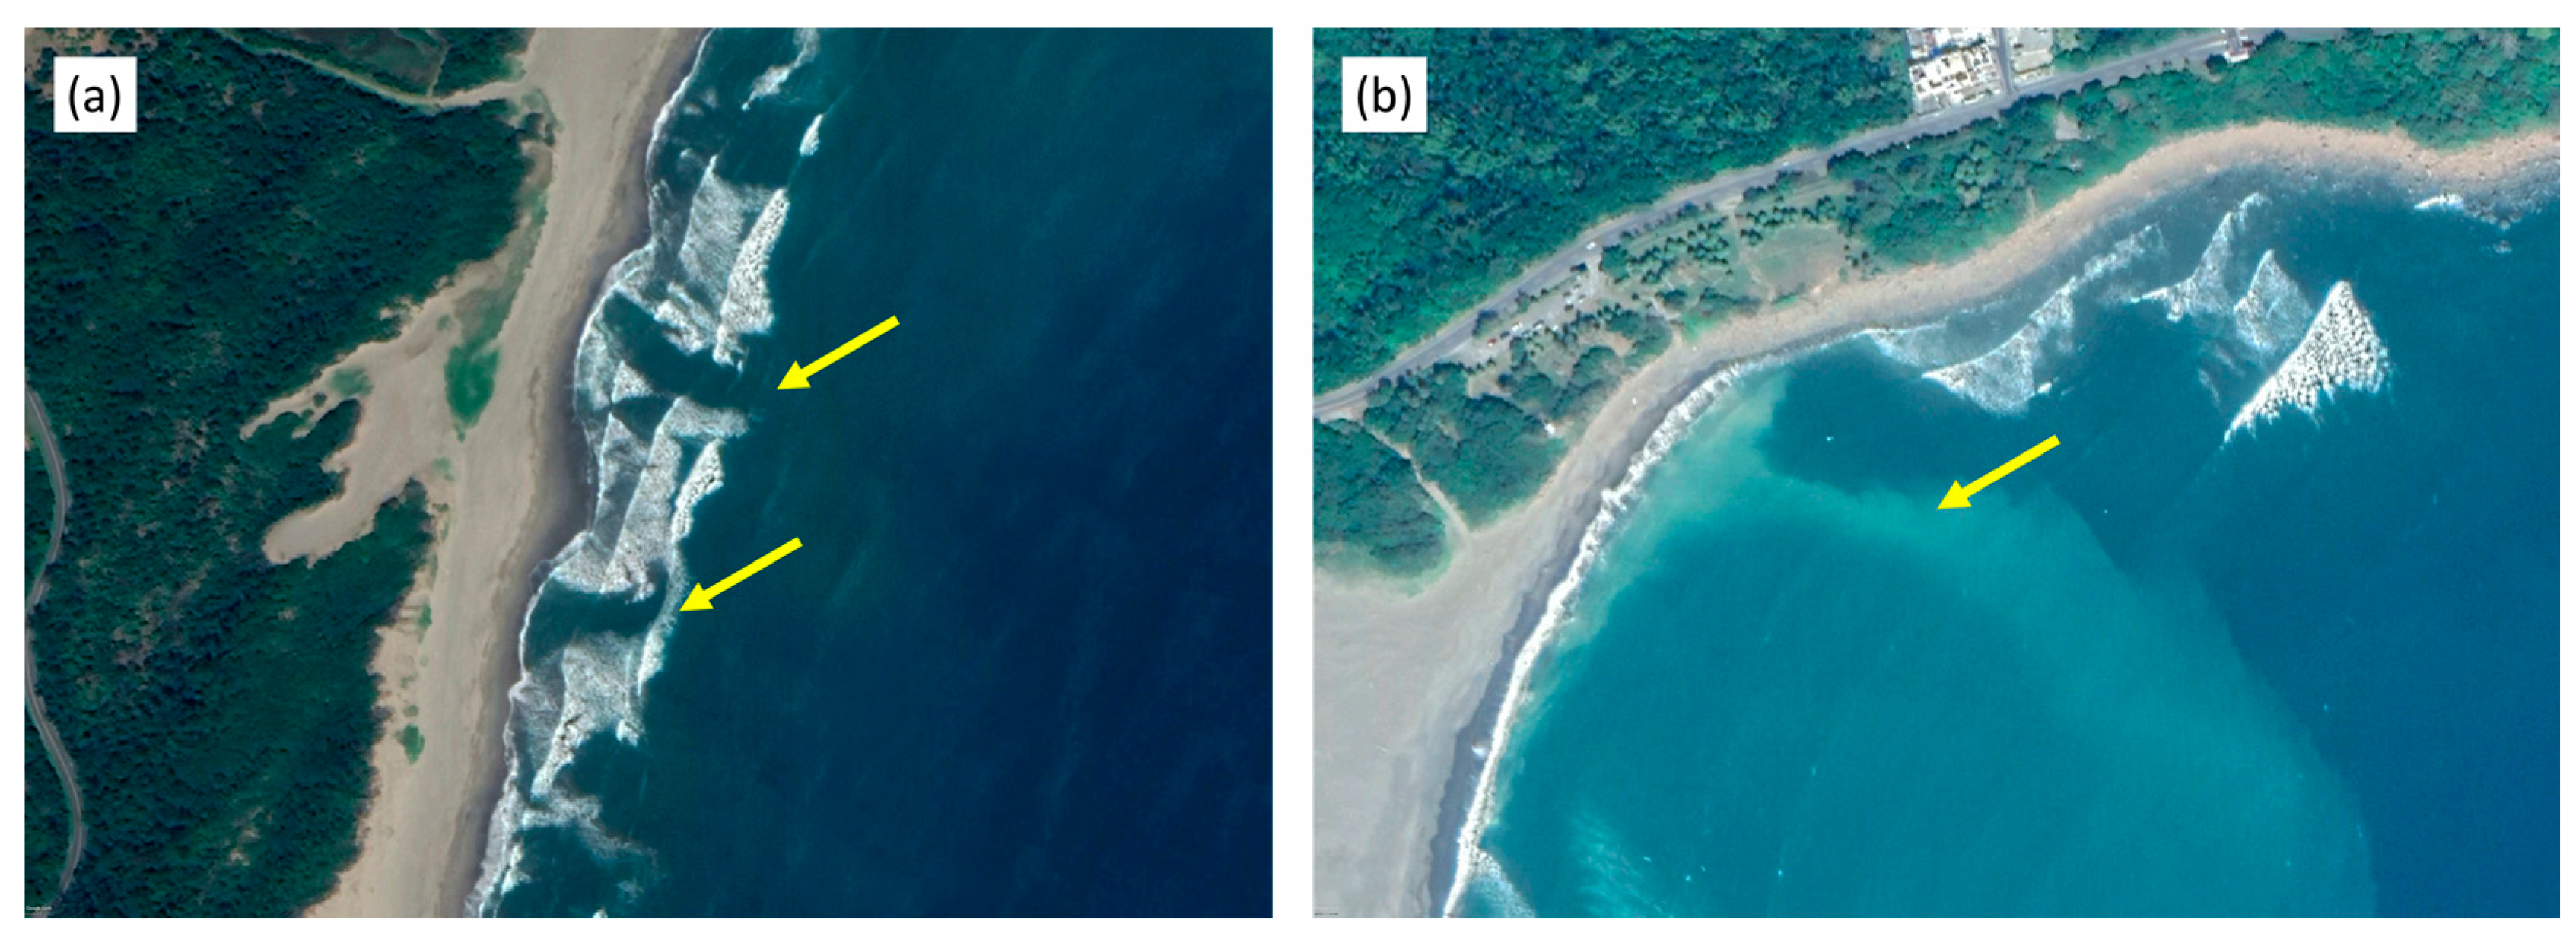
40] established a relationship between rip current formation and wave-breaking energy dissipation. When a rip current occurs, the offshore movement of water dissipates wave energy, preventing the necessary conditions for wave breaking. This phenomenon results in visible gaps in the wave-breaking zone, as illustrated in
Figure 2a [
8,
41]. In cases where suspended materials (such as sand, driftwood, or foam) are present on the sea surface, their movement trajectories can serve as indicators of current direction, thereby aiding in the identification of rip current locations (
Figure 2b) [
1,
25].
Another key factor in image-based rip current detection is the temporal persistence of these currents. Rip current durations vary significantly, ranging from several minutes to multiple hours [
2]. Thus, to enhance detection accuracy, methods such as image averaging and frame aggregation are applied to analyze the temporal continuity of disruptions in the breaker zone [
19,
20,
29]. These techniques help minimize false positives caused by transient disturbances such as wind-driven wave dispersion.
Topography also plays a crucial role in rip current formation. Wright and Short [
42] categorized beach types based on field observations and identified specific topographical features that favor rip current development. For example, areas with the presence of channels on the seabed or gaps in sandbars are commonly associated with rip current occurrences [
8,
43,
44,
45]. Interestingly, the oceanic and meteorological conditions required for rip current generation are not necessarily extreme [
4,
46], and rip currents often recur at the same locations. Therefore, this study proposes Criterion 4: “When the topography is stable (i.e., in the absence of typhoons, storm surges, or human-induced changes), a rip current must appear at least twice in the same location”. This condition serves as an additional verification measure for the reliability of rip current detection results in cases where the exact time of occurrence cannot be confirmed from satellite imagery. Additionally, previous studies have shown that the spacing between rip currents typically exceeds 40 m [
47,
48,
49]. Based on these insights, the following five criteria were established to detect rip currents in optical images:
Criterion 1: A visible gap or rift in the wave-breaking zone must be present.
Criterion 2: Suspended materials (e.g., spray, sediment, or driftwood) must be seen extending seaward.
Criterion 3: The discontinuity in the surf zone must persist for at least 10 min.
Criterion 4: Rip currents tend to recur at the same location over time.
Criterion 5: The spacing between rip currents is generally greater than 40 m.
2.2. Data Collection
2.2.1. Satellite Images
Most rip current case studies are derived from rescue records, which are often limited in number and may not provide sufficient data for comprehensive analysis. To overcome this limitation, satellite imagery offers a vast dataset with broad spatial coverage, making it an ideal resource for capturing rip current phenomena. In this study, satellite images provided by the Center for Space and Remote Sensing Research (CSRSR) of Taiwan and Google Earth (GE) are utilized. The satellite platforms used include SPOT 5/6/7, Pléiades, IKONOS, and QuickBird, with an image resolution of 2.5 m. Dalrymple et al. [
2] reviewed multiple studies and pointed out that rip currents typically extend from the shoreline to several tens or even hundreds of meters offshore, with a width approximately three times that of the surf zone. Turner et al. [
13] successfully identified rip currents using imagery with a resolution ranging from 0.5 to 5.0 m and even used images with resolutions as low as 16 m near the image boundaries. Borra et al. [
28] also successfully identified rip currents using satellite imagery from the same sources as this study (Pléiades and Google Earth Pro). In addition, numerical modeling studies of rip currents, such as that by Castelle et al. [
50], have commonly used grid resolutions between 0.5 and 10 m. Therefore, based on these previous research experiences, satellite imagery can be considered sufficient for rip current identification. A substantial dataset of high-resolution satellite imagery from 2013 to 2017 covering the entire Taiwan region is used. Since satellite imagery typically covers large areas and may include multiple beaches within a single image, this study segmented the satellite images into beach-based analysis units. These images were distributed across more than 200 beaches in Taiwan. The satellites regularly pass over Taiwan and capture images, resulting in at least 10 images per beach annually, with the total dataset exceeding 10,000 images.
Rip currents were observed at 101 beaches, and a total of 714 images containing rip currents were collected. The remaining images were also retained to form a comprehensive database, which was later used to validate the proposed automated rip current image recognition technique.
2.2.2. Coastal Video Images
The Central Weather Administration (CWA) of Taiwan has established a rip current optical monitoring station to observe coastal dynamics. The station is situated on a hillside approximately 1 km from Waiou Beach, Yilan County, Taiwan. Due to the considerable length of the beach and the need to clearly capture the surf zone, three high-resolution cameras (each with 2-megapixel resolution) were installed. The cameras are positioned at angles exceeding 30 degrees to minimize distortion and compression of the surf zone, with an image resolution ranging from 0.1 to 0.5 m per pixel. These three cameras respectively cover the northern, central, and southern sections of Waiou Beach. Each camera captures a segment approximately 400 m in length. A slight overlap between the coverage areas of the cameras ensures that the entire beach is fully captured.
The system records images at a frame rate of 30 fps (frames per second), ensuring detailed monitoring of rip current formation and dissipation, which can last from minutes to hours. However, as optical cameras are affected by lighting conditions, only daytime images (6:00 AM to 6:00 PM) were used in this study. Over the period from October 2021 to October 2022, the monitoring station captured 4211 h of image data, providing a substantial dataset for rip current analysis.
2.3. Wavelet Edge Detection
Traditional edge detection methods based on color value gradients using two-dimensional difference operators [
51,
52] are susceptible to environmental influences. Chaple et al. [
53] and Meester and Baslamisli [
54] pointed out that traditional edge detection methods such as those proposed by Roberts, Prewitt, and Sobel show significantly reduced performance under conditions such as image blurriness, weak or unclear lighting variations, speckle noise, low contrast, complex textures, and low image resolution. In real-world coastal environments, it is common to encounter challenges such as overcast weather causing insufficient lighting, interference from wave patterns or sea spray, and even disturbances caused by increased boat traffic or human activity, all of which can degrade image quality and adversely affect edge detection results [
55].
To overcome this limitation, this study utilizes a two-dimensional wavelet transform for edge detection. By employing Short-Time Fourier Transform (STFT) with an adjustable packet, the method can effectively remove background noise while preserving the characteristics of the breaking wave zone.
According to the wavelet theory proposed in [
56], the grayscale image is regarded as a 2D signal matrix (
), and
nts the Fourier transform. The 2D Fourier transform of the equation expressed as
is defined as Equation (1).
According Equation (1), the 2D wavelet transform equation for the image matrix (
) can be expressed as Equation (2).
where
is a function of the wavelet, which can be obtained by mother function translation and scale expansion as Equation (3).
Then, the 2D wavelet transform is described through Fast Fourier Transform (FFT) and inverse 2D Fourier transform. The 2D Fourier transform of the wavelet function can be written as Equation (4).
Under assumptions of scale expansion, translation (Equation (5)), 2D convolution (Equation (6)), and conjugation properties (Equation (7)), i.e.,
the 2D Fourier transform of the wavelet function can be rewritten as Equation (8).
where
and
can be obtained through fast Fourier transform (FFT). The result of the 2D wavelet transformation of the image can be calculated by Equation (4). Finally, after calculating edge strengths at multiple scales using wavelet transform, the detected edge information is normalized, then processed through a binarization procedure. The threshold used for binarization is the maximum value within the two-dimensional edge strength matrix. Pixels reaching this maximum value are considered edge points and are marked as true (1), while all other pixels are marked as false (0). After removing the regions marked as false (i.e., those with zero coefficients), the remaining true-marked positions clearly define the boundaries of the breaking wave zones.
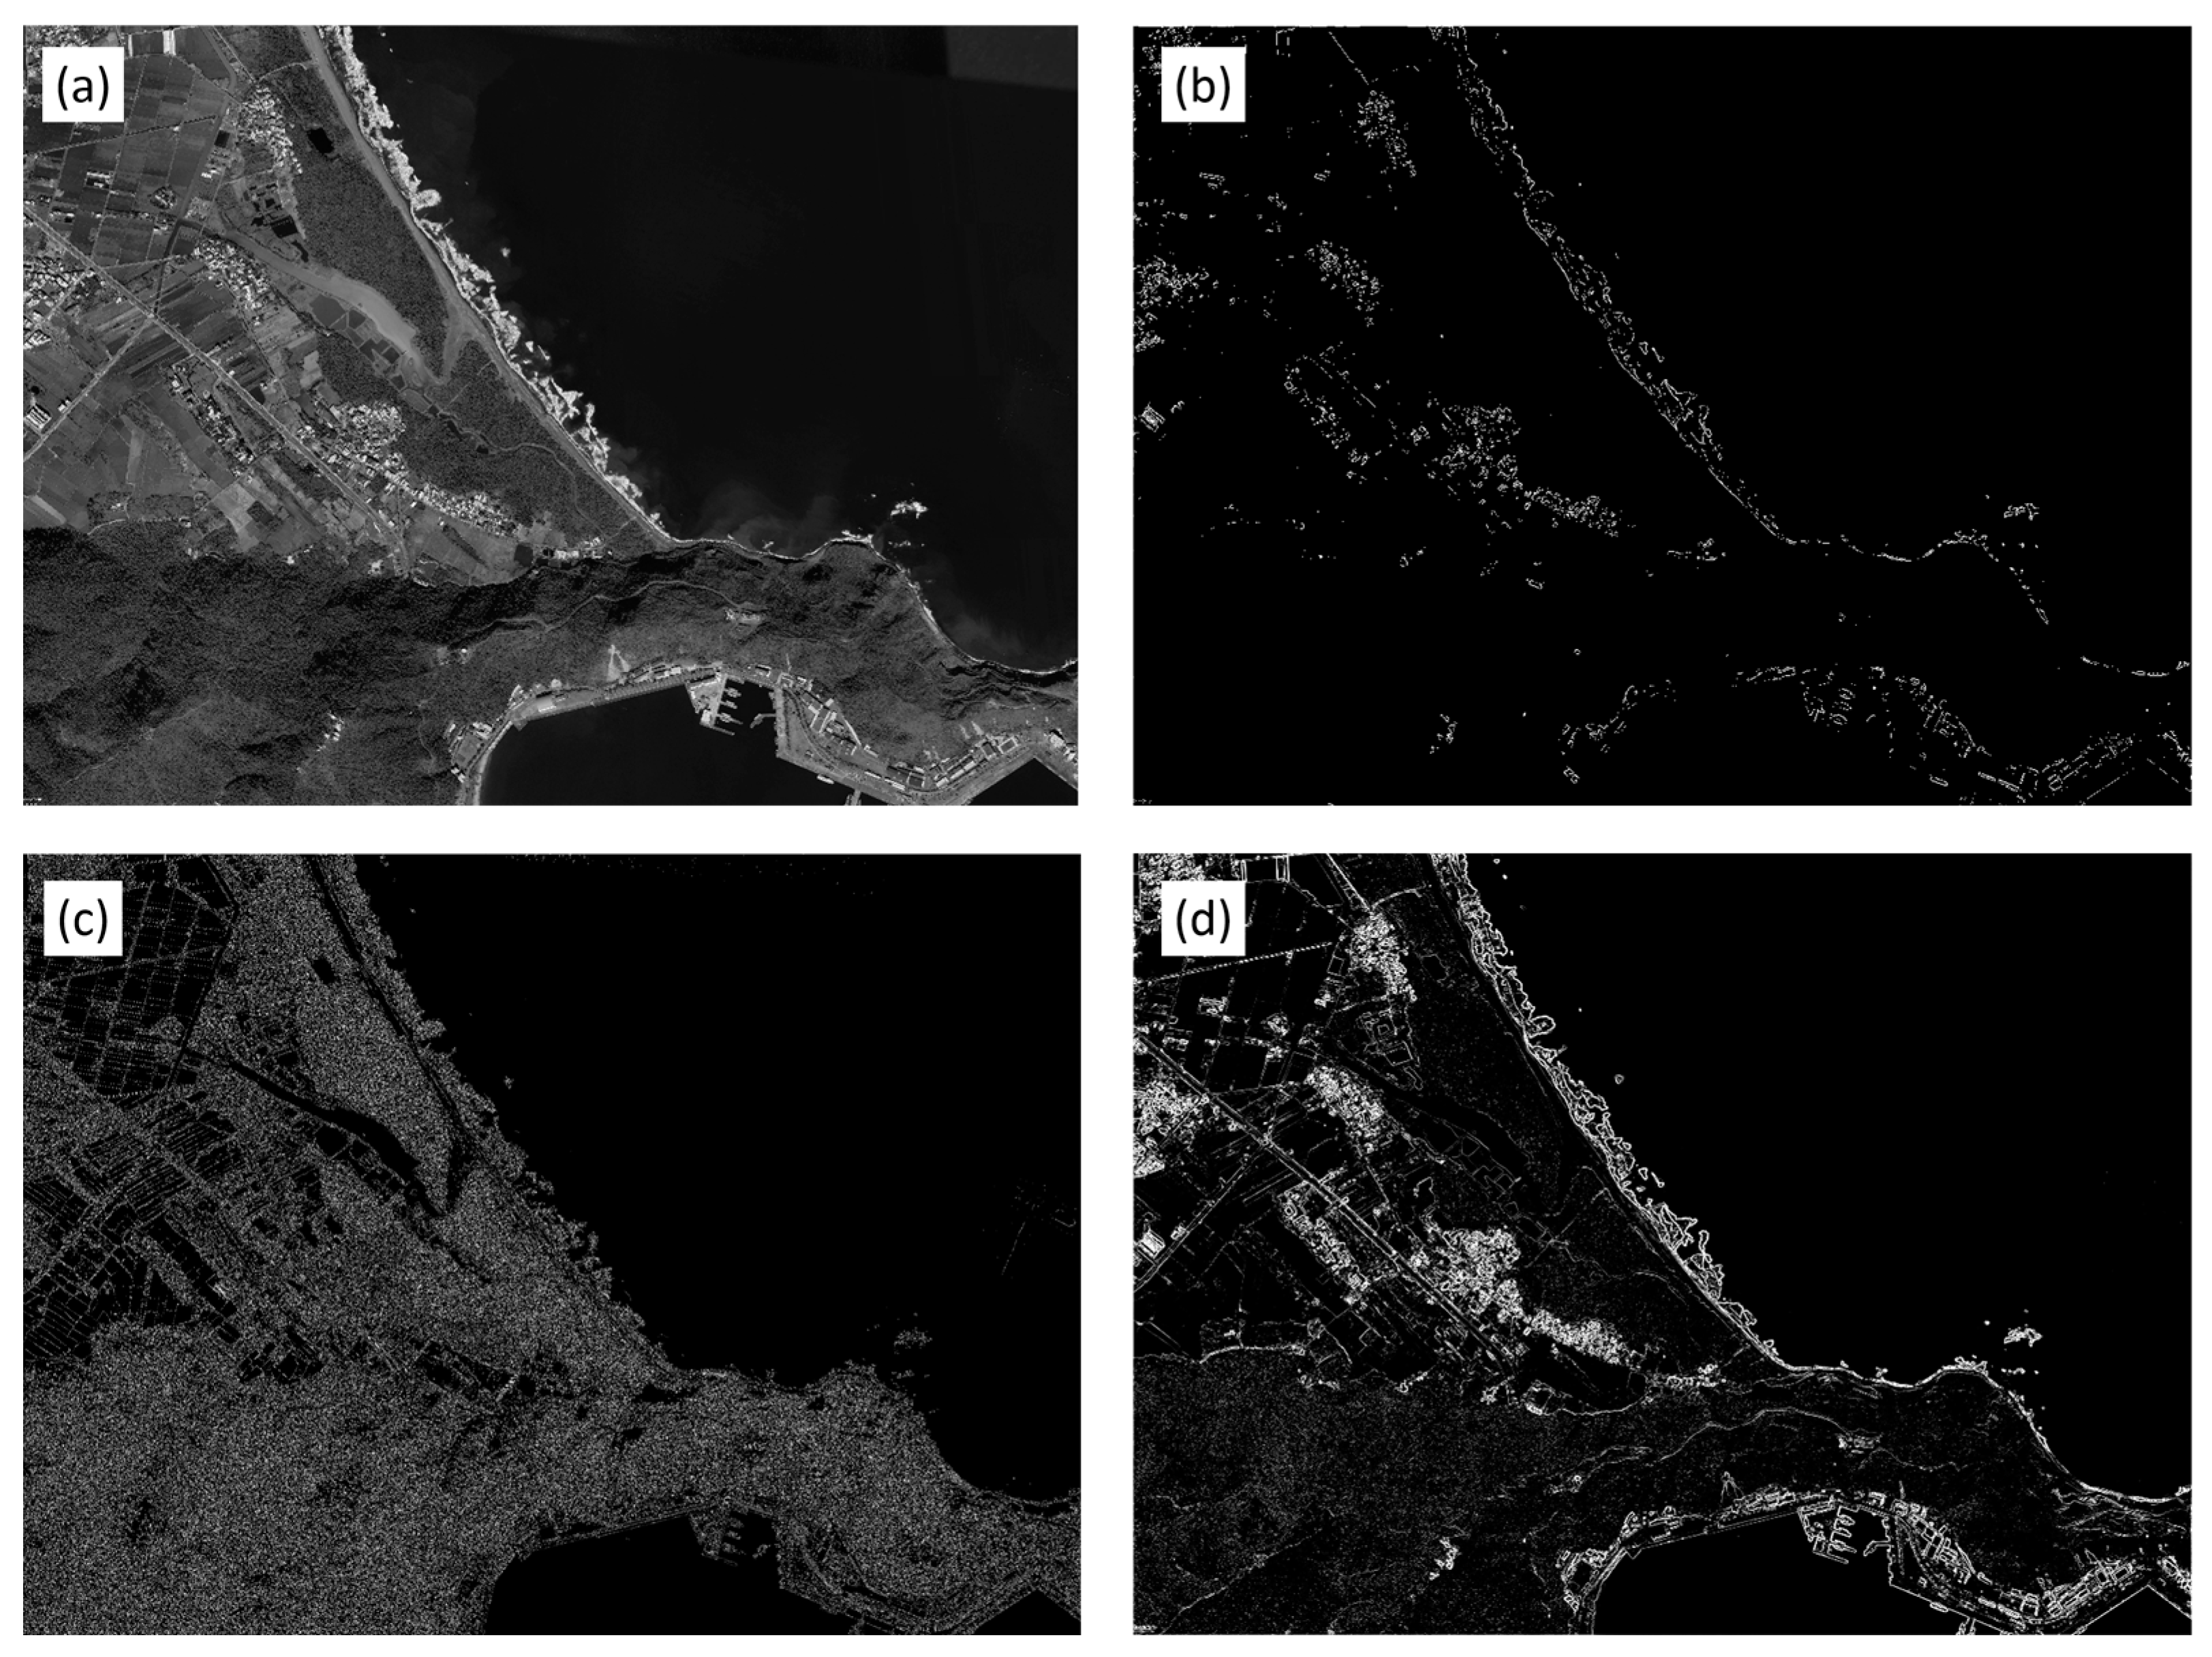
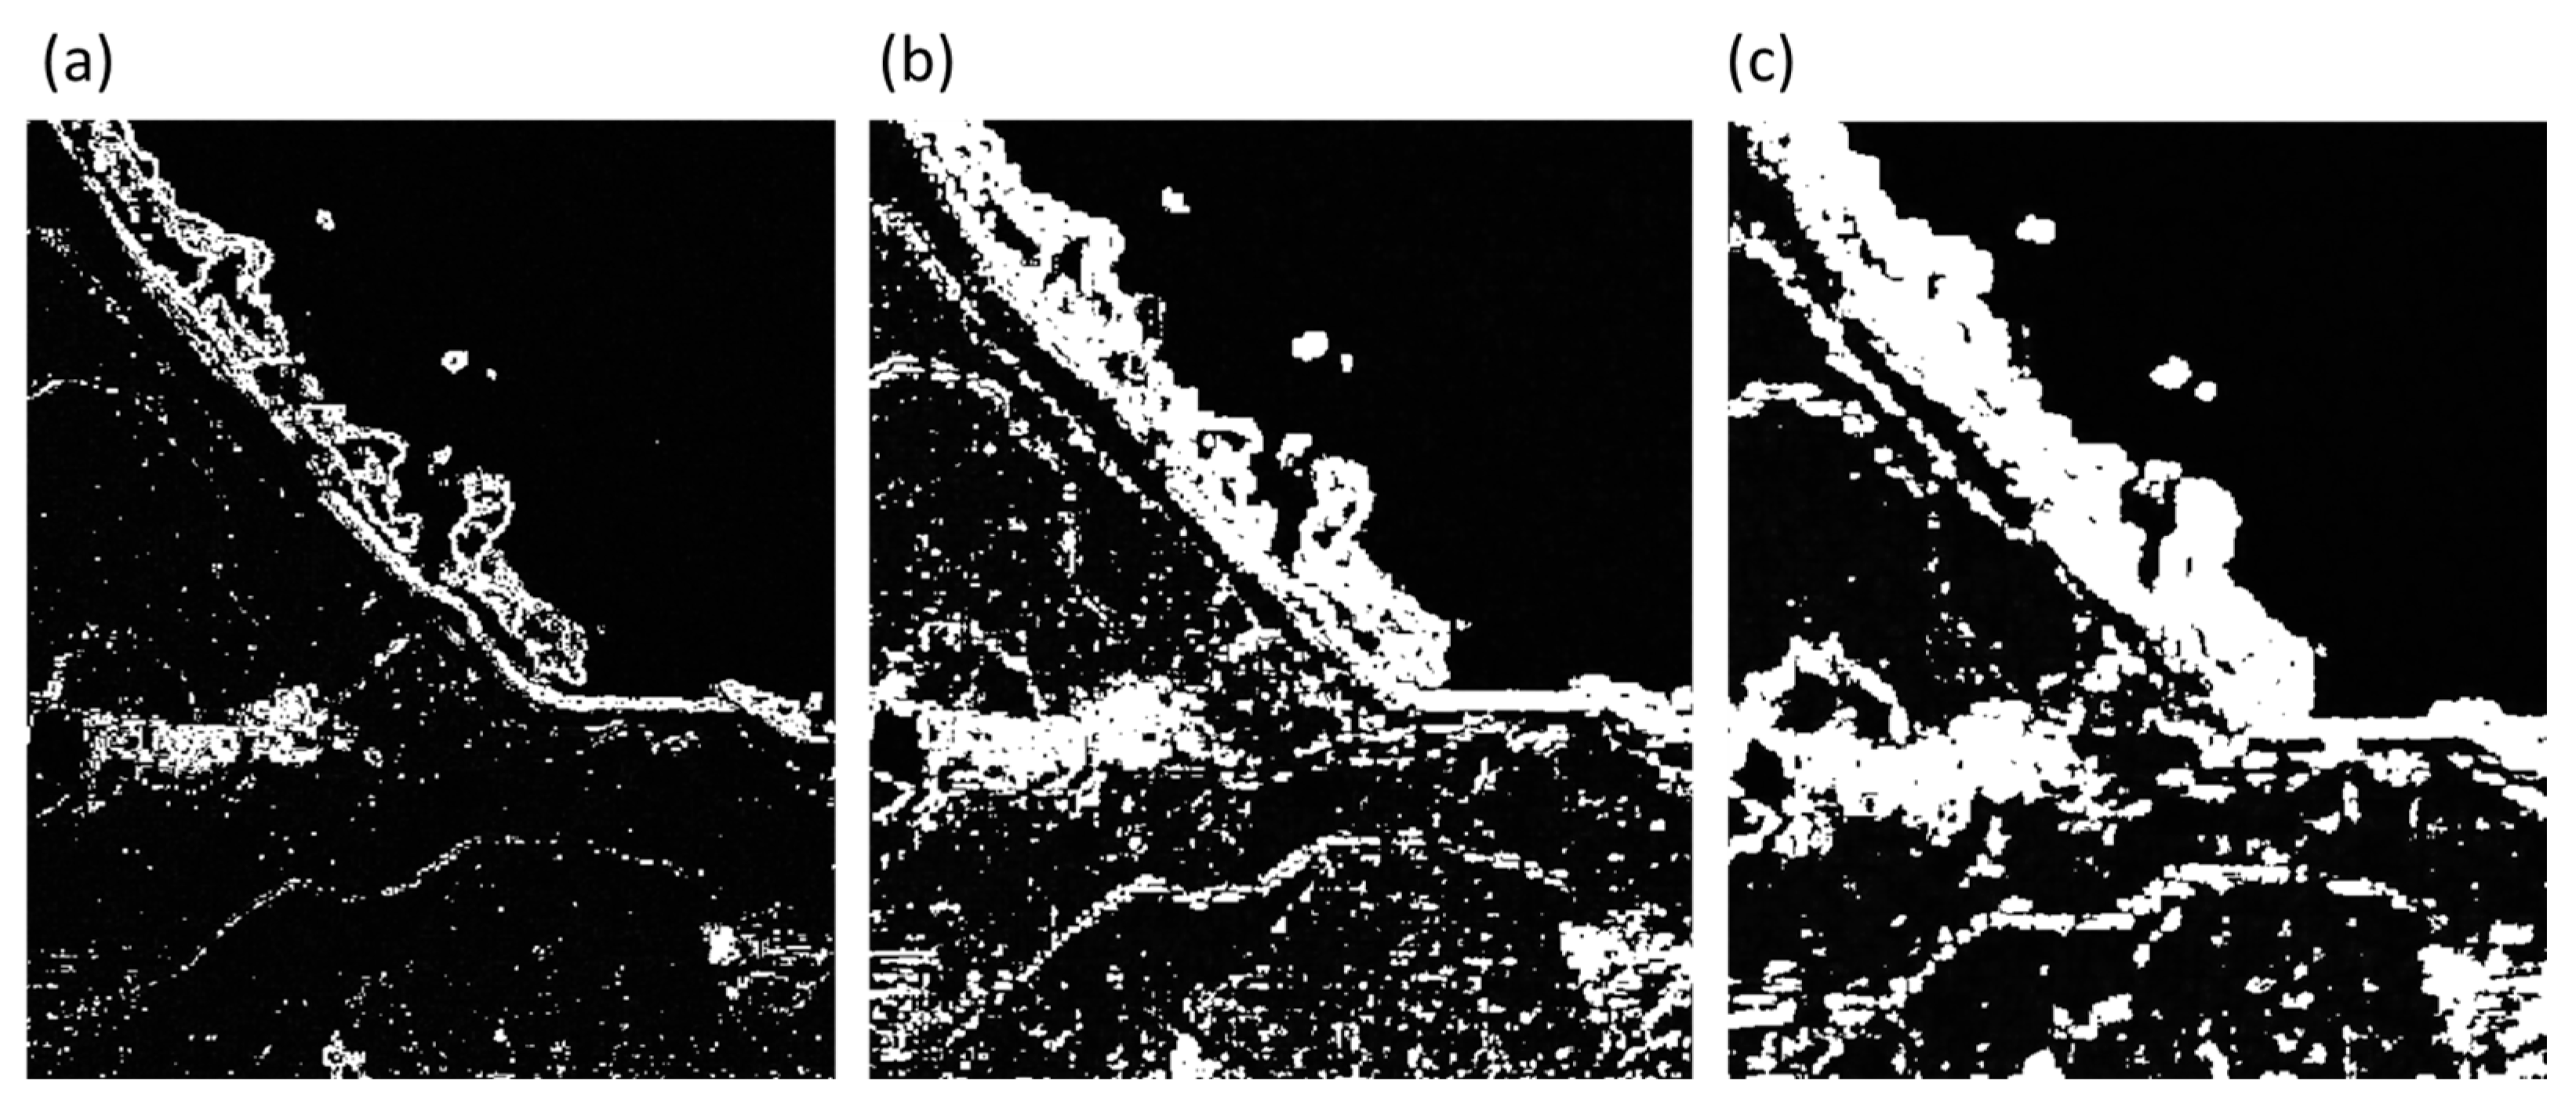
This study compares the results of wavelet-based edge detection with those of traditional Sobel and Canny algorithms. For wavelet edge detection, custom-defined filters were used: a low-pass filter [0.01, 0.04, 0.04, 0.01] and a high-pass filter [0.01, −0.01]. The scales were set as powers of 2, and convolution was applied point by point across the entire image. As a result, the output image has the same dimensions as the original. In contrast, the Sobel and Canny algorithms detect edges by first computing image gradients using their respective filters, then applying a threshold set at 30% of the maximum gradient value. The Sobel method retains only regions with strong gradients (
Figure 3b). The Canny algorithm, on the other hand, applies smoothing through its filtering process, resulting in more consistent gradient calculations and allowing for more detailed edge retention. However, it lacks the ability to differentiate between large-scale and small-scale edges, often producing outputs with considerable noise (
Figure 3c). As shown in
Figure 3d, the wavelet-based edge detection method effectively removes low-frequency noise while preserving high-frequency edge information across multiple scales. Therefore, both large-scale features such as coastlines and small-scale features such as breaking waves can be clearly identified. Based on these results, this study adopts the wavelet edge detection method to enhance the breaking wave features in nearshore surf zones, thereby facilitating the subsequent image convolution process for identifying rip current locations.
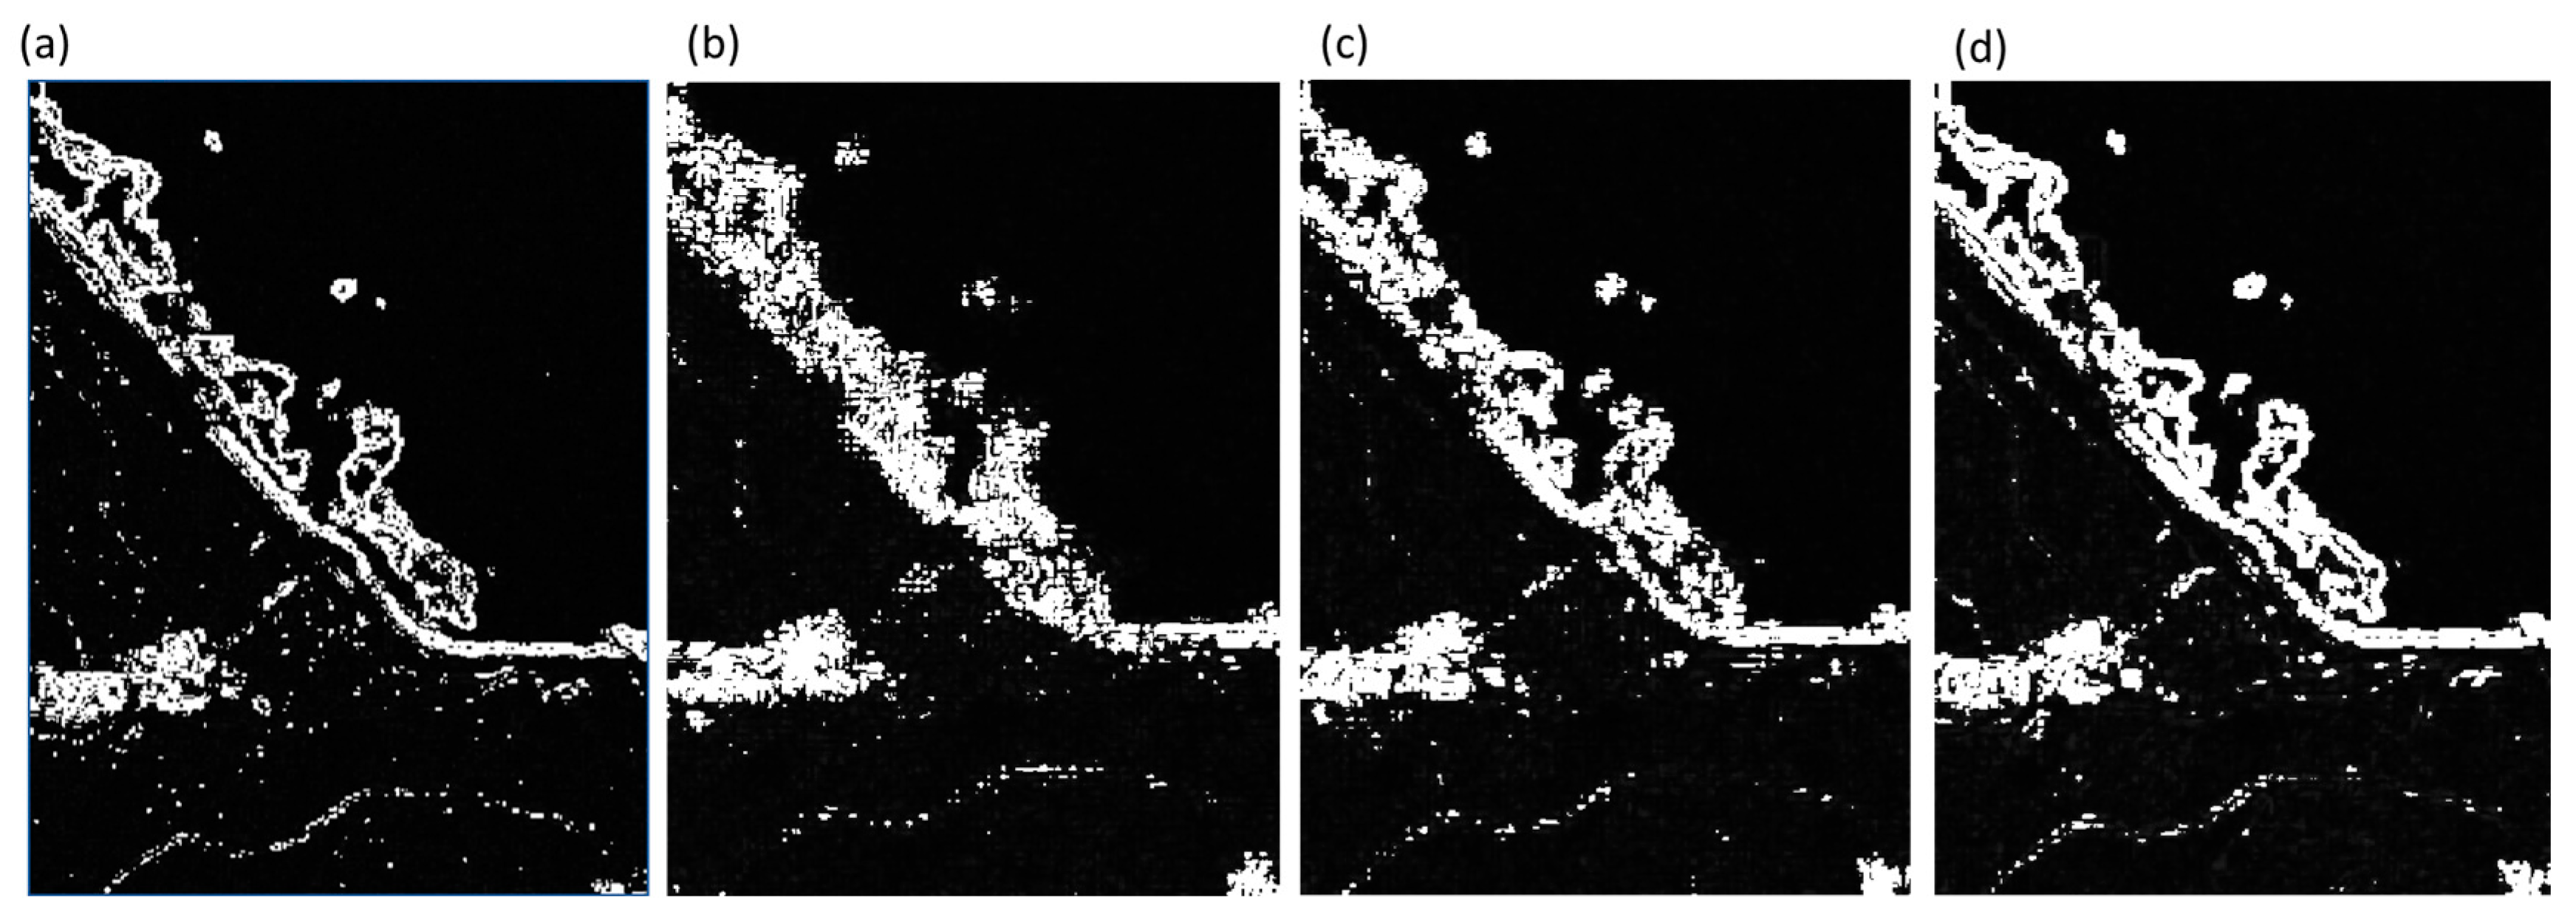
One-dimensional discrete wavelet transform is used in this work for denoising purposes. Based on the mathematical properties of different wavelet bases, four types—Haar, Daubechies, Symlet, and biorthogonal—were identified as suitable for enhancing breaking wave features in the nearshore region. The Haar wavelet, characterized by its step-like discontinuous mother function, offers strong first-order edge detection capability and high computational efficiency. It is particularly suitable for quickly detecting sharp intensity changes and boundary signals in the breaking wave zone. The Daubechies wavelet, with its high-order vanishing moments and compact support, enables multi-scale analysis of both fine textures and local edge structures in the surf zone. The Symlet wavelet, a symmetrized version of the Daubechies wavelet, retains the vanishing moments while improving phase-delay characteristics, making it more stable in detecting directional and continuous edge features of breaking waves. The biorthogonal wavelet, with its biorthogonality and perfect linear phase properties, allows for high-precision reconstruction without edge displacement, making it especially suitable for applications that require accurate localization of breaking wave boundaries.
Thus, four different types of wavelets are used in this work for denoising of telephonic speech signals in the Haar, Daubechies, Symlet, and biorthogonal wavelets. The first wavelet packet transform is the Haar wavelet packet. It is a sequence of rescaled “square-shaped” functions that, together, form a wavelet family [
57]; it can be defined as Equation (9).
The Haar wavelet is limited for general harmonic waves in DWT. Daubechies introduced compact orthonormal wavelets, which are valuable for discrete wavelet analysis. These wavelets lack a closed form; a scaling function is iteratively derived with 2N coefficients, yielding a wavelet function with the same coefficients. Coefficients for N = 1 to N = 45 are tabulated. Daubechies wavelets are denoted as dbN, with N indicating their order and the vanishing moments they possess (Equation (10)).
The Symlet wavelet is an orthogonal wavelet. Its waveform is more symmetric compared to the Daubechies wavelet, with its maximum value located at the center of the waveform. Finally, a biorthogonal wavelet refers to a type of wavelet whose corresponding wavelet transform is reversible, although not strictly orthogonal. Creating biorthogonal wavelets offers greater flexibility compared to orthogonal wavelets. An extra level of freedom lies in the ability to create symmetric wavelet functions, so the numbers (
M and
N) of coefficients in the scaling sequences (
,
) may differ. The scaling sequences must satisfy the following biorthogonality condition, expressed as Equation (11).
Then, the wavelet sequences can be determined as in Equation (12).
2.4. Rip Current Location Detection
2.4.1. Packet of Rip Current Convolution
After applying wavelet transform, the image is redefined such that black regions represent water bodies (assigned a value of +1) and white regions represent breaking waves (assigned a value of −1). This results in a wavelet-transformed image that reflects the environmental characteristics of the coastal zone. To enable automated rip current detection, this study introduces the concept of a rip current mask. Based on previous research on the surface characteristics of rip currents [
8], a pixel-based mask is constructed to describe the typical rip current pattern in imagery. According to the previously defined coastal features, the mask consists of white areas (representing breaking waves) on both sides and a black region (representing the rip current channel) in the center. This concept is similar to AI-based image feature learning; however, manually extracting object features significantly reduces the training cost typically required by machine learning models. By convolving the two matrices, it is possible to calculate the similarity between the rip current mask and each local region of the wavelet-transformed image as the mask slides across every pixel position, and the similarity at each position can be represented by
(Equation (13)).
where
m and
n are the width and height of the rip current mask image, respectively, and denote the convolution operator. Experimental results show that when the similarity between the wavelet transform edge detection image and the rip current mask image reaches 80%, the position is a clear breaking point of the surf zone and a suspected location of rip current occurrence. It should be noted that the quantitative threshold of 80% similarity was determined empirically through iterative adjustments during preliminary experiments.
2.4.2. Image Augmentation
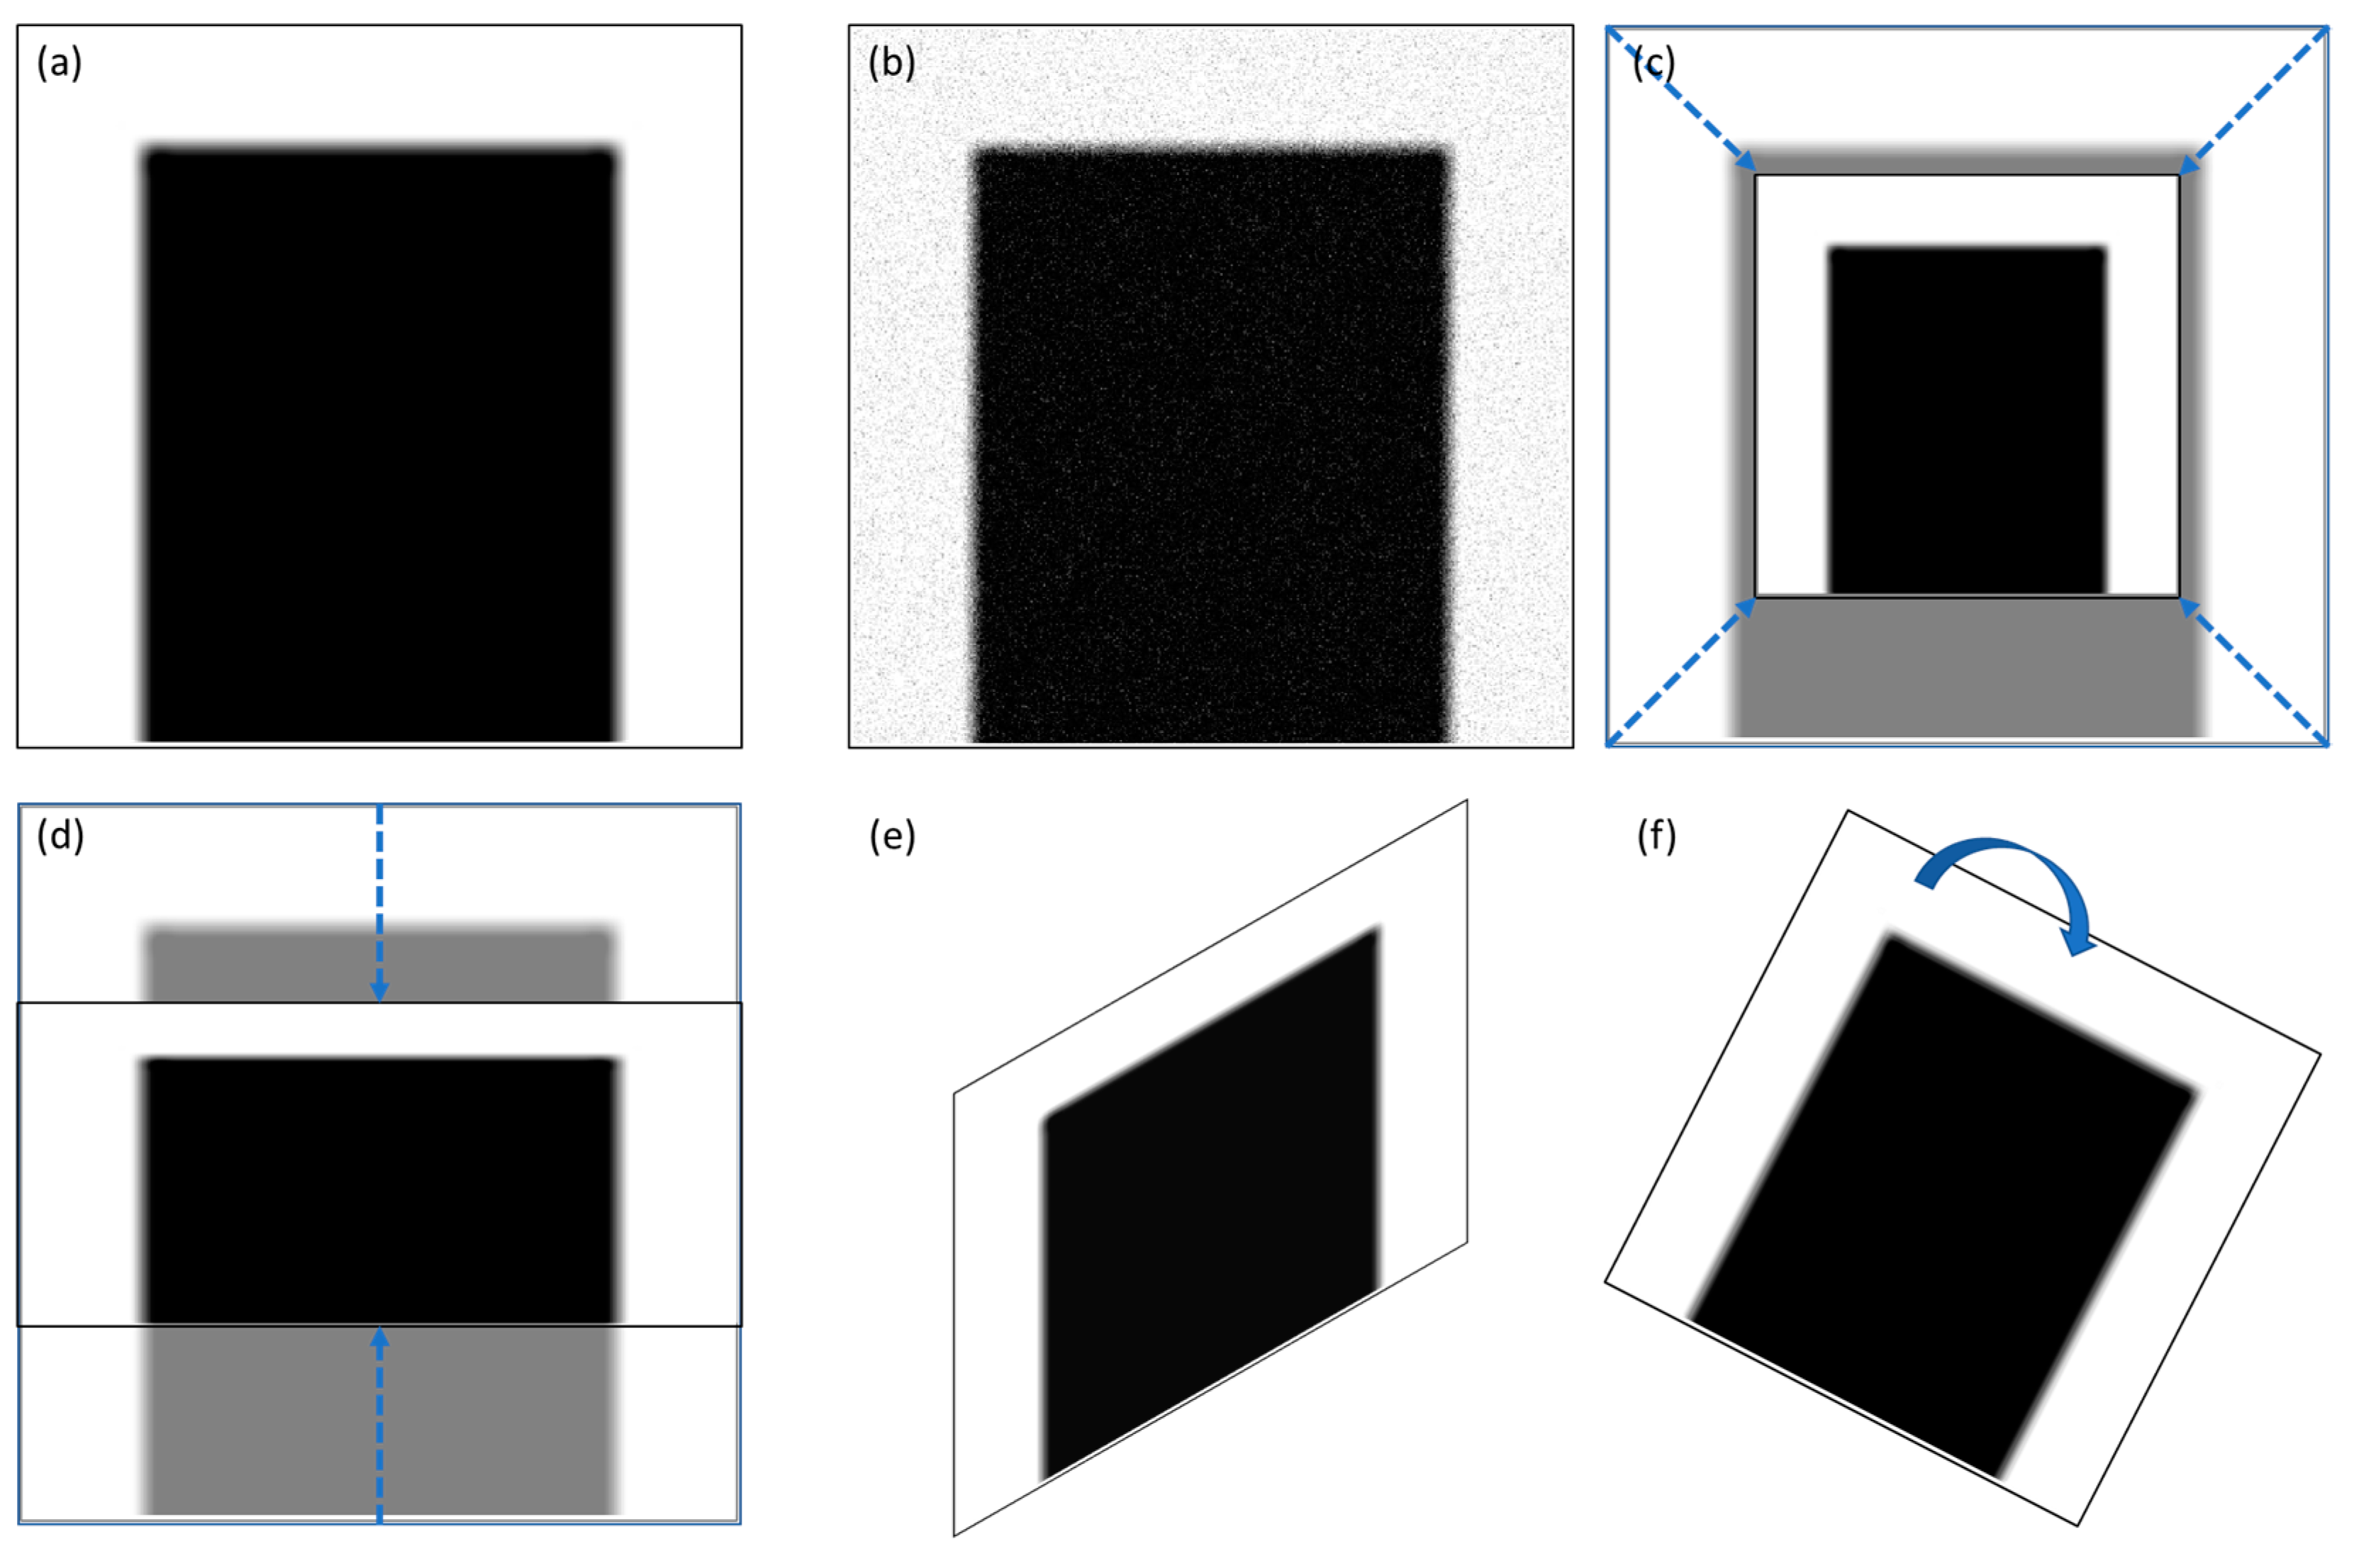
To enhance the generalizability of rip current image masks, image augmentation was applied to the rip current masks to account for variations in rip current patterns and differences caused by camera angle or distance during image acquisition. This approach enhances the generalizability of the rip current masks during image convolution. Five common augmentation methods, including rotation, vertical flipping, horizontal flipping, scaling, and distortion, are utilized. After image augmentation, the originally simple masks—comprising white pixels on both sides (representing the breaking wave zones) and black pixels in the center (representing the rip current channel)—can be adapted to simulate more realistic scenarios. These include variations in coastline orientation, distorted or non-perpendicular rip channels, and the presence of breaking wave noise within the rip channel. This process enhances the model’s ability to adapt to various types of rip current imagery. The parameters for image augmentation were set based on realistic conditions under which rip currents are likely to occur in actual images. The rotation angle ranges from 0 to 360 degrees in 30-degree intervals, the scaling parameter ranges from 0.5 to 3 in steps of 0.5, and the distortion level is set at 0.5 in increments of 0.1, as shown in
Figure 4. In the actual detection process, convolution is first performed using the simplest rip current mask (
Figure 4a) to calculate the similarity. If no sufficiently similar region is found, image augmentation is applied in the following order: rotation, scaling, stretching, distortion, and the addition of noise. If a region in the image reaches a similarity of 80% or higher with the augmented mask, that area is identified as a potential rip current zone. If no region meets this threshold, the image is considered to contain no rip current.
2.4.3. Frame Aggregation
Static object detection models typically focus on the current frame, neglecting the dynamic nature of rip currents, which can vary in shape and texture due to external factors like weather, wind speed, wave characteristics, water flow, debris, and sediment. Unlike objects with well-defined edges, rip currents have amorphous boundaries, resulting in bounding boxes of variable sizes and locations across adjacent video frames. To address this, we adopt temporal smoothing and frame aggregation techniques to improve the accuracy and usability of the results. This also ensures that the detection results meet the conditions of the third criterion for rip current identification proposed in this study based on image analysis [
29].
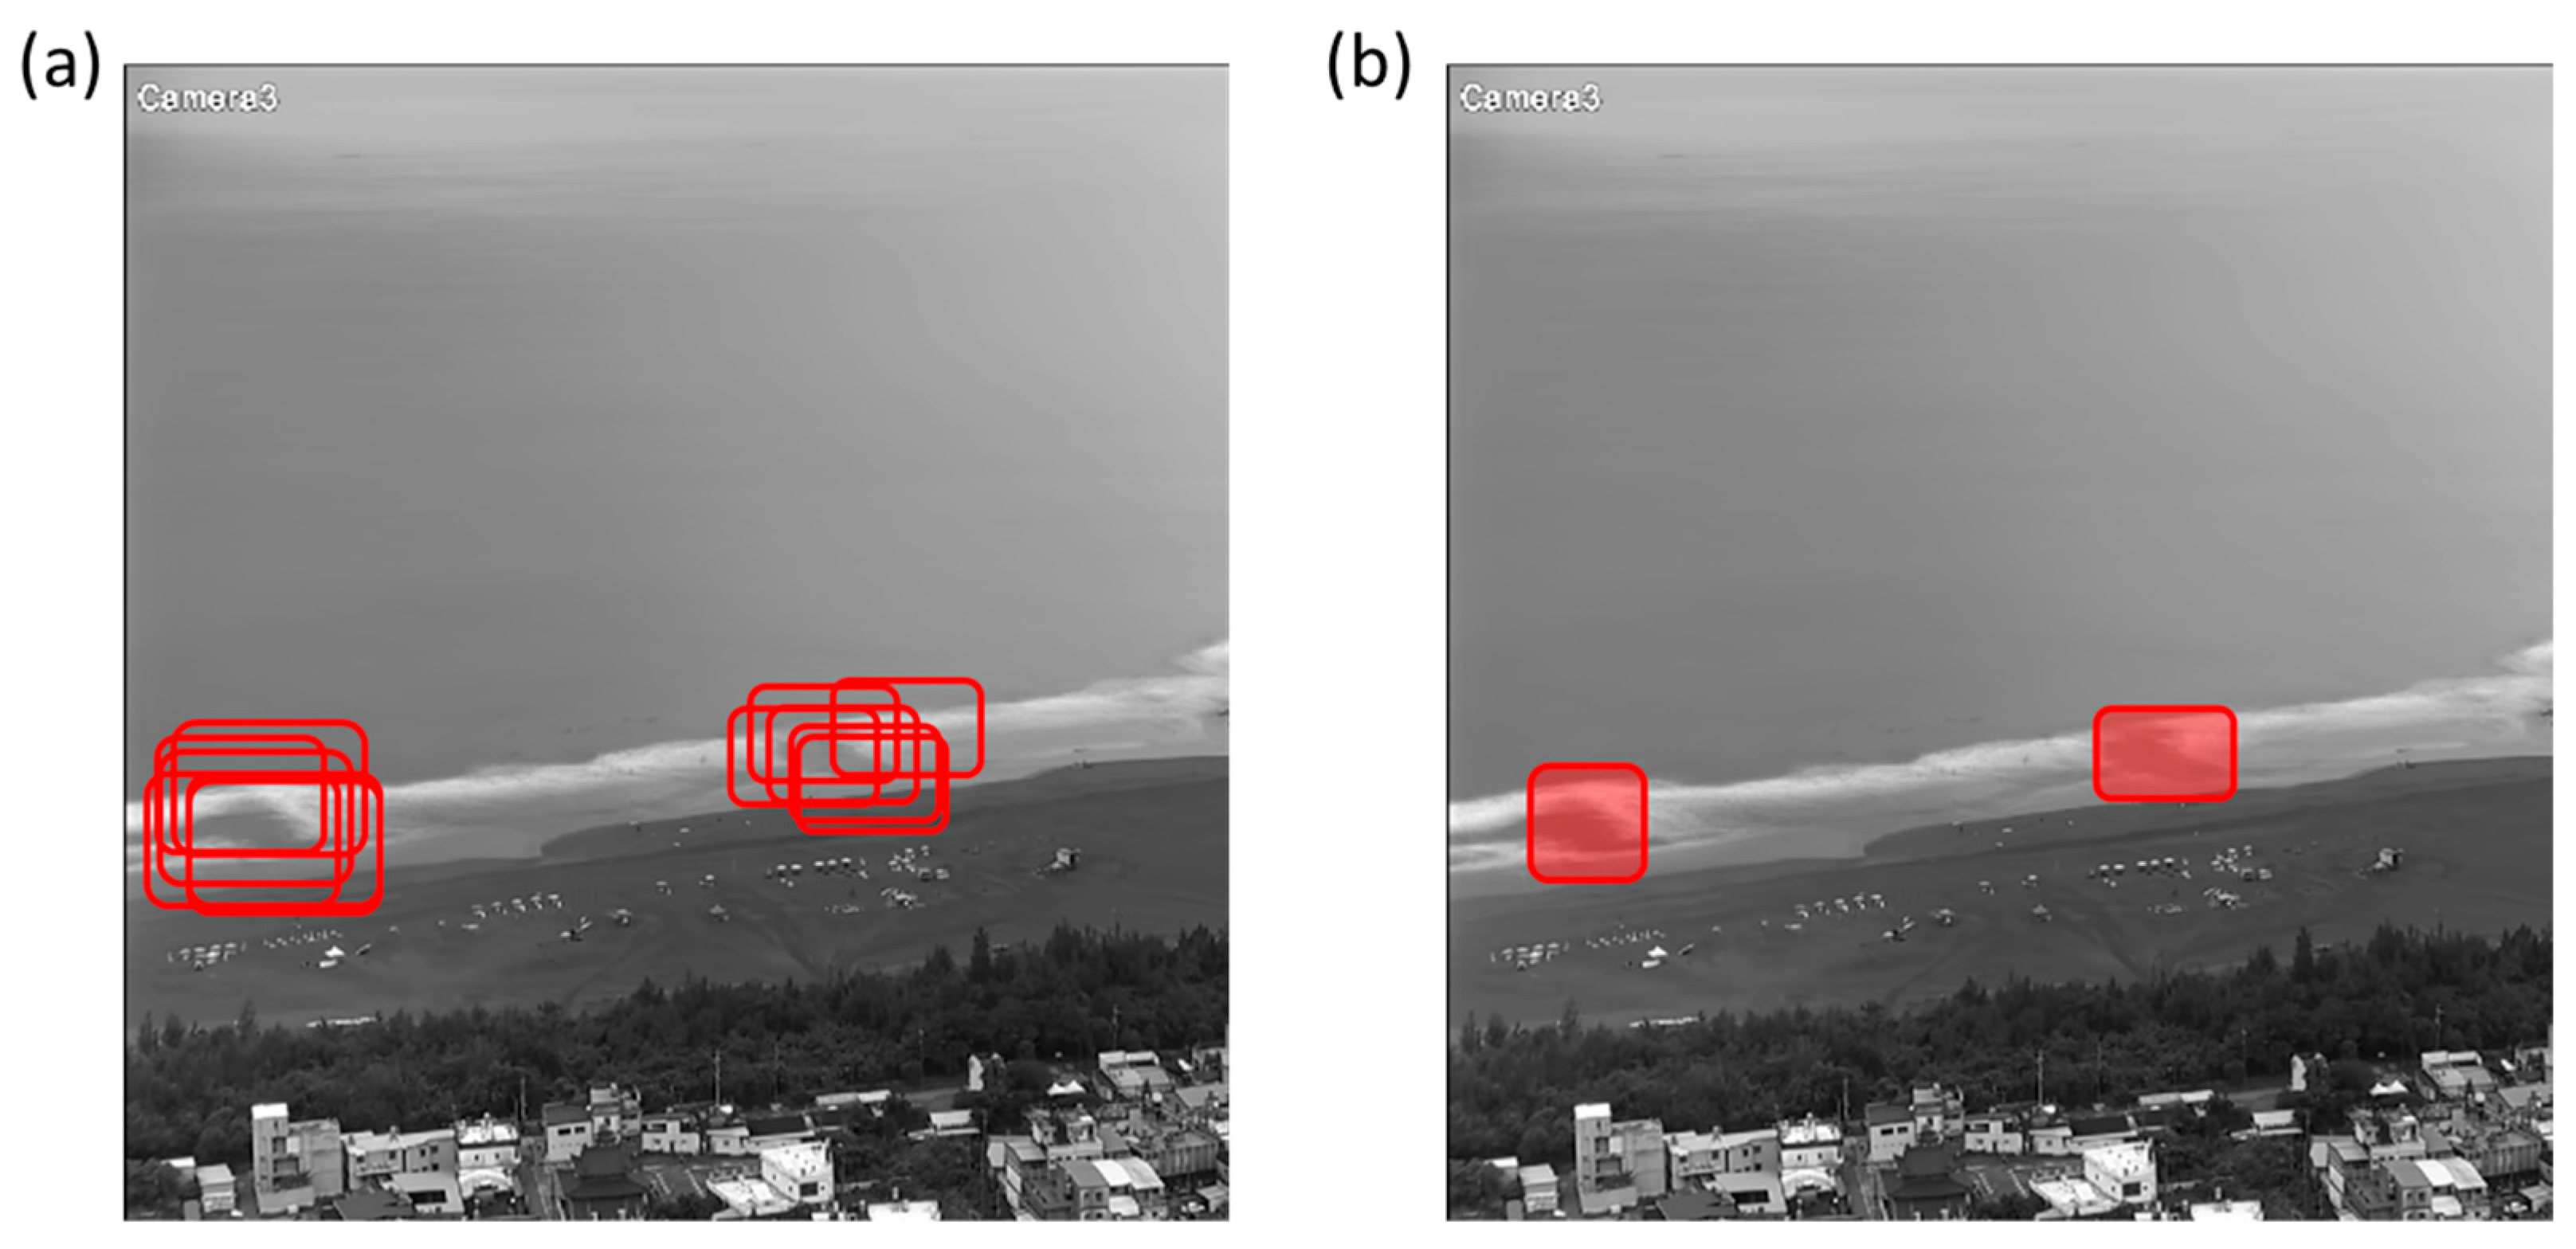
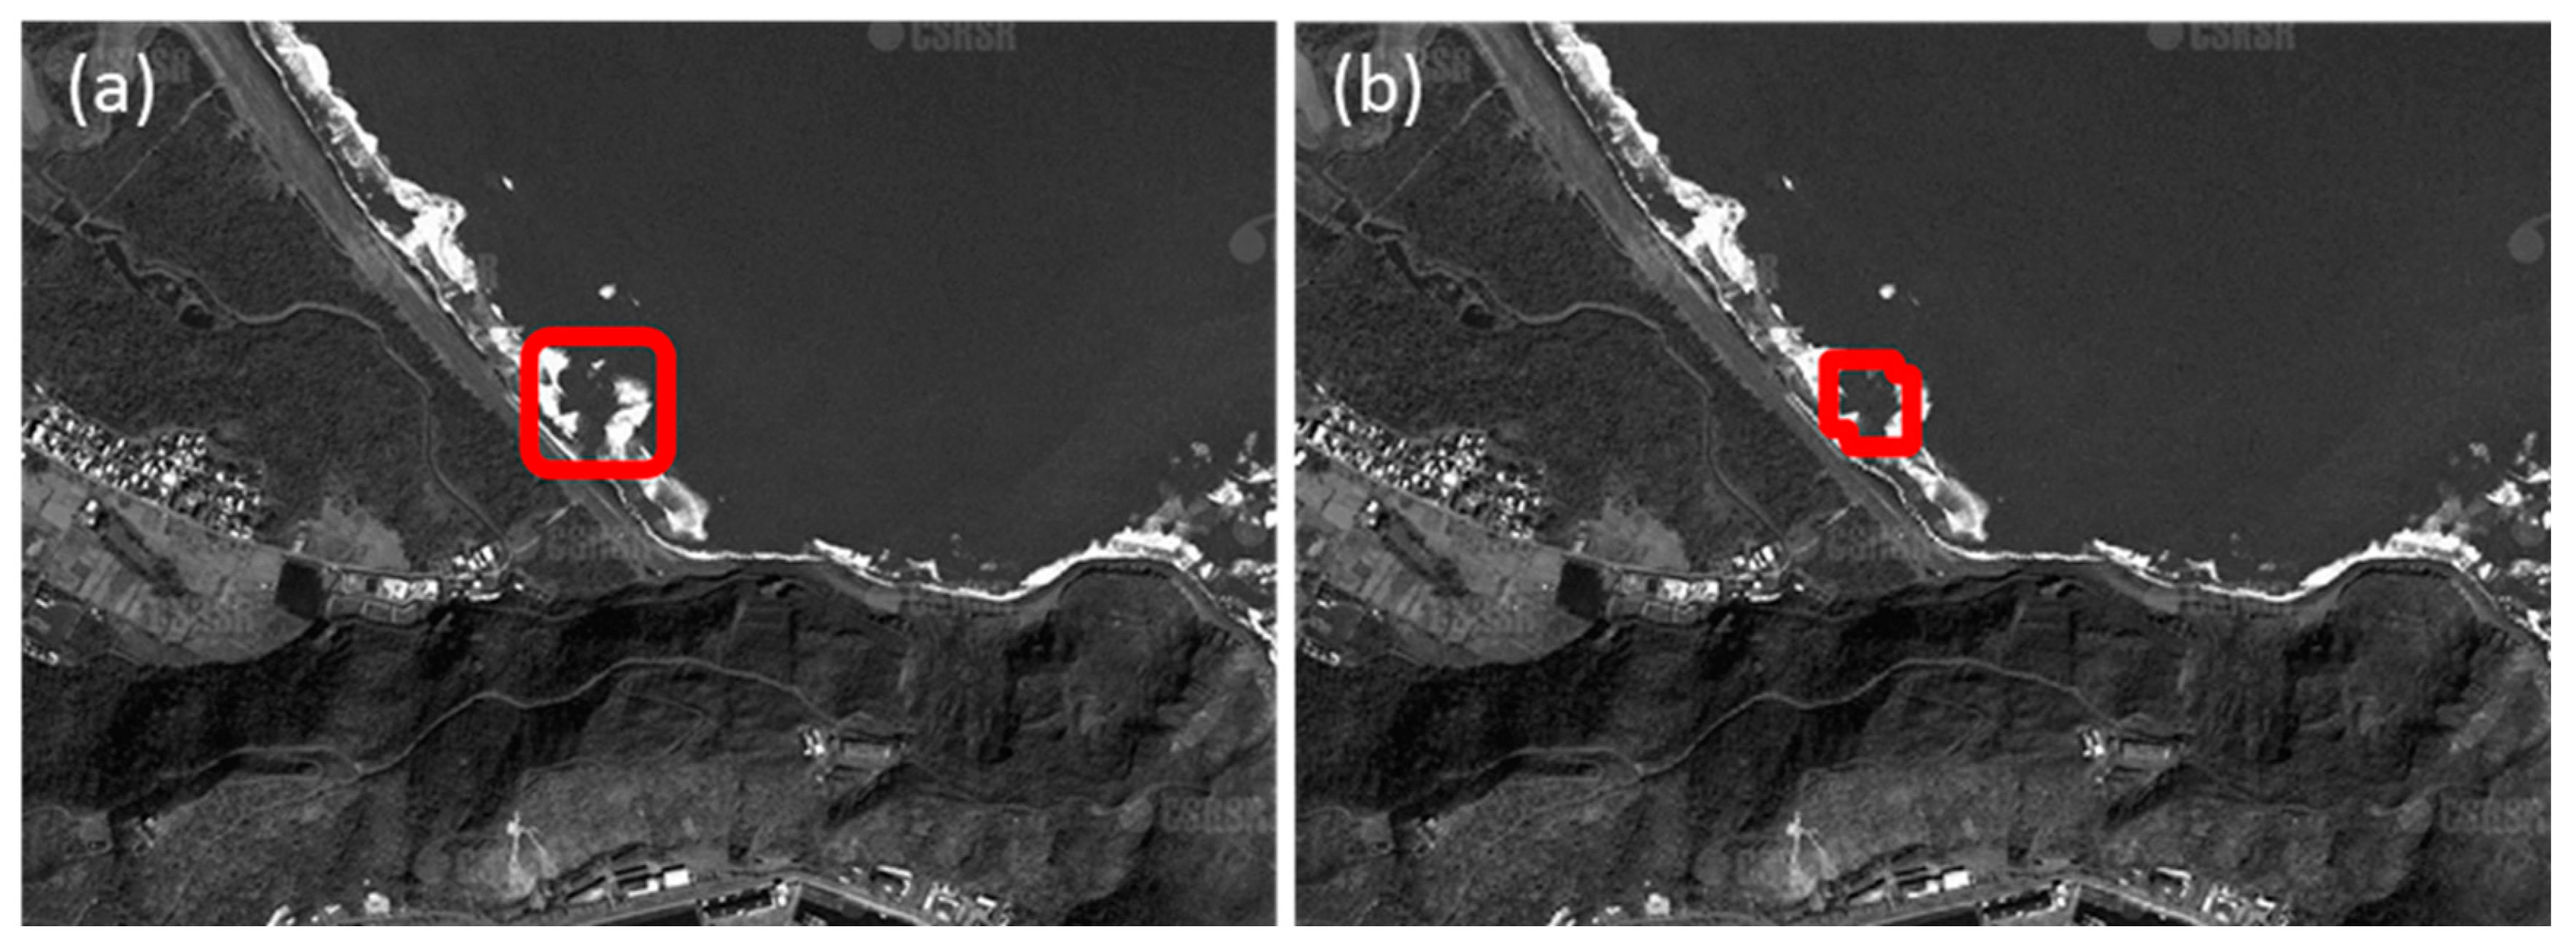
This method applies different processing approaches for satellite imagery and camera imagery. When applied to satellite images, the primary purpose of the frame aggregation method is to more accurately delineate the location of rip current occurrences. A cumulative buffer matrix with the same dimensions as the input image is used to record overlapping areas where the similarity between the mask and the wavelet-transformed image exceeds 80%. Each time such a region is detected, its corresponding pixel count (T) in the cumulative buffer is incremented by 1. If a total of N valid detections are recorded, the coverage ratio (T/N) can be calculated for each pixel in the cumulative buffer. When the pixel coverage ratio in a specific region reaches 0.8—meaning that 80% of the detected images indicate the same location—this region is identified as the primary rip current occurrence zone, as shown in
Figure 5.
In camera image data, we similarly employ an accumulation buffer with the same size as the input frame to identify overlapping regions of detected bounding boxes. A temporal packet of the N average images is considered to build the accumulation buffer. The buffer increments by 1 for each region within a detection bounding box in each average images. From frame N onwards, the area covered by a detection bounding box increments by 1, capped at a maximum of N. Regions not covered by a detection bounding box are unchanged, with a minimum of 0 in the accumulation buffer. This sliding packet approach allows us to track the bounding boxes across N average images. The accumulated regions in the buffer, where the value is at least T, are used to draw the tightest possible axis-aligned bounding box around the area. This aggregated detection process helps identify a single bounding box from the collection of bounding boxes. Our implementation uses N = 10 and T = 8 for optimal results.
Finally, to satisfy the fifth criterion for rip current identification, when two rip current regions are detected simultaneously, the regions delineated by the frame aggregation method are used to calculate their respective centroids. Based on the image resolution and the pixel distance between the two centroids, the actual physical distance between the rip currents can be determined. If this distance exceeds 40 m, the two regions are considered independent rip currents. Otherwise, they are regarded as part of the same rip current channel.
4. Conclusions
In this research, we propose a program for interpreting rip currents from images. Five criteria for rip currents on images are also proposed based on the literature and experience. The core concepts of the interpretation method involve wavelet edge detection and image convolution. The wavelet edge detection method can enhance regions of breaking waves, and image convolution can interpret the locations of rip currents in images. To increase the generality and accuracy of the image interpretation results, three techniques are used: image augmentation, image averaging, and frame aggregation. Image augmentation involves rotation, distortion, scaling, noise addition, and extension. Image averaging and frame aggregation involve image averaging every minute and frame aggregation (N = 10) every ten minutes, with rip current coverage exceeding 80% (T = 8).
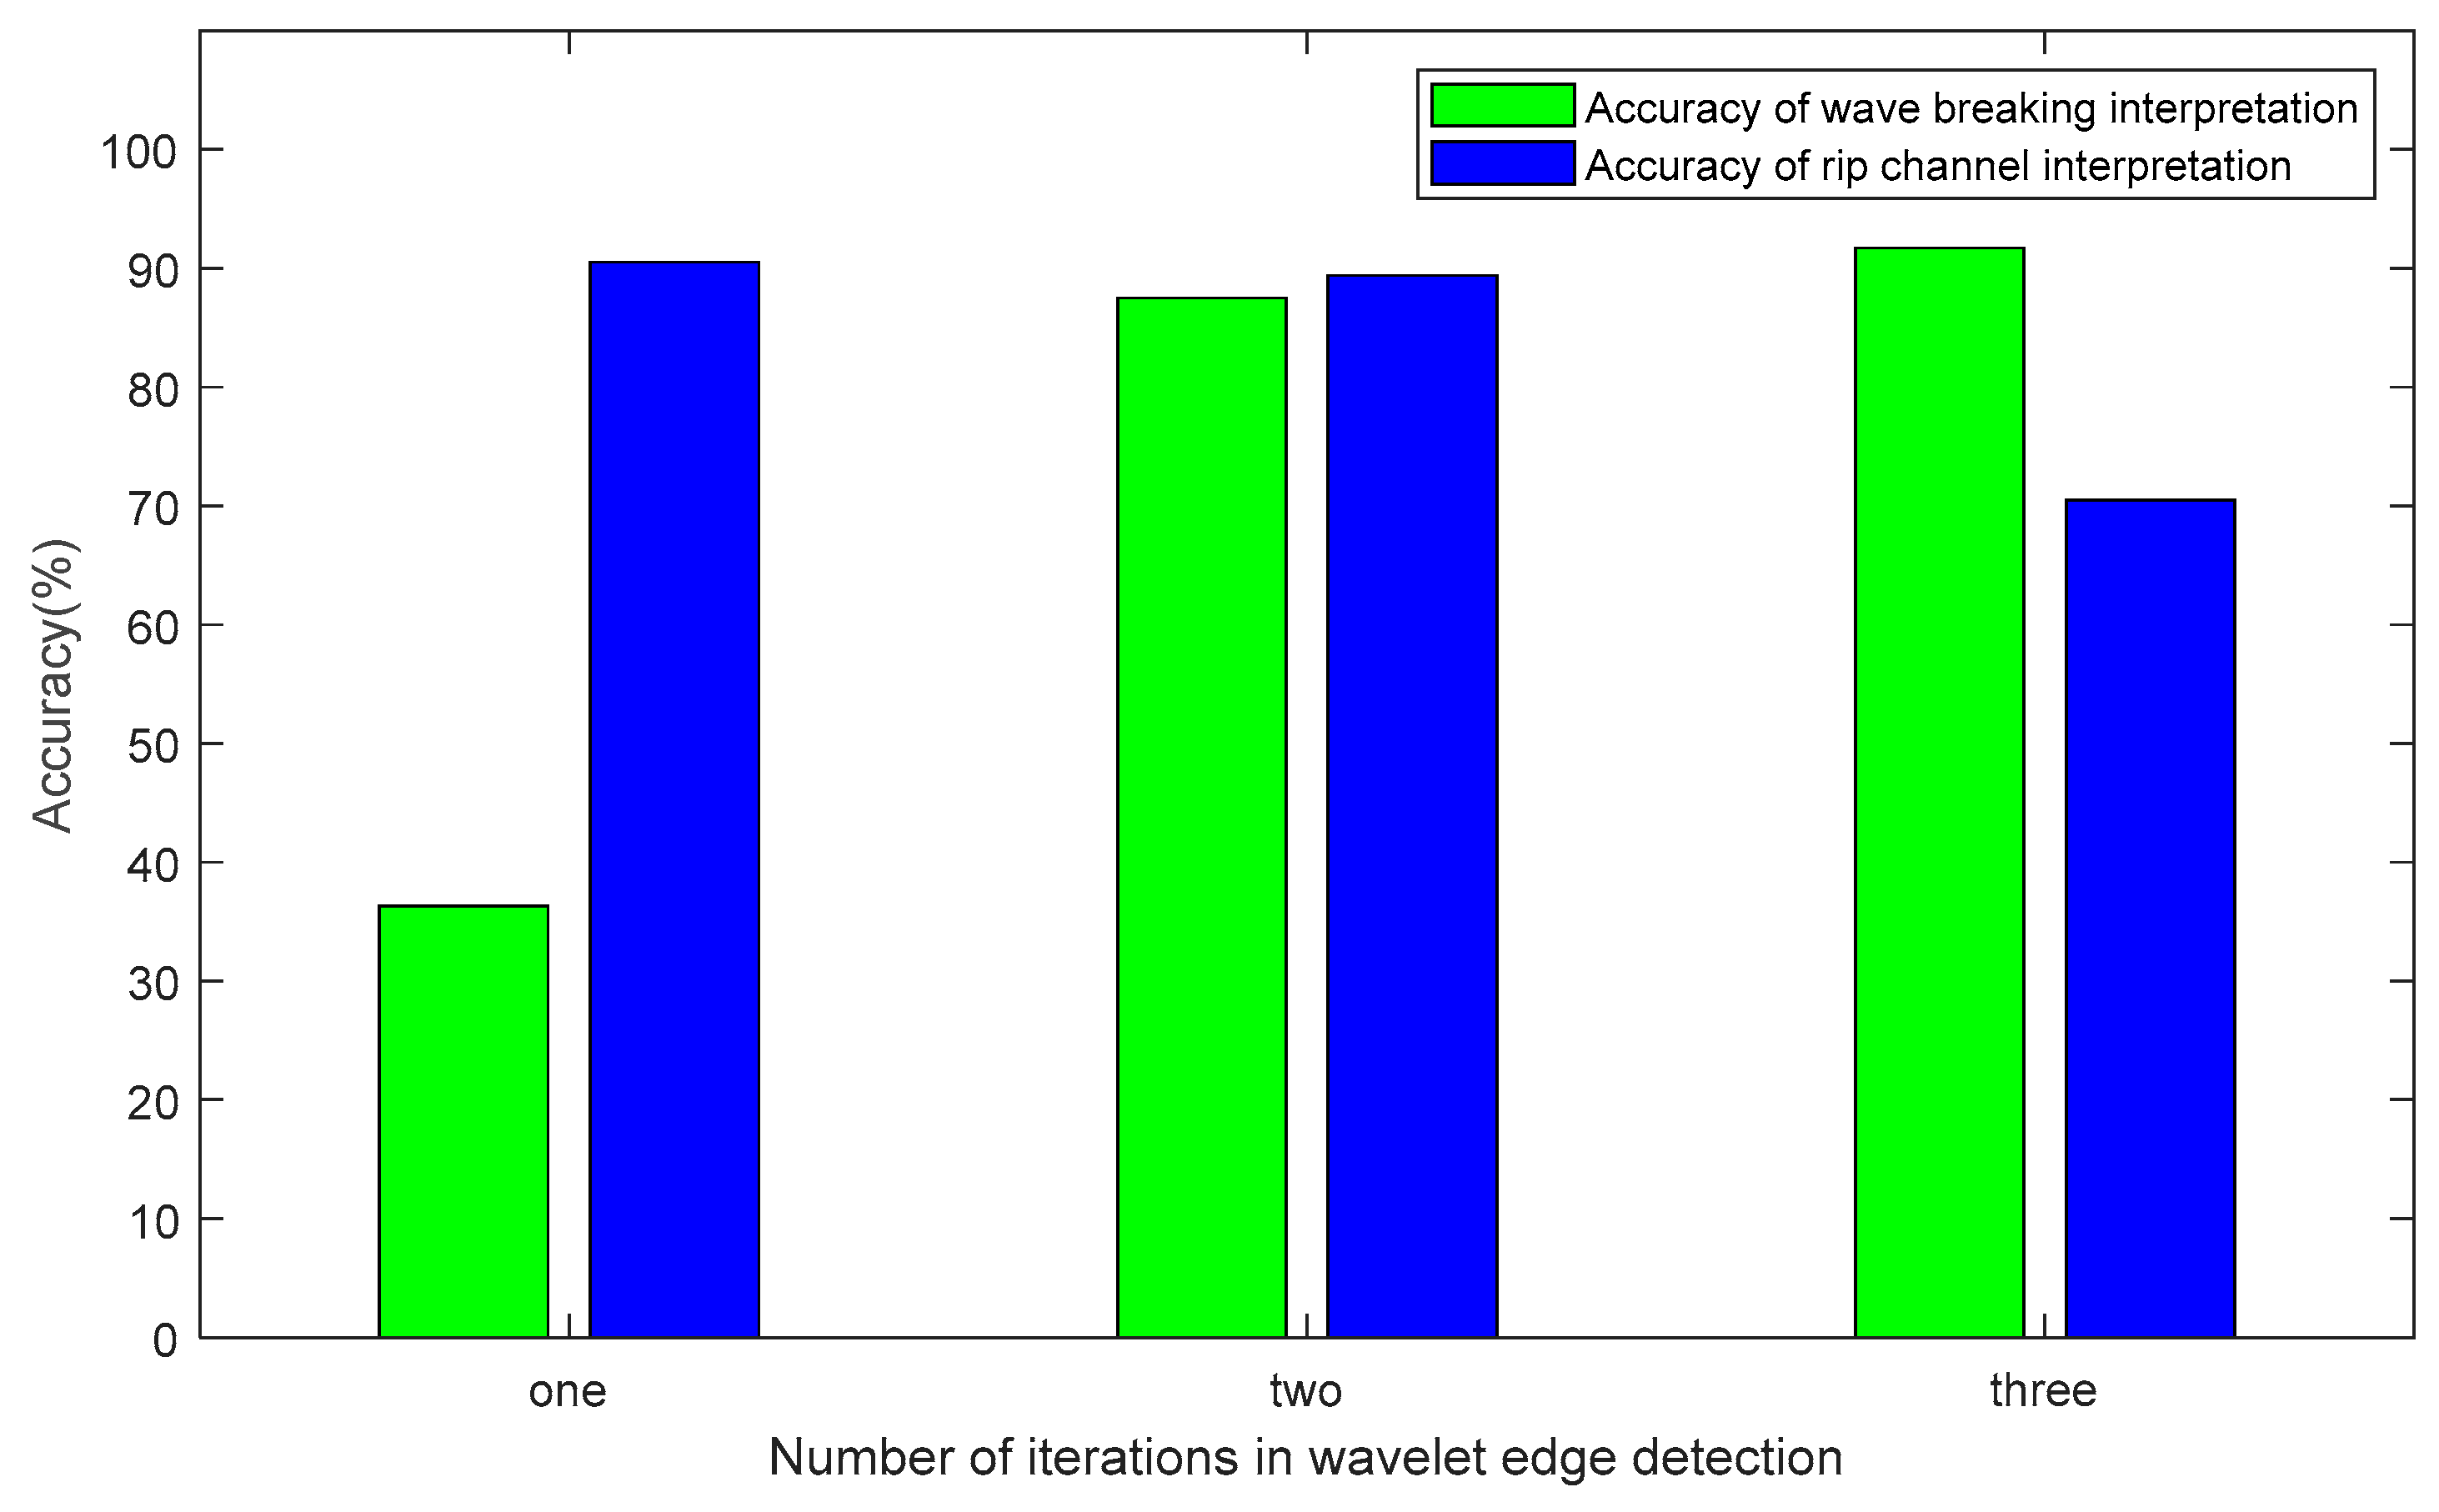
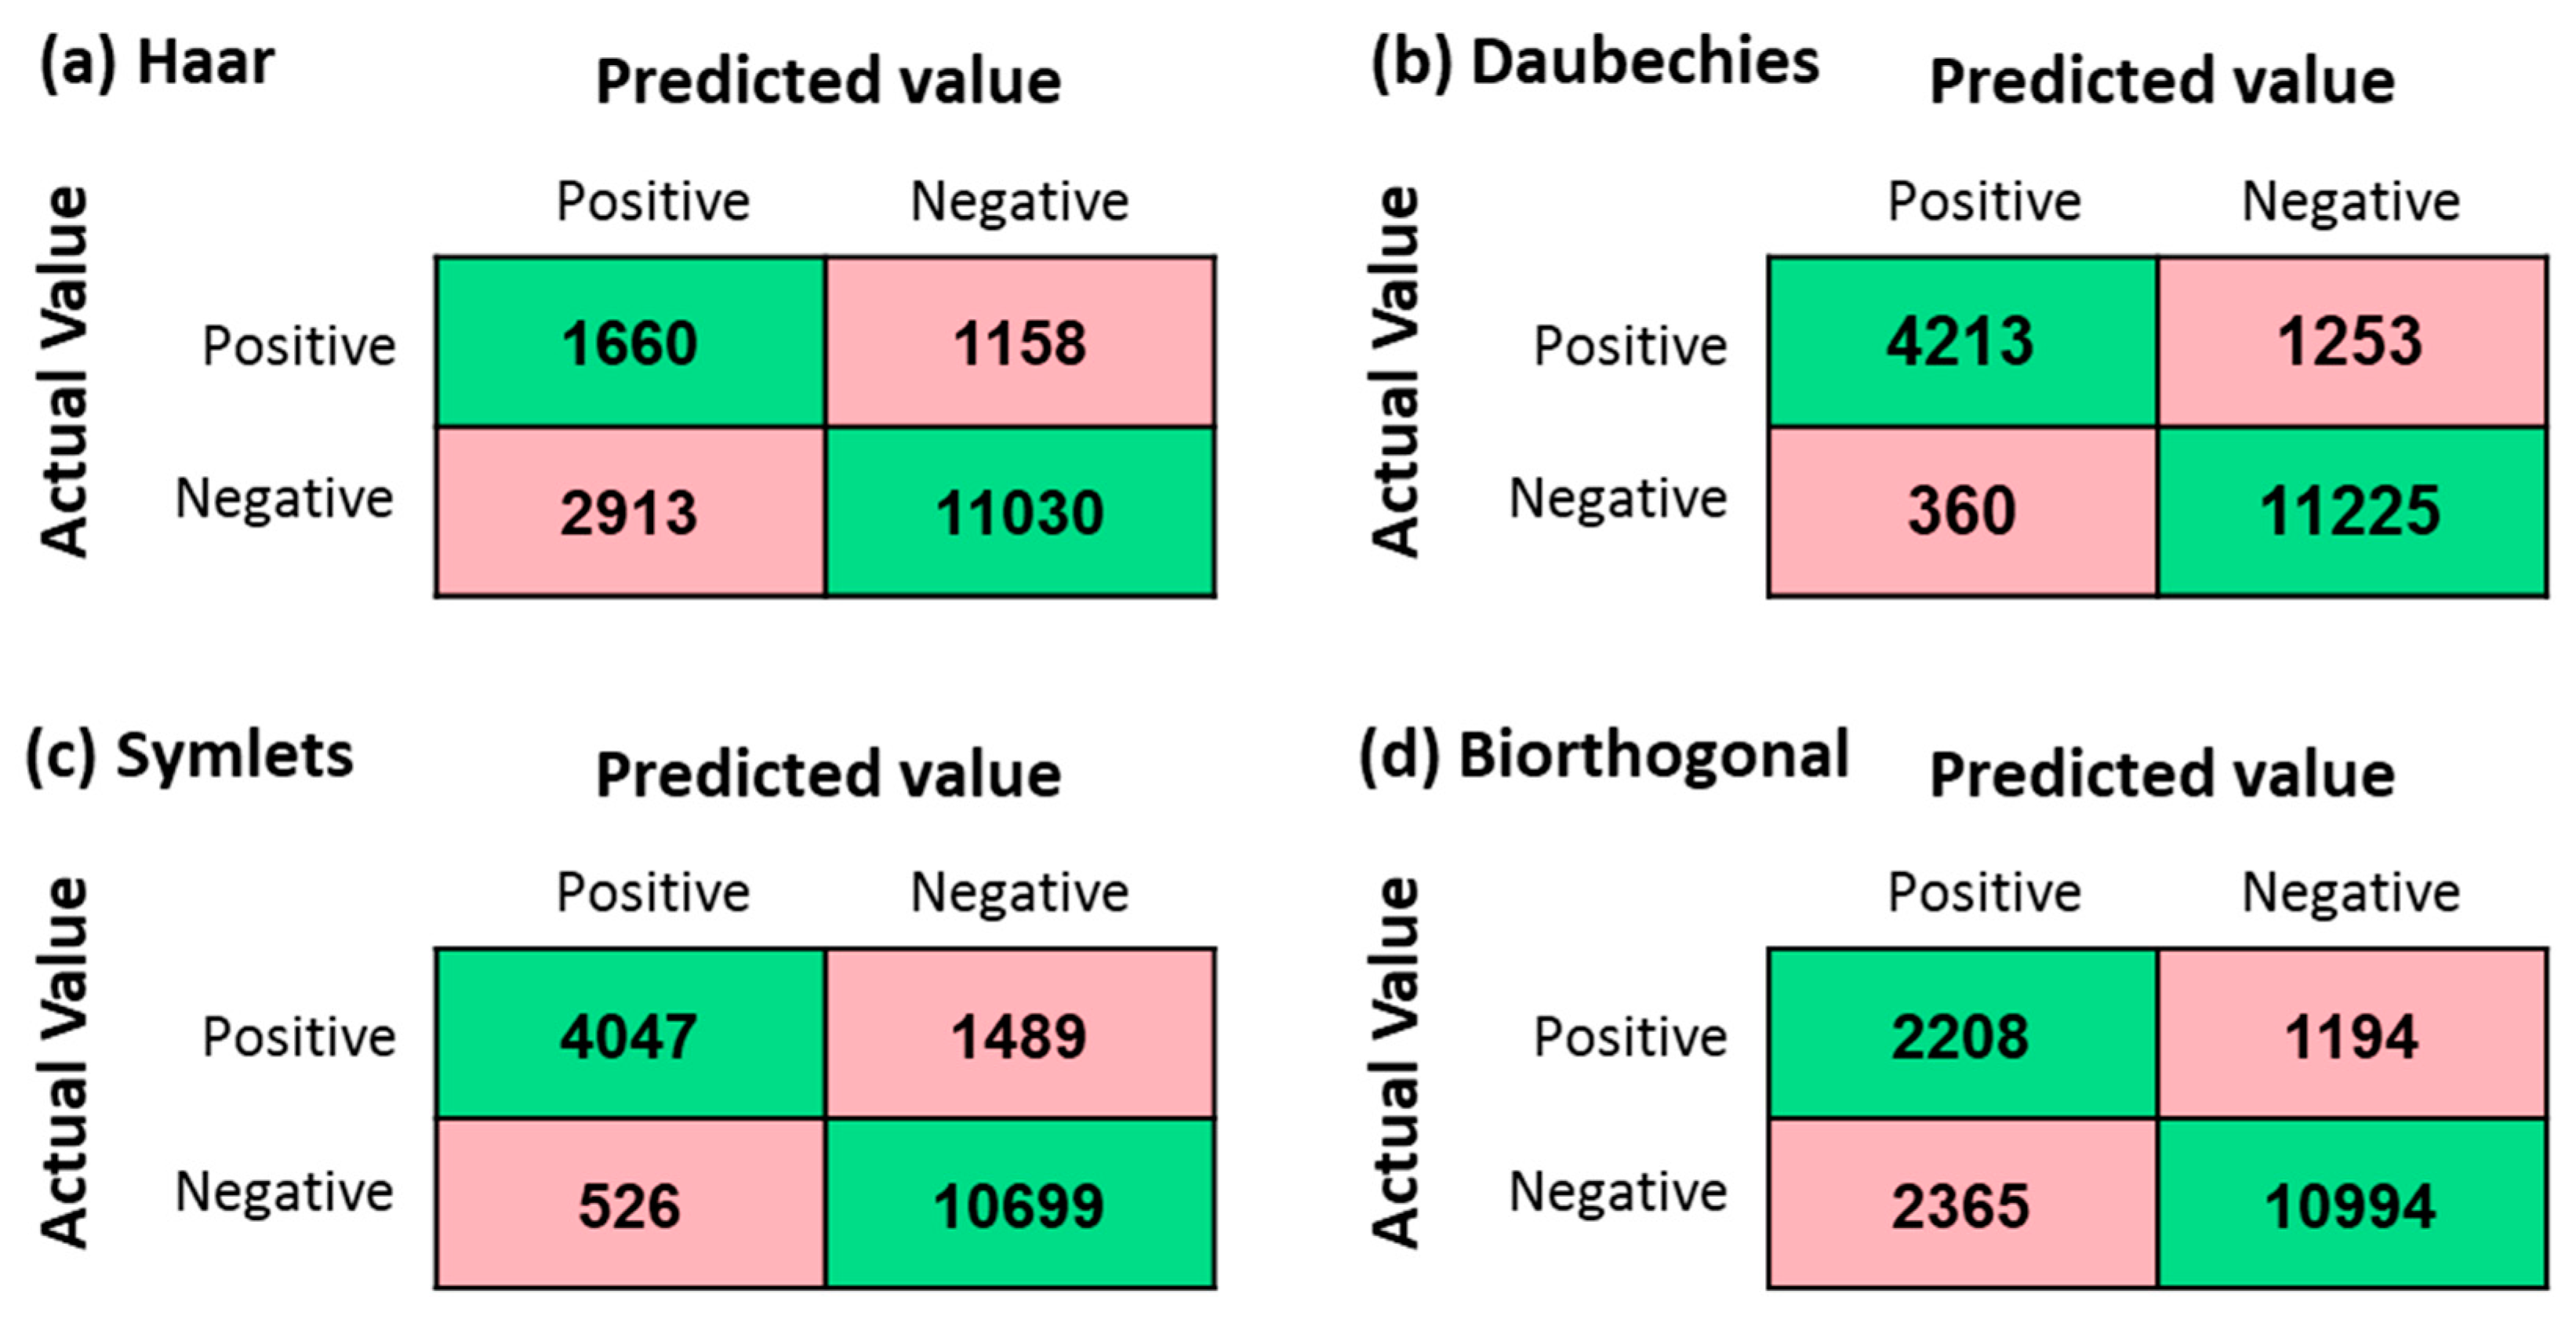
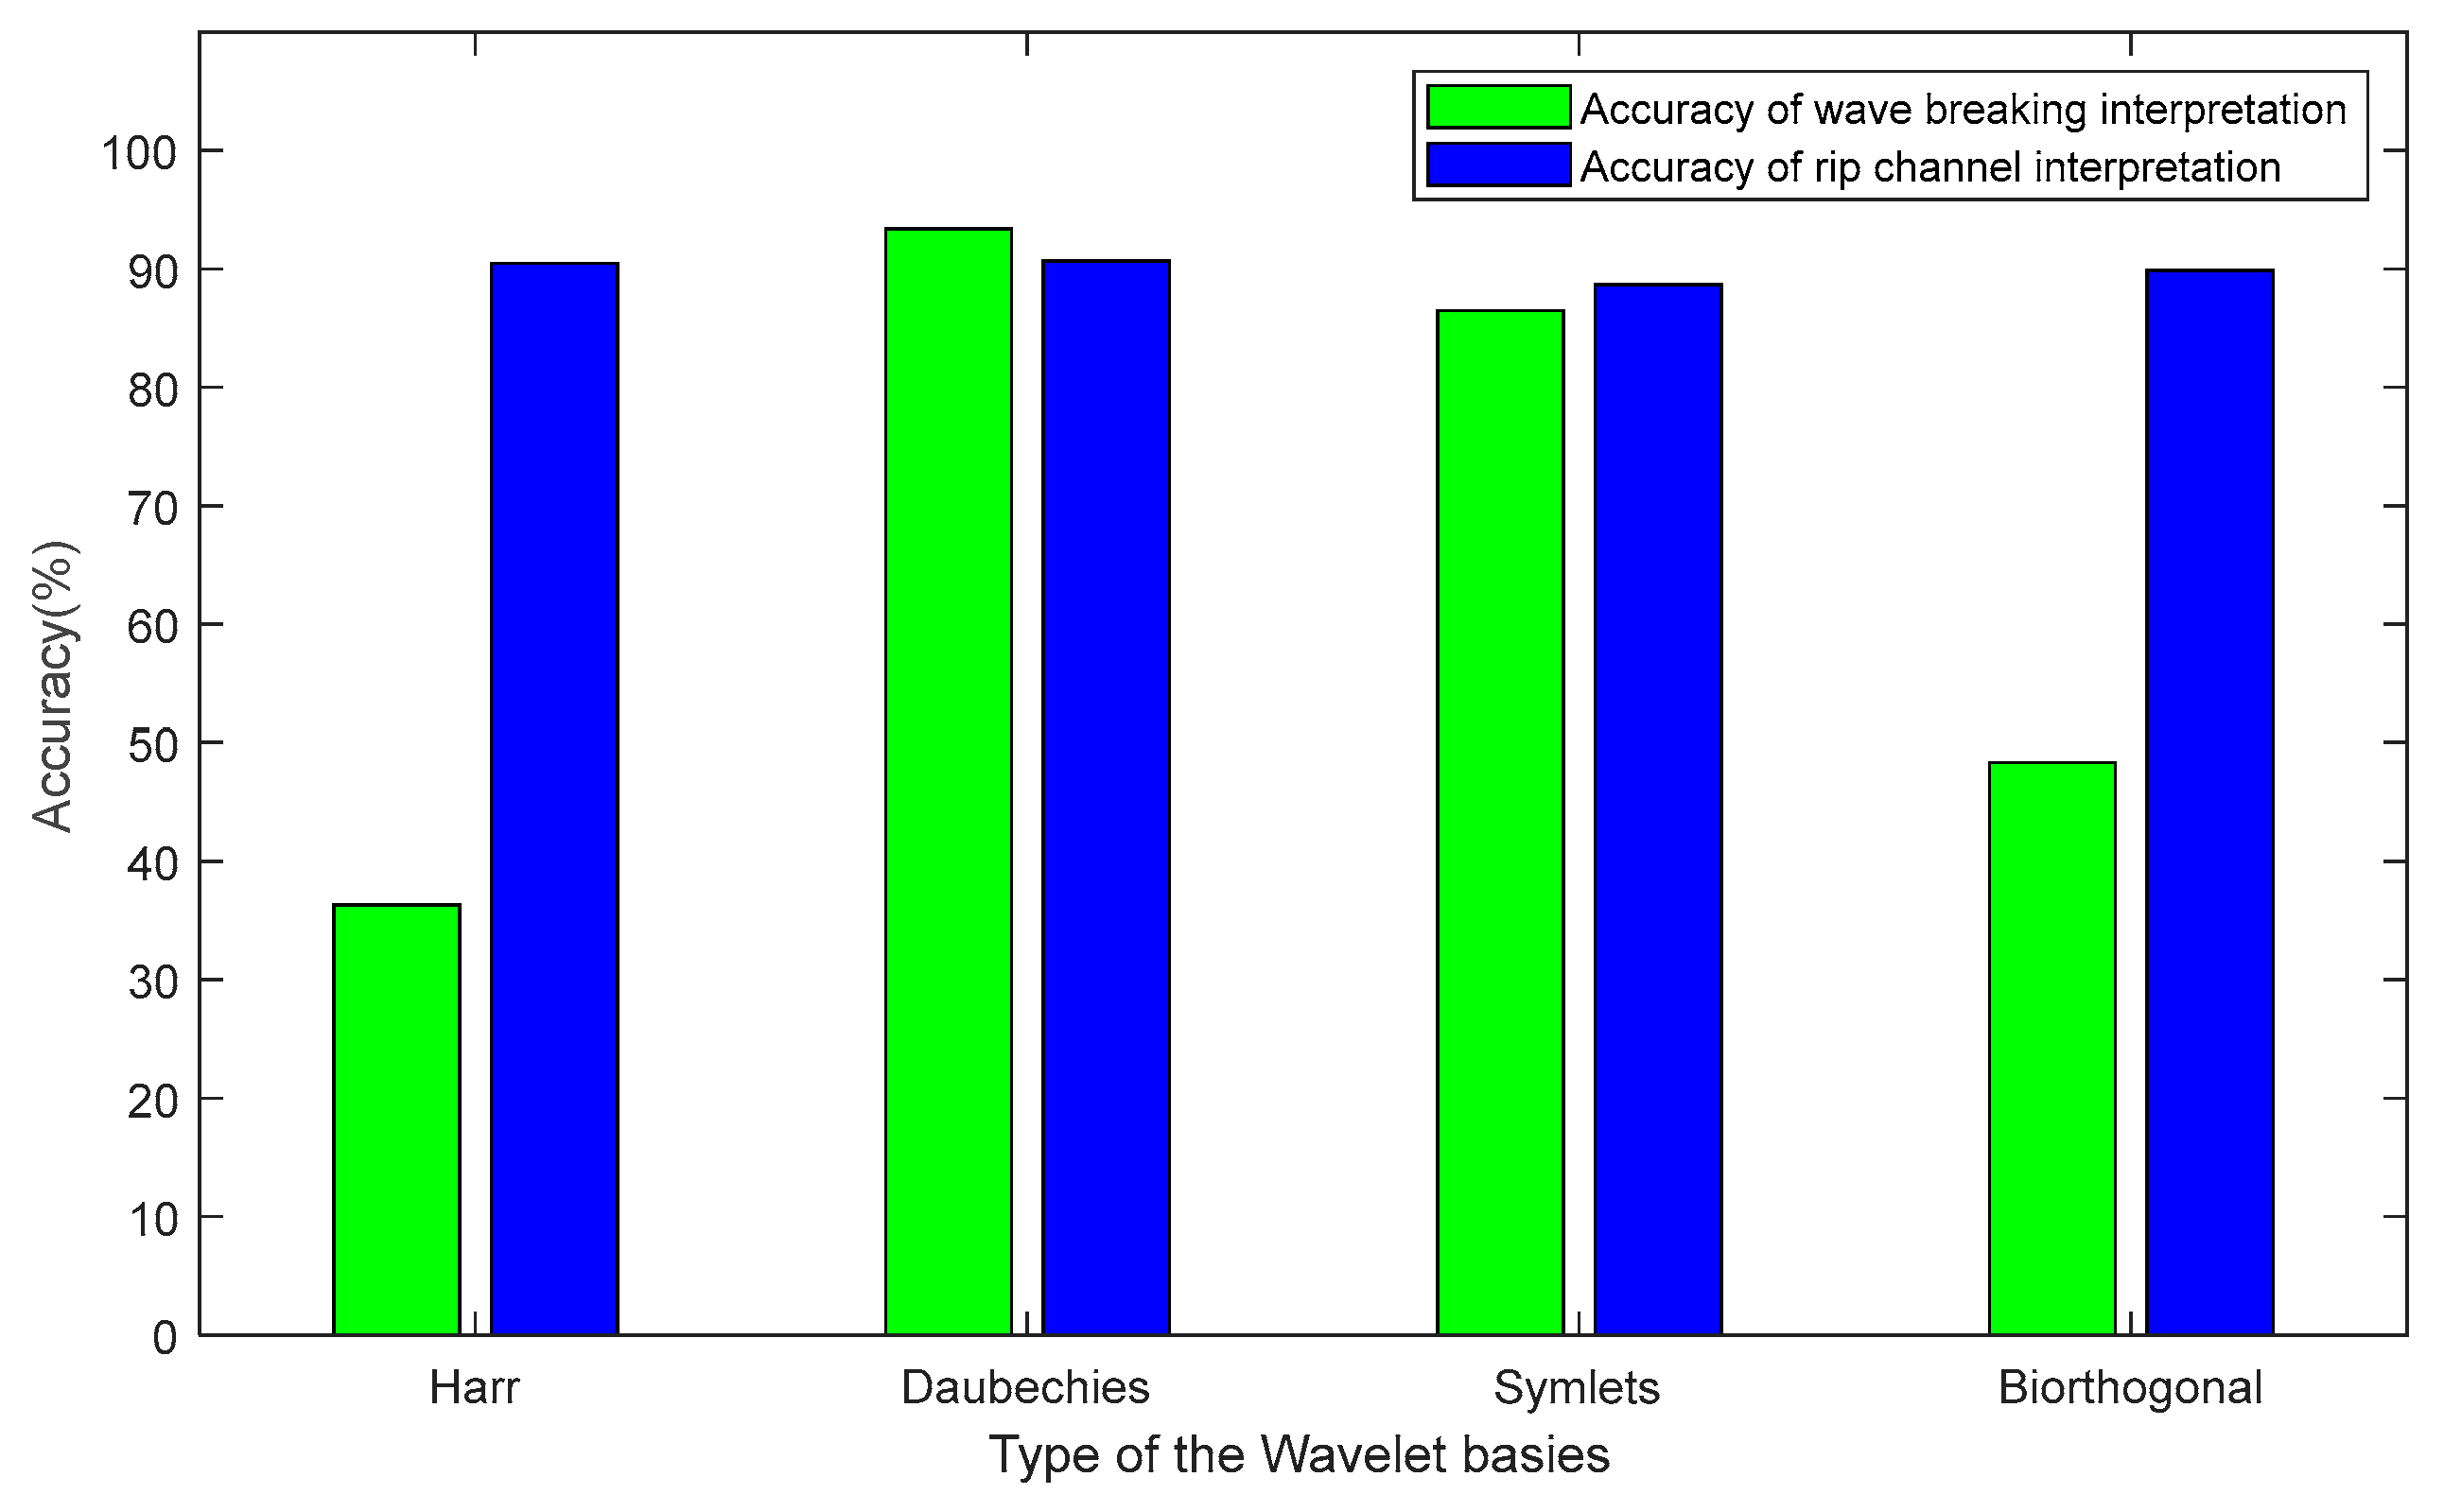
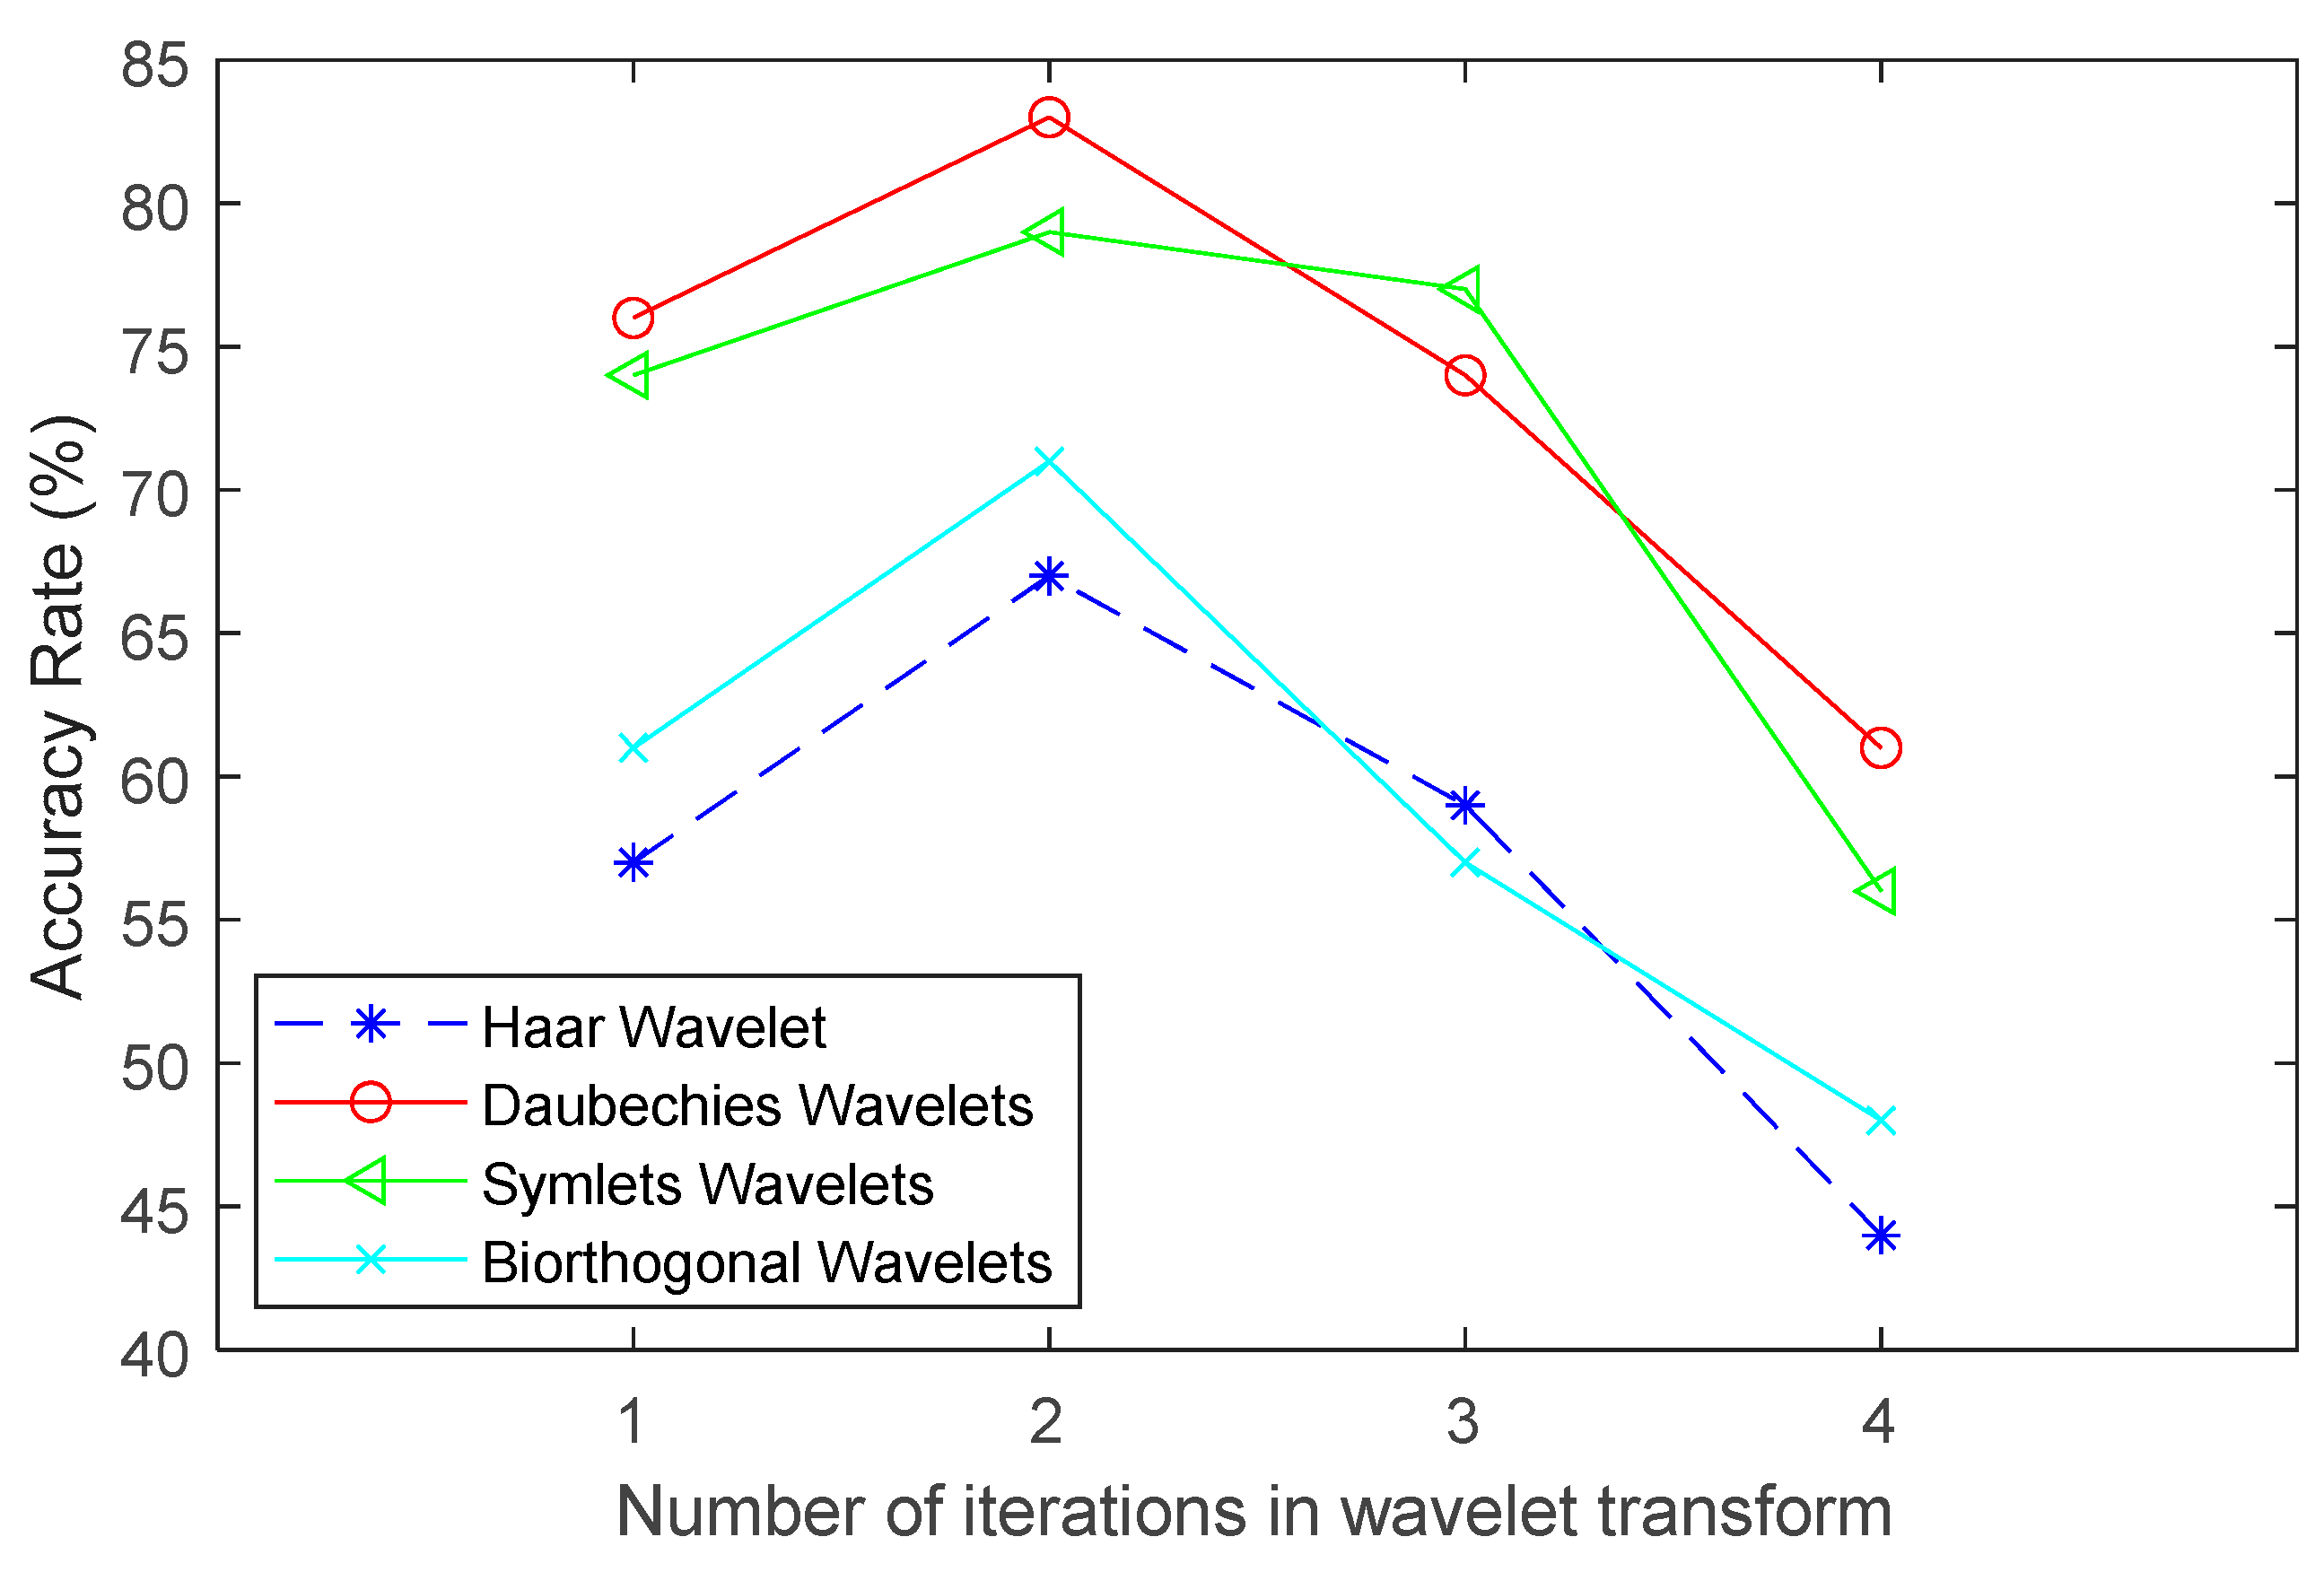
However, there are significant differences in the results of signal extraction from images when using different numbers of iterations and various types of wavelet bases. We experimented with four iterations and four different types of wavelet bases for the wavelet edge detection method. The results show that two iterations yielded the best results, with an overall interpretation success rate of 88.3% when compared to manually interpreted results. Therefore, four wavelet bases were experimented with, including Haar, Daubechies, Symlet, and biorthogonal wavelet bases. The results indicate that the Haar and biorthogonal wavelets yielded similar outcomes, both failing to capture most of the breaking wave features in the imagery. In contrast, the Daubechies and Symlet wavelets performed well in identifying both breaking waves and rip current channels. Among these, the Daubechies wavelet—characterized by high-order vanishing moments and relatively asymmetric properties—demonstrated the best performance in enhancing breaking wave features, achieving an accuracy of up to 90.7%.
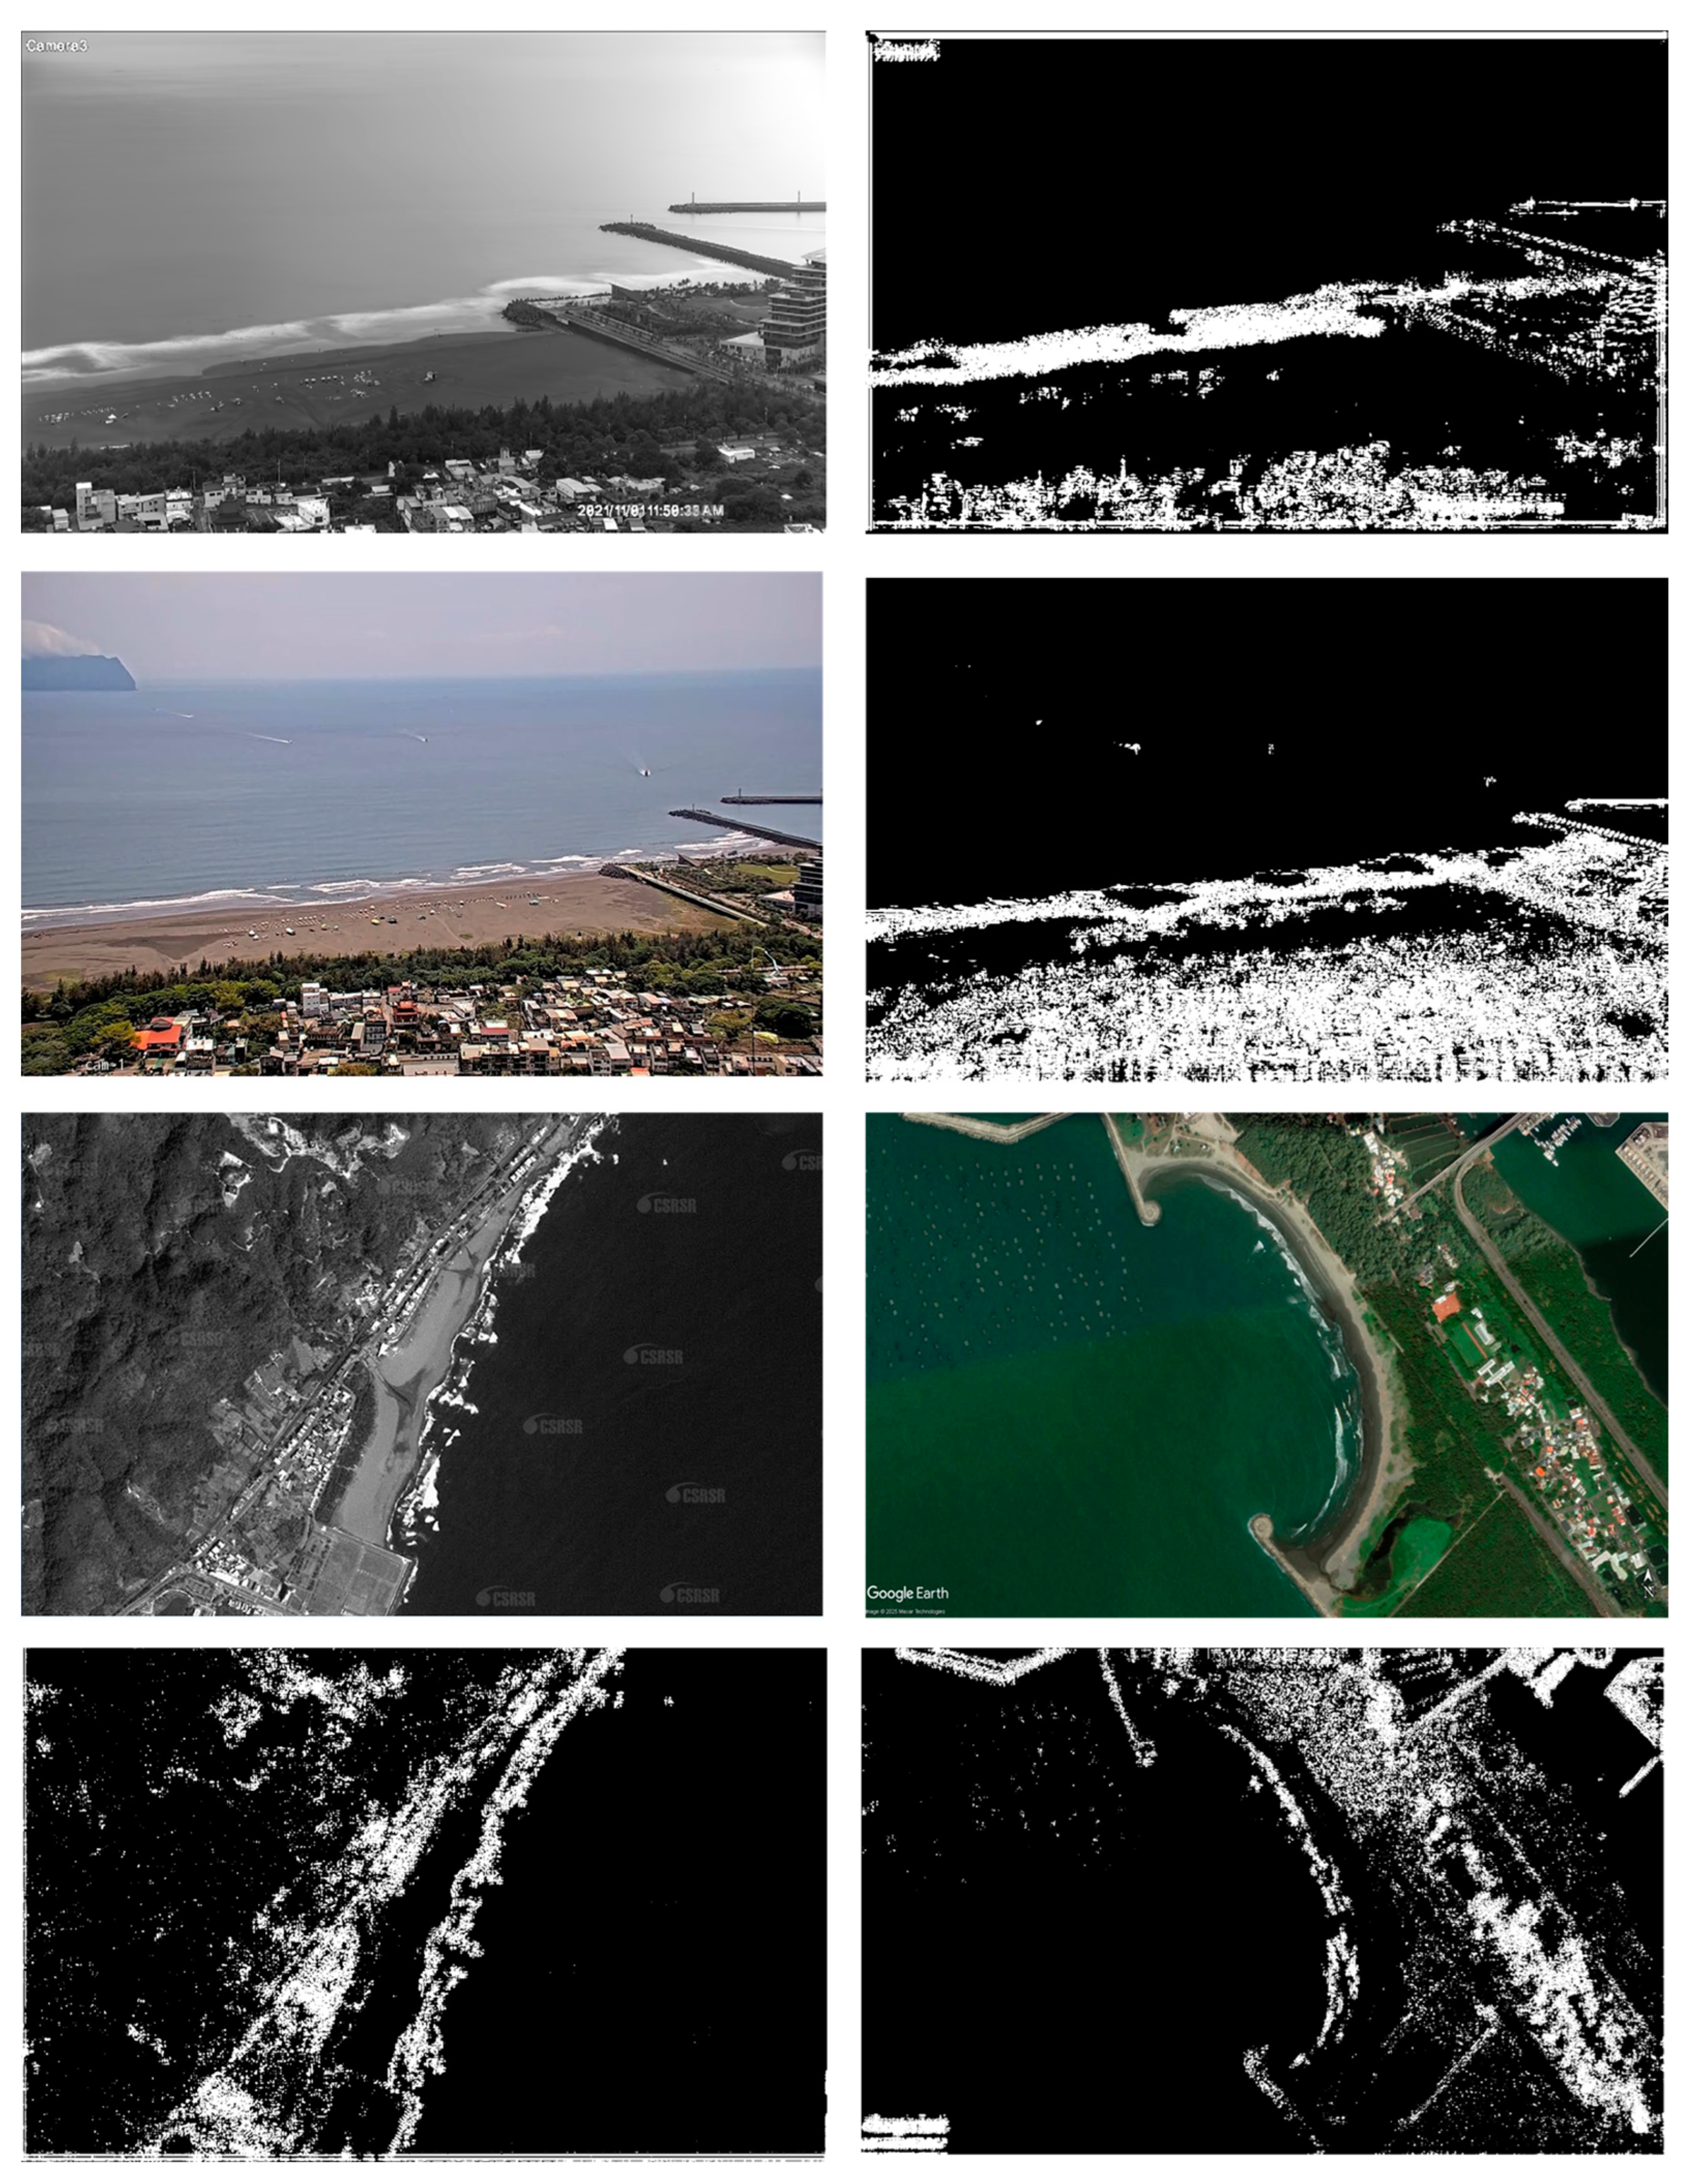
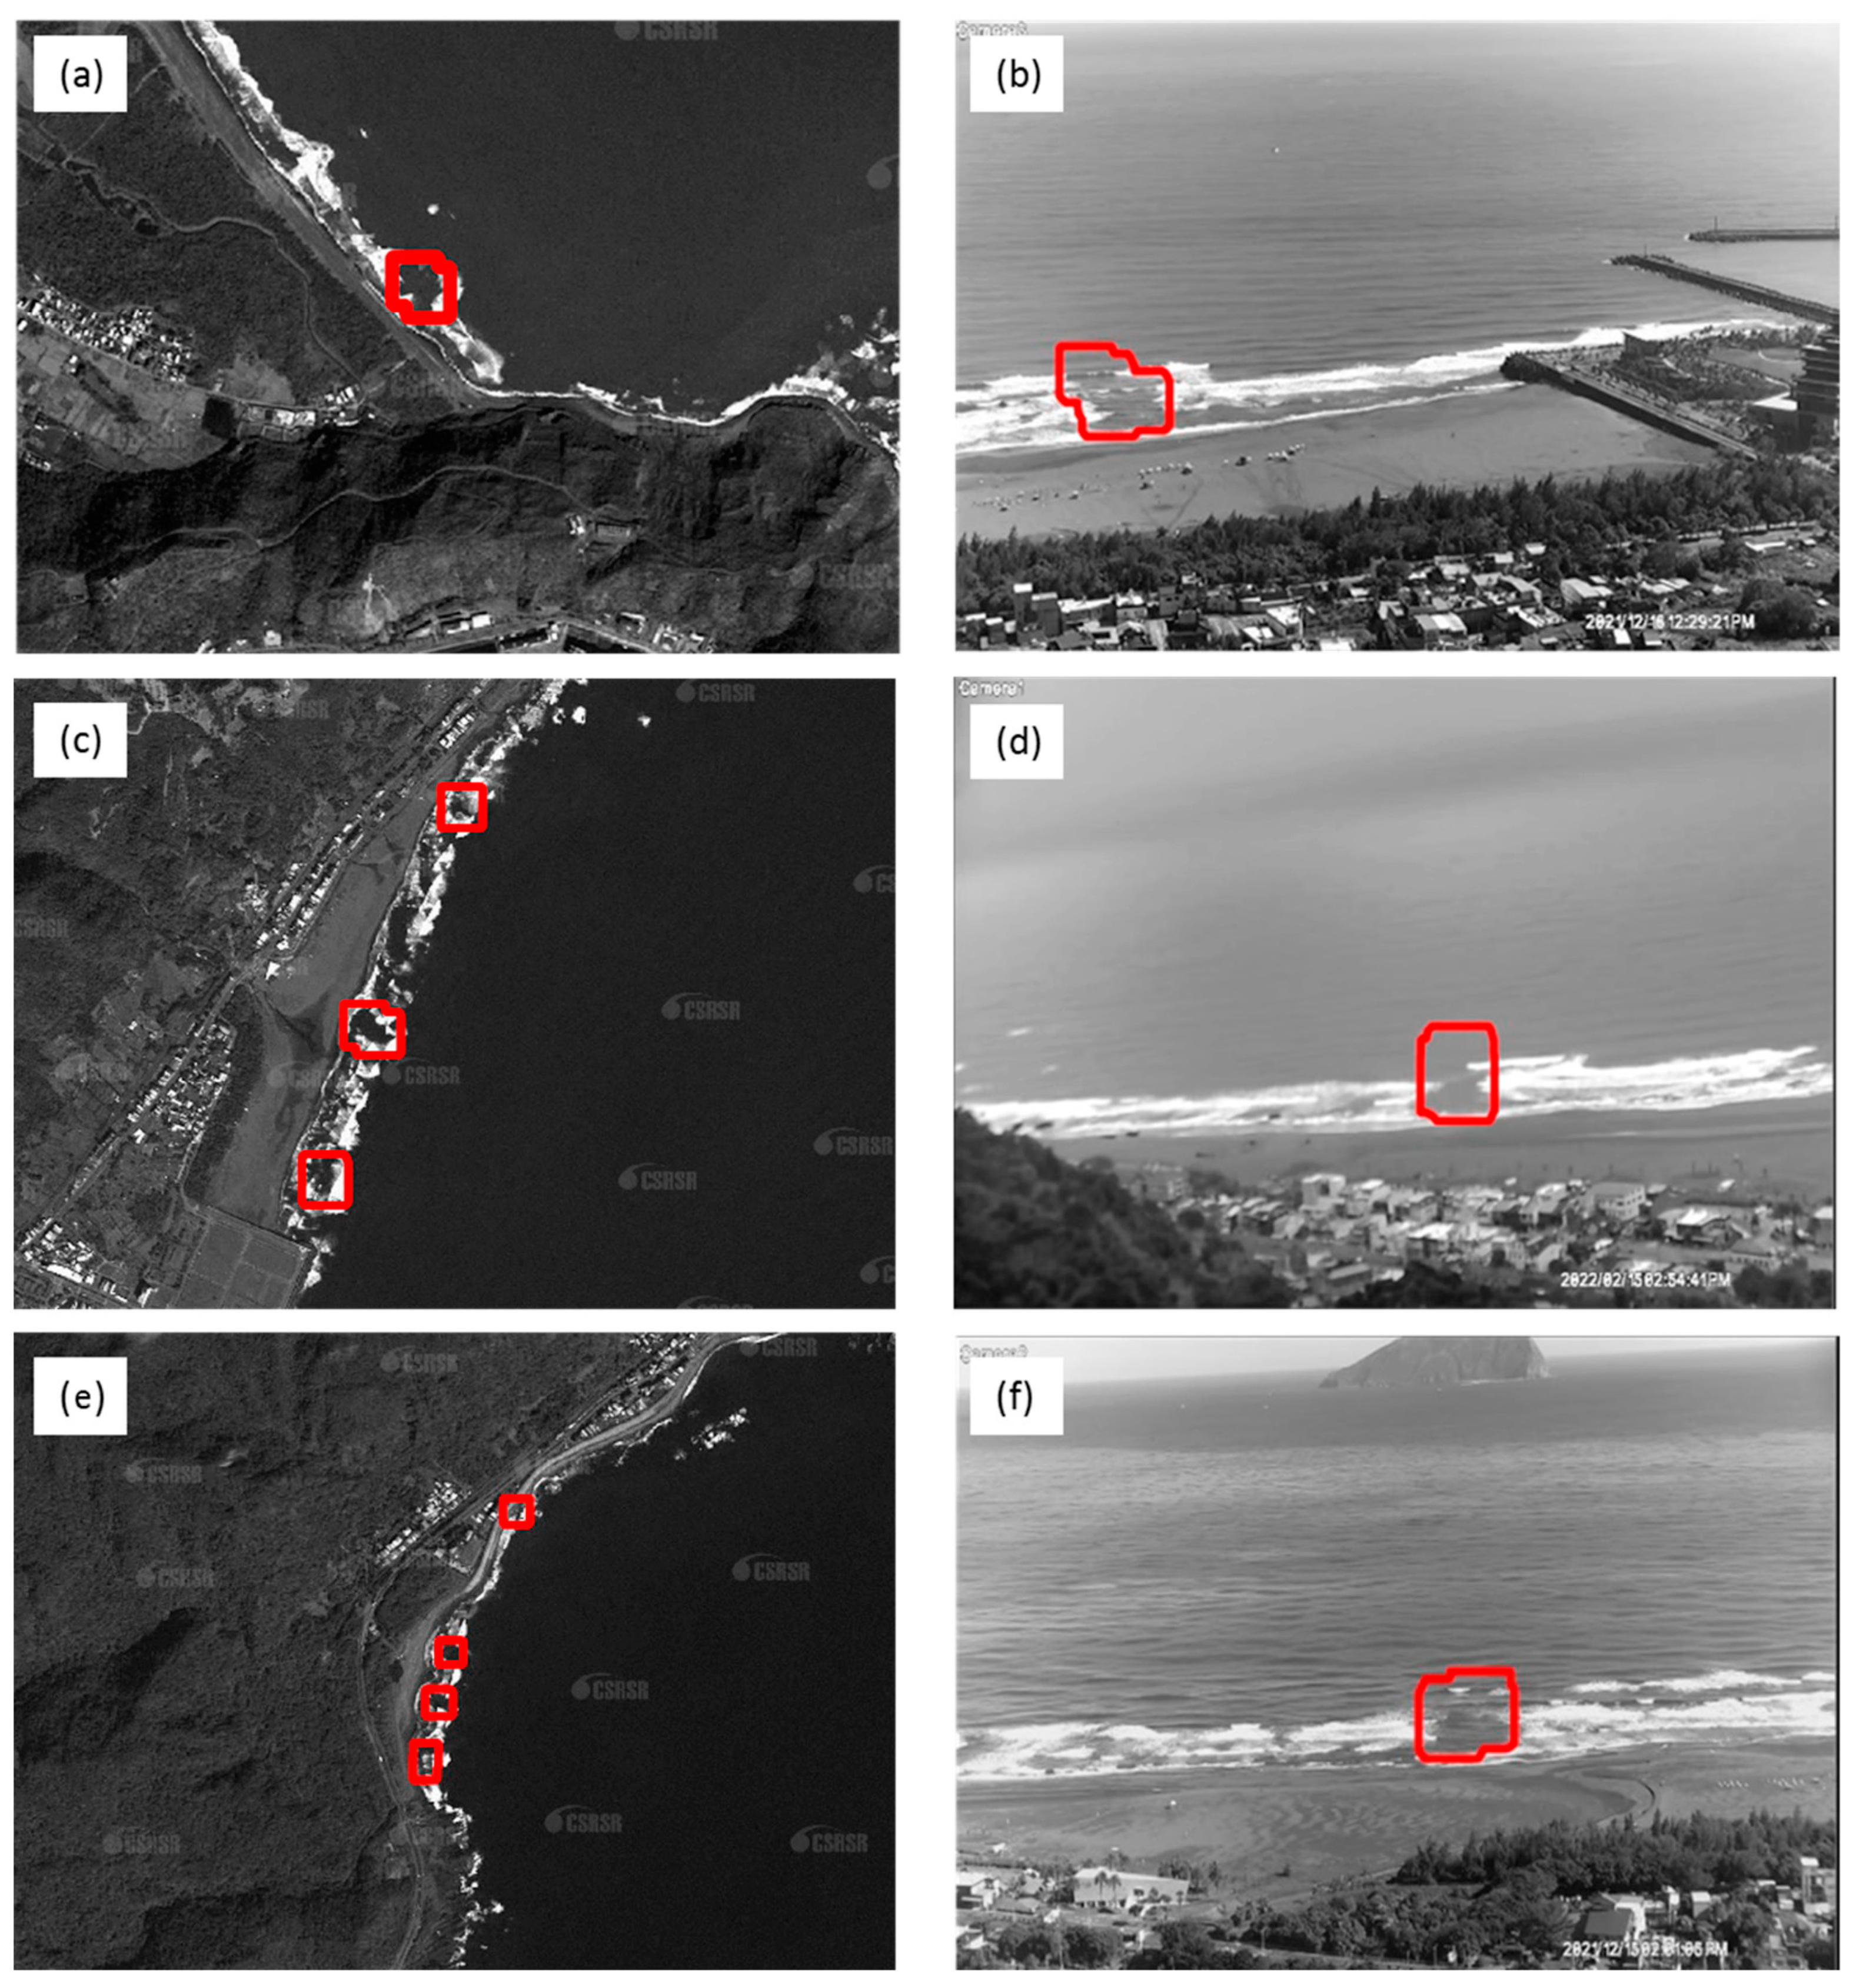
Eventually, the confusion matrix was used to evaluate the rip current image interpretation program. As previously analyzed, the Daubechies wavelet with two iterations showed the best interpretation ability, achieving an accuracy rate of 83.0%. This result is closely related to the ability of wavelet-based edge detection to enhance the intensity contrast of breaking wave zones in imagery. In addition, the use of frame aggregation enables the bounding boxes for rip current detection to precisely delineate rip current channels. The method was successfully tested across various environments, image sources, and camera configurations, consistently identifying rip current locations. These results demonstrate the high generalizability of the proposed approach.
The rip current positions interpreted by the program were located at significant breaks in the breaking wave. This study suggests that the proposed rip current image interpretation program can assist researchers in collecting rip current cases from imagery, serving as a foundation for future rip current-related research. For instance, the collected rip current images can be used to train and validate artificial intelligence (AI) models for automated rip current detection. The rip current mask proposed in this study represents a form of manually extracted features, which can be used for model pre-training or as part of the data preprocessing pipeline, potentially reducing the time required for model training. Moreover, if the proposed method is extended to radar imagery, it may further enable rip current detection and analysis in night-time conditions, thereby enhancing the system’s capability for round-the-clock monitoring.


