Article

AI-Enhanced Real-Time Monitoring of Marine Pollution: Part 2—A Spectral Analysis Approach

by
Navya Prakash
1,2,* and
Oliver Zielinski
1,2,3
1
Marine Sensor Systems, Institute for Chemistry and Biology of the Marine Environment (ICBM), Carl von Ossietzky University of Oldenburg, 26129 Oldenburg, Germany
2
Marine Perception, German Research Center for Artificial Intelligence (DFKI) GmbH, 26129 Oldenburg, Germany
3
Leibniz Institute for Baltic Sea Research Warnemuende (IOW), 18119 Rostock, Germany
*
Author to whom correspondence should be addressed.
J. Mar. Sci. Eng. 2025, 13(4), 636; https://doi.org/10.3390/jmse13040636
Submission received: 4 March 2025 / Revised: 19 March 2025 / Accepted: 21 March 2025 / Published: 22 March 2025
(This article belongs to the Section Marine Environmental Science)

Abstract

:
Oil spills and marine litter pose significant threats to marine ecosystems, necessitating innovative real-time monitoring solutions. This research presents a novel AI-driven multisensor system that integrates RGB, thermal infrared, and hyperspectral radiometers to detect and classify pollutants in dynamic offshore environments. The system features a dual-unit design: an overview unit for wide-area detection and a directional unit equipped with an autonomous pan-tilt mechanism for focused high-resolution analysis. By leveraging multi-hyperspectral data fusion, this system overcomes challenges such as variable lighting, water surface reflections, and environmental interferences, significantly enhancing pollutant classification accuracy. The YOLOv5 deep learning model was validated using extensive synthetic and real-world marine datasets, achieving an F1-score of 0.89 and an mAP of 0.90. These results demonstrate the robustness and scalability of the proposed system, enabling real-time pollution monitoring, improving marine conservation strategies, and supporting regulatory enforcement for environmental sustainability.

1. Introduction

Marine pollution from oil spills and floating litter is an escalating global concern [1,2,3,4], posing severe threats to marine biodiversity, coastal economies, and human health [5,6,7,8]. Traditional monitoring methods, which rely on manual sampling and delayed data processing, often fail to achieve real-time detection and classification of pollutants, particularly in dynamic offshore environments [9]. The limitations of these conventional approaches necessitate the development of an advanced, automated system capable of rapid, high-accuracy detection and classification of marine pollutants.
Recent advances in Artificial Intelligence (AI) and spectral sensing technologies have demonstrated significant potential for automating marine pollution detection [10,11]. AI-driven models have the capability to rapidly analyse large-scale environmental data, while multispectral and hyperspectral sensors capture the unique spectral signatures of pollutants [12,13,14,15]. However, existing solutions often lack sensor integration, adaptability to environmental variations, and real-time classification capabilities, highlighting a critical research gap in marine pollution monitoring.
Despite advancements in marine pollution monitoring, several limitations persist in existing detection frameworks. Most studies rely on single-sensor systems, such as RGB cameras or thermal-imaging devices, susceptible to lighting variations, sea surface reflections, and the misclassification of pollutants [9]. Additionally, traditional methods require post-processing and manual validation, resulting in delayed responses to pollution events [12]. Furthermore, no widely adopted system integrates RGB, thermal infrared, and hyperspectral imaging to enhance classification accuracy [16]. Addressing these limitations, this study proposes an AI-enhanced multispectral sensing framework that leverages deep learning and spectral analysis for high-accuracy, real-time pollutant detection and classification [10,16,17,18].
The aim of this research is to develop and validate an AI-powered, multisensor spectral analysis system for autonomous offshore pollution detection. By integrating RGB, thermal infrared, and hyperspectral radiometers, the proposed system enables enhanced pollutant classification, real-time monitoring, and adaptability to varying environmental conditions, such as light fluctuations, water reflections, and marine traffic interference. This study focuses on improving detection accuracy and reducing false positives, addressing critical gaps in current pollution-monitoring frameworks.
To achieve this goal, this study was structured around the following objectives. First, we aim to develop an AI-based sensor fusion system that integrates RGB, thermal infrared, and hyperspectral imaging for enhanced pollution detection. Second, we implemented a dual-unit sensing architecture consisting of an overview unit for wide-area detection and a directional unit with a pan-tilt mechanism for high-resolution pollutant analysis. Third, we trained and validated the YOLOv5 [19] Deep Learning model on synthetic and real-world marine datasets to improve pollutant classification accuracy. Fourth, we evaluated the system’s robustness in diverse marine environments, particularly under different lighting conditions, wave motions, and atmospheric interferences. Finally, we compared the proposed system’s effectiveness against existing marine pollution monitoring techniques, demonstrating its superiority in terms of real-time detection, classification, and adaptability.
The primary contribution of this study lies in its integration of AI-driven multispectral fusion for marine pollution detection, offering an advanced, scalable, and adaptable monitoring system. Unlike conventional methods, the proposed system utilises a combination of RGB, thermal, and hyperspectral imaging to provide high-accuracy pollutant classification in real time. Additionally, the dual-unit autonomous system allows for wide-area scanning and targeted high-resolution analysis, making it more effective than traditional monitoring techniques [9,20]. We ensured robustness and adaptability across diverse marine conditions by leveraging synthetic data-driven model training.
This article is structured as follows: Section 2 describes the design and implementation of the proposed spectral sensor system. Section 3 details the validation methodology, and Section 4 includes synthetic data acquisition and YOLOv5 model performance evaluation. Section 5 discusses the findings, challenges, and system implications for marine pollution monitoring. Finally, Section 6 presents conclusions and future research directions to enhance AI-driven marine pollution monitoring frameworks.

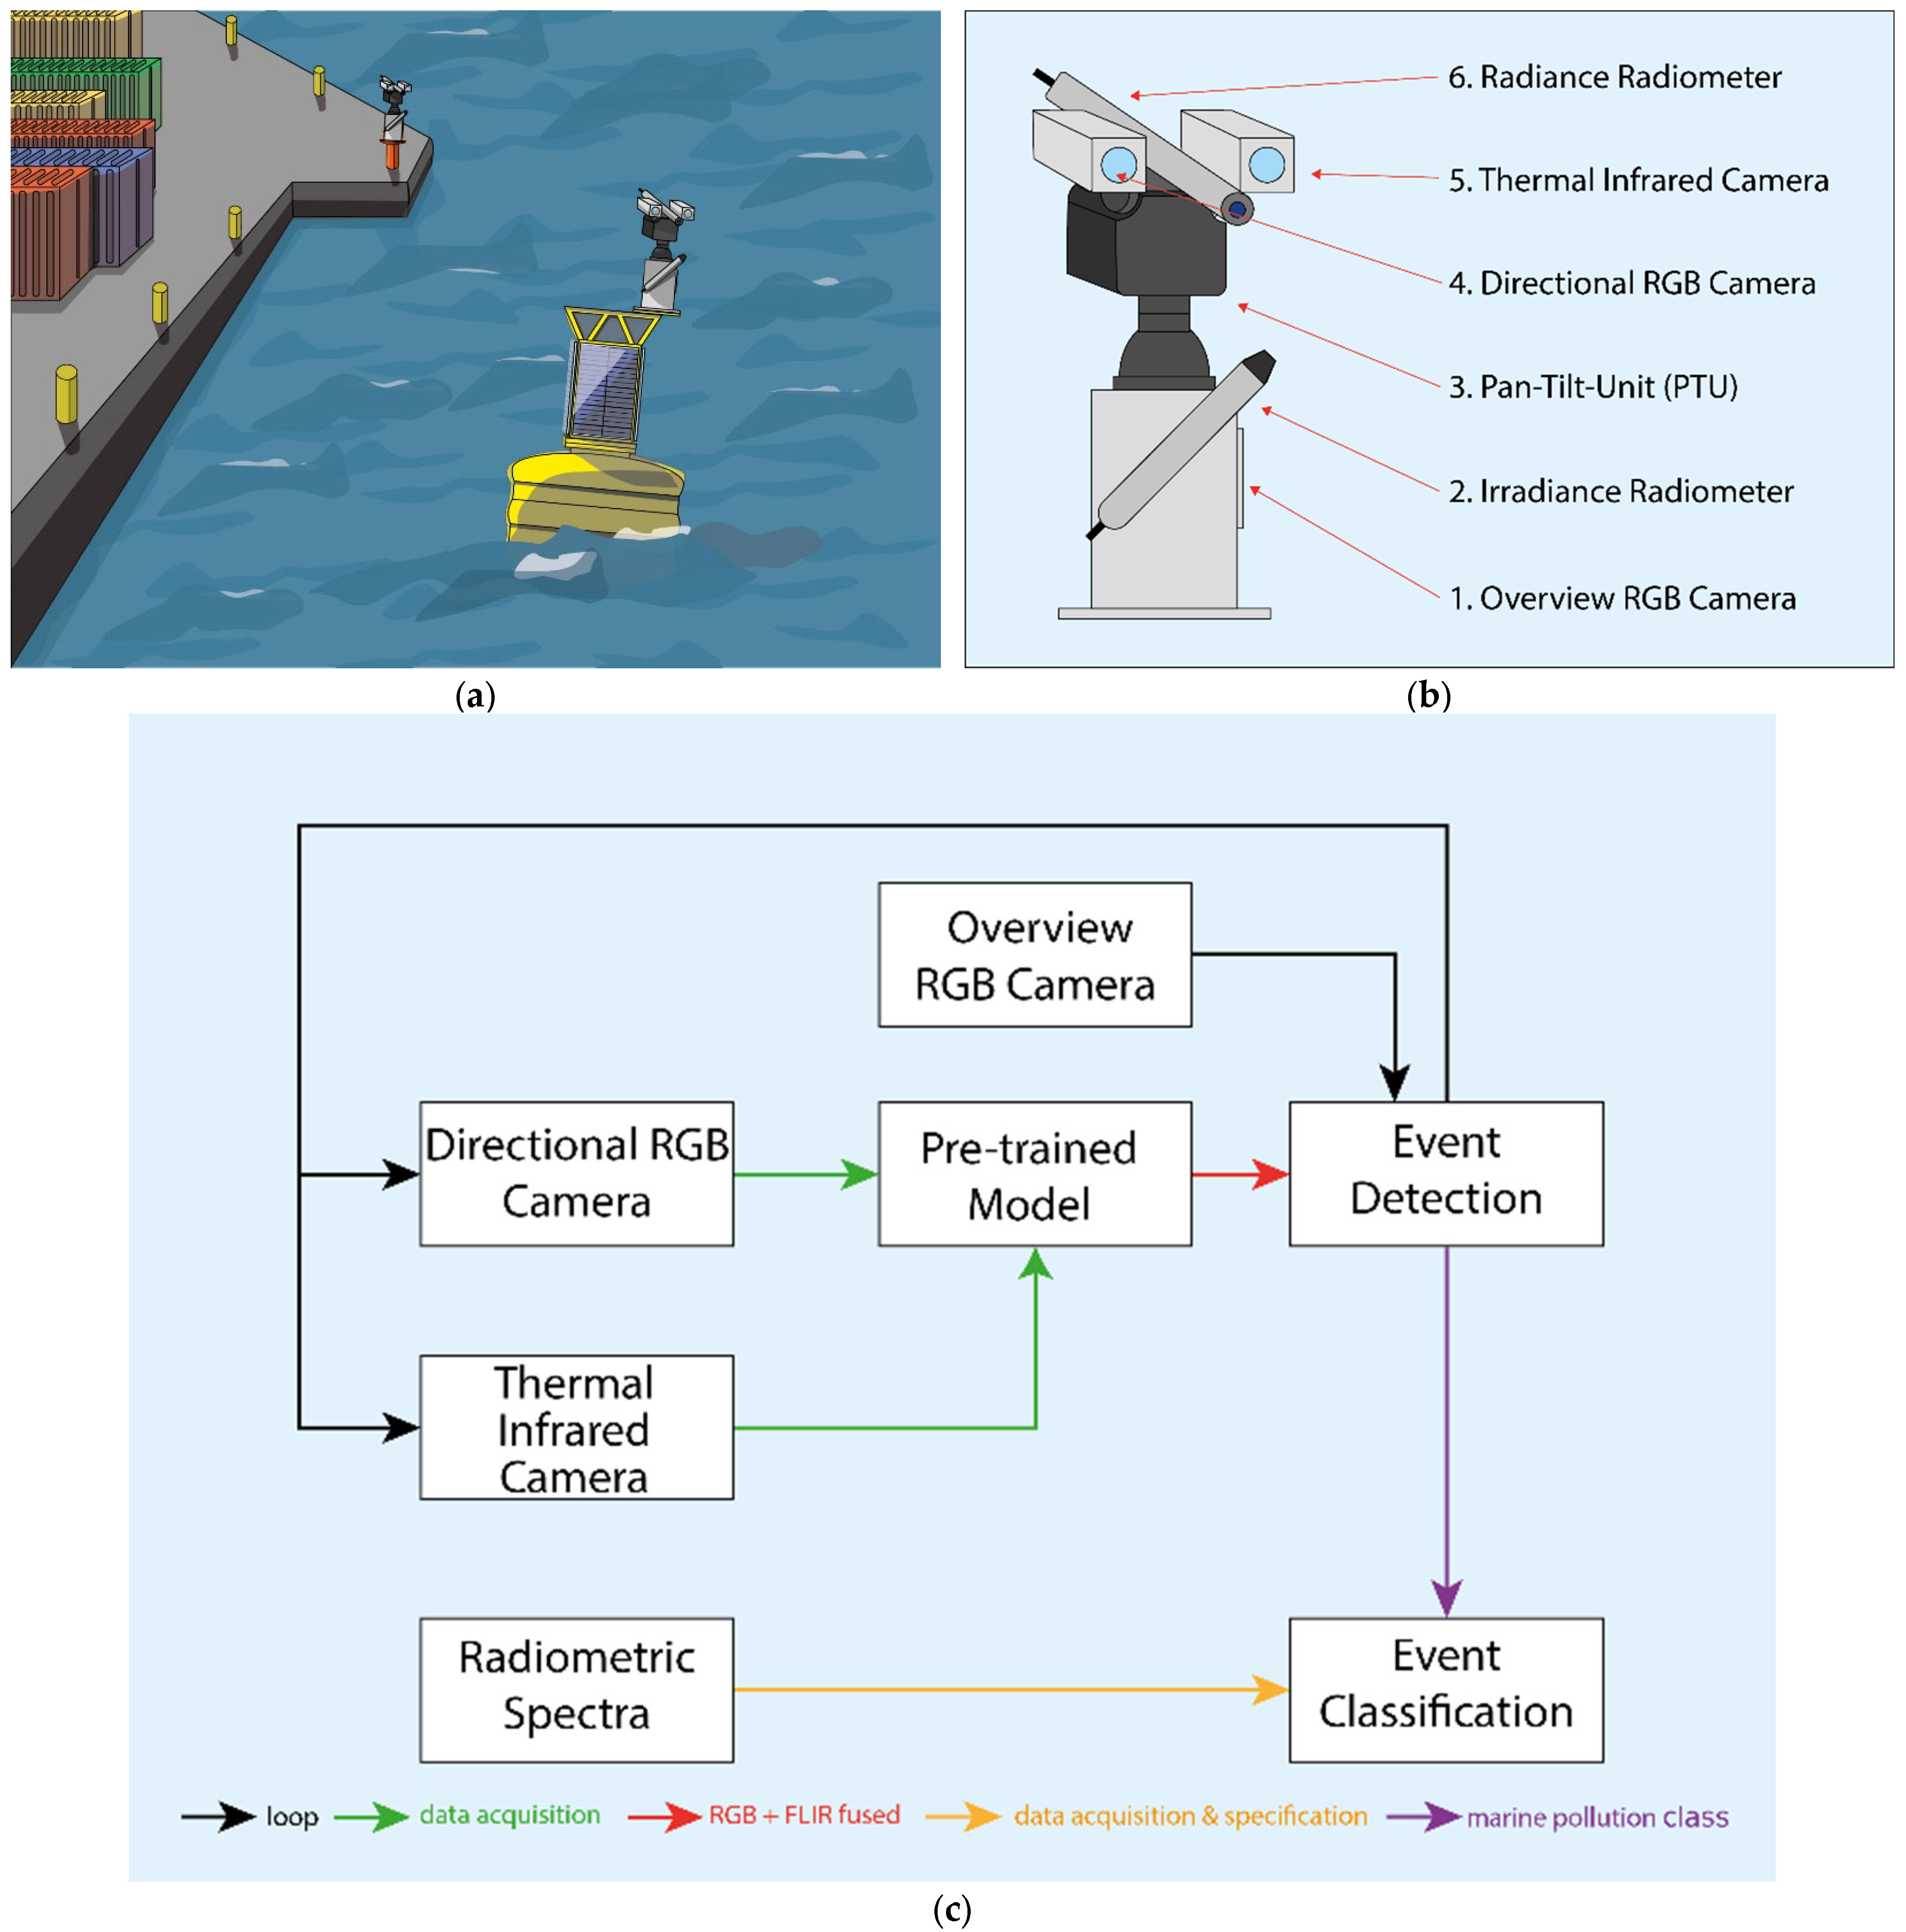
2. Design of Spectral Sensor Model for Marine Pollution Monitoring

The purpose of the proposed model is to develop a real-time marine pollution monitoring system by integrating multiple spectral sensor data. Marine research has demonstrated that spectral sensors can effectively detect pollution [10,12]. In particular, RGB or visible spectral sensors, such as cameras, have been widely utilised to identify plastic debris on beaches, floating and stagnant litter, oil spills, and stranded macroplastics [10]. Given the variability of weather conditions and marine ecosystems in rivers and seas, the fusion of RGB data with thermal infrared imaging [16,17] and hyperspectral radiometer data [15,21,22] offers a robust approach for analysing oil spills and marine litter. This model addresses key research gaps by leveraging multispectral sensor fusion for enhanced pollution detection and analysis [10]. The proposed sensor system is designed to be flexible, regardless of the type or location of marine pollution, making it adaptable for use in harbours, in riverbeds, or for buoys on the sea or ocean (refer to Figure 1a). Event rates, influenced by maritime traffic, impact system performance by providing more data for analysis in high-frequency areas while playing a preventive role in lower-frequency regions. Thus, the proposed spectral system consists of the following.

2.1. An Overview Unit

This sub-system is equipped with an RGB and irradiance radiometer. The overview unit is used for marine pollution detection, especially oil spills and floating litter, hereafter referred to as events (event detection, as in Figure 1c); the RGB camera (RGB overview or 1 in Figure 1b) in this unit is equipped with a wide-angle lens that captures real-time pollution data acquired in a greater-area range. The irradiance radiometer (2 in Figure 1b) captures the real-time sunlight spectrum for further analysis.

2.2. A Directional Unit

This sub-system consists of an RGB, thermal infrared camera and a radiance radiometer, all constituting sensors placed on a pan-tilt unit (PTU) (3 in Figure 1b) that operates autonomously to point at the event for spot analysis. The coordinates for the PTU are obtained from the results of the AI-based event detection performed by the overview unit. This spot analysis provides a detailed and closer view of the event for AI-based classification and helps to avoid miscounts of the encountered litter and oil spills. The directional unit consists of an RGB camera (4 in Figure 1b) equipped with a telelens, a thermal infrared camera (5 in Figure 1b) with the greatest-focal-length lens and a higher resolution than the overview camera, and a radiance radiometer (6 in Figure 1b) used to measure the light emitted from marine pollutants. The multisensor data from the directional unit are analysed using a pre-trained AI model to classify the events. A data flowchart for the proposed spectral sensor system is presented in Figure 1c. The proposed system software comprises a new AI model that autonomously composes the sensor data flowchart (as in Figure 1c) for continuous (looping, as in Figure 1c) and real-time marine pollution monitoring by acquiring inputs from all the sensors in the proposed system as test data for the location of deployment. As shown in Figure 1c, the proposed AI model obtains an input image from the RGB overview camera (1 in Figure 1b) for event detection, either oil spill or floating-litter pollution, predicted by a pre-trained AI model. The event detection leads to mapping the movement of the pan tilt unit (3 in Figure 1b) from a 2D image to 3D or real-world coordinates for spatial (in space, real-world) and temporal (real-time) event classification. Synchronously, it triggers the directional RGB camera (4 in Figure 1b), thermal infrared camera (5 in Figure 1b), and hyperspectral radiance radiometer (6 in Figure 1b) to capture instantaneous data (images from the RGB and thermal cameras, and spectra from the radiance radiometer). The fusion of the RGB and thermal infrared data (RGB + FLIR fused as in Figure 1c) provides inputs to the pre-trained AI model for event detection and classification. Simultaneously, the radiance (6 in Figure 1b) and irradiance (2 in Figure 1b) radiometers produce spectra (radiometric spectra and data acquisition and specification as in Figure 1c) in the UV-VIS-NIR light wavelength range emitted from the marine pollutant. The irradiance radiometer captures the light spectrum from sunlight, and the radiance radiometer captures the light spectrum from the event. By combining the radiance and irradiance reflectance spectra, the AI model can verify whether the event was classified as floating litter or an oil spill (the marine pollution class or event classification, as in Figure 1c), as these pollutants exhibit different spectra [23,24,25]. The proposed system comprises a computing unit with a dedicated graphics-processing unit (GPU), such as NVIDIA Jetson Orin. A solar-powered battery on a buoy or dedicated power banks at the harbour will serve as the power supply. To achieve maximum efficiency and effectiveness in marine pollution detection, the proposed system’s AI model must be evaluated using data from all acquisition campaigns, considering data-processing and model performance metrics.
The challenges the proposed systems will encounter in offshore environments, especially when placed on a buoy, are water currents, wave motion, sunlight, and wind, which affect buoy movements interlinked with the crucial PTU positioning of the directional unit for real-time event classification. These environmental factors also influence oil spills in oil agglomerations and floating litter submerged in marine environments, hampering the proposed spectral system’s ability to monitor real-time events. However, the system can be supervised by an efficient AI model in order to allow it to predict real-time marine pollution rapidly, irrespective of the environment (onshore or offshore). The AI model’s efficiency can be enhanced through pre-training with essential datasets, including those collected during the data acquisition campaigns described in the proposed methodology.

3. Validation Through Synthetic Marine Pollution Dataset

3.1. Campaign 1: Static Litter Data

Campaign 1 included recording videos or images of static litter in a controlled environment, such as a laboratory with a continuous LED light. The litter videos were collected using an Alvium 1800 u-2050c RGB camera (resolution: 5496 × 3672, 21 fps (frames per second). This camera has the following characteristics: a resolution of 20.1 MP, a compression type of none—bmp, a BayerRG8 raw-colour pixel format, issues with white balance and auto exposure, and a standard wide-angle lens (Fujinon CF16ZA-1S 1:1.8/16 mm). This wide-angle lens gives an overview of an environment, as shown in Figure 2a. Furthermore, Figure 2b shows an image of static litter recorded using a different camera, namely, a Mako G-507 RGB (resolution: 2064 × 1544, 23 fps, 3.1 MP, compression type: jpeg) with a telelens (focal length: 25 mm). This telelens can allow a spot analysis and provide zoomed-in litter data. Hereafter, the combined RGB image set (set of images) from the Alvium and Mako cameras for the static litter is referred to as ‘lab-litter data’ (Figure 2a,b). Each litter video was recorded using the Alvium and Mako cameras for 5 s for all litter combinations.

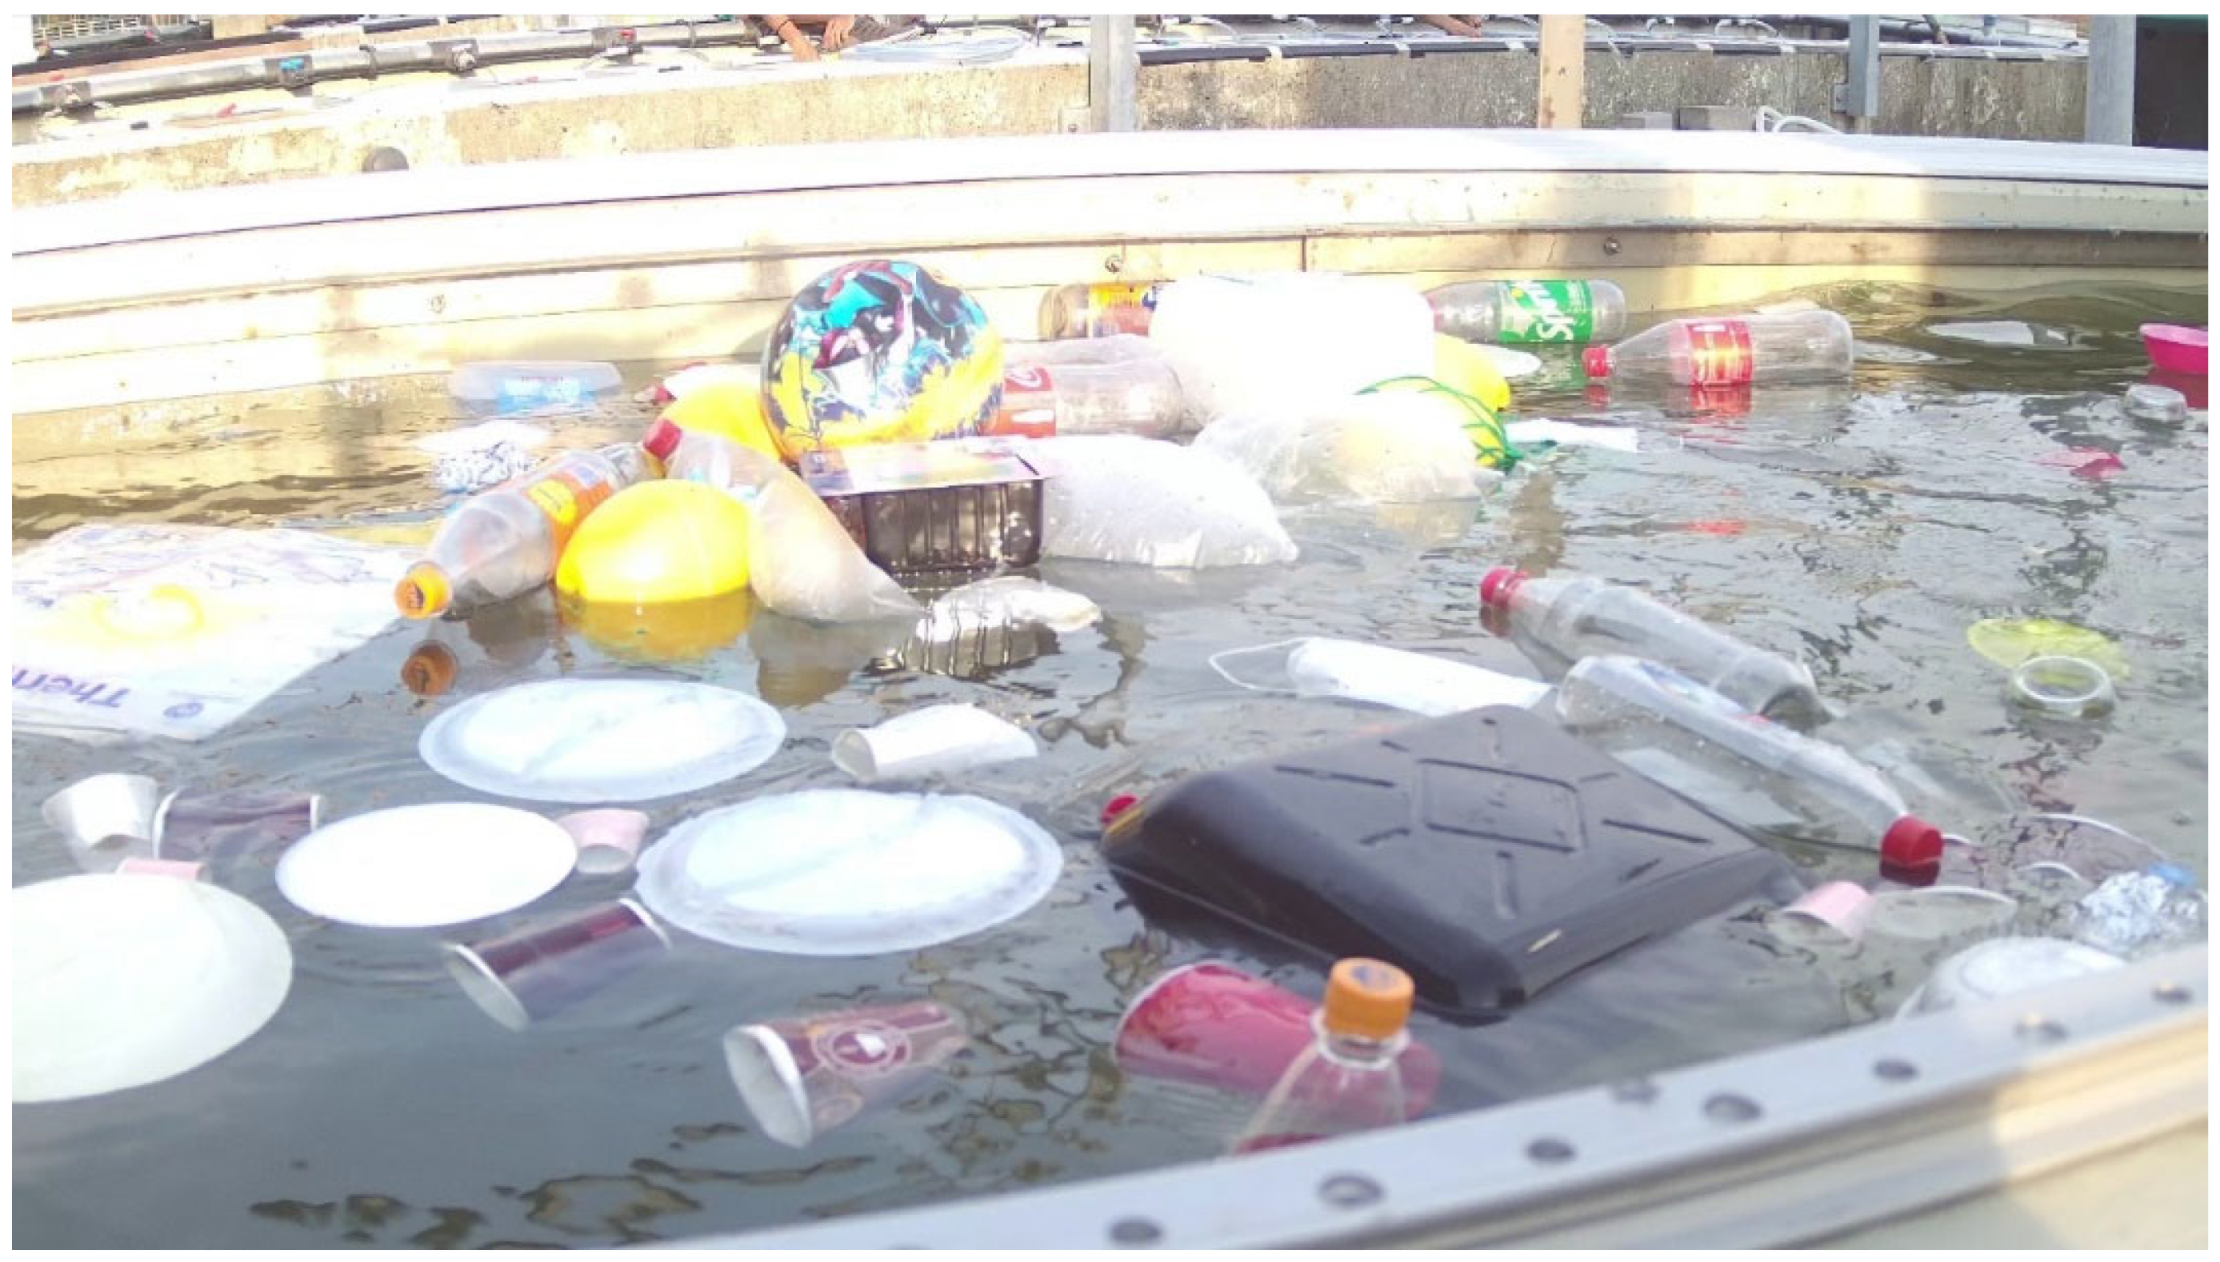
3.2. Campaign 2: Floating Basin Litter Data

Campaign 2 involved a semi-controlled environment in which free-floating litter is allowed within a restricted area at the Sea Surface Facility [26]. SURF offers a vital platform for exploring marine ecosystems within a controlled environment. It is a large-scale mesocosm, measuring 8.5 m in length, 2 m in width, and 1 m in depth. A dedicated pumping station fills this facility with seawater from Jade Bay on the North Sea Coast of Germany. SURF was chosen because it bridges the gap between controlled a laboratory experiment and the unpredictable nature of the open sea. The free-floating litter could drift across the basin, as SURF has an electric motor turbine that generates a current in the water. The Campaign 2 artificial data consist of new litter from everyday usage, single-use plastics, and masks, resembling free-floating marine litter (as shown in Supplementary Materials Figure S1). It consisted of two trails with different RGB cameras that acquired free-floating litter data.
Trial 1 was conducted with a Basler RGB camera (product: acA2040-25gc, 4.1 MP, 20 fps, resolution: 2046 × 2046, and compression type: uncompressed—tiff) with a wide-angle lens mounted 5 m above the basin on a tripod (allowing a static aerial view), as shown in Figure 2. Images were captured every second of the time interval and stored locally for labelling.
Trial 2 was performed using a Zenmuse XT2 visual (RGB) camera (image resolution: 4000 × 3000, 30 fps, 12 MP, compression type: jpg, and field of view (FOV): 57.12° × 42.44°) with a fixed-angle lens mounted on a DJI Matrice 300 RTK (which was not flown). This camera was situated near the SURF to acquire litter videos (total duration: 82 min, format: MOV, resolution: 3840 × 2160, video format: RGB24, framerate: 29.7201, and bits per pixels: 24). The RGB camera captured every litter deposited into the basin, and recorded videos. An example of a frame-filling (with maximum pixel values) positive image that was captured is shown in Figure 3. Hereafter, the Basler-and-Zenmuse-captured litter RGB image set is called ‘basin-litter data’. The SURF basin was filled with everyday plastics, paper materials, masks, and plastic drink bottles. To create natural litter scenarios in the SURF basin, a few plastic bottles were partially filled with water to submerge them. Some plastics and pieces of paper were deformed (crushed and cut into varying sizes). Masks were deformed into different shapes to mimic real-world litter pollution. The observations from SURF revealed that paper materials began to submerge slightly after one hour and thoroughly after two hours. In contrast, plastics took approximately three hours to begin submerging and six hours to settle at the bottom of the basin.

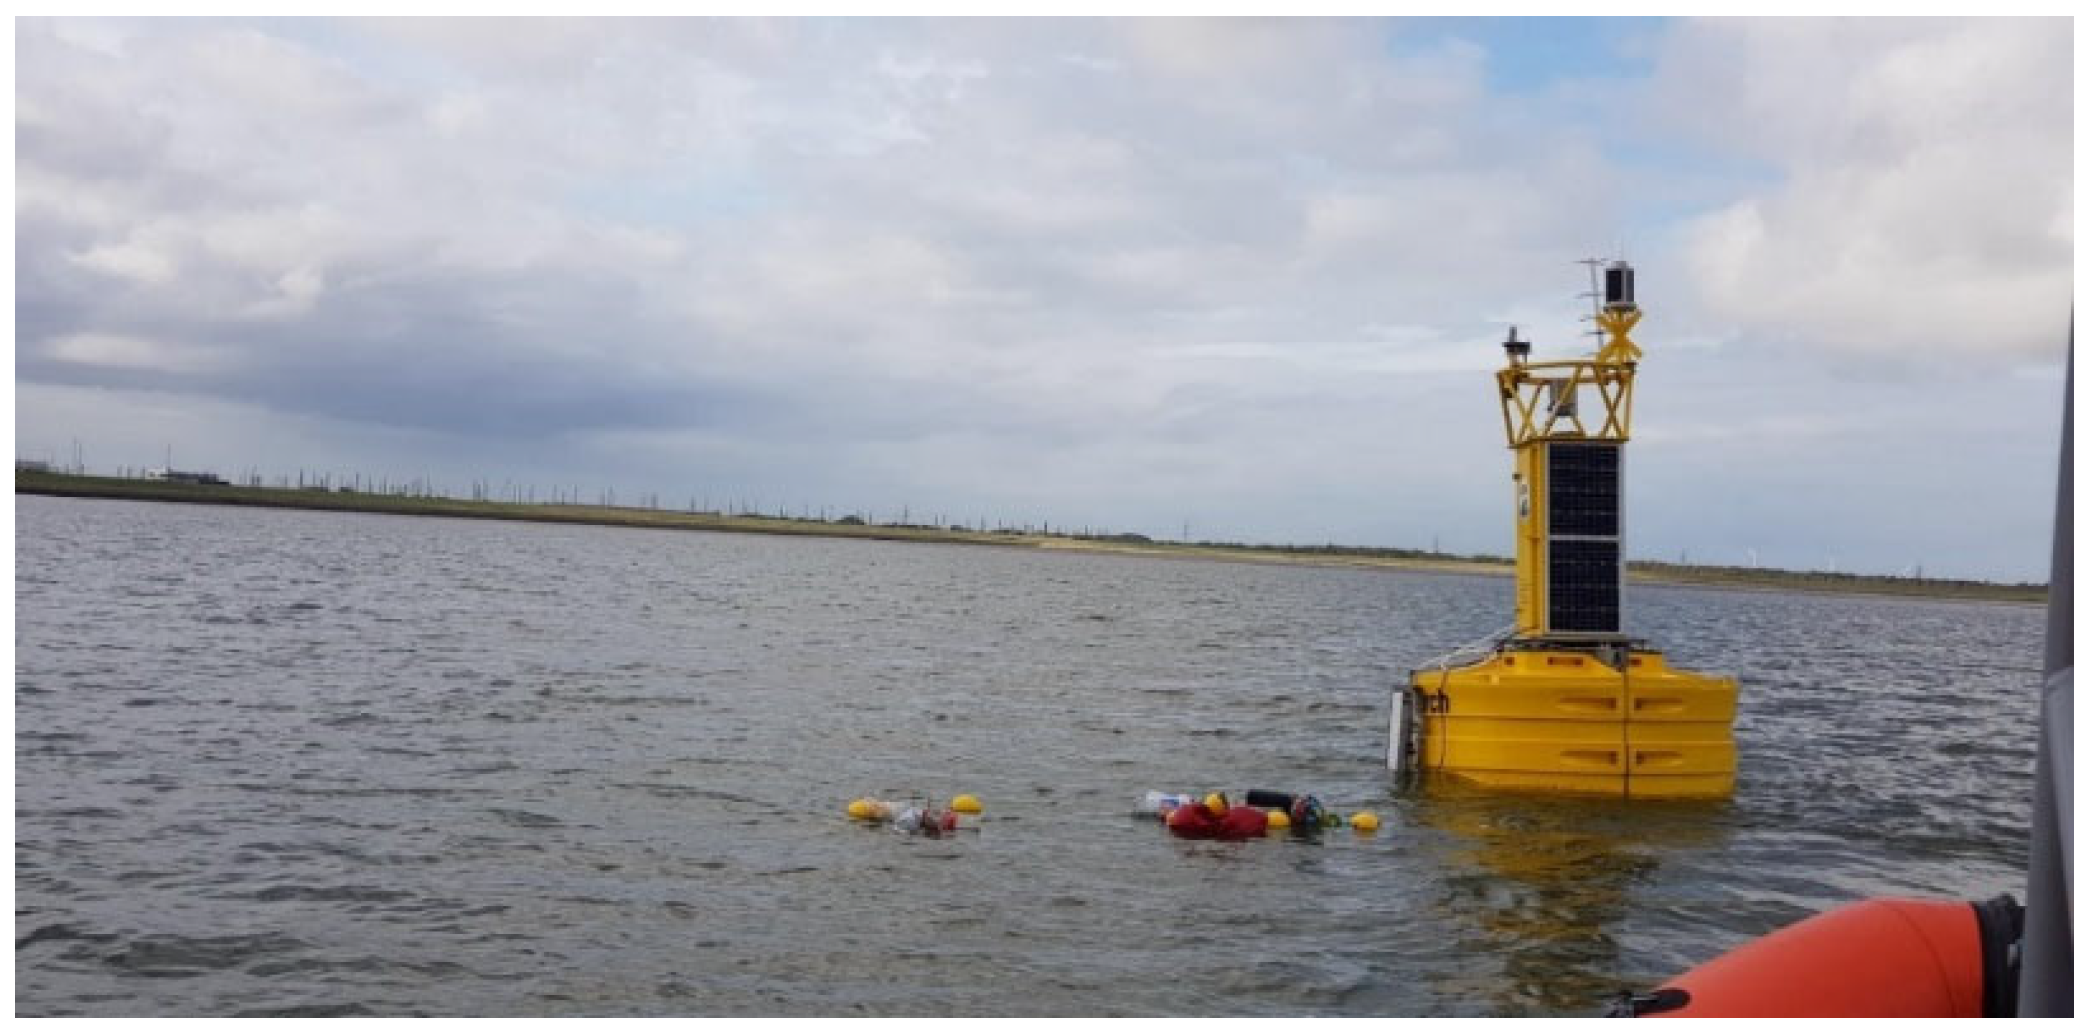
3.3. Campaign 3: Grouped Floating-Litter Data

Campaign 3 was conducted on the sea surface at the Jade Bight (geolocation: 53°35′12.6″ N, 8°09′49.1″ E), North Sea Coast, Germany. Larger litter samples were grouped using a fishing net as a barrier to prevent individual pieces of litter from drifting into the sea (Figure 4). The first litter group contained all samples with floating buoy balls (Figure 4). The second litter group contained seven empty and deformed drink bottles. The DJI Mavic-2 Enterprise Advanced (which was not flown), equipped with an RGB camera, was mounted on a buoy, as shown in Figure 5, to acquire data in video format (total duration: 30 min, video format: MP4). An RGB image (resolution: 3840 × 2160, resolution: 8.29 MP, compression type: jpg, 30 fps, and FOV: 83°) from a DJI drone camera is shown in Figure 6. Floating litter is visible in the RGB videos up to a distance of 5 m from the buoy. However, visibility was reduced due to environmental factors such as sunlight reflection, wave currents, and wind. Thus, the proposed sensor model was required to capture floating litter rapidly and efficiently. After the data acquisition campaign, the litter groups were safely collected to avoid intentional marine litter pollution. Hereafter, the image set for the data pertaining to the floating marine litter groups captured by the DJI Mavic-2 Enterprise-mounted RGB camera is called ‘buoy-litter data’.

4. AI-Based Synthetic Litter Analysis

The proposed synthetic litter data pre-processing method involved extracting image frames from videos. Data cleaning involved deleting blurred images and sorting and storing images from all data acquisition campaigns. Lastly, we labelled image frames containing litter from all data campaigns using LabelImg [27]. In the proposed method, we used the GoogleColab platform [19] with Google GPU (Titan, Gemini) to compute YOLOv5 predictions and Weights and Biases [28] for graphical representations. The data-processing step involved 10-fold cross-validation on the training image set for all data campaigns, and the best epochs, with a high mean Average Precision (mAP) and F1-score, were recorded. The best epoch was assessed using the test image set through holdout validation to obtain an unbiased prediction rate. The mAP metric was considered for litter or object detection; recall value and F1-score were used for classification to analyse the performance of YOLOv5. YOLOv5s and YOLOv5m were evaluated and benchmarked based on key performance metrics, including class loss, training or object loss, GPU utilisation, and recall.

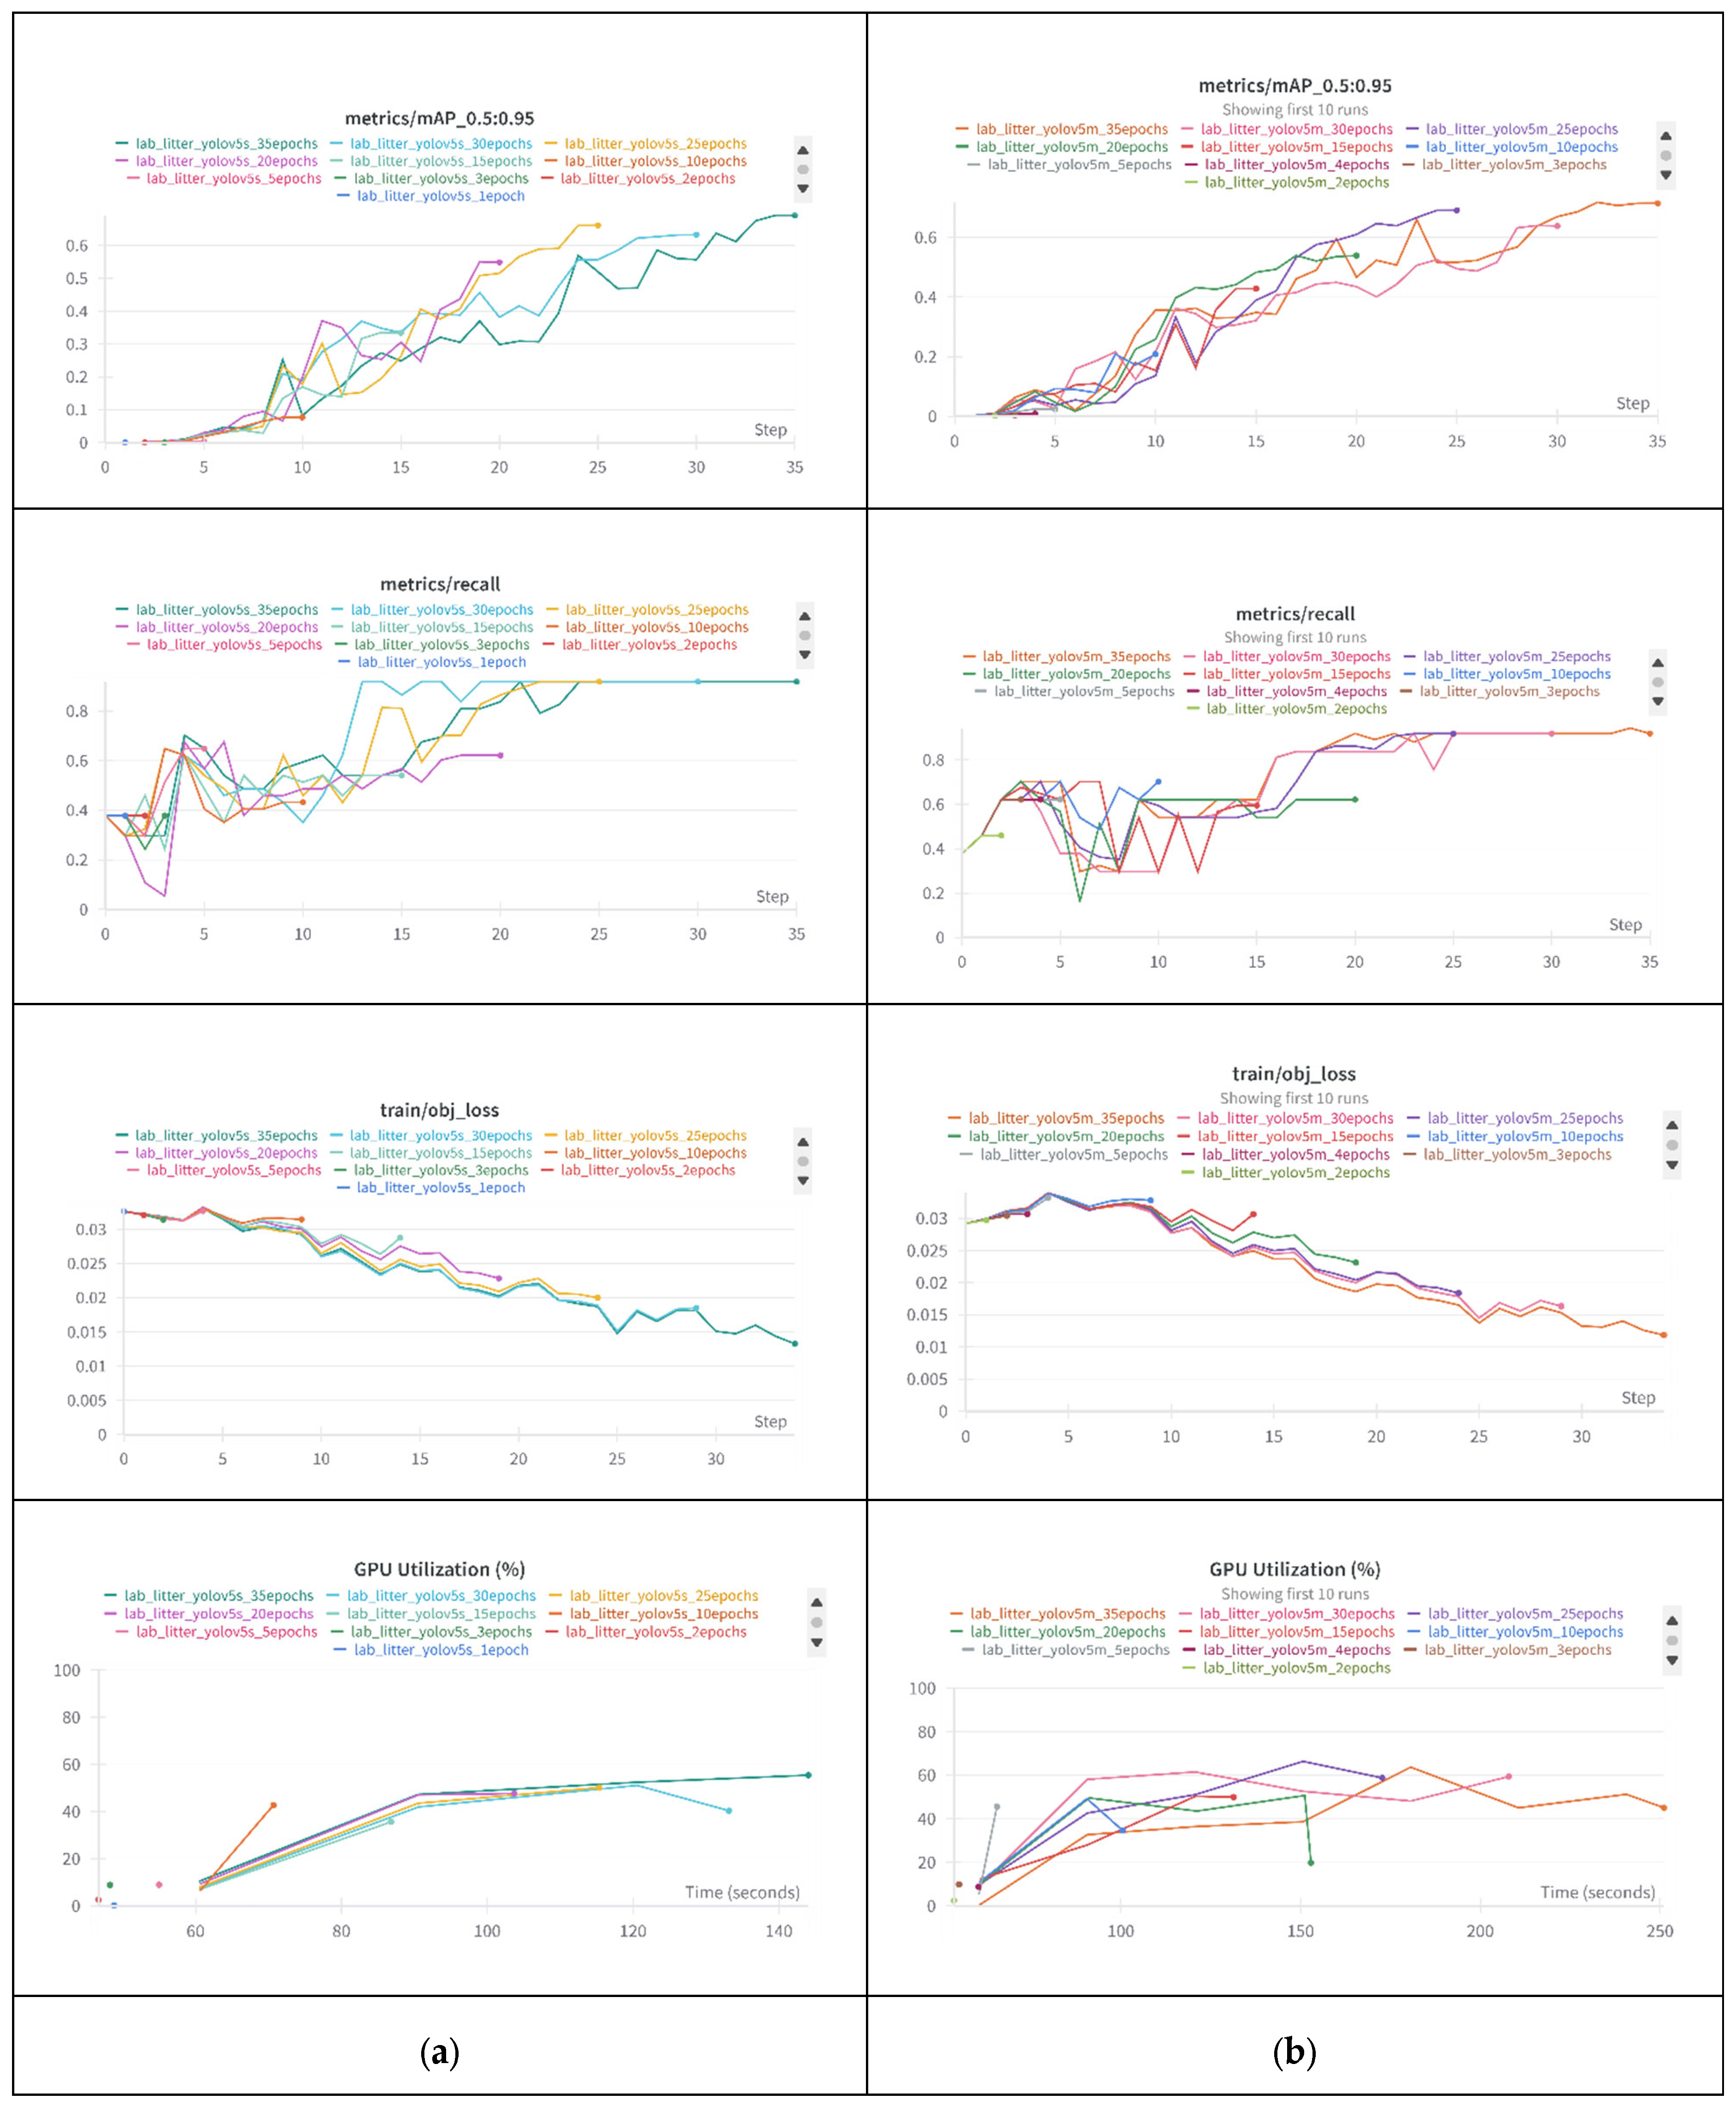
4.1. Campaign 1 and YOLOv5

There were fewer Alvium 1800 u-2050c camera images of static litter data (train: 4 images, test: 3 images), so they were combined with the Mako camera data. The Mako camera images of static litter data contained 112 training images and 28 testing images from all the litter item combinations. A comparison of the performance between YOLOv5s and YOLOv5m on the lab-litter dataset shows (Figure 7) that both models improved as the number of training epochs increased. Both models achieved an F1-score of 1, with YOLOv5m attaining a 0.770 confidence interval and YOLOv5s reaching 0.760. The mean Average Precision (mAP 0.5:0.95) and recall values also increased with the training epochs, with YOLOv5m generally achieving slightly higher mAP and recall values than YOLOv5s. Additionally, YOLOv5m had a lower Hamming loss (0.516 vs. 0.525) and a higher Fowlkes–Mallows Index (0.694 vs. 0.680), indicating fewer classification errors and better clustering performance. However, YOLOv5s had a slightly better Youden’s J score (0.05 vs. 0.011), suggesting a marginally better balance between sensitivity and specificity. While both models performed well, YOLOv5m demonstrated superior performance in mAP, recall, and error reduction, making it the better-performing model.

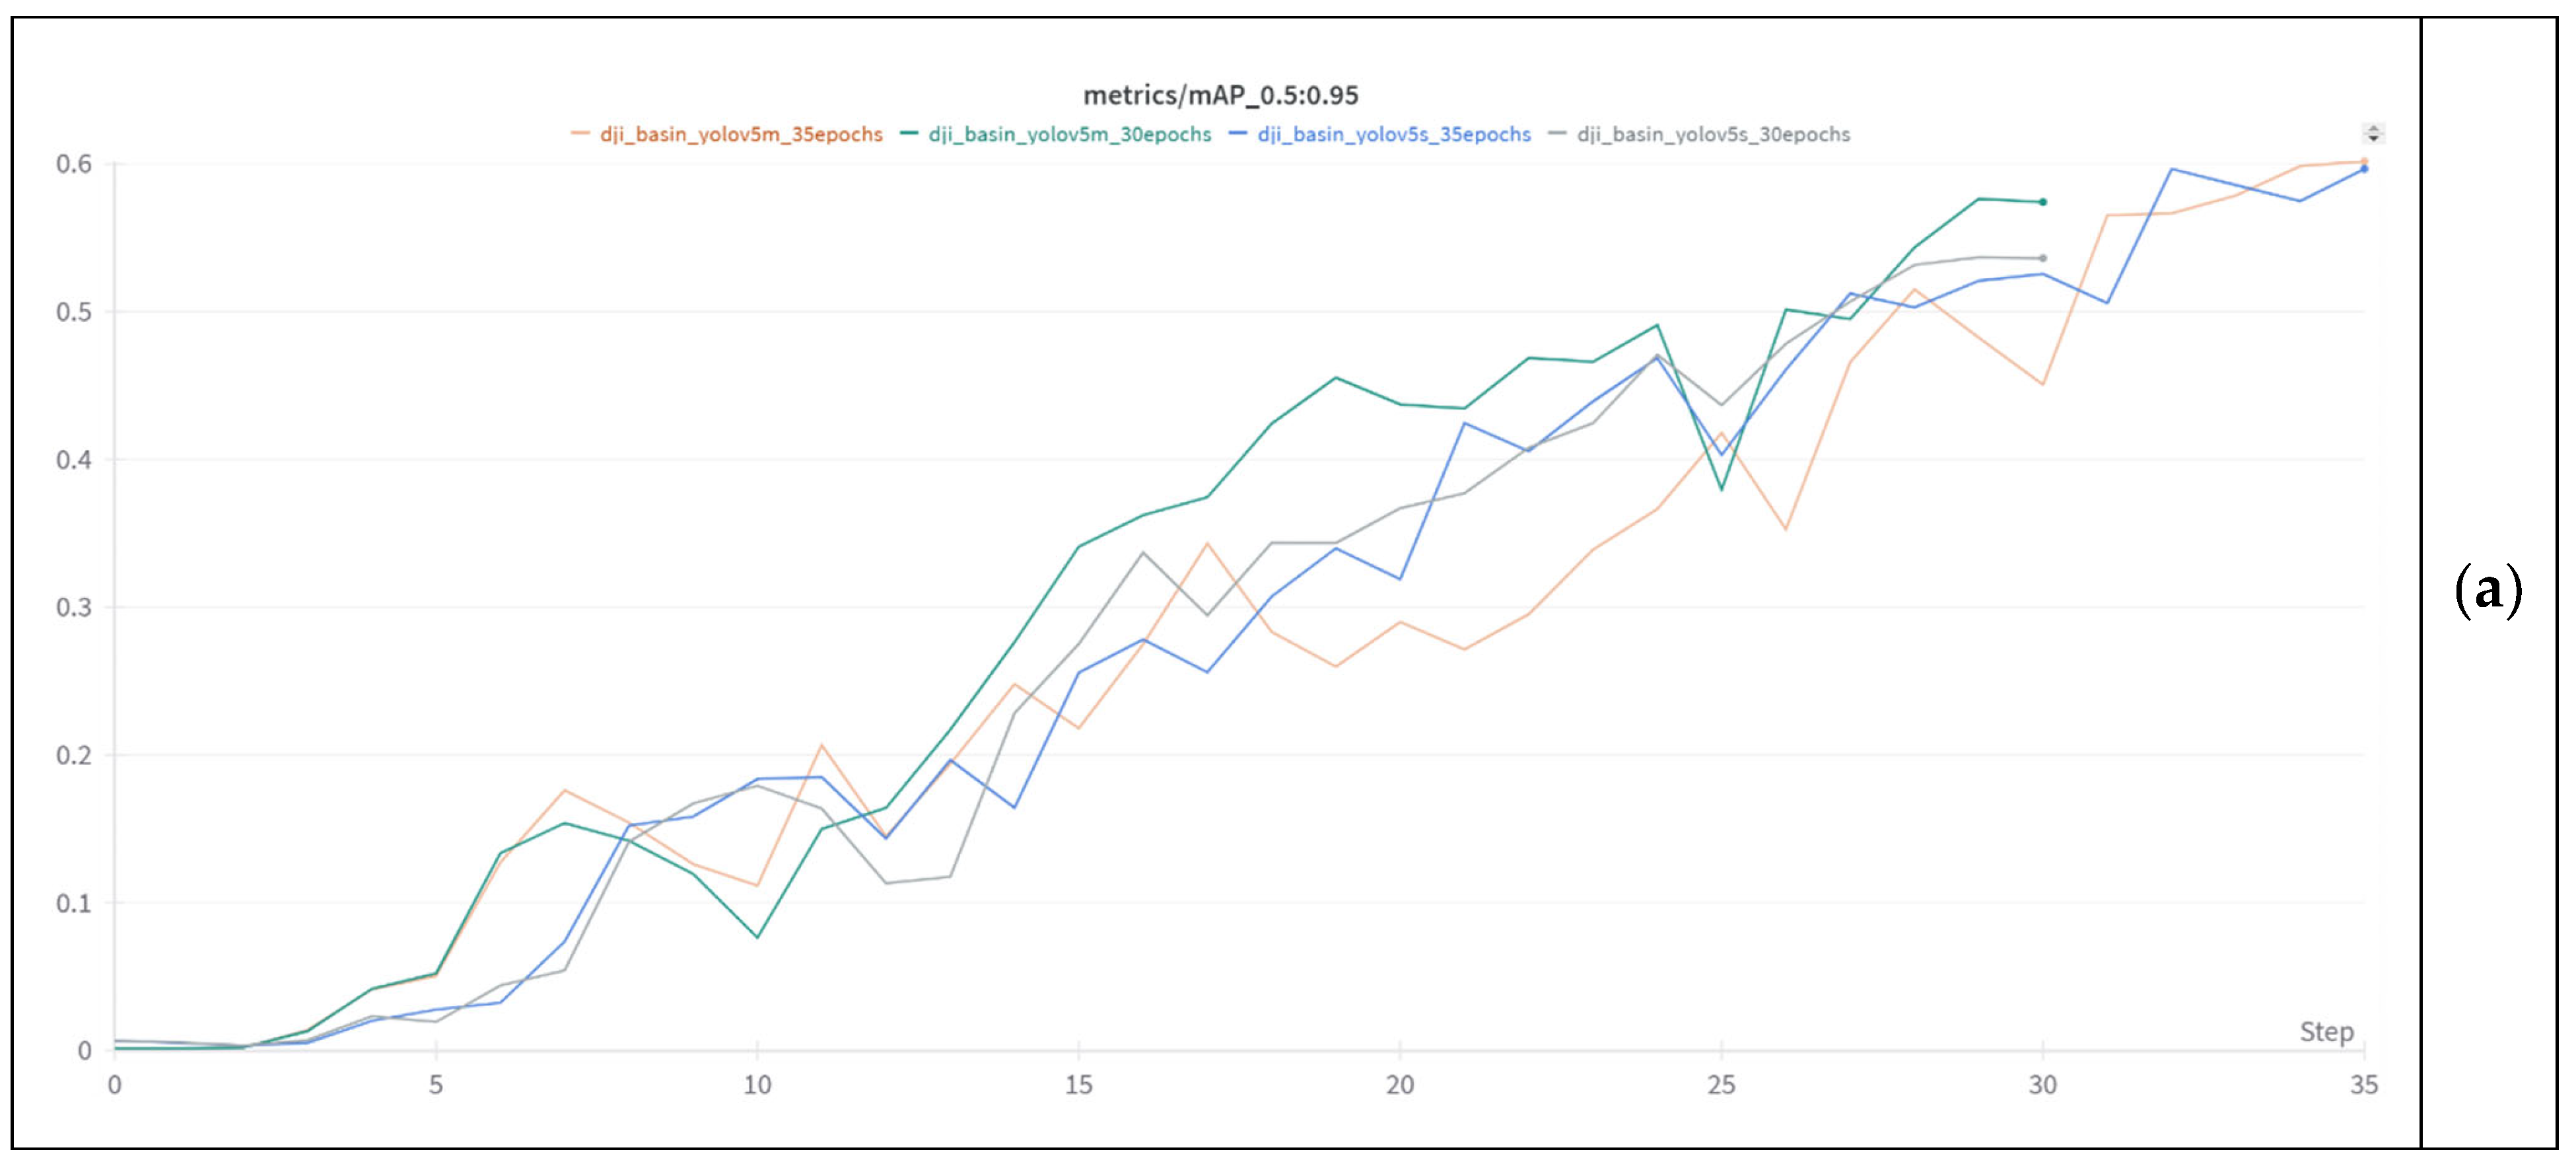
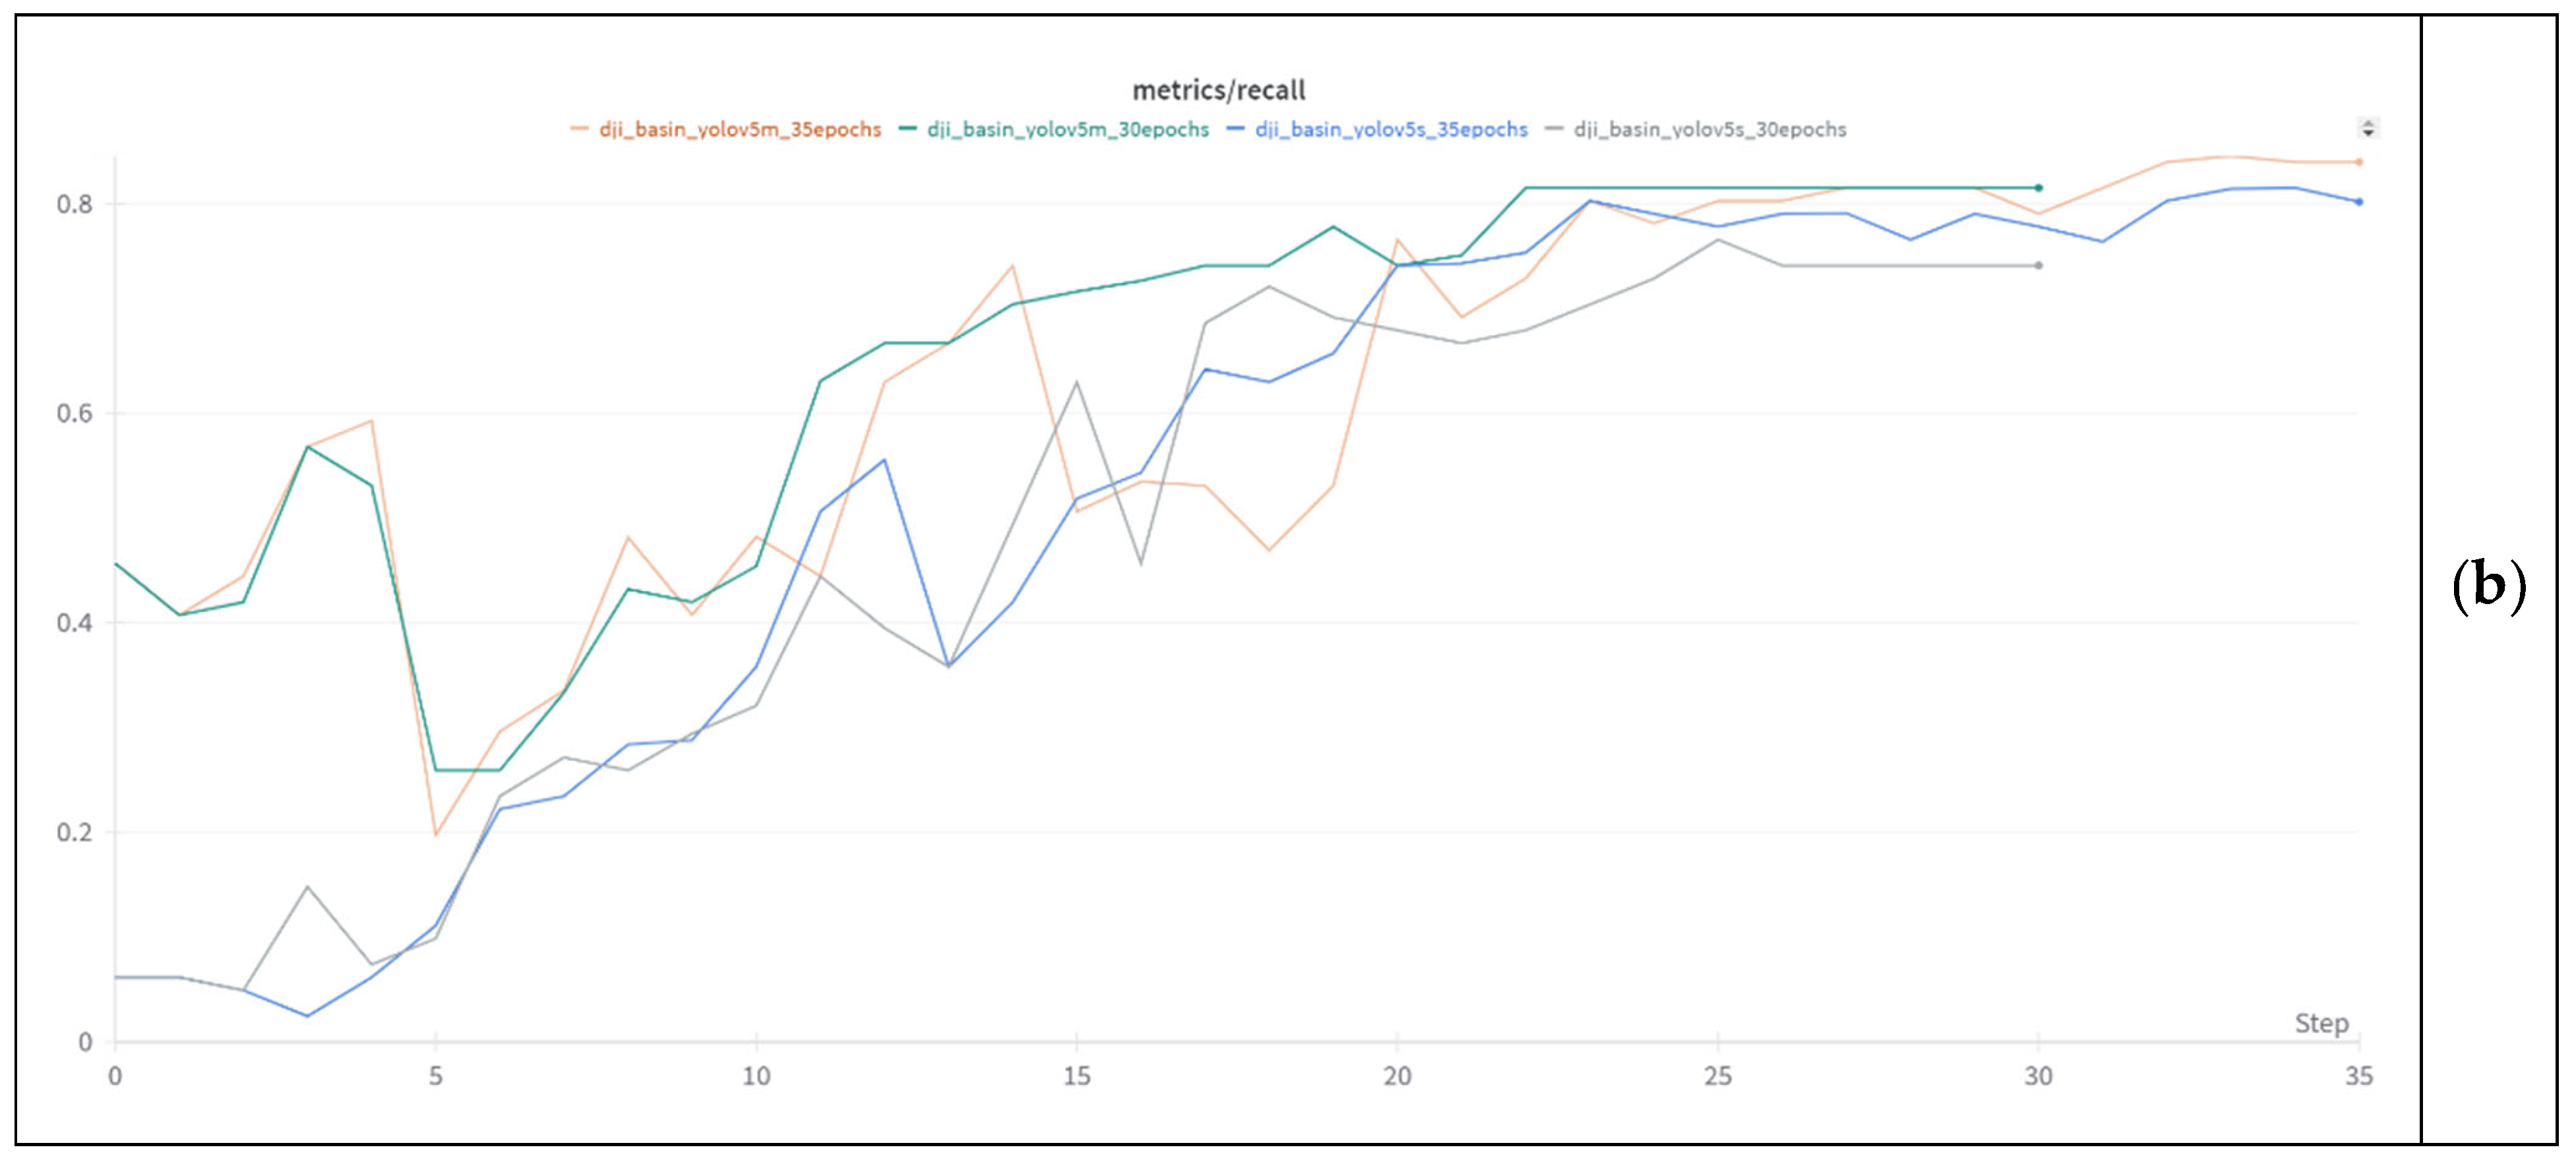
4.2. Campaign 2 and YOLOv5

Trial 1 included Basler RGB camera images containing 112 training images and 28 testing images from different free-floating-litter combinations. The best performance was achieved by YOLOv5m (Figure 8), reaching an F1-score of 1 at 0.713 confidence, a recall of 1, and a 0.75 mAP. In comparison, YOLOv5s had a lower F1-score of 0.99 at 0.363 confidence, a recall of 0.98, and a 0.7 mAP, marking the worst performance for this dataset.
Trial 2 included a Zenmuse RGB basin free-floating-litter image set with 112 training and 28 testing images from different free-floating-litter combinations. The best performance was achieved by YOLOv5m (Figure 9), achieving an F1-score of 0.90, a recall of 0.84, and an mAP of 1. YOLOv5’s performance was poorer, with an F1-score of 0.82, a recall of 0.80, and a 0.90 mAP.
For the combined Trial 1 and Trial 2 image sets, YOLOv5s and YOLOv5m showed improved performance following dataset augmentation. Before augmentation, with 224 training images and 56 testing images, YOLOv5s (Figure 10) achieved an F1-score of 0.75, an mAP of 0.77, and a recall of 0.95, while YOLOv5m performed slightly better, with an F1-score of 0.77, an mAP of 0.79, and a recall of 0.96. After applying augmentation techniques (for details, refer to Supplementary Materials Figure S2) and increasing the size of the dataset to 1792 training images and 448 test images, the performance of YOLOv5s improved significantly, reaching an F1-score of 0.88, a 0.90 mAP, and a recall of 1. Similarly, YOLOv5m outperformed YOLOv5s, attaining an F1-score of 0.90, a 0.92 mAP, and a recall of 1. These results indicate that dataset augmentation contributed to higher detection accuracy, with YOLOv5m consistently outperforming YOLOv5s across all metrics, making it the more reliable model for classifying free-floating litter.

4.3. Campaign 3 and YOLOv5

The buoy-litter data after image augmentation included 2000 training images and 600 testing images. The performance was lower for YOLOv5s (Figure 11), with an F1-score of 0.75, a 0.55 mAP, and a recall of 0.95, while YOLOv5m performed slightly better, with an F1-score of 0.88 at 0.333 confidence, an mAP of 0.65, and a recall of 0.9. YOLOv5s demonstrated superior recall and overall detection accuracy but struggled with classification, misidentifying boats as floating litter with a confidence of 0.3. On the other hand, YOLOv5m excelled in distinguishing between classes, making it the more precise model. In conclusion, YOLOv5s is recommended when high recall and accuracy are required, while YOLOv5m is better suited for applications requiring higher mAP and multi-class differentiation.

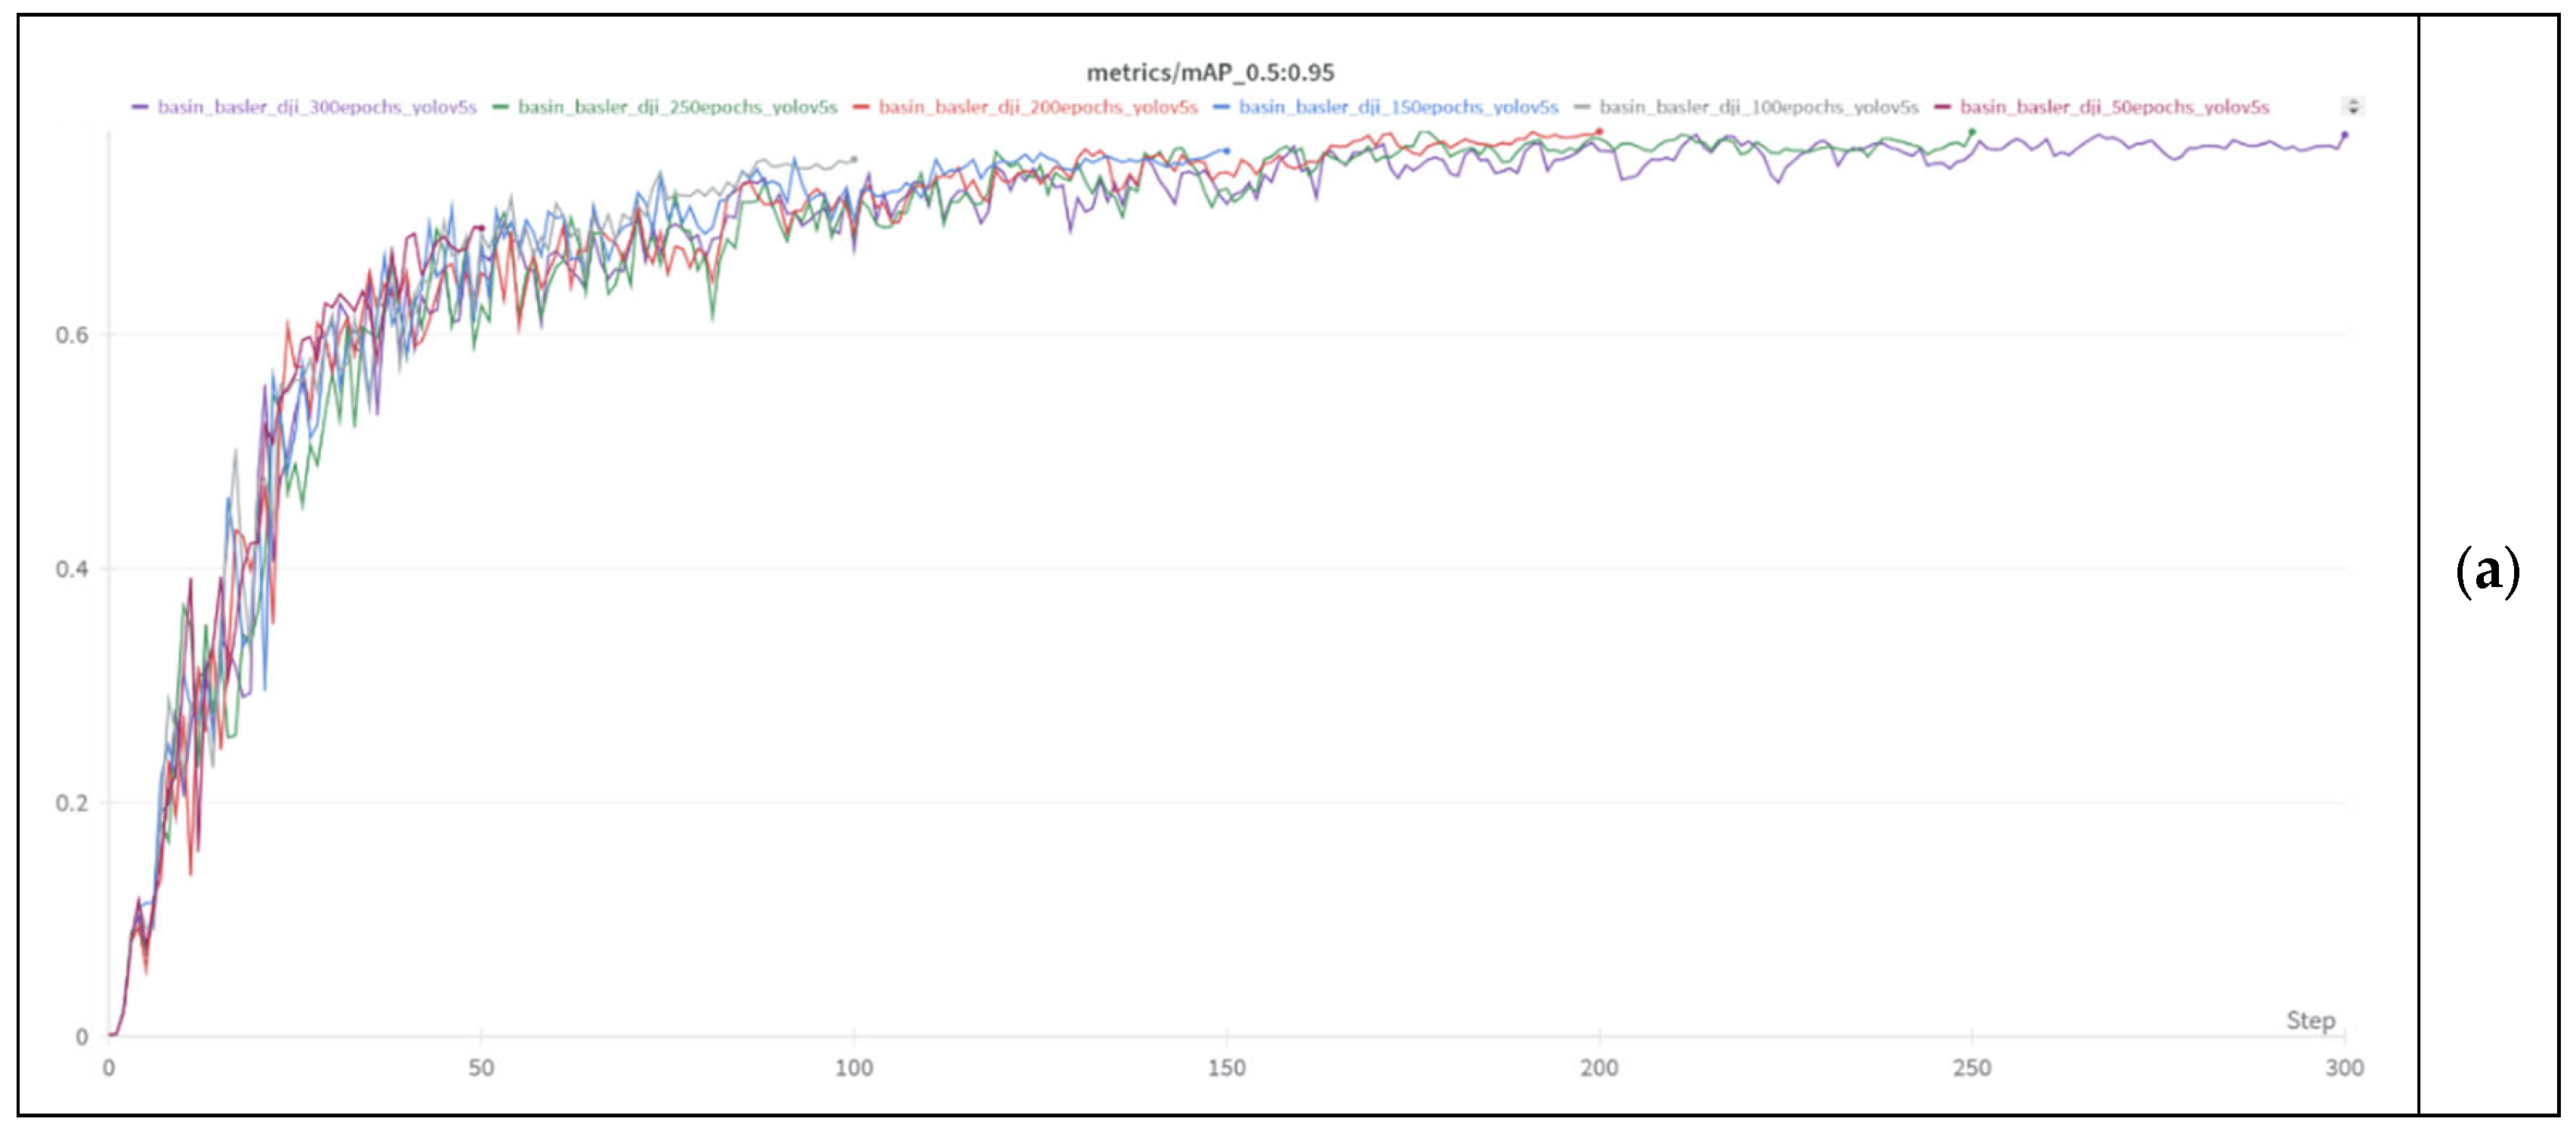
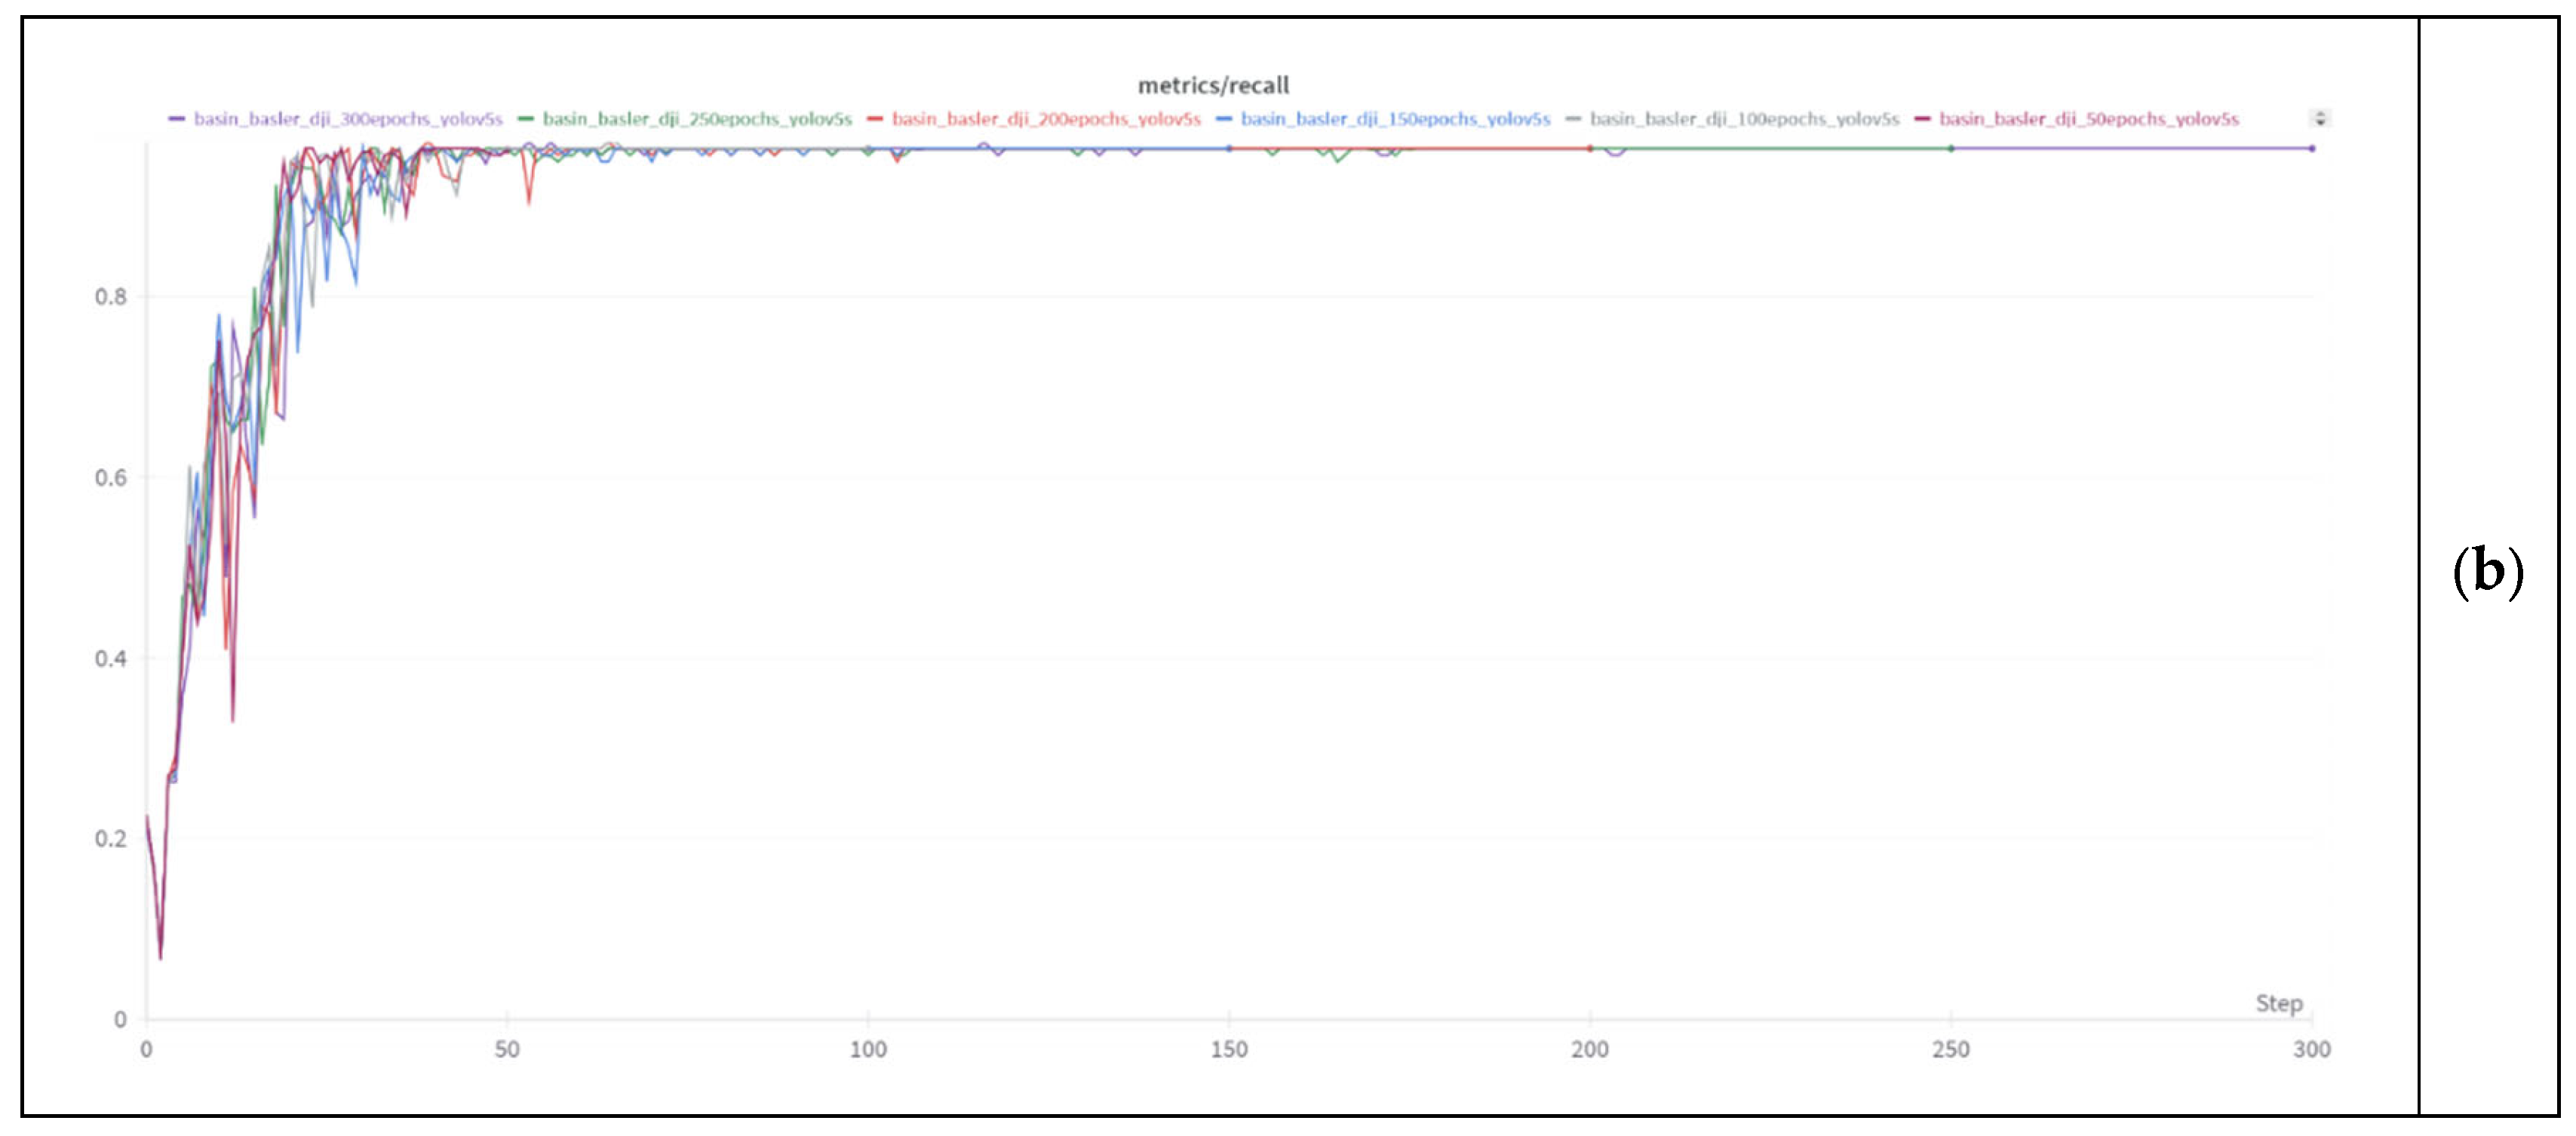
4.4. All Campaigns and YOLOv5

The experiments demonstrate that selecting an optimal number of training epochs is crucial for achieving the best model performance using YOLOv5. The highest F1-score, 1.0, was achieved by combining all campaign datasets in different trials (training: 1858, testing: 558). Another trial, with 1164 training images and 15 testing images, recorded an F1-score of 0.98, indicating strong performance. In further trials with additional object classes, including plastics, ships, fumes, and oil spills, with 1225 training images and 71 test images, the model exhibited overfitting, as evidenced by the decrease in the F1-score to 0.68. This highlights the importance of avoiding excessive training to maintain model generalisation.
Overall, YOLOv5m demonstrated strong robustness and adaptability across various datasets and training conditions, proving to be an effective model for detecting litter and other objects. However, carefully considering dataset composition, image quality, and training epochs is necessary to optimise model performance while preventing overfitting.

4.5. Impact of Synthetic Litter Image Quality on YOLOv5

In the image quality analysis, we evaluated the impact of image quality on the classification performance of the YOLOv5 Deep Learning model using mean-squared error (MSE), the signal-to-noise ratio (SNR), and the peak signal-to-noise ratio (PSNR). Lower MSE values indicate more remarkable similarity between images, while higher SNR and PSNR values signify better image quality. For the Campaign 1 lab-litter data, comparing an RGB image from Alvium 1800 u-2050c to Mako resulted in an MSE of 19,617.5237, an SNR of 1.8389, and a PSNR of 5.2044. For the Campaign 2 basin-litter data, comparing an image from Basler to DJI Zenmuse yielded an MSE of 9004.2796, an SNR of 4.7582, and a PSNR of 8.5863. In Campaign 3, comparing an image from DJI Zenmuse to DJI Mavic 2 Enterprise yielded an MSE of 7418.2185, an SNR of 2.4230, and a PSNR of 9.4278. In Campaign 2, the DJI Zenmuse RGB camera provided the best image quality, followed by the DJI Mavic 2 Enterprise, with the Basler RGB camera performing worst.
Training object loss and bounding box loss decreased with an increase in the number of epochs regardless of the size of the dataset, whereas GPU, CPU, and memory utilisation increased. Training object and class loss remained approximately zero across training epochs and datasets. Performance metrics, including mAP and recall, improved with training steps but were not directly influenced by dataset size. While YOLOv5s and YOLOv5m exhibited similar performances, YOLOv5m performed better, particularly in Campaign 3, demonstrating superior classification accuracy. A trial-and-error approach revealed the optimal training epochs, emphasising that better image quality with maximum frame-filling pixels improves model accuracy, while poor image quality limits detection. Expanding training datasets through image augmentation helps optimise model performance, preventing underfitting and overfitting. For datasets with fewer than 1000 images, YOLOv5s is preferred, while YOLOv5m is more effective for larger datasets when tuned for multiple classes, maximum F1-score, confidence, mAP, recall, and minimal training loss. Computational resources, including GPU, CPU, and disk utilisation, are not a limiting factor for the proposed methodology due to the availability of powerful hardware.

5. Discussion

The proposed AI-driven spectral monitoring system significantly advances real-time marine pollution detection by integrating RGB, thermal infrared, and hyperspectral radiometry for multispectral data fusion [10]. This system enhances detection accuracy compared to conventional individual sensor approaches and was validated across controlled laboratory conditions, semi-controlled basins, and real-world marine environments.

5.1. Performance Evaluation: Detection and Classification

The YOLOv5 deep learning model, trained on synthetic litter datasets, demonstrated high detection accuracy across various environmental conditions. In Campaign 1 (lab-litter dataset), performance improved with training epochs, with YOLOv5s and YOLOv5m achieving F1-scores of 1.0. YOLOv5m demonstrated better mAP (0.770 vs. 0.760), recall, and fewer classification errors.
In Campaign 2 (basin-litter dataset), YOLOv5s and YOLOv5m were tested on Basler and Zenmuse RGB free-floating litter datasets. YOLOv5m at 35 epochs achieved an F1-score of 1.0, mAP of 0.75 and recall of 1.0, while YOLOv5s performed slightly lower, with an F1-score of 0.99, mAP of 0.7 and recall of 0.98. When both datasets were combined and dataset augmentation was applied, the performance improved, with YOLOv5s reaching an F1-score of 0.88, mAP of 0.90 and recall of 1.0. At the same time, YOLOv5m achieved an F1-score of 0.90, mAP of 0.92 and recall of 1.0, confirming its superior classification accuracy.
In Campaign 3 (buoy-litter dataset), YOLOv5s at 35 epochs achieved an F1-score of 1.0, recall of 1.0 and mAP of 0.53, while YOLOv5m had an F1-score of 0.95, recall of 0.9 and the highest mAP of 0.65, demonstrating better overall precision. At 30 epochs, YOLOv5m outperformed YOLOv5s, achieving an F1-score of 0.88, mAP of 0.65 and recall of 0.9, compared to YOLOv5s’ F1-score of 0.75, mAP of 0.55 and recall of 0.95. Despite YOLOv5s having superior recall and overall detection accuracy, it misclassified boats as floating litter with a confidence of 0.3, whereas YOLOv5m excelled in distinguishing between different objects, making it the more precise model.

5.2. Multispectral Fusion for Enhanced Detection

A key advantage of this system is its ability to leverage pollutants’ spectral characteristics [10,15,22,23] to achieve improved classification. Oil spills and floating litter exhibit unique spectral signatures in the visible and infrared wavelengths. By integrating RGB and thermal imaging, this system reduces false positives caused by water reflections or natural debris. RGB-only detection led to the misclassification of boats as floating litter, while RGB and thermal fusion corrected this issue by recognising thermal contrasts between plastic and surrounding seawater. Hyperspectral radiometry [12] further refined classification, distinguishing between plastic types and oil spills, making the system more effective than traditional marine monitoring techniques.

5.3. Environmental Factors Affecting Performance

Although the system is robust, environmental conditions can still affect its performance. Wind and wave motion impact sensor alignment in buoy-mounted setups, affecting the accuracy of pan-tilt positioning. Sunlight reflection and cloud cover can also influence hyperspectral readings; in this study, they were mitigated using radiance and irradiance calibration techniques. Variations in oil spill dispersion [12] patterns due to temperature and water currents affect detection accuracy, highlighting the need for real-time adaptive learning models in future iterations.

5.4. Comparative Analysis Involving Existing Studies

This study builds upon previous marine-monitoring efforts by incorporating AI-based real-time spectral fusion analysis. Comparisons with prior studies show the improvements in detection accuracy (Table 1).
These results demonstrate that the system developed in this study outperforms previous approaches [11,16] by integrating real-time spectral fusion with AI-driven detection models [10,12], improving classification accuracy and adaptability to variable marine environments.

5.5. Impact of Synthetic Litter Image Quality on YOLOv5 Performance

Image quality analysis was conducted to evaluate the effect of image quality on classification performance. MSE, SNR, and PSNR metrics were used to assess image clarity:
  • Campaign 1 (lab-litter dataset): MSE = 19,617.5237, SNR = 1.8389, PSNR = 5.2044;
  • Campaign 2 (basin-litter dataset): MSE = 9004.2796, SNR = 4.7582, PSNR = 8.5863;
  • Campaign 3 (buoy-litter dataset): MSE = 7418.2185, SNR = 2.4230, PSNR = 9.4278.
Among the cameras used, Campaign 2’s DJI Zenmuse RGB camera provided the best image quality, followed by DJI Mavic 2 Enterprise, with the Basler RGB camera performing worst. Training object loss and bounding box loss decreased with increasing epochs, while GPU, CPU, and memory utilisation increased, highlighting the efficiency of YOLOv5 with proper hardware optimisation.

5.6. Real-World Implications

The findings suggest that AI-based [29] pollution monitoring can significantly enhance marine conservation efforts by enabling early detection of oil spills and plastic debris, allowing for faster response strategies. The AI model reduces reliance on manual sampling, which is labour-intensive and often leads to delays.

6. Conclusions

This study presents an AI-driven multispectral monitoring system for real-time marine pollution detection, overcoming the limitations of traditional monitoring methods. The system enhances pollutant classification accuracy by integrating RGB, thermal infrared, and hyperspectral sensors while minimising false positives caused by environmental factors such as lighting variations and water reflections. The dual-unit architecture, consisting of an overview unit for wide-area scanning and a directional unit for high-resolution analysis, ensures precise detection and classification of oil spills and floating debris. The Deep Learning model, YOLOv5, trained on synthetic and real-world marine datasets, demonstrated high detection accuracy, with YOLOv5m achieving an F1-score of 1.0 and an mAP of 0.92, outperforming previous approaches. The results confirm that multispectral data fusion improves real-time environmental monitoring by allowing robust classification across diverse marine conditions.
Despite its strengths, this study has certain limitations. Environmental factors such as extreme wave motion, sunlight reflection, and temperature variations can impact the accuracy of hyperspectral and thermal imaging. Due to strong winds and water currents, sensor misalignment in buoy-mounted setups may also affect the proposed system’s performance. Additionally, real-time deployment in deep-sea environments presents challenges related to power consumption, data transmission, and scalability for large-area monitoring. While the AI model achieved high detection accuracy, further refinements are needed to enhance its adaptability under highly dynamic marine conditions.
Future research should focus on improving AI models by incorporating real-time adaptive-learning mechanisms to enhance robustness against environmental variability. Integrating drone-based monitoring can expand this system’s capabilities for large-scale pollution detection. Further exploration of hyperspectral imaging for microplastic detection could improve marine conservation efforts by identifying pollutants at a finer scale. Additionally, developing automated alert systems to allow rapid responses to pollution events and integrating AI-driven chemical spectral analysis for detecting heavy metals and industrial waste would strengthen environmental management and policy enforcement. Expanding the training dataset through advanced image augmentation techniques and refining multisensor fusion methods will optimise detection accuracy. Addressing these areas will ensure the long-term impact, scalability, and effectiveness of AI-driven marine pollution monitoring, making it a critical tool for real-time environmental surveillance and conservation.

Supplementary Materials

The following supporting information can be downloaded at https://www.mdpi.com/article/10.3390/jmse13040636/s1. Figure S1: Everyday usage and single-use plastics to form artificial litter used in the proposed data acquisition campaigns; Figure S2: Campaign-2 Zenmuse RGB basin free-floating litter imageset augmentation.

Author Contributions

N.P.: Conceptualisation, methodology, software, validation, formal analysis, investigation, resources, data curation, writing—original draft, review and editing, visualisation, and project administration. O.Z.: Conceptualisation, writing—review, supervision, and funding acquisition. All authors have read and agreed to the published version of the manuscript.

Funding

For the data acquisition campaigns, the authors acknowledge the MWK’s financial support through “Niedersachsen Vorab” (ZN3480) and MarTERA 2019 (ERA-NET COFUND) at the DFKI GmbH.

Data Availability Statement

The corresponding author conducted all data acquisition campaigns from 2020–2023 while working as a Researcher at DFKI GmbH and a Doctoral Student at the ICBM, Carl von Ossietzky University of Oldenburg. The corresponding author conducted data analysis and obtained results in April 2024 as a Doctoral Student at the ICBM, Carl von Ossietzky University of Oldenburg. The original contributions presented in this study are included in the article and Supplementary Material. Further inquiries can be directed to the corresponding author.

Acknowledgments

The authors thank ICBM, the staff of the Carl von Ossietzky University of Oldenburg, Oliver Wurl, and Sven Emig for helping conduct Campaign 2 and Campaign 3. Thanks go out to Charles Lennart Müller for all the graphics and help planning Campaign 2 and Wolfram Michael Butter (DFKI GmbH, Oldenburg) for helping plan Campaign 2.

Conflicts of Interest

Navya Prakash (corresponding author) and Oliver Zielinski (co-author) were employed by DFKI GmbH. Oliver Zielinski was employed by ICBM, Carl von Ossietzky University of Oldenburg. The remaining authors declare that the research was conducted in the absence of any commercial or financial relationships that could be construed as a potential conflict of interest.

References

  1. NAOO. Where Does Marine Debris Come from? US Department of Commerce, NAOO, National Ocean Service. 2022. Available online: https://marinedebris.noaa.gov/discover-marine-debris (accessed on 4 April 2024).
  2. COAPS. Center for Ocean-Atmospheric Prediction Studies. Global Model for Monitoring Marine Litter. 2022. Available online: https://www.coaps.fsu.edu/our-expertise/global-model-for-marine-litter (accessed on 4 April 2024).
  3. OECD. Organisation for Economic Cooperation and Development. Global Plastics Outlook, The Ocean. 2022. Available online: https://www.oecd.org/environment/plastics/ (accessed on 4 April 2024).
  4. UNEP. Global Environment Outlook—GEO-6: Healthy Planet, Healthy People. United Nations Environment Programme. 2022. Available online: https://www.unep.org/resources/global-environment-outlook-6 (accessed on 4 April 2024).
  5. MSFD. Marine Strategy Framework Directive 2008/56/EC. European Parliament and Council. 2008. Available online: https://eur-lex.europa.eu/legal-content/en/ALL/?uri=CELEX%3A32008L0056 (accessed on 4 April 2024).
  6. EU. The EU Blue Economy Report 2019. Directorate-General for Maritime Affairs and Fisheries, European Commission, Publications Office of the European Union. 2019. Available online: https://op.europa.eu/en/publication-detail/-/publication/676bbd4a-7dd9-11e9-9f05-01aa75ed71a1/language-en/ (accessed on 4 April 2024).
  7. UN. Sustainable Development Goals Report. United Nations. 2022. Available online: https://unstats.un.org/sdgs/report/2022/ (accessed on 4 April 2024).
  8. WHO. World Health Organization Report on Water Sanitation and Health. 2022. Available online: https://www.who.int/publications/i/item/9789240076297 (accessed on 4 April 2024).
  9. OSPAR Commission. CEMP Guidelines for Marine Monitoring and Assessment of Beach Litter; OSPAR Agreement 2020-02; OSPAR Commission: London, UK, 2020. [Google Scholar] [CrossRef]
  10. Prakash, N.; Stahl, F.; Mueller, C.L.; Ferdinand, O.; Zielinski, O. Intelligent Marine Pollution Analysis on Spectral Data. In Proceedings of the OCEANS 2021: San Diego—Porto, San Diego, CA, USA, 20–23 September 2021; pp. 1–6. [Google Scholar] [CrossRef]
  11. Armitage, S.; Awty-Carroll, K.; Clewley, D.; Martinez-Vicente, V. Detection Classification of Floating Plastic Litter using a Vessel-Mounted Video Camera Deep Learning. Remote Sens. 2022, 14, 3425. [Google Scholar] [CrossRef]
  12. Zielinski, O.; Busch, J.A.; Cembella, A.D.; Daly, K.L.; Engelbrektsson, J.; Hannides, A.K.; Schmidt, H. Detecting Marine Hazardous Substances and Organisms: Sensors for Pollutants, Toxins and Pathogens. Ocean Sci. 2009, 5, 329–349. [Google Scholar] [CrossRef]
  13. Bagheri, M.; Farshforoush, N.; Bagheri, K.; Shemirani, A.I. Applications of Artificial Intelligence Technologies in Water Environments: From Basic Techniques to Novel Tiny Machine Learning Systems. Process Saf. Environ. Prot. 2023, 180, 10–22. [Google Scholar] [CrossRef]
  14. Herruzo-Ruiz, A.M.; Peralbo-Nolina, A.; López, C.M.; Michán, C.; Alhama, J.; Chicano-Gálvez, E. Mass Spectrometry Imaging in Environmental Monitoring: From a Scarce Existing Past to a Promising Future. Trends Environ. Anal. Chem. 2024, 42, e00228. [Google Scholar] [CrossRef]
  15. Hyspex. Hyperspectral Imaging for Plastic Recycling: Classifying Mixed Plastic Waste. HySpex by Neo. 2024. Available online: https://www.hyspex.com/media/qpfh4inu/hyspex_plastics.pdf (accessed on 4 April 2024).
  16. Ben-Shoushan, R.; Brook, A. Fused Thermal and RGB Imagery for Robust Detection and Classification of Dynamic Objects in Mixed Datasets via Pre-Trained High-Level CNN. Remote Sens. 2023, 15, 723. [Google Scholar] [CrossRef]
  17. Bustos, N.; Mashhadi, M.; Lai-Yuen, S.K.; Sarkar, S.; Das, T.K. A Systematic Literature Review on Object Detection using Near Infrared and Thermal Images. Neurocomputing 2023, 560, 126804. [Google Scholar] [CrossRef]
  18. Zhao, T.; Yuan, M.; Jiang, F.; Wang, N.; Wei, X. Removal and Selection: Improving RGB-Infrared Object Detection via Coarse-to-Fine Fusion. arXiv 2024. [Google Scholar] [CrossRef]
  19. Ultralytics. YOLOv5: A State-of-the-Art Real-Time Object Detection System. 2021. Available online: https://docs.ultralytics.com/yolov5/ (accessed on 4 April 2024).
  20. Ma, J.; Ma, R.; Pan, Q.; Liang, X.; Wang, J.; Ni, X. A Global Review of Progress in Remote Sensing and Monitoring of Marine Pollution. Water 2023, 15, 3491. [Google Scholar] [CrossRef]
  21. Goddijn-Murphy, L.; Martínez-Vicente, V.; Dierssen, H.M.; Raimondi, V.; Gandini, E.; Foster, R.; Chirayath, V. Emerging Technologies for Remote Sensing of Floating and Submerged Plastic Litter. Remote Sens. 2024, 16, 1770. [Google Scholar] [CrossRef]
  22. Taneepanichskul, N.; Hailes, H.C.; Miodownik, M. Using Hyperspectral Imaging to Identify and Classify Large Microplastic Contamination in Industrial Composting Processes. Front. Sustain. 2024, 5, 1332163. [Google Scholar] [CrossRef]
  23. Vansteenwegen, D.; Ruddick, K.; Cattrijsse, A.; Vanhellemont, Q.; Beck, M. The Pan-and-Tilt Hyperspectral Radiometer System (PANTHYR) for Autonomous Satellite Validation Measurements—Prototype Design and Testing. Remote Sens. 2019, 11, 1360. [Google Scholar] [CrossRef]
  24. Ade, C.; Hestir, E.L.; Avouris, D.M.; Burmistrova, J.; Nickles, C.; Lopez, A.M.; Barreto, B.L.; Vellanoweth, J.; Smalldon, R.; Lee, C.M. SHIFT: Ramses Trios Radiometer Above Water Measurements, Santa Barbara Sea, CA; ORNL DAAC: Oak Ridge, TN, USA, 2023. [Google Scholar] [CrossRef]
  25. Vabson, V.; Ansko, I.; Duong, K.; Vendt, R.; Kuusk, J.; Ruddick, K.; Bialek, A.; Tilstone, G.H.; Gossn, J.I.; Kwiatkowska, E. Complete characterisation of ocean color radiometers. Front. Remote Sens. 2024, 5, 1320454. [Google Scholar] [CrossRef]
  26. SURF. Sea Surface Facility. 2023. Available online: https://uol.de/icbm/prozesse-und-sensorik-mariner-grenzflaechen/equipment-and-infrastructure/surf (accessed on 4 April 2024).
  27. Tzutalin. LabelImg. 2015. Available online: https://github.com/tzutalin/labelImg (accessed on 4 April 2024).
  28. WandB. Weights and Biases. 2025. Available online: https://wandb.ai/site (accessed on 4 April 2024).
  29. Moorton, Z.; Kurt, Z.; Woo, W.L. Is the Use of Deep Learning an Appropriate Means to Locate Debris in the Ocean Without Harming Aquatic Wildlife? Mar. Pollut. Bull. 2022, 181, 113853. [Google Scholar] [CrossRef] [PubMed]
Figure 1. Proposed design of the spectral sensor system: (a) the system is capable of autonomously operating with the spectral system on a buoy and harbour platform for marine pollution monitoring [10]; (b) system legend [10]; (c) data flow chart [10].
Jmse 13 00636 g001
Figure 2. Campaign 1: (a) static litter data acquisition using an Alvium 1800 u-2050c RGB camera with a wide-angle lens, and (b) static litter data acquisition from Mako RGB camera with a telelens.
Jmse 13 00636 g002
Figure 3. Campaign 2: free-floating litter captured using Basler RGB camera with a wide-angle lens.
Jmse 13 00636 g003
Figure 4. Campaign 2: free-floating litter captured using a Zenmuse RGB camera with a fixed-angle lens.
Jmse 13 00636 g004
Figure 5. Campaign 3: DJI Mavic 2 Enterprise mounted on a buoy at Jade Bight (geolocation: 53°35′12.6″ N, 8°09′49.1″ E), North Sea Coast, Germany, to capture RGB videos of grouped floating litter.
Jmse 13 00636 g005
Figure 6. Campaign 3: grouped floating litter groups captured using a DJI Mavic 2 Enterprise visual camera at Jade Bight (geolocation: 53°35′12.6″ N, 8°09′49.1″ E), North Sea Coast, Germany.
Jmse 13 00636 g006
Figure 7. Campaign 1 performance metrics for YOLOv5: (a) lab-litter data evaluated using YOLOv5s; (b) lab-litter data evaluated using YOLOv5m.
Jmse 13 00636 g007
Figure 8. Campaign 2: Basler basin free-floating-litter data performance metrics for YOLOv5s and YOLOv5m: (a) mAP at 0.5:0.95; (b) recall.
Jmse 13 00636 g008
Figure 9. Campaign 2: Zenmuse basin free-floating-litter data performance metrics for YOLOv5s and YOLOv5m: (a) mAP at 0.5:0.95; (b) recall.
Jmse 13 00636 g009aJmse 13 00636 g009b
Figure 10. Campaign 2: Basin data (Basler + Zenmuse RGB image set) free-floating litter data performance metrics for YOLOv5s: (a) mAP at 0.5:0.95; (b) recall.
Jmse 13 00636 g010aJmse 13 00636 g010b
Figure 11. Campaign 3: Buoy floating-litter data performance metrics for YOLOv5s and YOLOv5m: (a) mAP at 0.5:0.95; (b) recall.
Jmse 13 00636 g011aJmse 13 00636 g011b
Table 1. Result comparisons.
StudyMethodF1-ScoremAPKey Limitations
Armitage et al. (2022) [11]Vessel-mounted RGB Camera + Deep Learning0.750.78Limited detection range, affected by lighting
Ben-Shoushan and Brook (2023) [16]Thermal + RGB CNN Model0.810.83Limited dataset, no hyperspectral integration
This StudySynthetic Litter Data (RGB) + YOLOv51.00.92Environmental factors still impact accuracy
Disclaimer/Publisher’s Note: The statements, opinions and data contained in all publications are solely those of the individual author(s) and contributor(s) and not of MDPI and/or the editor(s). MDPI and/or the editor(s) disclaim responsibility for any injury to people or property resulting from any ideas, methods, instructions or products referred to in the content.

