1. Introduction
Wind power generation technology, as a clean energy technology that converts wind energy into electricity, plays a leading role in the global energy transition due to its advantages of low emissions, low cost, no pollution, and high availability. In 1888, American inventor Charles Bushnell built the world’s first large-scale wind turbine, laying the foundation for the early development of wind power technology. In the late 1970s, Denmark took the lead in building and operating the world’s first commercial wind farm, marking an important step towards the commercialization of wind power technology. Subsequently, the commercialization process of wind power technology is significantly accelerating, and the installed capacity of wind power continues to rise globally [
1,
2,
3,
4].
With the gradual depletion of land resources, offshore wind power, which is a form of clean energy with enormous potential, is receiving increasing attention. Compared with onshore wind energy, offshore wind energy has higher stability, quality, power density, and capacity coefficient [
5,
6].
According to the statistical analysis of wind turbine failure cases, fatigue-induced fracture has been identified as one of the main failure mechanisms [
7]. Offshore wind turbines are continuously exposed to dynamic environmental loads such as wind, waves, and currents throughout their entire lifecycle [
8]. Specifically, wind exerts mechanical stresses on turbine blades and hubs, which are typically approximated as periodic to simplify the analysis, while tower structures are subjected to wave and water flow forces. In addition, pile foundation structures may occasionally encounter additional loads caused by geological activities such as submarine landslides [
9]. These environmental loads will cause stress cycles in various key components of the turbine, leading to the gradual accumulation of fatigue damage to the material and ultimately reaching its fatigue durability limit. The influencing factors of tower fatigue also include material characteristic constants [
10], material combination methods, and so on, which may have a positive impact on fatigue life [
11]. However, as most analyses focus on the impact of environmental factors, in order to simplify the process, it is usually assumed that the overall material of the tower is Q355 steel or concrete. This article also conducts research based on this assumption.
Currently, research methods for fatigue characteristics of offshore wind power mainly cover two major fields: frequency-domain analysis and time-domain analysis [
12]. Time-domain analysis uses the rain flow counting method to calculate stress time history and obtain data on equivalent stress amplitude and cycle number [
13]. Subsequently, the fatigue life curve and fatigue damage accumulation theory (such as Miner’s linear cumulative damage theory) are used to evaluate the degree of fatigue damage in the structure. In contrast, frequency-domain analysis focuses on obtaining probability density functions of factors such as wind, waves, and currents based on actual environmental conditions, and converting them into frequency spectra of structural responses. By analyzing these spectra, the fatigue damage of the structure in different frequency ranges can be comprehensively evaluated, thereby more accurately predicting the life and safety of the structure. De Morais Dodani Renan et al. [
14] proposed a method for evaluating the dynamic behavior of wind turbine towers considering the influence of wind on their structural components and studied the relationship between spatially correlated wind fields and structural behavior. Rezaei et al. [
15] used nonlinear p–y curves for soil structure interaction in time-domain finite element simulations to analyze the fatigue life of single-pile offshore wind turbines. Tao Chen et al. [
16] used the Mohr–Coulomb failure criterion and surface-to-surface contact to simulate soil structure interactions and model offshore wind turbines. Romali Biswal et al. [
17] conducted fatigue damage analysis at circumferential welds using the finite element method by considering the discontinuity of geometric and material properties. Ana Glišić et al. [
18] considered that submerged support structures are mainly affected by waves and therefore studied the influence of wave load parameters on fatigue stress and conducted sensitivity analysis. Yibo Xi et al. [
19] conducted statistical extrapolation of extreme loads and long-term and short-term fatigue damage assessment on offshore wind turbine towers based on actual monitoring data.
This article takes the single-pile foundation of an offshore wind turbine near the Shandong Peninsula as an example and uses FAST (3.5.0) software to establish an integrated model of the wind turbine structure. The study focuses on several key aspects. First, the integration of frequency and time-domain analyses provides a comprehensive evaluation of wind turbine performance, addressing the varying nature of wind loads and their impact on long-term durability [
20]. In particular, the study’s focus on the fatigue characteristics at the tower root [
21], the area most susceptible to damage from wind-induced forces, makes it especially relevant for engineers and designers working in the offshore wind industry. Finally, by accurately quantifying the fatigue life of the turbine, this research offers critical insights into optimizing the design and maintenance of these structures, ultimately contributing to the resilience and efficiency of renewable energy systems.
2. Fatigue Analysis Method
Fatigue refers to the microstructural changes that occur in materials over time under cyclic loading [
22], ultimately leading to a decrease in material strength and toughness. According to classical fatigue theory, fatigue damage is mainly influenced by factors such as the amplitude, frequency, and number of loading cycles of alternating stress. To better analyze the fatigue behavior of wind turbine towers, this article will systematically elaborate on the basic theories related to fatigue, including the S–N curve, P–M linear cumulative damage method, and other related fatigue analysis methods. These theories provide important theoretical foundations for subsequent fatigue damage assessment.
2.1. S–N Curve
The evaluation of fatigue resistance performance is of great significance in the field of structural engineering, and the S–N curve (stress cycle number curve) plays an indispensable role as a core tool for characterizing the fatigue characteristics of materials under cyclic loading. This curve can generally be divided into low-stress zones (corresponding to long life) and high-stress zones (corresponding to short life). The data obtained from fatigue tests conducted in the laboratory can provide a reliable basis for the fatigue behavior of materials under different stress levels. In addition, due to differences in material types and their structural forms, the S–N curve parameters may undergo significant changes. Therefore, selecting an appropriate S–N curve is crucial for accurately evaluating the fatigue performance and safety of the structure.
According to the DNVGL (Det Norske Veritas and Germanischer Lloyd, a global quality assurance and risk management company) [
23] specification, the typical S–N curve expression for steel structures is
where ∆
σ is the magnitude of the stress amplitude experienced by the structure,
N is the number of cycles required for the structure to reach fatigue failure when the stress amplitude is ∆
σ,
m is the slope of the double logarithmic coordinate S−N curve, which is a negative value,
is the intercept on the
axis,
k is the thickness correction parameter,
and
t are the reference thickness and the thickness of crack propagation penetration, respectively.
Among them, specific parameters are selected according to the recommended standards based on the “Guidelines for Fatigue Strength Assessment of Marine Engineering Structures” of the China Classification Society [
24].
2.2. Rain Flow Counting Method
Since wind turbines are subjected to loads with stochastic and dynamic characteristics [
25], the stress time history is usually composed of multiple stress pulses. Therefore, in order to facilitate subsequent calculation and analysis, it is particularly necessary to use the cycle counting method to simplify the complex irregularly measured stress time history into a representative typical stress spectrum [
26]. This process is commonly referred to as compiling spectrum.
The obtained stress spectrum should fulfill the following conditions: Firstly, the types of stress time histories should be reduced to enable reasonable comparative analysis. Secondly, the law of load variation should be derived based on the limited measured data, in order to form a representative typical spectrum. Thirdly, the simplified stress spectrum must align with the actual situation, ensuring that the fatigue life calculated from both the simplified spectrum and the actual data remains consistent. Finally, the number of cycles and stress amplitude should be determined according to the damaging degree equivalent principle for multilevel amplitude or random amplitude loads.
The cycle counting method includes various counting methods, such as rain flow counting, cascade counting, peak counting, and so on. Among them, the rain flow counting method is widely used and has been experimentally proven to be superior and effective compared to other methods. Therefore, the rain flow counting method has been incorporated as an important cycle counting algorithm into various standard specifications such as ASTM and SAE.
The steps and rules of the rain flow counting method are as follows:
- (1)
Identify Local Extremes: Detect all local extrema (peaks and valleys) in the load sequence.
- (2)
Form Cyclic Pairs: Pair consecutive peaks and valleys to define cyclic loops.
- (3)
Calculate Cycle Parameters: Compute the amplitude (difference between peak and valley) and the mean value (average of peak and valley) for each cycle.
- (4)
Sort and Merge Loops: Rank the cycles by amplitude in descending order, merging those with similar amplitudes.
- (5)
Handle Half Cycles: Address half cycles (where a peak or valley occurs but the subsequent load fluctuation does not form a complete cycle, often due to data boundaries or an incomplete cycle) by merging them appropriately with adjacent cycles.
- (6)
Generate Amplitude Distribution: Create a distribution of cycle amplitudes and calculate the frequency of each amplitude.
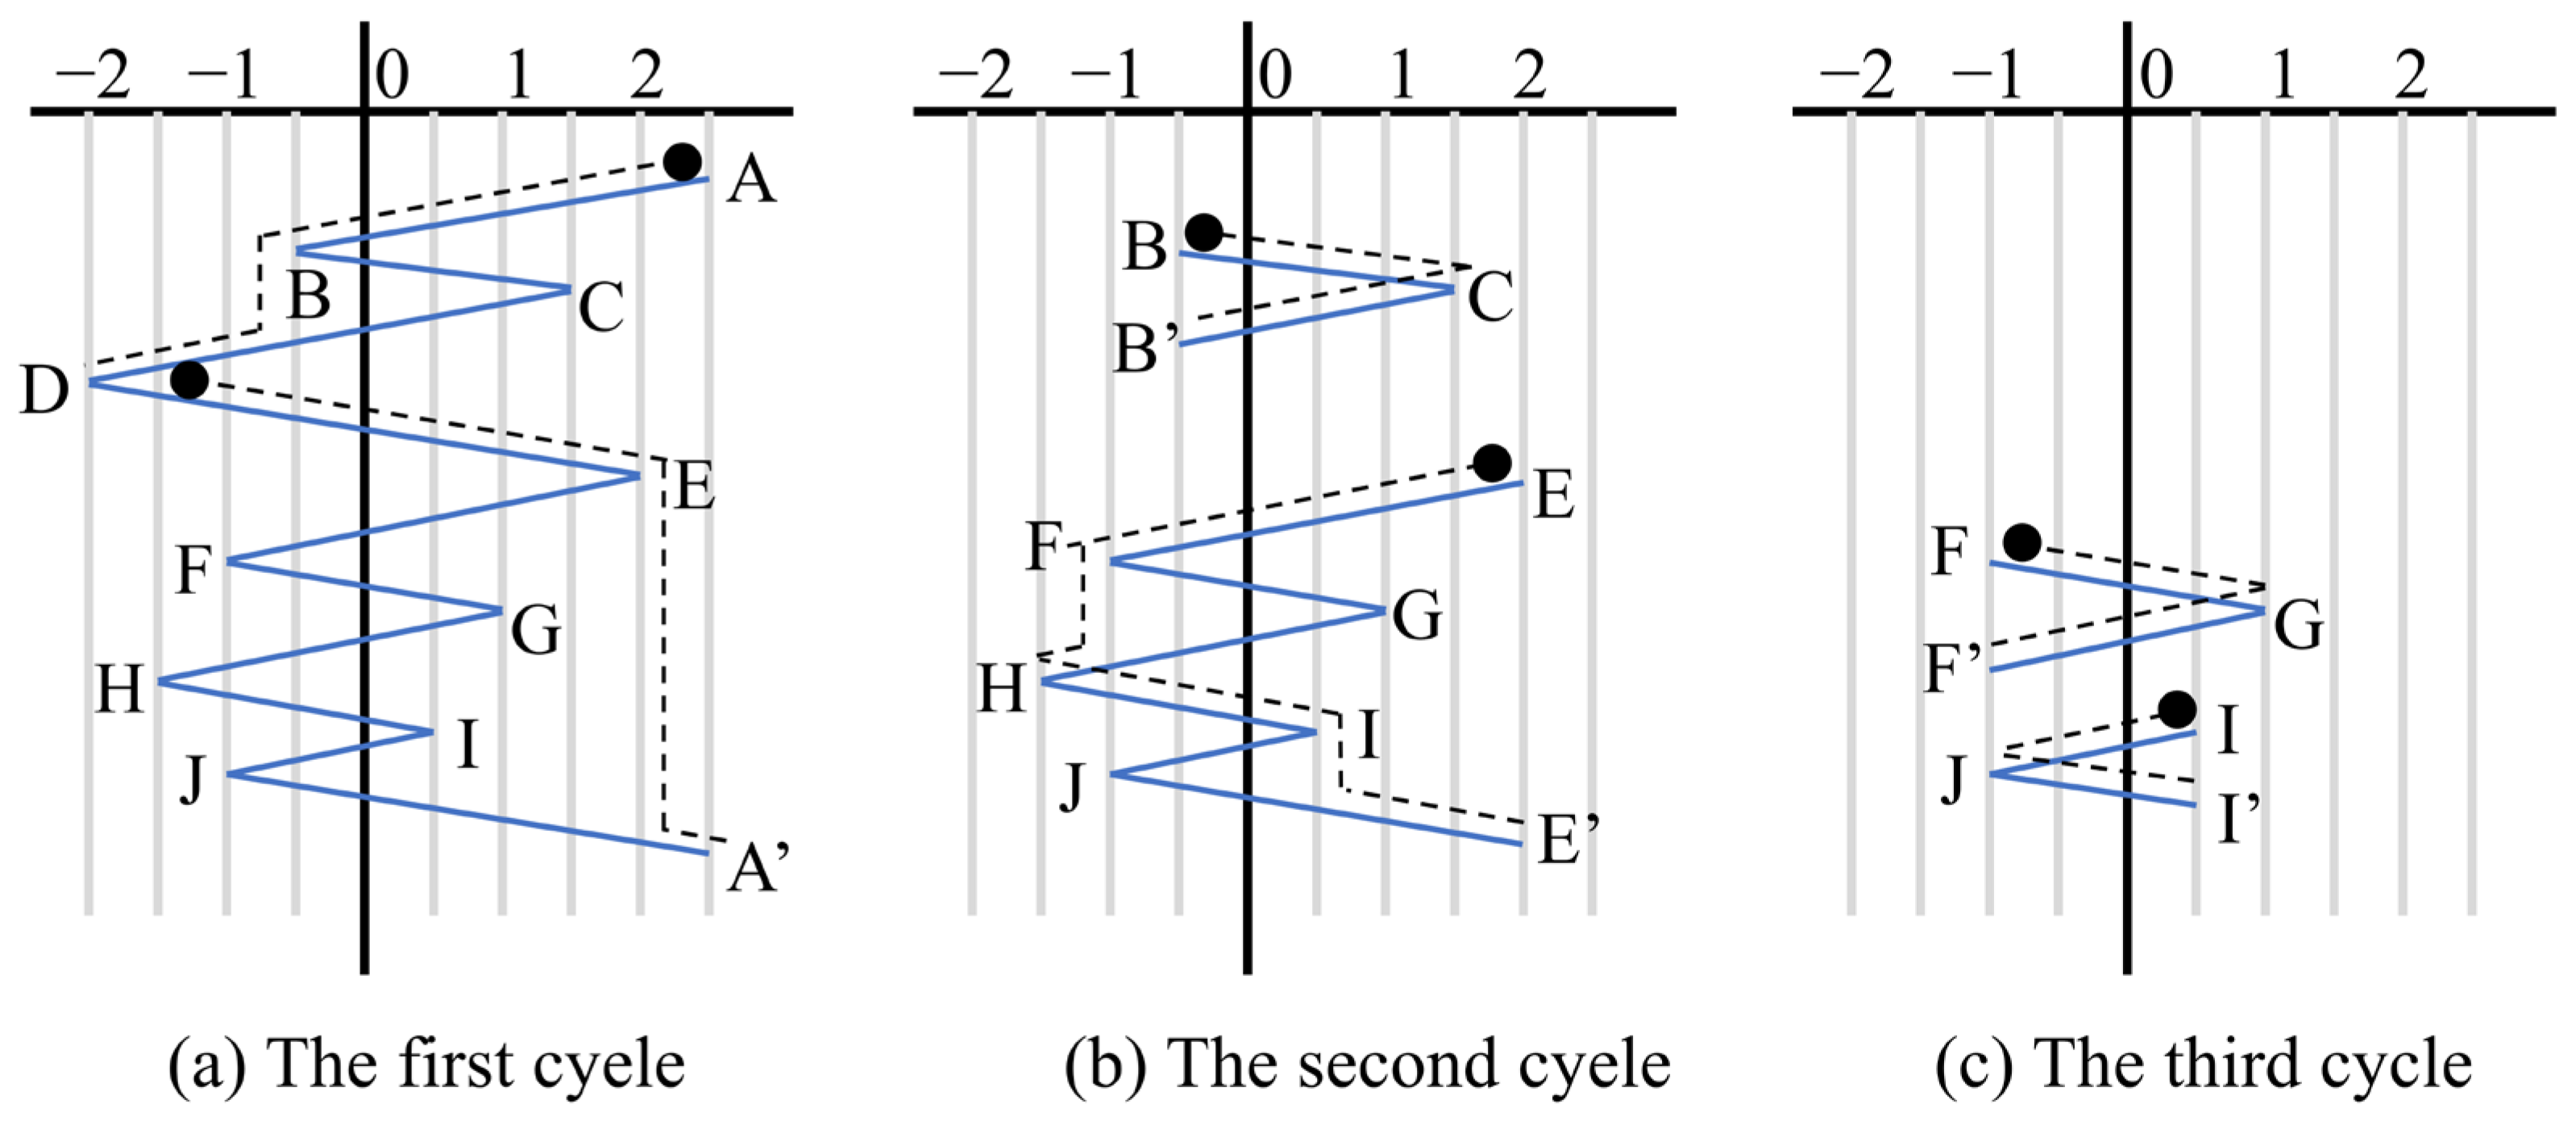
Taking the following figure as an example, calculate the rainfall flow rate of the load time history in
Figure 1 according to the rules: In (a), the extreme point A matches A’, forming a loop pair. Starting from point A, slide downwards first, pass through point B, continue to descend, and reach the extreme point D along CD, completing half of the loop. Then, starting from point D, returning along DE, falling from point E, and continuing along JA’ to reach A’, the first loop ABDEGA’ can be obtained. This process can be likened to dropping raindrops at point A, where the raindrops slide along a path, converge at point D, and then slide back to point A’ along another path. Remove the path traversed by the loop, perform the next round of extreme point matching, and form a new loop [
27].
Similarly, the second cycle BCB’, EFE’, and GHJG’, as well as the third cycle HIH’, can be obtained. At this point, there are no remaining curves and the counting is complete. Finally, list the load cycles and load parameters obtained from rain flow counting.
2.3. Mean Stress Correction
Mean stress correction is a key concept in fatigue analysis, used to evaluate the fatigue performance of materials under cyclic loading. Its main function is to correct the fatigue limit and life prediction of materials by considering the influence of average stress on fatigue strength.
In fatigue analysis, materials are typically subjected to alternating stresses, including alternating stress () and average stress (). Alternating stress represents the variation of the load, while average stress represents the overall level of the load. Normal average stress can lead to the tensile state of materials, usually reducing their fatigue strength. Negative average stress can cause the material to be in a compressed state, usually improving fatigue strength.
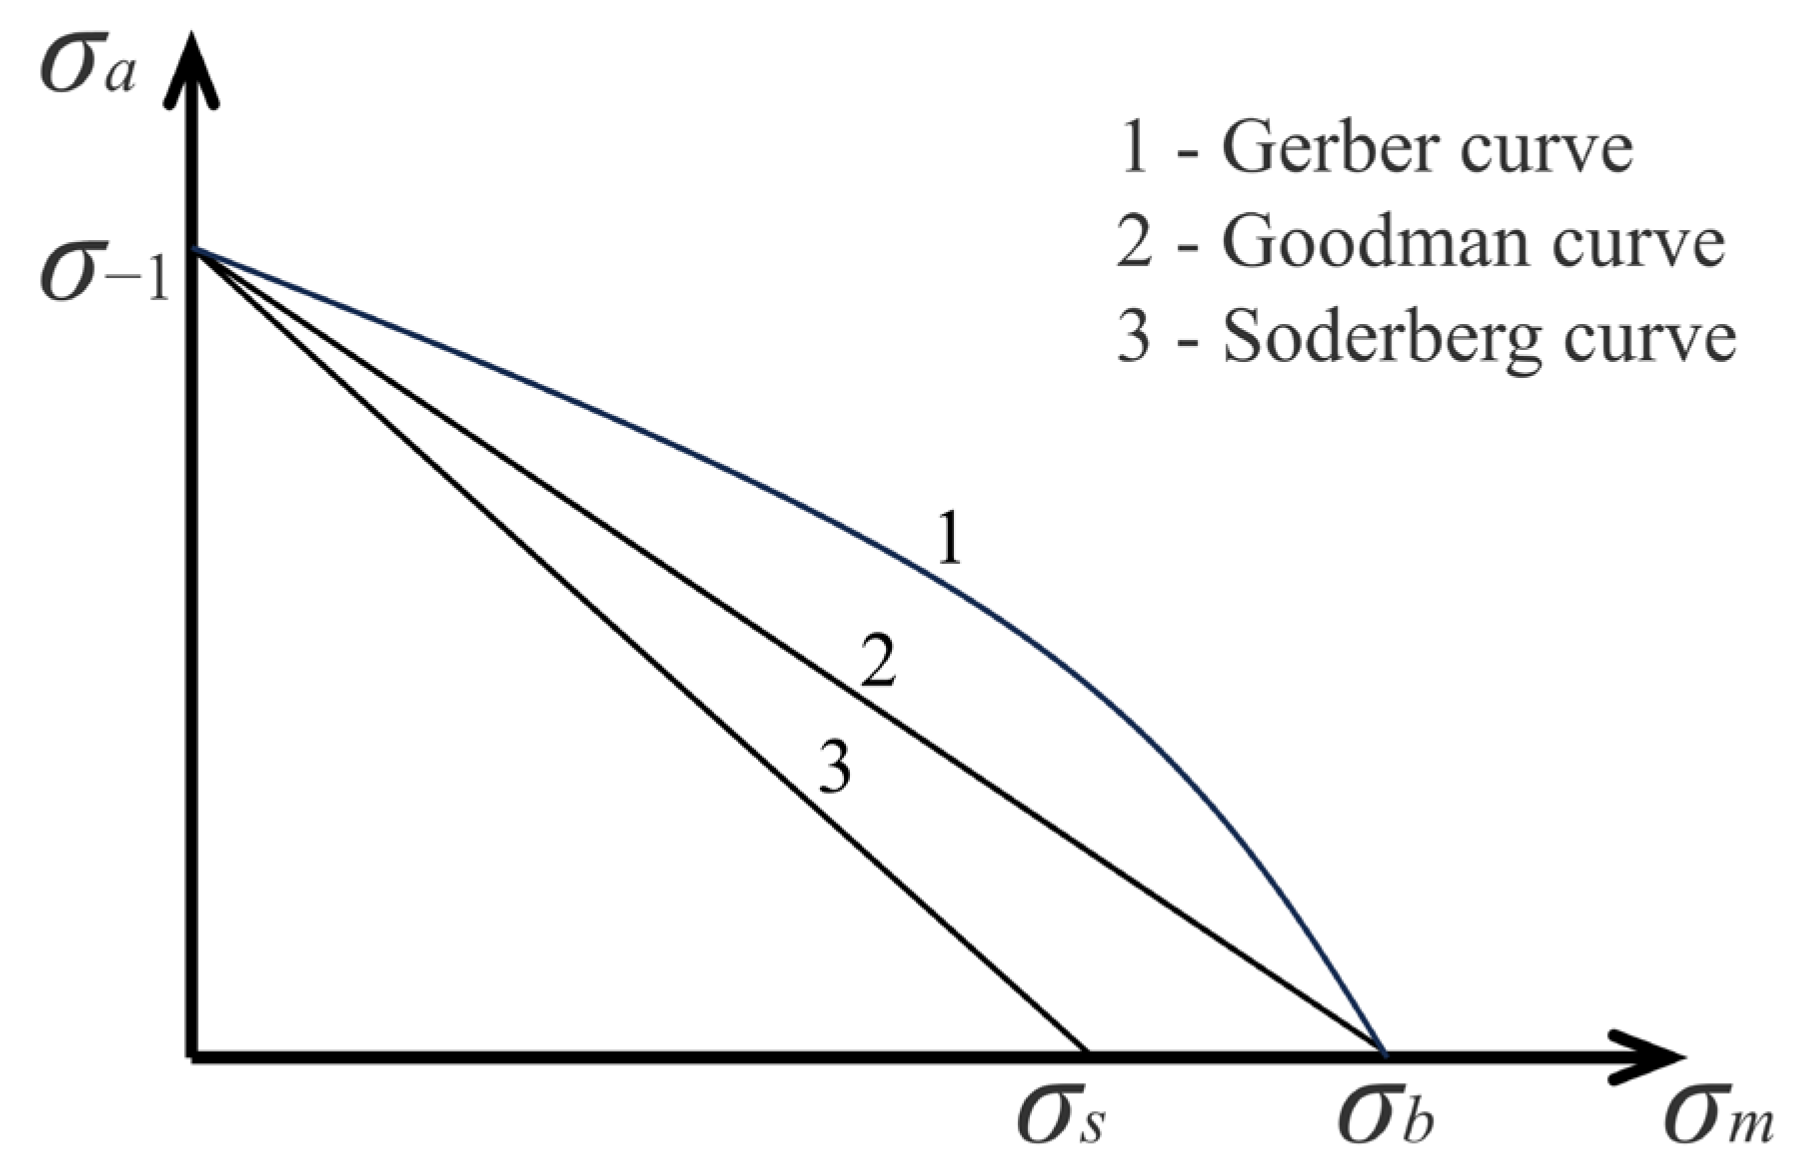
The commonly used correction formulas include the Goodman model, Soderberg model, and Gerber model [
28], as shown in
Figure 2.
In
Figure 2, 1 is the Gerber curve, which is expressed as follows:
2 is the Goodman curve, expressed as follows:
3 is the Soderberg curve, expressed as follows:
where,
is the stress amplitude of non-zero average stress,
is the stress amplitude of zero mean stress,
is the average stress,
is the ultimate tensile strength of the steel, and
is the static tensile strength of the material.
The Goodman model has the advantages of simplicity, a solid theoretical foundation, and strong applicability. And the Goodman curve is often used in applications to consider the influence of average stress on fatigue life. Therefore, the Goodman curve is used in the subsequent fatigue calculations.
2.4. Linear Cumulative Damage Criterion
In 1945, Miner proposed the famous Palmgren–Miner linear cumulative damage criterion in the form of a formula based on the fatigue damage linear cumulative assumption [
29]. Since its proposal, the linear cumulative damage criterion has been widely used in fatigue analysis due to its simple and effective characteristics. This criterion is based on a key assumption that damage under different stress levels can accumulate linearly. Specifically, it is supposed that the cumulative damage of a material under multiple stress states can be summed up by the damage contributions of each state, thereby predicting the overall fatigue life of the material.
According to Miner’s rule, the calculation formula for overall damage
D is
where,
represents the number of cycles experienced at the
i-th stress level,
represents the fatigue life of the material at that stress level (i.e., the maximum number of cycles the material can withstand at that stress level), and
i represents the total number of stress amplitudes corresponding to all operating conditions involved in calculating fatigue damage.
When the cumulative damage D reaches 1, it indicates that the fatigue life of the material has been exhausted and damage may occur at any time.
3. Establishment of Analysis Models
Generally speaking, the axial stress and shear stress of a structure are important factors affecting fatigue damage. As the wind turbine is subjected to wind loads, wave loads, and other dynamic loads during operation, each cross-section of the wind turbine tower will undergo periodic stress changes.
The axial stress borne by offshore wind turbines is mainly caused by the wind force and the gravity of the wind turbine, while the shear stress borne is closely related to the interaction between soil and piles. The fatigue damage assessment of offshore wind turbines under combined wind and wave loads shows that wind load is the main cause of structural fatigue damage in offshore wind turbines [
30]. Therefore, this section only considers the effect of axial stress on fatigue and ignores the effect of shear stress. The focus is on establishing wind turbine models and wind load models to calculate fatigue damage.
3.1. Establishment of Numerical Model for Offshore Single-Pile Wind Turbine
The wind farm studied in this paper is located near the Shandong Peninsula. The wind turbine has a single-unit capacity of 5 MW. The impeller diameter of the wind turbine is 126 m, the hub height is 90 m, the cutting-in wind speed is 3 m/s, and the cutting-out wind speed is 25 m/s. The foundation of the wind turbine is steel pipe piles, the diameter of the single-pile foundation is 6–7 m, and the outer diameter of the tower base is 6m, with a wall thickness of 80 mm and a platform height of 11 m. The schematic diagram of the fan and the establishment of the coordinate system are shown in
Figure 3, and its main parameters are shown in
Table 1.
The tower structure is divided into multiple parts, and the joints of each part are used as nodes, and the parameters of each node are calculated to establish a numerical model. The detailed parameters are shown in
Table 2 below.
3.2. Wind Load Model Establishment
3.2.1. Statistical Analysis of Annual Wind Loads
The wind speed data are obtained from ocean stations located near wind farms to conduct the statistical analysis. The measured wind speed of the ocean station anemometer is the average speed, at one-hour intervals. The wind load calculation standards in China generally use a standard time interval of 10 min, and the conversion ratio of a 1 h interval to a 10 min interval is 0.94 [
31], that is
where,
refers to the average wind speed at a time interval of 10 min at sea level
z, and
refers to the average wind speed at a time interval of 1 h at sea level
z.
According to the measured wind speed data, the average wind speed in this sea area in recent years is 6.94 m/s. The average wind speed for each year is shown in
Table 3, and the long-term average wind speed data are relatively stable.
In engineering, logarithmic and exponential formulas are used to describe the vertical distribution of wind speed within the friction layer [
32].
The logarithmic formula is shown as follows:
where,
refers to the wind speed at height
z,
refers to the wind speed at a standard height of 10 m;
refers to the roughness of the ground.
The exponential formula is shown as follows:
where,
m mainly depends on the surface roughness and the height
z value from the ground surface.
The logarithmic formula is applicable to working conditions below a height of 100 m near the surface, while the exponential formula is applicable to working conditions above a height of 100 m. For this wind turbine model with a 78 m tower height, the logarithmic formula is applicable. The recommended value for the roughness of China’s offshore ground is 0.003 m.
3.2.2. Wind Rose Diagram
A wind rose diagram is a visualization tool for displaying wind direction and speed data. It is usually presented in the form of a circle, dividing the circumference into different sections. Each section represents a specific range of wind direction, and the size of the section represents the wind speed within a range. The core of a wind rose diagram is its shape and color, which allows for a visual understanding of wind direction and speed distribution. By conducting statistical analysis on the measured data for the whole year of 2023, a wind rose chart can be obtained for the target wind farm, as shown in
Figure 4.
According to
Figure 4, the average wind speed range in all directions within a year is 4.8 m/s to 8 m/s, with the highest average wind speeds in the northwest, north, southeast, and south directions, ranging from 7 m/s to 8 m/s.
The average wind speed is usually positively correlated with pulsating wind. In the case of high wind speed, the wind field is usually more unstable, and the amplitude of pulsating wind will also increase accordingly. The existence of pulsating wind will increase the fatigue load of the wind turbine. Therefore, due to the higher average wind speeds in the northwest, north, southeast, and south directions, the amplitude of the pulsating winds in these directions is high, and the wind turbine tower is subjected to higher fatigue loads and damage in these directions.
3.2.3. Average Wind Speed Distribution
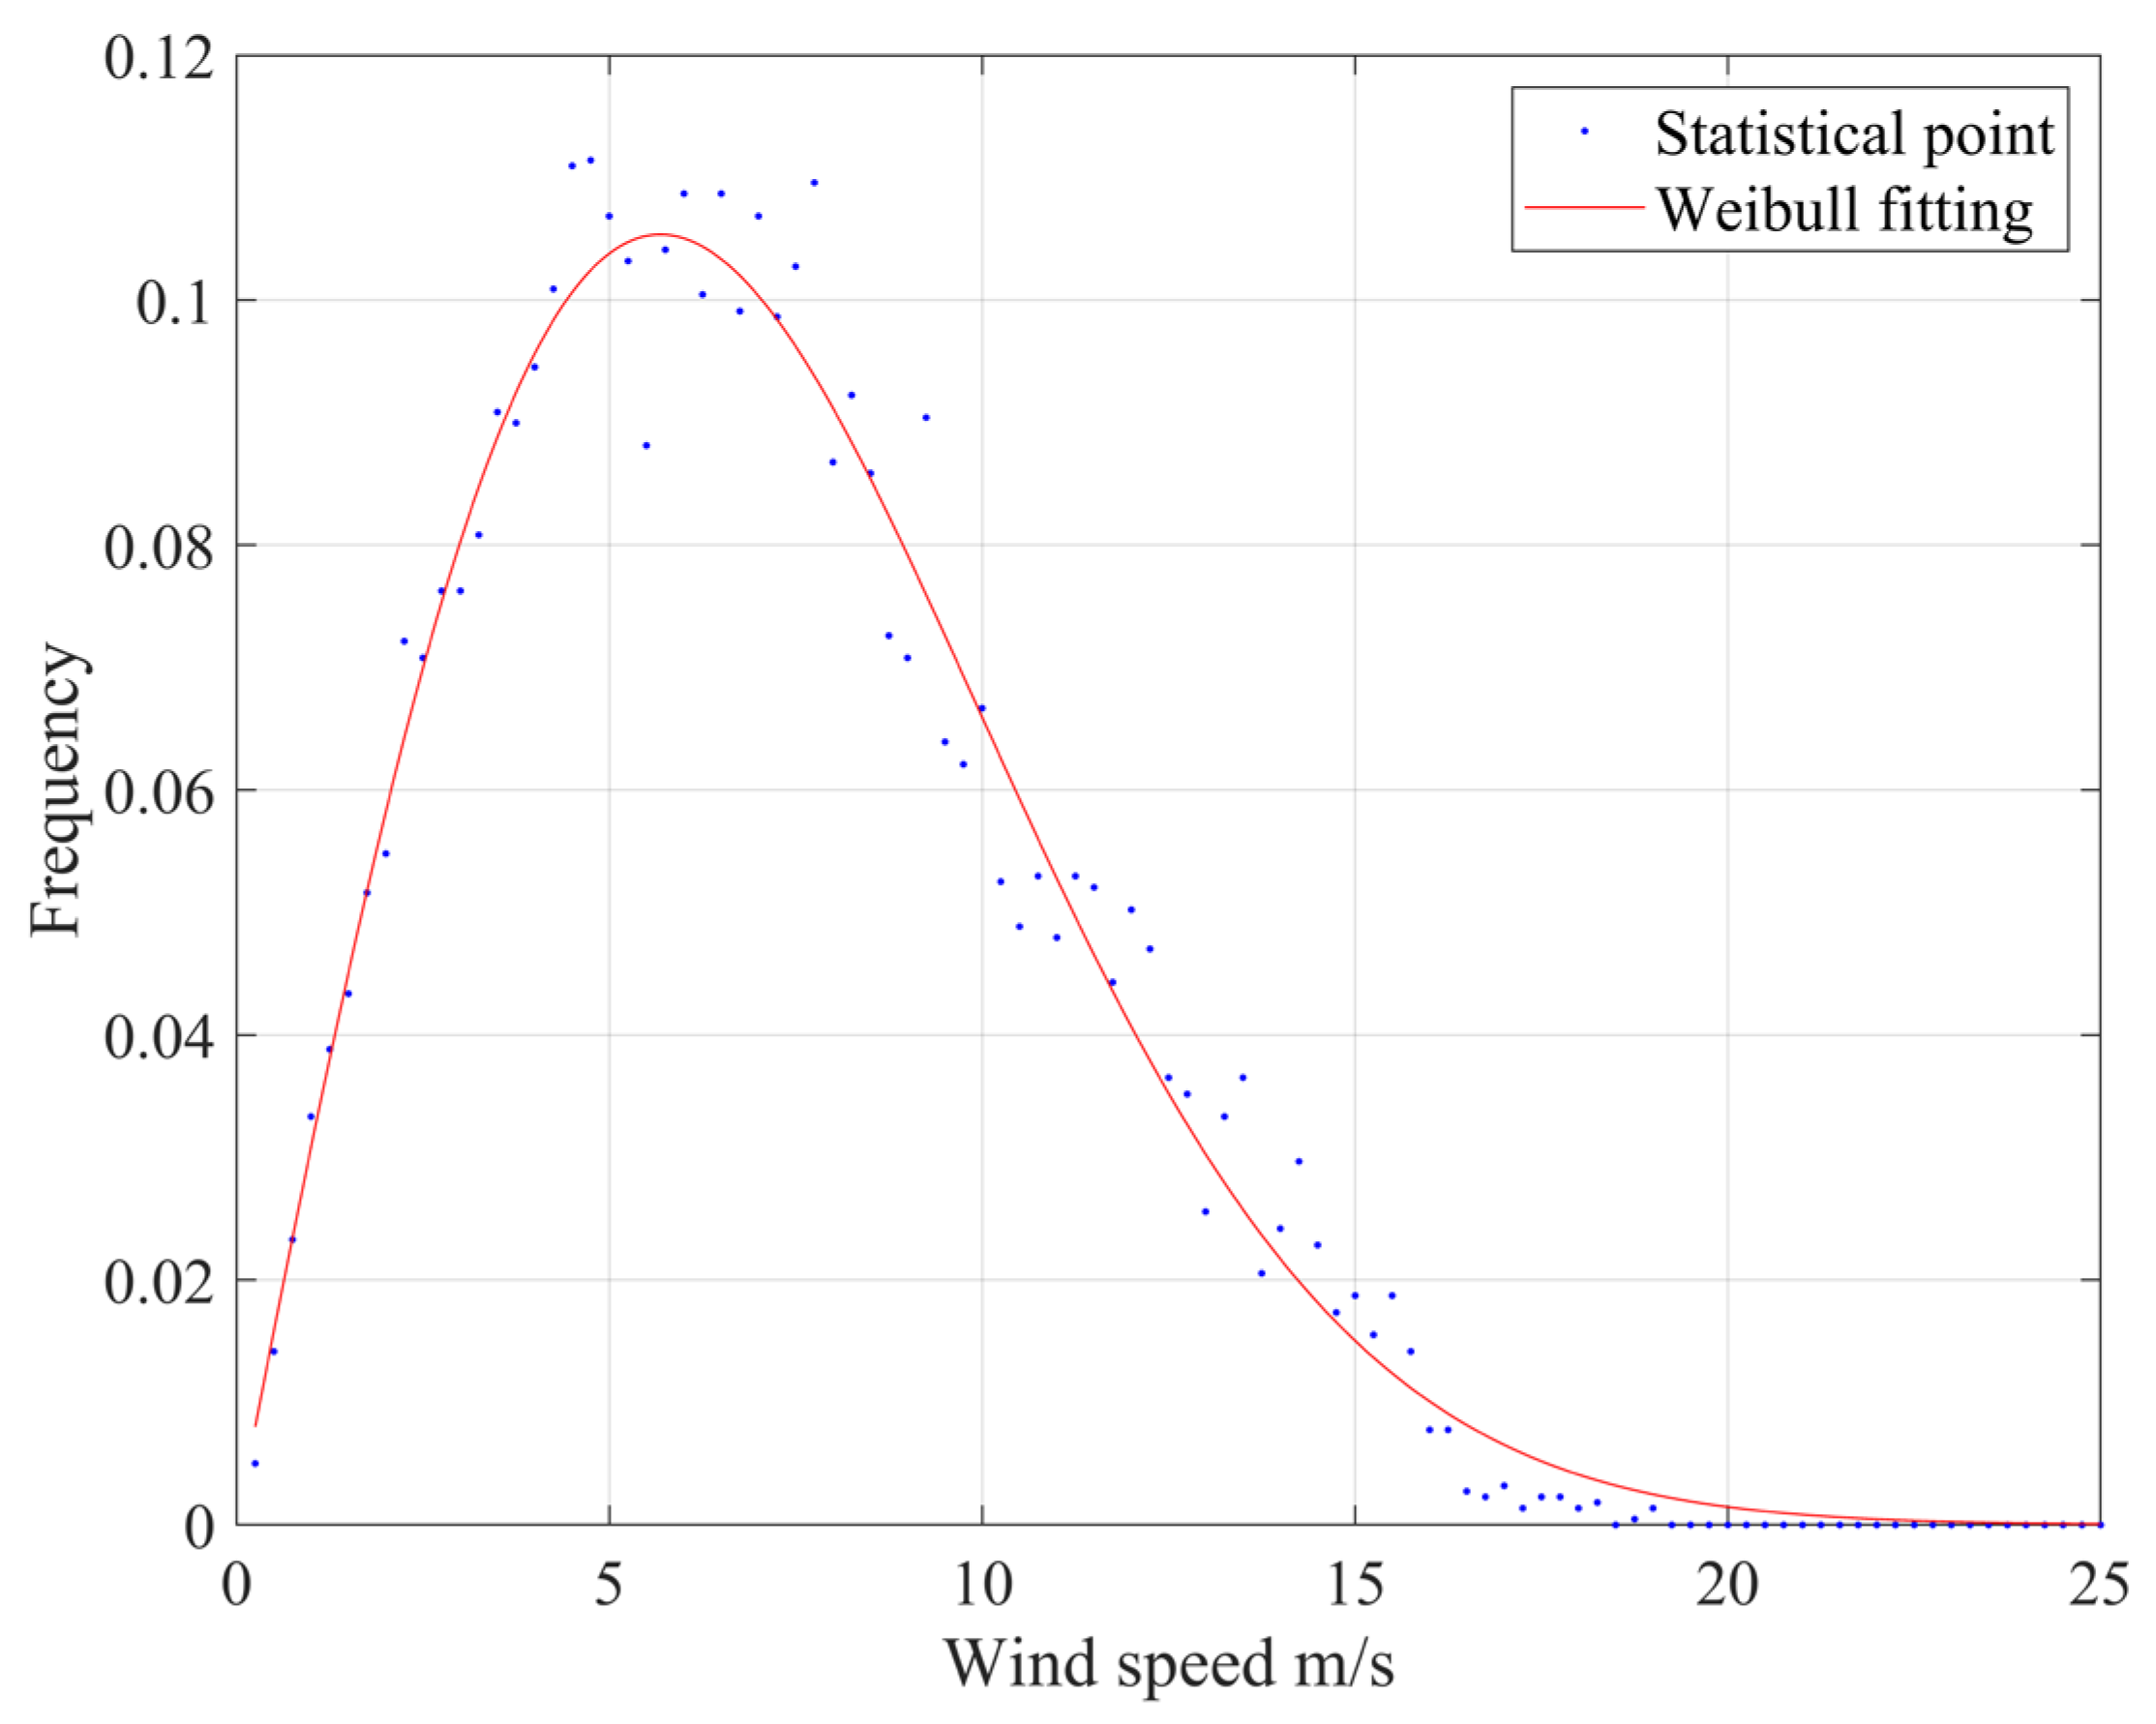
For determining a wind speed statistical interval value, the dispersed continuous wind speeds are transferred into discrete wind speed ranges. When a specific measured wind speed value falls within a certain wind speed range, the frequency of occurrence of that wind speed range is increased by one. Due to some omissions and errors in the measured wind speed, the total count decreased after removing outliers. Therefore, using frequency to describe the distribution of wind speed is more appropriate. The 2023 wind velocity data are taken as an example, as shown in
Figure 5. It can be seen that the wind speed distribution base of each year is relatively stable with a wind speed statistical interval of 0.25 m/s, with the maximum frequency concentrated in the wind speed range of 5 to 8 m/s. There is a frequency mutation at wind speeds of 6 m/s and 9.5 m/s, which may be caused by measurement errors, climate change, or data processing methods. It belongs to a reasonable mutation of wind speed range statistical values. The smaller the interval between wind speed statistics, the fewer the statistical features will be, and the stronger the data fluctuations will be. There is also a possibility that nearby data may fall within the same range, leading to statistical anomalies. The larger the interval between wind speed statistics, the lower the time resolution of the data. It may cover up the details of short-term wind speed changes and affect the accurate evaluation of wind speed fluctuations and wind equipment performance. Taking all factors into consideration, it is more appropriate to use a wind speed statistical interval value of 0.25 m/s for statistical analysis. The statistical curve is smoother and retains a small amount of detail about short-term wind speed changes.
Based on the statistical wind speed distribution map, an appropriate wind speed model needs to be selected. The common distribution models for wind speed include the Weibull distribution, Rayleigh distribution, Gaussian distribution, and mixed distribution model. Among them, the Weibull distribution and Rayleigh distribution are the two most commonly used models, which are, respectively, suitable for describing wind speed frequency distribution and probability density function. The lognormal distribution can describe the volatility and variability of wind speed, while mixed distribution models can more flexibly adapt to wind speed data under different conditions.
The Weibull distribution is as follows:
The Rayleigh distribution can be regarded as a special case of the Weibull distribution. When the shape parameter of the Weibull distribution is 2, the Weibull distribution becomes the Rayleigh distribution. By mathematically simplifying the Weibull distribution function, the following conventional Weibull model can be obtained:
The statistical points of average wind speed frequency and the Weibull fitting curve are shown in
Figure 6. The results show that the Weibull distribution model is well-fitted and in good agreement with the actual observed data, with strong applicability and reliability.
Taking the average of wind speed frequency statistical points, the fitting calculation is performed to obtain the fitting curve parameters, as shown in
Table 4.
Mathematically, R-squared is used to describe the fitting degree of a fitted curve. The R-squared value of the fitted curve can be calculated as 0.983 for each year’s data, indicating a high degree of fitting.
3.2.4. Pulsating Wind Speed
Pulsating wind refers to the irregularity or fluctuation of wind speed in the atmosphere over time. In the field of wind energy, studying pulsating wind is crucial for understanding the performance, fatigue loads, and control strategies of wind turbines.
The characteristics of pulsating wind can be described by the power spectrum of pulsating wind. Pulsating wind power spectrum is a frequency-domain analysis method used to study the energy distribution of wind speed signals at different frequencies. Normally, the pulsating wind power spectrum has higher energy at low frequencies and gradually decays with increasing frequency. Common pulsating wind power spectra include the Davenport spectrum, Kaimal spectrum, Mann spectrum, etc.
Kaimal wind spectrum is a spectral model used to describe the time series of natural wind speeds and is commonly used in wind engineering. Expressed as follows:
where
f is the frequency of pulsating wind,
is the average wind speed at a standard height of 10 m,
is the integral scale parameter [
33],
is the standard deviation, which can be expressed as
, where
TI is the turbulence intensity,
is the power spectrum of pulsating wind speed (m
2/s).
When the average wind speed is 7 m/s and the turbulence intensity
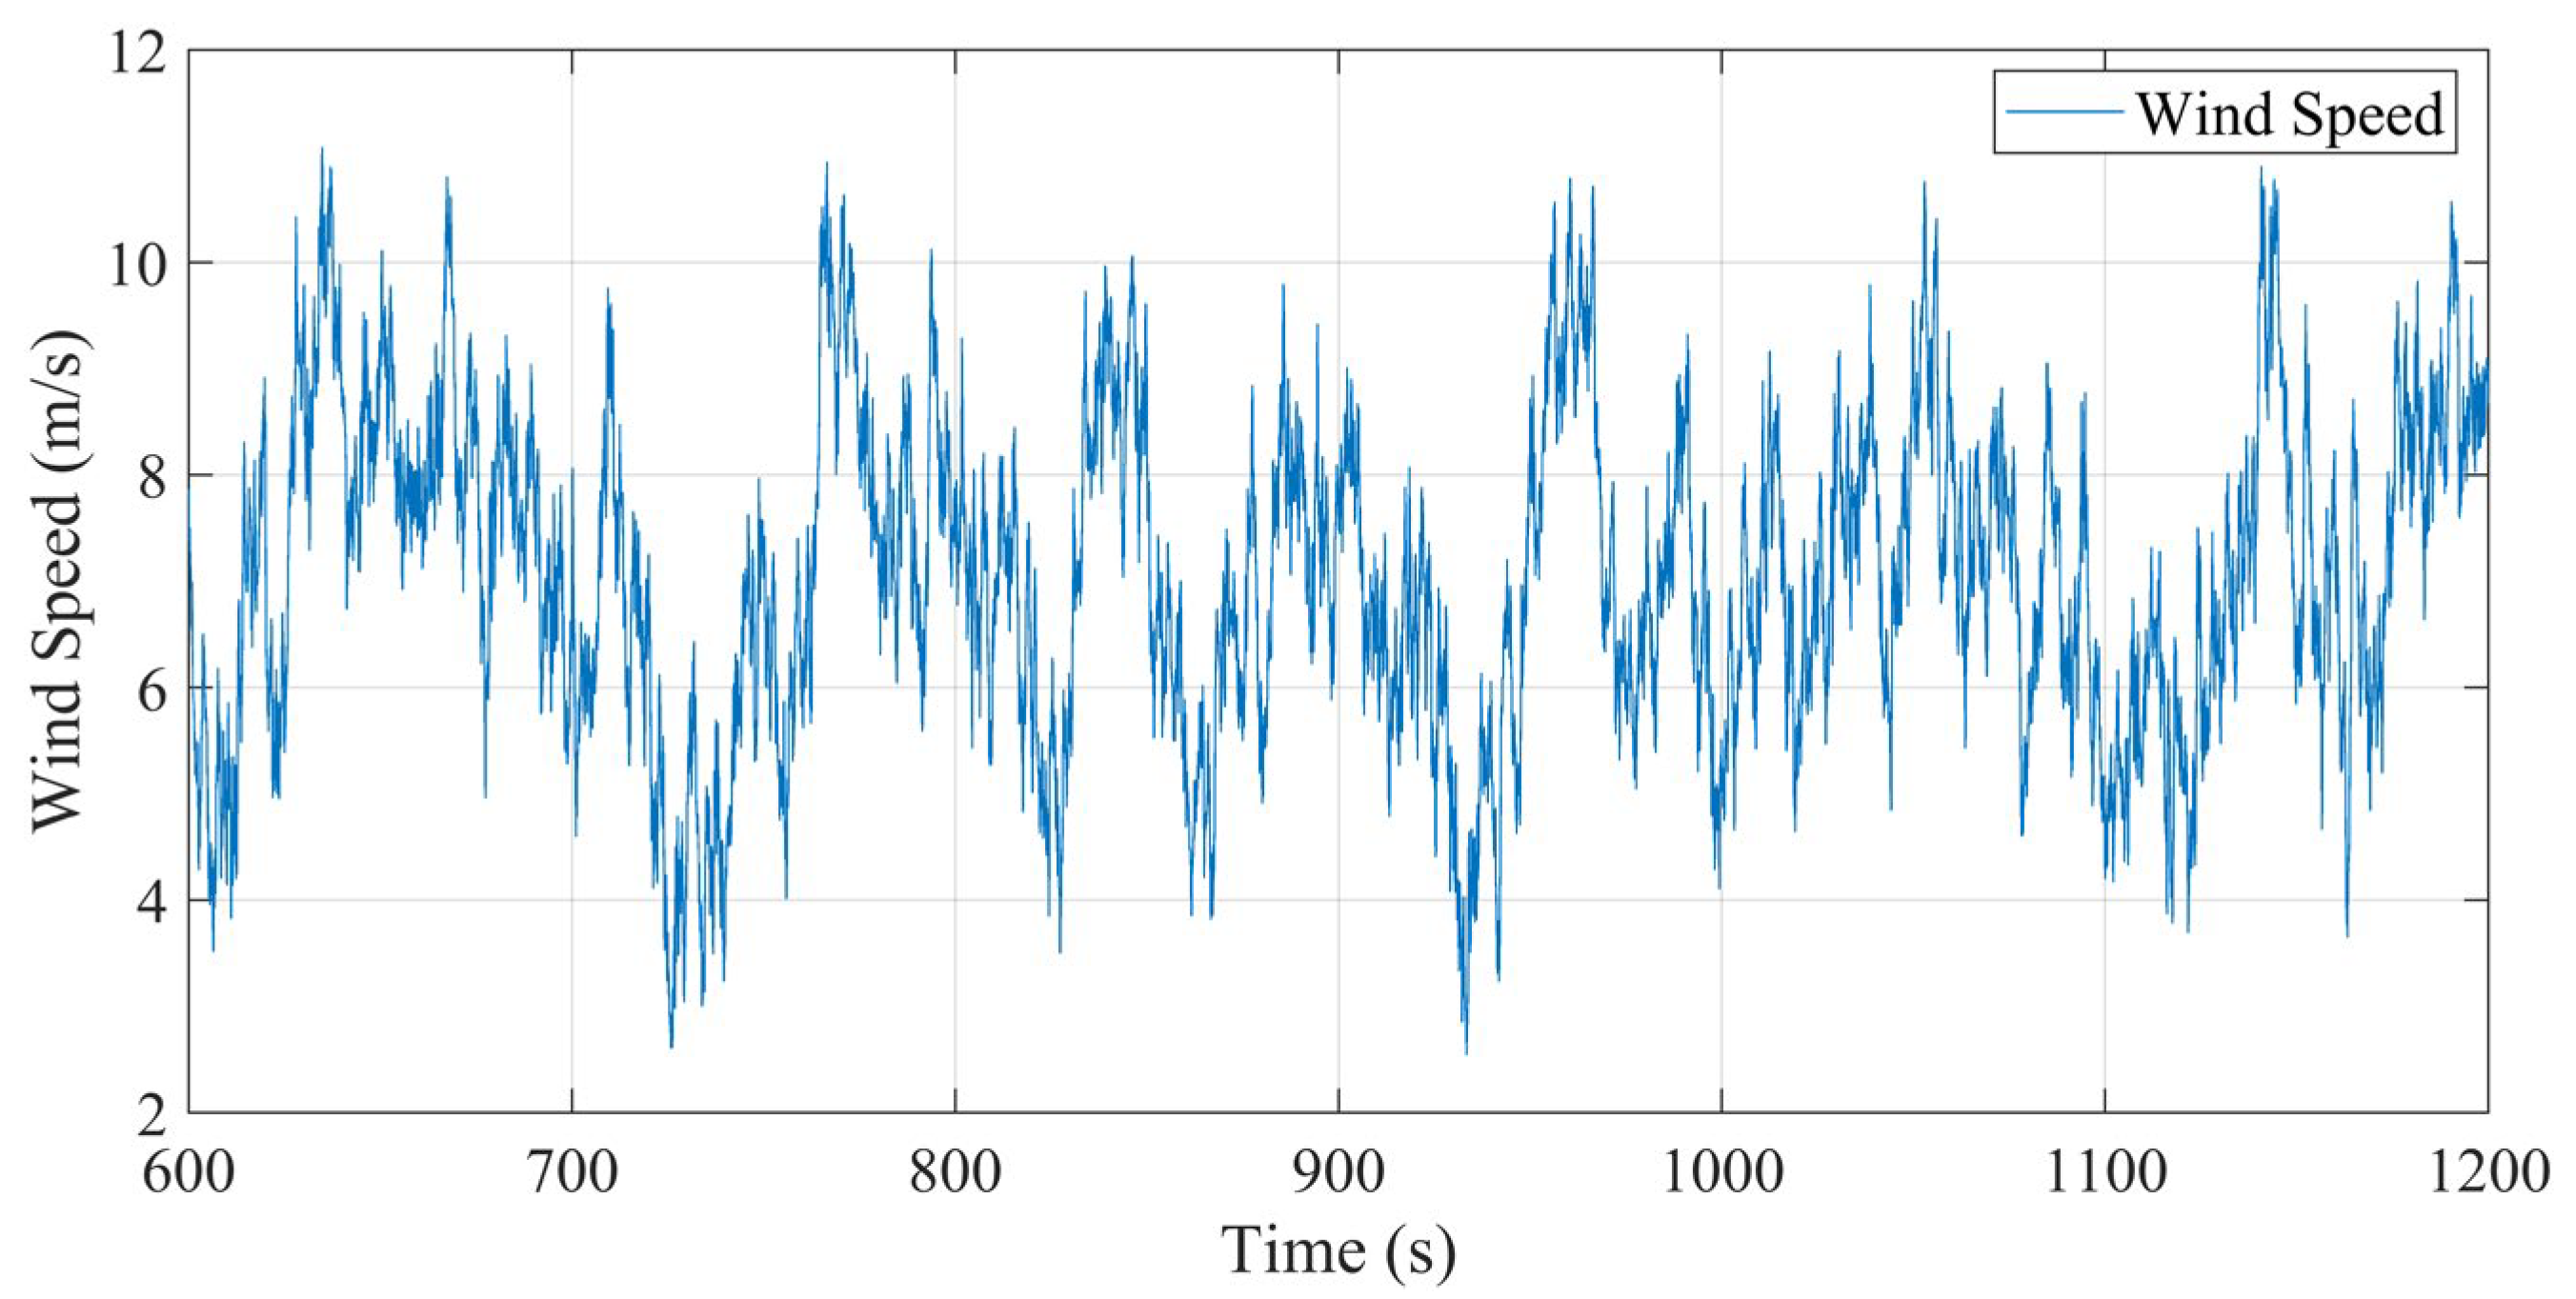
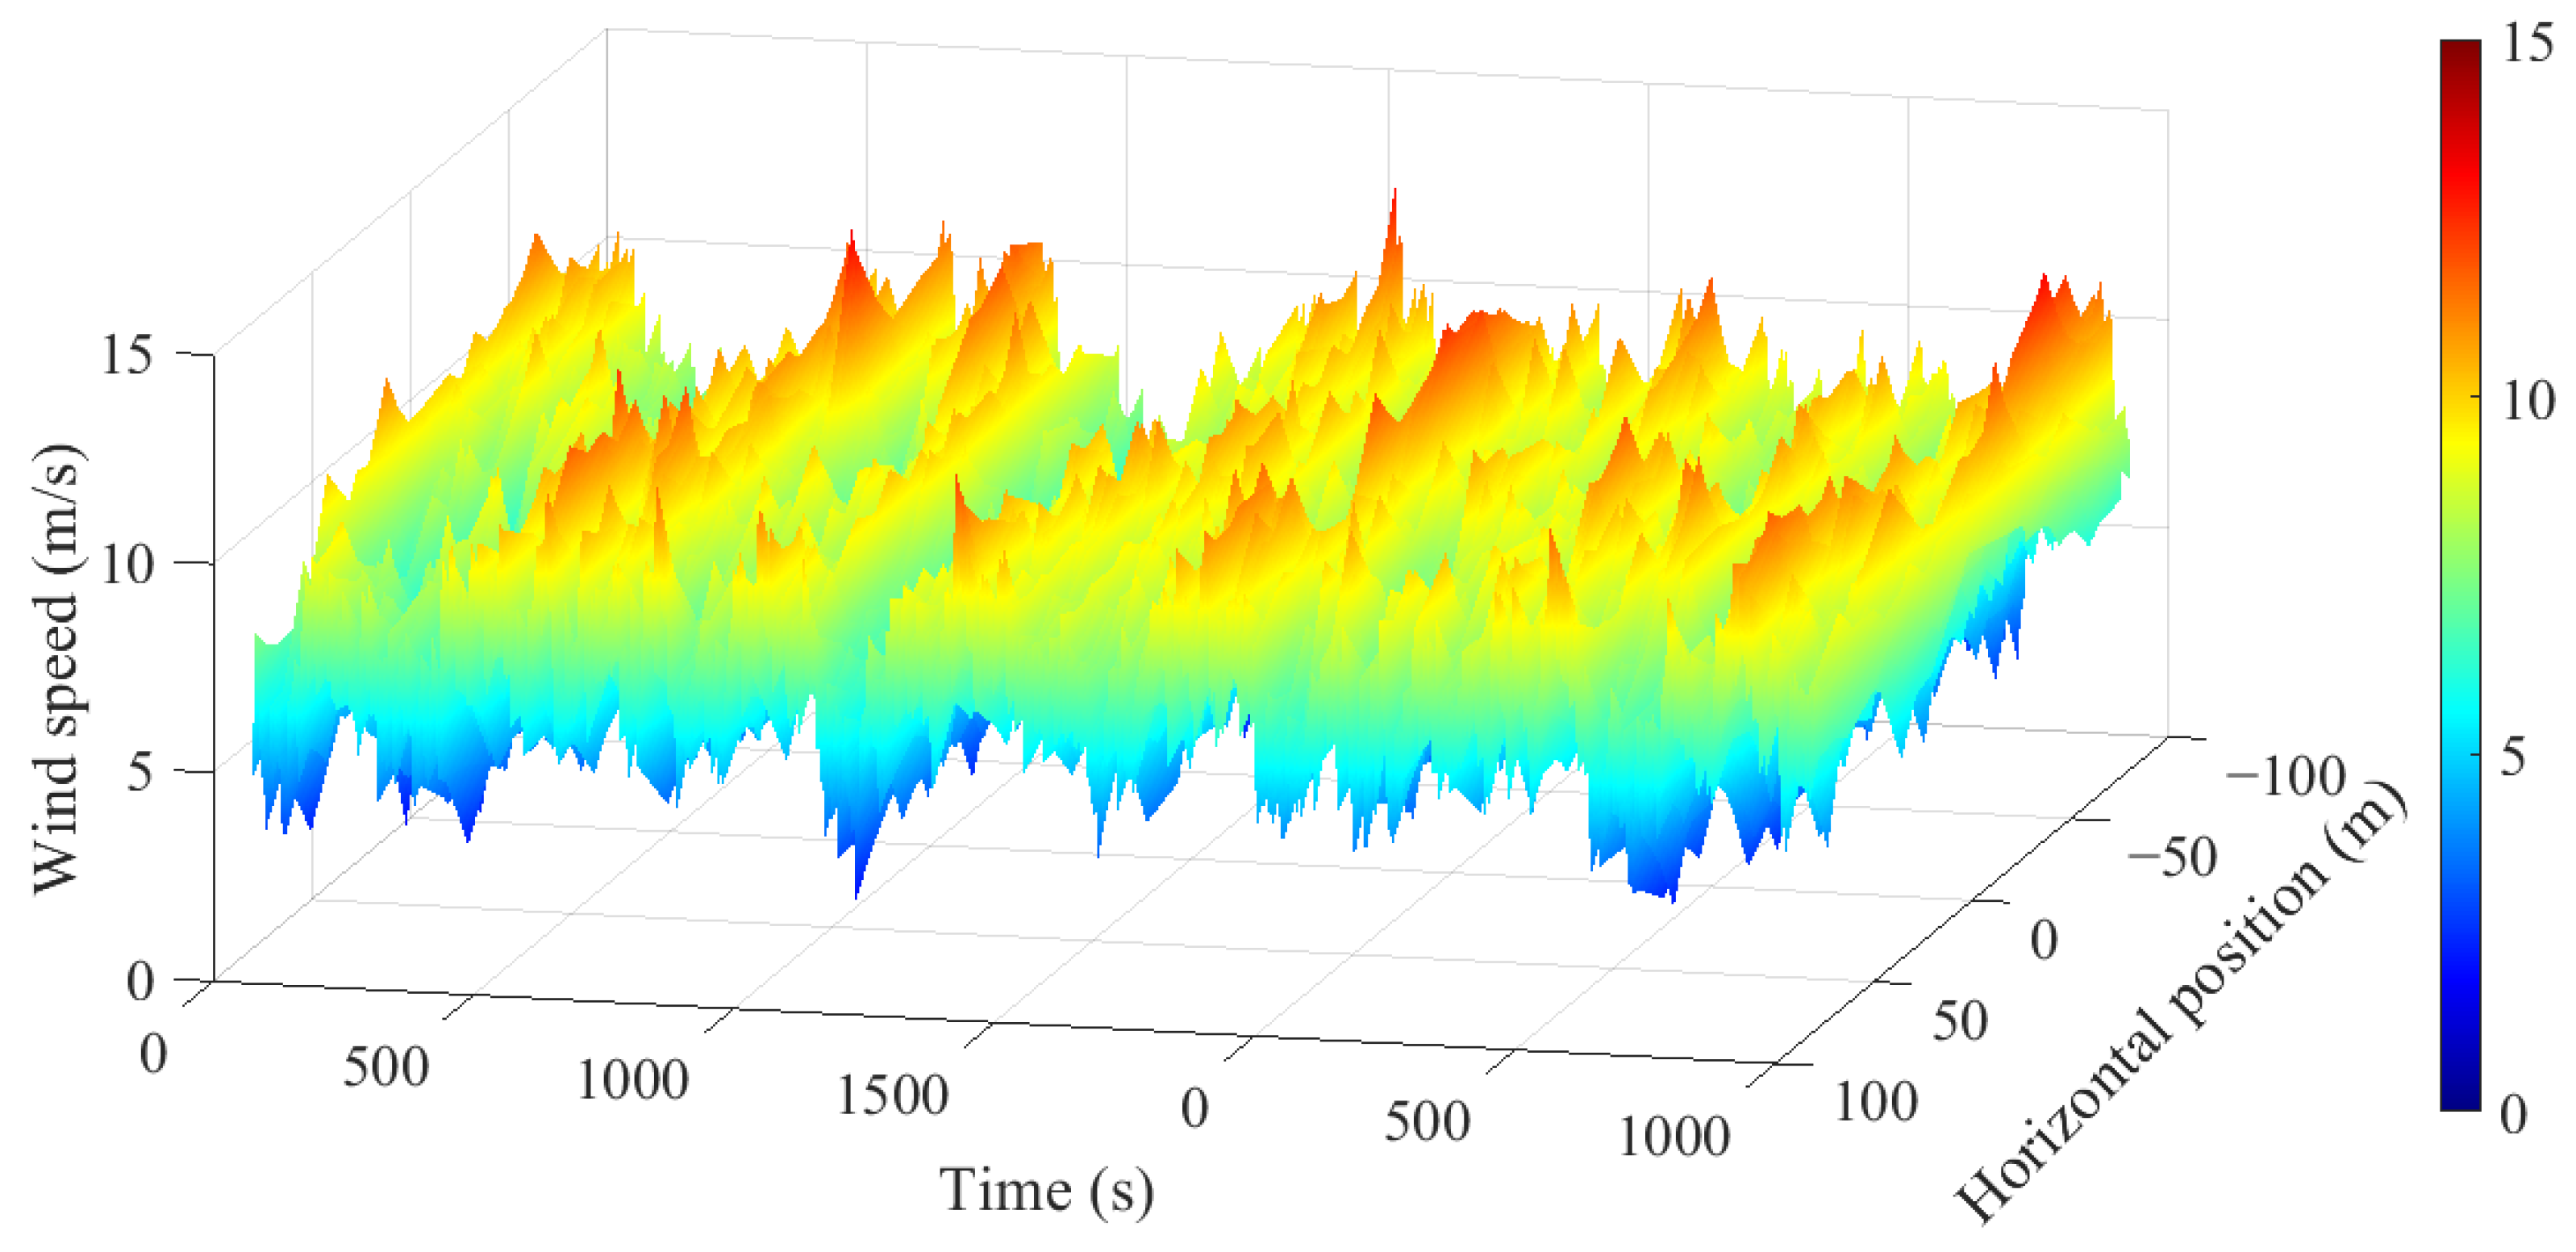
TI is 18%, TurbSim is used to simulate the pulsating wind speed time history curve within a 10 min standard time interval of this wind speed. The selected sampling frequency is 10 Hz, and a total of 1500 s is simulated. The 600th to 1200th s are taken as the effective time. The average wind speed at the wind turbine hub is 7 m/s, and the time history of pulsating wind speed is shown in
Figure 7, as well as in
Figure 8 on the plane of the wind turbine hub.
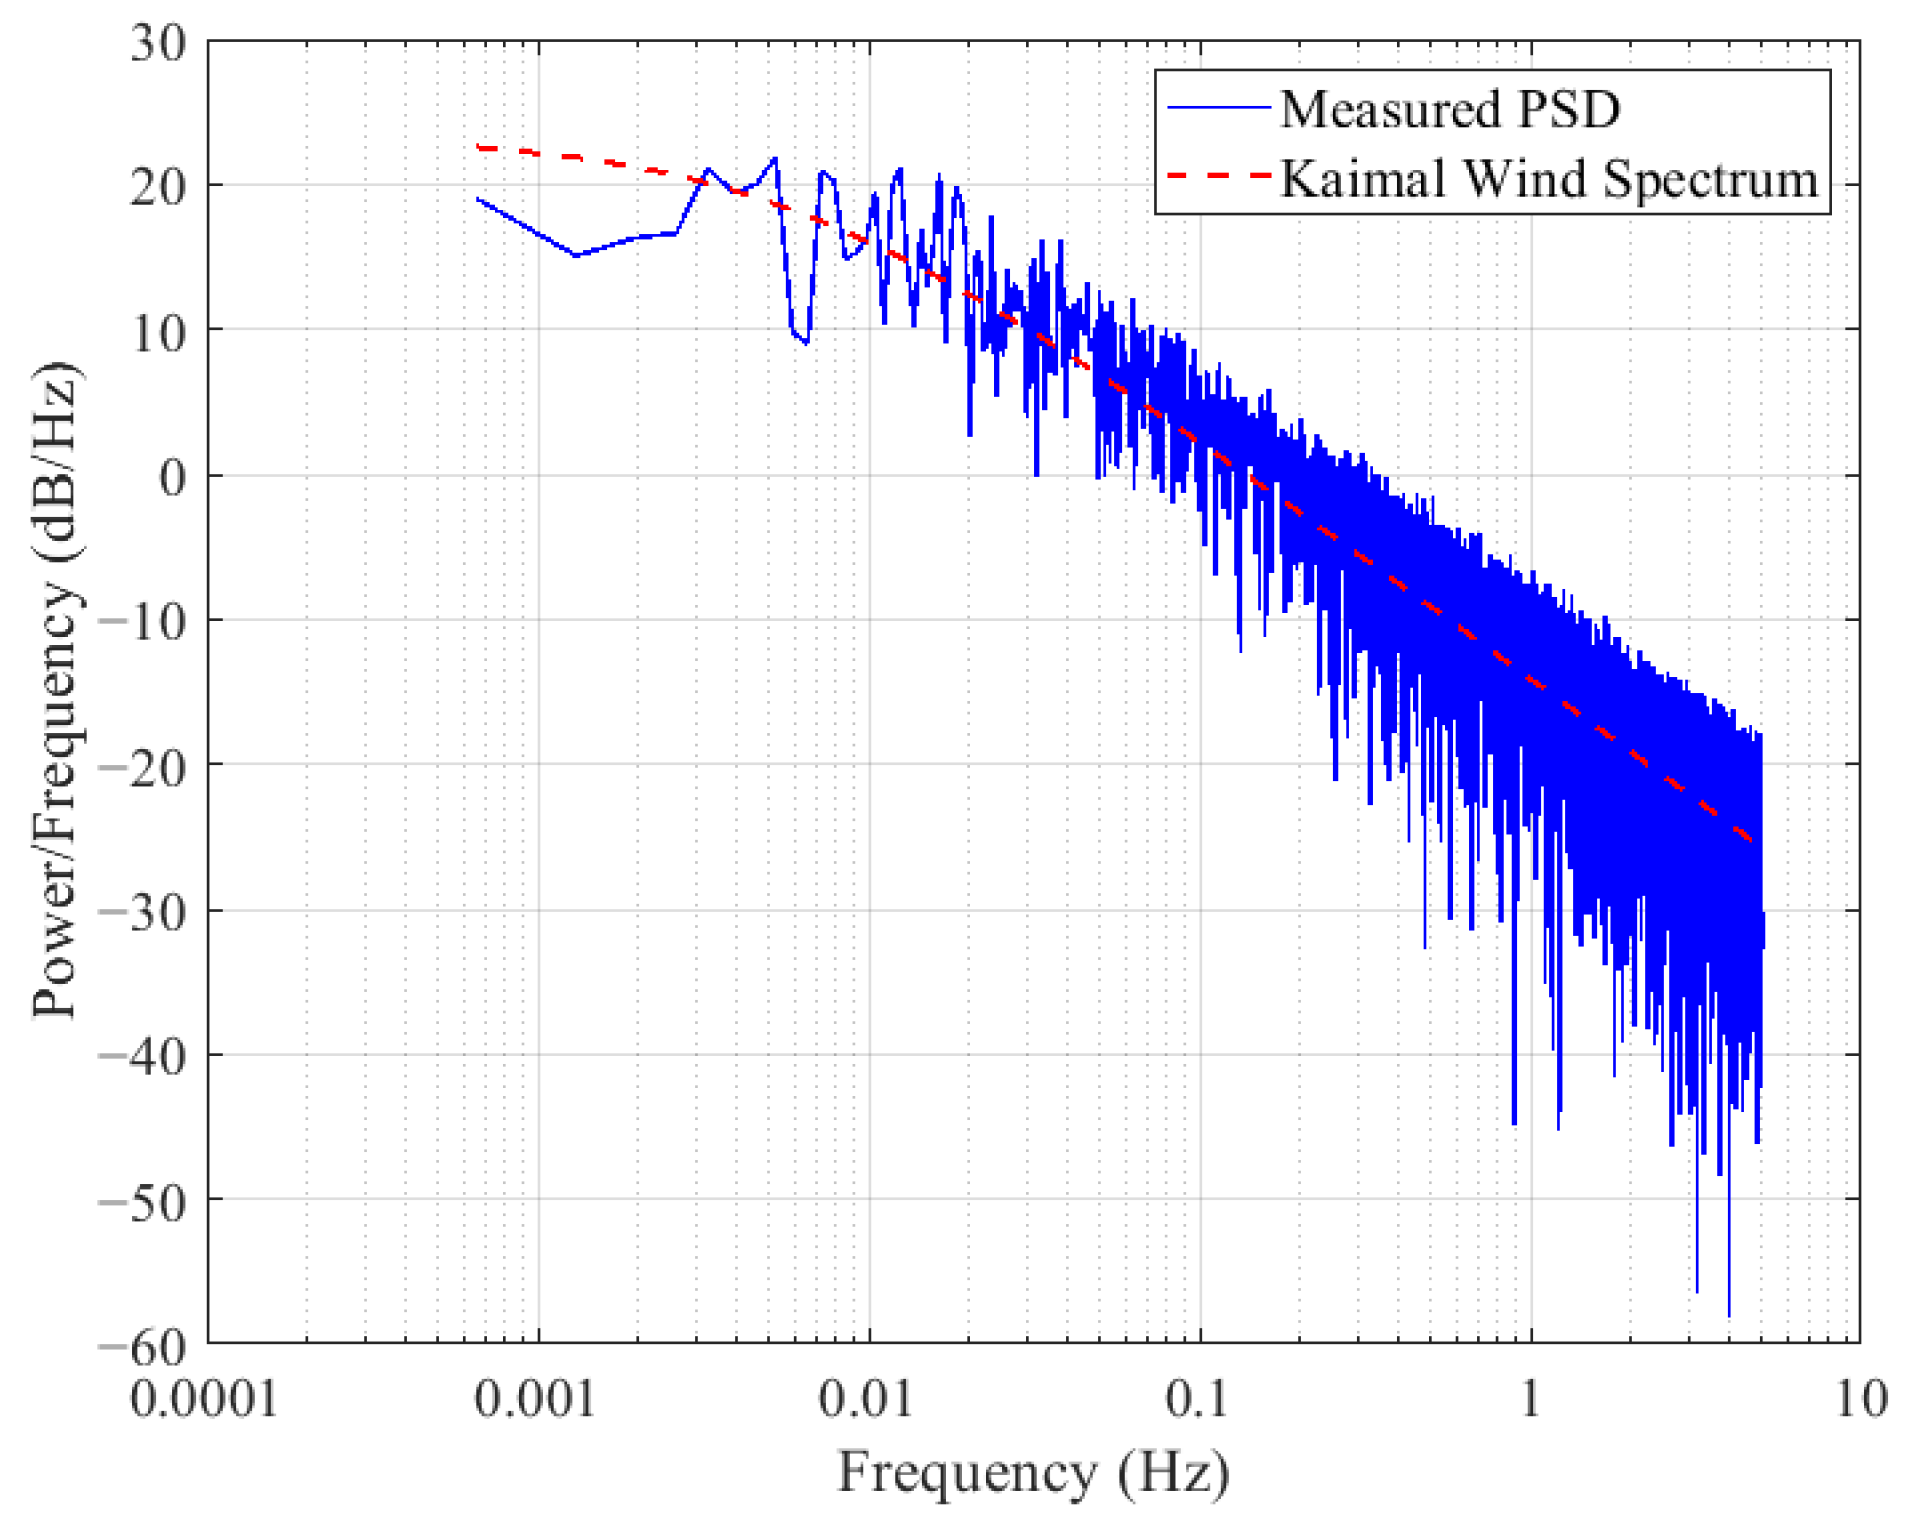
The functional relationship between the target spectrum and the simulated spectrum in the frequency domain is shown in
Figure 9. It can be seen that the consistency between the simulated spectrum and the target spectrum is high, and the simulation results are relatively reliable.
4. Fatigue Calculation and Analysis of Single-Pile Foundation
4.1. Calculation and Analysis of Load at the Root Section of the Tower
According to DNV standards, the fatigue damage is estimated at eight evenly distributed locations around the base cross-section of a single-pile tower. It is necessary to calculate the fatigue damage values of the eight uniformly distributed nodes on the cross-section. Stress calculations at the location of the nodes are based on the leeward side as the reference point, with eight nodes evenly distributed on the circumference at intervals of 90 degrees. The formula for calculating the nominal axial stress at the nodes is [
34]:
where,
is the axial force at the base of the tower, with a vertical upward direction,
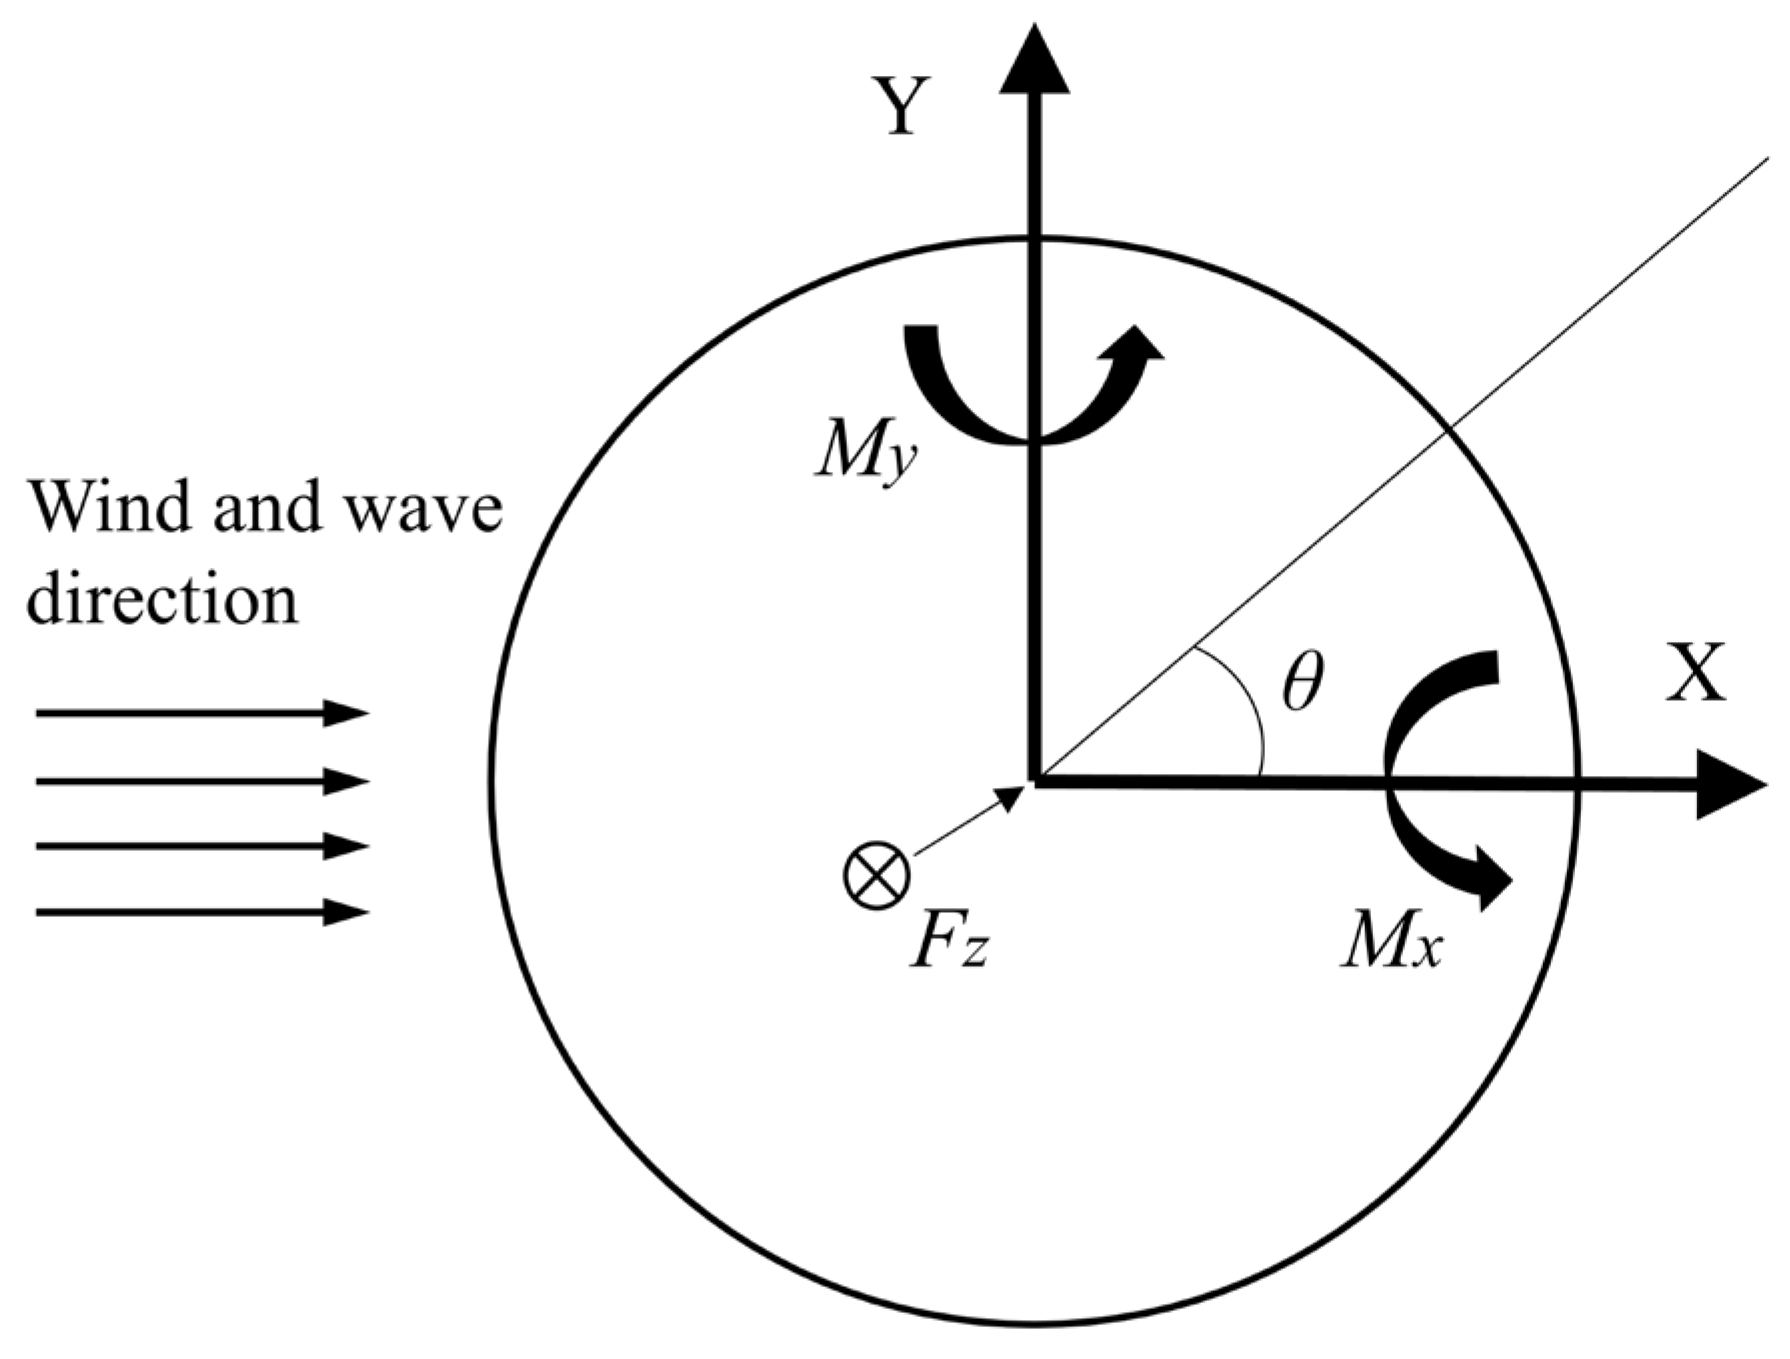
is the bending moment in the oscillation direction, which is the bending moment around the X-axis direction, as shown in
Figure 10,
is the bending moment in the swinging direction, which is the bending moment around the Y-axis direction, as shown in
Figure 10, and
A is the nominal cross-sectional area at the base of the tower, i.e.,
, where
D is the diameter corresponding to the outer wall of the foundation bottom, and
d is the diameter corresponding to the inner wall of the foundation bottom,
and
are the sectional moments of inertia on the X and Y axes, where
,
r is the radius corresponding to the outer wall at the base of the tower, and
θ is the azimuth angle of each point at the base of the tower.
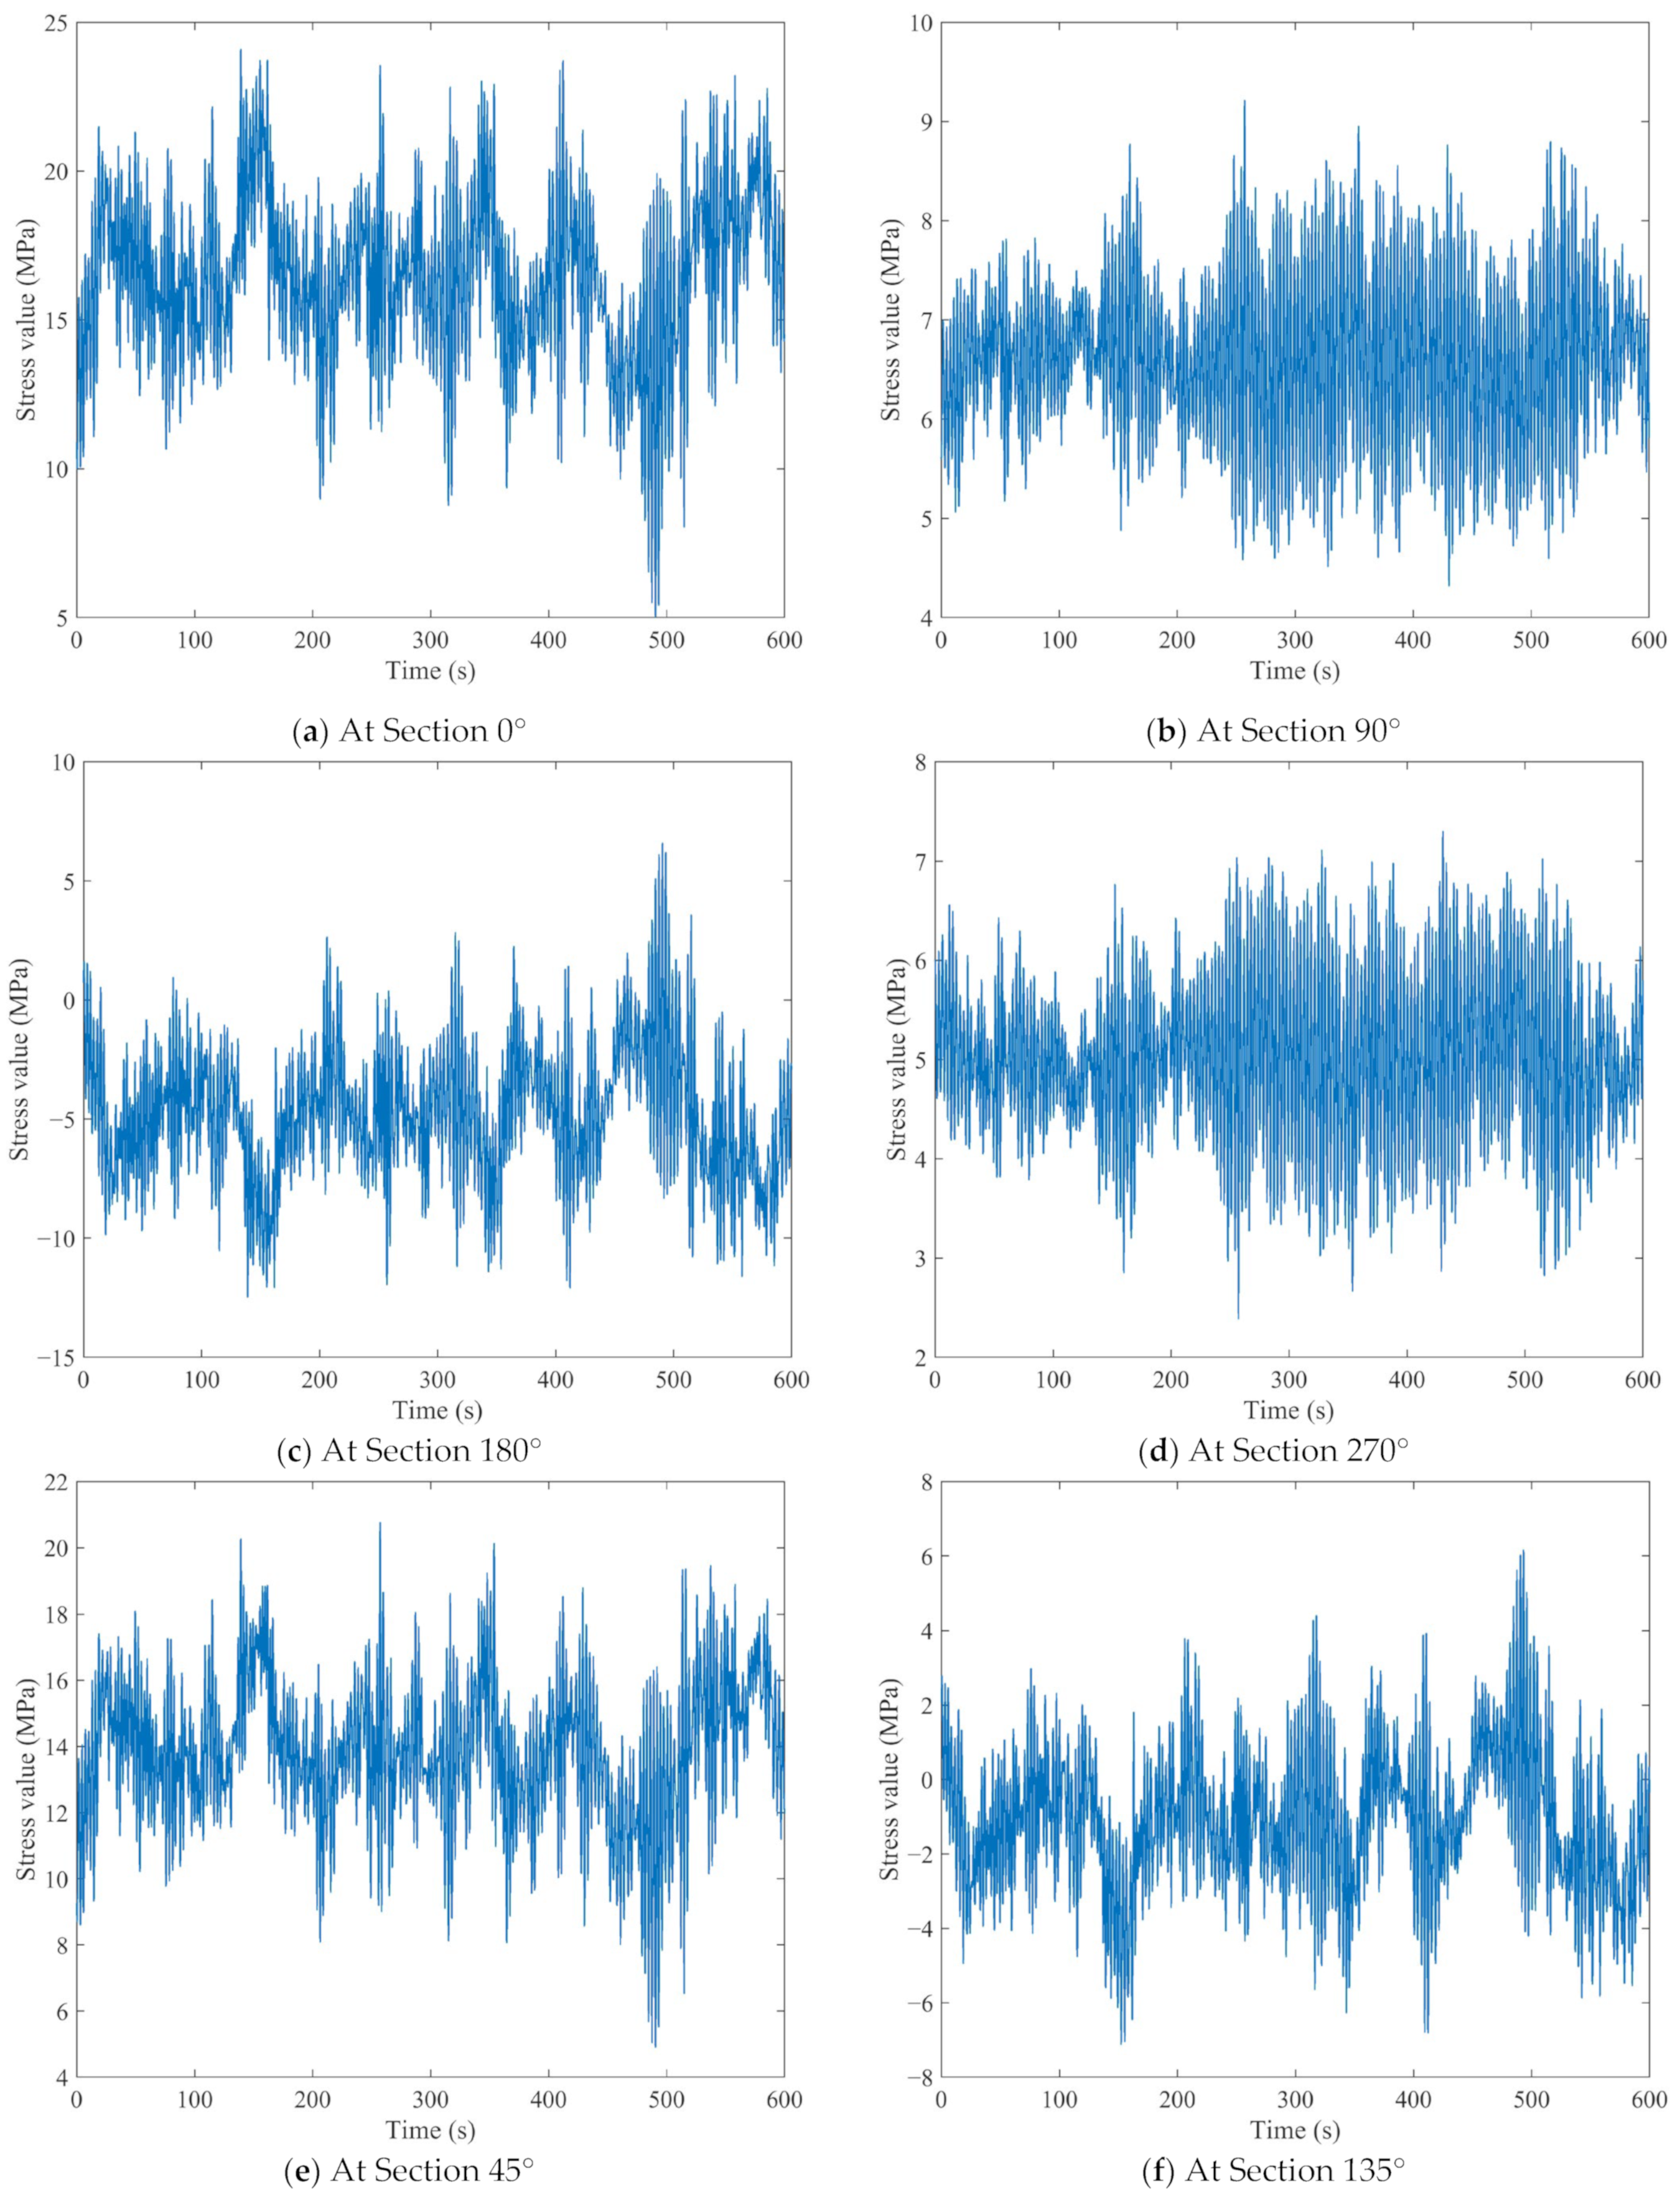
The simulated wind speed and tower structure parameters are input into FAST (3.5.0) software. And the forces and moments in three directions at the base of the tower during the normal operation of the wind turbine are calculated at each wind speed. Taking the force at the root of the tower at a pulsating wind speed of 7 m/s as an example, the forces and moments in three directions are obtained firstly at the cross-sectional position of the tower root. And then, the stress time-domain diagrams of each direction within 10 min are calculated in Matlab (4.3) according to Equation (12). The calculation results are shown in
Figure 11.
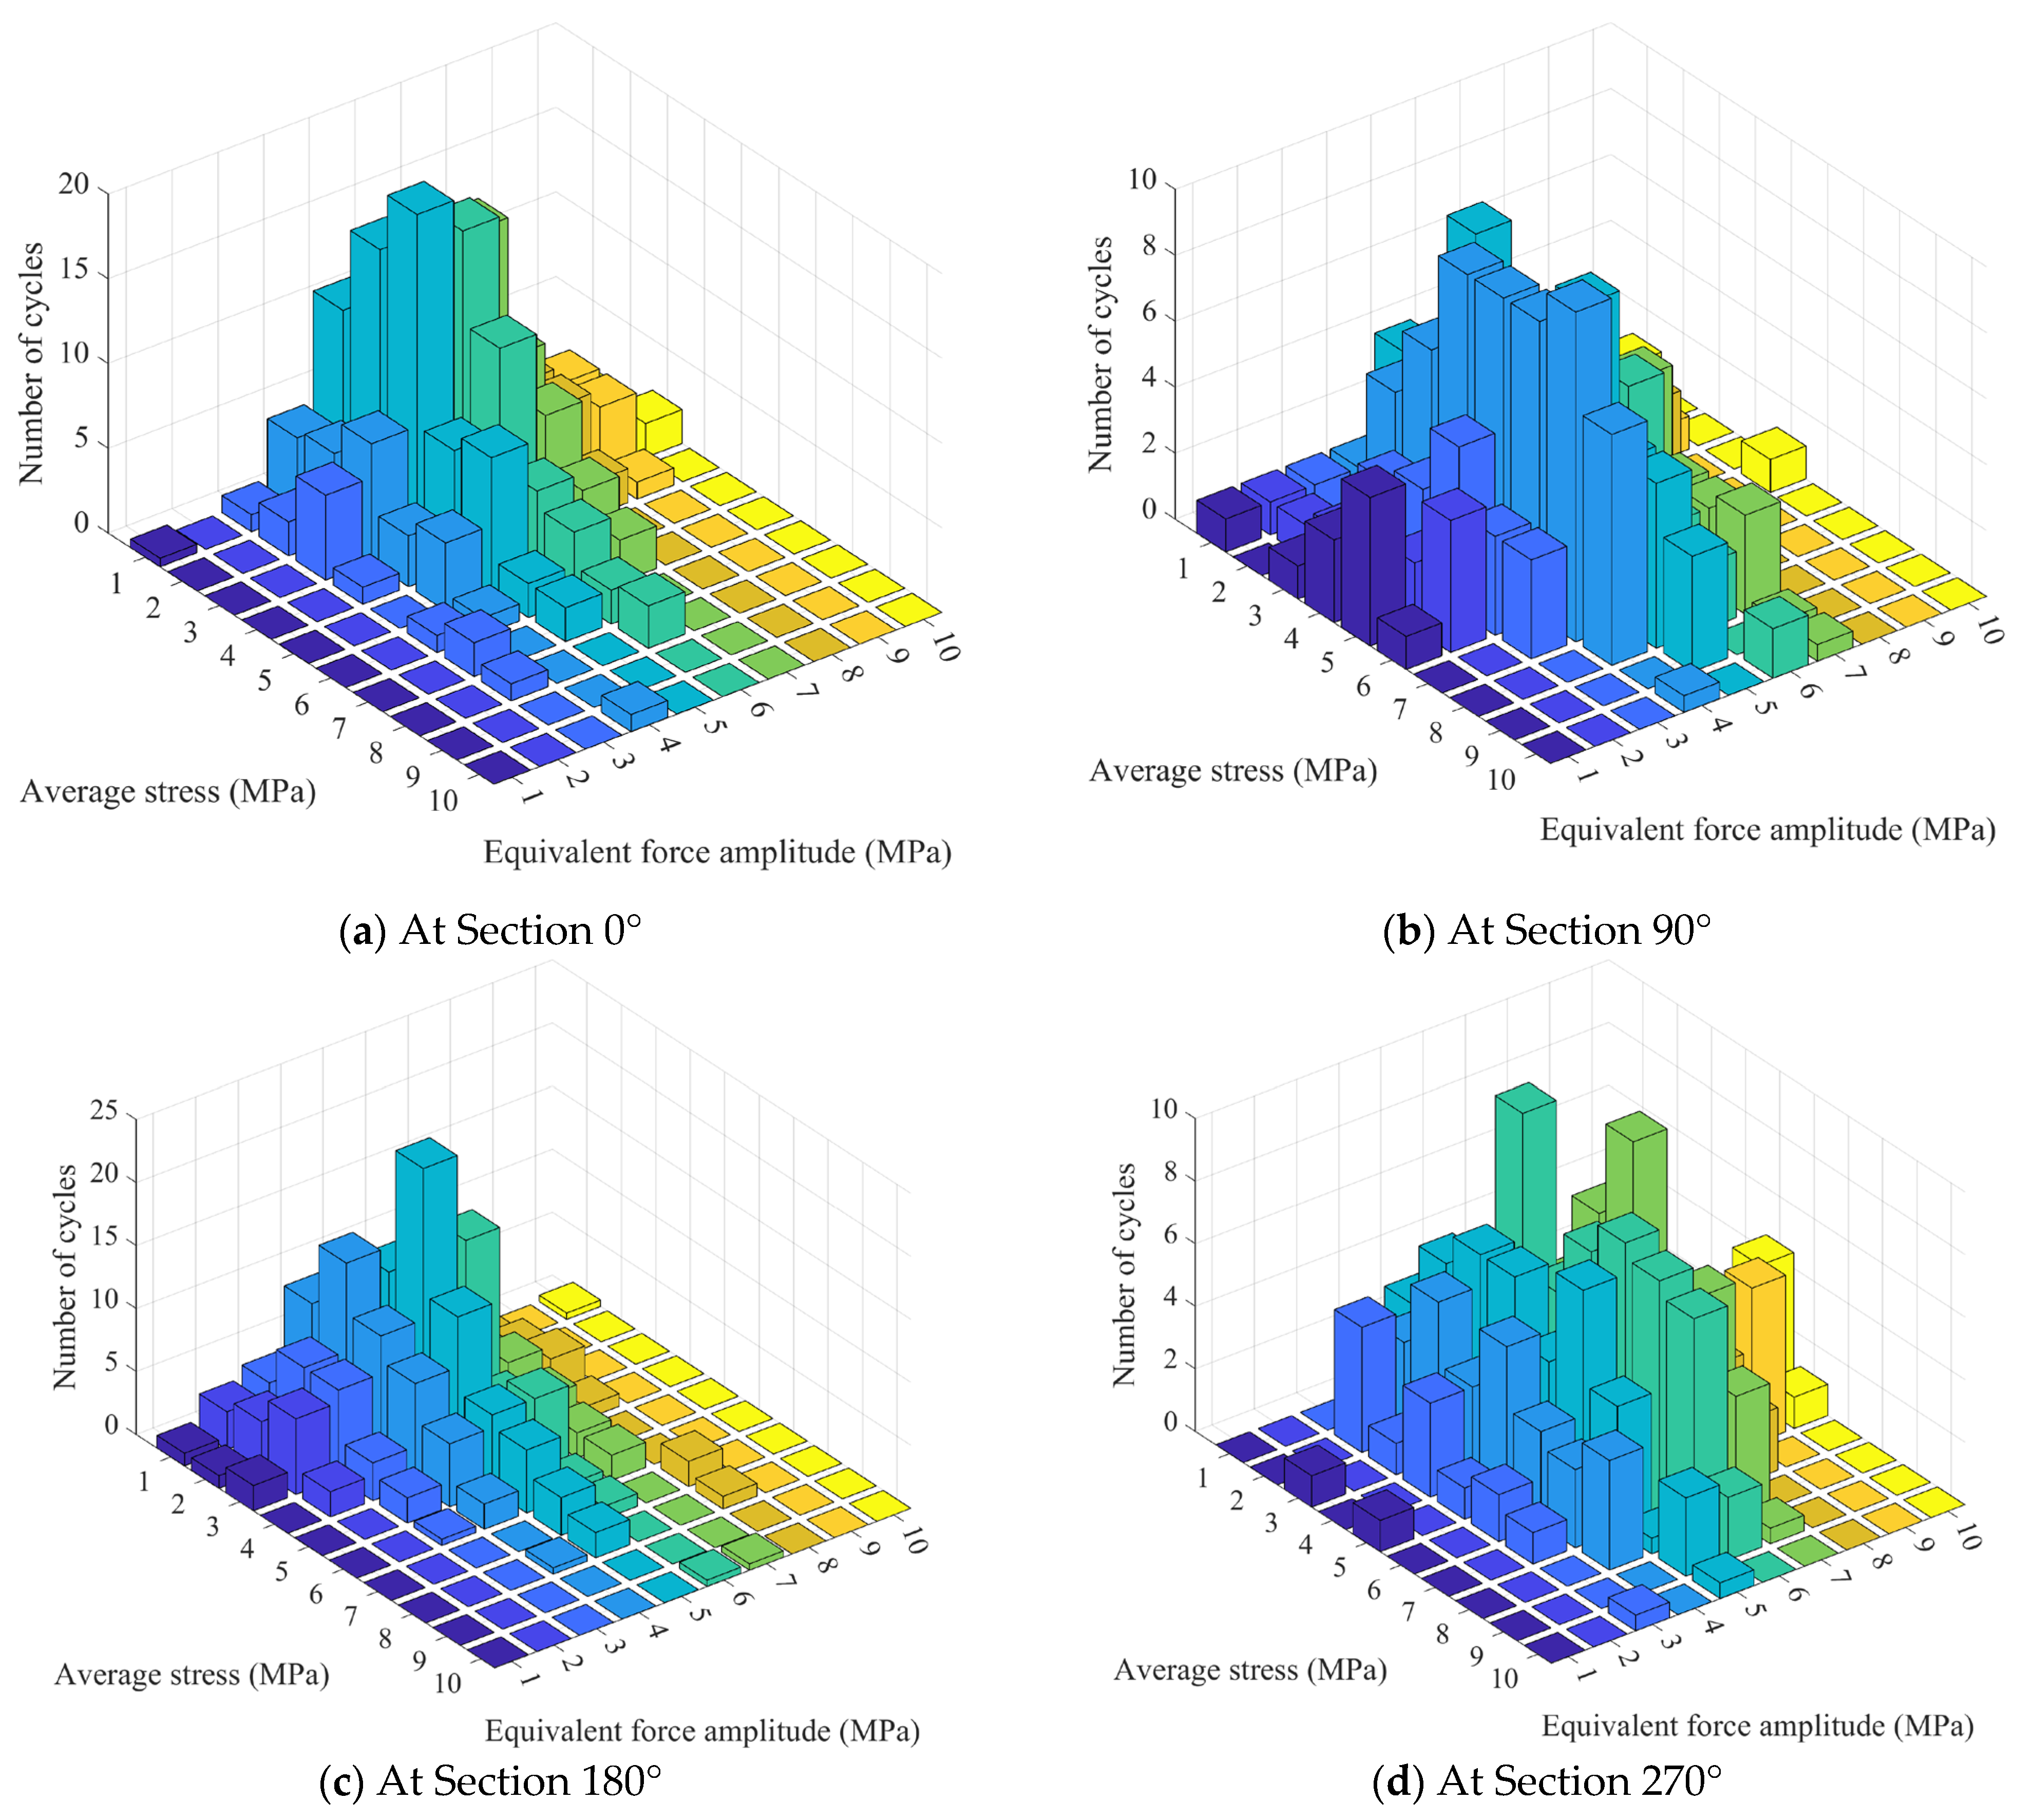
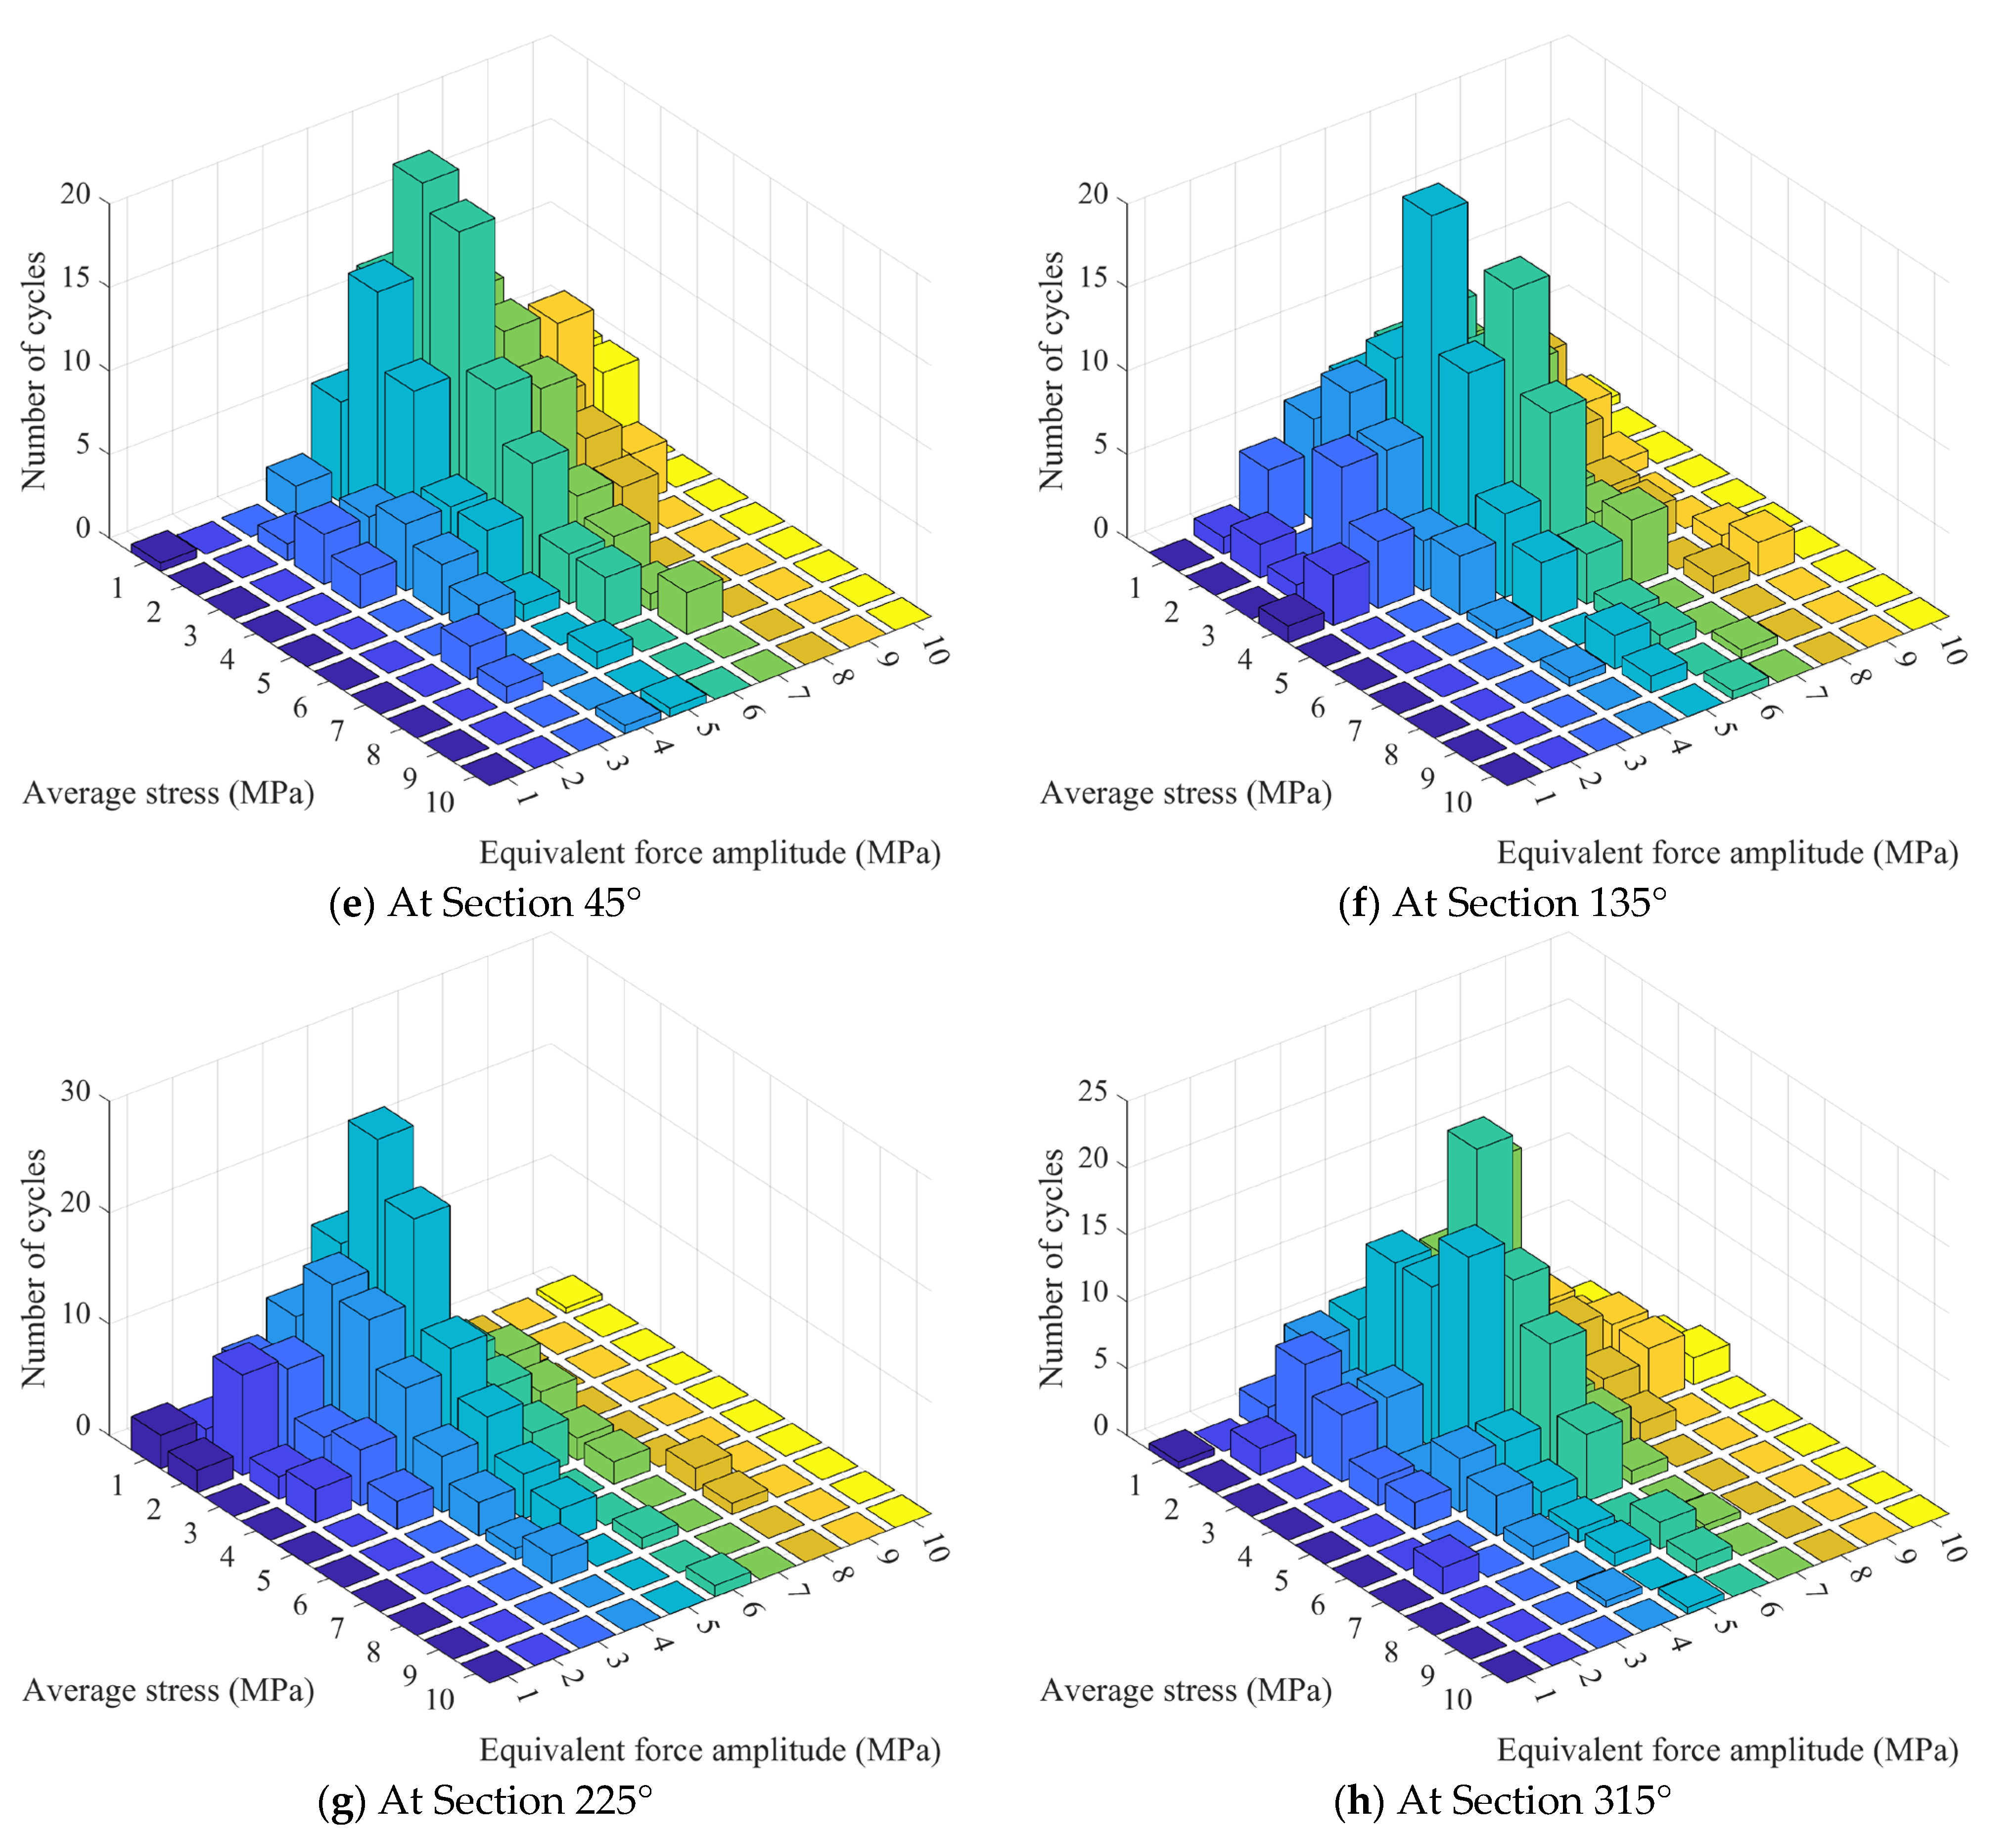
Lastly, rain flow analysis is performed on it to obtain the equivalent stress amplitude, average stress, and number of cycles in each direction, as shown in
Figure 12.
Figure 11 shows the stress variation process of the tower root under the influence of wind speed changes within 10 min, and the amplitude range of stress fluctuations can be observed. These fluctuations help us understand how wind speed fluctuations affect the structural response of the tower, and thus infer the dynamic behavior of the tower under different wind speed conditions (such as vibration amplitude, frequency, etc.).
Figure 12 visually illustrates the relationship between stress amplitude, average stress value, and number of cycles, which are important criteria for evaluating fatigue damage. By combining these two sets of images and observing only from the perspective of the most intuitive stress amplitude, it can be found that the stress fluctuation amplitudes in the 0°, 45°, and 180° directions are relatively large, resulting in significant fatigue damage in these directions. After subsequent fatigue analysis and calculation verification, the results are indeed true.
4.2. Determination of Stress Concentration Factor
The alignment problem between the tower base and the steel pipe pile is more prone to fatigue damage [
35], mainly considering the transverse shear stress and bending stress in the section. The stress concentration factor is calculated according to the formula of DNV-RP-C203 [
36]. Due to the welding position
T/
t ≤ 2 on the tower, the stress concentration factor can be calculated using the following formula:
where,
is the eccentricity caused by the different wall thicknesses of two connected circular pipes,
,
is the eccentricity, and in this article,
is taken as 0.1
t,
L is the length of the eccentric distribution,
,
D is the diameter of the circular tube.
According to the formula, the stress concentration factor at the bottom of the tower is calculated to be about 1.1. The nominal stress of this section is calculated and multiplied by the obtained stress concentration factor to obtain the hot spot stress.
4.3. Calculation of Fatigue Damage Degree for One Year
The Weibull fitting curve of actual wind speed can be used to calculate the frequency and occurrence of various wind speeds within a year. The annual wind speed is divided into 10 small wind speed intervals with a statistical interval of 2 m/s. And the fitting function is integrated to calculate the occurrence frequency of small wind speed intervals. Based on an average of 365.25 days per year, the annual occurrence duration for each wind speed range can be obtained, as shown in
Table 5, totaling 8766 h.
Based on the occurrence duration of various wind speed ranges within a year, the distribution of stress is determined under each operating condition in FAST (3.5.0) software. The hot spot stress is calculated at the root of the tower, and the corresponding equivalent cyclic stress amplitude and number of cycles are calculated by using the rain flow counting method for the hot spot stress.
According to Miner’s linear cumulative damage criterion, the total damage degree is calculated using the following formula:
where,
is the equivalent load of
N cycles,
is the stress amplitude of each level, and
m is the slope of the S–N curve, which takes the value of 9.
where,
D is the total fatigue damage degree,
is the actual number of cycles during operation under the
i-th level stress, and
is the number of cycles on the S–N curve under the
i-th level stress.
It is known that the tower material is Q345 steel, with a tensile strength of about 470 MPa. After 107 cycles, the corresponding tensile and compressive fatigue limit is about 141 MPa according to the structural steel standard.
The relationship between stress amplitude and
N can be calculated according to:
The partial calculation results of the fatigue life and cumulative damage value at the root of the tower under different equivalent cyclic stress amplitudes are shown in
Table 6 and
Table 7:
The fatigue damage value within one year is the product of the number of occurrences at a 10-min interval for each operating condition and the fatigue damage value of the section. According to
Table 6, the maximum annual fatigue damage occurs at 0° of the section, with a value of 1.1988 × 10
2. If the design life of the wind turbine is calculated as 20 years [
37], the total fatigue damage during the life cycle is 0.24, and the fatigue life is 82 years.
4.4. Verification of Results Based on Bladed Software
To verify the fatigue damage results, Bladed (4.3) software was used for verification. The tower shape, mass, and other parameters set in Bladed, as well as the distribution function and parameters of wind speed, are the same as Fast. According to the annual wind speed statistics of the target wind farm, the average wind speed is about 7 m/s. The generated fluctuating wind speed is used as input to calculate the annual fatigue damage value of the tower. The results are shown in
Table 8.
It is shown that the accumulated fatigue damage is 1.11 × 10⁻², with a total fatigue damage of 0.22 and a fatigue life of 90 years. Comparing the fatigue damage values obtained from Bladed’s calculations with Fast’s calculations, the difference between the two is about 7.4%, which is within a reasonable range.
5. Conclusions
The study investigates the dynamic response of offshore wind turbine structures to turbulent wind loads in both time and frequency domains. A combination of time-domain and frequency-domain methods was used to obtain the fatigue load spectrum and predict the fatigue life of the critical section at the bottom of the tower using the cumulative damage rule. The main conclusions are as follows:
- (1)
Due to the significant impact of the magnitude of average stress on the fatigue damage of wind turbines, this paper conducted equivalent conversion calculations on non-zero average stress during fatigue analysis to accurately reflect the loading conditions.
- (2)
The wind-induced fatigue damage at the bottom of the wind turbine tower varies in different directions, with the windward side experiencing the greatest fatigue damage, followed by the leeward side, and the left and right sides experiencing the smallest.
- (3)
The obtained fatigue life is 82 years, with an error within 10%, meeting the design requirement of 20 years.
The cross-section of the tower analyzed in this article is located above sea level and is mainly affected by wind loads, and the fatigue life is calculated based on this. But the randomness and nonlinear behavior of wind loads, as well as material properties, may also lead to errors. Therefore, future research can combine long-term monitoring data to explore the coupling effects of wind loads and structural nonlinearity to optimize design and monitoring methods.
