Abstract
Organic matter (OM)-hosted pores play a crucial role in unconventional shale reservoirs, with their development influenced by OM type and thermal maturity across terrestrial, transitional, and marine deposits. In this study, a comparative analysis of porosity and pore structures is presented using organic petrographical, petrophysical, and mineralogical methods on organic-rich samples from diverse depositional environments. A pore evolution model for these sediments in different settings is proposed. Results show that kerogen particles in terrestrial shales at low and moderate thermal maturity (Dameigou Formation and Qingshankou Formation) are mostly nonporous. Transitional shales (Longtan Formation) contain vitrinite and inertinite, with only some inertinite exhibiting visible primary pores. In marine shales at higher maturity (late oil window; Dalong Formation), the interparticle pore space is occupied by solid bitumen, and secondary porosity is present at higher maturity, approaching the thermal gas generation stage. In over-mature marine shales (Wujiaping and Daye Formations), secondary pores are densely distributed within pyrobitumen. A negative correlation between organic carbon content and pore volume is observed in low-maturity lacustrine and transitional shales due to poorly developed kerogen-bound pores and interparticle pore occlusion by solid bitumen. However, over-mature marine shales exhibit a strong positive correlation due to extensive secondary porosity in pyrobitumen. Thus, pore evolution within OM is controlled by kerogen type and maturity. In oil-prone marine and lacustrine shales, secondary porosity in solid bitumen and pyrobitumen increases with thermal maturity. In contrast, terrestrial kerogen rarely forms solid bitumen and mainly develops micropores rather than mesopores at high maturity.
1. Introduction
With the progressive exploration and development of shale gas in China, total shale gas production exceeded 2.0 × 10¹⁰ m3 in 2020 [1]. However, breakthroughs in exploration have not yet been achieved in terrestrial and transitional organic-rich shales due to complex geological conditions, unique petrophysical characteristics, and limitations in development techniques [2,3,4]. Currently, marine shales in the southern China region are the primary focus of shale gas exploration and development. They exhibit several favorable characteristics, such as significant thickness, consistent organic facies and richness, high thermal maturity, high total organic carbon (TOC) levels, and brittle mineral content [4]. Terrestrial organic-rich deposits primarily form in lacustrine or fluvial-deltaic environments [3,5]. Lacustrine sediments are characterized by type I–II kerogen, while fluvial-deltaic sediments are dominated by type III kerogen with abundant terrestrial debris. Compared to marine sediments, terrestrial organic matter (OM)-rich deposits generally exhibit lower quartz content and maturity. Transitional shales consist of fine-grained sediments deposited in various near-shore and paralic environments—such as distributary bays, channels, peat swamps, tidal flats, and lagoons—making them more complex and susceptible to terrestrial influences [6]. Consequently, transitional shales display considerable lithologic heterogeneity and often contain high levels of humic OM. A systematic comparative study focusing on characterization of pore structures across terrestrial, transitional, and marine deposits can provide valuable insights into the petrophysical properties of shales and their controlling factors. This research is crucial for advancing evaluations of shale reservoirs with diverse sedimentary characteristics.
As the carrier of nanometer-scale pores and precursor of oil and gas in unconventional shale reservoirs, OM has become a prominent research focus in recent years [7,8,9,10,11,12,13,14]. Its quantity, quality, and maturity directly control the hydrocarbon generation potential of source rocks and further influence the petrophysical properties of shale reservoirs. Sedimentary OM occurs in different forms in source rocks, owing to various thermal evolution stages and initial maceral types. For instance, bituminite—a structureless maceral derived from degraded phytoplankton—is the dominant component found in marine black shales from the Illinois Basin [13]. Alginite is the major maceral in many lacustrine source rocks at low maturity, e.g., the Jurassic Dameigou Formation in the Qaidam Basin [15]. These oil-prone macerals will gradually disappear due to degradation and transform into hydrocarbons and solid bitumen (SB) with increasing thermal maturity (Ro > 1.0) [8,9]. Secondary OM, including SB and pyrobitumen (Pyb), is the dominant OM in shales with type I/II kerogen that have passed the peak oil generation stage [8,9,15]. Pyb is the insoluble residue of SB after secondary cracking when the Ro values are higher than 1.1% [16]. Mastalerz et al. (2018) used an SB reflectance (BRo) value of 1.50% with an equivalent Ro (EVRo) value of about 1.33% (Jacob, 1989) as the boundary of SB and Pyb. Both SB and Pyb have void-filling characteristics and exhibit pervasive, continuous, and amorphous morphologies under scanning electron microscope (SEM) observation [10,16]. For instance, Pyb is the dominant OM in over-mature marine shales from south China, e.g., Ordovician–Silurian Wufeng–Longmaxi Formations and Lower Cambrian Shuijingtuo Formation [17,18]. Terrigenous OM, including vitrinite and inertinite, are enriched in shales containing type III and IV kerogen deposited in the transitional environments, e.g., distributary bays, underwater distributary channels, tidal flats, and lagoons [4,14,19]. These macerals are mainly derived from woody tissues of higher plants, fire-driven charcoal, and fungal tissue and have a rather low hydrocarbon generation potential [20]. Vitrinite and inertinite generally occur as discrete and micrometer-sized particles with a clear boundary in the mineral matrix. Fusinite, derived from charcoal, is an inertinite maceral characterized by well-preserved cell cavities, part of which may be filled with minerals [21].
Loucks et al. (2009) were the first to directly observe dominant nanometer-sized pores in the Mississippian Barnett Shale from the Fort Worth Basin, one of the most productive and commercially significant shale gas reservoirs in the United States [22]. This pioneering study employed argon ion beam milling in combination with SEM to provide unprecedented insights into the pore networks of organic-rich shales. In addition to direct imaging techniques, several indirect methods have been widely utilized to quantify pore structure parameters with high precision. These include low-pressure CO2 and N2 physisorption, mercury injection capillary pressure (MICP), small-angle and ultra-small-angle neutron/X-ray scattering, and helium porosimetry. Collectively, these approaches offer a comprehensive understanding of pore size distribution, connectivity, and overall porosity, thereby enabling more accurate assessments of reservoir quality and hydrocarbon storage potential in shale formations [23,24,25,26,27,28,29,30]. Previous studies have suggested that OM-hosted pores significantly influence the pore structure parameters of shale reservoirs, thereby affecting the gas adsorption capacity [17,27,31]. Due to the diversity of OM, these pores are classified into primary and secondary pores. Primary pores within OM refer to biological lumens derived from plant tissues, such as those present in fusinite and semifusite. Typically, these primary pores are micrometer-scale and exhibit round or oval shapes [8,15]. In contrast, secondary pores within OM are closely linked to the generation and expulsion of oil and gas, with their development primarily controlled by thermal maturity [8,30]. Liu et al. (2017) proposed that low oil-expulsion efficiency could lead to the retention of bitumen in shales, further contributing to gas generation and the formation of nanometer-scale secondary pores within OM [32]. Secondary pores within OM in the mesopore range (2–50 nm) exist mainly within SB and Pyb, characterized by irregular, bubble-like shapes, whereas vitrinite develops little secondary porosity in this range [33]. Curtis et al. (2012) studied a series of Woodford Shale samples, encompassing a range of Ro values from 0.51% to 6.36% [34]. They observed the initial occurrence of secondary pores within OM in the sample with a Ro value of 1.23%. However, some studies suggested that secondary porosity within OM starts to develop even at a lower maturity of 0.8% Ro [17,35]. In recent years, researchers have sought to systematically elucidate the evolution characteristics of pore systems—particularly secondary pores within OM—in shale reservoirs from immature to over-mature stages through studies on both artificially and naturally matured samples [8,11,36,37]. However, this issue remains debated, with many different proposed pore evolution models. Mastalerz et al. (2013) observed a substantial reduction in the total porosity of the OM-rich New Albany shales during the evolution from the mature stage to the late mature stage [24]. However, a noteworthy increase in the total pore volumes (PVs) was evident within the range of Ro 1.15% to 1.41%, which can be attributed to the development of new pores in OM. Wu et al. (2019) observed a similar multi-stage variation trend during artificial maturation experiments [36]. They suggested that the generated liquid hydrocarbons are absorbed on the surface of OM, resulting in the swelling of OM and further reduction of the pore size at a maturity of about 1.0% Ro. The first minor increase of PV in shales during the experiments takes place during the late stage of oil generation, while the major increase of PV occurs at higher temperatures, when gas is generated within SB. Hence, it is imperative to scrutinize the formation mechanism of OM-hosted pores and elucidate the evolution of shale porosity throughout the entire thermal maturation process.
Therefore, a comprehensive understanding of pore structure differences among terrestrial, transitional, and marine shales is essential, as these variations directly influence reservoir quality and shale gas potential. A systematic comparative analysis will clarify the controlling factors, aiding in the evaluation of organic-rich shales in various geological settings. Additionally, investigating the evolution and pore-forming characteristics of different types of OM is critical for assessing hydrocarbon generation, storage, and overall reservoir quality. Finally, elucidating the formation and transformation of OM-hosted pores across thermal maturity stages will provide valuable insights for optimizing shale gas exploration and production. Owing to the high thermal maturity observed in almost all marine shales in southern China, the naturally matured Dalong Formation (DLF) in the Lower Yangtze area provides a rare opportunity to investigate the pore system of marine deposits within the oil window. This study aims to (1) study a sequence of organic-rich samples from terrestrial, transitional, and marine environments with varying thermal maturities to conduct a comparative analysis of porosity and pore structures, (2) investigate the formation mechanisms and evolution of pores in OM, and (3) propose a pore evolution model for organic-rich sediments across different depositional settings.
2. Geological Setting
The development of shales in China spans a significant age, from the Proterozoic to the Quaternary, and they are widely distributed across extensive regions (Figure 1 and Figure 2) [2]. Chronologically, from the Early Cambrian to Silurian, marine shales were primarily deposited in passive margin and foreland settings due to compression from the Late Ordovician Caledonian orogeny (Figure 2). These marine sediments are predominantly found in the Yangtze and Tarim Platforms. Subsequently, during the Carboniferous to Permian periods, transitional settings—such as lagoons and shallow-water deltaic facies—became widespread across China as a result of the Hercynian orogeny and Pangaea’s accretion [2]. This geological evolution led to a series of transitional sediments comprising organic-rich shales, sandstones, silty mudstones, and interbedded coal (Figure 2). Lacustrine basins began developing after the Middle Permian. During the Mesozoic era, fluvial-lacustrine environments emerged due to sea regression, playing a crucial role in forming oil-prone source rocks within several petroliferous basins.
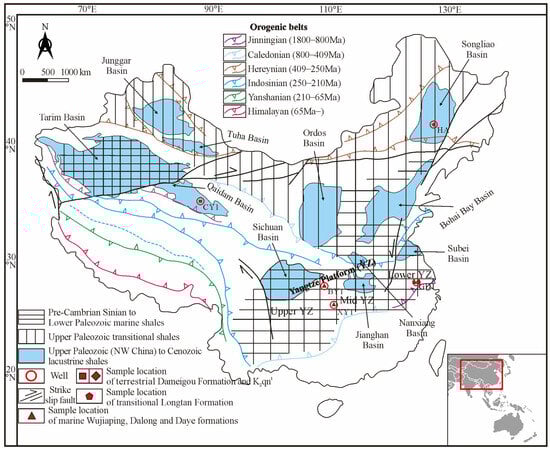
Figure 1.
Geographical location of the study areas and investigated wells (modified after Jiang et al. [2]).
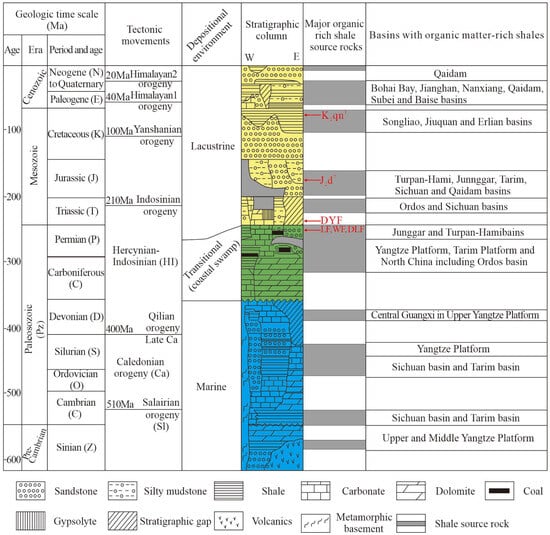
Figure 2.
Depositional environment, and distribution of major OM-rich shales in China (modified after Jiang et al. [2]).
The Qaidam Basin is notable as the largest high-altitude terrestrial petroliferous basin on the northeastern Tibetan Plateau, characterized by thick Mesozoic and Cenozoic sediments averaging around 8 km [38,39,40]. At the beginning of the Jurassic, the tectonic activity initiated subsidence in the northern segment of this basin [38,39,40]. During the Middle Jurassic, stress relaxation and tectonic extension led to the formation of the Yuqia sag in this northern sector, where well CY1 is located. This phase of subsidence resulted in the deposition of J2d7—the seventh member of the Middle Jurassic Dameigou Formation (DMGF)—characterized by sandstones and carbonaceous mudstones at its base and transitioning to mudstones at its top. This reflects a shift from fluvial to lacustrine depositional environments (Figure S1) [15].
The Songliao Basin is a non-marine continental rift basin superimposed on a Paleozoic basement [41,42]. During the late Early Cretaceous and Late Cretaceous, the basin underwent down-warping due to thermal subsidence. During this period, the most important oil-prone source rocks, particularly in the first Member of the Qingshankou Formation (K2qn1), were deposited (Figure S2) [43]. This formation is characterized by fine-grained lacustrine mudstones and shales.
Wells GD1, XY1, and BY1 are located across the Lower, Middle, and Upper Yangtze Platform, respectively (Figure 1). During the Late Permian Wuchiapingian stage, the marine Wujiaping Formation (WF) at the BY1 well was deposited within an intra-platform basin facies in the western Hubei region [44,45]. Contemporaneously, the Wuchiapingian Longtan Formation (LF), in the wells GD1 and XY1, developed in shallow-water marine-continental transitional environments, predominantly characterized by lagoonal and deltaic facies (Figures S3 and S4) [14,46]. The Changhsingian stage witnessed an extensive marine transgression, resulting in the deposition of the DLF under relatively deep marine conditions, typical of intra-platform basin facies (Figures S3 and S4) [14,47]. Subsequently, during the Early Triassic Daye period, following trough expansion termination, the marine Daye Formation (DYF) at the BY1 well was deposited in shallow-water intra-platform basin environments within the western Hubei region (Figure S5) [48].
3. Methods and Samples
For this study, 81 core samples were selected from different wells, representing deposits in terrestrial, transitional, and marine facies (Table 1). Detailed information regarding the origin, lithology, depth, and gamma-ray (GR) values of the analyzed samples is provided in Table S1 and Figures S1–S5. Prior to measurement, each core sample was divided into two parts: one was dried and ground into powder, while the other was embedded in epoxy resin. The study of macerals and the TOC analysis of Well CY1 were conducted at the Institute for Organic Biogeochemistry in Geo-Systems, RWTH Aachen University. All other tests were carried out at China University of Geosciences (Wuhan).

Table 1.
The geological information and bulk geochemical parameters for the terrestrial DMGF and K2qn1, transitional LF, and marine WF, DLF, and DYF.
Note that the Ro values of samples from the BY1 well are EVRo converted from BRo, calculated as EVRo = (BRo − 0.13)/0.87 [49].
3.1. TOC Content, Maceral Analysis, and Mineral Composition
The TOC content was determined using a Liqui TOC II (Elementar, Langenselbold, Germany) instrument (CY1 and HA wells) and Rapid CS elemental analyzer (Elementar, Langenselbold, Germany) (GD1, XY1, and BY1 wells), respectively. Prior to the analysis using the Rapid CS elemental analyzer (Elementar, Langenselbold, Germany), the powdered shale samples were wrapped in silver paper and subjected to hydrochloric acid treatment to eliminate carbonates. The identification of the maceral composition and Ro measurement were conducted on the oil-immersed sections using a LV100 (Nikon, Tokyo, Japan) and Axio Imager microscope (Zeiss, Jena, Germany). The samples were placed into silicone embedding molds and subsequently infused with a two-phase epoxy resin. After curing at 45 °C for 12 h, the embedded sections were manually ground and polished. Grinding was initially performed at 300 r/min with silicon carbide grinding papers of progressively finer grain sizes (120 μm, 25 μm, and 15 μm), using water as a lubricant. Polishing was conducted on the same device at 150 r/min for 3–4 min per step, utilizing polishing cloths and water-based diamond suspensions containing 9 μm (Dia Pro Plan 9) and 1 μm (Dia Pro Nap B) abrasive particles, respectively. In the final polishing step, a colloidal silica suspension (OP-U, 0.04 μm) with a small amount of rinsing agent and water was applied. For the determination of mineral content, the X’Pert PRO DY2198 diffractometer (Malvern Panalytical B.V., Almelo, The Netherlands) was employed. The comprehensive methodology for polished section preparation and the detailed specifications of analytical instruments and procedures were thoroughly documented by Wu et al. (2023) [43].
3.2. Gas Physisorption
Gas adsorption was performed using a Autosorb-IQ3 (Quantachrome, Boynton Beach, FL, USA) instrument on the powdered sample of 60–80 mesh. Before conducting the analysis, the samples underwent an eight-hour degassing and dewatering at 110 °C in an outgas station. At 273 K with pressures up to 104.5 kP, CO2 physisorption was conducted and, subsequently, the obtained data were analyzed using the nonlocal density functional theory model to obtain the pore structure parameters of micropores. N2 adsorption measurements were conducted at 97.3 kPa and 77.3 K across a relative pressure range (P/P0) of 0.0001–0.995, where P represents the equilibrium pressure and P0 denotes the saturation pressure. The resultant isotherms were analyzed using the Barrett–Joyner–Halenda (BJH) model to quantitatively characterize the pore structure parameters within the mesoporous and macroporous domains. A more comprehensive description of the applied experimental methodology was provided by Peng et al. (2019) [27].
3.3. FE-SEM (Field Emission-Scanning Electron Microscopy)
The sample surface perpendicular to the bedding was mechanically polished by a EM TXP instrument (Leica, Wetzlar, Germany) and subsequently treated with argon ions using a EM TIC 3X instrument (Leica, Wetzlar, Germany) in order to generate a highly smooth surface suitable for SEM observation. In order to improve conductivity, a 5 nm-thick carbon coating was applied to the polished surfaces. A Merlin instrument (Zeiss, Jena, Germany) was used to acquire high-resolution secondary and backscattered electron images. OM pores with diameters exceeding 10 nm were distinctly observable at magnifications ranging from 10,000× to 50,000×.
3.4. MICP
The MICP was determined using AutoPore 9510 and 9520 instruments (Micromeritics, Norcross, GA, USA). The cubic sample was subjected to oven drying prior to analysis at around 50 °C. The measurement involved a mercury pressure range increase from 0.0345 to 414 MPa, which encompassed a detectable pore-throat diameter range of about 3 nm to 36 μm, but care had to be taken for the smallest diameters due to Hg pressure far exceeding pressures reached during burial. Other petrophysical parameters, including porosity, average pore-throat diameter, and mercury entrapment ratio, were also acquired from MICP. The application of high-pressure conditions potentially modified the rock texture, consequently affecting the petrophysical parameters associated with pore dimensions below about 10 nm.
3.5. Fractal Theory
In this study, the fractal dimension (D) was determined using the Frenkel–Halsey–Hill model, defined as follows:
where V is the amount of gas adsorbed at equilibrium pressure P, V0 is the coverage volume of the single-molecule layer, P0 is the saturation pressure, P is the equilibrium pressure, C is a constant, and D − 3 represents the slope in the plot.
ln(V/V0) = C + (D − 3)ln[ln(P0/P)],
D typically falls within the range of 2 to 3 for porous media, with higher values indicating greater irregularity in profiles and increased surface roughness [30,50,51]. The FHH plot is partitioned into D1 and D2, which correspondingly represent monolayer adsorption (P/P0 < 0.45) and multilayer adsorption (0.45 < P/P0 < 1). These partitions delineate the D of the pore surface and pore structure.
4. Results
4.1. TOC Content and Mineral Composition
The data on the CY1, HA, GD1, and XY1 wells can be found in previous studies (Table S1) [15,30,43,52]. A high variability of TOC contents was observed in the samples obtained from the terrestrial DMGF in the CY1 well, ranging between 1.5 wt% and 39.2 wt% (avg. 9.4 wt%; Table S1). The K2qn1 from the HA well was characterized by generally lower TOC contents, ranging from 0.6 to 3.0 wt% (avg. 1.8 wt%; Table S1), while samples from the GD1 well exhibited TOC contents of 0.2–6.2 wt% (avg. 2.2 wt%; Table S1). Samples from the transitional LF exhibited significantly lower TOC contents (0.2–2.2 wt%, average (avg.) 1.0 wt%) than in the marine DLF (1.5–6.2 wt%, avg. 3.4 wt%). Similarly, TOC contents of the marine DLF in the XY1 well varied between 2.7 to 6.8 wt% (avg. 4.4 wt%). The samples from the BY1 well exhibited a significant variability in the TOC content (Table S1): values measured on the marine DYF (6.1–10.8 wt%, avg. 8.4 wt%) were clearly higher than those of the marine DLF (1.5 wt%) and WF (ranging from 0.6 to 3.1 wt%, avg. 1.7 wt%).
Samples from the terrestrial DMGF in the CY1 well were primarily constituted of quartz and clay minerals (Figure 3a). The oil shale deposited in a lacustrine environment was characterized by abundant carbonate minerals (calcite: 43 wt%; dolomite: 1 wt%). The lacustrine mudstone was primarily composed of quartz and clay minerals, accounting for average weight percentages of 47 and 39 wt%, respectively (Table S1). Similarly, the lacustrine samples of the K2qn1 from the HA well were dominated by quartz and clay minerals, with quartz content ranging from 27 wt% to 52 wt% (avg. 39 wt%) and clay minerals’ content ranging from 22 to 49 wt% (avg. 36 wt%; Figure 3b). The transitional LF was clay-rich, with clay mineral content (CMC) varying from 49 to 68 wt% (avg. 57 wt%; Figure 3c). In contrast, the marine DLF from the GD1 well exhibited significantly elevated quartz contents (averaging at 44 wt%) and some calcite (averaging at 6 wt%). Similarly, the marine Dalong samples in the XY1 well contained much quartz and calcite, ranging from 29 to 63 wt% (avg. 49 wt%) and 10 to 38 wt% (avg. 20 wt%), respectively. Both the Dalong samples from the GD1 and XY1 wells had relatively low proportions of clay minerals, varying from 20 wt% to 54 wt% (avg. 38 wt%) and 8 to 33 wt% (avg. 21 wt%; Figure 3c,d), respectively. Mineralogically, quartz (6–54 wt%, avg. 30 wt%) and calcite (2–89 wt%, avg. 48 wt%) were major components of the marine WF, DLF, and DYF from the BY1 well, while the clay minerals accounted for a lower proportion, ranging from 6 to 26 wt% (avg. 15 wt%; Figure 3e).
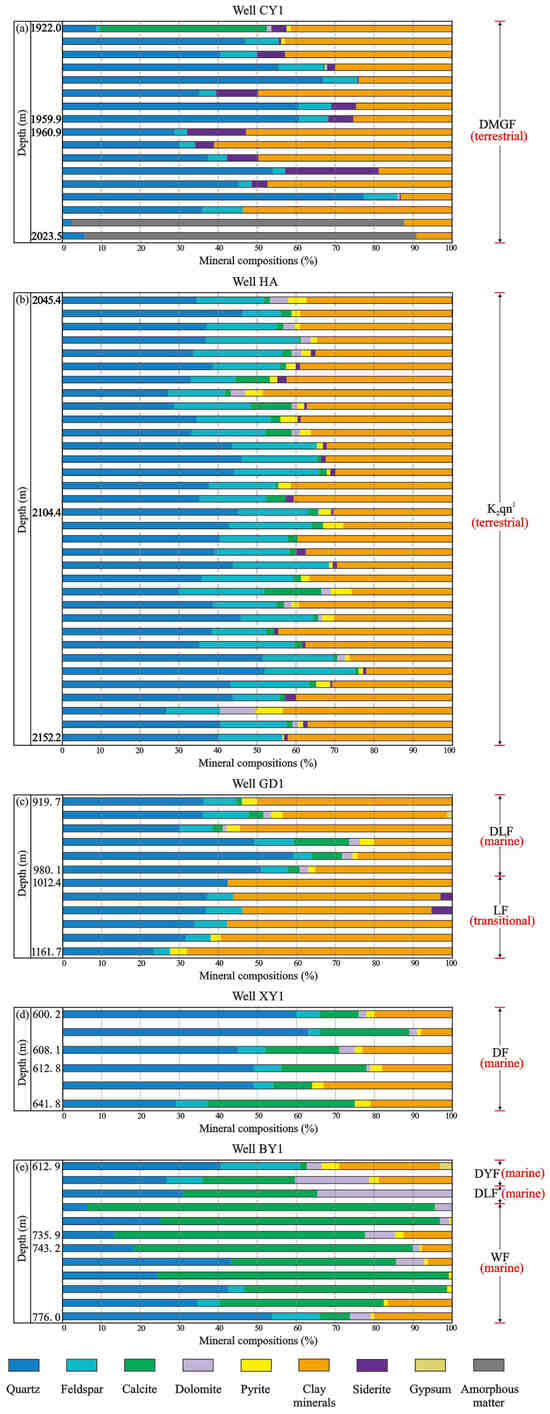
Figure 3.
Vertical variations in the mineralogical compositions of samples from wells CY1, HA, GD1, XY1, and BY1, determined by XRD analysis. (a) Well CY1; (b) Well HA; (c) Well GD1; (d) Well XY1; (e) Well BY1.
4.2. Organic Petrography
The examination of organic petrography showed significant variations in maceral composition and maturity levels among samples collected from distinct wells. Vitrinite, occurring as massive and homogeneous phytoclasts, constituted a significant proportion of the OM in the carbonaceous mudstone deposited in fluvial environments from the CY1 well (Figure S6a–h). Inertinite appeared as large fragments (Figure S6a,e), part of which, e.g., fusinite, developed micrometer-sized pores with relatively rounded shapes (Figure S6e). The occurrence of large amounts of vitrinite and inertinite suggested high terrestrial OM input during the deposition of the carbonaceous mudstone. In contrast, the OM in the lacustrine mudstone (Figure S6i–l) and oil shale (Figure S6m–p) was dominated by alginite with stripe-like lamellae structure. Lamalginite emitted yellow fluorescence under ultraviolet (UV) light excitation (Figure S6j,l,p). Exsudatinite displayed yellow fluorescence and generally filled the chamber within calcareous fossils in the oil shale (Figure S6m–p). Terrestrial macerals in the lacustrine mudstone typically occurred as fragments with irregular shapes and had a much smaller size (Figure S6i,k) compared to the OM present in the carbonaceous mudstone (Figure S6a,c,e,g). There was much lamalginite present in the lacustrine K2qn1 from the HA well, characterized by stripe-like lamellae displaying orange fluorescence under UV light excitation (Figure S7). In contrast, inertinite and vitrinite were present in low volumetric percentages and appeared as detrital particles (Figure S7a,c).
The transitional LF from the GD1 well was rich in vitrinite and inertinite, displaying irregular shapes (Figure S8a–c). Within the inertinite particles, primary pores were observable (Figure S8a). In contrast, the marine DLF was characterized by the dominance of dispersed and partly interconnected SB (Figure S8d–f). Similarly, SB was the dominant OM phase in the marine DLF from the XY1 well (Figure S9). Notably, certain mineral particles were enclosed SB (Figure S9b). Terrestrial macerals were generally scarce in the DLF, although a limited number of inertinite particles were detected (Figures S8f and S9c).
OM appeared as a pervasive and well-connected SB network and occupied a significant proportion of the primary interparticle pore space amidst mineral grains in the marine Wujiaping and Daye shales from the BY1 well (Figure S10). Furthermore, the interconnected OM network enclosed certain mineral grains, displaying a smoothly curved boundary (Figure S10c,e). These features strongly suggested that SB once existed as a liquid phase and was not primary kerogen. Within few inertinite particles, primary pores with rounded or oval shapes were visible (Figure S10e,f).
The Ro values, based on autochthonous vitrinite particles in the DMGF from the CY1 well, exhibited a range from 0.4% to 0.6% (Table S1), suggesting an immature to early mature stage. Ro values of the lacustrine samples of the K2qn1 from the HA well varied between 0.8% and 0.9% (avg. 0.8%; Table S1), reaching the early to peak oil generation stage. The LF and DLF from the GD1 well, as well as the DLF from the XY1 well, displayed Ro values ranging from 1.0% to 1.2% and 1.2% to 1.4% (Table S1), respectively, indicating variations in maturity from the late oil window to the condensate–wet gas stage. By converting the BRo values, the EVRo values for the DYF, DLF, and WF in the BY1 well ranged from 2.1% to 2.5% (Table S1), suggesting that OM in these source rocks was within the dry gas window.
4.3. FE-SEM Observation
There was abundant kerogen derived from terrestrial plants in the carbonaceous mudstone deposited in the fluvial environment of Well CY1. These kerogen particles appeared elongated or oval, massive, and homogeneous within the mineral matrix (Figure 4a–e). Most kerogen particles were nonporous, with only a few nanometer-scale primary pores observed (Figure 4b,d,e). Alginite, on the other hand, mainly occurred as parallel streaks and showed elongated algal bodies in lacustrine mudstone (Figure 4f). Similar to terrestrial OM in the carbonaceous mudstone, the kerogen particles in the lacustrine mudstone exhibited low porosity, although some stripped kerogen particles did contain nanometer-scale primary pores (Figure 4g–j). A portion of the primary pores within OM was occupied by authigenic minerals (Figure 4k,l). Furthermore, certain interparticle pore spaces were filled with nonporous OM, which may be pre-oil bitumen or exsudatinite (Figure 4k,m–o). Similarly, lamalginite occurred as nonporous, stripe-like, and parallel streaks in the lacustrine samples of the K2qn1, similar to those observed in the Well CY1 (Figure 5a,b). Terrestrial macerals predominantly occurred as discrete debris within the mineral matrix and displayed curved, stripe-like, lath, and fragmentary shapes with arcuate and smooth boundaries, as well as straight, sharp edges (Figure 5c–f). Overall, terrestrial maceral particles were larger and had smoother boundaries compared to lamalginite (Figure 5d–f).
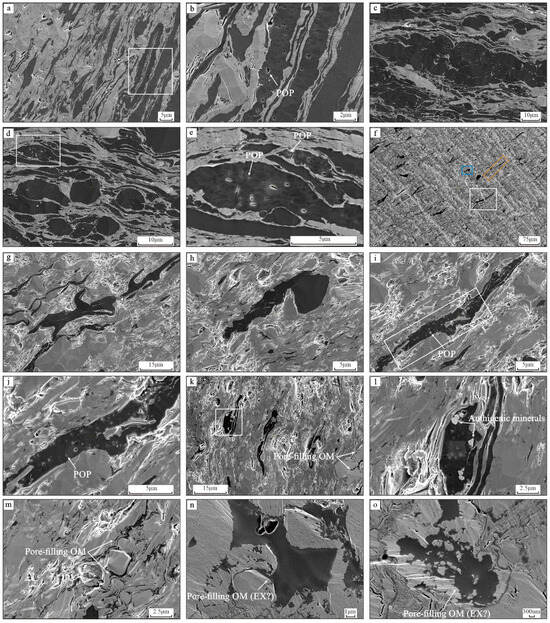
Figure 4.
FE-SEM images showing the morphology of OM in the DMGF from the CY1 well. (a) Macerals occurring as parallel streaks, sample CY-17, carbonaceous mudstone, DMGF. (b) An enlargement of the region highlighted by the white rectangle in (a), showing a small amount of primary pores within OM within certain kerogen particles. (c) Clustered macerals exhibiting an oval shape, sample CY-16, carbonaceous mudstone, DMGF. (d) Macerals with an elongated and oval shape. Most macerals are nonporous, sample CY-16, carbonaceous mudstone, DMGF. (e) An enlargement of the region highlighted by the white rectangle in (d), showing primary pores within OM in some kerogen particles. (f) Macerals occurring as parallel streaks, sample CY-4, mudstone, DMGF. (g) An enlargement of the region highlighted by the white rectangle in (f), showing nonporous macerals. (h) An enlargement of the region highlighted by the blue rectangle in (f), showing nonporous maceral. (i,j) An enlargement of the region highlighted by the orange rectangle in (f), showing primary pores within OM in maceral. (k) Macerals occurring as parallel streaks, sample CY-5, mudstone, DMGF. (l) An enlargement of the region highlighted by the white rectangle in (k), showing primary pores within OM in maceral. Some of the primary pores within OM are filled with authigenic minerals. (m) Interparticle pore space filled by OM, sample CY-10, mudstone, DMGF. (n,o) The OM, which may be exsudatinite, filling the pore space within the minerals, sample CY-1, oil shale, DMGF. Ex: exsudatinite; POP: primary OM pore.
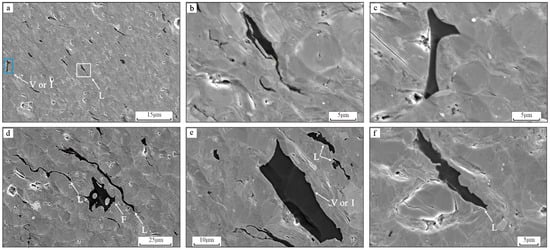
Figure 5.
FE-SEM images showing the morphology of OM in the K2qn1 from the HA well. (a) Lamalginite occurring as parallel streaks and terrigenous maceral, sample HA-13, shale, K2qn1. (b) An enlargement of the region highlighted by the white rectangle in (a), showing nonporous lamalginite. (c) An enlargement of the region highlighted by the blue rectangle in (a), showing nonporous terrigenous maceral. (d) Lamalginite and fusinite, sample HA-13, shale, K2qn1. (e) Lamalginite and terrigenous maceral, sample HA-13, shale, K2qn1. (f) Lamalginite, sample HA-13, shale, K2qn1. L—lamalginite, V—vitrinite, I—inertinite, and F—fusinite.
Vitrinite and inertinite occurred as detrital particles with angular edges within the mineral matrix in the transitional LF from the GD1 well (Figure 6a–d). No pores were observed in these terrestrial OM using SEM. SB occurred as amorphous, dispersed, and interconnected networks in the marine DLF (Figure 6e–i). The pervasive and nonporous OM network in the marine DLF from the GD1 well occupied almost all the pore space between mineral grains (Figure 6e–i) and exhibited significant differences compared to the adjacent terrestrial kerogen particles with relatively larger sizes (Figure 6g,h). It should be noted that the interior of the above-mentioned OM was not homogeneous and showed a spotted/globular structure (Figure 6f). Similarly, the OM in the marine DLF from the XY1 well was also characterized by an amorphous morphology and pore-filling characteristics (Figure 7). The SB network almost infilled all the interparticle pore space within pyrite framboids (Figure 7e). Some mineral particles were almost completely enclosed by the OM network (Figure 7i). In the SB, secondary pores with diameters spanning approximately 10 nm to 200 nm were discernible (Figure 7a–h). In addition, there was an uneven distribution of secondary pores within the OM, with certain SB particles displaying a higher number of secondary pores (Figure 7d), while others exhibited a relatively lower degree of pore development (Figure 7h). Similar to the OM in the DLF from the GD well, spotted/globular texture was observed in the OM from the XY1 well (Figure 7h).
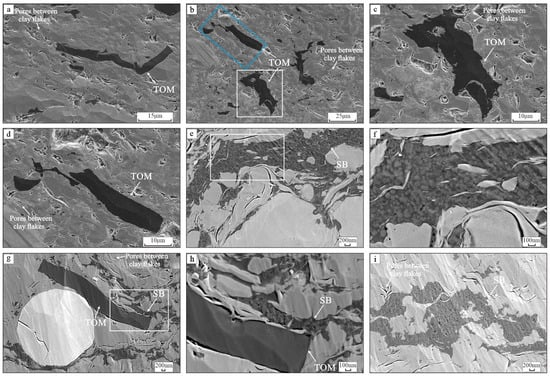
Figure 6.
FE-SEM images showing the morphology of OM in the LF and DLF from the GD1 well. (a) Terrestrial OM occurring as discrete particles exhibiting a stripe-like morphology and possessing a smooth boundary, sample GD-10, silty mudstone, LF. (b) Terrestrial OM and clay minerals exhibiting the presence of intraparticle pores within their cleavage sheets, sample GD-10, silty mudstone, LF. (c) An enlargement of the region highlighted by the white rectangle in (b), revealing the presence of nonporous macerals and clay minerals that exhibit intraparticle pores within their cleavage sheets. (d) An enlargement of the region highlighted by the blue rectangle in (b), showing nonporous macerals and clay minerals that exhibit intraparticle pores within their cleavage sheets. (e) A pervasive SB network filling the interparticle pore space within the mineral matrix, sample GD-5, shale, DLF. (f) An enlargement of the region highlighted by the white rectangle in (e), showing nonporous SB. (g) Terrestrial OM and SB, sample GD-6, shale, DLF. (h) An enlargement of the region highlighted by the white rectangle in (g), showing nonporous terrestrial OM and SB. (i) SB exhibiting a small number of micropores, sample GD-6 shale, DLF. TOM: Terrestrial OM; SB: solid bitumen.
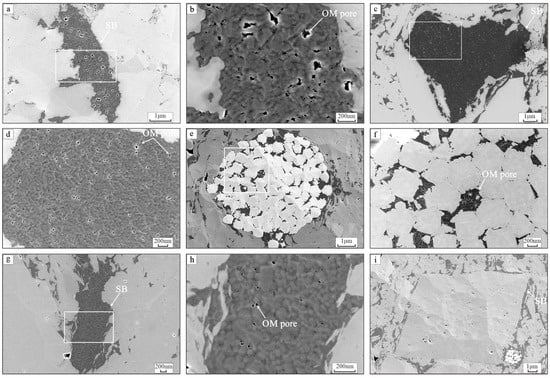
Figure 7.
FE-SEM images showing the morphology of OM in DLF from the XY1 well. (a) SB, 624.87 m, shale, DLF. (b) An enlargement of the region highlighted by the white rectangle in (a), showing porous SB. (c) SB, 624.87 m, shale, DLF. (d) An enlargement of the region highlighted by the white rectangle in (c), showing porous SB. (e,f) A pyrite framboid where pore spaces are filled with SB. The porous nature of the SB is not evident in image (e), and this observation comes from image (f), 624.87 m, shale, DLF. (g) SB, 624.87 m, shale, DLF. (h) An enlargement of the region highlighted by the white rectangle in (g), revealing the presence of a small number of micropores in SB. (i) SB network enclosing mineral grain, 624.87 m, shale, DLF. SB: solid bitumen.
OM was mainly present as either a pervasive network or wisps within the mineral matrix in the marine gas-window-maturity Wujiaping and Daye shales from the BY1 well (Figure 8). Similar to the OM in shales at the oil maturity stage, it filled the pore space between mineral grains (Figure 8e–g) and enclosed some mineral particles (Figure 8e–h). It was also mixed with clay minerals (Figure 8h,i). Secondary pores were densely distributed in the OM and showed spongy and irregular shapes (Figure 8b,c,f,h,i). The nanoscale secondary pores within OM typically exhibited diameters varying between several and several hundred nanometers. It should be noted that terrestrial OM showed curved and stripe-like shapes, and notably, it remained nonporous (Figure 8c,d).
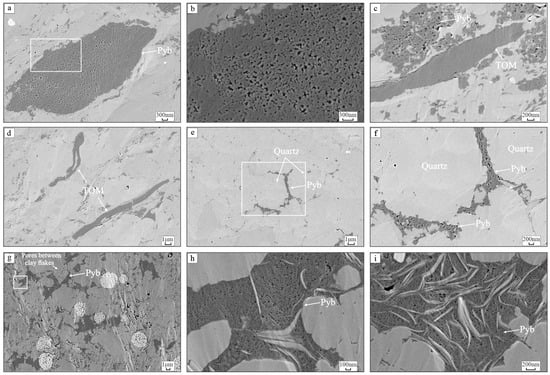
Figure 8.
FE-SEM images showing the morphology of OM in the WF and DYF from the BY1 well. (a) Pyb, sample BY-11, shale, WF. (b) An enlargement of the region highlighted by the white rectangle in (a), showing a large number of pores in Pyb. (c) Pyb and nonporous terrestrial OM, sample BY-11, shale, WF. (d) Nonporous terrestrial OM, sample BY-11, shale, WF. (e) Pyb filling the interparticle pore space within the quartz grains, sample BY-8, shale, WF. (f) An enlargement of the region highlighted by the white rectangle in (e), showing a large number of pores in Pyb. (g) Pervasive Pyb network filling the interparticle pore space within the mineral matrix, sample BY-2, shale, DYF. (h) An enlargement of the region highlighted by the white rectangle in (g), revealing a large number of pores in Pyb. (i) Pyb exhibiting a large number of pores, sample BY-2, shale, DYF. TOM: terrestrial OM; Pyb: pyrobitumen.
4.4. Pore Structure Characterization
The CO2 and N2 physisorption isotherms, along with the pore structure parameters obtained through gas adsorption, are presented in Figure 9 and Figure 10 and Table S2. The physisorption data of the samples from the GD1 and XY1 wells can be found in previous studies [30,52]. The CO2 physisorption isotherms for all examined samples exhibited characteristics closely resembling type I, indicating the presence of microscale pores (Figure 9). The carbonaceous mudstone in the CY well, exhibiting high TOC contents, showed the highest CO2 adsorption volume (AV). This observation implied a positive correlation between gas adsorption and terrestrial OM content (Figure 9a). The sandy mudstone, mudstone, and oil shale in the CY well exhibited high CO2 AVs (Figure 9a–c), but much lower than in the carbonaceous mudstones. The lacustrine samples from the K2qn1 in the HA well displayed a maximum CO2 AV similar to that of the lacustrine mudstone and oil shale in the CY well (Figure 9d–f).
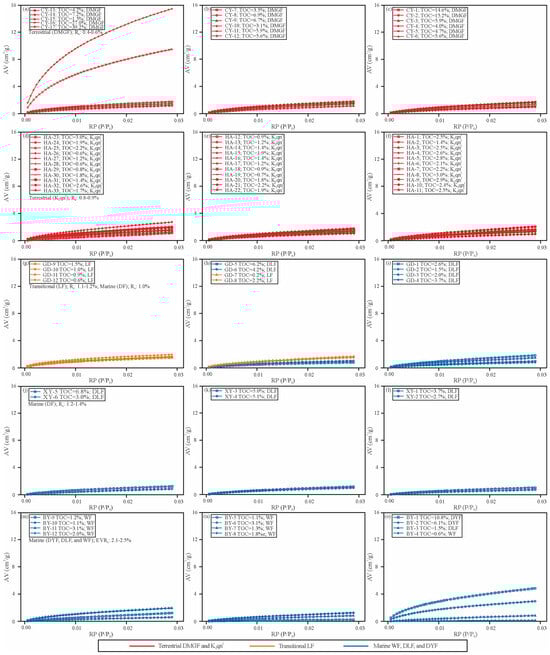
Figure 9.
CO2 adsorption isotherms for the terrestrial DMGF and K2qn1, transitional LF, and marine WF, DLF, and DYF. AV: adsorption volume; RP: relative pressure. (a–c) Well CY1; (d–f) Well HA; (g–i) Well GD1; (j–l) Well XY1; (m–o) Well BY1.
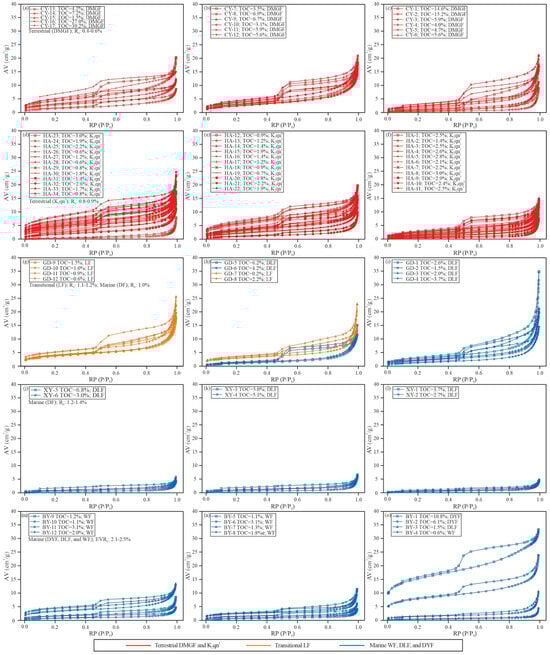
Figure 10.
N2 adsorption isotherms for the terrestrial DMGF and K2qn1, transitional LF, and marine WF, DLF, and DYF. AV: adsorption volume; RP: relative pressure. (a–c) Well CY1; (d–f) Well HA; (g–i) Well GD1; (j–l) Well XY1; (m–o) Well BY1.
The transitional LF in the GD1 well with relatively low TOC content generally showed a higher maximum CO2 AV than the overlying marine DLF (Figure 9g–i). In addition, for the marine Dalong shales, sample GD-1 (TOC = 2.6 wt%) displayed a higher CO2 AV than GD-5 with a higher TOC content of 6.2 wt% (Figure 9h,i). There was no significant disparity in CO2 AVs among the marine DLF from XY1 well (Figure 9j–l). Conversely, the marine samples from the BY1 well exhibited obvious differences in CO2 AVs (Figure 9m–o). Notably, the AVs of the marine Daye shales BY-1 (TOC = 10.8 wt%) and BY-2 (TOC = 6.1 wt%) exceeded those of the marine Wujiaping shales, which had lower TOC contents (Figure 9m–o), e.g., samples BY-9 (TOC = 1.2 wt%) and BY-10 (TOC = 1.1 wt%).
The N2 adsorption–desorption isotherms exhibited characteristics consistent with type II and type IV(a), implying the dominance of micro- and meso-pores characterized by heterogeneous planar surfaces [53]. Moreover, all the examined samples displayed a hysteresis loop characterized by a combined pattern of types H2 and H4 in the adsorption–desorption curves (Figure 10). This observation suggested the presence of ink-bottle- and slit-shaped pores.
The PVs are presented in Table S2. The carbonaceous mudstone in the CY1 well, deposited in a fluvial environment, was characterized by the highest micro-PVs of 0.0303 cm3/g and 0.0491 cm3/g, respectively. The recorded volumes were notably greater than those observed in the lacustrine mudstone (0.0035–0.0060 cm3/g) and oil shale (0.0044 cm3/g; Table S2) in the CY1 well. The terrestrial samples from the CY1 well were characterized by similar meso-PVs + macro-PVs (0.0130–0.0322 cm3/g; Table S2). The lacustrine samples from the K2qn1 in the HA well exhibited PVs (micro-PVs: 0.0035–0.0099 cm3/g; meso-PVs + macro-PVs: 0.0114–0.0329 cm3/g) similar to those observed in the CY1 well (Table S2). The volumes of micropores and mesopores + macropores within the transitional LF from the GD1 well ranged from 0.0046 cm3/g to 0.0062 cm3/g and 0.0204 cm3/g to 0.0354 cm3/g, respectively, which were close to those of the marine Dalong shales, varying from 0.0023 cm3/g to 0.0063 cm3/g and 0.0182 cm3/g to 0.0532 cm3/g, respectively. The DLF from the XY1 well showed the lowest meso-PVs + macro-PVs, varying between 0.0066 cm3/g and 0.0104 cm3/g. The Daye shales from the BY1 well were characterized by the highest micro-PVs and meso-PVs + macro-PVs among the analyzed marine samples, varying from 0.0102 cm3/g to 0.0162 cm3/g and 0.0292 cm3/g to 0.0357 cm3/g, respectively. In contrast, the marine Dalong and Wujiaping shales with lower TOC contents from the BY1 well exhibited lower micro-PVs and meso-PVs + macro-PVs (Table S2).
MICP intrusion and extrusion curves and associated parameters are presented in Figure 11 and Table S2. The MICP data of the samples from the GD1 and XY1 wells can be found in previous studies [30,52]. The terrestrial carbonaceous mudstone in the CY1 well showed the highest cumulative intruded mercury volume, while the lowest value was observed in the marine DLF from the XY1 well. Upon reaching an applied pressure of 350 MPa, the volume of intruded mercury experienced a swift escalation, possibly indicating well-developed nanoscale pores or artificial effects. The presence of few micron-sized pores was indicated by the low volume of intruded mercury at the applied pressure range of <1.0 MPa, although care had to be taken, because large pores connected via small pore throats will be classified as small pores. The analyzed samples from the CY1, HA, GD1, and CY1 wells showed an apparent hysteresis phenomenon between the intrusion and extrusion branches, suggesting the development of ink-bottle pores characterized by a narrow pore throat connected to the pore body (Figure 11a–j). The highest porosity values were obtained for the terrestrial carbonaceous mudstone from the CY1 well at 8.78% and 11.71%, respectively, whereas the marine DLF from the XY1 well exhibited the lowest porosity values of 0.31–0.51%. The examined samples were primarily characterized by nanoscale pores featuring average pore-throat diameters that spanned from 6.29 nm to 10.49 nm (Table S2). The analyzed samples displayed mercury entrapment ratios of 17–57% (avg. 31%). Overall, the plots depicting the relationship between PV percentage and pore-throat diameter indicated that all the examined samples were predominantly composed of pores with pore-throat diameters below 50 nm (Figure 12). Notably, within the examined samples, the lacustrine oil shale exhibited a significant proportion of pores characterized by micrometer-sized pore-throat diameters (Figure 12a), a feature likely attributed to the formation of pores linked to the occurrence of carbonate minerals (44 wt%).
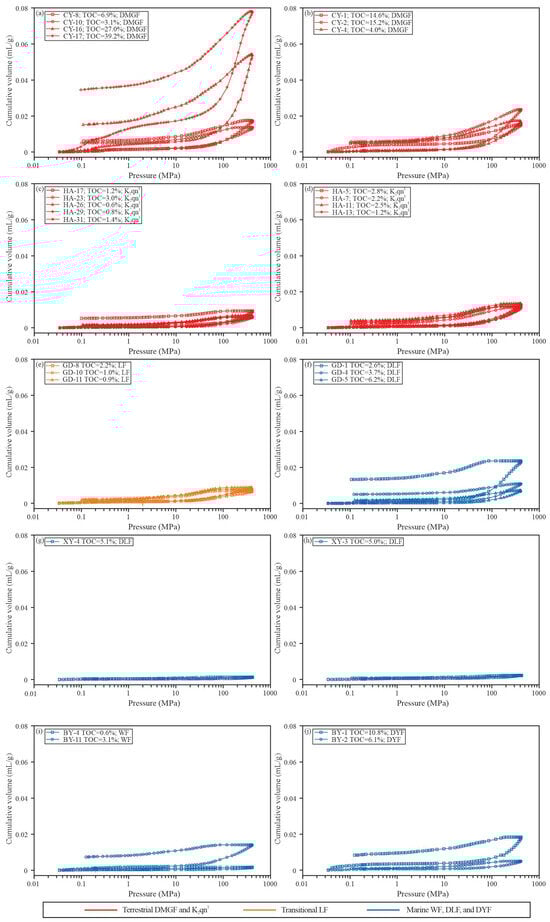
Figure 11.
The cumulative mercury intrusion and extrusion vs. intrusion pressure from MICP for the terrestrial DMGF and K2qn1, transitional LF, and marine WF, DLF, and DYF. (a,b) Well CY1; (c,d) Well HA; (e,f) Well GD1; (g,h) Well XY1; (i,j) Well BY1.
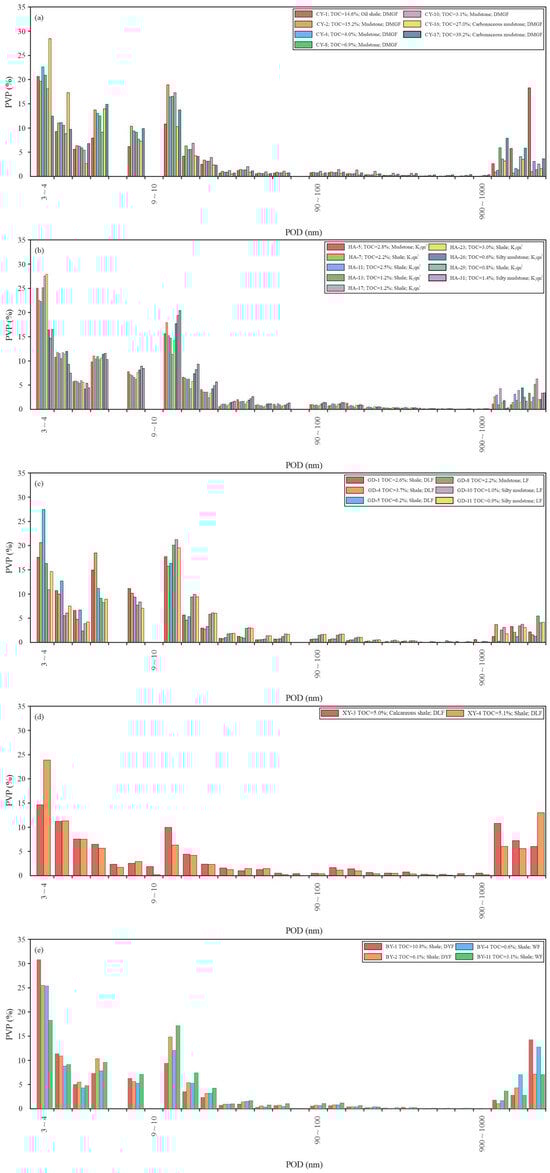
Figure 12.
Pore-throat size distribution calculated using the MICP for the terrestrial DMGF and K2qn1, transitional LF, and marine WF, DLF, and DYF. PVP: pore volume percentage; POD: pore-throat diameter. (a) Well CY1; (b) Well HA; (c) Well GD1; (d) Well XY1; (e) Well BY1.
4.5. Fractal Dimensions
Fractal analysis of the adsorption data was divided into two parts (D1 and D2) with high fitting quality, suggesting that the analyzed samples had obvious fractal characteristics (Figure S11). The D data for the samples from the GD1 well are available in a previous study (Table S3) [30]. D2 was larger than D1, suggesting that the pore structures exhibited greater complexity than the pore surfaces. For the terrestrial DMGF from the CY1 well, the D1 values were generally similar, varying between 2.2306 and 2.5554 (avg. 2.4479), whereas the D2 values had a wider distribution, ranging between 2.3840 and 2.8775 (avg. 2.6707; Table S3). The carbonaceous mudstone showed high D2 values (2.8259–2.8775, avg. 2.8517), indicative of a more complex pore structure. The marine DLF from the GD1 (D1: 2.3392–2.4804, avg. 2.4055; D2: 2.5415–2.6066, avg. 2.5579) and XY1 wells (D1: 2.2664–2.4797, avg. 2.3741; D2: 2.5073–2.7093, avg. 2.6127) was characterized by the lowest D values. In contrast, D1 and D2 showed high values in over-mature marine samples from the BY1 well, varying from 2.4880 to 2.6695 (avg. 2.5981) and 2.5788 to 2.8834 (avg. 2.7263), respectively. For example, the marine Daye shales with the highest TOC contents from the BY1 well were characterized by the highest D values. Specifically, the values of D1 and D2 spanned between 2.6632 and 2.6670 (with an average of 2.6651) and 2.8120 and 2.8834 (with an average of 2.8477), respectively (Table S3).
5. Discussion
5.1. OM Types in Deposits from Different Depositional Environments
The terrestrial DMGF from the CY1 well exhibited low thermal maturity and was characterized by different types of kerogen. The carbonaceous mudstone deposited in a fluvial environment contained predominantly macerals derived from terrestrial plant sources (Figure S6a–h). In contrast, the lacustrine mudstone and oil shale were dominated by oil-prone macerals, e.g., alginite (Figure S6i–l). Similarly, the lacustrine deposits from the K2qn1 in the HA well exhibited a high concentration of lamalginite, while terrestrially derived macerals constituted a minor fraction (Figure S7). In the transitional LF from the GD1 well, type III kerogen constituted the predominant OM (Figure S8a–c). In all of the above cases, primary macerals derived from plant precursors were present, while secondary OM was absent or rare. Littke et al. (1988), Rullkötter et al. (1988), and Liu et al. (2022) proposed that during thermal maturation, oil-prone kerogen, e.g., alginite and bituminite, transform into hydrocarbons, with the disappearance of these components typically occurring after reaching the peak oil window (Ro of approximately 0.8–1.0%) [9,54,55]. Analysis of thermal maturity parameters indicated that the marine sediments from wells GD1, XY1, and BY1 exhibited characteristics consistent with the SB stage (Figure 6, Figure 7 and Figure 8). Mastalerz et al. (2018) proposed a classification of SB into two distinct types: SB (pre-oil bitumen and post-oil bitumen) and Pyb, with differentiation based on their respective origins [10]. The term “pre-oil bitumen” refers to the early-generation products transformed from oil-prone kerogen. Typically, pre-oil bitumen is found within source rocks in an immature or early mature stage of thermal evolution. On the other hand, samples within the oil window maturity range contain “post-oil bitumen”, which becomes the dominant OM upon reaching the peak oil window, characterized by a Ro value ranging from 0.8% to 1.0% [8,9,10]. Pyb is formed through the secondary oil-to-gas or bitumen-to-gas cracking process, occurring at a maturity level above Ro 1.2%, and is the dominant OM in the source rocks with originally oil-prone kerogen within the dry gas window [9,10]. Post-oil SB and Pyb exhibit similar characteristics, displaying a void-filling structure and interconnected network [10]. Consequently, based on the measured Ro values in this study, the dominant OM in the marine DLF from the GD1 and XY1 wells was SB, while the dominant OM in the marine samples from the BY1 well was Pyb. According to Wood et al. (2018), the spotted/globular texture observed in the OM from the GD1 and XY1 well is attributed to early precipitation of asphalt floccules from an unstable precursor oil phase (Figure 6 and Figure 7) [56]. However, Reed (2017) suggested that the formation of the spotted/globular structure in OM is probably associated with the inhomogeneous transformation of kerogen, which may be affected by pre-existing heterogeneity within the kerogen [57].
5.2. Development and Evolution of OM-Hosted Pores
OM-hosted pores not only serve as a site for hydrocarbon storage through adsorption on their walls but also as a conduit for gas migration in OM-rich shales [7]. Investigations of the evolution of pores within OM in previous studies utilized both artificially and naturally matured shale [11,58,59]. According to the findings of Bernard et al. (2012), OM in shale samples within the immature and oil window maturity stages exhibited a nonporous nature [58]. In contrast, samples in the gas window maturity stage exhibited well-developed OM pores [52]. It was deduced that the development of nanoscale OM pores in gas-mature shale was a consequence of the generation of gaseous hydrocarbons through the secondary cracking of SB. Cardott et al. (2015) suggested that nanoscale secondary pores within OM emerge at an approximate thermal maturity of 0.9% Ro [7]. Liu et al. (2017) observed no pores in the alginite from the early mature New Albany shale (Ro 0.55%) [8]. However, in the samples reaching oil-window maturity (0.80% Ro), secondary pores within OM were observed in the alginite due to the expulsion of liquid and gaseous hydrocarbons. It is noteworthy that such pores were rarely observed in the SB from the oil-window-maturity samples studied here (Figure 6), but they were well developed in samples reaching gas-window maturity (Ro 1.42%; Figure 7). This observation is in accordance with previous observations on other shale systems and highlights the considerable impact of thermal maturity on the formation of secondary porosity.
In this study, vitrinite of terrigenous origin occurred mainly as massive phytoclasts without visible pores (Figure S6a,c,g), in accordance with published data (Giffin et al., 2013), while a small number of micrometer-scale primary pores within OM were observed in inertinite in immature or early mature carbonaceous mudstone from the CY1 well (Figure S6a,e) [33]. Owing to the gray-black color of all the OM in the SEM images, the exact recognition of macerals was difficult (Figure 4). However, considering the high proportions of vitrinite and inertinite in the optical microscopy images, it was evident that primary pores within OM were not well developed in the majority of terrigenous kerogen (Figure 4a–e). Nonetheless, a small number of organic particles showed the presence of nanometer-scale primary pores within OM (Figure 4b,d,e).
Vitrinite and inertinite also appeared as generally nonporous particles in the lacustrine K2qn1 and transitional LF within the oil window (Ro values of 0.8–0.9% and 1.1–1.2%; Figure 5e, Figures S7c and S8a–c). Similarly, terrigenous OM in the DLF from the XY1 well (Ro values of 1.2–1.4%; Figure S9c) and samples from the BY1 well (Ro values of 2.1–2.3%; Figure 8c,d and Figure S10e,f) was either nonporous or showed a small number of cellular pores. However, due to the limited resolution of the SEM or the potential blockage of micropores (less than 2 nm) by the carbon coating, some OM pores in the vitrinite may have remained undetected. Prinz et al. (2004) suggested that at elevated thermal maturity levels (Ro > 1.5%), the molecular orientation domains results in the formation of poorly defined isometric pores [60]. During the subsequent anthracitization process, these isometric pores underwent significant morphological modification, characterized by progressive flattening and statistical parallel orientation, primarily driven by the combined effects of overburden pressure and tectonic stress fields. This structural evolution significantly influenced the pore network architecture and, consequently, the gas storage and transport properties of high-rank coals. The microporosity clearly increased above about 1.5% Ro. The OM in the mudstone (Figure S6i–l) and oil shale (Figure S6o,p) from the CY well was dominated by the alginite (Figure S6i–p) and was also nonporous or pores were rare (Figure 4f–h). Similarly, the lamalginite in the K2qn1 from the HA well did not develop any detectable pores (Figure 5b,d,f). In these rocks, few kerogen particles, probably alginite, developed several primary pores within OM (Figure 4i,j).
The pervasive and interconnected SB network was typically nonporous in the DLF from the GD1 well (Ro 1.0%; Figure 6e–i). However, more secondary pores within OM were observed in the SB in the DLF from the XY1 well, such as in sample XY-3 (Ro 1.2%; Figure 7), probably owing to the generation of gaseous hydrocarbons through the cracking of the initial SB. Therefore, it is suggested that a maturity within the Ro range of 1.0–1.2% is the crucial period for the formation of initial secondary pores within OM in marine source rocks. This value is higher than the reported value by Han et al. (2017), who suggested the initial appearance of secondary pores within OM already at Ro of 0.8% [35]. The presence of densely distributed nanoscale secondary pores in the Pyb from the over-mature samples from the BY1 well (Figure 8) suggested that maturity, which directly affects the amounts of gaseous hydrocarbons generated, was indeed the primary factor controlling the formation of secondary pores within OM in the marine samples.
5.3. Effect of TOC Content and Mineral Composition on Pore Structure and Fractal Dimension
Previous studies generally indicated a positive association between TOC content and PV in over-mature marine shales in South China [3,4]. However, when considering terrestrial and transitional sediments, a more complex relationship between TOC content and PV has been reported, primarily attributed to variations in OM type and maturity [4,30,61]. The relationship between TOC content and PV is shown in Figure 13 and Figure S12. For the samples deposited in the lacustrine environment, TOC contents showed a weak negative or no obvious relationship with the PVs (Figure 13a and Figure S12c), which indicated that pores within the kerogen did not contribute much to the total porosity (Figure 4f–h and Figure 5). However, it is noteworthy that the two fluvial carbonaceous mudstones with the highest TOC contents of 27.0% and 39.2%, respectively, displayed remarkably elevated micro-PVs (Figure 13a and Table S2). This occurrence can likely be ascribed to the presence of a primary micropores within vitrinite particles at low maturities (Figure 4b–e). Such high primary microporosity has been documented before for coals of low rank [62]. For the transitional LF and the marine DLF from the GD1 well, the TOC contents had a negative correlation with the PVs (Figure 13b). This relationship resulted from the low microporosity of terrestrial OM at moderate maturity (about 1.2–1.4% Ro), thereby influencing the PV (Figure 6) [62]. Furthermore, the pervasive and interconnected SB network occupied a significant portion of the interparticle pore space between mineral particles (Figure 6e–i), leading to a further reduction in porosity. Similarly, the TOC contents of the DLF from the XY1 well exhibited no apparent relationship with the PVs (Figure S12g). While more secondary pores within OM were observed as a result of thermal evolution (Figure 7a–h), the newly generated pore space in the OM may not compensate for the reduction in porosity caused by the migrated SB, which blocked mineral-related pores (Figure 7i), as well as the mechanical compaction of interparticle pore space. In contrast, a notably strong positive correlation was observed between the TOC content and PVs in the over-mature samples deposited in the marine environment from the BY well (Figure 13d), which was attributed to the presence of well-developed secondary pores in the Pyb (Figure 8). Gas adsorption capacity and cumulative mercury volume were generally positively correlated with porosity, i.e., samples with larger pore volumes tended to exhibit a higher adsorption capacity and cumulative mercury volume (Figure 9, Figure 10 and Figure 11 and Table S2). Therefore, the previously discussed correlation between (i) TOC content and (ii) mineral composition with pore volume also extended to their relationship with gas adsorption capacity and cumulative mercury volume, i.e., with parameters commonly used in petroleum engineering.
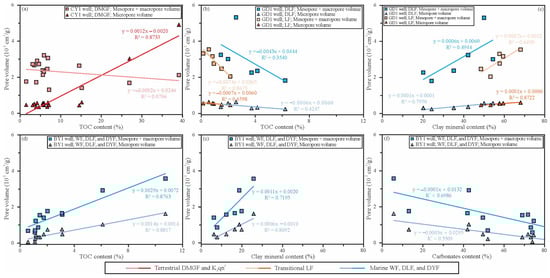
Figure 13.
Plots of PV vs. TOC, quartz, and clay mineral contents. (a) Well CY1; (b,c) Well GD1; (d–f) Well BY1.
As an effective parameter for describing the heterogeneity and complexity of the porosity in shales, D generally exhibited no apparent linear relationship with the TOC content of the terrestrial and transitional deposits, which was attributed to the poorly developed OM pores [63,64,65]. By contrast, there was an overall positive association between D and TOC content for the marine samples, owing to the more complex pore structure and surface of the examined samples exhibiting elevated TOC levels [66,67]. Yang et al. (2014) proposed that marine shales possessing elevated TOC content are characterized by a more complicated and heterogeneous crystallite structure, which contributes to their relatively high D [66]. Similarly, Jia et al. (2020) noted that the positive correlations between D (meso- and macro-pore) and TOC content resulted from the development of the complex and heterogeneous OM pores owing to the generation and expulsion of hydrocarbon during a relatively advanced stage of maturity [51]. In this study, the samples obtained from the CY1, HA, GD1, and XY1 wells commonly exhibited negative or inconspicuous associations between D and TOC content (Figure S13a,d,g and Figure 14a). In contrast, a positive correlation between D and TOC content was identified in the over-mature samples from the BY1 well (Figure 14d). This result is consistent with the SEM observations (Figure 8), which revealed the presence of well-developed OM pores. Furthermore, it aligns with the correlation observed between PV and the TOC content of the samples under analysis (Figure 13 and Figure S12).
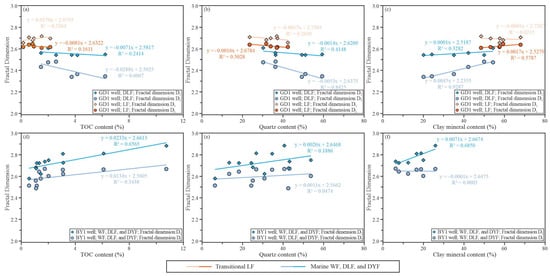
Figure 14.
Plots of D1 and D2 vs. TOC, quartz, and clay mineral contents. (a–c) Well GD1; (d–f) Well BY1.
5.4. Effect of Mineral Composition on Pore Structure
The primary forms of porosity within clay minerals and quartz, typically the dominant minerals in shales, are the interparticle pores [6,11,12]. However, the development of these pores is subject to the influence of diverse factors, including compaction, cementation, and SB blocking, during the diagenetic evolution [30,37,68]. Through the adaptation of a mathematical framework originally established in soil mechanics to basin modeling applications, Broichhausen et al. (2005) demonstrated that the mudstone compaction model effectively predicted porosities in shallow regions [68]. The model-derived porosities exhibited strong correlation with observed porosity values up to depths of approximately 2000 m. However, in deeply buried sediments, the significance of mechanical compaction diminished, while the influence of temperature-dependent processes became increasingly dominant. Consequently, the integration of mechanical and chemical compaction processes in shale systems facilitated more accurate reconstruction of porosity evolution in geological formations buried beyond 2000 m depth. The impact of mineral composition on petrophysical parameters can be quite variable [4,12,51]. Broadly, a positive relationship exists between quartz content and either PV or porosity in over-mature marine shale, which is attributed to the protective role of quartz with a rigid framework in maintaining the porosity [51,69,70]. Nonetheless, some studies have reported the absence of any discernible relationship between quartz content and the porosity in over-mature marine shales [4,12,70]. This phenomenon can be ascribed to the adverse effect of secondary quartz growth on the protection of interparticle pores [12]. In general, there is an inverse relationship between the clay mineral content and the porosity of marine shales, which possibly results from strong mechanical compaction of clay-rich shales [17,51]. However, studies have indicated even a positive correlation between clay mineral content and PV, specifically in transitional shales, owing to the contribution of pore space from certain clay minerals, e.g., illite/smectite mixed clay [3,4].
For immature to early mature terrestrial samples, neither quartz nor clay mineral content exhibited an apparent correlation with the PVs (Figure S12a,b). This result is likely attributed to the reduction in interparticle pore space resulting from compaction, cementation, and blocking of OM, as illustrated in Figure 4k–o. Similarly, these results were observed in the lacustrine K2qn1 from the HA well (Figure S12d,e). There was also no apparent correlation between quartz content and PV for the transitional LF (Figure S12f), which contradicted the findings of the majority of previous studies conducted on marine shales [51,69]. This result is possibly associated with the origin of the quartz from terrestrial detrital sources [14], as well as the preponderance of nonporous kerogen within the LF (Figure 6a–d). By contrast, a weak positive correlation was observed between the clay mineral content and PV (Figure 13c), which may be ascribed to the existence of pores associated with clay minerals (Figure 6a–d). For the marine DLF from the GD1 and XY1 wells, the quartz content was weakly negatively correlated with PV (Figure S12f,h). The result can be linked to the occupation of almost all the interparticle pore space associated with detrital quartz by the generated SB (Figure 6e–i and Figure 7). However, a small percentage of the pores between the clay flakes remained unobstructed from the blocking of the SB (Figure 6g,i), which may have contributed to the positive correlation between the clay mineral content and PV for the marine DLF within the oil window (Figure 13c and Figure S12i). For the over-mature marine samples from the BY1 well, there was no apparent correlation between the quartz content and PV, which was attributed to the reduction of the interparticle pore space due to mechanical compaction and cementation (Figure S12j). Similarly, Wei et al. (2020) stated that in the over-mature Lower Cambrian Shuijingtuo shales, the reduction of interparticle pore space can be attributed to the occupation of OM and the formation of authigenic quartz through precipitation, rather than being primarily caused by mechanical compaction [17]. Cao et al. (2021) also observed that the majority of original interparticle pores, which have a size in the range of hundreds of nanometers, were closed in the over-mature DLF due to both compaction and cementation by authigenic minerals [11]. Similar to the above-mentioned results for the samples from the GD1 and XY1 wells, there was a positive relationship between clay mineral content and PV for the samples from the BY1 well (Figure 13e). Carbonate cementation was likely responsible for the negative correlation between carbonate mineral content and PV (Figure 13f).
Furthermore, it is noteworthy that the porosity of the analyzed samples, as determined through MICP analysis, exhibited a decreasing trend from the CY1 to the XY1 wells with increasing Ro (Table S2), probably mainly owing to mechanical compaction. However, samples from the BY1 well, which experienced the greatest burial depth, exhibited higher porosity in comparison to samples from the GD1 and XY1 wells (Figure 11f,g and Table S2), which could be ascribed to the existence of the numerous secondary pores within OM, as discussed above (Figure 8). There were generally no apparent linear or negative correlations between quartz content and D for the analyzed samples in this study (Figure 14b,e and Figure S13a,f,h). However, the clay mineral content exhibited a positive correlation with D for the samples from the GD1 well, as well as with D2 for the samples from the BY1 well (Figure 14c,f). This result may be attributed to the increase in the heterogeneity of these source rocks caused by the existence of clay minerals with layer and flocculent structures, while brittle mineral grains were characterized by a relatively smooth surface [67,71,72].
5.5. Implications for OM Pore Formation Mechanism and Porosity Evolution Model
Depositional setting, compaction, and thermal maturity play crucial roles for the petrophysical characteristics of OM-rich shales based on comprehensive analyses of diverse samples from globally distributed OM-rich shales, including the Mississippi Barnett and Late Cretaceous Eagle Ford formations of the United States and the Early Silurian Longmaxi Formation in South China [11,12,17,37,73,74]. Furthermore, mineral composition significantly affects interparticle pore space and its evolution [4,30,75]. Based on the organic petrographic and petrophysical data obtained in this study and previous investigations on shale pore evolution using both artificially and naturally matured samples, a model depicting the evolution of OM and associated pores is proposed (Figure 15a,b).
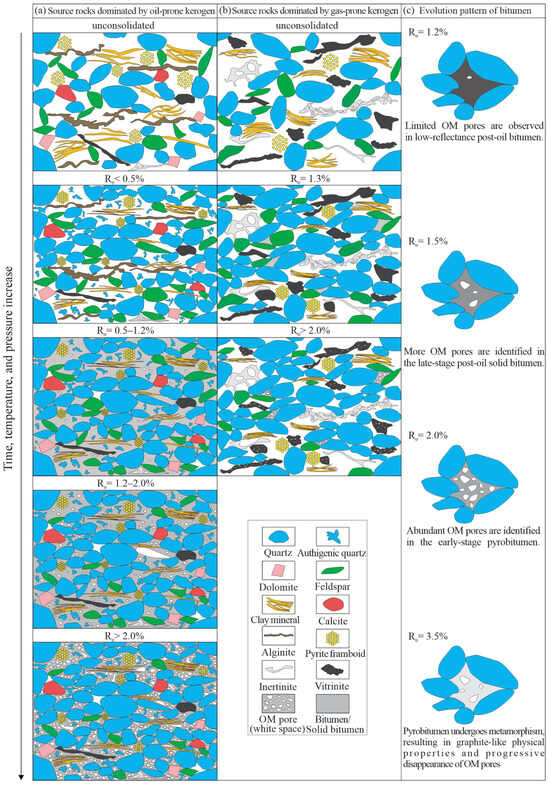
Figure 15.
(a,b) Generalized model illustrating the evolution of OM and the associated pores in source rocks with different kerogen types, spanning from the immature to the over-mature stage (modified after Misch et al., Wang et al., and Cao et al. [12,37,76]). (c) The principal thermal transformation pathway from post-oil SB to Pyb.
During early diagenesis, sediments, sediments composed of bioclasts, and minerals remained loosely packed. OM in marine and lacustrine deposits had a high proportion of the thermally unstable oil-prone kerogen, e.g., type I or type II kerogen, which contained a significant number of aliphatic chains [4,77]. On the contrary, transitional sediments were dominated by gas-prone kerogen containing less aliphatic chains, e.g., type III kerogen, which was enriched in mono- and poly-aromatic groups. Owing to the loose stack of mineral grains and kerogen debris, the total porosity of the deposits was the highest. However, the interparticle pores were susceptible to damage due to compaction and cementation as the burial depth increased [78].
During the following diagenetic stage (Ro 0.3–0.5%), sediments underwent semi-consolidation to consolidation, tightening intergranular contacts. In marine deposits, siliceous organisms, e.g., radiolarians and sponge spicules, transformed into quartz, while unstable carbonates (e.g., aragonite and high-Mg calcite) were replaced by more stable forms [37,79]. Mineral-related pores dominated during this period (Figure 15), but compaction and cementation caused rapid porosity loss [37].
During the middle diagenetic stage one (Ro: 0.5–1.2%), the majority of alginite was transformed to residues and SB—it no longer occurred as elongated algal bodies observed in the early mature sample [54]. Oil-prone kerogen was typically absent in samples with a maturity level greater than Ro 0.90% [55,80]. SB constituted the major type of OM in source rocks at and beyond the peak oil generation stage (about 0.9–1.0% Ro) owing to the conversion of oil-prone type I or type II kerogen to hydrocarbons within marine and lacustrine deposits [8,81]. The formation of secondary pores within OM may result in a small-scale increase in PV [8,37], but usually compaction and loss of PV is more pronounced [82]. During the late oil window (1.0% < Ro < 1.2%), although more OM pores were generated in the SB with increasing maturity (Figure 6), the increase in OM pore space was inadequate to overcome the loss in porosity resulting from further compaction and the precipitation of the SB, which blocked part of the interparticle pores (see Table S2). Terrestrial kerogen (vitrinite/inertinite) underwent minimal morphological changes, though primary microporosity was reduced.
During the middle diagenetic stage two (Ro of 1.2–2.0%), pore evolution became more complex. During the initial phase of this stage (1.2% < Ro < 1.3%), the porosity associated with minerals for the marine and lacustrine deposits was consistently negatively impacted by factors such as compaction, cementation, and the infilling of SB (Figure 7 and Figure 15a). With increasing maturity, the cracking of OM and the generation and expulsion of gas contributed to the creation of more secondary pores within OM (Figure 15c), which served to counterbalance the loss of mineral-related pore space caused by diagenesis [37]. In contrast, in sediments primarily composed of gas-prone kerogen, e.g., transitional deposits, the terrestrial-origin kerogen formed no meso- or macro-pores, but secondary micropores started to be generated (Figure 15b). This conclusion aligns with the morphological evolution patterns of terrestrial-derived macerals, such as vitrinite and inertinite, proposed by Giffin et al. (2013), Liu et al. (2017), and Misch et al. (2019) [8,33,76]. However, most vitrinite pores remained micropores, below SEM/MICP resolution [33].
During the late diagenesis stage (Ro > 2.0%), dry gas (methane) generation occurred (Figure 15). This process led to an augmentation in the gas content produced via SB cracking, finally contributing to the formation of numerous secondary pores in the Pyb (Figure 8 and Figure 15c). Extensive micropore networks developed in vitrinite macerals (Figure 15b) [60]. A maturity range of 2.5–3.2% was the peak period of the gas generation within Pyb, which resulted in an increase in PV [37]. However, at Ro > 3.5%, OM transformed into graphite, reducing OM porosity and PV (Figure 15c). In contrast, terrestrial kerogen-dominated sediments showed little porosity enhancement throughout thermal evolution, as vitrinite/inertinite morphology remained stable, with only primary cellular pores visible.
6. Conclusions
In this study, a series of naturally matured samples deposited in terrestrial, transitional, and marine environments with different maturities were studied and compared with respect to their porosity and pore size distribution, utilizing organic petrographical, petrophysical, and mineralogical analyses. Furthermore, this study investigated the formation mechanism and evolution characteristics of pores within OM and proposed a pore evolution model for organic-rich sediments, with special focus on important OM-rich sedimentary rocks from China. We conclude the following:
- (1)
- Most samples exhibited TOC contents ranging between 1% and 10%, except for two samples from a coaly section in the Jurassic of the Qaidam Basin, which reached up to 39%. Ro varied widely, from approximately 0.5% in the Jurassic of the Qaidam Basin to about 1.3% Ro on the Upper Permian Yangtze Platform, covering the entire oil window. Additionally, a section from the Yangtze Platform showed much higher thermal maturity, with Ro values reaching 2.5%, enabling a comparison with the thermal gas generation stage.
- (2)
- The pores within OM in the analyzed samples were classified into two categories: primary pores and secondary pores. Most terrestrial kerogen particles showed no or very little meso- and macro-pores, except for micrometer-sized pores with relatively rounded shapes in the inertinite within carbonaceous mudstones deposited in fluvial environments from the DMGF of the CY1 well. A certain number of nanometer-scale primary pores were also observed in some stripped kerogen particles. Primary pores were also visible in some inertinite particles for the transitional LF from the GD1 well. In the marine DLF from the GD1 and XY1 wells, the pore space between mineral grains was mostly occupied by a pervasive SB network. However, for the samples from the XY1 wells, more secondary pores with diameters of approximately 10–200 nm could be observed in the SB. In the marine samples from the BY1 well, secondary pores with spongy and irregular shapes were densely distributed within the Pyb network.
- (3)
- Terrestrial carbonaceous mudstones from the CY1 well exhibited the highest porosity (8.78–11.71%) and micropore volumes (0.0303–0.0491 cm3/g), whereas marine deposits from the DLF from the XY1 well showed the lowest porosity (0.31–0.51%) and mesopore + macropore volumes (0.0066–0.0104 cm3/g). Overall, the analyzed samples were predominantly composed of nanoscale pores with pore-throat diameters ranging from 6.29 nm to 10.49 nm, with mercury entrapment ratios varying between 17% and 57% (avg. 31%).
- (4)
- In the terrestrial DMGF from the CY1 well, the TOC contents and PVs of samples with low TOC content did not show a strong correlation, but two fluvial carbonaceous mudstones with the highest TOC contents exhibited very high micro-PVs due to the very high primary micropore volume of early mature vitrinite. Weak negative relationships between TOC contents and PVs were observed for samples at higher thermal maturity, resulting, on the one hand, from the rather low TOC contents and, on the other hand, from the loss of primary pores within the late oil window. Secondary pores started to form in SB, while on the other hand SB occupied and diminished the primary interparticle pore space between minerals at this stage. Conversely, in over-mature marine samples from the BY well, a notably strong positive correlation existed between the TOC contents and PVs, which was attributed to the presence of well-developed secondary pores in the Pyb. A large part of these pores were well visible as mesoporosity under SEM investigation. Maturity played a crucial role in shaping the pore structures, with over-mature marine samples generally exhibiting increased porosity. In contrast, terrestrial kerogen, which rarely formed solid bitumen, primarily developed micropores at high maturity. These micropores were undetectable via SEM, and no mesopore formation was observed.
- (5)
- In the deposits within the study area, porosity development was directly governed by compaction, solid bitumen emplacement, and maturity. As thermal maturity increased, molecular bonds underwent a transition from longer to shorter lengths as they broke down, resulting in a higher rate of gas generation. The expulsion of gas contributed to the formation of secondary pores within OM.
Supplementary Materials
The following supporting information can be downloaded at: https://www.mdpi.com/article/10.3390/jmse13030609/s1. Figure S1: Integrated stratigraphic columns of the target formation from well CY1, illustrating lithology, sedimentary facies, natural gamma-ray log, the thickness of the OM-rich deposits, and sampling locations; Figure S2: Integrated stratigraphic columns of the target formation from well HA, illustrating lithology, sedimentary facies, natural gamma-ray log, the thickness of the OM-rich deposits, and sampling locations; Figure S3: Integrated stratigraphic columns of the target formations from well GD1, illustrating lithology, sedimentary facies, natural gamma-ray log, the thickness of the OM-rich deposits, and sampling locations; Figure S4: Integrated stratigraphic columns of the target formation from well XY1, illustrating lithology, sedimentary facies, natural gamma-ray log, the thickness of the OM-rich deposits, and sampling locations; Figure S5: Integrated stratigraphic columns of the target formations from well BY1, illustrating lithology, sedimentary facies, natural gamma-ray log, the thickness of the OM-rich deposits, and sampling locations; Figure S6: Photomicrographs showing OM in the DMGF from the CY1 well under incident reflected white light (a,c,e,g,i,k,m,o) and in fluorescence mode (b,d,f,h,j,l,n,p). (a,b) Semifusinite and vitrinite, sample CY-17, carbonaceous mudstone, DMGF. (c,d) Vitrinite and cutinite, sample CY-17, carbonaceous mudstone, DMGF. (e,f) Fusinite, vitrinite, and sporinite, sample CY-17, carbonaceous mudstone, DMGF. (g,h) Vitrinite and sporinite, sample CY-17, carbonaceous mudstone, DMGF. (i,j) Lamalginite and inertinite, sample CY-2, mudstone, DMGF. (k,l) Lamalginite, vitrinite, and inertinite, sample CY-2, mudstone, DMGF. (m,n) Exsudatinite filling pore space within minerals, sample CY-1, oil shale, DMGF. (o,p) Lamalginite and exsudatinite, sample CY-1, oil shale, DMGF. V—vitrinite, I—inertinite, F—fusinite, Sf—semifusinite, L—lamalginite, Cu—cutinite, Sp—sporinite, Ex—exsudatinite, Py—pyrite framboid, and POP—primary OM pore; Figure S7: Photomicrographs showing OM in the K2qn1 from the HA well under incident reflected white light (a,c) and fluorescence mode (b,d). (a,b) Lamalginite and inertinite, sample HA-1, shale, K2qn1. (c,d) Lamalginite, vitrinite, and inertinite, sample HA-11, shale, K2qn1. L—lamalginite, V—vitrinite, and I—inertinite; Figure S8: Photomicrographs showing OM in the LF and DLF from the GD1 well under incident reflected white light. (a–c) Vitrinite and inertinite, sample GD-11, silty mudstone, LF. (d,e) SB, sample GD-6, shale, DLF. (f) SB and inertinite, sample GD-6, shale, DLF. SB—solid bitumen, V—vitrinite, I—inertinite, Py—pyrite framboid, and POP—primary OM pore; Figure S9: Photomicrographs showing OM in the DLF from the XY1 well under incident reflected white light. (a,b) SB, sample XY-2, shale, DLF. (c) Inertinite, sample XY-2, shale, DLF. SB—solid bitumen and I—inertinite; Figure S10: Photomicrographs showing OM in the WF and DYF from the BY1 well under incident reflected white light. (a,b) Pyb and inertinite, sample BY-8, shale, WF. (c,d) Pyb, sample BY-2, shale, DYF. (e,f) Pyb and inertinite, sample BY-2, shale, DYF. Pyb—pyrobitumen, I—inertinite, Py—pyrite framboid, and POP—primary OM pore; Figure S11: Plots of ln(V) vs. ln(ln(P0/P)) derived from N2 adsorption isotherms for the terrestrial DMGF and K2qn1, transitional LF, and marine WF, DLF, and DYF. (a–c) Well CY1; (d–f) Well HA; (g–i) Well GD1; (j–l) Well XY1; (m–o) Well BY1; Figure S12: Plots of PV vs. TOC, quartz, and clay mineral contents. (a,b) Well CY1; (c–e) Well HA; (f) Well GD1; (g–i) Well XY1; (j) Well BY1; Figure S13: Plots of D1 and D2 vs. TOC, quartz, and clay mineral contents. (a–c) Well CY1; (d–f) Well HA; (g–i) Well XY1; Table S1: TOC content, VRr, and mineral composition for the terrestrial DMGF and K2qn1, transitional LF, and marine WF, DLF, and DYF; Table S2: Pore structure parameters based on gas adsorption and MICP for the terrestrial DMGF and K2qn1, transitional LF, and marine WF, DLF, and DYF; Table S3: D for the terrestrial DMGF and K2qn1, transitional LF, and marine WF, DLF, and DYF.
Author Contributions
Conceptualization, Z.W. and S.H.; Methodology, Z.W. and Y.H.; Formal analysis, Z.W.; Investigation, Z.W.; Resources, S.H., G.Z., Z.H. and K.W.; Data curation, Z.W.; Writing—original draft, Z.W.; Writing—review & editing, R.L., S.Q., Y.H., S.H., G.Z., Z.H. and K.W.; Visualization, Z.W.; Supervision, S.H.; Funding acquisition, S.H. All authors have read and agreed to the published version of the manuscript.
Funding
The authors would like to thank the National Key R & D Program of China (No. 2017YFE0106300), the National Natural Science Foundation of China (Nos. 41830431 and 41690134), China National Science and Technology Major Projects (No. 2016ZX05034002-003), and China Geological Survey Project Grant (No. DD20190561-1) for financial assistance.
Data Availability Statement
The original contributions presented in this study are included in the article/Supplementary Materials. Further inquiries can be directed to the corresponding authors.
Acknowledgments
The China Scholarship Council (CSC) is acknowledged for supporting the first author of this paper financially. We also sincerely thank the two anonymous reviewers for their valuable and constructive comments on an earlier draft of this paper.
Conflicts of Interest
Kaiming Wang was employed by Sinopec East China Oil & Gas Company. The remaining authors declare that the research was conducted in the absence of any commercial or financial relationships that could be construed as a potential conflict of interest.
References
- Zhang, J.; Li, Z.; Wang, D.; Xu, L.; Li, Z.; Niu, J.; Chen, L.; Sun, Y.; Li, Q.; Yang, Z.; et al. Shale gas accumulation patterns in China. Nat. Gas Ind. B 2023, 10, 14–31. [Google Scholar] [CrossRef]
- Jiang, S.; Xu, Z.; Feng, Y.; Zhang, J.; Cai, D.; Chen, L.; Wu, Y.; Zhou, D.; Bao, S.; Long, S. Geologic characteristics of hydrocarbon-bearing marine, transitional and lacustrine shales in China. J. Asian Earth Sci. 2016, 115, 404–418. [Google Scholar] [CrossRef]
- Yang, C.; Zhang, J.C.; Tang, X.; Ding, H.H.; Zhao, Q.R.; Dang, W.; Chen, H.Y.; Su, Y.; Li, B.W.; Lu, D.F. Comparative study on micro-pore structure of marine, terrestrial, and transitional shales in key areas, China. Int. J. Coal Geol. 2017, 71, 76–92. [Google Scholar] [CrossRef]
- Li, X.; Jiang, Z.; Wang, S.; Wu, F.; Miao, Y.; Wang, X.; Wang, H.; Liu, X. Differences of marine and transitional shales in the case of dominant pore types and exploration strategies, in China. J. Nat. Gas Sci. Eng. 2022, 103, 104628. [Google Scholar] [CrossRef]
- Xie, W.; Tan, J.; Wang, W.; Schulz, H.M.; Liu, Z.; Kang, X.; Shahzad, A.; Jan, I.U. Middle Jurassic lacustrine source rocks controlled by an aridification event: A case study in the northern Qaidam Basin (NW China). Int. J. Coal Geol. 2021, 242, 103779. [Google Scholar] [CrossRef]
- Zhang, L.; Xiao, D.; Lu, S.; Jiang, S.; Chen, L.; Guo, T.; Wu, L. Pore development of the Lower Longmaxi shale in the southeastern Sichuan Basin and its adjacent areas: Insights from lithofacies identification and organic matter. Mar. Petrol. Geol. 2020, 122, 104662. [Google Scholar] [CrossRef]
- Cardott, B.J.; Landis, C.R.; Curtis, M.E. Post-oil solid bitumen network in the Woodford Shale, USA—A potential primary migration pathway. Int. J. Coal Geol. 2015, 139, 106–113. [Google Scholar] [CrossRef]
- Liu, B.; Schieber, J.; Mastalerz, M. Combined SEM and reflected light petrography of organic matter in the New Albany Shale (Devonian-Mississippian) in the Illinois Basin: A perspective on organic pore development with thermal maturation. Int. J. Coal Geol. 2017, 184, 57–72. [Google Scholar] [CrossRef]
- Liu, B.; Mastalerz, M.; Schieber, J. SEM petrography of dispersed organic matter in black shales: A review. Earth Sci. Rev. 2022, 224, 103874. [Google Scholar] [CrossRef]
- Mastalerz, M.; Drobniak, A.; Stankiewicz, A.B. Origin, properties, and implications of solid bitumen in source-rock reservoirs: A review. Int. J. Coal Geol. 2018, 195, 14–36. [Google Scholar] [CrossRef]
- Cao, T.; Deng, M.; Cao, Q.; Huang, Y.; Yu, Y.; Cao, X. Pore formation and evolution of organic-rich shale during the entire hydrocarbon generation process: Examination of artificially and naturally matured samples. J. Nat. Gas Sci. Eng. 2021, 93, 104020. [Google Scholar] [CrossRef]
- Cao, T.; Liu, H.; Pan, A.; Fu, Y.; Deng, M.; Cao, Q.; Huang, Y.; Yu, Y. Pore evolution in siliceous shales and its influence on shale gas-bearing capacity in eastern Sichuan-western Hubei, China. J. Petrol. Sci. Eng. 2022, 208, 109597. [Google Scholar] [CrossRef]
- Teng, J.; Mastalerz, M.; Liu, B. Petrographic and chemical structure characteristics of amorphous organic matter in marine black shales: Insights from Pennsylvanian and Devonian black shales in the Illinois Basin. Int. J. Coal Geol. 2021, 235, 103676. [Google Scholar] [CrossRef]
- Wu, Z.; He, S.; He, Z.; Li, X.; Zhai, G.; Huang, Z. Petrographical and geochemical characterization of the Upper Permian Longtan formation and Dalong Formation in the Lower Yangtze region, South China: Implications for provenance, paleoclimate, paleoenvironment and organic matter accumulation mechanisms. Mar. Petrol. Geol. 2022, 139, 105580. [Google Scholar] [CrossRef]
- Wu, Z.; Grohmann, S.; Littke, R.; Guo, T.; He, S.; Baniasad, A. Organic petrologic and geochemical characterization of petroleum source rocks in the Middle Jurassic Dameigou Formation, Qaidam Basin, northwestern China: Insights into paleo-depositional environment and organic matter accumulation. Int. J. Coal Geol. 2022, 259, 104038. [Google Scholar] [CrossRef]
- Jacob, H. Classification, structure, genesis and practical importance of natural solid oil bitumen (“migrabitumen”). Int. J. Coal Geol. 1989, 11, 65–79. [Google Scholar] [CrossRef]
- Wei, S.; He, S.; Pan, Z.; Zhai, G.; Dong, T.; Guo, X.; Yang, R.; Han, Y.; Yang, W. Characteristics and evolution of pyrobitumen-hosted pores of the overmature Lower Cambrian Shuijingtuo Shale in the south of Huangling anticline, Yichang area, China: Evidence from FE-SEM petrography. Mar. Petrol. Geol. 2020, 116, 104303. [Google Scholar] [CrossRef]
- Teng, J.; Liu, B.; Mastalerz, M.; Schieber, J. Origin of organic matter and organic pores in the overmature Ordovician-Silurian Wufeng-Longmaxi Shale of the Sichuan Basin, China. Int. J. Coal Geol. 2022, 253, 103970. [Google Scholar] [CrossRef]
- Yang, C.; Xiong, Y.; Zhang, J.; Liu, Y.; Chen, C. Comprehensive understanding of OM-hosted pores in transitional shale: A case study of Permian Longtan shale in South China based on organic petrographic analysis, gas adsorption, and X-ray diffraction measurements. Energy Fuels 2019, 33, 8055–8064. [Google Scholar] [CrossRef]
- Froidl, F.; Zieger, L.; Mahlstedt, N.; Littke, R. Comparison of single-and multi-ramp bulk kinetics for a natural maturity series of Westphalian coals: Implications for modelling petroleum generation. Int. J. Coal Geol. 2020, 219, 103378. [Google Scholar] [CrossRef]
- International Committee for Coal and Organic Petrology (ICCP). The new inertinite classification (ICCP system 1994). Fuel 2001, 80, 459–471. [Google Scholar] [CrossRef]
- Loucks, R.G.; Reed, R.M.; Ruppel, S.C.; Jarvie, D.M. Morphology, genesis, and distribution of nanometer-scale pores in siliceous mudstones of the Mississippian Barnett Shale. J. Sediment. Res. 2009, 79, 848–861. [Google Scholar] [CrossRef]
- Clarkson, C.R.; Freeman, M.; He, L.; Agamalian, M.; Melnichenko, Y.B.; Mastalerz, M.; Bustin, R.M.; Radliński, A.P.; Blach, T.P. Characterization of tight gas reservoir pore structure using USANS/SANS and gas adsorption analysis. Fuel 2012, 95, 371–385. [Google Scholar] [CrossRef]
- Mastalerz, M.; Schimmelmann, A.; Drobniak, A.; Chen, Y. Porosity of Devonian and Mississippian New Albany Shale across a maturation gradient: Insights from organic petrology, gas adsorption, and mercury intrusion. AAPG Bull. 2013, 97, 1621–1643. [Google Scholar] [CrossRef]
- Barré, L. Contribution of small-angle x-ray and neutron scattering (saxs and sans) to the characterization of natural nanomaterials. In X-Ray and Neutron Techniques for Nanomaterials Characterization; Springer: Berlin/Heidelberg, Germany, 2016; pp. 665–716. [Google Scholar]
- Chen, L.; Jiang, Z.; Liu, K.; Wang, P.; Gao, F.; Hu, T. Application of low-pressure gas adsorption to nanopore structure characterisation of organic-rich lower Cambrian shale in the Upper Yangtze Platform, South China. Aust. J. Earth Sci. 2017, 64, 653–665. [Google Scholar] [CrossRef]
- Peng, N.; He, S.; Hu, Q.; Zhang, B.; He, X.; Zhai, G.; He, C.; Yang, R. Organic nanopore structure and fractal characteristics of Wufeng and lower member of Longmaxi shales in southeastern Sichuan, China. Mar. Petrol. Geol. 2019, 103, 456–472. [Google Scholar] [CrossRef]
- Wei, S.; Hu, M.; He, S.; Shu, Y.; Dong, T.; He, Q.; Yang, W.; Cai, Q. Effects of Quartz Precipitation on the Abundance and Preservation of Organic Matter Pores in Cambrian Marine Shale in South China. J. Mar. Sci. Eng. 2023, 11, 1267. [Google Scholar] [CrossRef]
- Wang, Q.; Hu, Q.; Zhao, C.; Zhang, C.; Ilavsky, J.; Yu, L.; Ma, C.; Cheng, H.; Li, X.; Zhang, Y.; et al. Integrated experimental studies of pore structure and fluid uptake in the Bossier Shale in eastern Texas, USA. Fuel 2025, 384, 133926. [Google Scholar] [CrossRef]
- Wu, Z.; He, S.; Li, X.; Liu, X.; Zhai, G.; Huang, Z.; Yang, W. Comparative study on pore structure characteristics of ma-rine and transitional facies shales: A case study of the Upper Permian Longtan Formation and Dalong Formation in the Lower Yangtze area, south China. J. Petrol. Sci. Eng. 2022, 215, 110578. [Google Scholar] [CrossRef]
- Cao, T.T.; Deng, M.; Song, Z.G.; Luo, H.Y.; Hursthouse, A.S. Characteristics and controlling factors of pore structure of the Permian shale in southern Anhui province, East China. J. Nat. Gas Sci. Eng. 2018, 60, 228–245. [Google Scholar] [CrossRef]
- Liu, Y.; Xiong, Y.; Li, Y. Effects of oil expulsion and pressure on nanopore development in highly mature shale: Evidence from a pyrolysis study of the Eocene Maoming oil shale, south China. Mar. Petrol. Geol. 2017, 86, 526–536. [Google Scholar] [CrossRef]
- Giffin, S.; Littke, R.; Klaver, J.; Urai, J.L. Application of BIB–SEM technology to characterize macropore morphology in coal. Int. J. Coal Geol. 2013, 114, 85–95. [Google Scholar] [CrossRef]
- Curtis, M.E.; Cardott, B.J.; Sondergeld, C.H.; Rai, C.S. Development of organic porosity in the Woodford Shale with increasing thermal maturity. Int. J. Coal Geol. 2012, 103, 26–31. [Google Scholar] [CrossRef]
- Han, Y.; Horsfield, B.; Wirth, R.; Mahlstedt, N.; Bernard, S. Oil retention and porosity evolution in organic rich shales. AAPG Bull. 2017, 101, 807–827. [Google Scholar] [CrossRef]
- Wu, S.; Yang, Z.; Zhai, X.; Cui, J.; Bai, L.; Pan, S.; Cui, J. An experimental study of organic matter, minerals and porosity evolution in shales within high-temperature and high-pressure constraints. Mar. Petrol. Geol. 2019, 102, 377–390. [Google Scholar] [CrossRef]
- Wang, X.M.; Jiang, Z.X.; Jiang, S.; Chang, J.Q.; Li, X.H.; Wang, X.; Zhu, L. Pore evolution and formation mechanism of organic-rich shales in the whole process of hydrocarbon generation: Study of artificial and natural shale samples. Energy Fuels 2020, 34, 332–347. [Google Scholar] [CrossRef]
- Hanson, A.D.; Ritts, B.D.; Zinniker, D.; Moldowan, J.M.; Biffi, U. Upper Oligocene lacustrine source rocks and petroleum systems of the northern Qaidam basin, northwest China. AAPG Bull. 2001, 85, 601–619. [Google Scholar]
- Xia, W.; Zhang, N.; Yuan, X.; Fan, L.; Zhang, B. Cenozoic Qaidam basin, China: A stronger tectonic inversed, extensional rifted basin. AAPG Bull. 2001, 85, 715–736. [Google Scholar]
- Jian, X.; Guan, P.; Zhang, W.; Feng, F. Geochemistry of Mesozoic and Cenozoic sediments in the northern Qaidam basin, northeastern Tibetan Plateau: Implications for provenance and weathering. Chem. Geol. 2013, 360, 74–88. [Google Scholar] [CrossRef]
- Feng, Z.Q.; Jia, C.Z.; Xie, X.N.; Zhang, S.; Feng, Z.H.; Cross, T.A. Tectonostratigraphic units and stratigraphic sequences of the nonmarine Songliao Basin, Northeast China. Basin Res. 2010, 22, 79–95. [Google Scholar]
- Xu, Z.; Wang, Y.; Jiang, S.; Fang, C.; Liu, L.; Wu, K.; Luo, Q.; Li, X.; Chen, Y. Impact of input, preservation and dilution on organic matter enrichment in lacustrine rift basin: A case study of lacustrine shale in Dehui Depression of Songliao Basin, NE China. Mar. Petrol. Geol. 2022, 135, 105386. [Google Scholar] [CrossRef]
- Wu, Z.; Littke, R.; Baniasad, A.; Yang, Z.; Tang, Z.; Grohmann, S. Geochemistry and petrology of petroleum source rocks in the Upper Cretaceous Qingshankou Formation, Songliao Basin, NE China. Int. J. Coal Geol. 2023, 270, 104222. [Google Scholar] [CrossRef]
- Liu, X.; Ma, Z.; Yan, J. Sedimentary environments and controlling factors of hydrocarbon source rocks of the Late Permian Wujiaping Age in Yangtze area. J. Palaeogeogr. 2010, 12, 244–252, (In Chinese with English abstract). [Google Scholar]
- Kong, W. Research of Sedimentary Facies and Paleogeography of Middle and Later Permian in the Northern Margin of Middle and Upper Yangtze Region. Ph.D. Thesis, Hefei University of Technology, Hefei, China, 2011. (In Chinese with English abstract). [Google Scholar]
- Ding, J.; Sun, J.; Zhang, J.; Yang, X.; Shi, G.; Wang, R.; Huang, B.; Li, H. Elemental geochemical evidence for controlling factors and mechanisms of transitional organic matter accumulation: The upper Permian Longtan Formation black shale in the Lower Yangtze region, South China. J. Nat. Gas Sci. Eng. 2022, 98, 104385. [Google Scholar] [CrossRef]
- Gu, Z.; Peng, Y.; He, Y.; Hu, Z.; Zhai, Y. Geological conditions of Permian sea-land transitional facies shale gas in the Xiangzhong depression. Geol. China 2015, 42, 288–299, (In Chinese with English abstract). [Google Scholar]
- Zheng, B. Sedimentary Evolution of the Western Hubei Trough and Its Tectonic Implications—With Discussions on the Source of the PTB Bentonite in South China. Ph.D. Thesis, China University of Geosciences (Wuhan), Wuhan, China, 2019. (In Chinese with English abstract). [Google Scholar]
- Bertrand, R. Standardization of solid bitumen reflectance to vitrinite in some Paleozoic sequences of Canada. Energy Sources 1993, 15, 269–287. [Google Scholar] [CrossRef]
- Jaroniec, M. Evaluation of the fractal dimension from a single adsorption isotherm. Langmuir 1995, 11, 2316–2317. [Google Scholar] [CrossRef]
- Jia, A.; Hu, D.; He, S.; Guo, X.; Hou, Y.; Wang, T.; Yang, R. Variations of pore structure in organic-rich shales with different lithofacies from the Jiangdong block, Fuling shale gas field, SW China: Insights into gas storage and pore evolution. Energy Fuels 2020, 34, 12457–12475. [Google Scholar] [CrossRef]
- Wu, Z.R.; He, S.; Han, Y.J.; Zhai, G.Y.; He, X.P.; Zhou, Z. Effect of organic matter type and maturity on organic matter pore formation of transitional facies shales: A case study on upper permian Longtan and Dalong shales in Middle Yangtze region, China. J. Earth Sci. 2020, 31, 368–384. [Google Scholar] [CrossRef]
- Thommes, M.; Kaneko, K.; Neimark, A.V.; Olivier, J.P.; Reinoso, F.R.; Rouquerol, J.; Sing, K.S.W. Physisorption of gases, with special reference to the evaluation of surface area and pore size distribution (IUPAC Technical Report). Pure Appl. Chem. 2015, 87, 1051–1069. [Google Scholar] [CrossRef]
- Littke, R.; Baker, D.R.; Leythaeuser, D. Microscopic and sedimentologic evidence for the generation and migration of hydrocarbons in Toarcian source rocks of different maturities. Org. Geochem. 1988, 13, 549–559. [Google Scholar] [CrossRef]
- Rullkötter, J.; Leythaeuser, D.; Horsfield, B.; Littke, R.; Mann, U.; Müller, P.J.; Radke, M.; Schaefer, R.G.; Schenk, H.-J.; Schwochau, K.; et al. Organic matter maturation under the influence of a deep intrusive heat source: A natural experiment for quantitation of hydrocarbon generation and expulsion from a petroleum source rock (Toarcian shale, northern Germany). Org. Geochem. 1988, 13, 847–856. [Google Scholar] [CrossRef]
- Wood, J.M.; Sanei, H.; Haeri-Ardakani, O.; Curtis, M.E.; Akai, T.; Currie, C. Solid bitumen in the Montney Formation: Diagnostic petrographic characteristics and significance for hydrocarbon migration. Int. J. Coal Geol. 2018, 198, 48–62. [Google Scholar] [CrossRef]
- Reed, R.M. Organic-matter-pores: New findings from lower-thermal-maturity mudrocks. GCAGS J. 2017, 6, 99–110. [Google Scholar]
- Bernard, S.; Wirth, R.; Schreiber, A.; Schulz, H.-M.; Horsfield, B. Formation of nanoporous pyrobitumen residues during maturation of the Barnett Shale (Fort Worth Basin). Int. J. Coal Geol. 2012, 103, 3–11. [Google Scholar] [CrossRef]
- Shi, M.; Yu, B.; Zhang, J.; Huang, H.; Yuan, Y.; Li, B. Evolution of organic pores in marine shales undergoing thermocompression: A simulation experiment using hydrocarbon generation and expulsion. J. Nat. Gas Sci. Eng. 2018, 59, 406–413. [Google Scholar] [CrossRef]
- Prinz, D.; Pyckhout-Hintzen, W.; Littke, R. Development of the meso-and macroporous structure of coals with rank as analysed with small angle neutron scattering and adsorption experiments. Fuel 2004, 83, 547–556. [Google Scholar] [CrossRef]
- Zhao, R.; Xue, H.; Lu, S.; Li, J.; Tian, S.; Dong, Z. Multi-scale pore structure characterization of lacustrine shale and its coupling relationship with material composition: An integrated study of multiple experiments. Mar. Petrol. Geol. 2022, 140, 105648. [Google Scholar] [CrossRef]
- Littke, R.; Leythaeuser, D. Migration of oil and gas in coals. AAPG Spec. Vol. 1993, 180, 219–236. [Google Scholar]
- Wang, M.; Xue, H.; Tian, S.; Wilkins, R.W.; Wang, Z. Fractal characteristics of Upper Cretaceous lacustrine shale from the Songliao Basin, NE China. Mar. Pet. Geol. 2015, 67, 144–153. [Google Scholar] [CrossRef]
- Li, Y.; Wang, Z.; Pan, Z.; Niu, X.; Yu, Y.; Meng, S. Pore structure and its fractal dimensions of transitional shale: A cross-section from east margin of the Ordos Basin, China. Fuel 2019, 241, 417–431. [Google Scholar] [CrossRef]
- Han, H.; Guo, C.; Zhong, N.N.; Pang, P.; Gao, Y. A study on fractal characteristics of lacustrine shales of Qingshankou Formation in the Songliao Basin, northeast China using nitrogen adsorption and mercury injection methods. J. Petrol. Sci. Eng. 2020, 193, 107378. [Google Scholar] [CrossRef]
- Yang, F.; Ning, Z.; Liu, H. Fractal characteristics of shales from a shale gas reservoir in the Sichuan Basin, China. Fuel 2014, 115, 378–384. [Google Scholar] [CrossRef]
- Li, A.; Ding, W.; He, J.; Dai, P.; Yin, S.; Xie, F. Investigation of pore structure and fractal characteristics of organic-rich shale reservoirs: A case study of Lower Cambrian Qiongzhusi formation in Malong block of eastern Yunnan Province, South China. Mar. Petrol. Geol. 2016, 70, 46–57. [Google Scholar] [CrossRef]
- Broichhausen, H.; Littke, R.; Hantschel, T. Mudstone compaction and its influence on overpressure generation, elucidated by a 3D case study in the North Sea. Int. J. Earth Sci. 2005, 94, 956–978. [Google Scholar] [CrossRef]
- Gou, Q.; Xu, S.; Hao, F.; Shu, Z.; He, S.; Wu, Z. Differences in the nanopore structure of organic-rich shales with distinct sedimentary environments and mineral compositions. Energy Fuels 2021, 35, 16562–16577. [Google Scholar] [CrossRef]
- Gou, Q.; Xu, S.; Hao, F.; Lu, Y.; Shu, Z.; Lu, Y.; Shu, Z.; Lu, Y.; Wang, Z.; Wang, Y. Evaluation of the exploration prospect and risk of marine gas shale, southern China: A case study of Wufeng-Longmaxi shales in the Jiaoshiba area and Niutitang shales in the Cen’gong area. GSA Bull. 2022, 134, 1585–1602. [Google Scholar] [CrossRef]
- Ji, W.; Song, Y.; Jiang, Z.; Meng, M.; Liu, Q.; Chen, L.; Wang, P.; Gao, F.; Huang, H. Fractal characteristics of nano-pores in the lower Silurian Longmaxi shales from the upper Yangtze platform, south China. Mar. Petrol. Geol. 2016, 78, 88–98. [Google Scholar] [CrossRef]
- Zhang, M.; Fu, X. Influence of reservoir properties on the adsorption capacity and fractal features of shales from Qinshui coalfield. J. Petrol. Sci. Eng. 2019, 177, 650–662. [Google Scholar] [CrossRef]
- Hu, Q.H.; Liu, X.G.; Gao, Z.Y.; Liu, S.G.; Zhou, W.; Hu, W.X. Pore structure and tracer migration behavior of typical American and Chinese shales. Pet. Sci. 2015, 12, 651–663. [Google Scholar] [CrossRef]
- Kibria, M.G.; Hu, Q.; Liu, H.; Zhang, Y.; Kang, J. Pore structure, wettability, and spontaneous imbibition of Woodford shale, Permian Basin, West Texas. Mar. Petrol. Geol. 2018, 91, 735–748. [Google Scholar] [CrossRef]
- Yang, Y.; Aplin, A.C. A permeability–porosity relationship for mudstones. Mar. Petrol. Geol. 2010, 27, 1692–1697. [Google Scholar] [CrossRef]
- Misch, D.; Gross, D.; Hawranek, G.; Horsfield, B.; Klaver, J.; Mendez-Martin, F.; Urai, J.L.; Vranjes-Wessely, S.; Sachsenhofer, R.F.; Schmatz, J.; et al. Solid bitumen in shales: Petrographic characteristics and implications for reservoir characterization. Int. J. Coal Geol. 2019, 205, 14–31. [Google Scholar] [CrossRef]
- Ungerer, P.; Collell, J.; Yiannourakou, M. Molecular modeling of the volumetric and thermodynamic properties of kerogen: Influence of organic type and maturity. Energy Fuel. 2015, 29, 91–105. [Google Scholar] [CrossRef]
- Milliken, K.L.; Ko, L.T.; Pommer, M.; Marsaglia, K.M. Petrography of eastern Mediterranean Sapropels: Analogue data for assessing organic matter in oil and gas shales. J. Sediment. Res. 2014, 84, 961–974. [Google Scholar] [CrossRef]
- Zhao, J.; Jin, Z.; Jin, Z.; Hu, Q.; Hu, Z.; Du, W.; Yan, C.; Geng, Y. Mineral types and organic matters of the Ordovician-SilurianWufeng and Longmaxi Shale in the Sichuan Basin, China: Implications for pore systems, diagenetic pathways, and reservoir quality in fine-grained sedimentary rocks. Mar. Pet. Geol. 2017, 86, 655–674. [Google Scholar] [CrossRef]
- Liu, B.; Wang, Y.; Tian, S.; Guo, Y.; Wang, L.; Yasin, Q.; Yang, J. Impact of thermal maturity on the diagenesis and porosity of lacustrine oil-prone shales: Insights from natural shale samples with thermal maturation in the oil generation window. Int. J. Coal Geol. 2022, 261, 104079. [Google Scholar] [CrossRef]
- Hackley, P.C.; Cardott, B.J. Application of organic petrography in North American shale petroleum systems: A review. Int. J. Coal Geol. 2016, 163, 8–51. [Google Scholar] [CrossRef]
- Ghanizadeh, A.; Amann-Hildenbrand, A.; Gasparik, M.; Gensterblum, Y.; Krooss, B.M.; Littke, R. Experimental study of fluid transport processes in the matrix system of the European organic-rich shales: II. Posidonia Shale (Lower Toarcian, northern Germany). Int. J. Coal Geol. 2014, 123, 20–33. [Google Scholar] [CrossRef]
Disclaimer/Publisher’s Note: The statements, opinions and data contained in all publications are solely those of the individual author(s) and contributor(s) and not of MDPI and/or the editor(s). MDPI and/or the editor(s) disclaim responsibility for any injury to people or property resulting from any ideas, methods, instructions or products referred to in the content. |
© 2025 by the authors. Licensee MDPI, Basel, Switzerland. This article is an open access article distributed under the terms and conditions of the Creative Commons Attribution (CC BY) license (https://creativecommons.org/licenses/by/4.0/).