Article

Fatigue Reliability Analysis of Offshore Wind Turbines Under Combined Wind–Wave Excitation via Direct Probability Integral Method

1
Center for Numerical Simulation Software in Engineering and Sciences, College of Mechanics and Engineering Science, Hohai University, Nanjing 211100, China
2
Institute of Science and Technology Research, China Three Gorges Corporation, Beijing 210098, China
3
Department of Structural Engineering, Cairo University, Giza 12613, Egypt
*
Authors to whom correspondence should be addressed.
J. Mar. Sci. Eng. 2025, 13(3), 506; https://doi.org/10.3390/jmse13030506
Submission received: 13 February 2025 / Revised: 27 February 2025 / Accepted: 3 March 2025 / Published: 5 March 2025
(This article belongs to the Section Ocean Engineering)

Abstract

:
As offshore wind turbines develop into deepwater operations, accurately quantifying the impact of stochastic excitation in complex sea environments on offshore wind turbines and conducting structural fatigue reliability analysis has become challenging. In this paper, based on long-term wind–wave reanalysis data from the South China Sea, a novel direct probability integral method (DPIM) is developed for the stochastic response and fatigue reliability analysis of the key components for the floating offshore wind turbine structures, under combined wind–wave excitation. A 5 MW floating offshore wind turbine is considered as the research object, and a comprehensive analysis of the wind turbine system is performed to assess the short-term fatigue damage at the tower base and blade root. The proposed method’s accuracy and efficiency are validated by comparing the results to those obtained from Monte Carlo simulations (MCS) and a subset simulation (SSM). Additionally, a sensitivity analysis is conducted to evaluate the impact of different environmental parameters on fatigue damage, providing valuable insights for the design and operation of FOWTs in varying sea conditions. Furthermore, the results indicate that the fatigue life of floating offshore wind turbine (FOWT) structures under combined wind–wave excitation meets the design requirements. Notably, the fatigue reliability of the wind turbine under aligned wind–wave conditions is lower compared to misaligned wind–wave conditions.

1. Introduction

Offshore wind energy, with its vast resource reserves and flexible environmental constraints, has become an important development direction for the future of wind energy. However, as offshore wind power projects gradually advance into deepwater operations, the wind turbines will be subjected to complex, variable, and alternating random loads, which can easily induce cumulative fatigue damage, and subsequently threaten the overall safety and stability of the structure [1]. Therefore, conducting a fatigue reliability analysis of the offshore wind turbines under stochastic environmental excitation is of significant importance.
In recent years, researchers have conducted extensive studies on the reliability analysis of offshore wind turbine (OWT) units. For instance, Colone [2] examined the impact of turbulence and wave loads on the fatigue reliability of OWT piles, emphasizing the need for accurate environmental modeling to improve cost-effective and reliable monopile design. Wilkie [3] developed a computational framework using Gaussian process regression to effectively assess the fatigue reliability of OWT substructures, providing practical insights for design and reliability in European waters. Fu [4] investigated the fatigue reliability of the wind turbine tower flange and bolt under random wind loads, proposing a probabilistic fatigue assessment method rooted in probability density evolution, for an accurate and quantitative prediction of structural reliability under fluctuating conditions. Zhao [5] proposed a fatigue reliability analysis method using a surrogate model, C-vine copula, and MCS, which was utilized to evaluate fatigue reliability at three key locations on a FOWT. Castro [6] experimentally demonstrates an optimized method for testing blades under cyclic loading, achieving material-based damage targets with an improved accuracy and a reduced testing time, compared to standard fatigue tests. Luczak [7] systematically explores how different test setups affect the modal properties of blades, providing a baseline model for damage detection methods based on a modal analysis. Although extensive studies have been conducted on the reliability analysis of wind turbines subjected to combined wind and wave loads, most studies have primarily concentrated on the effects of wind and wave loads, often neglecting the significant impact of wind–wave misalignment [8,9]. Furthermore, many previous studies have classified operating conditions into the following three main categories based on wind speed: below-rated, rated, and above-rated, without the consideration of using distribution models to accurately simulate the environmental conditions of coupled wind and wave loads.
Currently, the main approaches for the structural reliability analysis include the first-order second-moment method (FORM), second-order second-moment methods (SORM), random sampling simulation methods [10], and probability density evolution methods [11,12]. FORM and SORM are commonly used for a static analysis and are not suitable for the nonlinear dynamic systems of wind turbines. Random sampling simulation methods, like MCS, SSM, and importance sampling, yield accurate results but come with high computational costs. The generalized density evolution equation (GDEE) was established by Li [11] using the principle of probability conservation, leading to the development of the probability density evolution method. However, analytical solutions for GDEE are challenging for most engineering problems. To resolve this problem, this study extends a novel direct probability integral method (DPIM) [13,14] for the stochastic response analysis of wind turbine structures subjected to stochastic environmental excitation, aiming to achieve an efficient fatigue reliability analysis of FOWTs under combined wind–wave excitation.
This study focuses on the 5 MW spar wind turbine designed by the National Renewable Energy Laboratory (NREL) [15]. An efficient assessment method for the fatigue reliability analysis of the key structures for FOWT, with multiple uncertainty factors, is further proposed based on the DPIM. This model incorporates the long-term joint probability distribution of wind and wave conditions relevant to the specific maritime area for a time-domain analysis. Stress spectra are extracted from the blade root and the support structure at crucial places using the rainflow counting method. Then, the number of cycles is computed via the S–N curves [16], and the Palmgren–Miner’s cumulative fatigue damage theory [17] is applied to estimate the short-term fatigue damage values. Finally, the proposed method makes it possible to use the DPIM for the fatigue reliability study of FOWT structures.
The following is how this document is structured: The FOWT model and the fatigue analysis technique via DPIM, employed in this study, are described in detail in Section 2. Section 3 evaluates the performance of the suggested approach. Additionally, the influence of different wind–wave conditions on stochastic response, fatigue damage, and fatigue reliability is further investigated. Lastly, Section 4 emphasizes the main conclusions and insights from this research.

2. FOWT Model and Fatigue Reliability Analysis Approach

2.1. Numerical Model of FOWT

Fatigue analysis is performed on a NREL 5 MW OWT, whose platform is the OC3-Hywind spar-buoy [18] (Figure 1). Table 1 provides a summary of the wind turbine’s main characteristics. The turbine stands 90 m tall, with the tower top and base at 87.6 m and 10 m above the SWL, respectively. The platform is anchored by three symmetrically positioned catenary mooring lines, one of which is placed along the negative X-axis.
The dynamic reactions of crucial FOWT components under various environmental circumstances are assessed in this study using OpenFAST v3.5.1 [19], a coupled areo-hydro-servo-elastic tool developed and validated by NREL. TurbSim-generated turbulent wind data are processed by the AeroDyn module, which uses the Blade Element Momentum (BEM) theory to compute the aerodynamic loads on blades. The turbulent wind field is simulated using the Kaimal spectrum, with a reference turbulence intensity of 0.12. Potential flow theory is used to compute the wind loads on the supporting structure, while both potential theory and Morison’s equation are used to determine hydrodynamic loads. The drag element in Morison’s equation is taken into consideration in order to account for the viscous drag forces. Since the first-order force is greater than second-order wave forces, the latter are disregarded [20]. Kane’s dynamics are used to construct the motion equation for FOWTs.

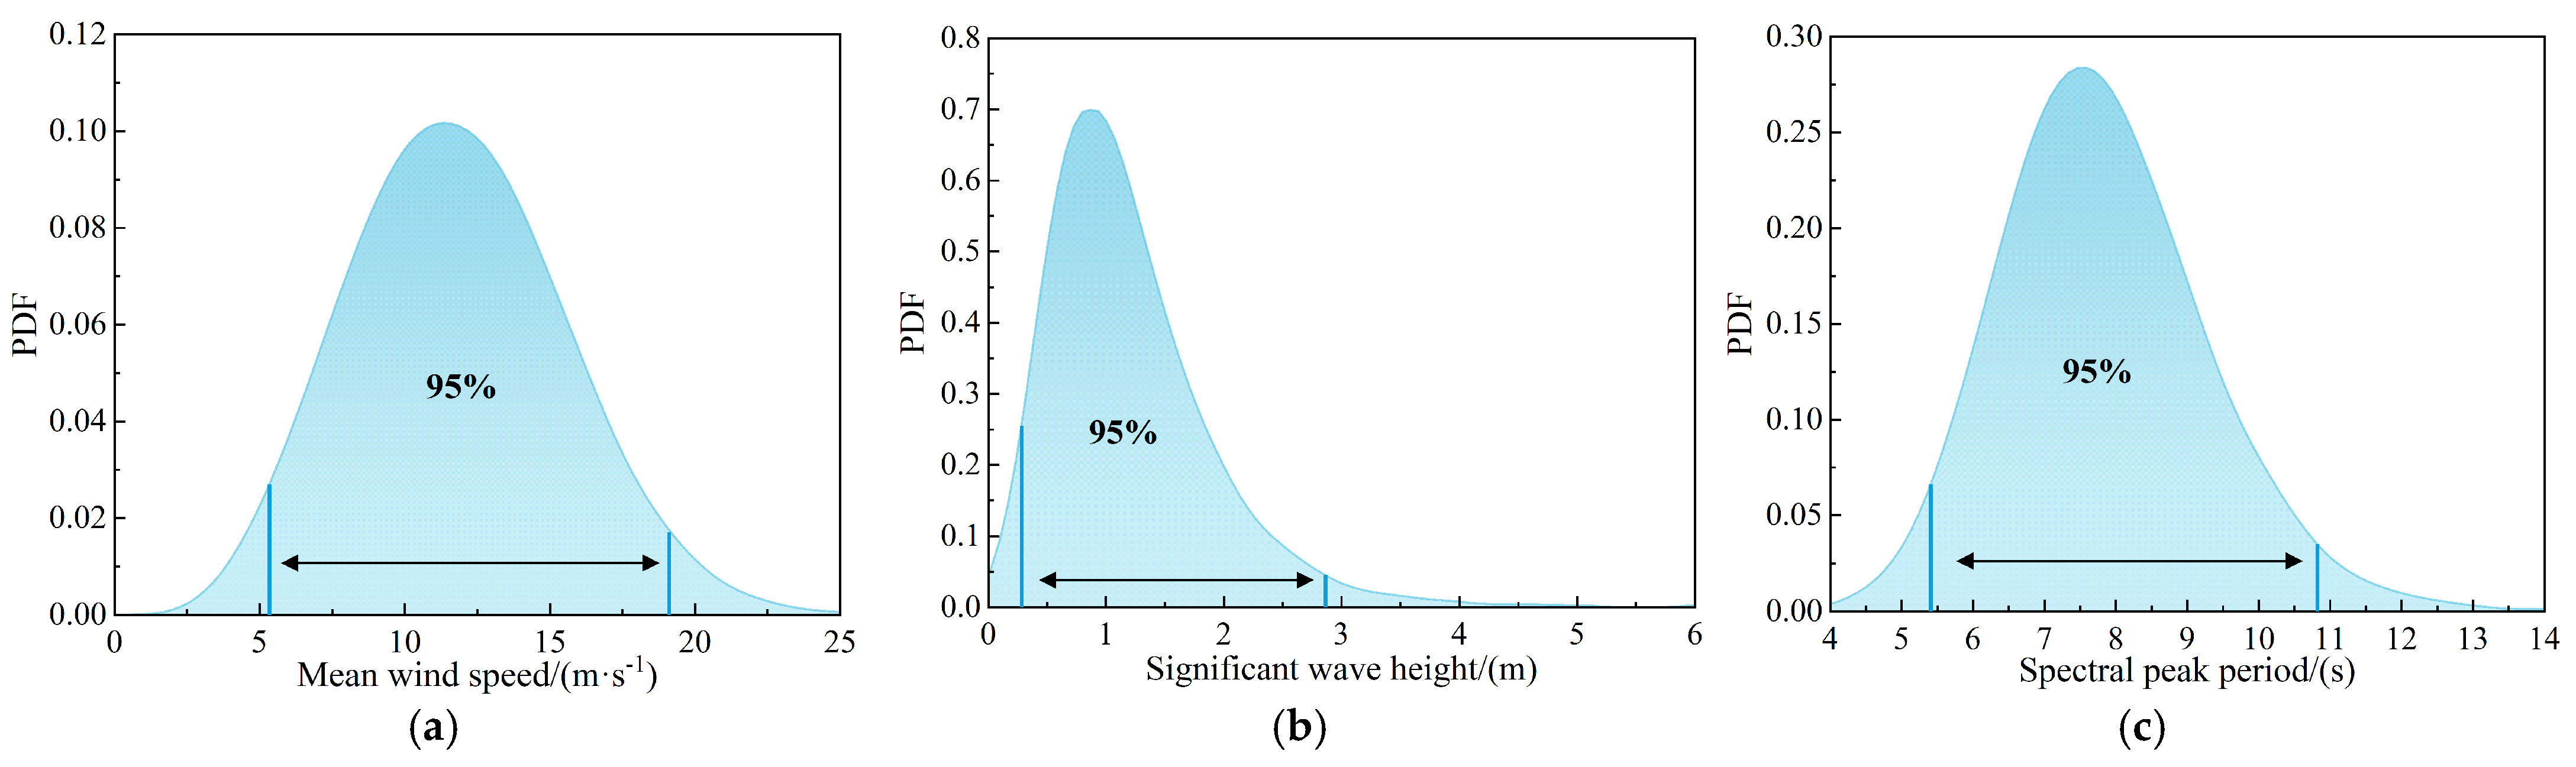
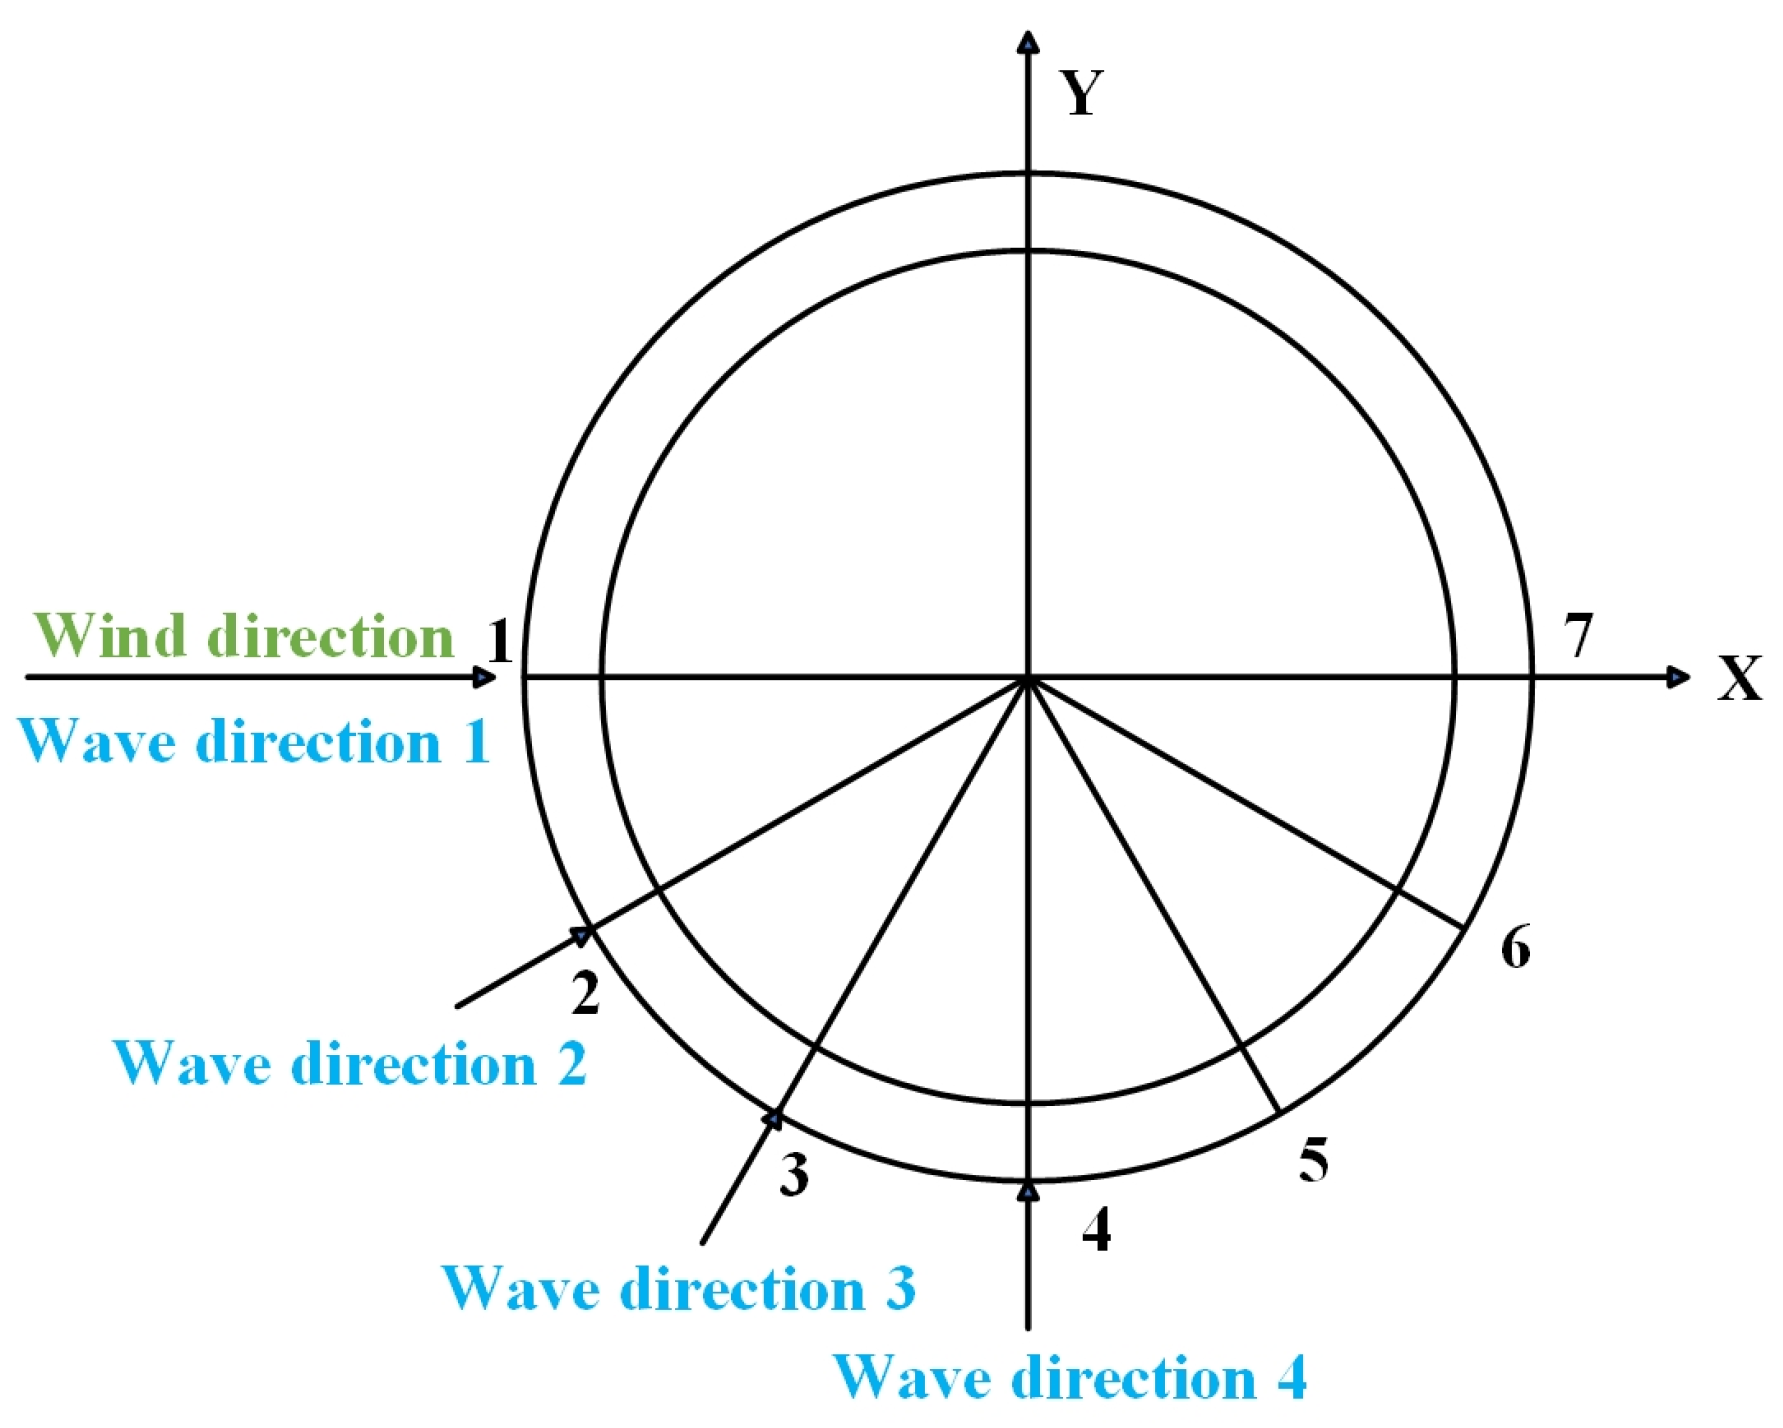
2.2. Probabilistic Modeling of Long-Term Joint Wind and Wave Loads

FOWTs operate in variable natural environments for extended periods, facing multiple random environmental factors primarily driven by wind and wave loads. Following IEC 61400-3 [21], this study selects the following three environmental parameters affecting wind and wave loads: mean wind speed ( V W ), significant wave height ( H S ), and spectral peak period ( T P ). V W can define characteristics of wind states, the others can determine the characteristics of sea states. Moreover, this study focuses primarily on mechanical factors for the wind turbine, thus some uncertainty factors in the environmental conditions, such as atmospheric and electrochemical corrosion, are not considered in the proposed model. The study aligns the wind direction with the positive X-axis and varies the incoming wave angle to investigate the effects of different wind and wave directions. The wave angles are set to 0°, 30°, 60°, and 90°, respectively.
The reanalysis data from the South China Sea station [22] are applied, and then the environmental data for this sea area are simulated based on the conjoint distribution model for combined wind–wave excitation, proposed by Song et al. [23]. Table 2 displays the probability distribution models for the environmental random factors. To determine if the model appropriately captures the variables’ marginal distribution, the Kolmogorov–Smirnov (K–S) test is used. The corresponding PDF curves of the environmental random variables are displayed in Figure 2.

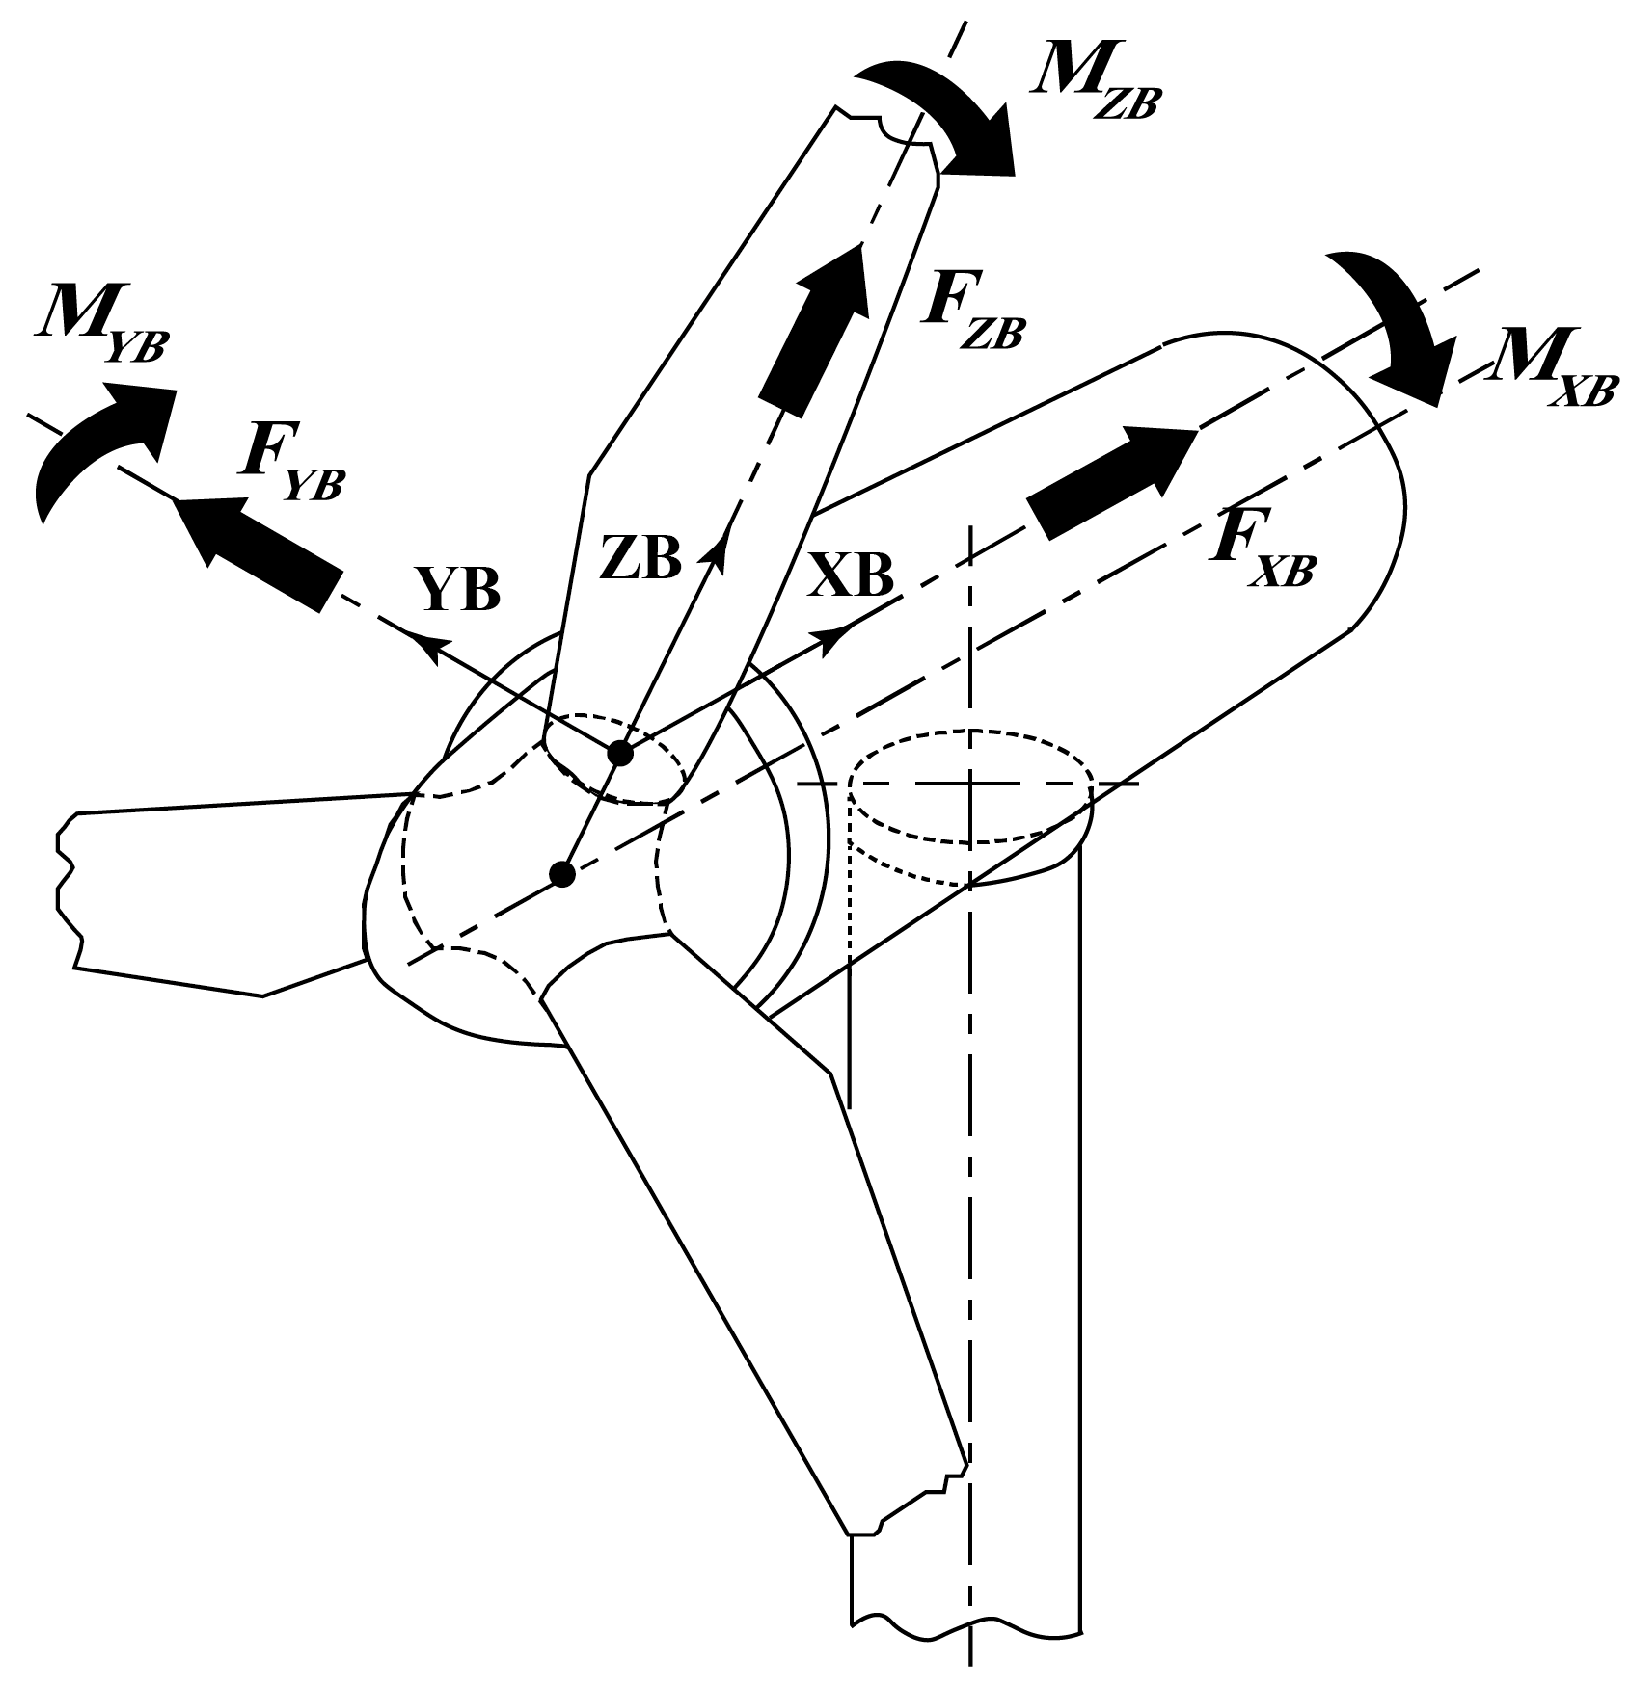
2.3. Fatigue Damage Location and Stress Calculation

Two critical locations of the FOWT system, namely tower base and blade root, are selected in this study for fatigue reliability evaluation. Finding the stress sequence is one important component of fatigue damage within the time domain. Consequently, obtaining the stress time series from the dynamic simulations at these locations is essential.
The base of the supporting structure is considered a thin-walled cylindrical structure. To make the computation easier, the impact of bolts and the components that connect the tower to the platform is ignored. Given that shear stress contributes far less to fatigue damage compared to axial stress [24], only the axial stress is considered for the fatigue damage assessment in this work. Seven locations around the tower’s diameter are used to measure the stress (Figure 3). Under the small deformation assumption, the nominal axial stress σ T o w e r is determined using Equation (1).
σ T o w e r = N z A T + M T y I y r cos α M T x I x r sin α
where N z is the axial force; A T is the nominal cross-sectional area; M T x and M T y denote the tower base roll and pitching moment, respectively; I x and I y mean the sectional moments of the area; α is the angle between the calculated point and the negative X-axis evaluated counterclockwise.
Compared to the supporting structure, stress conditions at the blade root are more intricate. Both shear stress and axial stress are deemed to be components of the tension at the blade root. The blade undergoes bending moments and shear forces in three directions as it rotates continuously. A fixed coordinate system is established to accurately describe these loads on the blade (Figure 4). This coordinate system remains stationary and does not change with the rotation of the blade, allowing for a consistent analysis of the loads operating upon the blade. To simplify the calculation, the blade root cross-section is treated as a circular ring-shaped area. Equations (2) and (3) can be used to obtain the axial stress σ 0 and shear stress τ 0 , respectively, which is
σ 0 = M B x 2 + M B y 2 W n + F B z A B
τ 0 = F B x 2 + F B y 2 A B + M B z W p
where M B x , M B y , and M B z are the in-plane, out-of-plane, and pitching moment, respectively; F B x , F B y , and F B z are the out-of-plane shear, in-plane shear, and axial force, respectively; W n and W p are the section modulus and section modulus in torsion, respectively.
After obtaining the stresses at the blade root, the axial and shear stress ought to be synthesized according to the fourth strength theory:
σ B l a d e = σ 0 2 + 3 τ 0 2

2.4. Rainflow Counting Method

The rainflow counting method was introduced in 1968 [25] and has since become a widely accepted method for analyzing random signals in the context of fatigue analysis. The primary factors influencing the fatigue life of structures include stress amplitude, the cycle count, and mean stress amplitude. The rainflow counting method, a common statistical approach, is frequently applied to measure these parameters and evaluate fatigue damage.
The 5MW spar OWT is simulated first in the time domain within this research. The stress cycles in time history are then counted using the rainflow counting method. The Goodman method (Equation (5)) is utilized to correct the average stress, accounting for its impact on the structure’s fatigue life.
σ i R F = σ i R σ u l t σ M F σ u l t σ i M ε
where σ i R F denotes the stress range of the cycle relative to constant mean load; σ i R denotes the ith cycle’s range about a load mean stress of σ i M ; ε is the Goodman exponent. In this work, it is defined as 1.0. σ u l t represents the maximum stress (in absolute terms) of the cross-section before failure, based on ultimate strength. σ M F is the constant mean stress value calculated from stress time series. By setting σ M F to 0, the mean stress effect can be negated.

2.5. S–N Curve

By illustrating how many repetitions a material can withstand at a given stress amplitude before experiencing fatigue damage, the S–N curve defines its fatigue resistance. According to the DNV standard [16], the basic formula for calculating the S–N curve under different environmental conditions is as follows:
lg N = l g a ¯ m lg Δ σ
where N denotes the predicted amount of cycles to failure for the stress range Δ σ ; a ¯ and m denote the slope and the intercept parameters. Blades are made of composite materials, while the tower is made of steel, m is defined as 8 and 3, respectively.

2.6. Fatigue Cumulative Damage Theory

Fatigue damage measures the material degradation caused by fatigue loading, often characterized by D , a parameter without dimensions. When D = 0, the material is free from fatigue damage. Conversely, when D > 1 it signifies that the material has reached its fatigue limit. The P-M theory is applied in this study to evaluate fatigue damage:
D j S T = i n j i N j i
D R j S T = D j S T T j
D = j = 1 N D R j S T P q T
where D j S T denotes the fatigue damage value; n j i is the cycle number for the ith stress cycle; N j i is the failure times; T j is the simulation time ( T j = 600 s in this paper); T stands for the total operating time of the wind turbine.

2.7. Fatigue Reliability Analysis via DPIM

Assuming that the stochastic sources for the multi-degree-of-freedom (MDOF) nonlinear system of floating wind turbines under random external excitation (such as wind, waves, etc.) come from Θ, the principle of probability conservation [11] applied to the wind turbines is:
Ω Y p Y y , t d y = Ω Θ p Θ θ , t d θ
where p Θ θ , t and p Y y , t indicate the PDF of input variables θ and output vector y , respectively. A deterministic mapping G describes the connection between θ and y :
G : Y t = g Θ , t
To better illustrate the uncertainty propagation from θ into y , the PDIE of the MDOF nonlinear system of the FOWTs is derived, leveraging the deterministic mapping of G and Dirac delta function.
p Y y , t = p Θ θ δ y g θ , t d θ
Since in practice it is not necessary to compute a joint PDF for all responses, only a few or even a single response is of primary concern. The PDF for the response y l t is derived by applying the marginal integral of Equation (12) and the Dirac delta function property to the dimension reduction for the MDOF nonlinear system of the FOWTs:
p Y l ( y l , t ) = δ y l g l ( θ , t ) p Θ ( θ ) d θ
The methods of partitioning probability space and smoothing the Dirac delta were presented by Chen et al. [11] to solve the problems brought on by the Dirac function’s singularity in solving Equation (13):
p Y l y l , t = q = 1 N 1 2 π σ e y l g l θ q , t 2 / 2 σ 2 P q
where N denotes the representative point number generated by the techniques of the partition of probability space, g l θ q , t means the representative response of qth representative points, P q is the assigned probability, and σ denotes the smoothing parameter.
Then, for achieving the fatigue reliability analysis of key components for the FOWTs via DPIM, the dynamic performance function is denoted as
M : Z t = F Θ , t
in which Y(Θ, t) is expressed as
Z t = B g ext Θ , t
where B denotes the threshold, gext(Θ, t) means the equivalent extreme value of the fatigue response of wind turbines. Furthermore, the fatigue reliability function is formulated by
R s t = Pr Z τ Ω Z , s , τ 0 , t = Pr Z > 0 = 0 p Z z , t dz
where Ω Z , s is the safe domain of stochastic response Z(t), and p Z z , t denotes the PDF of Z(t). According to PDIE, the fatigue reliability function in Equation (17) can be evaluated by
R s t = Pr Z > 0 = 0 p Z z , t dz = 0 Ω Θ δ z F ( θ , t ) p Θ ( θ ) d θ dz
Introducing Heaviside function H , the formulation for calculating the fatigue reliability in the framework of DPIM is given by
R t = H F θ , t p θ θ d θ = q = 1 N H F θ q , t P q
Equation (19) introduces the Heaviside function to avoid the smoothing process of Dirac delta function. The numerical solution of Equation (19) only requires the application of the partition of probability space techniques, which is a simpler solution.

3. Numerical Examples

A two-step process based on the GF-discrepancy is used within this paper to construct representative points, and 1000 is the fixed number of representative points. As a result, using the DPIM, the tower base and the blade root for the 5 MW spar FOWT undergo stochastic and fatigue reliability evaluations. Furthermore, the MCS method results are used as a benchmark solution, and the sample size for the method is set to 10,000.

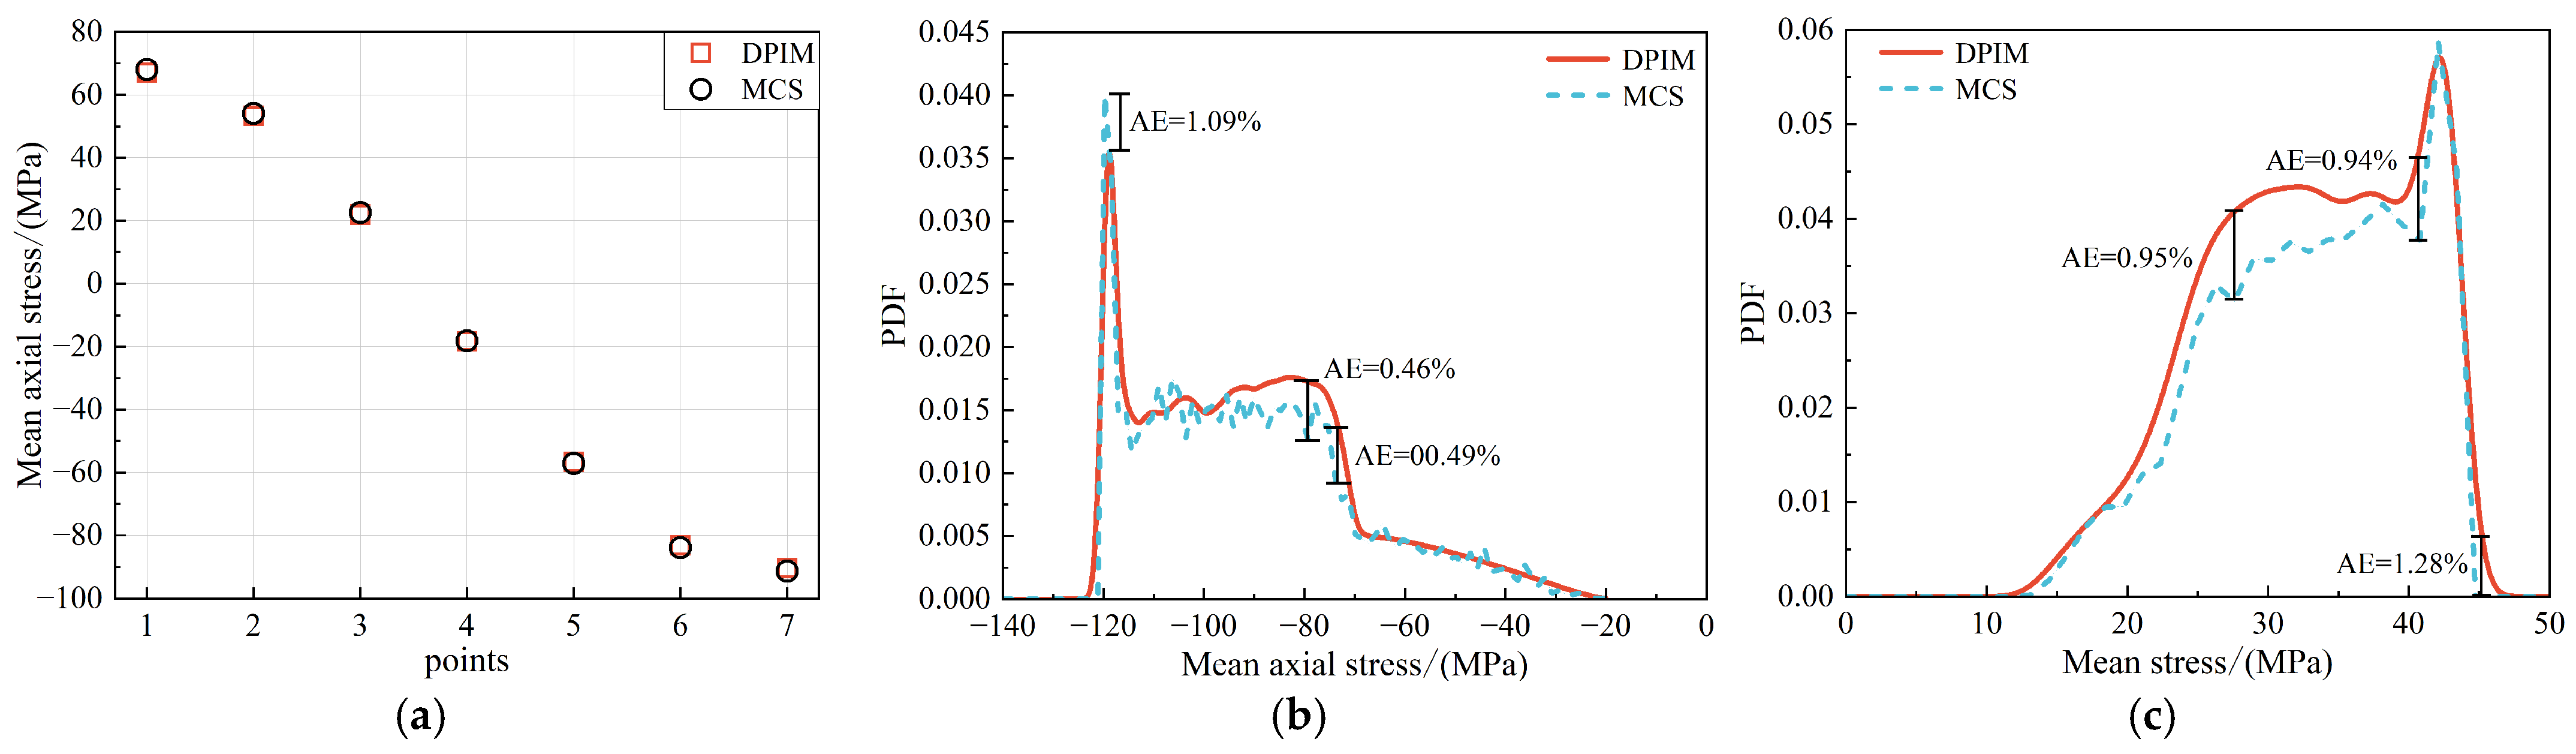
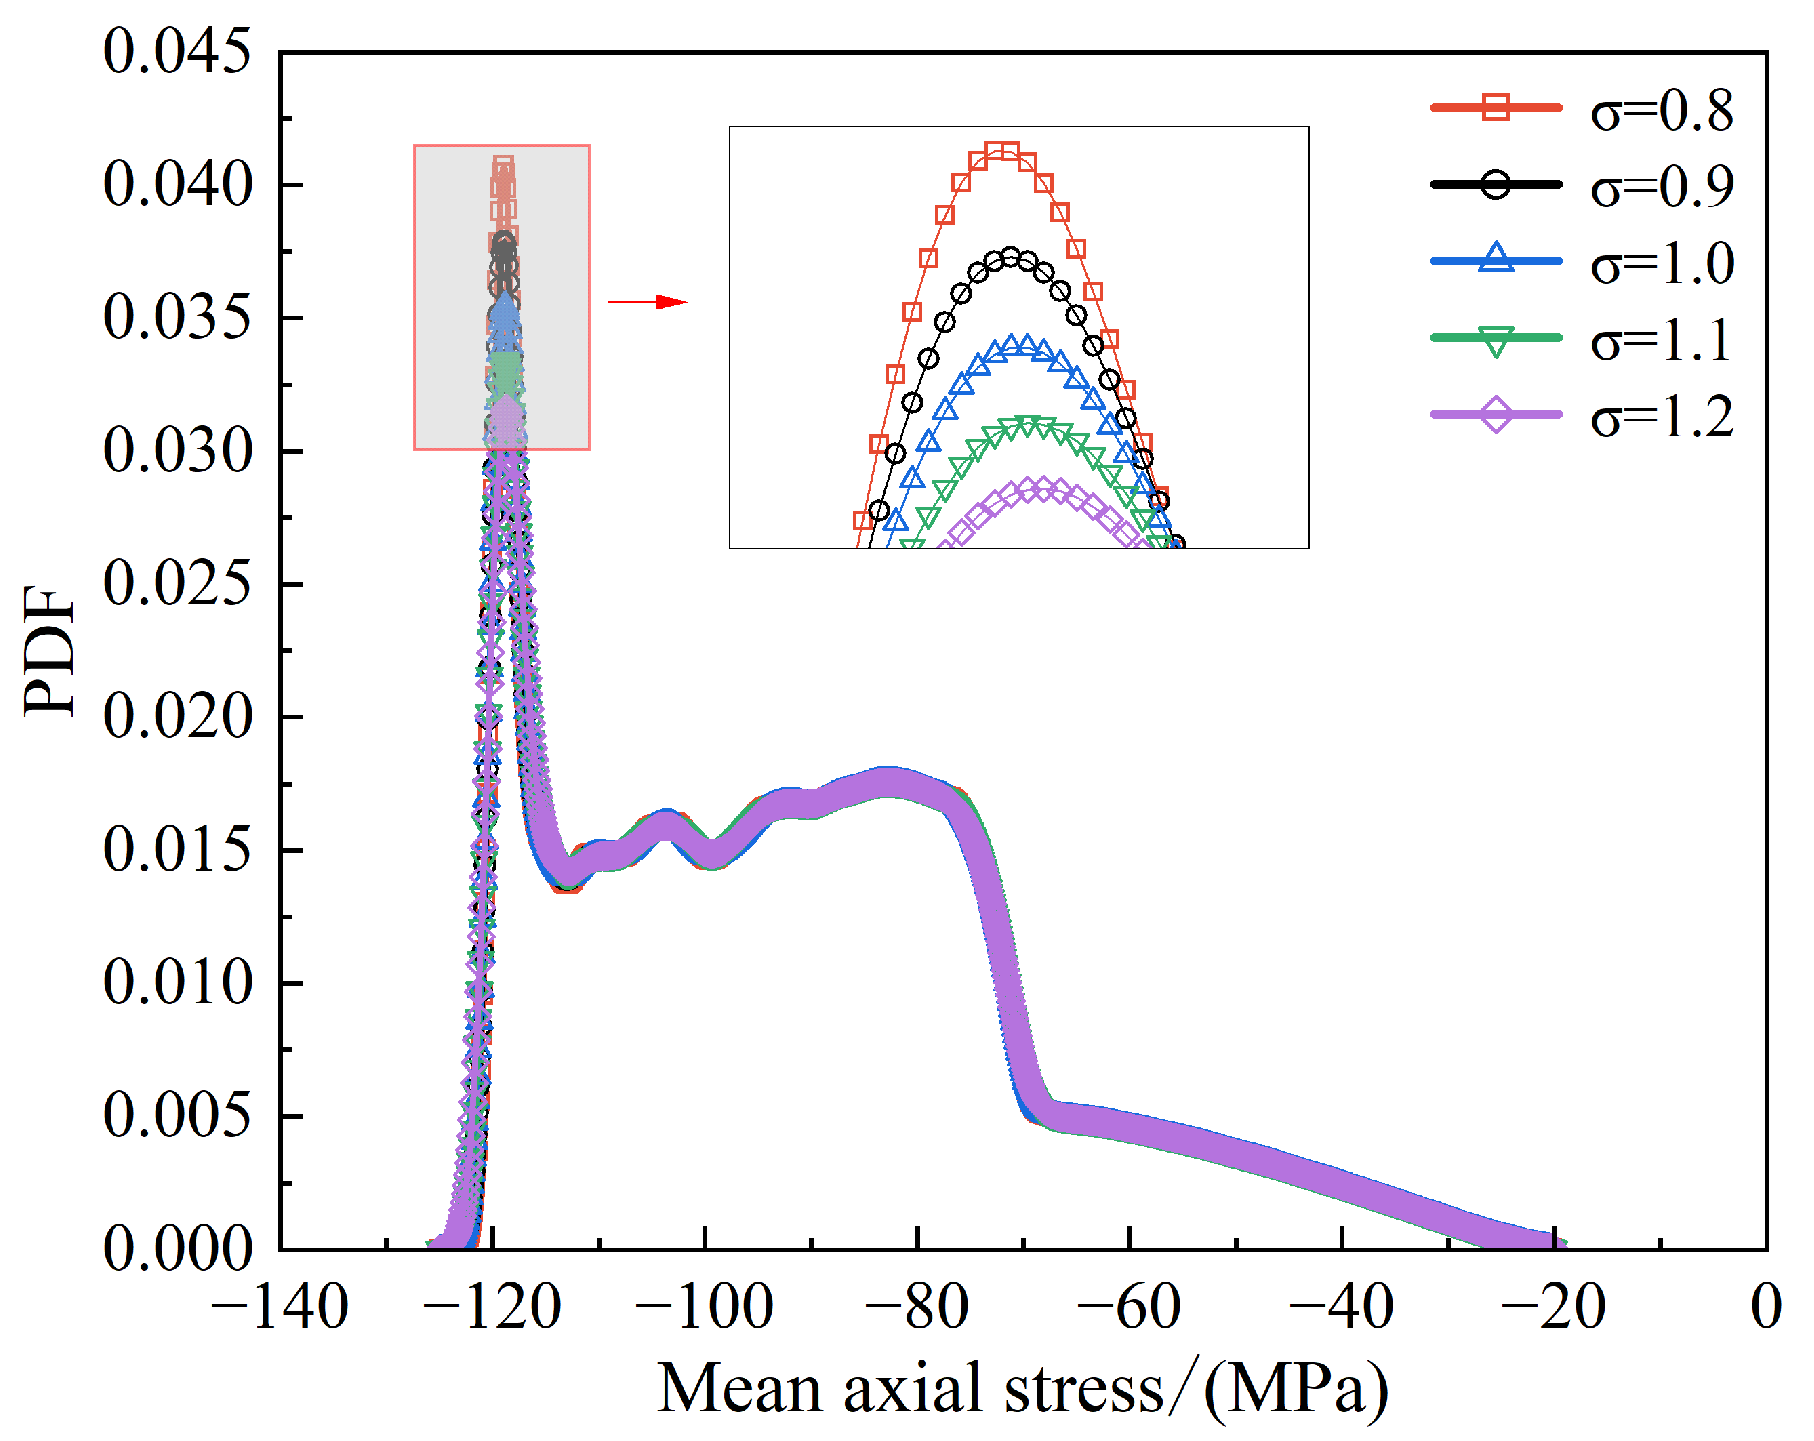
3.1. Stochastic Response Analysis of FOWTs Under Combined Wind–Wave Excitation

A comparison of the average stress at the key points of the supporting structure under different wind and wave angles (0°, 30°, 60°, and 90°) is illustrated in Figure 5. The analysis of the mean axial stress reveals that point 7 experiences the highest mean axial stress, indicating a potential fatigue risk that warrants further investigation. Furthermore, Equation (1), indicates that the axial stress varies sinusoidally with the angle, demonstrating that the mean axial stress in absolute terms diminishes as the point deviates from the wind and wave direction along the Y-axis. Furthermore, the mean axial stress on the lee side is slightly higher than on the windward side, arising from the axial stresses on the lee side points being superimposed by the axial force and the flatwise bending moment. Additionally, despite the changes in wind and wave angles, the difference in average stresses at various points is not significant. Thus, stress variations appear to be insensitive to the changes in wind and wave angles.
Figure 6a displays the average stress values at various tower base locations under aligned wind–wave conditions, as determined by the DPIM and MCS techniques. Specifically, Figure 6b,c show the PDF curves for the stress at point 7 of the tower base and blade root, respectively. The absolute error of the DPIM compared to the MCS results is also provided, with the maximum absolute error being 1.09% for the tower base and 1.28% for the blade root, proving DPIM’s great accuracy and dependability. According to the comparison findings, the absolute stress at point 7 ranges primarily from 80 MPa to 120 MPa. In contrast, the stress at the blade root typically falls between 20 MPa and 45 MPa. This indicates that the average stress on the supporting structure is higher than that at the blade root. Additionally, the results from both DPIM and MCS are consistent with each other. Furthermore, regarding the computational efficiency, the CPU time for the DPIM is approximately 22,910 s, while the MCS method takes 611,770 s. This means that the DPIM is over 20 times more efficient, proving the precision and potency of the presented approach for an uncertainty qualification analysis of large-scale wind turbine structures.
Additionally, a study of sensitivity was performed to evaluate how the smoothing parameter affects the results of the model (Figure 7). The results demonstrate that the DPIM is insensitive to variations in the smoothing parameter. Specifically, the results show that the five smoothing parameter curves exhibit slight differences near the mean stress of 120 MPa, while they remain highly consistent in other regions.

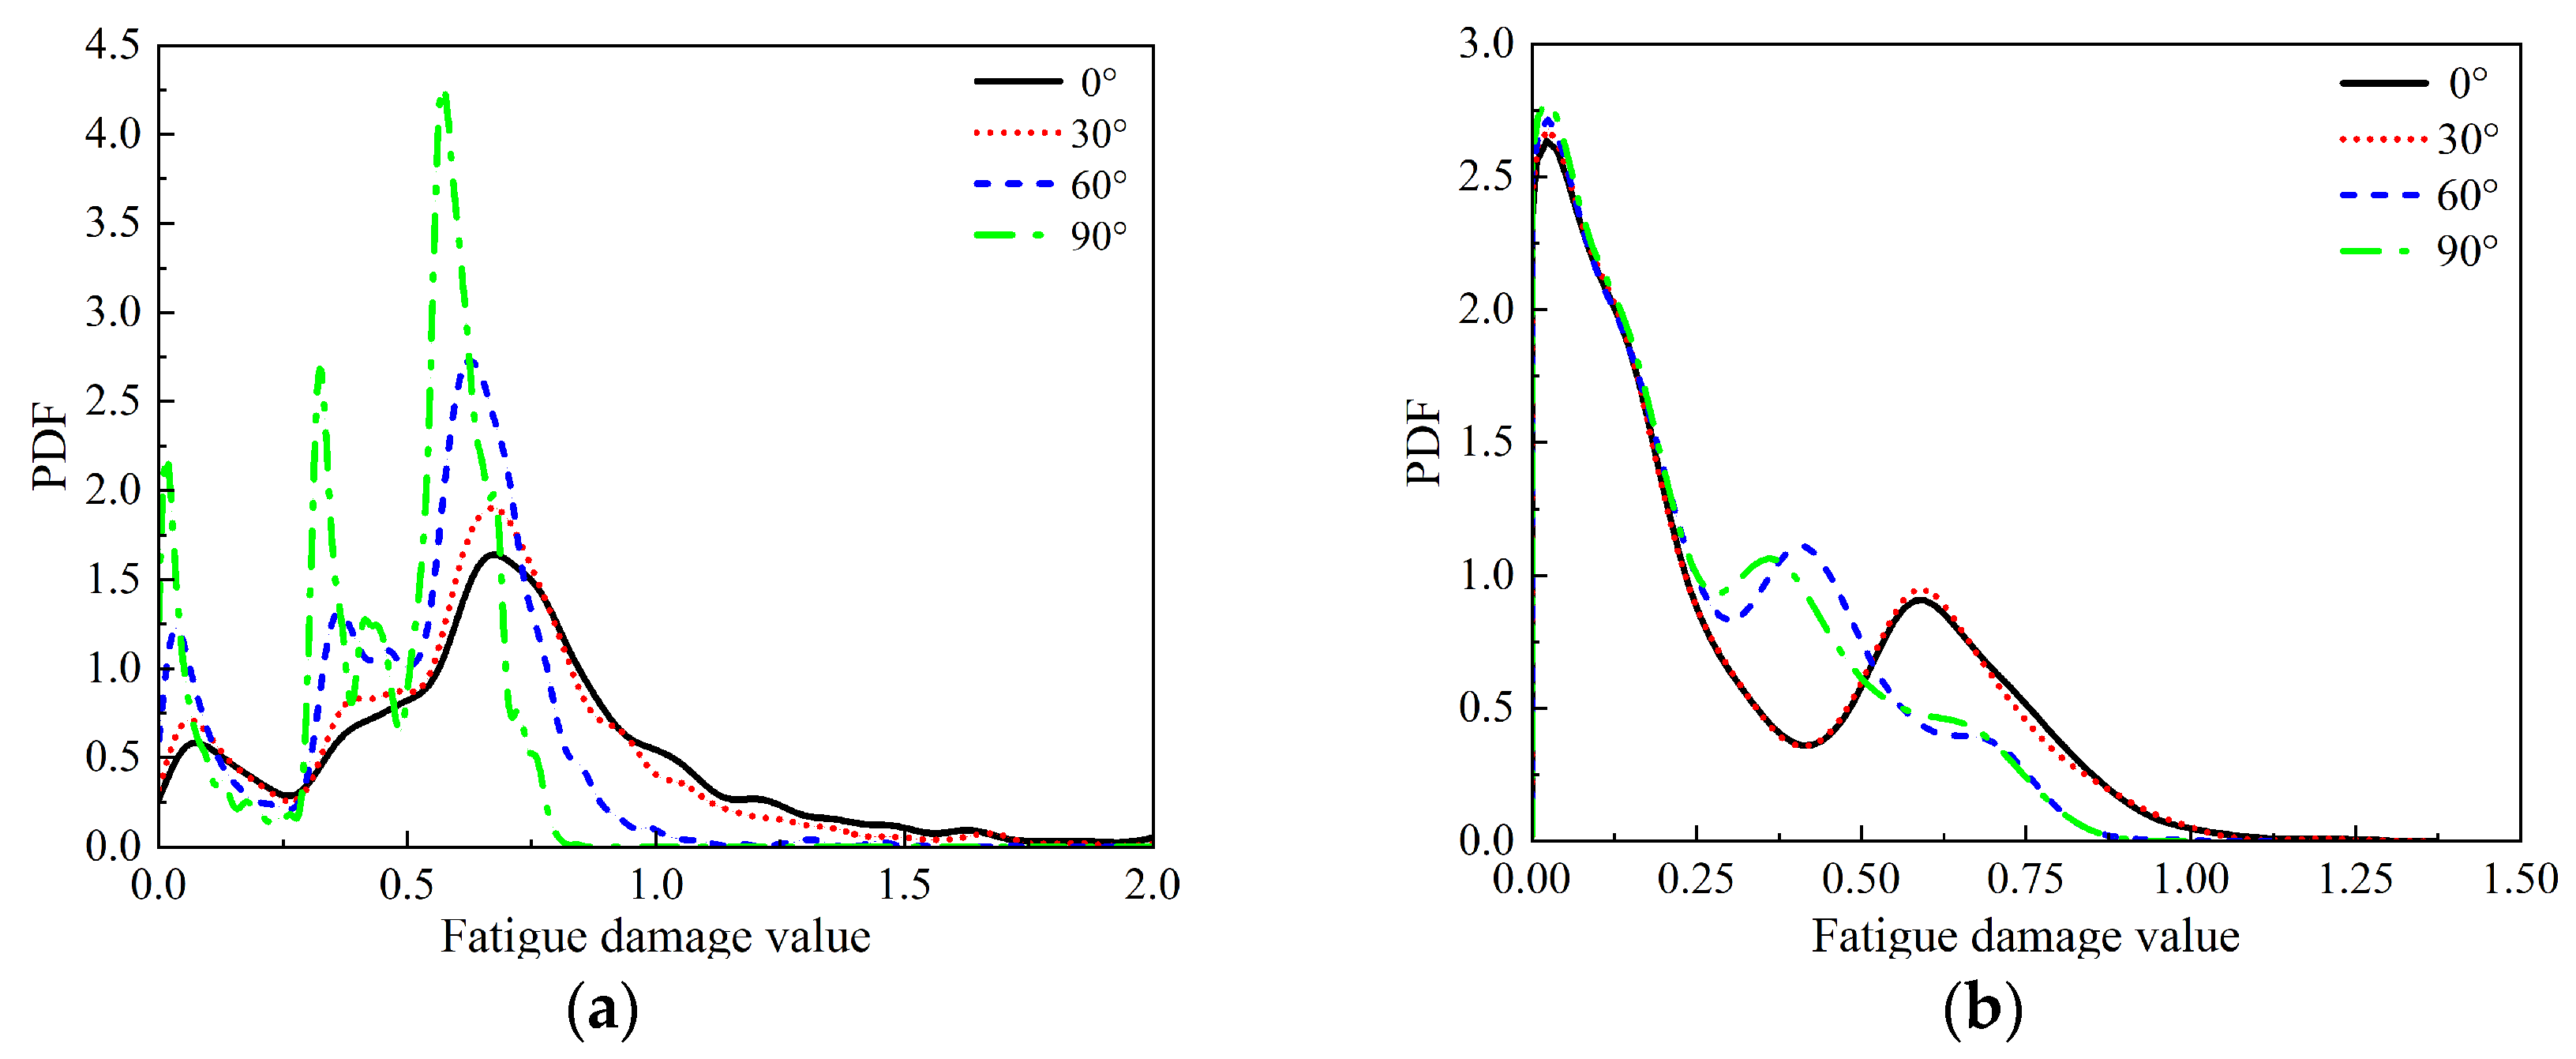
3.2. Fatigue Damage Analysis of FOWTs Under Combined Wind–Wave Excitation

To comprehensively assess the impact of fatigue accumulation effects under long-term operating conditions, the calculated fatigue damage values are first converted to a damage rate per second, which is then multiplied by the corresponding calculation duration to quantify the accumulation of damage over time. Figure 8 illustrates the PDF curves of the fatigue damage at the danger point (point 7) of the tower base and blade root after 20 years of operation, under varying wind and wave directions (0°, 30°, 60°, and 90°). When the wind and wave angle is 90°, the probability that the fatigue damage value of two structures is less than 1 is the highest compared to all other angle conditions. Additionally, the PDF curves show peaks in the ranges of [0.5, 0.8] and [0, 0.25], indicating the most likely variation ranges of fatigue damage for the tower base and the blade root, respectively.
In contrast, when wind and wave are aligned, the range of the structural fatigue damage values increases, and the probability of values greater than 1 also rises, making the probability of being less than 1 the lowest among all angle conditions. It can be concluded that the angles greatly impact fatigue damage, with relatively lower fatigue damage observed at 90°, while the probability of fatigue damage values exceeding 1 is the highest when the wind and waves are aligned. The diagram comparison indicates that the likelihood of the fatigue damage value at the blade root being less than 0.25 is significantly higher than at the tower base. This suggests that the tower base is more susceptible to fatigue failure, compared to the blade root. This can be attributed to several factors: (1) The tower base experiences complex combined loads, including wind, wave, and dynamic operational forces, which lead to higher stress concentrations, compared to the blade root. (2) The steel material used in the tower base is strong, but it has lower fatigue resistance compared to the composite materials used in the blade root. These findings align with the mean stress results discussed in Section 3.1.
Table 3 summarizes the sensitivity analysis of fatigue damage at the two structures to the variations in input parameters. The results show that an increasing wind speed causes a more pronounced rise in fatigue damage at the blade root than at the tower base. The main cause of this outcome is the direct exposure of blades to aerodynamic loads, which are dependent on wind speed. In contrast, the tower base is more susceptible to changes in significant wave height, since it is subjected to wave loads directly. Moreover, compared to the mean wind speed and significant wave height, the variations in the spectral peak period have minimal impact on fatigue damage. These findings demonstrate the distinct influences of key input parameters on the fatigue damage of different components.

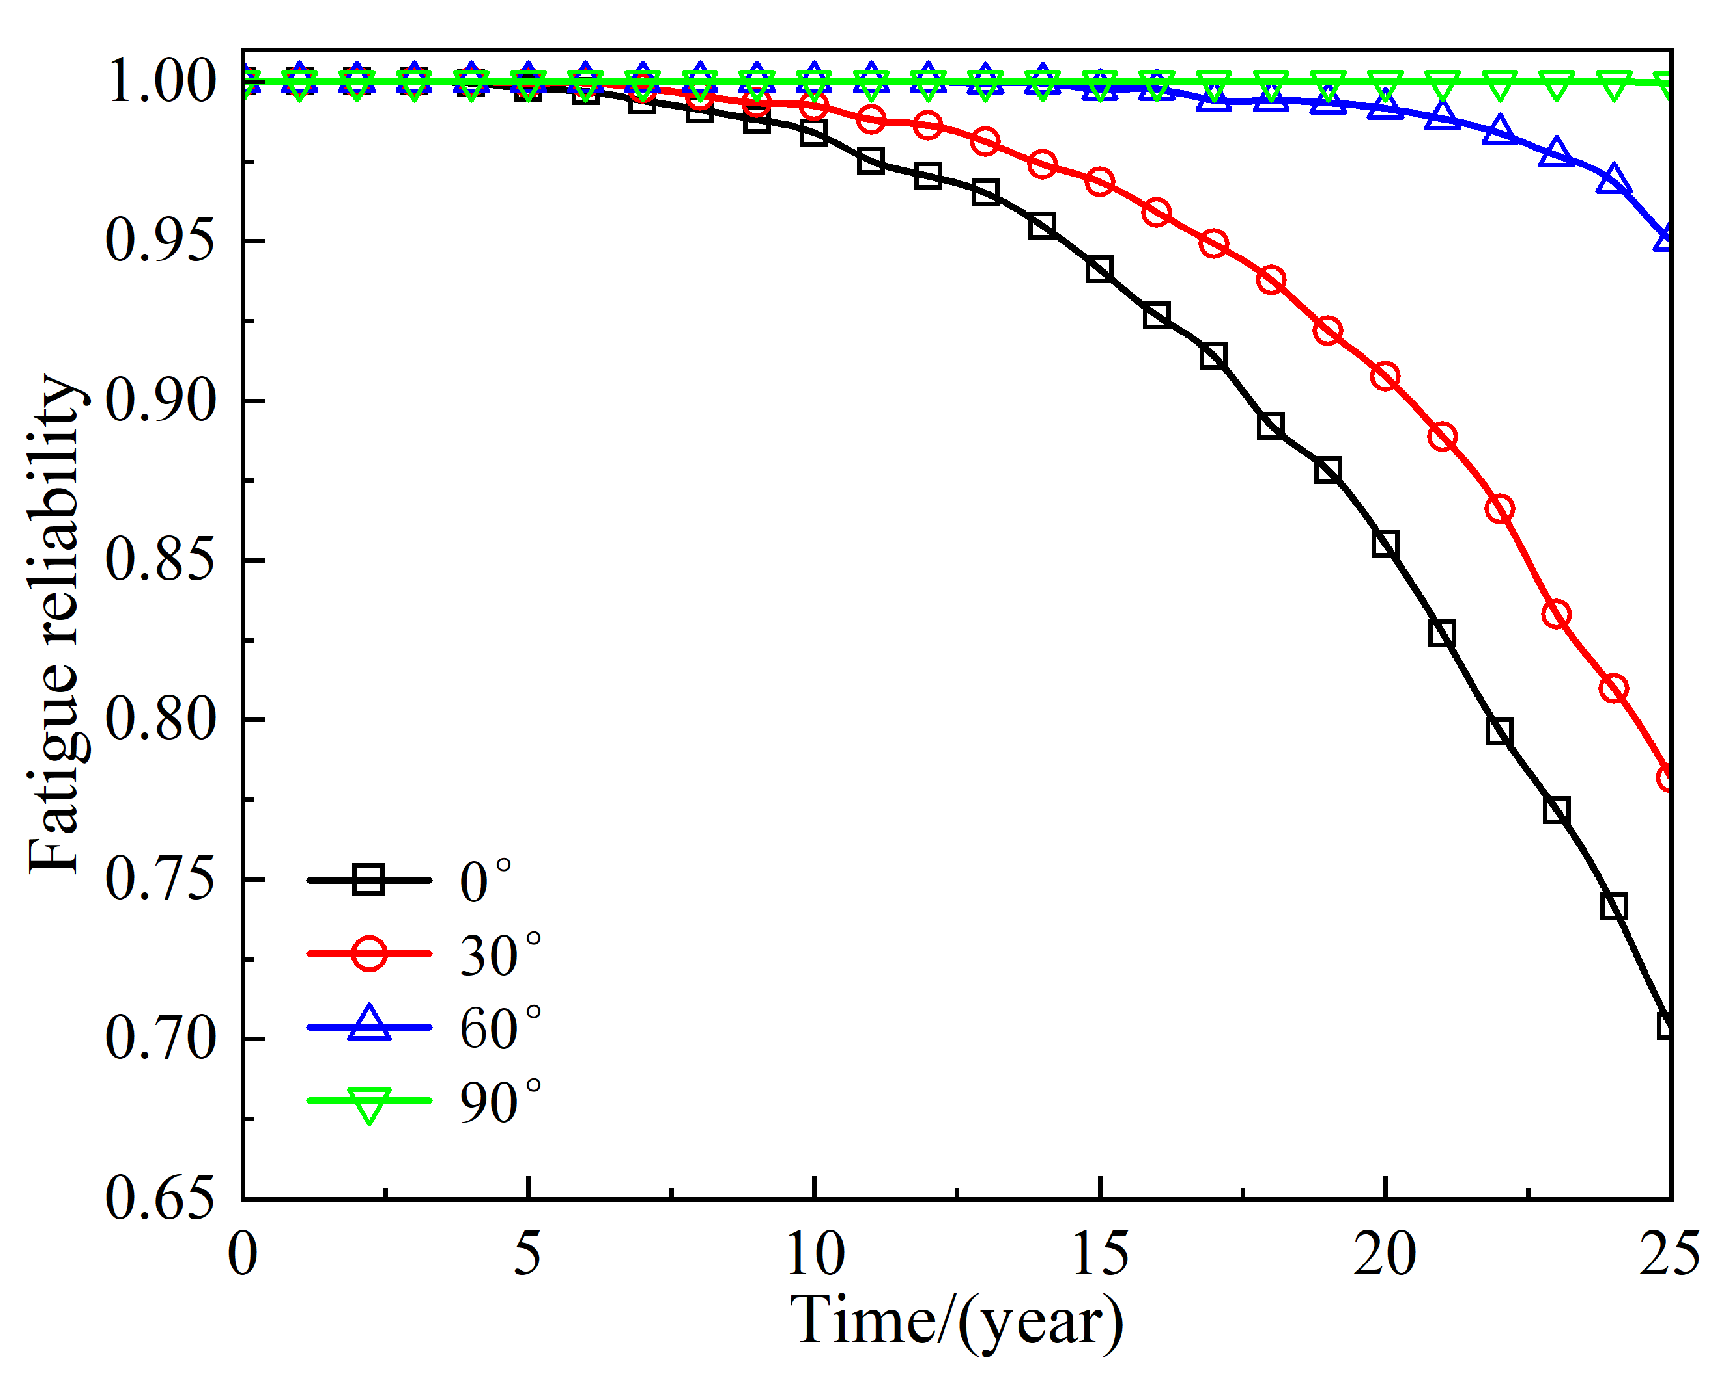
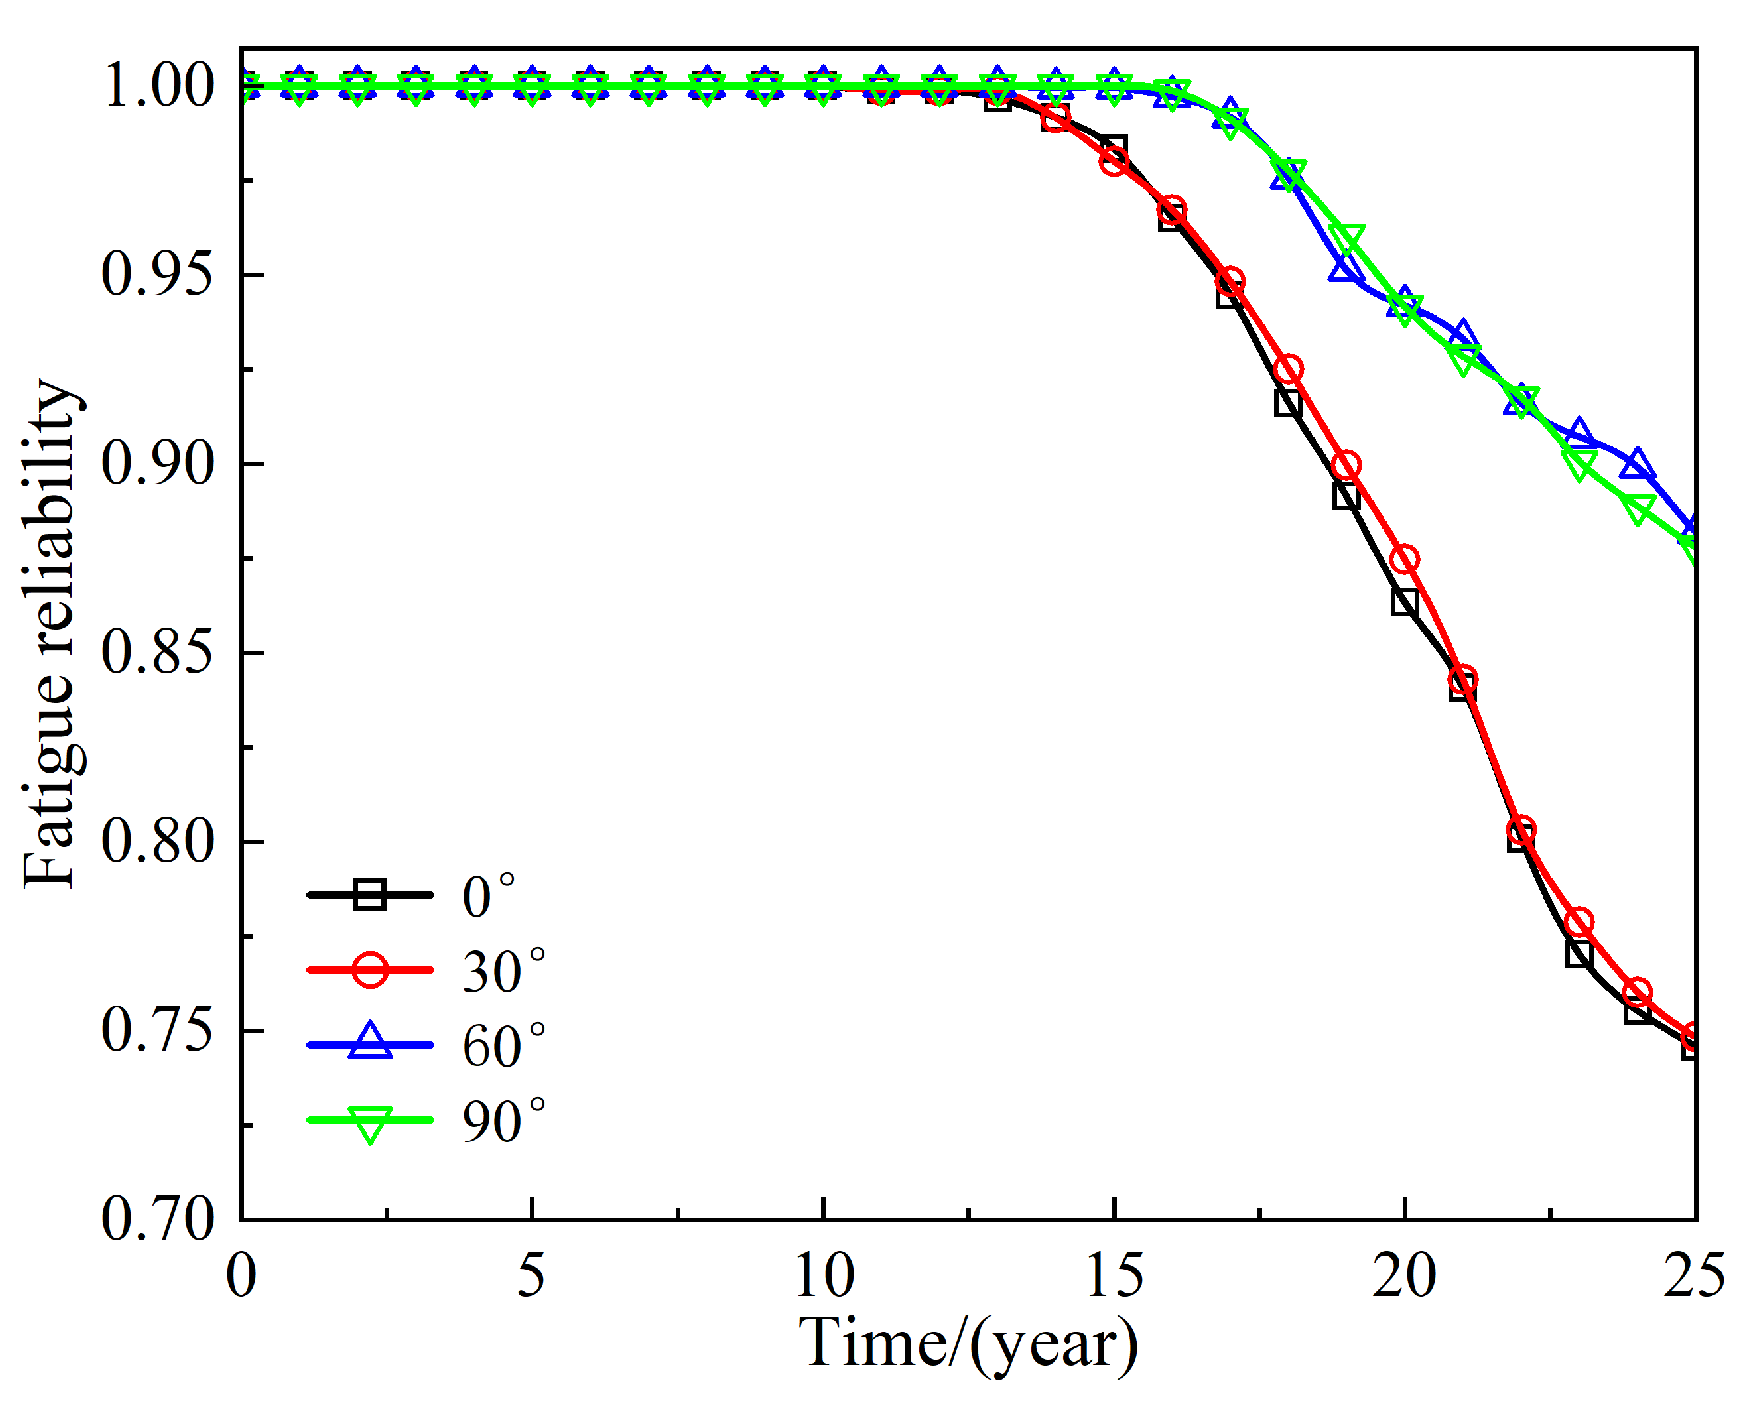
3.3. Fatigue Reliability Analysis of FOWTs Under Combined Wind–Wave Excitation

This section provides additional research on the effects of the wind and wave angle on the fatigue reliability of crucial locations, under various operating years. As shown in Figure 9, when the wind and waves are aligned, the evaluation of fatigue reliability for the supporting structure of FOWTs is implemented based on fatigue damage at the danger point (point 7). There is a noticeable rising trend in wind turbine fatigue reliability as the wind and wave angle rises from 0° to 90°, which corresponds with the previously analyzed fatigue damage value results in Section 3.2.
As the operational lifespan of FOWTs increases, the fatigue reliability of the supporting structure at various points shows a gradual decline. Under the aligned wind–wave condition, when the operational lifespan extends to the designed lifespan of 20 years, the fatigue reliability of FOWT is 0.855. This relatively high value indicates that the wind turbine structure possesses a significant level of fatigue reliability within the design life. However, when the operational lifespan is extended to 25 years, the fatigue reliability is significantly reduced to 0.704, indicating the adverse effects of prolonged use on the fatigue performance of the FOWT structure. This result suggests that exceeding the design lifespan leads to a gradual decline in fatigue reliability, with the decline becoming more pronounced over time.
In addition, the results of the fatigue reliability analysis of the tower base under various wind–wave angles calculated by DPIM and SSM are presented in Table 4. The table reveals that the DPIM achieves high computational efficiency while ensuring accuracy, whereas the CPU time of SSM is about 3.35 to 8.5 times that of the DPIM. These results demonstrate that the DPIM can be developed as a highly effective tool for fatigue reliability analysis of FOWTs under complex wind–wave conditions.
Furthermore, Figure 10 provides the fatigue reliability of the blade root for the wind turbines. The results indicate that the combined effects of wind and waves have a significant impact on the fatigue reliability of the blade.
Fatigue reliability starts to decline significantly even when the operational lifespan is well below the designed lifespan of 20 years. Moreover, when the angle is small (e.g., 0°and 30°), the stochastic environmental excitation significantly affects the fatigue reliability of blades. In comparison to the misaligned wind–wave condition, the aligned wind–wave condition results in a greater impact of this excitation, leading to a decrease in fatigue reliability from 0.864 at a designed life of 20 years to 0.746 at 25 years. As illustrated in Figure 9 and Figure 10, the fatigue reliability of the FOWT structure shows a gradual but consistent decline throughout its operational life, with the rate of decline accelerating slightly after 20 years. To guarantee the long-term safe and steady operation of the wind turbines, it is crucial to perform routine inspections, maintenance, or reinforcements in high-risk regions.

4. Conclusions

This study proposes an efficient approach to analyze the fatigue reliability of a 5 MW spar FOWT structure based on the DPIM. The key findings are as follows:
(1)
This paper develops the DPIM to analyze the stochastic response and structural fatigue reliability analyses of key components for FOWTs under combined wind–wave excitation. The proposed uncertainty quantification method serves as an alternative approach for analyzing FOWT structures with multiple uncertainties.
(2)
Compared to the typical MCS, the DPIM has a high accuracy and significantly improves computational efficiency, making the assessment for the fatigue reliability analysis of key components for FOWT structures more efficient.
(3)
The fatigue reliability of the tower base and blade root declines significantly over time under aligned wind–wave conditions, decreasing from 0.855 and 0.864 at 20 years to 0.704 and 0.746 at 25 years. This necessitates more frequent inspections and maintenance as the end of the service life approaches, to ensure operational safety.
These findings provide significant insights for the design and maintenance of FOWTs. The notable reduction in fatigue reliability at the tower base and blade root under aligned wind–wave conditions highlights the need for targeted reinforcement strategies during the design phase, such as adding structural supports to these critical areas. Furthermore, inspection schedules should be tailored to the FOWT’s operational lifespan, with an increased frequency as the structure approaches the end of its service life, particularly under aligned wind–wave conditions, to ensure continued safety and reliability. These strategies can enhance maintenance efficiency and extend the operational lifespan of FOWTs in challenging marine environments. However, it is important to acknowledge the limitations of this study. The analysis in this study primarily focuses on wind and wave loads, which are the main influencing factors for the fatigue reliability of FOWTs. Other environmental factors, such as atmospheric corrosion, electrochemical corrosion, and temperature variations may influence the long-term fatigue performance of FOWTs. Additionally, the study relies on simulated data rather than field measurements, which may introduce uncertainties in the results. To address these limitations, future work will focus on incorporating additional environmental factors into the analysis, as these factors play a critical role in the long-term performance and durability of marine structures. Moreover, the proposed model will be validated by comparing its predictions with field-measured fatigue data from operational offshore wind farms. This validation will not only confirm the accuracy of the model but also provide practical insights for its application in real-world scenarios. By addressing these limitations and expanding the scope of the analysis, this research aims to contribute to the development of more efficient and reliable tools for evaluating the fatigue reliability of FOWTs, ultimately supporting the sustainable growth of the offshore wind energy industry.

Author Contributions

Conceptualization, J.D. and Z.F.; methodology, H.C.; software, J.D.; validation, Y.F.R., Z.F. and H.C.; formal analysis, X.L.; investigation, Y.F.R.; resources, Z.F.; data curation, J.D.; writing—original draft preparation, J.D.; writing—review and editing, H.C.; visualization, J.D.; supervision, Z.F.; project administration, X.L.; funding acquisition, H.C. and Z.F. All authors have read and agreed to the published version of the manuscript.

Funding

This research was funded by the National Natural Science Foundation of China (Grant Nos. 12372196, 12402238); the Jiangsu Funding Program for Excellent Postdoctoral Talent (Grant No. 2023ZB506); and the Postdoctoral Fellowship Program of CPSF (Grant No. GZC20230667).

Institutional Review Board Statement

Not applicable.

Informed Consent Statement

Not applicable.

Data Availability Statement

The data presented in this study are available upon request from the corresponding author.

Acknowledgments

We greatly appreciate the careful work and constructive suggestions of the editor and all anonymous reviewers.

Conflicts of Interest

The authors declare no conflicts of interest.

References

  1. Toft, H.S.; Sørensen, J.D. Reliability-based design of wind turbine blades. Struct. Saf. 2011, 33, 333–342. [Google Scholar] [CrossRef]
  2. Colone, L.; Natarajan, A.; Dimitrov, N. Impact of turbulence induced loads and wave kinematic models on fatigue reliability estimates of offshore wind turbine monopiles. Ocean Eng. 2018, 155, 295–309. [Google Scholar] [CrossRef]
  3. Wilkie, D.; Galasso, C. Gaussian process regression for fatigue reliability analysis of offshore wind turbines. Struct. Saf. 2021, 88, 102020. [Google Scholar] [CrossRef]
  4. Fu, B.; Zhao, J.B.; Li, B.Q.; Yao, J.; Teifouet, A.R.M.; Sun, L.Y.; Wang, Z.Y. Fatigue reliability analysis of wind turbine tower under random wind load. Struct. Saf. 2020, 87, 101982. [Google Scholar] [CrossRef]
  5. Zhao, G.H.; Dong, S.; Zhao, Y.L. Fatigue reliability analysis of floating offshore wind turbines under the random environmental conditions based on surrogate model. Ocean Eng. 2024, 314, 119686. [Google Scholar] [CrossRef]
  6. Castro, O.; Yeniceli, S.C.; Berring, P.; Semenov, S.; Branner, K. Experimental demonstration of strain-based damage method for optimized fatigue testing of wind turbine blades. Compos. Struct. 2022, 293, 115683. [Google Scholar] [CrossRef]
  7. Luczak, M.M.; Riva, R.; Yeniceli, S.C.; Madsen, S.H.; Lorenzo, E.D. Identification of the test setup influence on the modal properties of a short wind turbine blade during fatigue test. Measurement 2021, 174, 108960. [Google Scholar] [CrossRef]
  8. Chen, L.; Basu, B. Fatigue load estimation of a spar-type floating offshore wind turbine considering wave-current interactions. Int. J. Fatigue 2018, 116, 421–428. [Google Scholar] [CrossRef]
  9. Liang, J.; Wang, Y.; Li, C.; Ou, J.P. Fatigue analysis of monopile-supported offshore wind turbine under varied supported conditions. Ocean Eng. 2025, 320, 120279. [Google Scholar] [CrossRef]
  10. Valdebenito, M.A.; Jensen, H.A.; Labarca, A.A. Estimation of first excursion probabilities for uncertain stochastic linear systems subject to Gaussian load. Comput. Struct. 2014, 138, 36–48. [Google Scholar] [CrossRef]
  11. Li, J.; Chen, J.B. Stochastic Dynamics of Structures; John Wiley & Sons, Ltd.: Singapore, 2009; pp. 192–195. [Google Scholar] [CrossRef]
  12. Melchers, R.E.; Beck, A.T. Structural Reliability Analysis and Prediction, 2nd ed.; John Wiley & Sons: New York, NY, USA, 2017; pp. 95–130. [Google Scholar] [CrossRef]
  13. Chen, G.H.; Yang, D.X. Direct probability integral method for stochastic response analysis of static and dynamic structural systems. Comput. Methods Appl. Mech. Eng. 2019, 357, 112612. [Google Scholar] [CrossRef]
  14. Chen, G.H.; Yang, D.X. A unified analysis framework of static and dynamic structural reliabilities based on direct probability integral method. Mech. Syst. Signal Process. 2021, 158, 107783. [Google Scholar] [CrossRef]
  15. Jonkman, J.M.; Butterfield, S.; Musial, W.; Scott, G. Definition of a 5-MW Reference Wind Turbine for Offshore System Development; National Renewable Energy Lab (NREL): Golden, CO, USA, 2009. [Google Scholar] [CrossRef]
  16. DNV-RP-C203: Fatigue Design of Offshore Steel Structures. 2011. Available online: https://www.dnv.com/ (accessed on 1 October 2011).
  17. Miner, M.A. Cumulative Damage in Fatigue. J. Appl. Mech. 1945, 12, A159–A164. [Google Scholar] [CrossRef]
  18. Jonkman, J.M. Definition of the Floating System for Phase IV of OC3; National Renewable Energy Lab (NREL): Golden, CO, USA, 2005. [Google Scholar] [CrossRef]
  19. Jonkman, J.M.; Buhl, J.M. FAST User’s Guide; National Renewable Energy Lab (NREL): Golden, CO, USA, 2005. [Google Scholar] [CrossRef]
  20. Roald, L.; Jonkman, J.M.; Robertson, A.; Chokani, N. The Effect of Second-Order Hydrodynamics on Floating Offshore Wind Turbines. Energy Procedia 2013, 35, 253–264. [Google Scholar] [CrossRef]
  21. Wind Energy Generation Systems-Part 3-2: Design Requirements for Floating Offshore Wind Turbines. Available online: https://webstore.iec.ch/en/publication/29244 (accessed on 5 April 2019).
  22. Dee, D.P.; Uppala, S.M.; Simmons, A.J.; Berrisford, P.; Poli, P.; Kobayashi, S.; Andrae, U.; Balmaseda, M.A.; Balsamo, G.; Bauer, P.; et al. The ERA-Interim reanalysis: Configuration and performance of the data assimilation system. Q. J. R. Meteorol. Soc. 2011, 137, 553–597. [Google Scholar] [CrossRef]
  23. Song, Y.P.; Sun, T.; Zhang, Z.L. Fatigue reliability analysis of floating offshore wind turbines considering the uncertainty due to finite sampling of load conditions. Renew. Energy 2023, 212, 570–588. [Google Scholar] [CrossRef]
  24. Kvittem, M.I.; Moan, T. Time domain analysis procedures for fatigue assessment of a semi-submersible wind turbine. Mar. Struct. 2015, 40, 38–59. [Google Scholar] [CrossRef]
  25. Matsuichi, M.; Endo, T. Fatigue of Metals Subjected to Varying Stress; John Wiley & Sons: New York, NY, USA, 1968. [Google Scholar]
Figure 1. 5MW OC3 Spar-type FOWT.
Jmse 13 00506 g001
Figure 2. PDF curves of the wind and wave loading parameters under the DPIM: (a) the mean wind speed; (b) the significant wave height; (c) the spectral peak period.
Jmse 13 00506 g002
Figure 3. Top view of the tower base.
Jmse 13 00506 g003
Figure 4. The coordinate system of the blade.
Jmse 13 00506 g004
Figure 5. Comparison of mean axial stress when wind and waves are misaligned (0°, 30°, 60°, and 90°).
Jmse 13 00506 g005
Figure 6. Comparison of mean stress results under different methods: (a) mean axial stress at point 7 of tower base; (b) PDF curves of mean axial stress at point 7 of tower base; (c) PDF curves of mean stress at blade root.
Jmse 13 00506 g006
Figure 7. Comparison of PDF curves of mean axial stress at point 7 of tower base, under different smoothing parameters, when wind and waves are aligned.
Jmse 13 00506 g007
Figure 8. Comparison of PDF curves of fatigue damage value at key components under different wind–wave angles (0°, 30°, 60°, and 90°): (a) tower base; (b) blade root.
Jmse 13 00506 g008
Figure 9. Comparison of fatigue reliability of tower base under different wind–wave angles (0°, 30°, 60°, and 90°) for different operating years.
Jmse 13 00506 g009
Figure 10. Comparison of fatigue reliability of blade root when wind and wave are misaligned (0°, 30°, 60°, and 90°) for different operating years.
Jmse 13 00506 g010
Table 1. The main properties of the 5MW OC3 Spar-type FOWT.
ParameterValue
Rating5 MW
Rotor and hub diameter, hub height126 m, 3 m, 90 m
Cut-in, rated, cut-out wind speed3 m/s, 11.4 m/s, 25 m/s
Cut-in, rated root speed6.9 rpm, 12.1 rpm
Elevation to tower base above SWL10 m
Tower base diameter, tower base thickness6.5 m, 0.027 m
Table 2. Probability distribution models of environmental random variables.
VariableDistribution Type PDF f x Distribution ParametersK-S Test
V W / m · s 1 Truncated Weibull a b x a b 1 exp x a b , x 3,25 a = 11.9799
b = 2.8005
Pass
H S / m Lognormal 1 x σ 2 π exp ln x μ 2 2 σ 2 μ = 0.4887
σ = 0.4489
Pass
T P / s Lognormal 1 x σ 2 π exp ln x μ 2 2 σ 2 μ = 2.0759
σ = 0.1547
Pass
Table 3. The fatigue damage (600 s) of different input parameters when wind and waves are aligned.
Input ParameterLoad CaseFatigue Damage
V W / m · s 1 H S / m T P / s Tower BaseBlade Root
mean wind speed5186.74 × 10−81.28 × 10⁻¹⁰
11.4186.24 × 10−73.38 × 10⁻⁷
20181.08 × 10−61.76 × 10⁻⁷
significant wave height11.40.585.02 × 10−73.24 × 10⁻⁷
11.4186.24 × 10−73.38 × 10⁻⁷
11.4281.23 × 10−63.93 × 10⁻⁷
spectral peak period11.4156.43 × 10−73.42 × 10⁻⁷
11.4186.24 × 10−73.38 × 10⁻⁷
11.41115.89 × 10−73.48 × 10⁻⁷
Table 4. Fatigue reliability of tower base under different wind–wave angles (0°, 30°, 60°, and 90°) using DPIM and SSM.
MethodFatigue ReliabilityCPU Time (s)
30°60°90°30°60°90°
DPIM0.7040.7820.9500.99922910229102291022910
SSM0.7140.7760.9550.995767498018588204194732
Disclaimer/Publisher’s Note: The statements, opinions and data contained in all publications are solely those of the individual author(s) and contributor(s) and not of MDPI and/or the editor(s). MDPI and/or the editor(s) disclaim responsibility for any injury to people or property resulting from any ideas, methods, instructions or products referred to in the content.

