
A Prioritization Framework for Adaptation Responses for Climate Change-Induced Erosion in Island Beaches—Cases from the Aegean Islands, Greece

 ,
,  ,
,  ,
,  ,
,
Abstract
1. Introduction
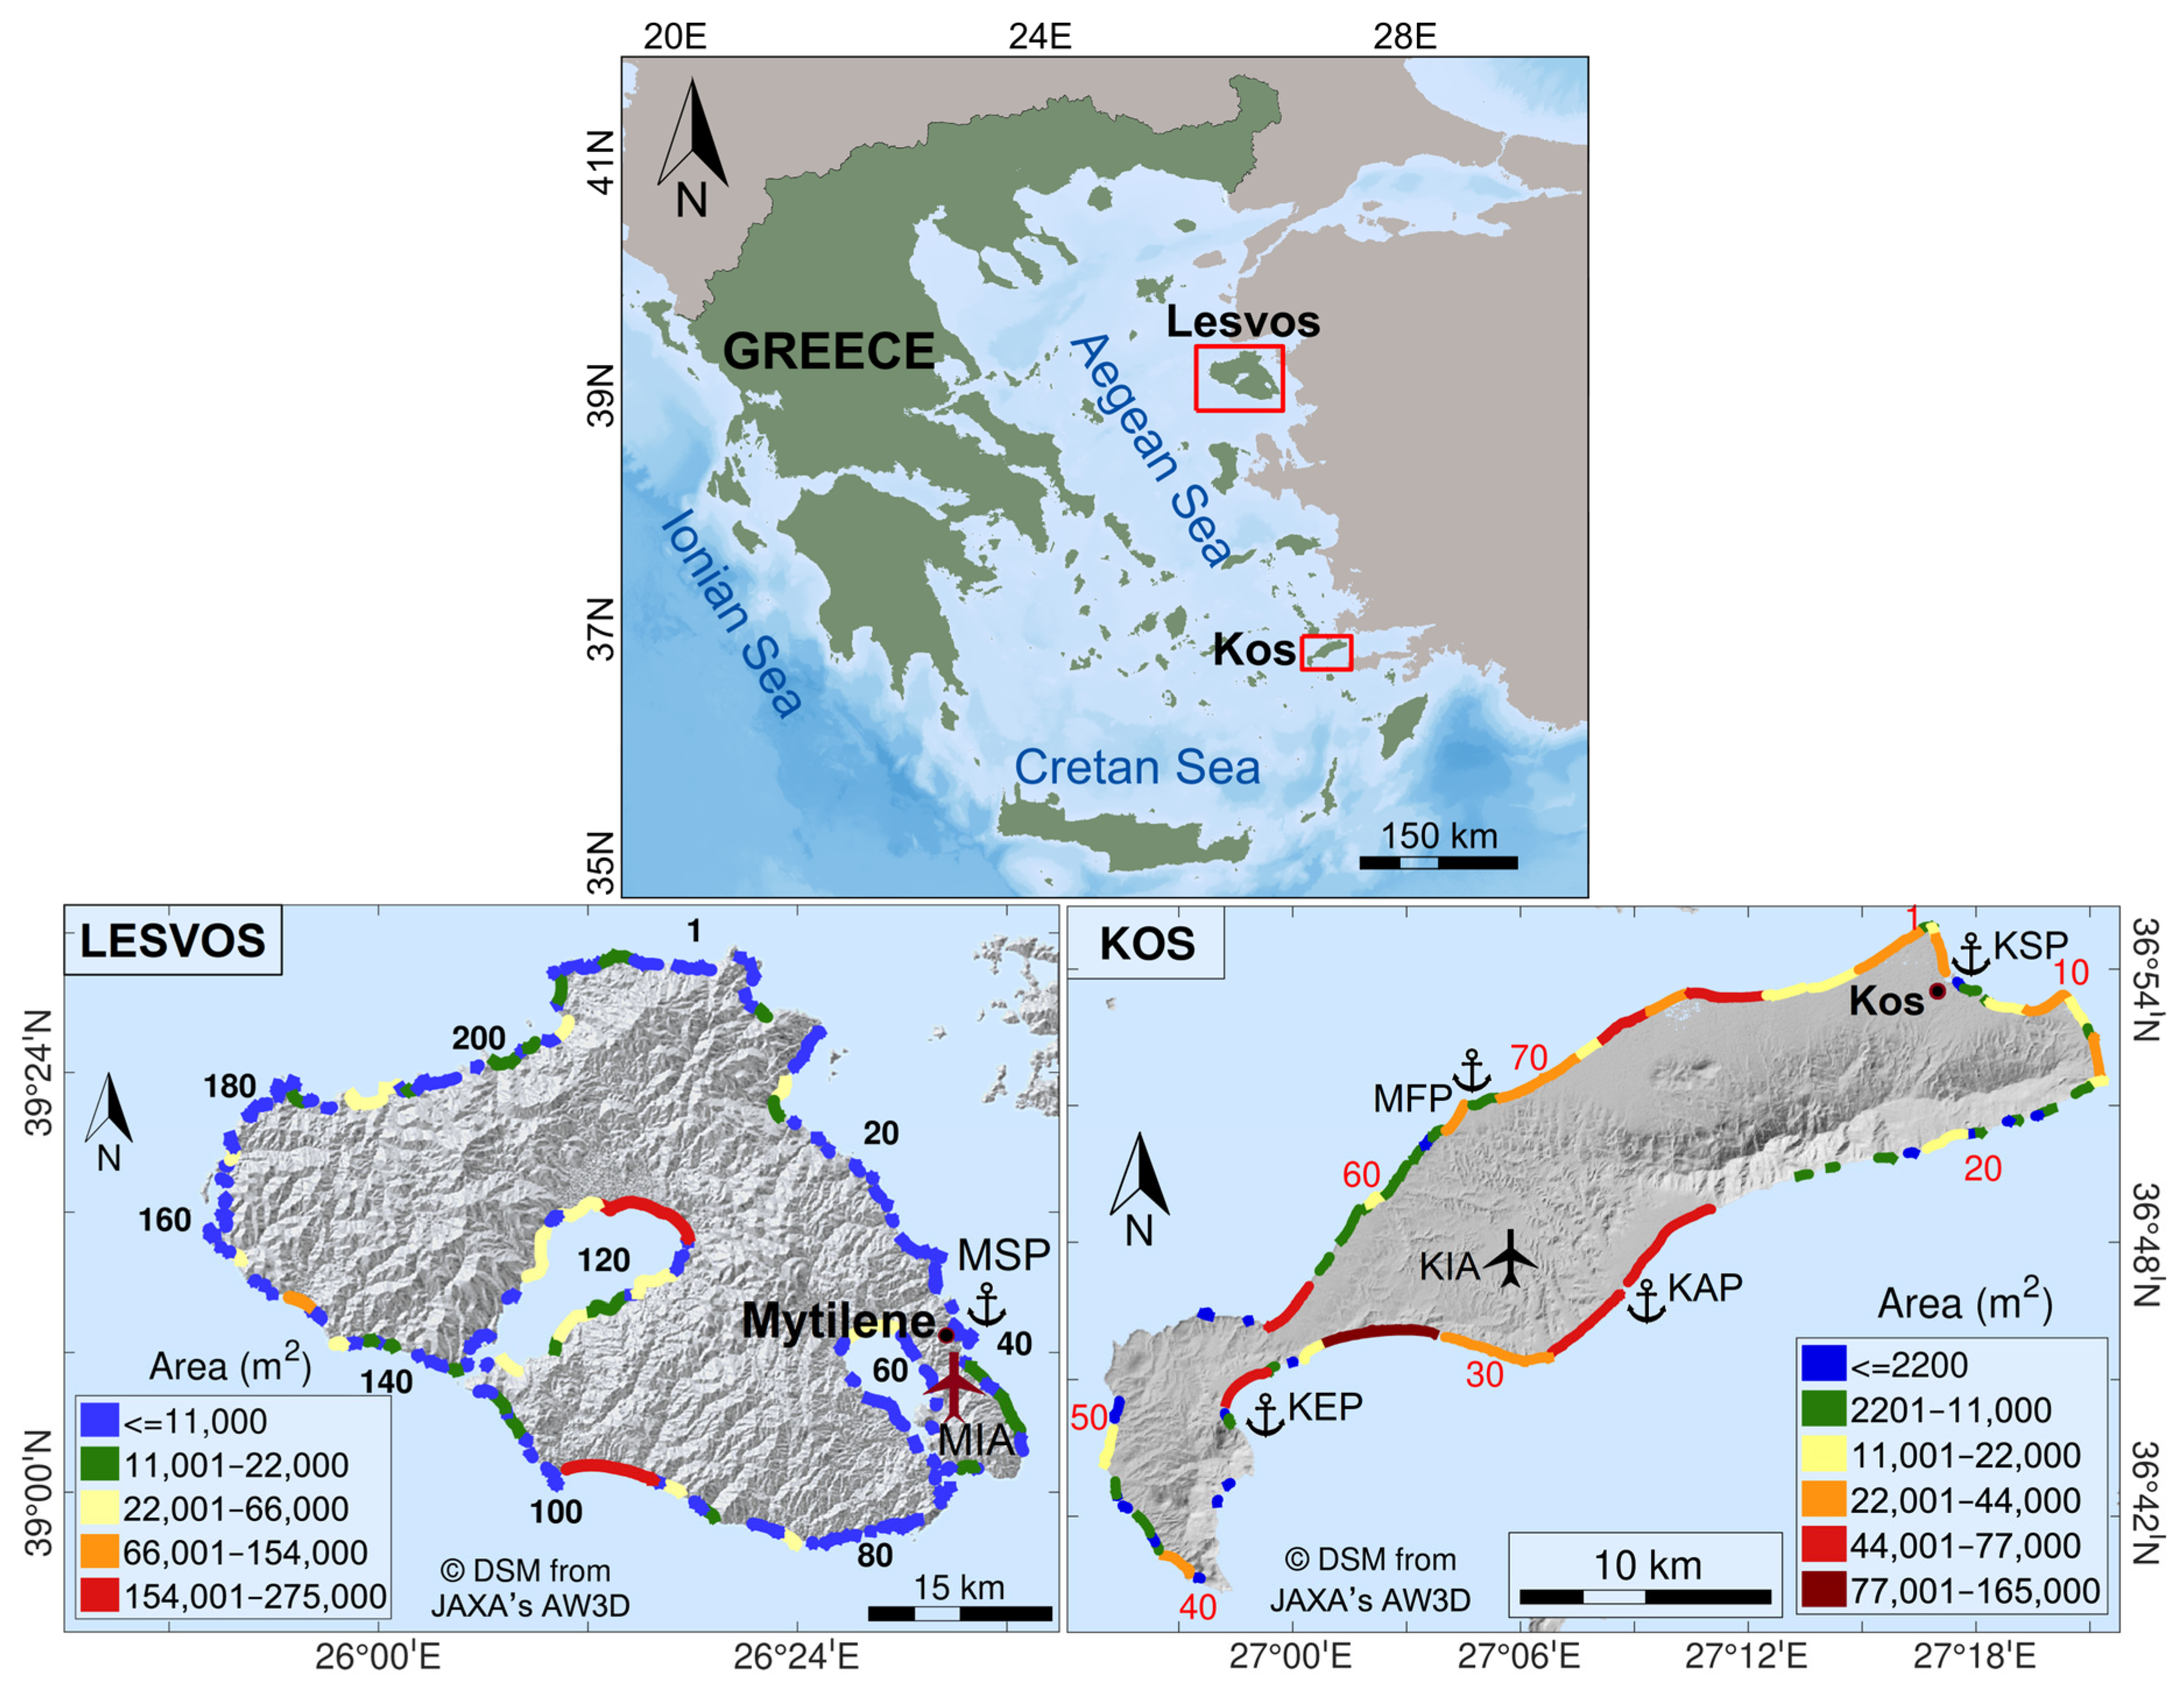
2. Environmental Setting
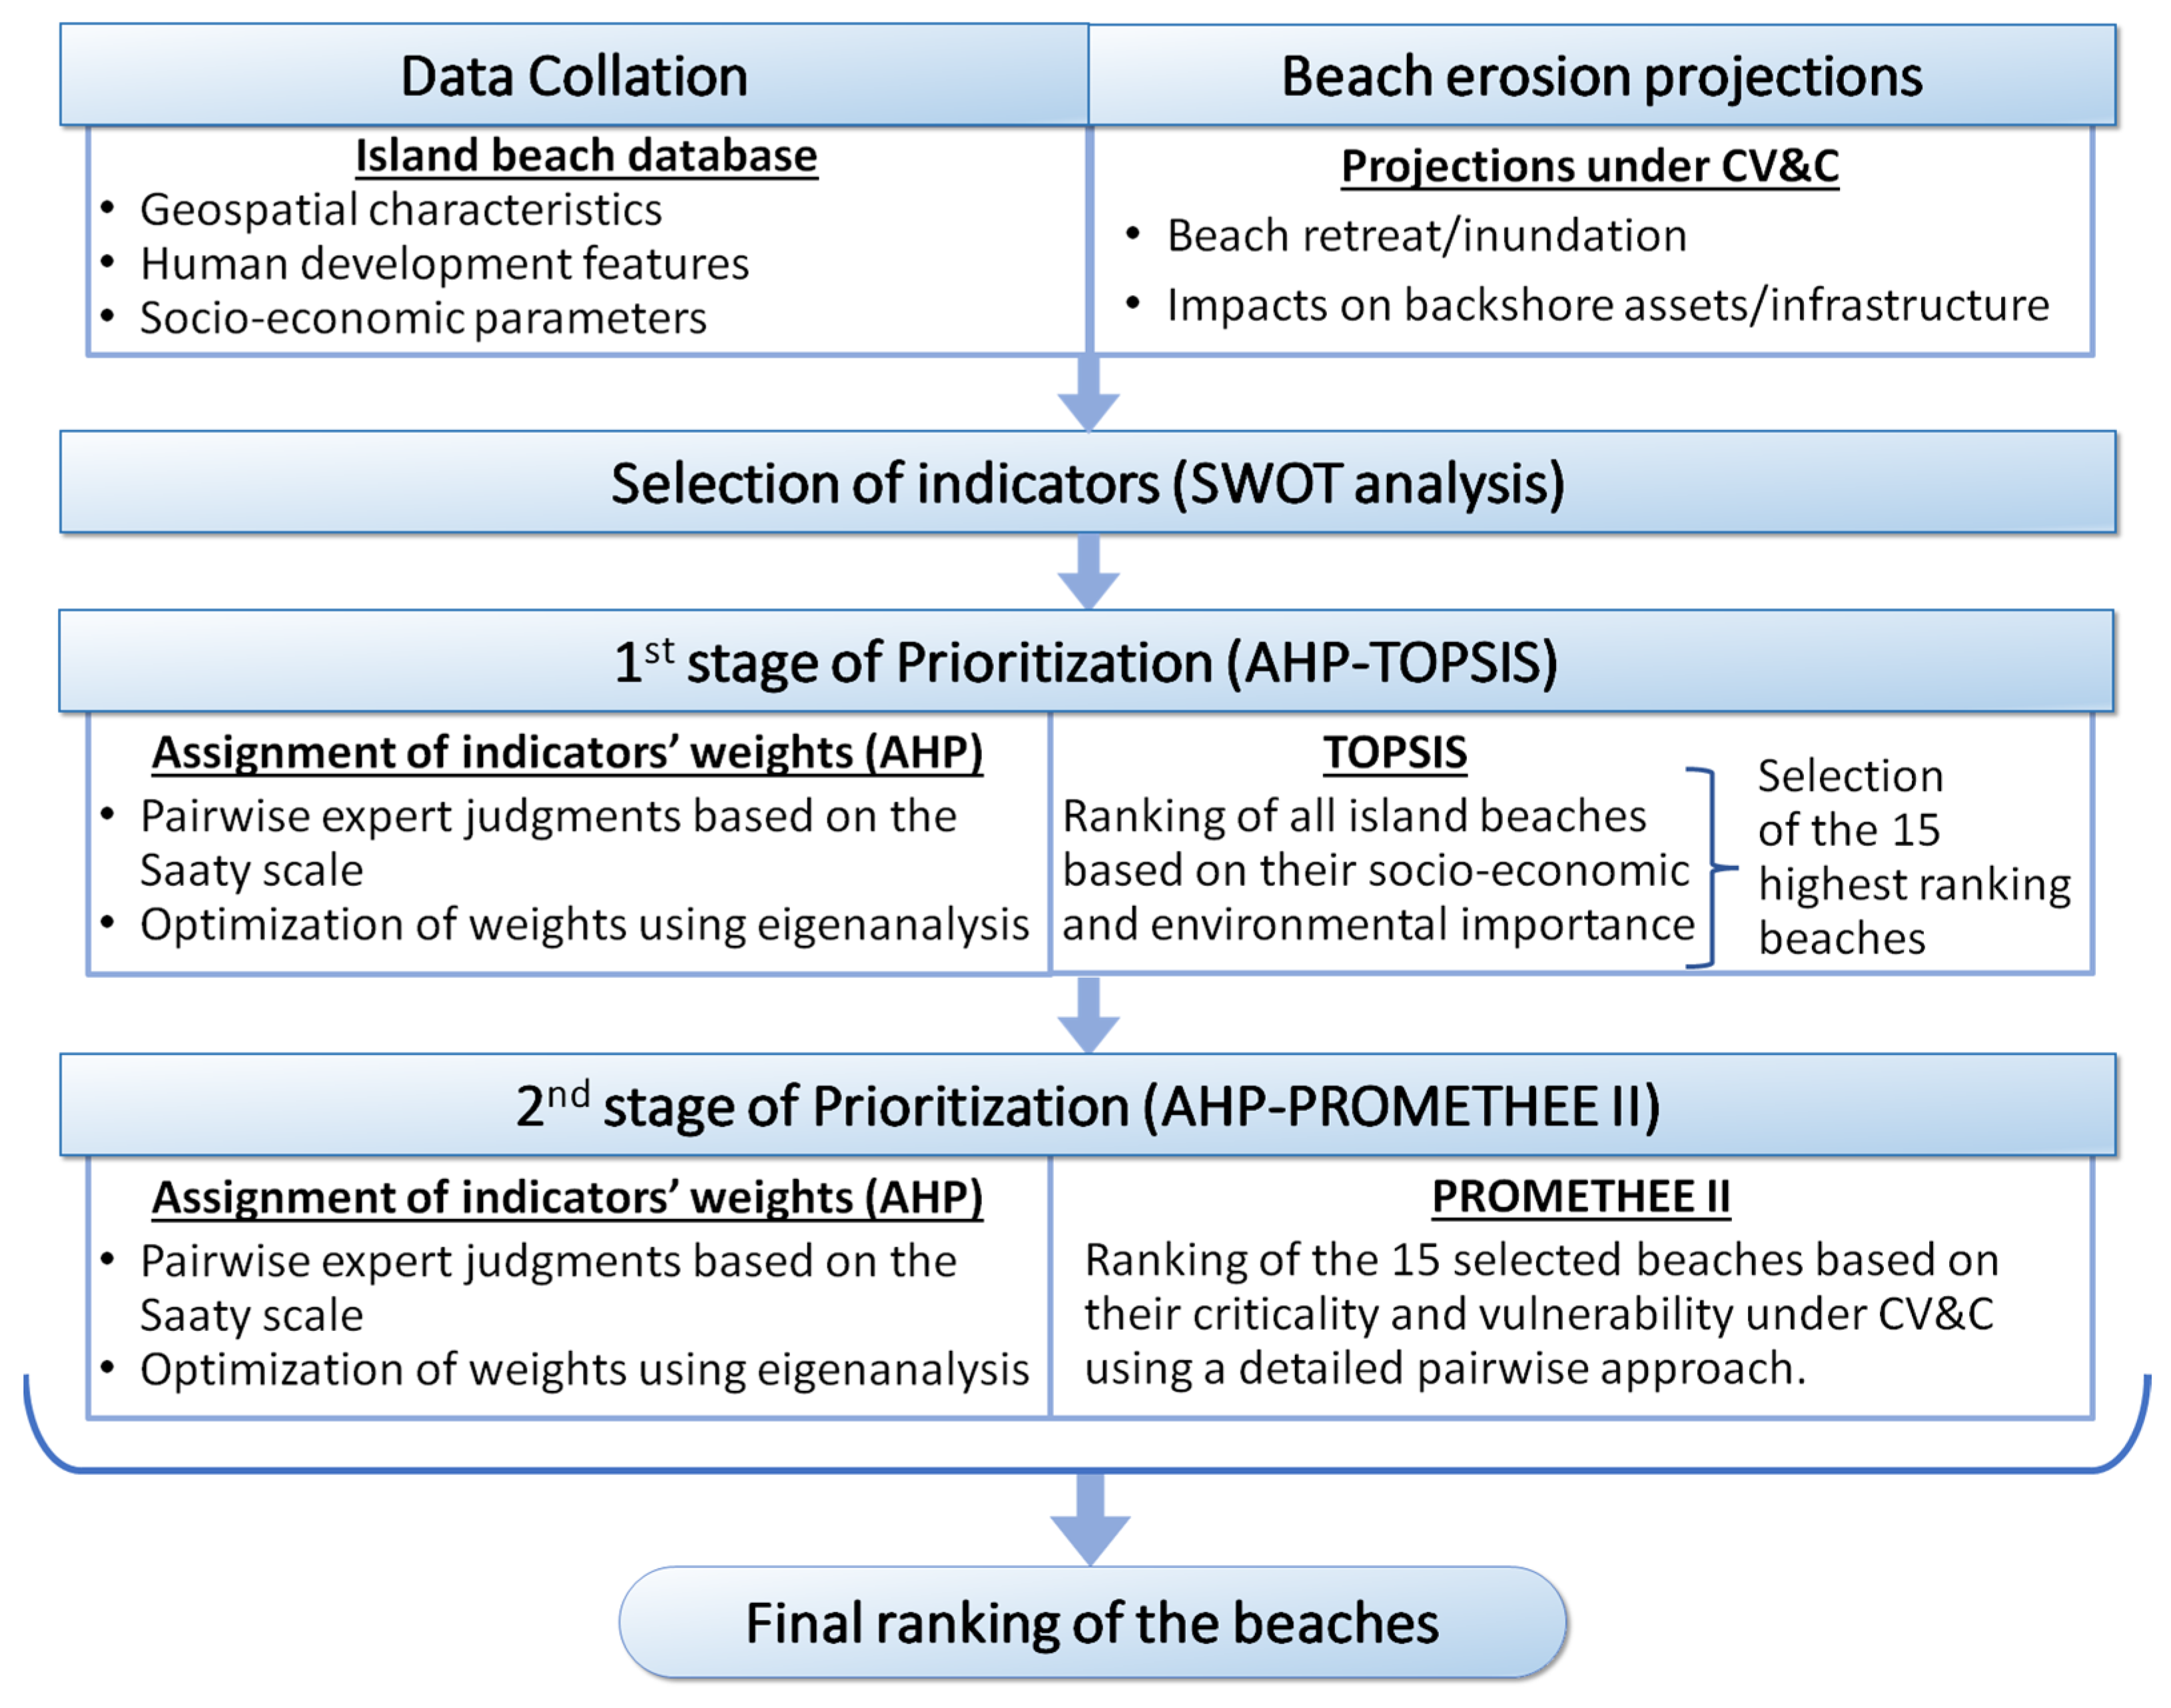
3. Methodology
3.1. Data Collation and Database
3.2. Erosion Projections Under the Mean and Extreme Sea Levels
3.3. Prioritization Framework
4. Results
4.1. SWOT Analysis
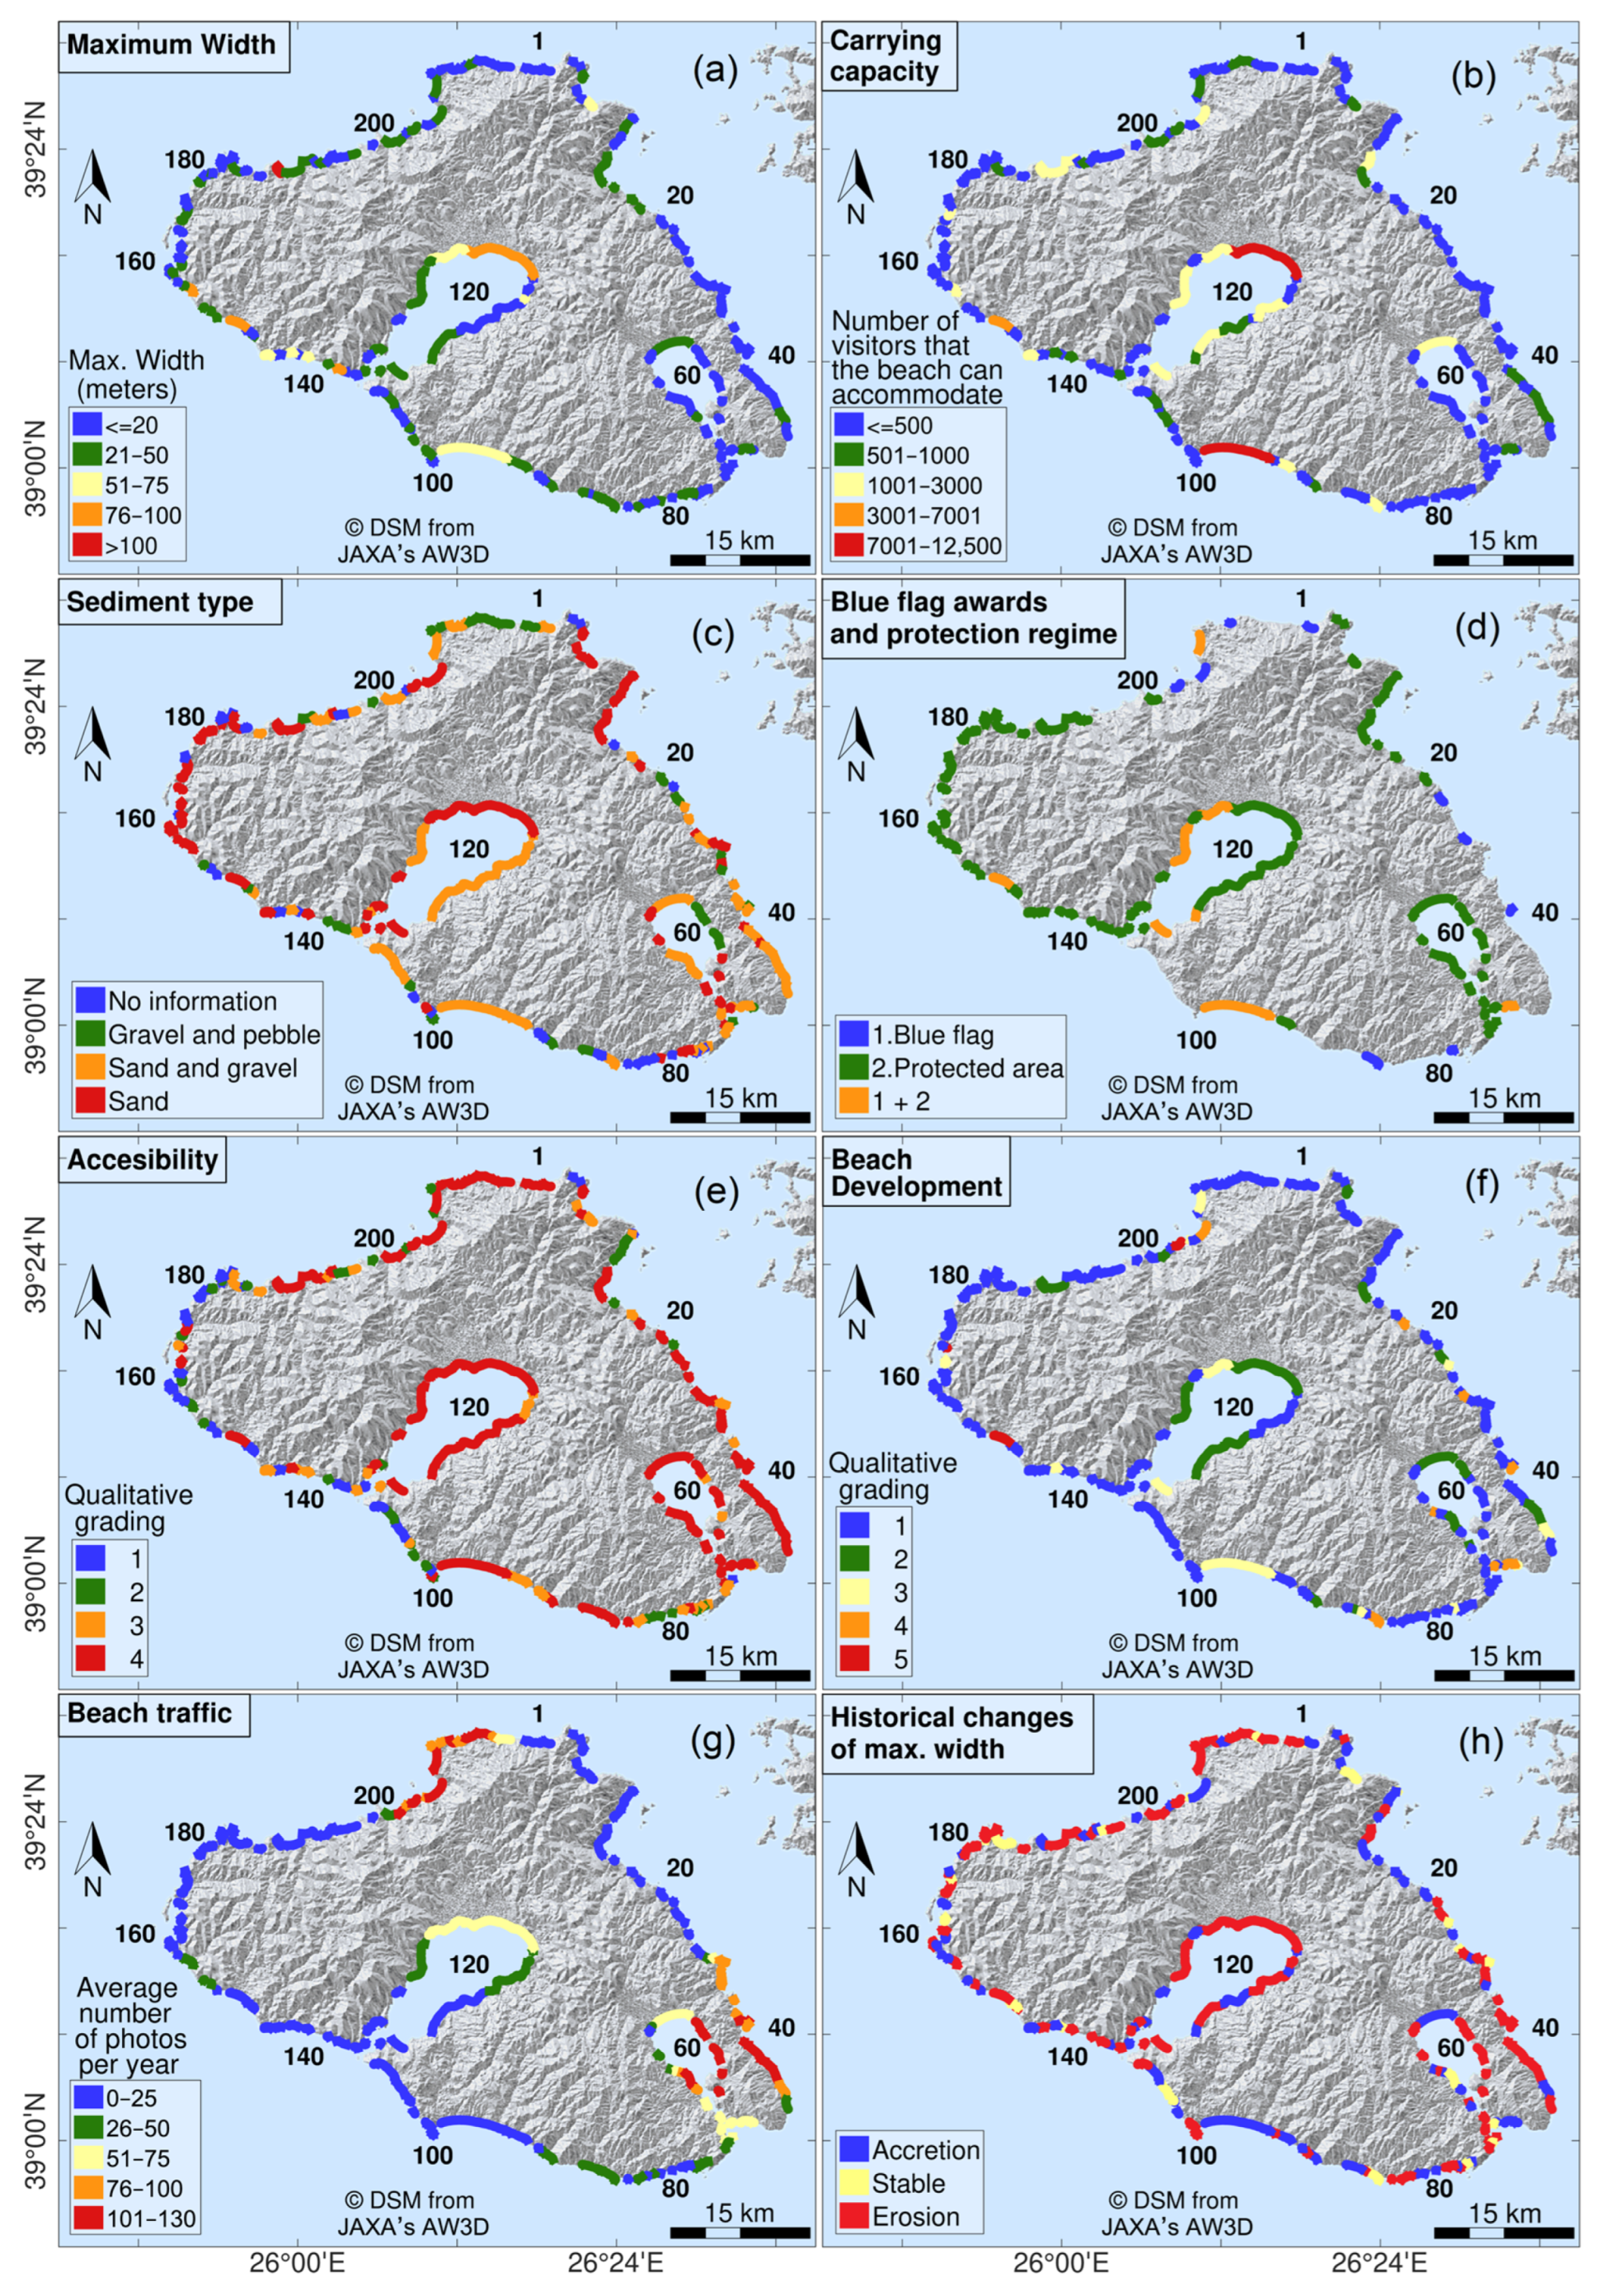
4.2. Indicators
4.2.1. Lesvos
4.2.2. Kos
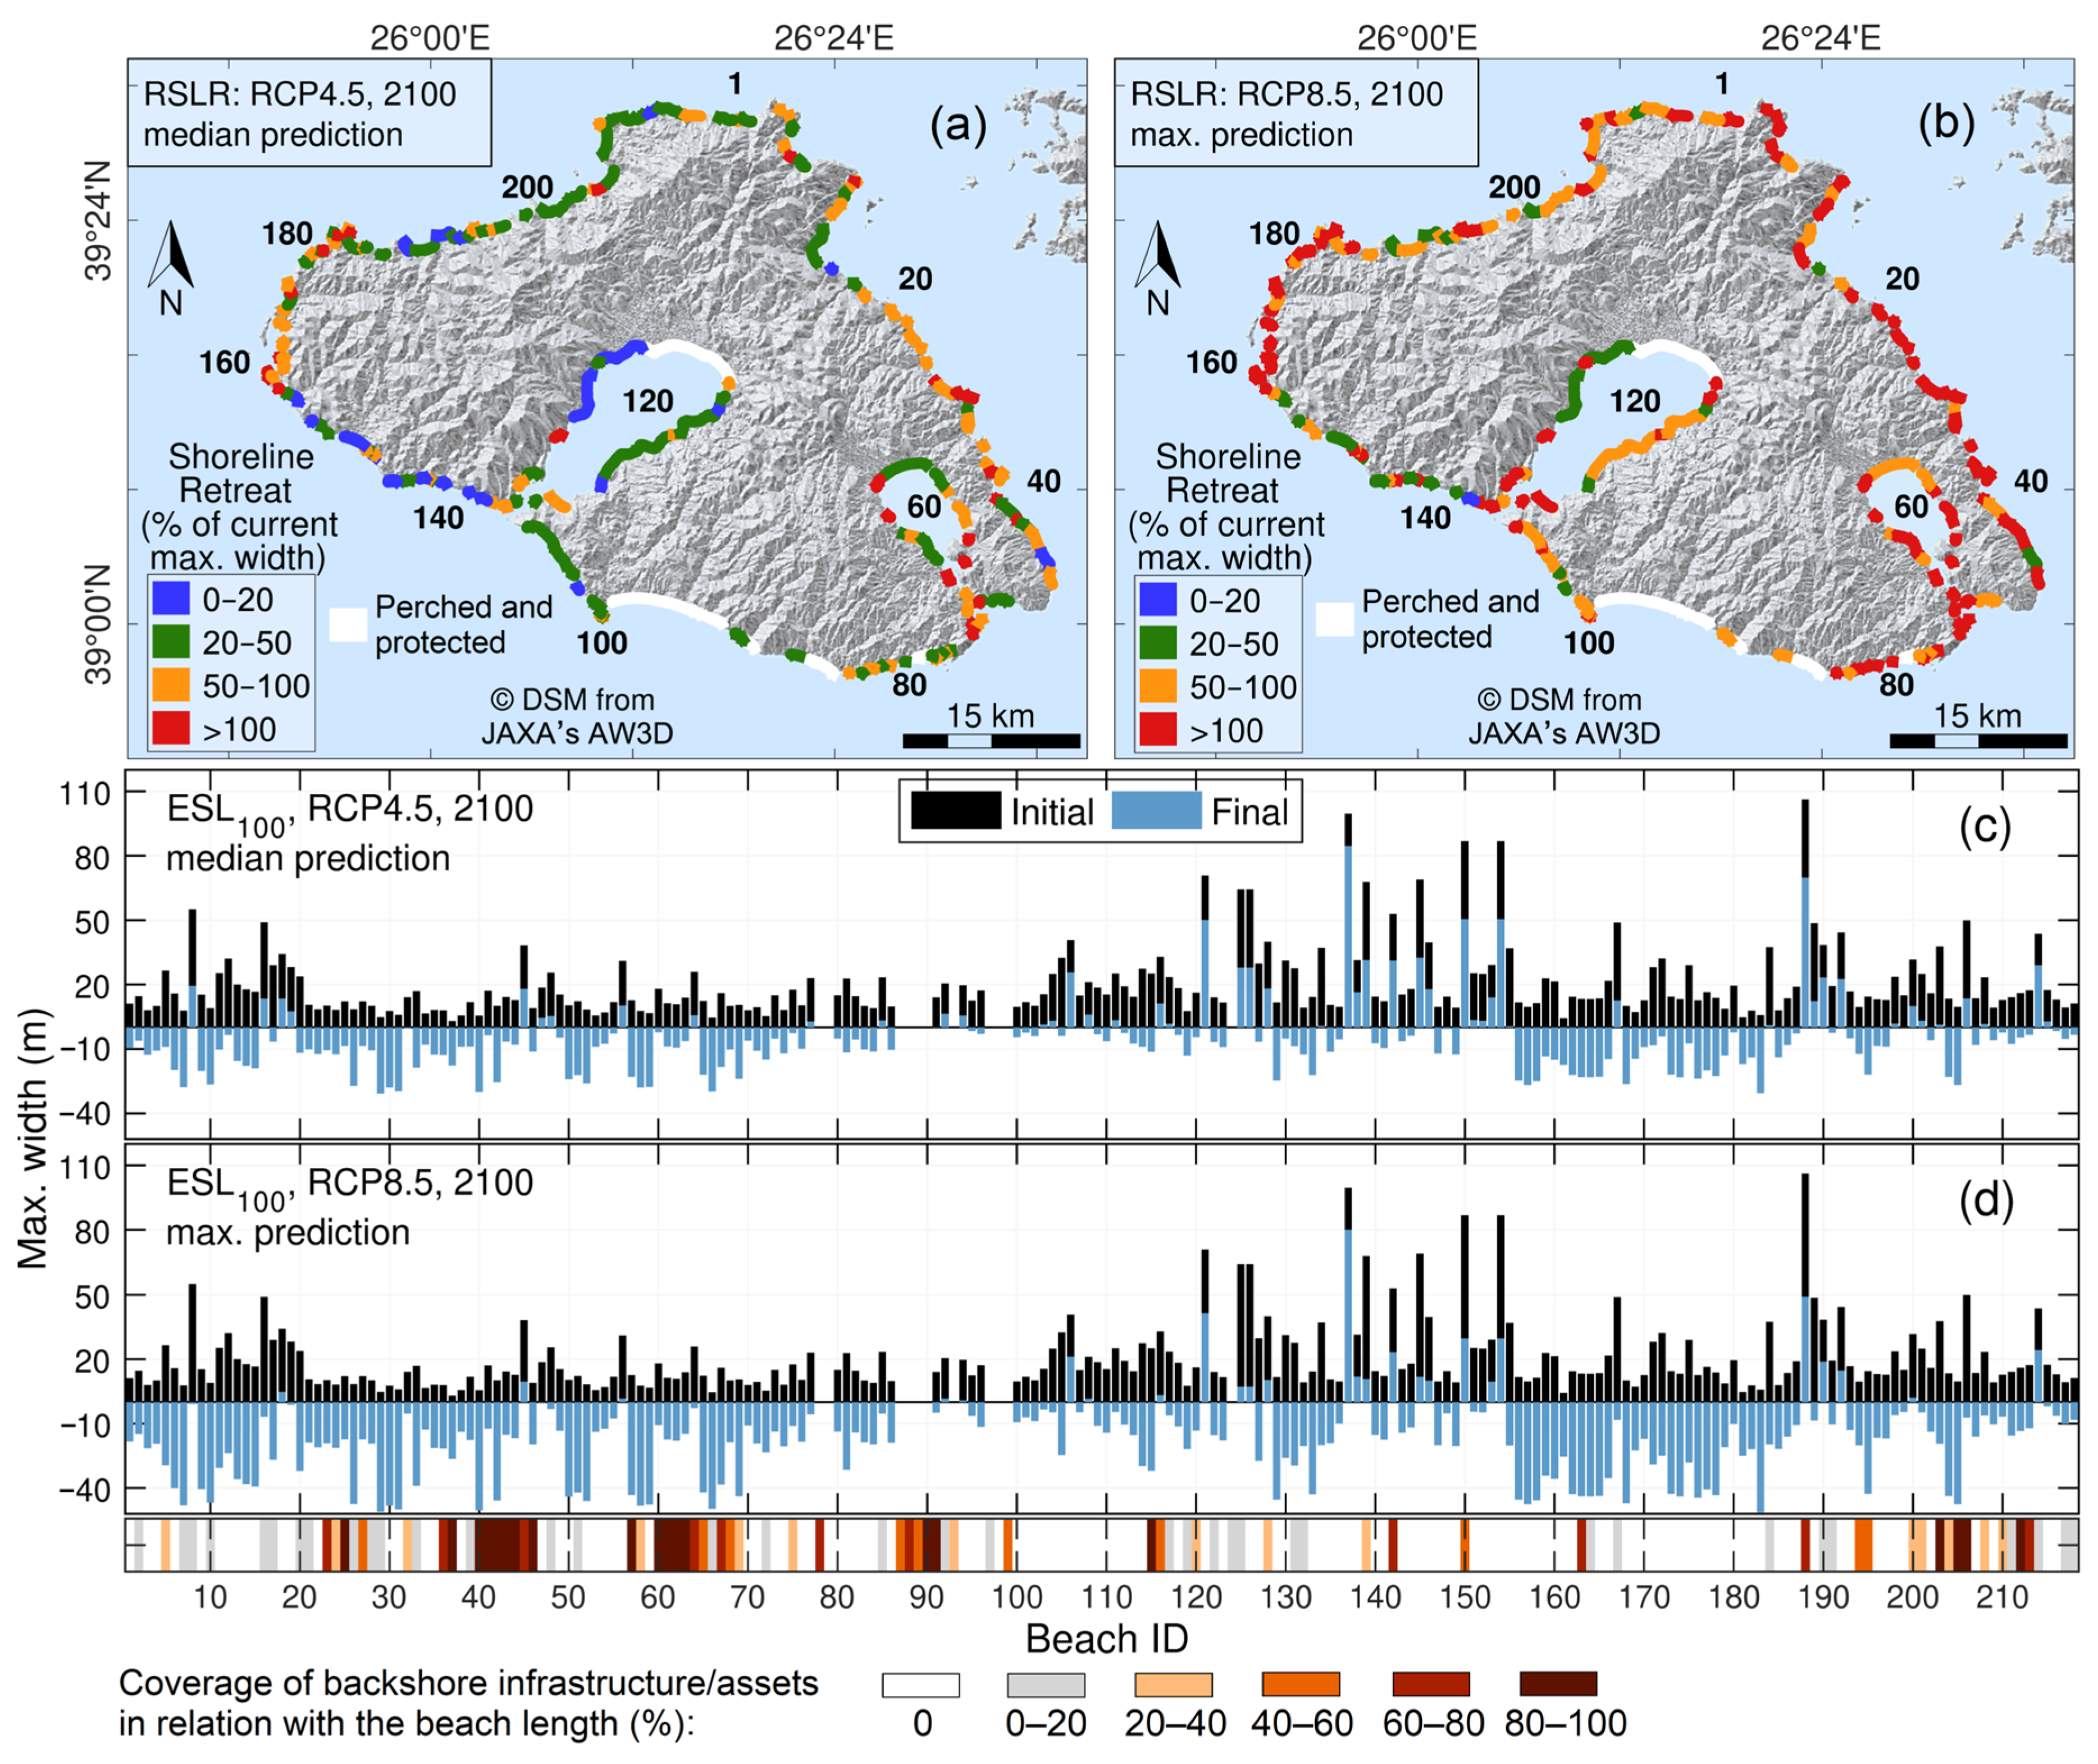
4.3. Beach Erosion: Trends and Projections
4.3.1. Trends of Beach Retreat/Erosion
4.3.2. Projection of Future Beach Retreat/Erosion
4.4. Island Beach Prioritization
5. Discussion
6. Conclusions
Supplementary Materials
Author Contributions
Funding
Institutional Review Board Statement
Informed Consent Statement
Data Availability Statement
Conflicts of Interest
References
- Luijendijk, A.; Hagenaars, G.; Ranasinghe, R.; Baart, F.; Donchyts, G.; Aarninkhof, S. The State of the World’s Beaches. Sci. Rep. 2018, 8, 6641. [Google Scholar] [CrossRef] [PubMed]
- Roy, P.; Pal, S.C.; Chakrabortty, R.; Chowdhuri, I.; Saha, A.; Shit, M. Effects of Climate Change and Sea-Level Rise on Coastal Habitat: Vulnerability Assessment, Adaptation Strategies and Policy Recommendations. J. Environ. Manag. 2023, 330, 117187. [Google Scholar] [CrossRef] [PubMed]
- Ciavola, P.; Harley, M.D.; den Heijer, C. The RISC-KIT Storm Impact Database: A New Tool in Support of DRR. Coast. Eng. 2018, 134, 24–32. [Google Scholar] [CrossRef]
- Toimil, A.; Losada, I.J.; Álvarez-Cuesta, M.; Le Cozannet, G. Demonstrating the Value of Beaches for Adaptation to Future Coastal Flood Risk. Nat. Commun. 2023, 14, 3474. [Google Scholar] [CrossRef]
- UNWTO. International Tourism Highlights; 2024 ed.; World Tourism Organization: Madrid, Spain, 2024; ISBN 978-92-844-2579-2. [Google Scholar]
- Boto-García, D.; Leoni, V. The Hedonic Value of Coastal Amenities in Peer-to-Peer Markets; DEA WP; Departament d’Economia Aplicada, Universitat de Les Illes Balears: Palma, Spain, 2022. [Google Scholar]
- Brett, M.R. How Important Is Coastal Tourism for Island Nations? An Assessment of African and Indian Ocean Islands. J. Coast. Res. 2021, 37, 568–575. [Google Scholar] [CrossRef]
- Peduzzi, P.; Velegrakis, A.; Chatenoux, B.; Estrella, M.; Karambas, T. Assessment of the Role of Nearshore Marine Ecosystems to Mitigate Beach Erosion: The Case of Negril (Jamaica). Environments 2022, 9, 62. [Google Scholar] [CrossRef]
- March, A.; Siddons, B.; Greenhill, L. Rapid Readiness Assessment for the Transition to a Sustainable Blue Economy—Pilot Project in Antigua and Barbuda; The Commonwealth Secretariat: London, UK, 2023. [Google Scholar]
- Pons, G.X.; Martín-Prieto, J.Á.; Carreras-Martí, D. Tourist Visitation and Beach Erosion: Analysis of the Evolution of the Coastline, Frequentation and Beach Area on the Island of Menorca (2001–2015) (Balearic Islands, Spain). In Spanish Tourism Geographies: Territorial Diversity and Different Approaches; Blanco-Romero, A., Blázquez-Salom, M., Eds.; Springer International Publishing: Cham, Switzerland, 2023; pp. 227–243. ISBN 978-3-031-39780-6. [Google Scholar]
- Vandarakis, D.; Malliouri, D.; Petrakis, S.; Kapsimalis, V.; Moraitis, V.; Hatiris, G.-A.; Panagiotopoulos, I. Carrying Capacity and Assessment of the Tourism Sector in the South Aegean Region, Greece. Water 2023, 15, 2616. [Google Scholar] [CrossRef]
- Mentaschi, L.; Vousdoukas, M.I.; Pekel, J.-F.; Voukouvalas, E.; Feyen, L. Global Long-Term Observations of Coastal Erosion and Accretion. Sci. Rep. 2018, 8, 12876. [Google Scholar] [CrossRef]
- Vousdoukas, M.I.; Ranasinghe, R.; Mentaschi, L.; Plomaritis, T.A.; Athanasiou, P.; Luijendijk, A.; Feyen, L. Sandy Coastlines under Threat of Erosion. Nat. Clim. Chang. 2020, 10, 260–263. [Google Scholar] [CrossRef]
- Bozzeda, F.; Ortega, L.; Costa, L.L.; Fanini, L.; Barboza, C.A.M.; McLachlan, A.; Defeo, O. Global Patterns in Sandy Beach Erosion: Unraveling the Roles of Anthropogenic, Climatic and Morphodynamic Factors. Front. Mar. Sci. 2023, 10, 1270490. [Google Scholar] [CrossRef]
- IPCC. Climate Change 2023: Synthesis Report. Contribution of Working Groups I, II and III to the Sixth Assessment Report of the Intergovernmental Panel on Climate Change; Core Writing Team, Lee, H., Romero, J., Eds.; IPCC: Geneva, Switzerland, 2023. [Google Scholar]
- Jevrejeva, S.; Williams, J.; Vousdoukas, M.I.; Jackson, L.P. Future Sea Level Rise Dominates Changes in Worst Case Extreme Sea Levels along the Global Coastline by 2100. Environ. Res. Lett. 2023, 18, 024037. [Google Scholar] [CrossRef]
- Vousdoukas, M.I.; Athanasiou, P.; Giardino, A.; Mentaschi, L.; Stocchino, A.; Kopp, R.E.; Menéndez, P.; Beck, M.W.; Ranasinghe, R.; Feyen, L. Small Island Developing States under Threat by Rising Seas Even in a 1.5 °C Warming World. Nat. Sustain. 2023, 6, 1552–1564. [Google Scholar] [CrossRef]
- Nicholls, R.J.; Cazenave, A. Sea-Level Rise and Its Impact on Coastal Zones. Science (1979) 2010, 328, 1517–1520. [Google Scholar] [CrossRef]
- Di Paola, G.; Rodríguez, G.; Rosskopf, C.M. Shoreline Dynamics and Beach Erosion. Geosciences 2023, 13, 74. [Google Scholar] [CrossRef]
- Monioudi, I.N.; Velegrakis, A.F. Beach Carrying Capacity at Touristic 3S Destinations: Its Significance, Projected Decreases and Adaptation Options under Climate Change. J. Tour. Hosp. 2022, 11, 1000500. [Google Scholar] [CrossRef]
- Chalazas, T.; Bove, G.; Chatzistratis, D.; Monioudi, I.N.; Velegrakis, A.F. A System for the Management of Sandy Shorelines under Climate Change: United States Virgin Islands (USVI). Ambio 2024, 53, 406–420. [Google Scholar] [CrossRef]
- Dong, W.S.; Ismailluddin, A.; Yun, L.S.; Ariffin, E.H.; Saengsupavanich, C.; Abdul Maulud, K.N.; Ramli, M.Z.; Miskon, M.F.; Jeofry, M.H.; Mohamed, J.; et al. The Impact of Climate Change on Coastal Erosion in Southeast Asia and the Compelling Need to Establish Robust Adaptation Strategies. Heliyon 2024, 10, e25609. [Google Scholar] [CrossRef] [PubMed]
- Saengsupavanich, C. Successful Coastal Protection by Step Concrete Revetments in Thailand. IOP Conf. Ser. Earth Environ. Sci. 2022, 1072, 012002. [Google Scholar] [CrossRef]
- UNFCCC. Policy Brief: Technologies for Averting, Minimizing and Addressing Loss and Damage in Coastal Zones; United Nations Framework Convention on Climate Change: Rio de Janeiro, Brazil; New York, NY, USA, 2020. [Google Scholar]
- Vousdoukas, M.I.; Mentaschi, L.; Voukouvalas, E.; Verlaan, M.; Jevrejeva, S.; Jackson, L.P.; Feyen, L. Global Probabilistic Projections of Extreme Sea Levels Show Intensification of Coastal Flood Hazard. Nat. Commun. 2018, 9, 2360. [Google Scholar] [CrossRef]
- Monioudi, I.N.; Velegrakis, A.F.; Chatzistratis, D.; Vousdoukas, M.I.; Savva, C.; Wang, D.; Bove, G.; Mentaschi, L.; Paprotny, D.; Morales-Nápoles, O.; et al. Climate Change—Induced Hazards on Touristic Island Beaches: Cyprus, Eastern Mediterranean. Front. Mar. Sci. 2023, 10, 1188896. [Google Scholar] [CrossRef]
- Narayan, S.; Beck, M.W.; Reguero, B.G.; Losada, I.J.; van Wesenbeeck, B.; Pontee, N.; Sanchirico, J.N.; Ingram, J.C.; Lange, G.-M.; Burks-Copes, K.A. The Effectiveness, Costs and Coastal Protection Benefits of Natural and Nature-Based Defences. PLoS ONE 2016, 11, e0154735. [Google Scholar] [CrossRef] [PubMed]
- Tanim, A.H.; Goharian, E.; Moradkhani, H. Integrated Socio-Environmental Vulnerability Assessment of Coastal Hazards Using Data-Driven and Multi-Criteria Analysis Approaches. Sci. Rep. 2022, 12, 11625. [Google Scholar] [CrossRef]
- Cruz-Ramírez, C.J.; Chávez, V.; Silva, R.; Muñoz-Perez, J.J.; Rivera-Arriaga, E. Coastal Management: A Review of Key Elements for Vulnerability Assessment. J. Mar. Sci. Eng. 2024, 12, 386. [Google Scholar] [CrossRef]
- Hzami, A.; Heggy, E.; Amrouni, O.; Mahé, G.; Maanan, M.; Abdeljaouad, S. Alarming Coastal Vulnerability of the Deltaic and Sandy Beaches of North Africa. Sci. Rep. 2021, 11, 2320. [Google Scholar] [CrossRef] [PubMed]
- Yin, J.; Yin, Z.; Wang, J.; Xu, S. National Assessment of Coastal Vulnerability to Sea-Level Rise for the Chinese Coast. J. Coast. Conserv. 2012, 16, 123–133. [Google Scholar] [CrossRef]
- Toimil, A.; Losada, I.J.; Díaz-Simal, P.; Izaguirre, C.; Camus, P. Multi-Sectoral, High-Resolution Assessment of Climate Change Consequences of Coastal Flooding. Clim. Chang. 2017, 145, 431–444. [Google Scholar] [CrossRef]
- Gornitz, V. Global Coastal Hazards from Future Sea Level Rise. Palaeogeogr. Palaeoclim. Palaeoecol. 1991, 89, 379–398. [Google Scholar] [CrossRef]
- Durap, A.; Balas, C.E. Towards Sustainable Coastal Management: A Hybrid Model for Vulnerability and Risk Assessment. J. Coast. Conserv. 2024, 28, 66. [Google Scholar] [CrossRef]
- Roukounis, C.N.; Tsihrintzis, V.A. Indices of Coastal Vulnerability to Climate Change: A Review. Environ. Process. 2022, 9, 29. [Google Scholar] [CrossRef]
- Furlan, E.; Pozza, P.D.; Michetti, M.; Torresan, S.; Critto, A.; Marcomini, A. Development of a Multi-Dimensional Coastal Vulnerability Index: Assessing Vulnerability to Inundation Scenarios in the Italian Coast. Sci. Total Environ. 2021, 772, 144650. [Google Scholar] [CrossRef]
- Ahmed, M.A.; Sridharan, B.; Saha, N.; Sannasiraj, S.A.; Kuiry, S.N. Assessment of Coastal Vulnerability for Extreme Events. Int. J. Disaster Risk Reduct. 2022, 82, 103341. [Google Scholar] [CrossRef]
- Bagdanavičiūtė, I.; Kelpšaitė, L.; Soomere, T. Multi-Criteria Evaluation Approach to Coastal Vulnerability Index Development in Micro-Tidal Low-Lying Areas. Ocean Coast. Manag. 2015, 104, 124–135. [Google Scholar] [CrossRef]
- Tahri, M.; Maanan, M.; Maanan, M.; Bouksim, H.; Hakdaoui, M. Using Fuzzy Analytic Hierarchy Process Multi-Criteria and Automatic Computation to Analyse Coastal Vulnerability. Prog. Phys. Geogr. Earth Environ. 2017, 41, 268–285. [Google Scholar] [CrossRef]
- Maanan, M.; Maanan, M.; Rueff, H.; Adouk, N.; Zourarah, B.; Rhinane, H. Assess the Human and Environmental Vulnerability for Coastal Hazard by Using a Multi-Criteria Decision Analysis. Hum. Ecol. Risk Assess. Int. J. 2018, 24, 1642–1658. [Google Scholar] [CrossRef]
- De Serio, F.; Armenio, E.; Mossa, M.; Petrillo, A.F. How to Define Priorities in Coastal Vulnerability Assessment. Geosciences 2018, 8, 415. [Google Scholar] [CrossRef]
- Sekovski, I.; Del Río, L.; Armaroli, C. Development of a Coastal Vulnerability Index Using Analytical Hierarchy Process and Application to Ravenna Province (Italy). Ocean Coast. Manag. 2020, 183, 104982. [Google Scholar] [CrossRef]
- HSA. Hellenic Statistical Authority: ‘Results of Population and Residencies Census of 2021’. Available online: https://kede.gr/wp-content/uploads/2023/04/APOF_APOT_MON_DHM_KOIN.pdf (accessed on 30 November 2024). (In Greek).
- SETE. Annual Report of Competitiveness and Structural Adjustment in the Touristic Sector for the Year 2023: Administrative Region of North Aegean. Available online: https://insete.gr/wp-content/uploads/2024/12/24-12_North_Aegean-1.pdf (accessed on 30 November 2024). (In Greek).
- SETE. Annual Report of Competitiveness and Structural Adjustment in the Touristic Sector for the Year 2023: Administrative Region of South Aegean. Available online: https://insete.gr/wp-content/uploads/2024/12/24-12_South_Aegean-1.pdf (accessed on 30 November 2024). (In Greek).
- Higgins, M.D. Greek Islands, Geology; Gillespie, R., Clague, D., Eds.; University of California Press: Berkeley, CA, USA, 2009; pp. 392–396. ISBN 9780520943728. [Google Scholar]
- Zouros, N.C. Lesvos Petrified Forest Geopark, Greece: Geoconservation, Geotourism, and Local Development. Georg. Wright Forum 2010, 27, 19–28. [Google Scholar]
- Piper, D.J.W.; Pe-Piper, G. A Reworked Isolated Deposit of the Kos Plateau Tuff and Its Significance for Dating Raised Marine Terraces, Kos, Greece. Geol. Mag. 2020, 157, 2021–2032. [Google Scholar] [CrossRef]
- Tsimplis, M.N.; Proctor, R.; Flather, R.A. A Two-Dimensional Tidal Model for the Mediterranean Sea. J. Geophys. Res. Ocean. 1995, 100, 16223–16239. [Google Scholar] [CrossRef]
- Korres, G.; Ravdas, M.; Zacharioudaki, A. Mediterranean Sea Waves Hindcast (CMEMS MED-Waves) [Data Set]. Copernicus Monitoring Environment Marine Service (CMEMS). Available online: https://www.cmcc.it/doi/mediterranean-sea-waves-hindcast-cmems-med-waves (accessed on 9 February 2025). [CrossRef]
- Zacharioudaki, A.; Ravdas, M.; Korres, G. Mediterranean Production Centre MEDSEA_MULTIYEAR_WAV_006_012. Available online: https://documentation.marine.copernicus.eu/QUID/CMEMS-MED-QUID-006-012.pdf (accessed on 9 February 2025).
- Velegrakis, A.F.; Monioudi, I.; Tzoraki, O.; Vousdoukas, M.I.; Tragou, E.; Hasiotis, T.; Asariotis, R.; Andreadis, O. Coastal Hazards and Related Impacts in Greece. In The Geography of Greece: Managing Crises and Building Resilience; Darques, R., Sidiropoulos, G., Kalabokidis, K., Eds.; Springer International Publishing: Cham, Switzerland, 2024; pp. 353–370. ISBN 978-3-031-29819-6. [Google Scholar]
- Tsimplis, M.N.; Shaw, A.G.P. Seasonal Sea Level Extremes in the Mediterranean Sea and at the Atlantic European Coasts. Nat. Hazards Earth Syst. Sci. 2010, 10, 1457–1475. [Google Scholar] [CrossRef]
- Tsoukala, V.K.; Chondros, M.; Kapelonis, Z.G.; Martzikos, N.; Lykou, A.; Belibassakis, K.; Makropoulos, C. An Integrated Wave Modelling Framework for Extreme and Rare Events for Climate Change in Coastal Areas—The Case of Rethymno, Crete. Oceanologia 2016, 58, 71–89. [Google Scholar] [CrossRef]
- Monioudi, I.N.; Velegrakis, A.F.; Chatzipavlis, A.E.; Rigos, A.; Karambas, T.; Vousdoukas, M.I.; Hasiotis, T.; Koukourouvli, N.; Peduzzi, P.; Manoutsoglou, E.; et al. Assessment of Island Beach Erosion Due to Sea Level Rise: The Case of the Aegean Archipelago (Eastern Mediterranean). Nat. Hazards Earth Syst. Sci. 2017, 17, 449–466. [Google Scholar] [CrossRef]
- Jevrejeva, S.; Jackson, L.P.; Riva, R.E.M.; Grinsted, A.; Moore, J.C. Coastal Sea Level Rise with Warming above 2 °C. Proc. Natl. Acad. Sci. USA 2016, 113, 13342–13347. [Google Scholar] [CrossRef]
- Muis, S.; Verlaan, M.; Winsemius, H.C.; Aerts, J.C.J.H.; Ward, P.J. A Global Reanalysis of Storm Surges and Extreme Sea Levels. Nat. Commun. 2016, 7, 11969. [Google Scholar] [CrossRef]
- Tolman, H.L. User Manual and System Documentation of WAVEWATCH III Version 3.14; U.S. Department of Commerce National Oceanic and Atmospheric Administration, National Weather Service, National Centers for Environmental Prediction: College Park, MD, USA, 2009. [Google Scholar]
- Monioudi, I.Ν.; Asariotis, R.; Becker, A.; Bhat, C.; Dowding-Gooden, D.; Esteban, M.; Feyen, L.; Mentaschi, L.; Nikolaou, A.; Nurse, L.; et al. Climate Change Impacts on Critical International Transportation Assets of Caribbean Small Island Developing States (SIDS): The Case of Jamaica and Saint Lucia. Reg. Environ. Change 2018, 18, 2211–2225. [Google Scholar] [CrossRef]
- CEM. Coastal Engineering Manual; U.S. Army Corps of Engineers: Washington, DC, USA, 2002. [Google Scholar]
- Bruun, P. The Bruun Rule of Erosion by Sea-Level Rise: A Discussion on Large-Scale Two- and Three-Dimensional Usages. J. Coast. Res. 1988, 4, 627–648. [Google Scholar]
- Dean, R.G. Equilibrium Beach Profiles: Characteristics and Applications. J. Coast. Res. 1991, 7, 53–84. [Google Scholar]
- Edelman, T. Dune Erosion During Storm Conditions. In Proceedings of the 13th Conference on Coastal Engineering, Vancouver, BC, Canada, 10–14 July 1972; ASCE: Vancouver, BC, Canada, 1972; Volume 2, pp. 1305–1311. [Google Scholar]
- Larson, M.; Kraus, N.C. SBEACH: Numerical Model for Simulating Storm-Induced Beach Change; Report 1: Empirical Foundation and Model Development; U.S. Army Coastal Engineering Research Center: Washington, DC, USA, 1989. [Google Scholar]
- Leont’yev, I.O. Numerical Modelling of Beach Erosion during Storm Event. Coast. Eng. 1996, 29, 187–200. [Google Scholar] [CrossRef]
- Roelvink, D.; Reniers, A.; Van Dongeren, A.; Van Thiel De Vries, J.; Lescinski, J.; Report, R.M. XBeach Model Description and Manual; Unesco-IHE Institute for Water Education, Deltares and Delft University of Technology: Delft, The Netherlands, 2010. [Google Scholar]
- Karambas, T.V.; Koutitas, C. Surf and Swash Zone Morphology Evolution Induced by Nonlinear Waves. J. Waterw. Port Coast. Ocean Eng. 2002, 128, 102–113. [Google Scholar] [CrossRef]
- Athanasiou, P. Global Distribution of Nearshore Slopes, (Version 1) [Dataset]. 4TU. Centre for Research Data. Available online: https://data.4tu.nl/articles/_/12712265/1 (accessed on 30 November 2024).
- Karambas, T.V. Prediction of Sediment Transport in the Swash-Zone by Using a Nonlinear Wave Model. Cont. Shelf Res. 2006, 26, 599–609. [Google Scholar] [CrossRef]
- Monioudi, I.N.; Karditsa, A.; Chatzipavlis, A.; Alexandrakis, G.; Andreadis, O.P.; Velegrakis, A.F.; Poulos, S.E.; Ghionis, G.; Petrakis, S.; Sifnioti, D.; et al. Assessment of Vulnerability of the Eastern Cretan Beaches (Greece) to Sea Level Rise. Reg. Environ. Change 2016, 16, 1951–1962. [Google Scholar] [CrossRef]
- Reis, A.H.; Gama, C. Sand Size versus Beachface Slope—An Explanation Based on the Constructal Law. Geomorphology 2010, 114, 276–283. [Google Scholar] [CrossRef]
- Bujan, N.; Cox, R.; Masselink, G. From Fine Sand to Boulders: Examining the Relationship between Beach-Face Slope and Sediment Size. Mar. Geol. 2019, 417, 106012. [Google Scholar] [CrossRef]
- Arns, A.; Dangendorf , S.; Jensen, J.; Talke, S.; Bender, J.; Pattiaratchi, C. Sea-Level Rise Induced Amplification of Coastal Protection Design Heights. Sci. Rep. 2017, 7, 40171. [Google Scholar] [CrossRef] [PubMed]
- Tzoraki, O.; Monioudi, I.N.; Velegrakis, A.F.; Moutafis, N.; Pavlogeorgatos, G.; Kitsiou, D. Resilience of Touristic Island Beaches Under Sea Level Rise: A Methodological Framework. Coast. Manag. 2018, 46, 78–102. [Google Scholar] [CrossRef]
- Lukoseviciute, G.; Panagopoulos, T. Management Priorities from Tourists’ Perspectives and Beach Quality Assessment as Tools to Support Sustainable Coastal Tourism. Ocean Coast. Manag. 2021, 208, 105646. [Google Scholar] [CrossRef]
- Wu, Z.; Abdul-Nour, G. Comparison of Multi-Criteria Group Decision-Making Methods for Urban Sewer Network Plan Selection. CivilEng 2020, 1, 26–48. [Google Scholar] [CrossRef]
- Saaty, T.L. Relative Measurement and Its Generalization in Decision Making Why Pairwise Comparisons Are Central in Mathematics for the Measurement of Intangible Factors The Analytic Hierarchy/Network Process. Rev. Real Acad. Cienc. Exactas Fisicas Nat. Ser. A Math. 2008, 102, 251–318. [Google Scholar] [CrossRef]
- Zavadskas, E.K.; Mardani, A.; Turskis, Z.; Jusoh, A.; Nor, K.M. Development of TOPSIS Method to Solve Complicated Decision-Making Problems—An Overview on Developments from 2000 to 2015. Int. J. Inf. Technol. Decis. Mak. 2016, 15, 645–682. [Google Scholar] [CrossRef]
- Chen, C.-L.; Teng, N. Management Priorities and Carrying Capacity at a High-Use Beach from Tourists’ Perspectives: A Way towards Sustainable Beach Tourism. Mar. Policy 2016, 74, 213–219. [Google Scholar] [CrossRef]
- Andreadis, O.; Chatzipavlis, A.; Hasiotis, T.; Monioudi, I.; Manoutsoglou, E.; Velegrakis, A. Assessment of and Adaptation to Beach Erosion in Islands: An Integrated Approach. J. Mar. Sci. Eng. 2021, 9, 859. [Google Scholar] [CrossRef]
- Wood, S.A.; Guerry, A.D.; Silver, J.M.; Lacayo, M. Using Social Media to Quantify Nature-Based Tourism and Recreation. Sci. Rep. 2013, 3, 2976. [Google Scholar] [CrossRef]
- Maity, S.R.; Chakraborty, S. Tool Steel Material Selection Using PROMETHEE II Method. Int. J. Adv. Manuf. Technol. 2015, 78, 1537–1547. [Google Scholar] [CrossRef]
- Kuleli, T.; Bayazit, S. An Integrated Approach to the Spatial Distribution of the Coastal Infrastructure Vulnerability by Using Coastal Vulnerability Index and Hot Spot Analysis: A Case Study of Kusadasi-Selcuk. Nat. Hazards 2024, 120, 14117–14151. [Google Scholar] [CrossRef]
- Abdullah, M.F.; Siraj, S.; Hodgett, R.E. An Overview of Multi-Criteria Decision Analysis (Mcda) Application in Managing Water-Related Disaster Events: Analyzing 20 Years of Literature for Flood and Drought Events. Water 2021, 13, 1358. [Google Scholar] [CrossRef]
- Baldock, T.E.; Gravois, U.; Callaghan, D.P.; Davies, G.; Nichol, S. Methodology for Estimating Return Intervals for Storm Demand and Dune Recession by Clustered and Non-Clustered Morphological Events. Coast. Eng. 2021, 168, 103924. [Google Scholar] [CrossRef]
- Abdul Razak, M.; Ghasemlounıa, R.; Aksel, M. Tourism Impact on Coastal Erosion: A Case of Alanya. Int. J. Environ. Geoinform. 2023, 10, 105–116. [Google Scholar] [CrossRef]
- Velegrakis, A.F.; Vousdoukas, M.I.; Andreadis, O.; Adamakis, G.; Pasakalidou, E.; Meligonitis, R.; Kokolatos, G. Influence of Dams on Downstream Beaches: Eressos, Lesbos, Eastern Mediterranean. Mar. Georesour. Geotechnol. 2008, 26, 350–371. [Google Scholar] [CrossRef]
- Georgoulias, A.K.; Akritidis, D.; Kalisoras, A.; Kapsomenakis, J.; Melas, D.; Zerefos, C.S.; Zanis, P. Climate Change Projections for Greece in the 21st Century from High-Resolution EURO-CORDEX RCM Simulations. Atmos. Res. 2022, 271, 106049. [Google Scholar] [CrossRef]
- Politi, N.; Vlachogiannis, D.; Sfetsos, A.; Nastos, P.T. High Resolution Projections for Extreme Temperatures and Precipitation over Greece. Clim. Dyn. 2023, 61, 633–667. [Google Scholar] [CrossRef]
- de Freitas, C.R.; Scott, D.; McBoyle, G. A Second Generation Climate Index for Tourism (CIT): Specification and Verification. Int. J. Biometeorol. 2008, 52, 399–407. [Google Scholar] [CrossRef] [PubMed]
- Semeoshenkova, V.; Newton, A.; Contin, A.; Greggio, N. Development and Application of an Integrated Beach Quality Index (BQI). Ocean Coast. Manag. 2017, 143, 74–86. [Google Scholar] [CrossRef]


| Baseline | RCP 4.5 | RCP 8.5 | ||||
|---|---|---|---|---|---|---|
| 2050 | 2100 | 2050 | 2100 | |||
| Lesvos 1 | RSLR (m) | 0 | 0.13 | 0.47 | 0.18 | 0.75–0.77 |
| ηtide (m) | 0.08–0.09 | 0.08–0.09 | 0.07–0.09 | 0.07–0.09 | 0.07–0.09 | |
| ηCE (m) | 0.88–1.01 | 0.85–0.97 | 0.85–0.94 | 0.89–1.01 | 0.88–0.98 | |
| ESL (m) | 0.96–1.09 | 1.06–1.18 | 1.39–1.49 | 1.15–1.27 | 1.72–1.81 | |
| Hs | 1.47–1.67 | 1.48–1.67 | 1.47–1.63 | 1.46–1.74 | 1.51–1.68 | |
| T | 5.13–5.38 | 5.07–5.36 | 5.04–5.31 | 5.08–5.33 | 5.10–5.36 | |
| Kos 2 | RSLR (m) | 0 | 0.14 | 0.50 | 0.19 | 0.81 |
| ηtide (m) | 0.06 | 0.06 | 0.06 | 0.06 | 0.06 | |
| ηCE (m) | 0.86 | 0.83 | 0.88 | 0.85 | 0.84 | |
| ESL (m) | 0.92 | 1.03 | 1.44 | 1.10 | 1.71 | |
| Hs | 1.77 | 1.77 | 1.81 | 1.75 | 1.80 | |
| T | 5.31 | 5.32 | 5.40 | 5.31 | 5.37 | |
| ID | Indicators/Criteria | Type of Data | Effect |
|---|---|---|---|
| 1 | Beach carrying capacity | Quantitative | Beneficial |
| 2 | Sediment type | Qualitative—3 classes: sand, mixed (sand and gravel) and coarse sediments (gravels and pebbles) | Beneficial |
| 3 | Blue Flag awards | Qualitative indicator—yes or no | Beneficial |
| 4 | Special environmental protection regime | Qualitative indicator—yes or no | Beneficial |
| 5 | Beach accessibility | Qualitative—1: None (Only marine access). 2: Difficult (unpaved road with many turns). 3: Moderate (road with many turns or/and long distance from the main road network). 4: Easy (paved road and easy access from the main road network) | Beneficial |
| 6 | Beach development | Qualitative—1: None (basic facilities, e.g., changing rooms, bins,). 2: Low (basic facilities and a few umbrellas). 3: Moderate (More facilities and umbrellas). 4: Good (well organized). 5: Intense (too many umbrellas, sea sports, lifeguards) | Beneficial |
| 7 | Beach-visitation traffic | Quantitative | Beneficial |
| 8 | Touristic activity | Qualitative—1: None. 2: Low (a few small hotels). 3: Moderate (more hotels/restaurants). 4: High (many hotels and restaurants) | Beneficial |
| 9 | Coverage of the backshore assets | Quantitative | Beneficial |
| 10 | Current trends of beach erosion (positive values for accretion, negative values for erosion) | Quantitative | Non-Beneficial |
| 11 | Beach maximum width -BMW | Quantitative | Non-Beneficial |
| 12 | Future % reduction in BMW | Quantitative | Beneficial |
| 13 | Change in beach carrying capacity (% reduction) | Quantitative | Beneficial |
| 14 | Potential beach erosion impacts on the backshore assets | Qualitative—yes or no | Beneficial |
| Status | Lesvos (2003–2021) | Kos (2004–2023) | ||
|---|---|---|---|---|
| N | % | N | % | |
| Erosion | 96 | 44 | 54 | 69 |
| Accretion | 61 | 28 | 14 | 18 |
| Stable | 61 | 28 | 10 | 13 |
| Sea-Level Rise | Retreat-R (m) | R of 20% of BMW (%) | R of 50% of BMW (%) | R Equal to BMW (%) | Beaches with Assets Affected | |||||
|---|---|---|---|---|---|---|---|---|---|---|
| Year | RCP | (m) | N | % | ||||||
| RSLR | 2050 | 4.5 | 0.13 | Min | 1.3–2.6 | 15 | 1 | 0 | 0 | 0 |
| Max | 2.6–7.8 | 73 | 20 | 4 | 5 | 2 | ||||
| Median | 2.3–5.2 | 48 | 10 | 1 | 2 | 1 | ||||
| 8.5 | 0.18 | Min | 1.8–3.6 | 31 | 3 | 0 | 0 | 0 | ||
| Max | 2.8–8.6 | 75 | 25 | 5 | 6 | 3 | ||||
| Median | 2.6–5.7 | 55 | 11 | 1 | 3 | 1 | ||||
| 2100 | 4.5 | 0.47 | Min | 4.7–9.4 | 81 | 33 | 7 | 8 | 4 | |
| Max | 5.7–17.4 | 95 | 65 | 28 | 24 | 12 | ||||
| Median | 5.1–12.9 | 90 | 49 | 14 | 15 | 7 | ||||
| 8.5 | 0.77 | Min | 7.5–15.3 | 94 | 64 | 22 | 20 | 10 | ||
| Max | 10.3–31.1 | 100 | 89 | 60 | 48 | 23 | ||||
| Median | 8.6–21.7 | 99 | 78 | 39 | 32 | 15 | ||||
| ESL100 | 2050 | 4.5 | 1.06 | Min | 10.8–24.4 | 99 | 85 | 46 | 35 | 17 |
| Max | 12.4–37.9 | 100 | 94 | 74 | 59 | 29 | ||||
| Median | 11.1–29.4 | 100 | 90 | 62 | 50 | 24 | ||||
| 8.5 | 1.15 | Min | 11.6–26.1 | 99 | 86 | 52 | 42 | 20 | ||
| Max | 13.2–40.5 | 100 | 94 | 75 | 59 | 29 | ||||
| Median | 11.9–31.6 | 100 | 91 | 67 | 54 | 26 | ||||
| 2100 | 4.5 | 1.39 | Min | 14.1–30.4 | 100 | 90 | 64 | 52 | 25 | |
| Max | 15.6–47.1 | 100 | 97 | 80 | 64 | 31 | ||||
| Median | 14.4–36.4 | 100 | 95 | 75 | 59 | 29 | ||||
| 8.5 | 1.72 | Min | 17.4–36.8 | 100 | 94 | 76 | 58 | 28 | ||
| Max | 18.9–57.1 | 100 | 98 | 87 | 71 | 34 | ||||
| Median | 17.7–43.9 | 100 | 97 | 83 | 65 | 31 | ||||
| Sea-Level Rise | Retreat-R (m) | R by 20% of BMW (%) | R by 50% of BMW (%) | R Equal to BMW (%) | Beaches with Assets Affected | |||||
|---|---|---|---|---|---|---|---|---|---|---|
| Year | RCP | (m) | N | % | ||||||
| RSLR | 2050 | 4.5 | 0.14 | Min | 1.4–2.8 | 2 | 0 | 0 | 0 | 0 |
| Max | 2.6–7.7 | 53 | 2 | 0 | 0 | 0 | ||||
| Median | 2.4–5.2 | 23 | 0 | 0 | 0 | 0 | ||||
| 8.5 | 0.19 | Min | 1.9–3.8 | 8 | 0 | 0 | 0 | 0 | ||
| Max | 2.9–8.6 | 61 | 6 | 0 | 0 | 0 | ||||
| Median | 2.6–5.8 | 27 | 0 | 0 | 0 | 0 | ||||
| 2100 | 4.5 | 0.50 | Min | 5.0–10.0 | 74 | 9 | 0 | 0 | 0 | |
| Max | 6.0–18.1 | 97 | 41 | 6 | 2 | 3 | ||||
| Median | 5.2–12.9 | 82 | 20 | 0 | 0 | 0 | ||||
| 8.5 | 0.81 | Min | 8.1–16.1 | 97 | 35 | 3 | 0 | 0 | ||
| Max | 10.3–30.9 | 100 | 80 | 26 | 8 | 12 | ||||
| Median | 9.1–22.7 | 100 | 67 | 14 | 5 | 8 | ||||
| ESL100 | 2050 | 4.5 | 1.03 | Min | 10.5–21.8 | 100 | 71 | 17 | 5 | 8 |
| Max | 11.9–33.5 | 100 | 86 | 36 | 10 | 15 | ||||
| Median | 11.5–25.9 | 100 | 80 | 24 | 8 | 12 | ||||
| 8.5 | 1.10 | Min | 11.2–23.1 | 100 | 73 | 20 | 6 | 9 | ||
| Max | 12.6–35.5 | 100 | 88 | 42 | 12 | 18 | ||||
| Median | 12.2–27.5 | 100 | 82 | 27 | 8 | 12 | ||||
| 2100 | 4.5 | 1.44 | Min | 14.6–29.6 | 100 | 82 | 32 | 8 | 12 | |
| Max | 15.9–45.7 | 100 | 100 | 65 | 17 | 26 | ||||
| Median | 15.5–35.9 | 100 | 92 | 50 | 13 | 20 | ||||
| 8.5 | 1.71 | Min | 17.3–34.7 | 100 | 88 | 44 | 10 | 15 | ||
| Max | 18.6–54.1 | 100 | 100 | 79 | 22 | 33 | ||||
| Median | 18.2–42.7 | 100 | 98 | 67 | 17 | 26 | ||||
| Indicators | Weights 1st Stage | Weights 2nd Stage (Current) | Weights 2nd Stage (Future) |
|---|---|---|---|
| (1) | 0.049 | 0.059 | - |
| (2) | 0.146 | 0.118 | 0.118 |
| (3) | 0.146 | 0.118 | 0.118 |
| (4) | 0.146 | 0.118 | 0.118 |
| (5) | 0.073 | - | - |
| (6) | 0.146 | 0.118 | 0.118 |
| (7) | 0.073 | 0.059 | 0.059 |
| (8) | 0.146 | 0.118 | 0.118 |
| (9) | 0.073 | 0.059 | 0.059 |
| (10) | - | 0.118 | - |
| (11) | - | 0.118 | - |
| (12) | - | - | 0.118 |
| (13) | - | - | 0.059 |
| (14) | - | - | 0.118 |
| Lesvos | Kos | ||||||
|---|---|---|---|---|---|---|---|
| Beach Name | Current | RCP4.5, 2100, Med. | RCP8.5, 2100, Max. | Beach Name | Current | RCP4.5, 2100, Med. | RCP8.5, 2100, Max. |
| 27. Kanoni | −0.094 | −0.029 | −0.056 | 1. Faros, Ammoglossa | −0.058 | 0.047 | 0.031 |
| 39. Tsamakia | −0.060 | −0.012 | −0.040 | 2. Faros, Ammoglossa−2 (Kritika) | −0.058 | −0.013 | 0.021 |
| 45. Kratigos_1 | −0.193 | −0.280 | −0.308 | 5. Skala−2 | 0.002 | −0.025 | −0.035 |
| 48. Charamida | −0.099 | −0.115 | −0.038 | 7. Marina (Aktaion) | −0.012 | 0.006 | −0.007 |
| 50. Ag. Ermogenis_2 | −0.027 | 0.116 | 0.088 | 9. Psalidi−2 | 0.067 | −0.024 | −0.023 |
| 60. Evriaki_1 | −0.113 | 0.058 | 0.031 | 11. Psalidi—Ydroviotopos | −0.028 | −0.046 | −0.045 |
| 115. Nyfida | 0.041 | 0.107 | 0.079 | 12. Okeanis (Peukokefali) | −0.057 | −0.001 | −0.010 |
| 125. Skala_Kallonis | 0.181 | −0.024 | −0.053 | 15. Dimitra | −0.064 | −0.069 | −0.074 |
| 142. Tavari_3 | −0.182 | −0.292 | −0.320 | 32. Paradise (Kefalou) | −0.070 | −0.055 | −0.027 |
| 150. Eresos | 0.385 | 0.139 | 0.111 | 34. Kamari, Agios Stefanos−1 | −0.017 | 0.041 | 0.025 |
| 163. Sigri_1 | −0.092 | 0.083 | 0.055 | 70. Troulos (Mastichari) | −0.021 | −0.013 | −0.015 |
| 164. Sigri_2 | −0.117 | 0.167 | 0.139 | 73. Marmari | 0.174 | 0.057 | 0.056 |
| 203. Anaxos | 0.220 | 0.101 | 0.178 | 75. Tigaki | 0.098 | 0.056 | 0.056 |
| 206. Petra_3 | 0.091 | 0.032 | 0.109 | 77. Aiolos | 0.008 | 0.052 | 0.036 |
| 208. Molyvos | 0.058 | −0.053 | 0.024 | 78. Faros, Lambi | 0.033 | −0.013 | 0.011 |
Disclaimer/Publisher’s Note: The statements, opinions and data contained in all publications are solely those of the individual author(s) and contributor(s) and not of MDPI and/or the editor(s). MDPI and/or the editor(s) disclaim responsibility for any injury to people or property resulting from any ideas, methods, instructions or products referred to in the content. |
© 2025 by the authors. Licensee MDPI, Basel, Switzerland. This article is an open access article distributed under the terms and conditions of the Creative Commons Attribution (CC BY) license (https://creativecommons.org/licenses/by/4.0/).
Share and Cite
Monioudi, I.N.; Chatzistratis, D.; Chalazas, T.; Chatzipavlis, A.E.; Velegrakis, A.F.; Andreadis, O.P.; Monioudis, E.N.; Nikolaou, A.; Hasiotis, T. A Prioritization Framework for Adaptation Responses for Climate Change-Induced Erosion in Island Beaches—Cases from the Aegean Islands, Greece. J. Mar. Sci. Eng. 2025, 13, 491. https://doi.org/10.3390/jmse13030491
Monioudi IN, Chatzistratis D, Chalazas T, Chatzipavlis AE, Velegrakis AF, Andreadis OP, Monioudis EN, Nikolaou A, Hasiotis T. A Prioritization Framework for Adaptation Responses for Climate Change-Induced Erosion in Island Beaches—Cases from the Aegean Islands, Greece. Journal of Marine Science and Engineering. 2025; 13(3):491. https://doi.org/10.3390/jmse13030491
Chicago/Turabian StyleMonioudi, Isavela N., Dimitris Chatzistratis, Theodoros Chalazas, Antonis E. Chatzipavlis, Adonis F. Velegrakis, Olympos P. Andreadis, Efstratios N. Monioudis, Antigoni Nikolaou, and Thomas Hasiotis. 2025. "A Prioritization Framework for Adaptation Responses for Climate Change-Induced Erosion in Island Beaches—Cases from the Aegean Islands, Greece" Journal of Marine Science and Engineering 13, no. 3: 491. https://doi.org/10.3390/jmse13030491
APA StyleMonioudi, I. N., Chatzistratis, D., Chalazas, T., Chatzipavlis, A. E., Velegrakis, A. F., Andreadis, O. P., Monioudis, E. N., Nikolaou, A., & Hasiotis, T. (2025). A Prioritization Framework for Adaptation Responses for Climate Change-Induced Erosion in Island Beaches—Cases from the Aegean Islands, Greece. Journal of Marine Science and Engineering, 13(3), 491. https://doi.org/10.3390/jmse13030491