1. Introduction
The maritime transportation of liquefied natural gas (LNG) is becoming a trend in global clean energy transportation [
1]. Owing to the strict construction standards imposed on LNG carriers, maritime transportation of LNG is relatively safe. However, these standards do not guarantee that desirable performance can be maintained throughout the operational lifespan of these vessels. Generally, an LNG carrier is regarded as defective if its hull, equipment, or operational safety is significantly below the standards required by the conventions or if the crew members are unfamiliar with their duties.
Compared with other types of vessels, LNG carriers feature specialized safety and cargo maintenance equipment, such as specific detection and cargo handling systems designed to maintain the cargo temperature. Consequently, inspection of these vessels requires surveyors to possess a higher level of expertise and more specialized knowledge, including the details of safety equipment, the configuration of fire-fighting systems, and the pressure thresholds of equipment [
2]. Notably, even minor defects can lead to catastrophic consequences, posing a threat not only to the safety of the crew but also potentially causing severe damage to the vessel. Therefore, developing a specialized approach to address the complex knowledge challenges encountered by LNG carriers during Port State Control (PSC) inspections is vital.
PSC plays a crucial role in ensuring the safety and security of maritime transportation. Various studies have been conducted to assess the effectiveness and factors influencing the implementation of PSC regimes. Xiao and colleagues examined the effectiveness of the new inspection regime for PSC by applying the Tokyo MoU [
3]. Yuan and colleagues identified important factors influencing the implementation of independent PSC regimes using the analytical hierarchy process (AHP) to develop a framework for assessing priority factors [
4]. Fan and colleagues utilized Bayesian network modeling to evaluate the effectiveness of PSC inspections [
5]. Additionally, Şanlıer and colleagues analyzed PSC inspection data in the Black Sea region [
6], while Emecen and colleagues assessed the similarities between PSC regimes based on the performance of flag states using hierarchical clustering methods [
7]. Yan and colleagues developed an artificial intelligence model for ship selection in PSC based on detention probabilities [
8], and Wang and colleagues incorporated deficiency data into the analysis of risk factors influencing PSC inspections [
9]. Furthermore, Yang and colleagues used Bayesian network-based TOPSIS to aid dynamic detention risk control decisions in PSC [
10]. Yan and colleagues investigated the influence of COVID-19 on PSC using inspection data [
8]. Demirci and colleagues focused on intelligent ship inspection analytics by mining ship deficiency data for PSC purposes [
11]. Shu and colleagues investigated the effects of sea ice on vessel routing and velocity by assessing the spatiotemporal correlations between Sea Ice Concentration, Sea Ice Thickness, Sea Ice Volume, and Automatic Identification System data along the Northeast Passage [
12]. Liu and colleagues [
13] and Chen and colleagues [
14] have provided valuable insights into navigational safety and ship trajectory analysis, which are integral to enhancing PSC effectiveness. Their work complements existing studies on PSC, aiming to improve maritime safety and security.
The annual report of the 2023 Tokyo Memorandum of Understanding (Tokyo MoU) recorded increases in Port State Control (PSC) inspection rates, defect detection rates, and detention rates. For example, a certain Chinese maritime authority conducted PSC inspections on 14 liquefied gas carriers. Among them, 10 vessels (7 LNG and 3 LPG) were detained due to an average of 10.7 defects per vessel, including 4 critical defects, resulting in a detention rate as high as 71.43%. These vessels had an average age of 25.9 years, and their detention defects were primarily concentrated in areas such as the statutory certificates, load lines, fire protection systems, life-saving equipment, and cargo piping systems of the ships, with a particular emphasis on their exposed deck areas. In one case, an LNG carrier had accumulated water and bubbles at the junction of its discharge pipe and the cover of its temperature sensor circuitry, which triggered an alarm when a portable explosive gas detector measured a methane concentration of approximately 4%, which was ultimately attributed to damage to the internal packing box.
Knowledge graphs have become a significant area of interest in both industry and academia, with a focus on exploiting diverse, dynamic, and large-scale collections of data [
15]. These graphs represent structural relations between entities and have been recognized as a crucial research direction towards cognition and human-level intelligence [
16]. Various research efforts have been made to enhance the capabilities of knowledge graphs, such as knowledge reasoning over knowledge graphs [
17], fake news detection using knowledge-driven multimodal graph convolutional networks [
9], and bridging knowledge graphs to generate scene graphs [
18]. One key aspect of knowledge graphs is their representation of learning, acquisition, and applications [
16]. Knowledge acquisition, particularly knowledge graph completion, has been a significant area of focus in recent research. Methods such as embedding methods, path inference, and logical rule reasoning have been explored to enhance knowledge graph completion [
16]. Liu developed a deep learning knowledge extraction model (BERT-MCNN) for extracting the information required for front-line management from China’s marine pollution control-related laws and regulations, effectively supporting the on-site decision-making of PSC inspectors [
19]. Gan and colleagues employ knowledge graph technology to integrate various sources of knowledge for Flag State Control (FSC) inspections [
20]. Gan and colleagues introduce a novel knowledge graph construction method to investigate ship collision accidents, highlighting the interconnections among critical accident factors [
21]. The study compiles 241 ship collision investigation reports from 2018 to 2021, sourced from the China Maritime Safety Administration (CMSA) website. Ref. [
22] developed a graph neural network model (MIDG-GCN) for predicting the causes of maritime vessel traffic accidents based on accident investigation reports, effectively aiding maritime authorities in quickly identifying accident factors and guiding decision-making in accident investigations. Zhang constructed a knowledge graph for PSC inspections of LNG carriers and developed a knowledge graph-based recommendation model (PT-KGCN) for predicting and recommending inspection items to improve the efficiency and accuracy of PSC inspections [
23]. Liu’s research, by constructing a PSC inspection knowledge graph and using evolutionary game theory to analyze the internal evolutionary dynamics of ship populations, proposed a knowledge graph-based PSC inspection support decision-making strategy, which effectively improved the accuracy of inspections and resource utilization efficiency, providing new insights for the research on maritime supervision informatization and ship safety management [
24]. This method aims to utilize the basic information provided by the knowledge module and the language module to mutually assist each other in generating embeddings for entities in the text and to create context-aware initial embeddings for entities and relationships in the knowledge graph. In summary, while knowledge graphs offer numerous opportunities for advancing research and applications, they also present challenges that need to be addressed. Understanding the structural relationships between entities, enhancing knowledge acquisition and completion methods, and fusing contextual information from language understanding are key focus areas in current knowledge graph research [
25].
However, constructing knowledge graphs typically requires substantial computational and storage resources, which are impractical for many practical applications. In particular, high-performance deep learning models demand even more resources, limiting their application to devices with limited capabilities. Furthermore, pretrained language models have excessively long training times and do not offer a significant speed advantage in actual prediction tasks. Therefore, to better apply pretrained language models in engineering practice, it is necessary to consider the resource constraints of most users and develop new large-scale pretrained models to maximize their value. The research and industrial communities are seeking methods to construct lightweight pretrained models while maintaining their performance.
Among the most notable successes in the NLP field are ChatGPT, based on GPT-3.5, and GPT-4 from OpenAI, which have exerted a significant influence not only on the AI research community but also far beyond it. Studies on constructing such models have yielded various methods, among which reducing the number of model parameters is the most common approach [
26]. Reducing the number of model parameters can be achieved through techniques such as pruning to remove redundant connections and parameters or through applying methods such as low-rank decomposition. The emergence of knowledge distillation (KD) technology offers a novel method for compressing pretrained language models, realizing knowledge transfer from large models to smaller ones through the concept of “distillation”. Compared with pruning and quantization, knowledge distillation can transfer knowledge from a teacher network, ensuring the accuracy of the student network after implementing compression. It offers greater flexibility and ease of implementation, and it does not rely on specific hardware. Pruning may result in information losses, whereas quantization may diminish the performance of the constructed model. Tian and colleagues introduced the concept of Contrastive Representation Distillation, which focuses on maximizing mutual information between teacher and student models [
27]. Chen and colleagues proposed Online Knowledge Distillation with Diverse Peers (OKDDip), which involves two-level distillation with multiple auxiliary peers and a group leader [
28]. Goldblum and colleagues highlighted the vulnerability of small neural networks produced through knowledge distillation to adversarial attacks [
29], while Tang and colleagues categorized teachers’ knowledge into three hierarchical levels to study its effects on knowledge distillation [
30]. Cheng and colleagues presented a method to quantify and analyze task-relevant and task-irrelevant visual concepts encoded in intermediate layers of deep neural networks to explain the success of knowledge distillation [
31]. Xu and colleagues discussed practical ways to exploit noisy self-supervision signals for distillation [
32]. Allen-Zhu and colleagues developed a theory showing that ensemble and knowledge distillation in deep learning work differently from traditional learning theories, especially in the presence of a multi-view data structure [
33]. Zhang and colleagues proposed two knowledge distillation methods for object detection, leading to significant improvements in average precision [
34]. Zhao and colleagues introduced Decoupled Knowledge Distillation (DKD) to address issues with the classical KD loss formulation [
35]. Yang and colleagues introduced an open-source knowledge distillation toolkit for natural language processing to facilitate the implementation of knowledge distillation in NLP tasks named Textbrewer [
36]. Finally, Zhang and colleagues presented self-distillation as a novel technique to improve the efficiency and compactness of neural networks by addressing the limitations of model deployment due to the growth of computation and parameters [
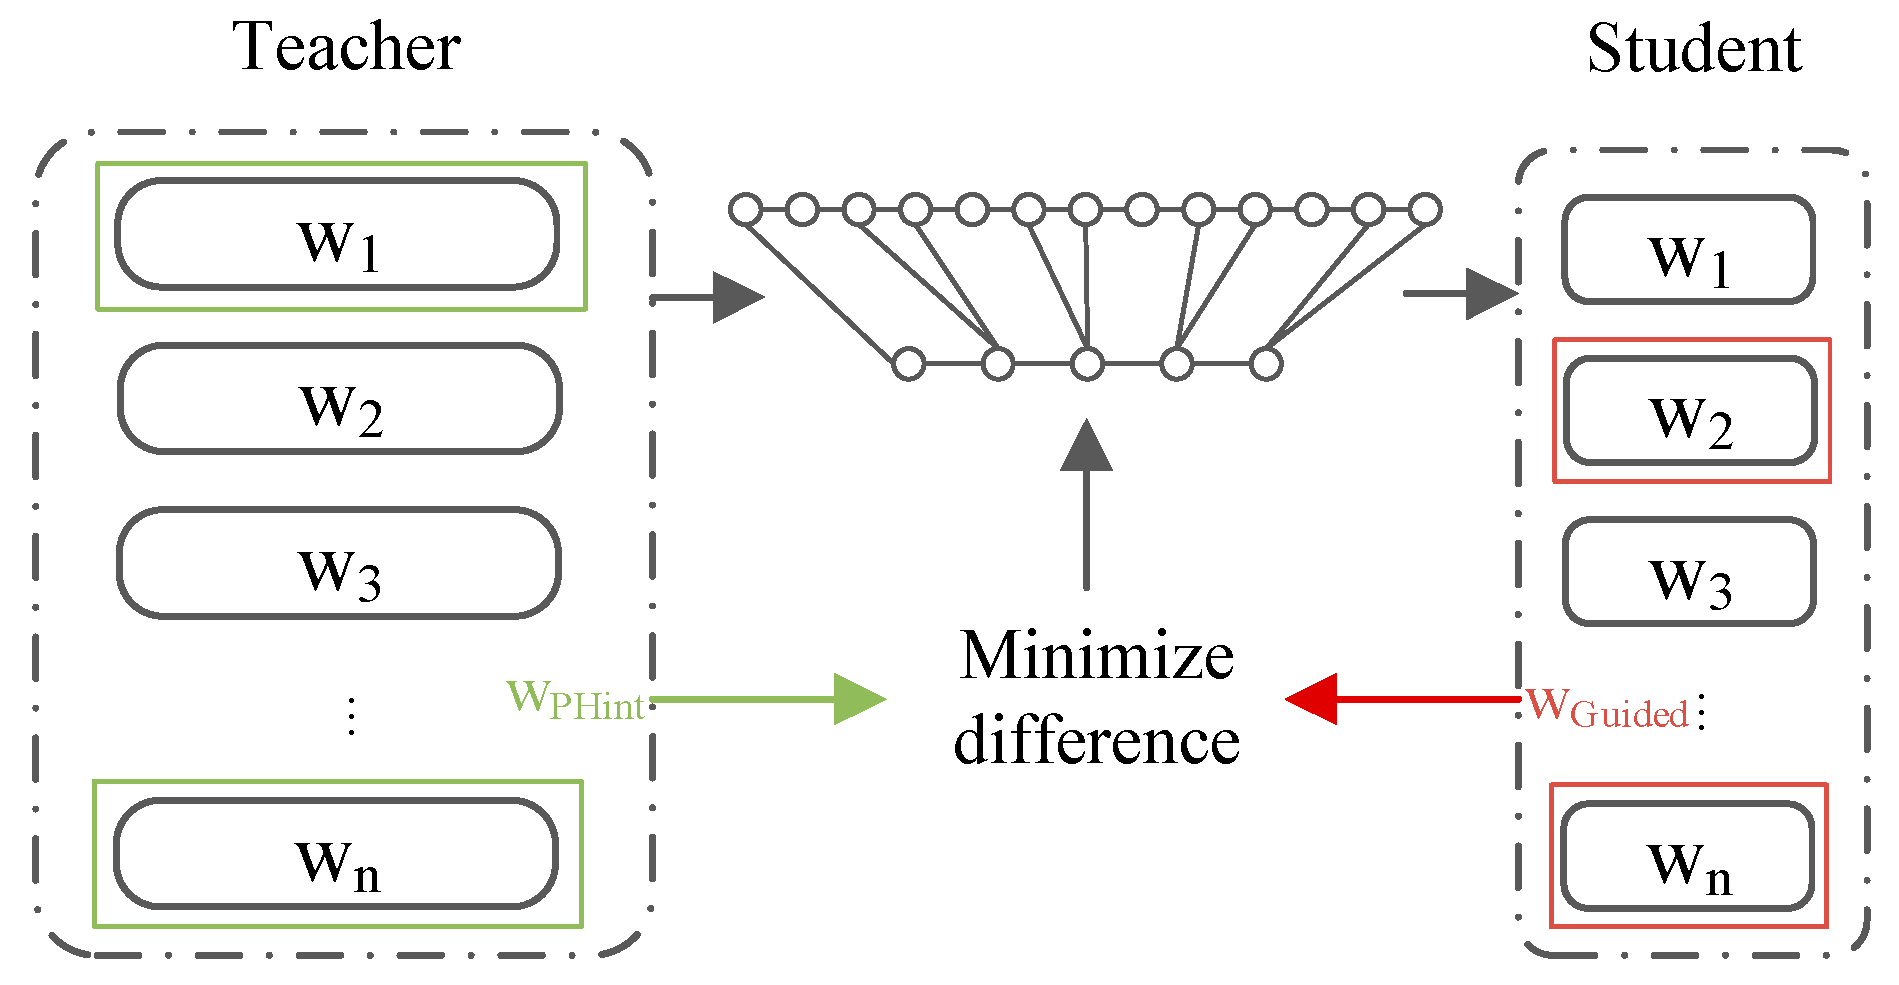
37]. In KD, a complex teacher model guides a simpler student model to accomplish knowledge transfer and construct a lightweight model. Moreover, multi-teacher KD methods require consideration of the performance differences between teachers to achieve dynamic guidance among them, which is an important direction in the field at present.
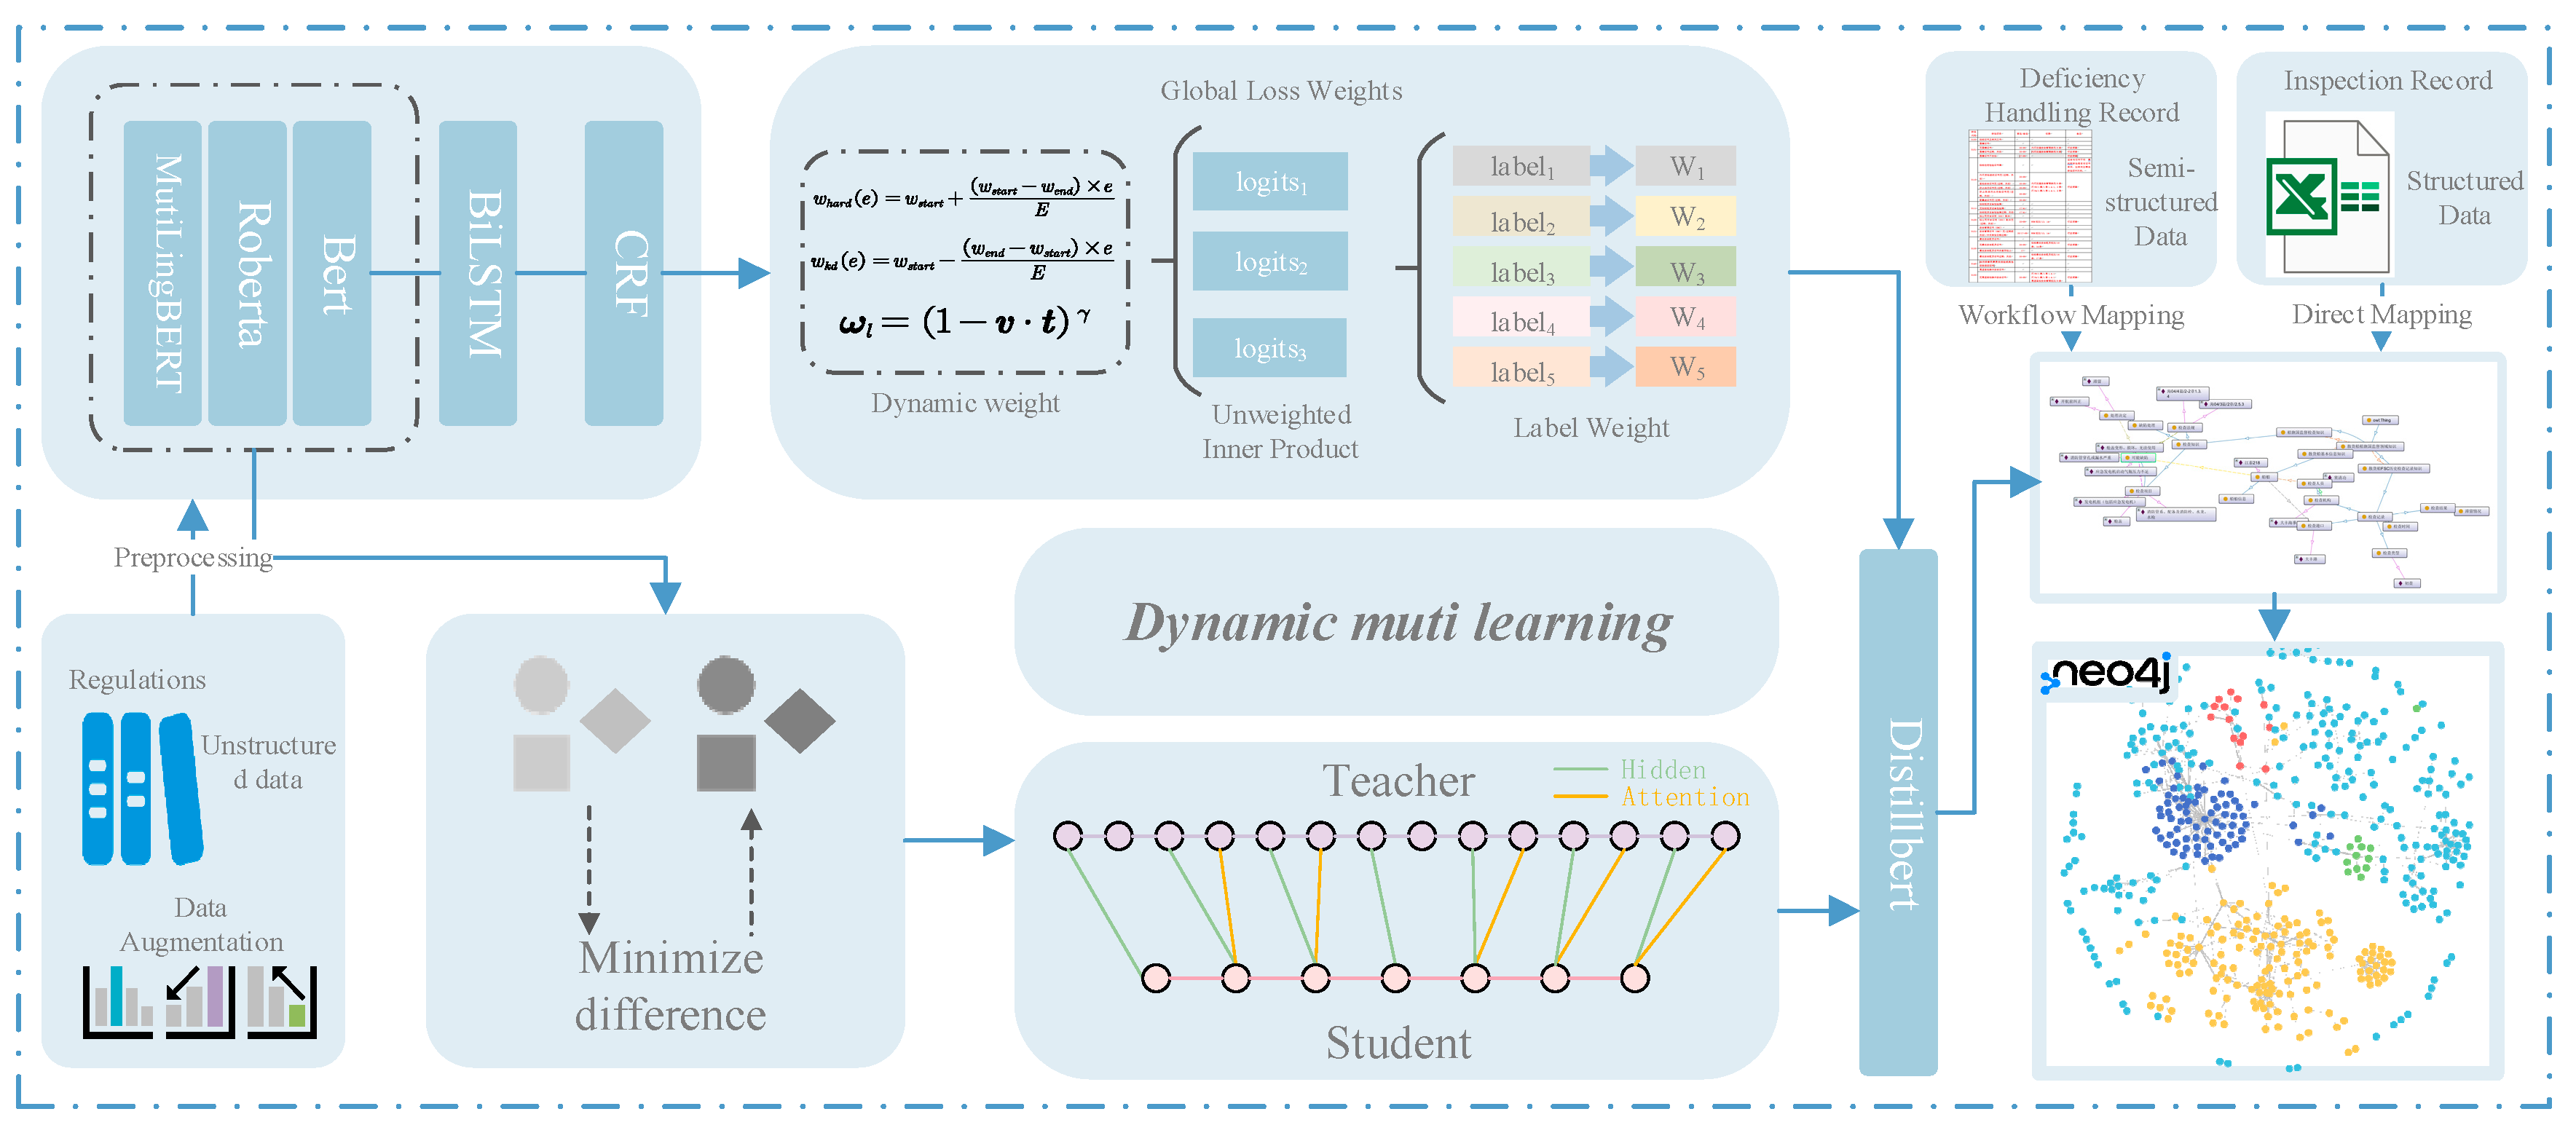
To increase the efficiency and accuracy of PSC inspections for LNG vessels, a finely tuned KD technique has been adopted for inspection model optimization. This technique has demonstrated significant advantages in terms of professional performance. Specifically, after intensive training using a substantial amount of PSC inspection data, the distilled model is capable of accurately identifying unique risk factors and potential safety hazards for LNG vessels, substantially improving the targeting and effectiveness of inspections. The model focuses on optimizing the inspection process for the characteristics of LNG vessels, streamlining nonessential inspection procedures, and effectively reducing the number of inspection cycles while ensuring strict compliance with all safety regulations. During the PSC inspection process, historical data are utilized by the model to accurately identify and classify potential defects, providing scientific support for vessel maintenance and management. The model offers real-time decision-making support for PSC inspectors, reducing human error through data analysis and enhancing the consistency and fairness of inspections. As PSC inspection standards evolve and maritime technology advances, the model continuously learns, integrates new inspection cases, adapts to industry changes, and consistently performs at the forefront of PSC inspections for LNG vessels. In summary, this model, which is based on KD technology, provides efficient and precise support for PSC inspections of LNG vessels, ensuring the safety and reliability of LNG transportation while enhancing the professionalism and scientific nature of the entire inspection process.
4. Discussion
4.1. Comparison of Traditional Model Discrepancies
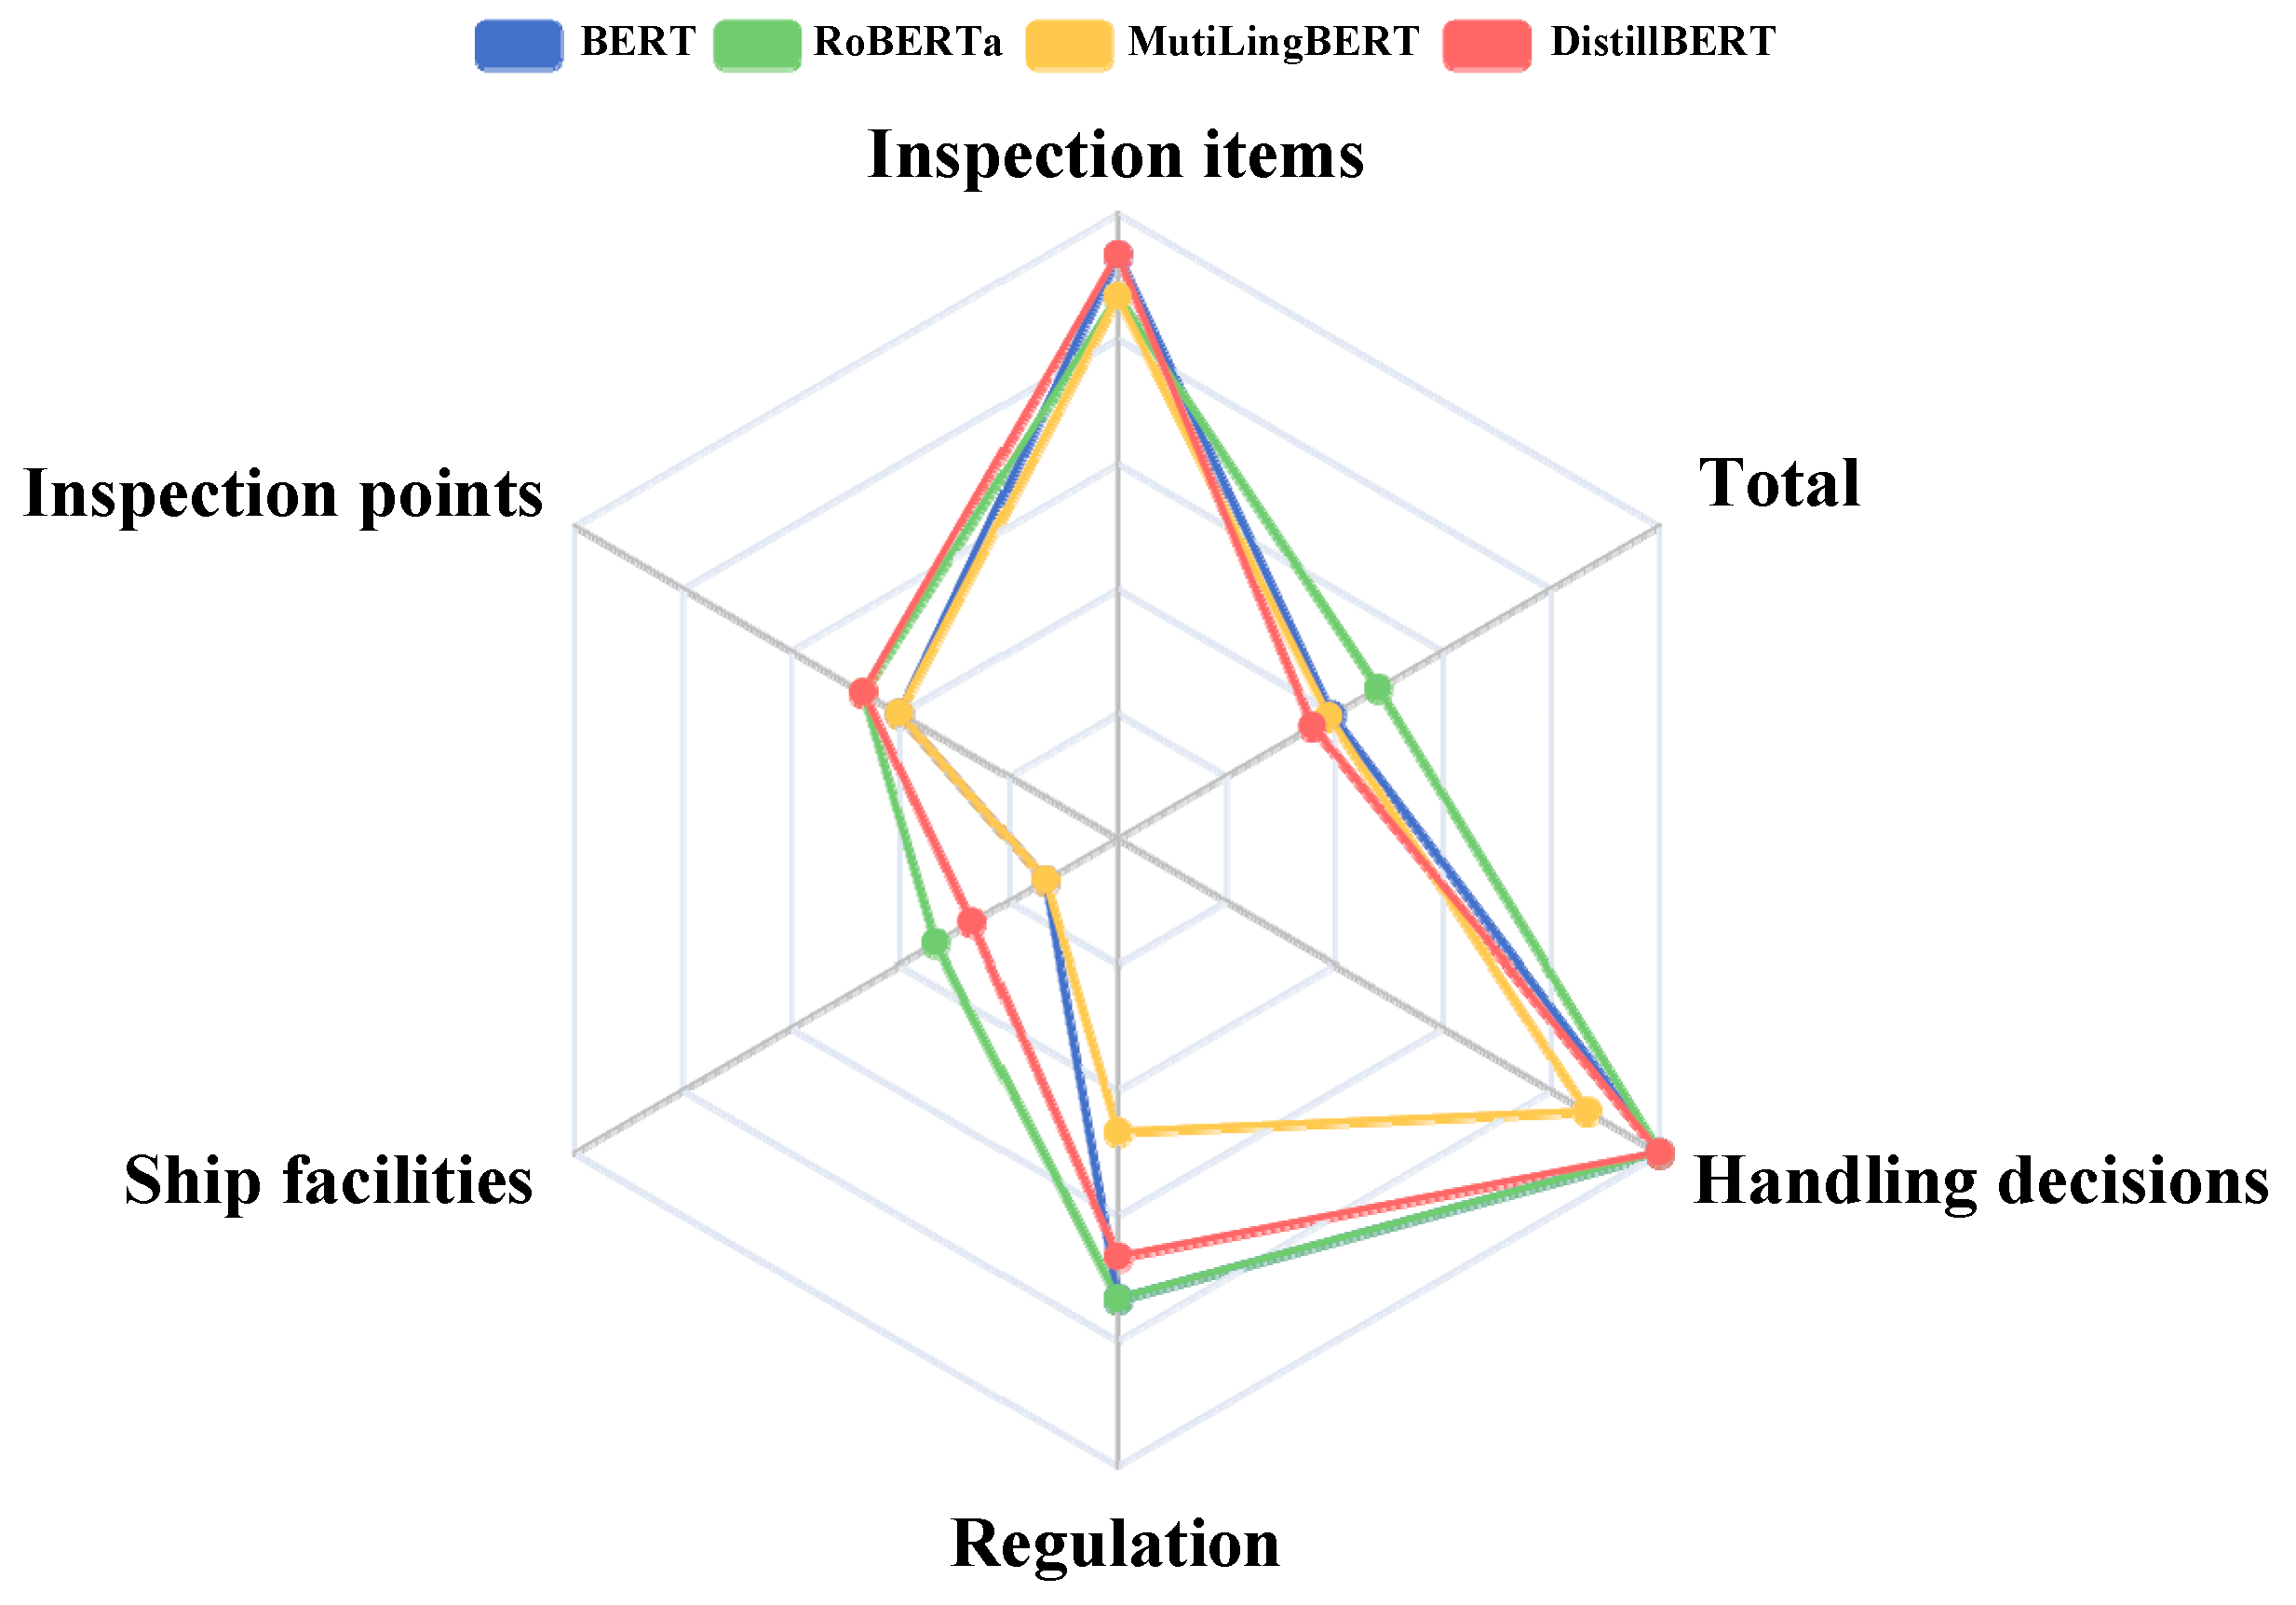
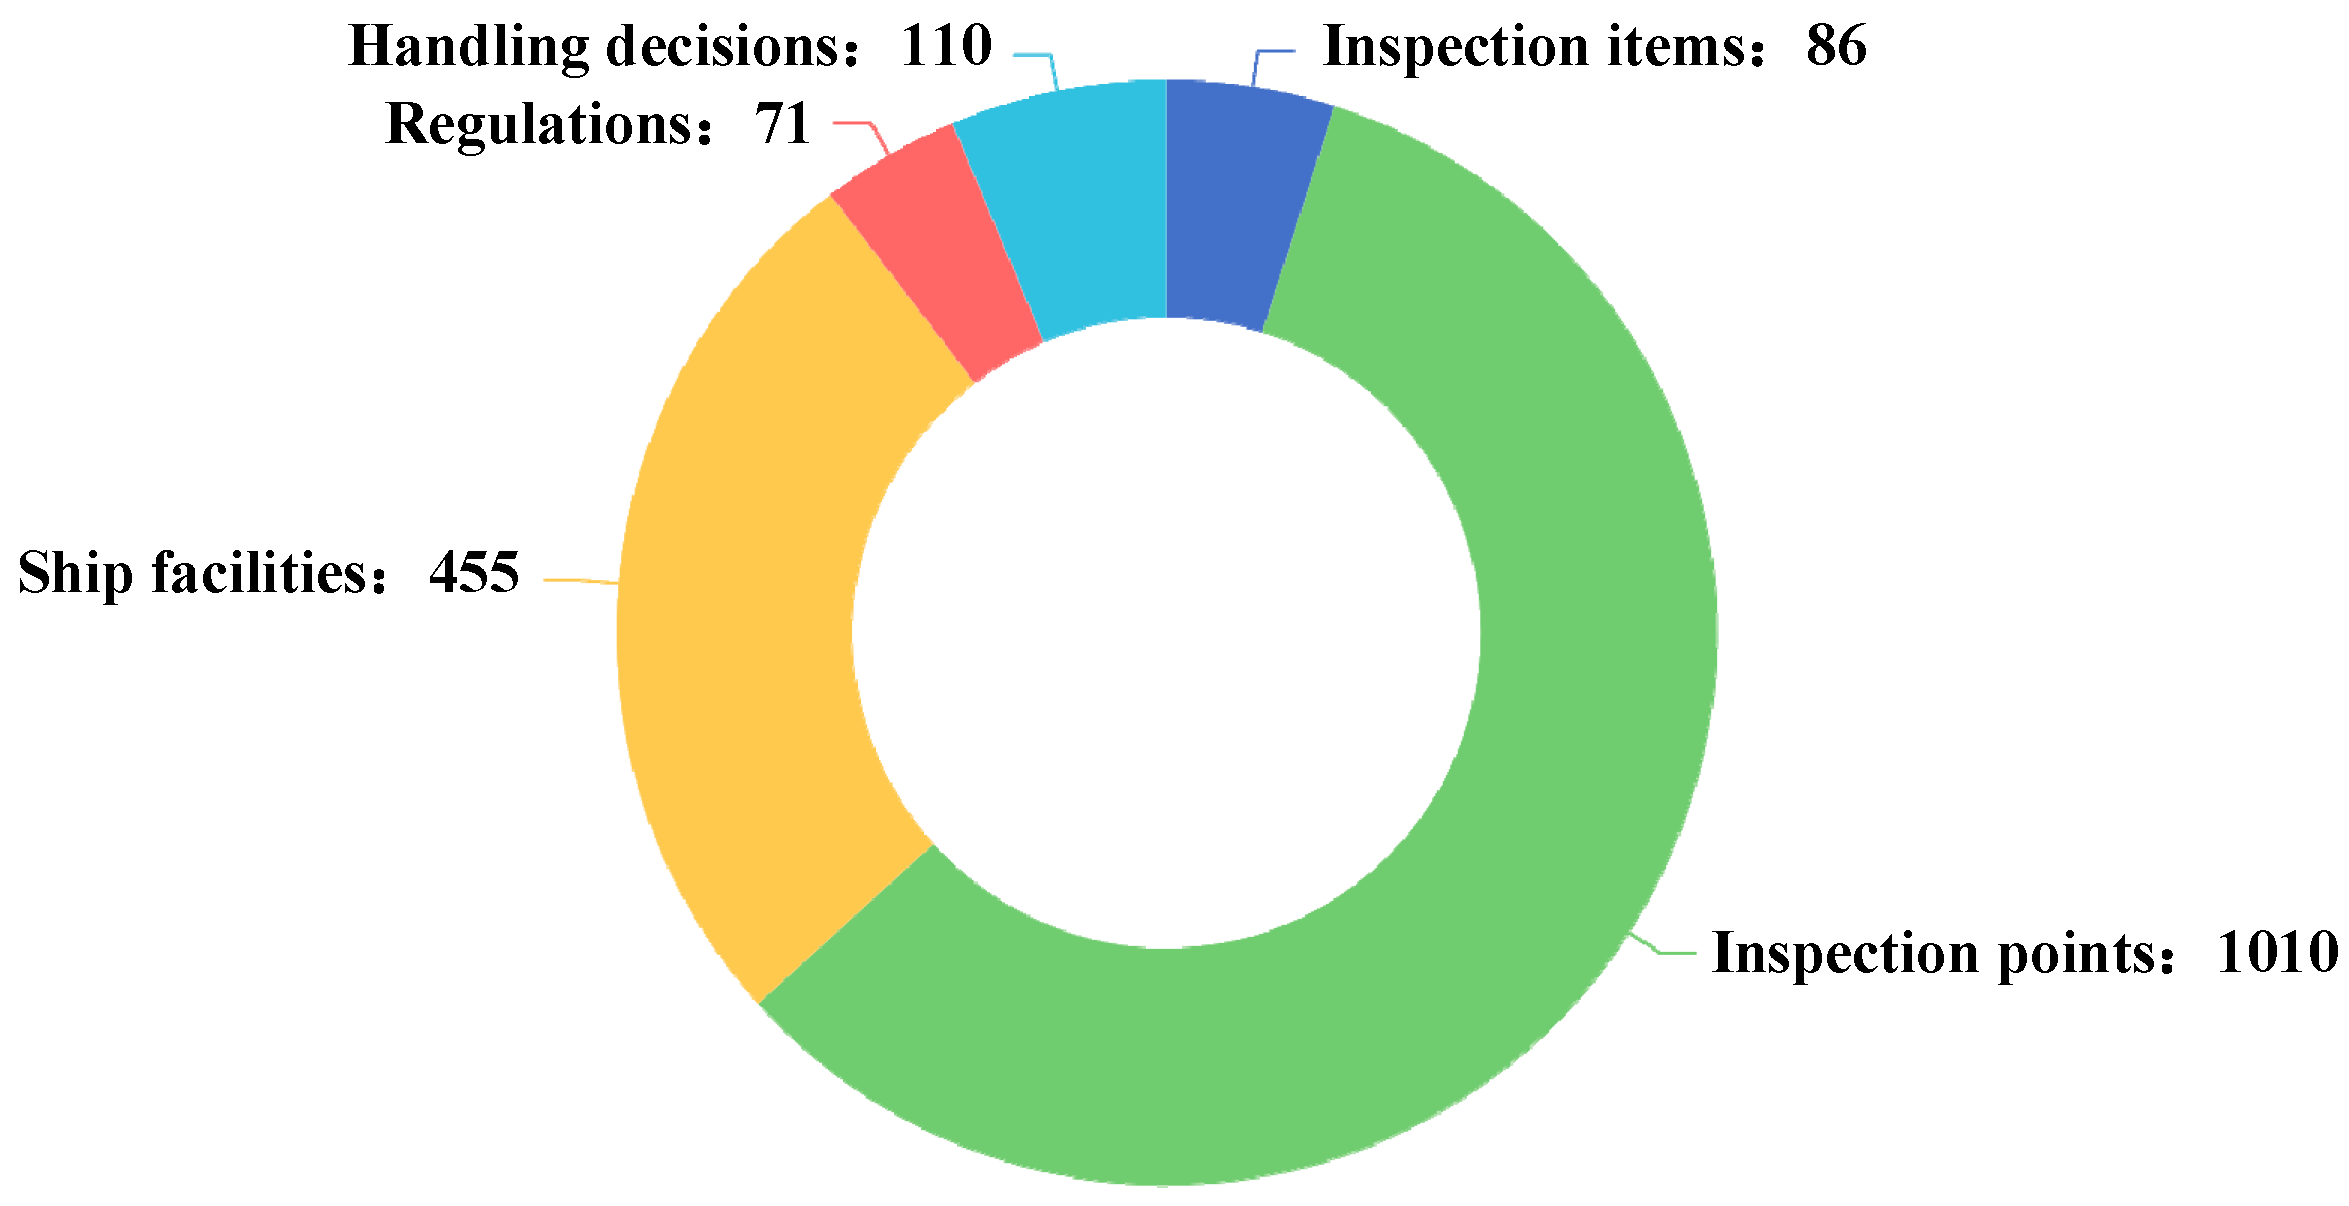
To compare the performance of different models across various labels, a radar chart was implemented as a visualization tool to intuitively display the performance differences between the BERT, RoBERTa, and MutiLingBERT models. The label quantity and F1 score for each label in the test dataset for each model are shown in
Figure 5 and
Figure 6, respectively. The specific data are shown in
Table 4.
The radar chart shows that the performance of the RoBERTa model is relatively balanced across the labels, particularly for the “inspection points” and “ship facilities” labels, which have significantly high scores. This result indicates that the RoBERTa model has a strong ability to handle longer and extensible entities. However, on other labels, such as “inspection items”, “handling decisions”, and “regulations”, the RoBERTa model’s scores are not outstanding, revealing certain limitations. Nevertheless, since inspection points and ship facilities include a rich set of content, the overall performance of the RoBERTa model remains the most impressive.
In contrast, the BERT model’s performance across the labels shows marked unevenness, with both strong and weak areas. Specifically, for the “inspection items”, “handling decisions”, and “regulations” labels, the BERT model’s scores surpass those of the RoBERTa model, indicating its advantage in handling short entities and common entities.
The MutiLingBERT model shows significant advantages in dealing with non-English entities, but in terms of overall performance, the difference in performance compared with that of the BERT model is not pronounced.
On the basis of the above analysis, through radar chart analysis of the performance of the BERT, RoBERTa, and MutiLingBERT models across the evaluation labels, the following conclusions are drawn. The RoBERTa model excels with respect to the “inspection points” and “ship facilities” labels, indicating its strengths in handling complex and extensible entities, and despite being less impressive on other labels, its overall effect is still significant. The BERT model has stronger capabilities with respect to the “inspection items”, “handling decisions”, and “regulations” labels and particularly excels in handling short and common entities, outperforming the RoBERTa model. The MutiLingBERT model stands out in handling English entities, with an overall performance comparable to that of the BERT model. These results reveal the applicability and limitations of different models in various application scenarios.
Similarly, the radar chart also shows that the DistillBERT model, which undergoes distillation, performs relatively well across the labels, also performing well in terms of the “inspection points” and “ship facilities” labels, with high scores observed. This finding indicates that the DistillBERT model also has strong capabilities in handling longer and expandable entities. Although it scores lower for “inspection items”, “handling decisions”, and “regulations”, showing some limitations, the overall effectiveness of the DistillBERT model is still commendable because of the importance of “inspection points” and “ship facilities”.
Further observation reveals that the DistillBERT model, which undergoes dynamic multilayer knowledge distillation learning, performs evenly across all labels, proving that the distillation process successfully inherits the strengths of the larger model across different labels in the smaller model.
Within the domain of Port State Control inspections, model precision is of paramount importance, as even subtle differences in the F1 metric can have cascading effects, potentially resulting in irremediable safety risks. It is imperative that the model employed for PSC inspections exhibits high levels of accuracy and reliability across all labeled dimensions to avoid any form of performance bias. The integration of a student model that has been trained to embody the respective strengths of multiple teacher models confers a competitive edge for ensuring comprehensive and effective inspection outcomes. This approach guarantees a balanced and nuanced assessment, which is critical for ensuring the integrity of PSC inspection protocols.
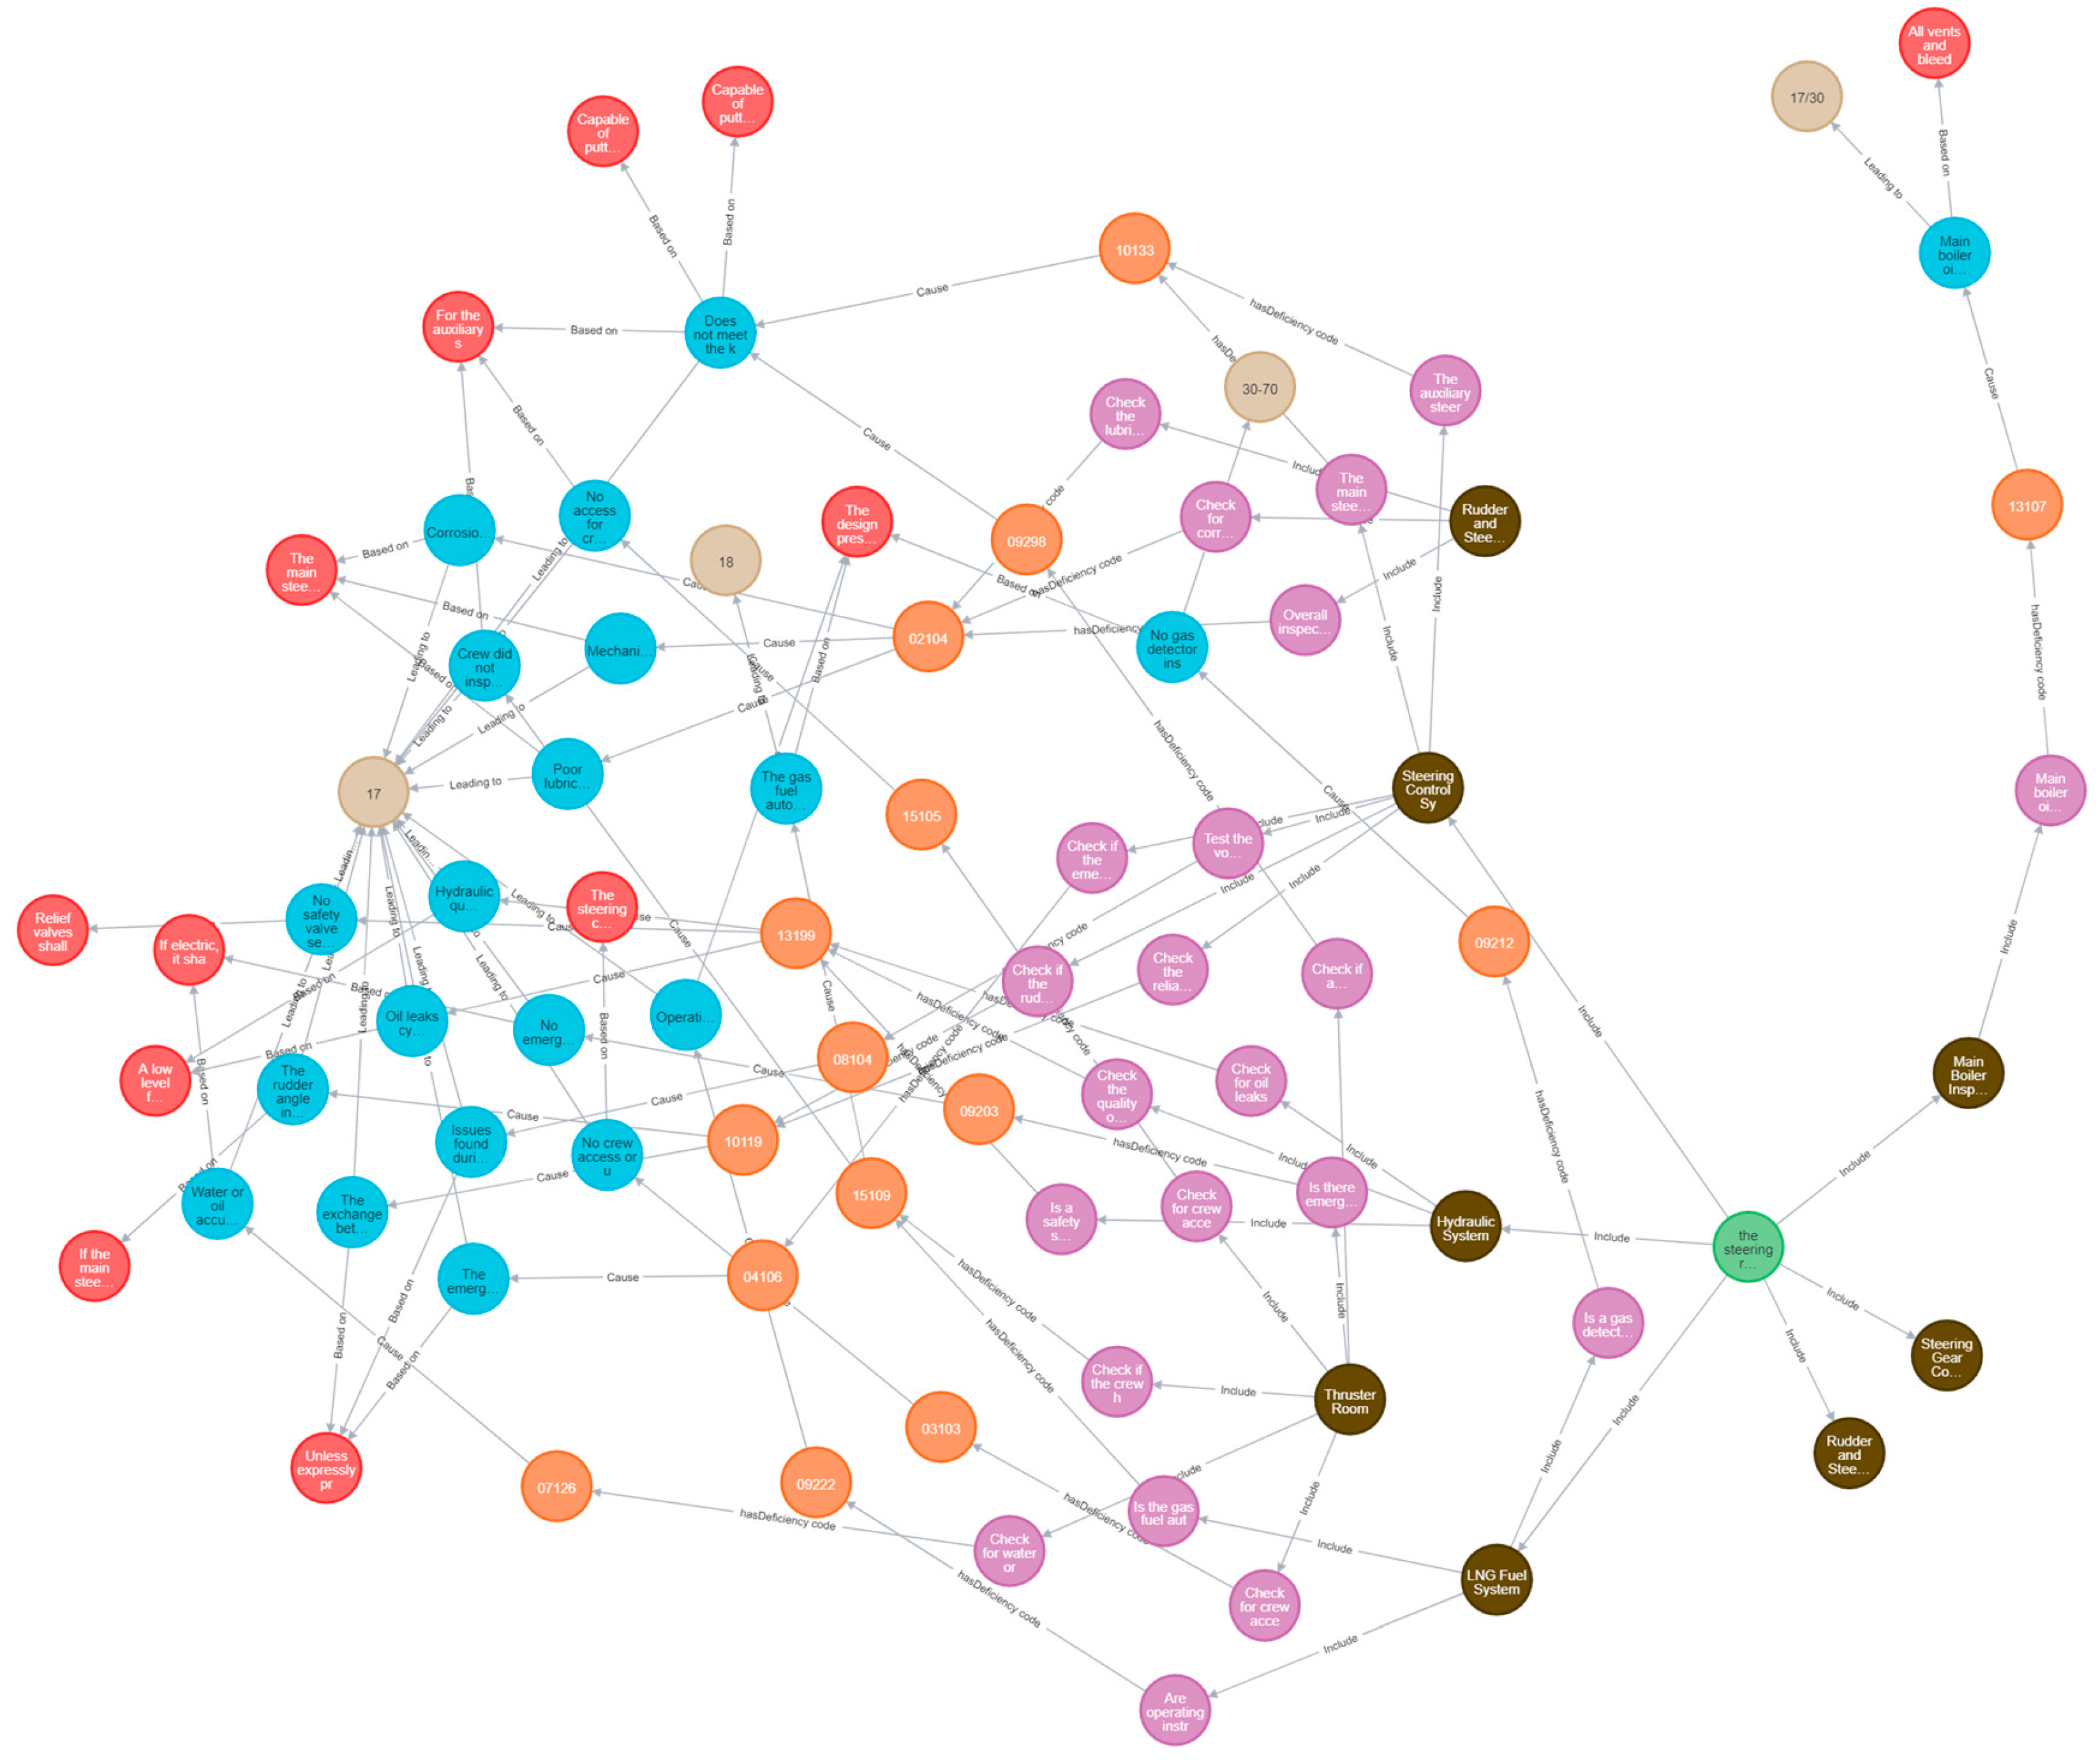
For example, during the PSC inspection process, inspectors utilize model outcomes to efficiently review the fire extinguishing system in LNG cargo holds. The model highlights critical nodes such as the fire extinguishing agent storage tanks, control valves, sensors, and nozzles, which are essential components for the system’s operation. With the model, inspectors can conduct targeted examinations of these nodes to ensure they are functioning properly. The model also elucidates the relationships between the sensor’s detection of a fire signal, the transmission of information to the control valve, and the control valve’s response to release the extinguishing agent, aiding inspectors in comprehensively understanding the system’s workflow. Furthermore, the model presents a logical chain, for instance, in cases where the sensor fails to detect a fire signal or the control valve is unable to activate due to a malfunction. Inspectors can swiftly identify these potential fault points. This approach enables inspectors to promptly detect deficiencies in the fire extinguishing system within LNG cargo holds, thereby ensuring the safety of the vessel.
4.2. Comparison of Distillation Model Discrepancies
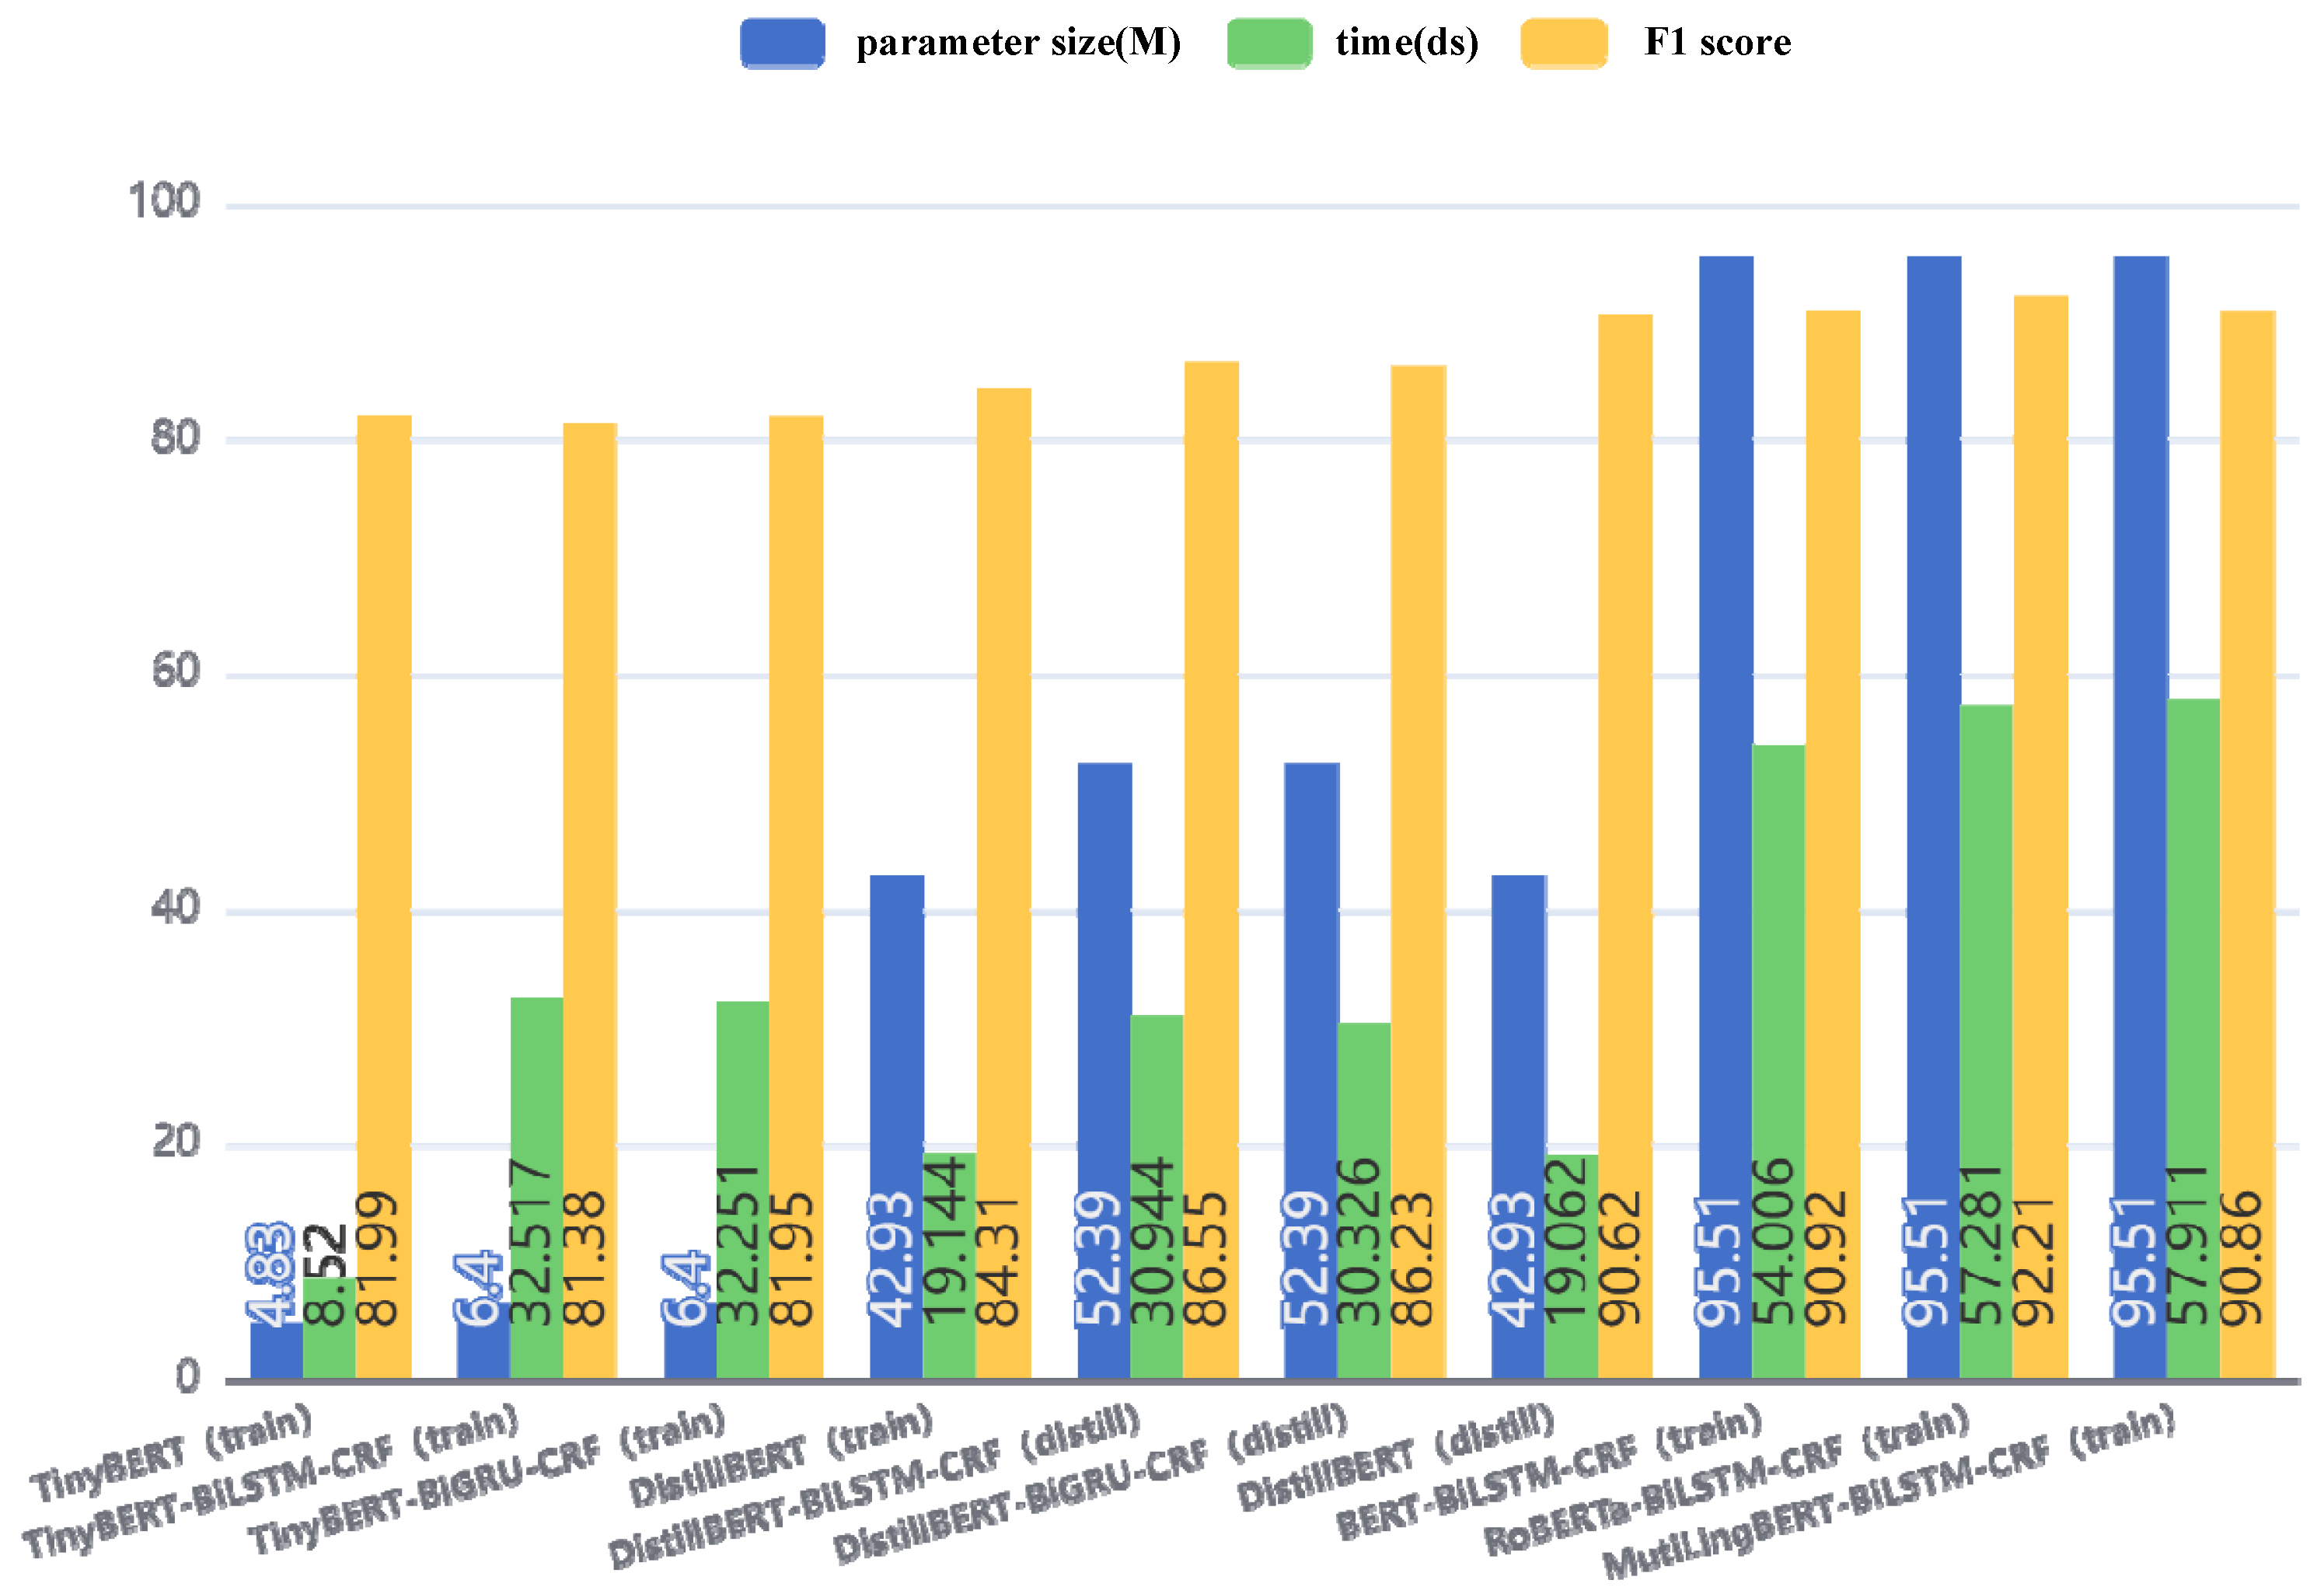
The model distillation was explored via a meticulous comparison of various carefully designed distillation models, including TinyBERT, TinyBERT-BiLSTM-CRF, and TinyBERT-BiGRU-CRF, as well as DistillBERT, DistillBERT-BiGRU-CRF, and DistillBERT-BiLSTM-CRF. In the process of identifying the most suitable distillation model, three core dimensions were comprehensively considered: the model’s parameter scale, the required training duration, and the model’s accuracy. The specific data are shown in
Table 5.
Specifically, the TinyBERT model achieves an F1 score of 82.39. As a lightweight transformer model based on BERT, TinyBERT is recognized for its compactness and speed while achieving a performance similar to that of BERT but with a significantly reduced number of parameters. By preserving BERT’s preprocessing layer, the BERT model was utilized to encode the input text, thus outputting data rich in semantic information. TinyBERT achieves extreme parameter reduction and has the fastest training speed among all the candidate models. However, the accuracy of TinyBERT is not satisfactory, suggesting that while miniaturized models offer clear advantages in deployment efficiency and computational resource consumption, these benefits often come at the cost of model performance.
Next, the TinyBERT-BiLSTM-CRF model, which has a larger parameter scale than the DistillBERT model and requires approximately twice the training time, was examined. Despite the increased model complexity of TinyBERT-BiLSTM-CRF, its F1 score is only 85.87, which is significantly lower than that of DistillBERT. This phenomenon indicates that, at the same parameter scale, DistillBERT is more effective at retaining the knowledge of the original model.
Attention was then turned to the TinyBERT-BiGRU-CRF model, which has a reduced parameter scale compared with that of TinyBERT-BiLSTM-CRF and a similar training time. However, TinyBERT-BiGRU failed to meet expectations in terms of critical accuracy, with an F1 score of 85.36, which did not surpass that of DistillBERT.
Finally, the DistillBERT model does not overly increase in terms of the parameter scale and has a relatively short training time. Most importantly, it demonstrates exceptional performance in terms of accuracy, with an F1 score as high as 90.6214, which is significantly higher than those of both TinyBERT-BiLSTM-CRF and TinyBERT-BiGRU-CRF. This result fully illustrates that DistillBERT successfully retains the essence of the original model’s performance while maintaining a moderate model size.
Additionally, the models that combine DistillBERT with BiLSTM and BiGRU, were investigated. These models achieve F1 scores of 89.21 and 88.90, respectively. Although these two models yield slightly lower F1 scores than the standalone DistillBERT model does, they still exhibit high accuracy.
In summary, under the same experimental conditions, when a distillation model was selected, the DistillBERT model achieved the best balance among the parameter scale, training duration, and accuracy. While TinyBERT is small and fast, its insufficient accuracy makes it unsuitable for scenarios with high-performance requirements. Although TinyBERT-BiLSTM-CRF and TinyBERT-BiGRU-CRF, as well as DistillBERT-BiLSTM-CRF and DistillBERT-BiGRU-CRF, increase in terms of parameter scale and time, their improvement in accuracy is not significant. Therefore, after weighing the efficiency and performance of the models, it was ultimately decided to adopt DistillBERT as the preferred distillation model.
4.3. Sensitivity Analysis of the Distillation Model Hyperparameters
In KD, the temperature parameter plays a core role. This parameter is responsible for adjusting the smoothness of the soft labels (i.e., the softmax probability distribution) output by the teacher model [
10]. In the calculation of knowledge distillation loss, the outputs of both the teacher and student models need to be adjusted in terms of the temperature value. A higher temperature increases the smoothness of the outputs, causing the model to exhibit greater uncertainty in predictions. This adjustment is beneficial for the student model to learn a broader range of information from the teacher model. Typically, when the temperature value exceeds 1, the distribution of soft labels becomes smoother, aiding the learning process of the student model. Conversely, when the temperature approaches 0, the soft labels tend toward hard labels (i.e., one-hot encoding), which reduces the amount of information the student model can learn.
Another critical hyperparameter is hard_label_weight, which represents the weight of the true labels (hard labels) in the total loss function. This weight determines the relative importance between the loss from true labels and the soft label loss provided by the teacher model when training the student model. When the hard_label_weight is low, the student model relies more on the teacher model’s output; when it is high, the student model relies more on the actual training labels.
Similarly, kd_loss_weight is also an important hyperparameter that determines the weight of the soft label loss from the teacher model’s output in the total loss function. The higher the kd_loss_weight is, the more the student model depends on the teacher model output during training. There is a ratio relationship between kd_loss_weight and hard_label_weight, and together, they determine the relative emphasis the student model places on the soft labels from the teacher model and the true labels during training.
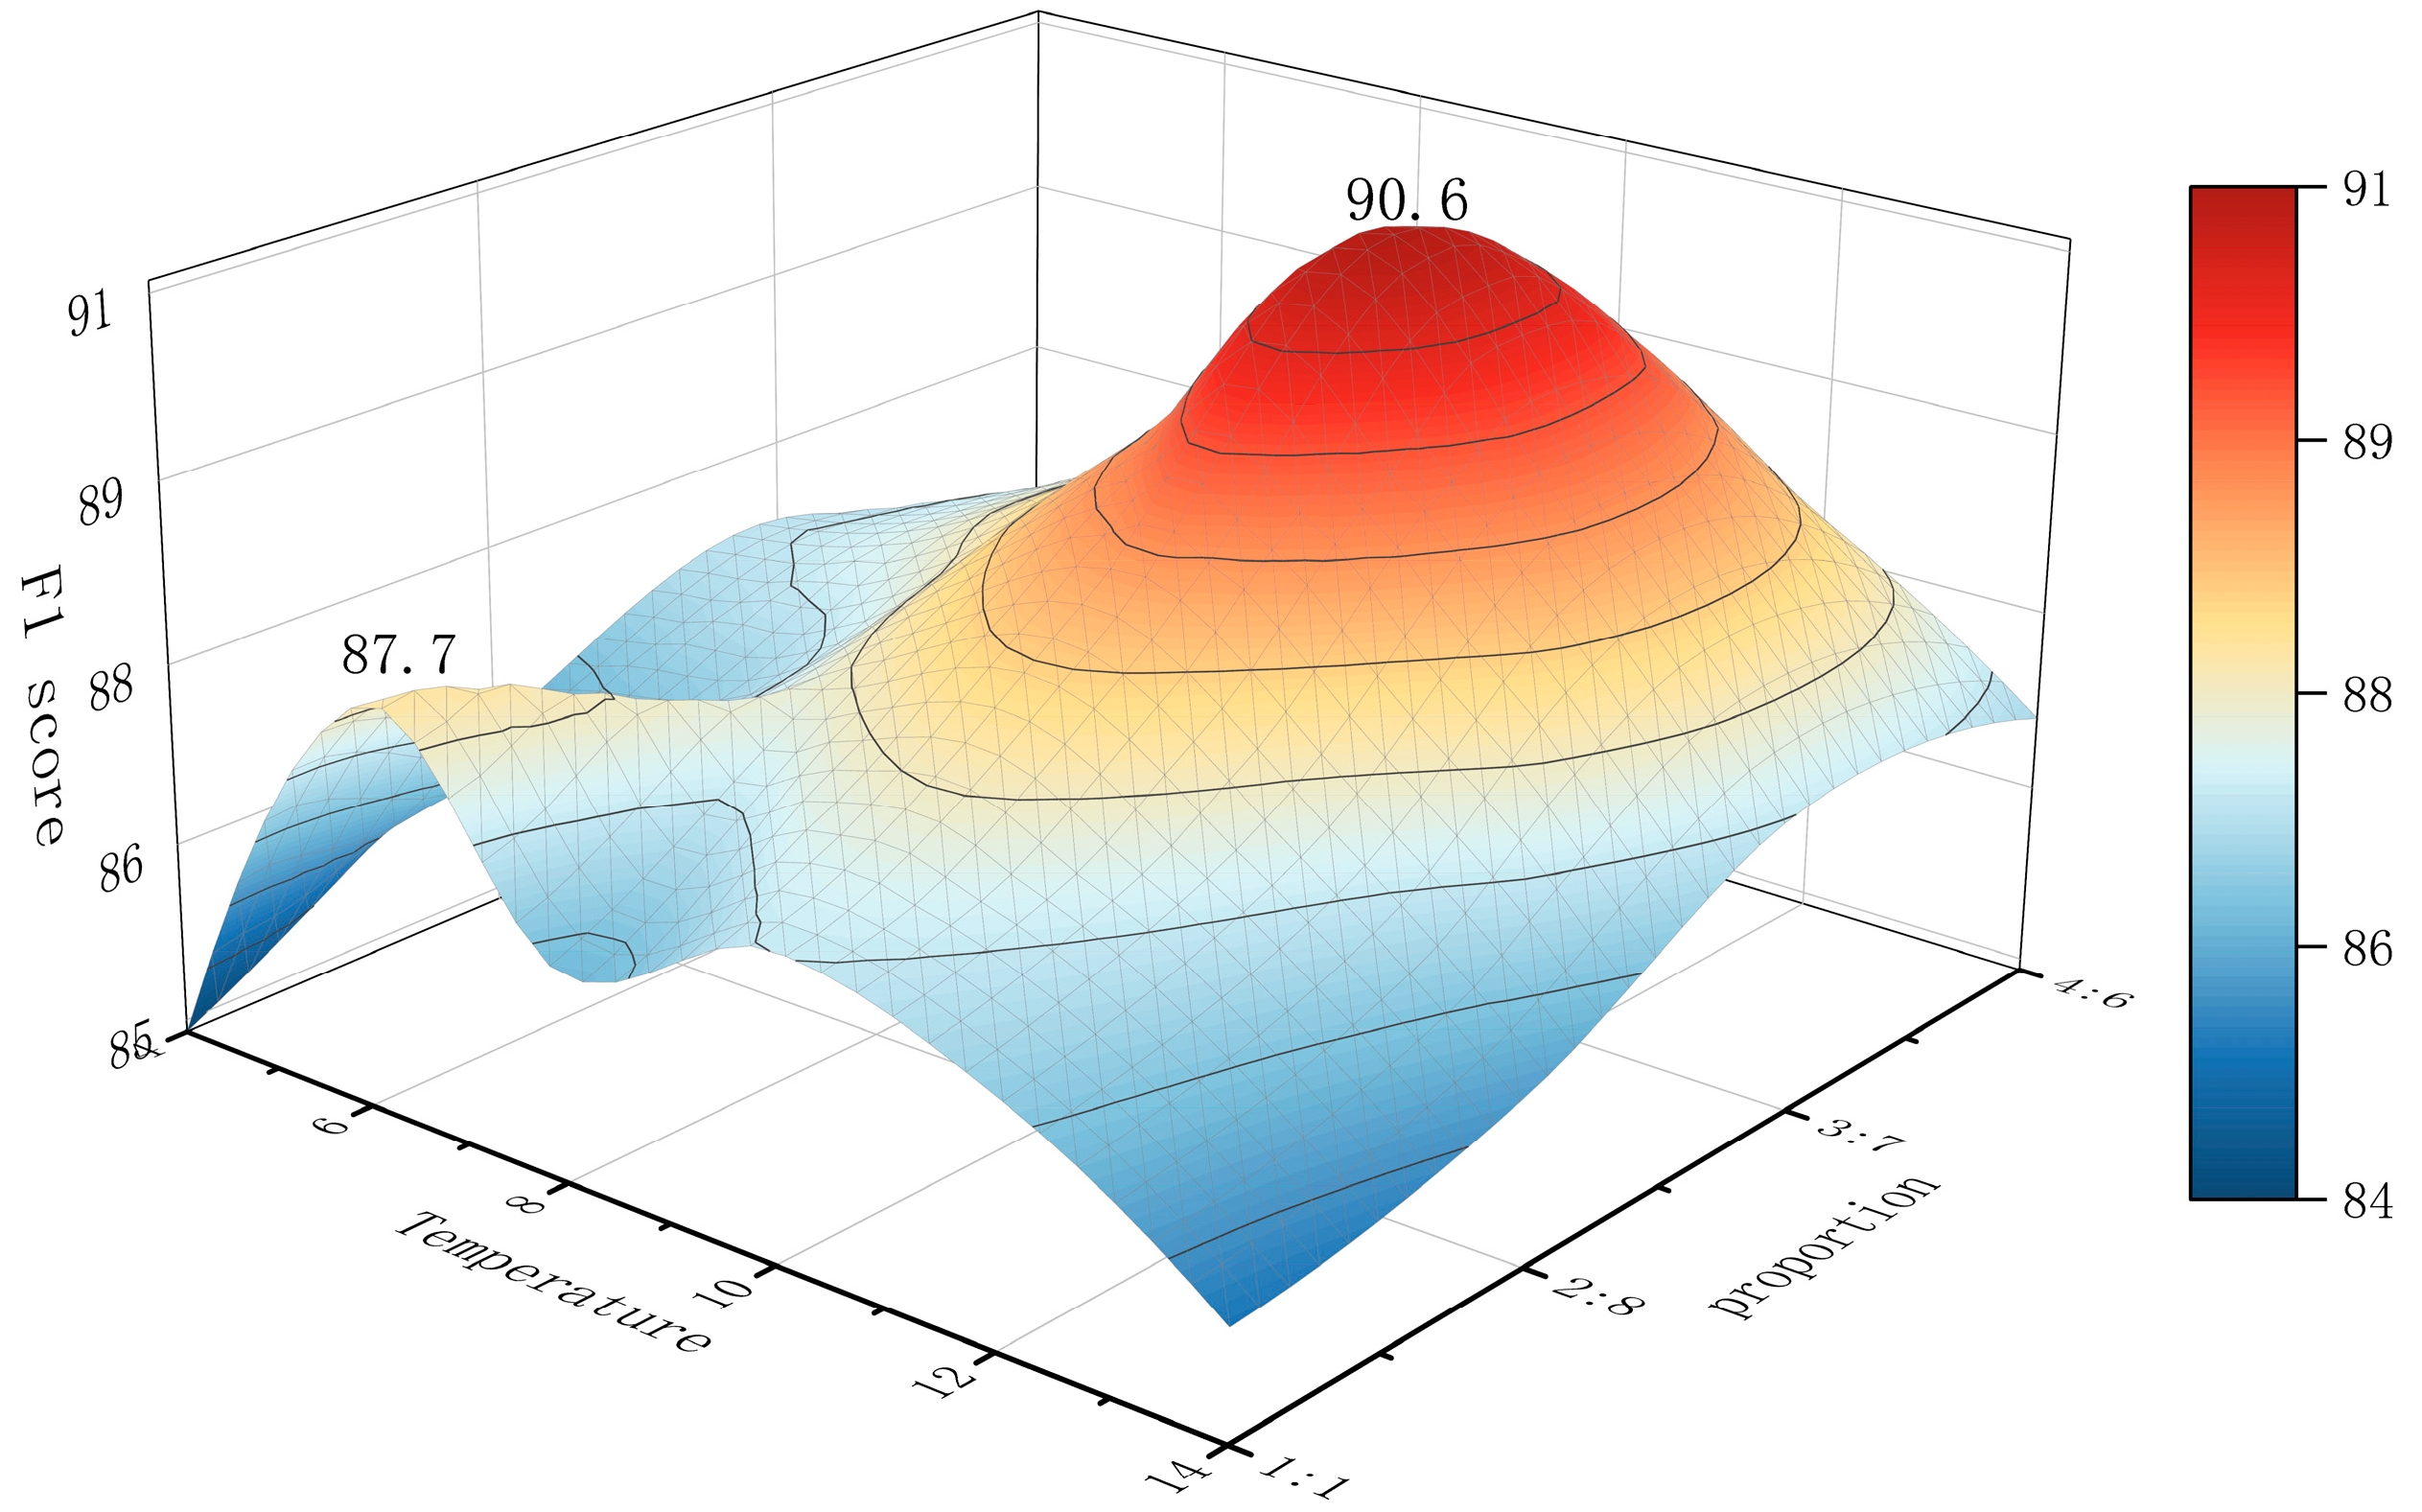
As shown in
Figure 7, the following trends can be observed: as the temperature increases, the F1 score clearly first increases but then decreases. Specifically, as the temperature parameter gradually increases from a lower value, the F1 score steadily increases until it reaches its peak at a temperature of 10, indicating that the student model achieves optimal performance at this temperature. Beyond this point, the F1 score begins to decline, suggesting that too high a temperature may lead to a decrease in model performance.
Similarly, for the ratio parameter (the ratio of hard_label_weight to kd_loss_weight), the F1 score shows a similar pattern. As the ratio parameter increases from a lower value, the F1 score gradually improves and reaches its peak at a ratio of 3:7, indicating that at this ratio, the student model achieves the best learning effect by combining hard and soft label information. When the ratio parameter is further increased, the F1 score starts to decrease, suggesting that a higher ratio may not be beneficial for improving model performance.
Notably, when the temperature parameter is set to 6, and the ratio is 1:1, the F1 score reaches 87.7 and does not follow the usual pattern of increasing or decreasing. This phenomenon may indicate that the experimental results have reached a local optimal state. Under this specific configuration, the model may have found the optimal solution for a particular dataset or task environment. This case suggests that there may be multiple locally optimal combinations of parameters in the KD process. Therefore, it cannot be ruled out that other locally optimal parameter configurations may appear in other datasets or different experimental settings, emphasizing the need to consider a variety of factors and finely tune and validate parameters when optimizing models.
In conclusion, through precise adjustment of the temperature and ratio parameters in the KD process, the performance of the student model can be effectively improved. Specifically, when the temperature parameter is set to 10, and the ratio parameter is set to 3:7, the model exhibits the best performance, with an F1 score of 90.6. Therefore, in practical applications, these two parameters should be adjusted according to the specific scenario to achieve the optimal model performance.
5. Conclusions
In PSC inspections of LNG carriers, the comprehensive application of complex regulatory knowledge presents a challenge. This study introduces an MDMD model. This model involves first selecting the teacher-student model and then, while fusing the knowledge from multiple layers of soft labels in the multi-teacher model, dynamically allocating the weights among the multiple teachers. The experimental results indicate that the DistillBERT model trained with a KD approach outperforms the directly trained DistillBERT model by 6.3 percentage points in terms of the F1 score, with a prediction speed increase of approximately 64% compared with those of the traditional BERT-BiLSTM-CRF, RoBERTa-BiLSTM-CRF, and MutiLingBERT-BiLSTM-CRF models and a reduction in model parameters of approximately 55% compared with those of conventional models. Thus, this model achieves an optimized balance between efficiency and performance.
Through sensitivity analysis of hyperparameters, we determined the impacts of temperature and scaling parameters on model performance. The model exhibited optimal performance when the temperature parameter was set to 10, and the scaling parameter was 3:7, providing a basis for parameter tuning in practical applications.
By constructing a knowledge graph, we can assist PSC inspectors in efficient information retrieval and decision-making. The model extracts knowledge and constructs a graph based on LNG vessel safety management laws and regulations, which has been verified with actual inspection data, demonstrating high accuracy. The findings of this study contribute to enhancing the efficiency of PSC inspections and addressing the complex challenges of onsite inspections. Additionally, shipowners and crew members can use this to strengthen safety management and prevent accidents. We hope that this method will contribute to vessel safety management from an inspection perspective, reducing the risk of accidents.
This study has certain limitations. First, the precision of the model needs further improvement. Although the current model achieved reasonable accuracy and stability, further optimization is needed. Second, there is a need to expand the sources of regulatory knowledge. This study relies heavily on data sourced from Chinese regulatory frameworks, limiting its generalizability to global PSC inspections. The current study is primarily based on Chinese laws and regulations. Future studies should incorporate more international regulations and conventions, with the aim of exploring new ways to prevent accidents through PSC inspections and providing strategic recommendations for the management of the shipping industry. Given the impending adoption of the IMO MASS Code, subsequent studies should consider incorporating PSC procedures for autonomous ships into knowledge graphs. Given the high-stakes nature of PSC inspections, explainability mechanisms should be explored to ensure regulatory transparency. The paper does not address the dynamic evolution of maritime regulations. The current knowledge graph relies on fixed versions of international conventions and historical Chinese inspection cases. However, maritime rules are frequently revised in practice due to technological advancements or lessons from accidents. A static knowledge graph would struggle to adapt to additions, deletions, or modifications of regulatory clauses, risking conflicts between the system’s outputs and the latest legal requirements.
The research outcomes offer tangible benefits for maritime companies and crew members alike. From a corporate perspective, the model enhances PSC inspection readiness, thereby minimizing operational delays and financial losses attributable to inspection failures. The AI-driven deficiency prediction capability can optimize maintenance schedules and bolster the operational reliability of LNG carriers. Furthermore, the data-driven insights derived from PSC inspection records can be leveraged to refine vessel management policies and improve compliance with international regulations.
For the crew, the knowledge graph serves as a user-friendly resource for visualizing inspection criteria, thereby mitigating workload and improving on-site safety. The capability to preemptively identify irregularities in critical systems, such as cargo handling, gas detection, and fire suppression, substantially augments risk mitigation efforts. Additionally, by simplifying the comprehension of complex maritime regulations, the knowledge graph empowers seafarers with the requisite knowledge to respond to inspection requirements more effectively.
These practical advantages collectively enhance PSC inspection preparedness and contribute to the overarching goal of safer and more efficient LNG carrier operations. The fusion of domain-specific knowledge with advanced AI techniques provides a solid foundation for further research and development.
