Article

Construction of an LNG Carrier Port State Control Inspection Knowledge Graph by a Dynamic Knowledge Distillation Method

1
School of Navigation, Wuhan University of Technology, Wuhan 430063, China
2
Hubei Key Laboratory of Inland Shipping Technology, Wuhan University of Technology, Wuhan 430063, China
3
School of Computer Science and Artificial Intelligence, Wuhan University of Technology, Wuhan 430061, China
*
Author to whom correspondence should be addressed.
J. Mar. Sci. Eng. 2025, 13(3), 426; https://doi.org/10.3390/jmse13030426
Submission received: 6 February 2025 / Revised: 23 February 2025 / Accepted: 24 February 2025 / Published: 25 February 2025
(This article belongs to the Section Ocean Engineering)

Abstract

:
The Port State Control (PSC) inspection of liquefied natural gas (LNG) carriers is crucial in maritime transportation. PSC inspection requires rapid and accurate identification of defects with limited resources, necessitating professional knowledge and efficient technical methods. Knowledge distillation, as a model lightweighting approach in the field of artificial intelligence, offers the possibility of enhancing the responsiveness of LNG carrier PSC inspections. In this study, a knowledge distillation method is introduced, namely, the multilayer dynamic multi-teacher weighted knowledge distillation (MDMD) model. This model fuses multilayer soft labels from multi-teacher models by extracting intermediate feature soft labels and minimizing intermediate feature knowledge fusion. It also employs a comprehensive dynamic weight allocation scheme that combines global loss weight allocation with label weight allocation based on the inner product, enabling dynamic weight allocation across multiple teachers. The experimental results show that the MDMD model achieves a 90.6% accuracy rate in named entity recognition, which is 6.3% greater than that of the direct training method. In addition, under the same experimental conditions, the proposed model achieves a prediction speed that is approximately 64% faster than that of traditional models while reducing the number of model parameters by approximately 55%. To efficiently assist in PSC inspections, an LNG carrier PSC inspection knowledge graph is constructed on the basis of the recognition results to quickly and effectively support knowledge queries and assist PSC personnel in making decisions at inspection sites.

1. Introduction

The maritime transportation of liquefied natural gas (LNG) is becoming a trend in global clean energy transportation [1]. Owing to the strict construction standards imposed on LNG carriers, maritime transportation of LNG is relatively safe. However, these standards do not guarantee that desirable performance can be maintained throughout the operational lifespan of these vessels. Generally, an LNG carrier is regarded as defective if its hull, equipment, or operational safety is significantly below the standards required by the conventions or if the crew members are unfamiliar with their duties.
Compared with other types of vessels, LNG carriers feature specialized safety and cargo maintenance equipment, such as specific detection and cargo handling systems designed to maintain the cargo temperature. Consequently, inspection of these vessels requires surveyors to possess a higher level of expertise and more specialized knowledge, including the details of safety equipment, the configuration of fire-fighting systems, and the pressure thresholds of equipment [2]. Notably, even minor defects can lead to catastrophic consequences, posing a threat not only to the safety of the crew but also potentially causing severe damage to the vessel. Therefore, developing a specialized approach to address the complex knowledge challenges encountered by LNG carriers during Port State Control (PSC) inspections is vital.
PSC plays a crucial role in ensuring the safety and security of maritime transportation. Various studies have been conducted to assess the effectiveness and factors influencing the implementation of PSC regimes. Xiao and colleagues examined the effectiveness of the new inspection regime for PSC by applying the Tokyo MoU [3]. Yuan and colleagues identified important factors influencing the implementation of independent PSC regimes using the analytical hierarchy process (AHP) to develop a framework for assessing priority factors [4]. Fan and colleagues utilized Bayesian network modeling to evaluate the effectiveness of PSC inspections [5]. Additionally, Şanlıer and colleagues analyzed PSC inspection data in the Black Sea region [6], while Emecen and colleagues assessed the similarities between PSC regimes based on the performance of flag states using hierarchical clustering methods [7]. Yan and colleagues developed an artificial intelligence model for ship selection in PSC based on detention probabilities [8], and Wang and colleagues incorporated deficiency data into the analysis of risk factors influencing PSC inspections [9]. Furthermore, Yang and colleagues used Bayesian network-based TOPSIS to aid dynamic detention risk control decisions in PSC [10]. Yan and colleagues investigated the influence of COVID-19 on PSC using inspection data [8]. Demirci and colleagues focused on intelligent ship inspection analytics by mining ship deficiency data for PSC purposes [11]. Shu and colleagues investigated the effects of sea ice on vessel routing and velocity by assessing the spatiotemporal correlations between Sea Ice Concentration, Sea Ice Thickness, Sea Ice Volume, and Automatic Identification System data along the Northeast Passage [12]. Liu and colleagues [13] and Chen and colleagues [14] have provided valuable insights into navigational safety and ship trajectory analysis, which are integral to enhancing PSC effectiveness. Their work complements existing studies on PSC, aiming to improve maritime safety and security.
The annual report of the 2023 Tokyo Memorandum of Understanding (Tokyo MoU) recorded increases in Port State Control (PSC) inspection rates, defect detection rates, and detention rates. For example, a certain Chinese maritime authority conducted PSC inspections on 14 liquefied gas carriers. Among them, 10 vessels (7 LNG and 3 LPG) were detained due to an average of 10.7 defects per vessel, including 4 critical defects, resulting in a detention rate as high as 71.43%. These vessels had an average age of 25.9 years, and their detention defects were primarily concentrated in areas such as the statutory certificates, load lines, fire protection systems, life-saving equipment, and cargo piping systems of the ships, with a particular emphasis on their exposed deck areas. In one case, an LNG carrier had accumulated water and bubbles at the junction of its discharge pipe and the cover of its temperature sensor circuitry, which triggered an alarm when a portable explosive gas detector measured a methane concentration of approximately 4%, which was ultimately attributed to damage to the internal packing box.
Knowledge graphs have become a significant area of interest in both industry and academia, with a focus on exploiting diverse, dynamic, and large-scale collections of data [15]. These graphs represent structural relations between entities and have been recognized as a crucial research direction towards cognition and human-level intelligence [16]. Various research efforts have been made to enhance the capabilities of knowledge graphs, such as knowledge reasoning over knowledge graphs [17], fake news detection using knowledge-driven multimodal graph convolutional networks [9], and bridging knowledge graphs to generate scene graphs [18]. One key aspect of knowledge graphs is their representation of learning, acquisition, and applications [16]. Knowledge acquisition, particularly knowledge graph completion, has been a significant area of focus in recent research. Methods such as embedding methods, path inference, and logical rule reasoning have been explored to enhance knowledge graph completion [16]. Liu developed a deep learning knowledge extraction model (BERT-MCNN) for extracting the information required for front-line management from China’s marine pollution control-related laws and regulations, effectively supporting the on-site decision-making of PSC inspectors [19]. Gan and colleagues employ knowledge graph technology to integrate various sources of knowledge for Flag State Control (FSC) inspections [20]. Gan and colleagues introduce a novel knowledge graph construction method to investigate ship collision accidents, highlighting the interconnections among critical accident factors [21]. The study compiles 241 ship collision investigation reports from 2018 to 2021, sourced from the China Maritime Safety Administration (CMSA) website. Ref. [22] developed a graph neural network model (MIDG-GCN) for predicting the causes of maritime vessel traffic accidents based on accident investigation reports, effectively aiding maritime authorities in quickly identifying accident factors and guiding decision-making in accident investigations. Zhang constructed a knowledge graph for PSC inspections of LNG carriers and developed a knowledge graph-based recommendation model (PT-KGCN) for predicting and recommending inspection items to improve the efficiency and accuracy of PSC inspections [23]. Liu’s research, by constructing a PSC inspection knowledge graph and using evolutionary game theory to analyze the internal evolutionary dynamics of ship populations, proposed a knowledge graph-based PSC inspection support decision-making strategy, which effectively improved the accuracy of inspections and resource utilization efficiency, providing new insights for the research on maritime supervision informatization and ship safety management [24]. This method aims to utilize the basic information provided by the knowledge module and the language module to mutually assist each other in generating embeddings for entities in the text and to create context-aware initial embeddings for entities and relationships in the knowledge graph. In summary, while knowledge graphs offer numerous opportunities for advancing research and applications, they also present challenges that need to be addressed. Understanding the structural relationships between entities, enhancing knowledge acquisition and completion methods, and fusing contextual information from language understanding are key focus areas in current knowledge graph research [25].
However, constructing knowledge graphs typically requires substantial computational and storage resources, which are impractical for many practical applications. In particular, high-performance deep learning models demand even more resources, limiting their application to devices with limited capabilities. Furthermore, pretrained language models have excessively long training times and do not offer a significant speed advantage in actual prediction tasks. Therefore, to better apply pretrained language models in engineering practice, it is necessary to consider the resource constraints of most users and develop new large-scale pretrained models to maximize their value. The research and industrial communities are seeking methods to construct lightweight pretrained models while maintaining their performance.
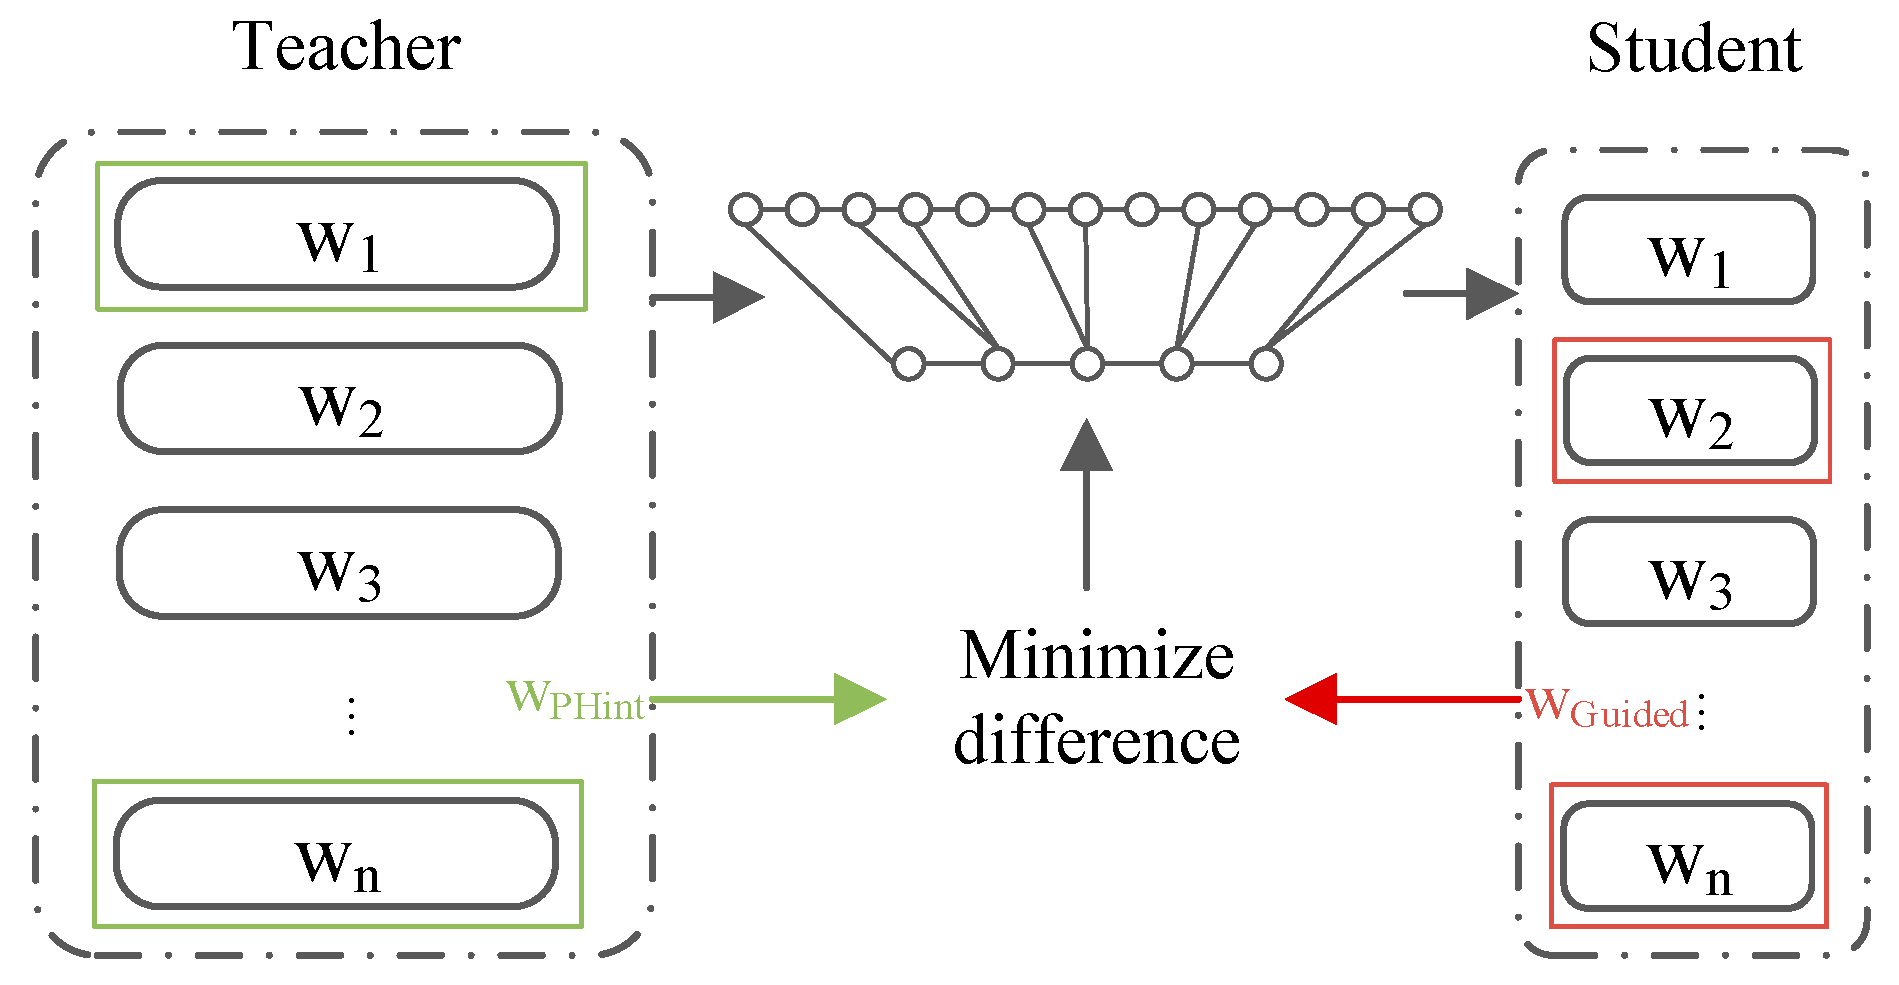
Among the most notable successes in the NLP field are ChatGPT, based on GPT-3.5, and GPT-4 from OpenAI, which have exerted a significant influence not only on the AI research community but also far beyond it. Studies on constructing such models have yielded various methods, among which reducing the number of model parameters is the most common approach [26]. Reducing the number of model parameters can be achieved through techniques such as pruning to remove redundant connections and parameters or through applying methods such as low-rank decomposition. The emergence of knowledge distillation (KD) technology offers a novel method for compressing pretrained language models, realizing knowledge transfer from large models to smaller ones through the concept of “distillation”. Compared with pruning and quantization, knowledge distillation can transfer knowledge from a teacher network, ensuring the accuracy of the student network after implementing compression. It offers greater flexibility and ease of implementation, and it does not rely on specific hardware. Pruning may result in information losses, whereas quantization may diminish the performance of the constructed model. Tian and colleagues introduced the concept of Contrastive Representation Distillation, which focuses on maximizing mutual information between teacher and student models [27]. Chen and colleagues proposed Online Knowledge Distillation with Diverse Peers (OKDDip), which involves two-level distillation with multiple auxiliary peers and a group leader [28]. Goldblum and colleagues highlighted the vulnerability of small neural networks produced through knowledge distillation to adversarial attacks [29], while Tang and colleagues categorized teachers’ knowledge into three hierarchical levels to study its effects on knowledge distillation [30]. Cheng and colleagues presented a method to quantify and analyze task-relevant and task-irrelevant visual concepts encoded in intermediate layers of deep neural networks to explain the success of knowledge distillation [31]. Xu and colleagues discussed practical ways to exploit noisy self-supervision signals for distillation [32]. Allen-Zhu and colleagues developed a theory showing that ensemble and knowledge distillation in deep learning work differently from traditional learning theories, especially in the presence of a multi-view data structure [33]. Zhang and colleagues proposed two knowledge distillation methods for object detection, leading to significant improvements in average precision [34]. Zhao and colleagues introduced Decoupled Knowledge Distillation (DKD) to address issues with the classical KD loss formulation [35]. Yang and colleagues introduced an open-source knowledge distillation toolkit for natural language processing to facilitate the implementation of knowledge distillation in NLP tasks named Textbrewer [36]. Finally, Zhang and colleagues presented self-distillation as a novel technique to improve the efficiency and compactness of neural networks by addressing the limitations of model deployment due to the growth of computation and parameters [37]. In KD, a complex teacher model guides a simpler student model to accomplish knowledge transfer and construct a lightweight model. Moreover, multi-teacher KD methods require consideration of the performance differences between teachers to achieve dynamic guidance among them, which is an important direction in the field at present.
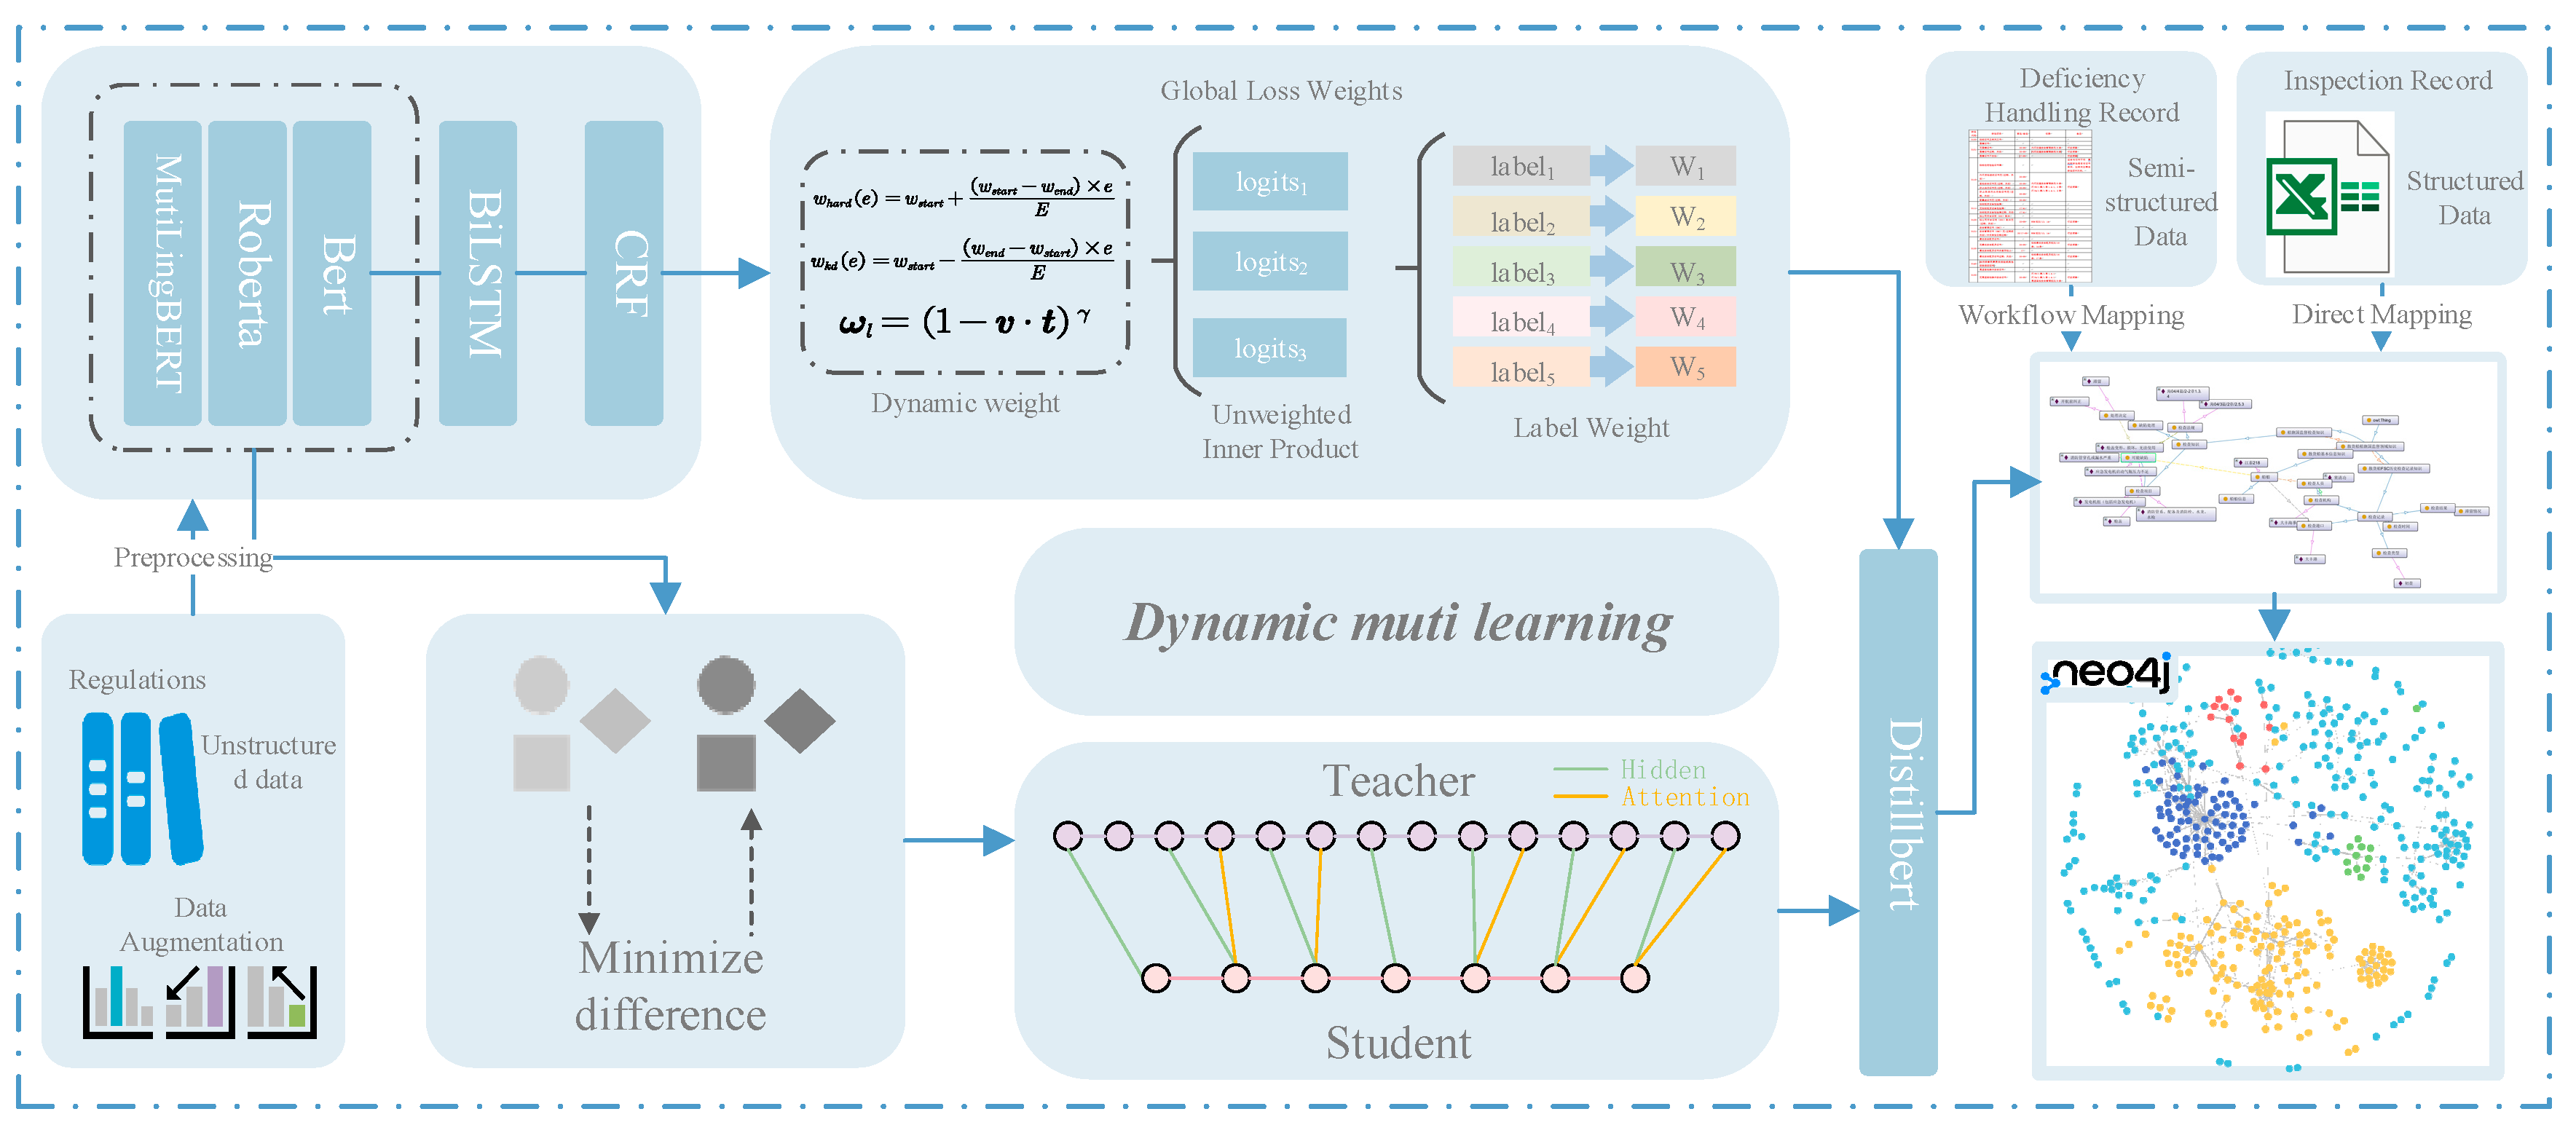
To increase the efficiency and accuracy of PSC inspections for LNG vessels, a finely tuned KD technique has been adopted for inspection model optimization. This technique has demonstrated significant advantages in terms of professional performance. Specifically, after intensive training using a substantial amount of PSC inspection data, the distilled model is capable of accurately identifying unique risk factors and potential safety hazards for LNG vessels, substantially improving the targeting and effectiveness of inspections. The model focuses on optimizing the inspection process for the characteristics of LNG vessels, streamlining nonessential inspection procedures, and effectively reducing the number of inspection cycles while ensuring strict compliance with all safety regulations. During the PSC inspection process, historical data are utilized by the model to accurately identify and classify potential defects, providing scientific support for vessel maintenance and management. The model offers real-time decision-making support for PSC inspectors, reducing human error through data analysis and enhancing the consistency and fairness of inspections. As PSC inspection standards evolve and maritime technology advances, the model continuously learns, integrates new inspection cases, adapts to industry changes, and consistently performs at the forefront of PSC inspections for LNG vessels. In summary, this model, which is based on KD technology, provides efficient and precise support for PSC inspections of LNG vessels, ensuring the safety and reliability of LNG transportation while enhancing the professionalism and scientific nature of the entire inspection process.

2. Methods

This section outlines a knowledge extraction framework for PSC inspections of LNG vessels. First, a teacher-student model is selected, followed by the integration of multilayer soft labels from multiple teacher models. Finally, the weights of multiple teachers are dynamically allocated. A deep learning-based KD model is proposed—the multilayer dynamic multi-teacher weighted KD (MDMD) model.

2.1. Multilayer Soft Label Knowledge Fusion

2.1.1. Intermediate Feature Soft Labels Extraction Method

In KD, the student model is required not only to learn the final prediction outcomes of the teacher model but also to learn the features of the intermediate layers. Traditional methods focus on the soft target knowledge of the output layer, but in tasks such as NER, intermediate features are equally important. Therefore, a customized knowledge distillation strategy is necessary to ensure that the student model can learn key information.
Studies have shown that relying solely on output feature learning is insufficient, as the capacity difference between the teacher and student models at the intermediate layers affects knowledge transfer. To address this problem, researchers have proposed the intermediate feature KD, which involves extracting the intermediate layer features of the teacher model to guide the learning of the student model, thereby improving its performance.
FitNets is one of the earliest methods to utilize intermediate feature knowledge from a teacher model [38]. The proposed method refines this process by encouraging the intermediate layers of the student model to approximate the outputs of the teacher model, thereby learning feature representations more effectively and reducing the model size without compromising performance. The key concept is to align the hidden layers of the student model with those of the teacher model, enabling the student to predict outputs similar to the teacher’s hidden layers. In this way, the student model can learn the feature representations of the teacher model at the intermediate layers, thereby enhancing its overall learning efficiency and performance. This approach effectively promotes the student model’s ability to closely approximate the teacher model while maintaining a smaller size. The loss for the student model to learn the intermediate hidden layers of the teacher model is defined in Equation (1).
L Hint W Guided , W r = 1 2 | u h x ; W PHint r u g x ; W Guided ; W r | 2
where W PHint is a part of the weights of the first h layers of the teacher model and W Guided represents the weights of the first g layers of the student model. The output u is the feature output. The regression function r is designed to address the mismatch in dimensions between the hidden layers of the teacher and student models. The initial g layers of the student network, when processed through this regression function, are expected to yield intermediate hidden layer feature outputs that closely resemble the first h layers of the teacher model. After the student model has learned the intermediate features from the teacher model, the original knowledge distillation loss is then applied to perform KD across the entire network.

2.1.2. Minimizing Intermediate Feature Knowledge Fusion

In the KD model training process, there are two major challenges: the high computational cost and the reduction in model generalizability. To overcome these challenges, this paper introduces a novel strategy that reduces computational complexity by minimizing intermediate features, thereby facilitating more effective hierarchical learning by the model.
The objective is to streamline the computational process by simplifying the intermediate features while integrating multisource knowledge to enhance the model’s generalizability. This strategy initially focuses on the fundamental characteristics of the data and shallow features and then progressively transitions to more complex characteristics. This approach significantly mitigates the computational burden in the early stages of training, as shallow features typically encapsulate the basic information of the data, whereas deeper features reveal higher-level abstract concepts. Through this shallow-to-deep learning approach, the model can progressively understand the deeper structure of the data while maintaining performance.
In the multi-teacher distillation framework, knowledge fusion is achieved through independent forward propagation. Each teacher network processes the data independently, generating its own output vectors. To align outputs of different dimensions, methods such as linear mapping are employed to ensure that all outputs reside within the same dimensional space. On this basis, instead of a simple average, a weighted average is employed to process the outputs of all teacher models under the assumption that each teacher model contributes differently to the predictions. By fusing the knowledge from each teacher model, comprehensive weights are allocated to compute prediction outputs. This method not only provides consensus predictions for all categories but also offers a more robust and comprehensive guidance signal to the student network, thus enhancing its performance, understanding, and generalizability when handling complex tasks.
A set of learning schemes for fusing knowledge on the basis of the layer characteristics of the teacher and student models is introduced in this paper. Initially, raw data are processed through the embedding layer of the teacher model to be transformed into vector representations. The data are subsequently processed through 12 encoder layers to progressively obtain more advanced feature representations. Attention mechanisms are introduced between each encoder layer to enhance the model’s focus on the critical parts of the input data, thereby improving the efficiency of feature extraction. This feature information is transmitted to the student model, which has only 6 encoder layers, in an arithmetic sequence through hidden layers. Notably, owing to the absence of attention mechanisms but the presence of hidden layers in the embedding layer, the transmission sequences of the hidden and attention layers differ. Each encoding layer of the student model learns from different encoding and attention layers of the teacher model, achieving effective knowledge transfer and distillation. The multilayer soft label knowledge fusion is shown in Figure 1 and Equation (1).
The procedure for the multilayer soft label knowledge fusion process entails the following steps: Initially, knowledge is selected from the teacher model. Subsequently, the selected knowledge is subjected to a minimization of differences. Finally, an appropriate number of layers within the student model are chosen for the learning process.

2.2. Dynamic Multi-Teacher Weight Allocation Method

To increase the efficiency of the student model during the learning process and strengthen its ability to recognize confusing samples, a comprehensive soft label scheme is introduced. This scheme combines the model’s overall performance with its learning capability for specific samples. The framework consists of two key components: first, by analyzing the correlation between the soft labels and hard labels of the teacher model, global weights are calculated; second, by computing the inner product of the student model’s predictions with those of the teacher model, the similarity of the student model’s predictions to the teacher model’s predictions is measured; then, the respective weights are obtained. By fusing these two sets of weights, a weighted sum of the soft labels from each teacher model can be achieved, resulting in a comprehensive soft label.
The implementation of this scheme not only ensures the model’s generalizability across different types of entity recognition tasks but also further enhances the overall performance of the model by improving the recognition accuracy for specific entities. In this manner, the student model can maintain efficient learning while more accurately identifying and distinguishing confusing samples, thereby improving its performance in practical applications.

2.2.1. Global Loss Weight Allocation

To enhance the model’s ability to learn from challenging samples, a method involving the dynamic adjustment of global teacher weights is introduced. During the training process, the student model dynamically adapts its learning approach, transitioning from initially focusing on learning soft labels to learning the true labels. The specific formulas are shown in Equations (2) and (3).
w h a r d e = w s t a r t + w s t a r t w e n d × e E
w k d e = w s t a r t w e n d w s t a r t × e E
where w h a r d e is the weight of the hard label loss at training step e , w k d e represents the weight of the KD loss at training step e , w s t a r t is the initial value of the KD loss weight, w e n d is the final value of the KD loss weight, and E is the total number of training steps.
Two functions are defined: one for calculating the hard label loss weight and the other for the KD loss weight. The hard label loss function assigns a weight that increases linearly with the current training step (epoch), while the KD loss function assigns a weight that decreases linearly with each epoch. In the initial training phase, the student model primarily learns from soft labels, which aids the model in learning the overall knowledge distribution of the teacher model. As training progresses, the student model gradually shifts to primarily learning true labels, which helps the model focus more on challenging samples and enhances its recognition capabilities. This strategy can help the model balance generalizability and accuracy. In the early stages of training, the focus on soft labels helps improve the model’s generalizability, while in the later stages of training, the focus on true labels helps to improve the model’s accuracy.

2.2.2. Label Weight Allocation Based on the Inner Product

In the KD process, the rational allocation of sample weights is crucial for improving model performance. To enhance the model’s learning capability for challenging samples, the dynamic temperature distillation method is applied to adjust the temperature parameter to assign higher weights to these samples, thereby improving their learning efficiency. However, how to more effectively distribute sample weights remains a challenge. Focal loss-style weights (FLSWs) offer an innovative solution by assigning weights on the basis of the learning difficulty of each sample. This approach ensures that challenges samples are assigned higher weights, thereby strengthening the model’s ability to recognize them [39].
In this work, which is based on the FLSW method, an improvement is made to the sample weights by replacing them with the total weight of each label for calculation. This improvement enhances the model’s generalizability across different labels and its accuracy in identifying challenging samples. The specific formula is shown in Equation (4).
ω l = 1 v t γ
where ω l is the weight for label l , v is the student model’s prediction for sample x , t is the teacher model’s prediction for label l , and γ is a hyperparameter used to control the focus of the FLSW for challenging samples. When the student model’s prediction for labels differs significantly from the teacher model’s prediction, the value of v t is smaller, and the value of 1 v t γ is larger, which results in the label being assigned a higher weight. When the student model’s prediction for label l is similar to the teacher model’s prediction, the value of v t is larger, and the value of 1 v t γ is smaller, leading to a lower weight for sample x .
The core concept of the FLSW method involves performing an inner product operation between the predictions of the student and teacher models for the same sample. This operation generates a value ranging from −1 to 1, which is used to measure the similarity between the student and teacher model predictions. Using this inner product value, the FLSW method assigns a sample weight. The magnitude of the weight is directly proportional to the discrepancy in the predictions. Specifically, when the prediction of the student model significantly differs from that of the teacher model, the inner product value is smaller, and the sample weight is larger; conversely, when the predictions are similar, the inner product value is larger, and the sample weight is smaller.
During the actual training process, most samples are correctly predicted by the model, resulting in smaller sample weights. To address this issue, the FLSW method introduces normalization techniques to scale the weights, making their values comparable and controllable. Experiments have shown that the FLSW method can significantly enhance the performance of KD models, particularly in recognizing challenging samples.

2.2.3. Comprehensive Dynamic Weight Allocation Scheme

To effectively leverage the unique strengths of each teacher model for different labels, a set of soft label weights tailored for specific languages is designed for each teacher model, with a focus on the performance of each teacher model on labels of varying lengths and complexities. The accuracy of the teacher models is calculated for each label to obtain the teacher model’s label advantage weights, which are then used to adjust the soft labels. The specific process is shown in Equations (5)–(7).
W M j l = a M j l i = 1 n a M i l
where W M j l represents the weight of model M j on label l , a M j l represents the recognition accuracy of model M j on label l , and n is the number of teacher models.
W ^ M l = W M W M l
where W ^ M l is the weight of model M on label l , considering the advantages of each label and the global features.
P l = i = 1 n P M i l W ^ M i l
where P l is a comprehensive soft label that fuses the label advantage for label l , while W ^ M l indicates the independent soft label of model M i for label l . This approach biases the soft labels for each tag toward the teacher model that performs best for that particular label. By integrating global relevance weights and specific label weights, customized comprehensive soft labels are generated for each label. This blending strategy enables the student model to not only learn the most effective information from each label but also maintain sensitivity to global features. This approach not only improves the model’s accuracy for specific labels but also enhances the model’s ability to generalize to different label features.

2.3. Construction of the Multilayer Dynamic Multi-Teacher Weighted Knowledge Distillation Model

In the field of natural language processing (NLP), RoBERTa-wwm-ext and BERT-base-Chinese are two models that have been pretrained using vast amounts of Chinese language data and demonstrated exceptional performance. These models are selected as the teacher models. Additionally, MutiLingBERT is a pretrained model based on multilingual data training that excels at handling multilingual tasks. All three models are based on the transformer architecture, but they differ in training strategies and details, giving each a unique performance profile in NLP tasks.
The bidirectional encoder representations from the transformers (BERT) model, with its bidirectional transformer structure, are capable of capturing deep bidirectional contextual information within text [40]. In contrast, RoBERTa is an improved version of BERT that enhances model performance by adjusting pretraining strategies and hyperparameters. RoBERTa employs a dynamic masking strategy during the pretraining process. This strategy increases the model’s difficulty when predicting masked words, thereby improving the overall performance of the model [41]. In summary, BERT excels at handling short entities, whereas RoBERTa demonstrates better generalizability, effectively dealing with longer, more extensive entities.
Next, the long short-term memory network addresses the issues of vanishing and exploding gradients in the training process of traditional recursive recurrent neural network (RNN) structures. The bidirectional LSTM extracts hidden layer states h t and h t from the forward and reverse layers of the LSTM network for the input sequence a t t = 1 , 2 , , n . The input sequence enters the embedding layer to obtain the embedded sequence x t t = 1 , 2 , , n , which, after being input into the LSTM layer, yields feature vectors h t x containing contextual information. Moreover, the dictionary feature embedded sequence g t t = 1 , 2 , , n , after being input into the LSTM layer, results in feature vectors h t x containing boundary information. These two sets of B i L S T M networks are independent of each other and do not share any parameters; thus, they can be formalized as defined in Equation (8).
h t x = B i L S T M h t + 1 x , h t 1 x , x t h t g = B i L S T M h t + 1 g , h t 1 g , g t
The conditional random field (CRF) is then utilized to identify the optimal annotation order of words within entities to form entities. B i L S T M extracts long-distance textual information but does not excel in recognizing the sequential information between adjacent tags. In contrast, CRF can predict the optimal sequence of tags on the basis of the dependency relationships between labels [42]. To increase the accuracy of the prediction results, this study employs cross-entropy as the loss function, training the model by predicting the probability of tags approaching the true labels.
When discussing the construction of student models, there are two main KD student models to choose from. DistillBERT, a lightweight transformer model [43], achieves most of BERT’s performance while using fewer parameters, making it suitable for environments with limited resources. It employs the transformer encoder architecture, with a multilayer perceptron as the output layer. Another model, TinyBERT, has a reduced number of encoder layers and hidden layer dimensions. The original BERT model may contain 12 or 24 encoder layers. However, in TinyBERT, there are only 4 encoder layers. Moreover, since its hidden layer dimension is 312, as opposed to BERT’s 768, mapping methods need to be adopted during the distillation process to accommodate the dimensional difference.
Figure 2 shows the implementation steps of the MDMD model, which commences with inputting prelabeled text data into a pretrained teacher model for fine-tuning, resulting in a finely calibrated teacher model. The process then splits into two concurrent phases. In the first phase, intermediate feature soft labels from the teacher model are extracted, and knowledge integration across multiple layers of these soft labels is achieved by reducing the discrepancies between these features, ensuring that the student model absorbs the advanced abstract features of the teacher model. In the second phase, a holistic, dynamic weight allocation strategy is employed to integrate the global loss weight distribution with the label weight distribution based on the inner product of the prediction outcomes to dynamically adjust the weights of the multi-teacher models. These processes occur in tandem, collectively improving the learning efficiency of the student model. Once these steps are finalized, distilled knowledge is utilized to train the student model thoroughly. In the end, the trained MDMD model can transform unstructured text data into structured information, thereby constructing a knowledge graph for PSC inspections of LNG vessels.
For example, when detecting anomalies in LNG cargo tank pressure control systems, multiple teacher models first extract the content that they consider to be potential anomalies. These models subsequently score the provided results. The student model dynamically learns from the integrated outcomes of the teacher models in the anomaly detection task based on these scores. In the end, the student model identifies the anomalous entities that it deems acceptable, which will be used as the final anomaly detection results.

3. Experiments and Results

3.1. Dataset Preparation

In the current field of maritime regulation research, there is a lack of annotated datasets specifically targeting regulatory texts. This study is based on the practice of PSC inspections in China and focuses on the conventions of the International Maritime Organization (IMO) currently signed by China and relevant regulations published domestically. The constructed dataset is sourced from existing laws, regulations, departmental rules, and international conventions, as detailed in Table 1. This dataset includes documents related to PSC inspections such as the “Code for the Construction and Equipment of Ships Carrying LNG in Bulk”, “Code on the Use of Natural Gas as Marine Fuel”, “Technical Regulation System for Ships and Marine Facilities”, “International Convention on Standards of Training, Certification and Watchkeeping for Seafarers, 1978 (STCW Convention), “International Convention for the Safety of Life at Sea (SOLAS)”, “International Safety Management (ISM) Code”, and text content crawled from maritime-related websites.
Through detailed manual screening and processing of these texts, a total of 2558 unstructured data entries are obtained. These collected data exist in the form of single-sentence rule content, with no fixed length or topic restrictions, and contain many technical terms reflecting the specific content of the rules.
In the NER task, entities within these unstructured data are annotated for model training. The “BIO” annotation method is employed to label entity data, where “B” is the beginning of an entity (Begin), “I” indicates the inside of an entity (Inside), and “O” is used to mark nonentity text. Additionally, the unstructured text data collected from the professional domain are preprocessed for the NER task.

3.2. Parameter Setup

The experimental parameter settings are shown in Table 2 and Table 3. The character embeddings are set to 768 dimensions to ensure compatibility with the teacher model’s embedding layer. On the basis of the maximum sentence length of the text data, sentences in each batch are limited to 150 characters. These sentences, along with word embeddings, constitute the text embedding matrix. To fully exploit the potential of the model, the number of training rounds, or epochs, is set to 100. This setting implies that each data point will be used multiple times for model training, thereby promoting deeper learning of the knowledge within the data.
For batch processing, a batch size of 16 is chosen. This parameter determines how many batches the data are divided into for simultaneous training. The choice of batch size has a direct effect on hardware resource consumption and training speed: a larger batch size results in higher hardware consumption and typically faster training speed.
The distillation configuration for the student model is shown in Table 3. To ensure the smooth progress of the distillation process, the batch size, training epochs, and learning rate are kept consistent with those of the teacher model. Additionally, the learning temperature during distillation is set to 10, the hard_label_weight is 0.3, and the kd_loss_weight is 0.7. The selection of these hyperparameters is analyzed and discussed in detail in the following sections.
To validate the performance of the DistillBERT model in NER tasks, teacher models are considered comparable models. Among the deep learning-based methods, the directly trained TinyBERT model, TinyBERT-BiLSTM-CRF model, TinyBERT-BiGRU-CRF model, DistillBERT-BiLSTM-CRF model, and DistillBERT-BiGRU-CRF model are selected for comparison.

3.3. Accuracy Assessment

In the assessment of model accuracy, the precision, recall, and F 1 score metrics are used to comprehensively measure the effectiveness of the model. The specific formulas are shown in Equations (9)–(11). Precision measures the correctness of the model in identifying various entity or relationship labels, i.e., the model’s ability to accurately identify the target categories without error. Recall measures the model’s ability to cover all relevant entities or relationship labels in the identification process, i.e., the efficiency of the model in finding all actually existing target categories. The F1 score is the harmonic mean of precision and recall and is employed to evaluate the overall performance and stability of the model.
Specifically, true positive ( T P ) refers to the actual number of entities or relationship labels correctly identified by the model as the i category. False positive ( F P ) refers to the number of entities or relationship labels from other categories that the model incorrectly identifies as the i category. False negative ( F N ) refers to the number of entities or relationship labels that the model fails to correctly identify but should actually be categorized as the i category. n represents the total number of entity or relationship label categories.
precision = 1 n i TP i TP i + FP i
r e c a l l = 1 n i T P i T P i + F N i
F 1 = 2 × Precision × Recall Precision + Recall
In the model evaluation phase, the performance metrics, computational efficiency, and architectural complexity of the model are carefully considered. The specific formulas are shown in Equations (12) and (13). The time cost for the model to make predictions is quantified by precisely recording the time interval between the start and end of the prediction process. For the statistics of the model parameters, since different models do not use a unified vocabulary, to facilitate comparison, the vocabulary parameters are excluded from the total number of model parameters, thereby accurately calculating the actual size of the model’s parameters. This step helps to effectively control the model size and reduce the demand for computational resources.
T Prediction = T End T Start
P Model = P Total P Vocabulary

3.4. Results

3.4.1. Comparison of Results Among Various Models

The results of each model are shown in Figure 3. In this study on model performance evaluation, a variety of training strategies were implemented to compare and analyze different model architectures. Specifically, TinyBERT and its variants, as well as the traditional models, were subjected to conventional direct training methods. DistillBERT variants were also subjected to distillation training methods. Notably, the DistillBERT model underwent a dual training process that included both direct training and distillation training.
These models were exhaustively compared and analyzed in terms of key evaluation metrics: model parameter size (in millions), inference speed (in tenths of a second), and F1 score, as shown in Equations (11)–(13). Although the DistillBERT model showed minimal differences in parameter size and inference time between direct and distillation training, it achieved a 6.3-point improvement in the F1 score through distillation training compared with that of the direct training version, fully demonstrating the significant effect of the distillation method in enhancing model performance. This performance increase is attributed mainly to the effective transfer of knowledge from the teacher model to the student model during distillation, which improves the model’s efficacy without increasing model complexity or inference latency.
First, in terms of model parameter size, the TinyBERT series models contained only 4.83 M parameters, making them the most compact models. In contrast, the traditional models had a parameter count of up to 95.51 M, placing them among the models with the largest parameter counts. The DistillBERT model has a parameter size of 19.144 M, which is slightly larger than that of TinyBERT but more advantageous than the other models.
Second, in terms of inference speed, the TinyBERT series models also exhibited excellent performance. In particular, the TinyBERT (train) model required only 8.52 ds for inference, whereas the other traditional models had longer inference times, such as 54.01 ds for BERT-BiLSTM-CRF, 57.28 ds for RoBERTa-BiLSTM-CRF, and 57.91 ds for MutiLingBERT-BiLSTM-CRF. Compared with that of the other models, the DistillBERT models trained with both methods had a similar speed of 19 ds, which was advantageous.
Finally, regarding the F1 score, the RoBERTa-BiLSTM-CRF (train) model achieved the best performance, with a score of 92.21, followed by the DistillBERT (distill) model, which employed the distillation method and achieved an F1 score of 90.62. The TinyBERT series models yielded relatively low F1 scores.
Considering these three key dimensions, the DistillBERT series of models achieved an excellent balance between model efficiency and performance. In particular, the DistillBERT (distill) model, after optimization through the distillation method, significantly improved its F1 score to 90.62 while maintaining the original parameter size and prediction speed, demonstrating outstanding accuracy and efficiency balance.
Therefore, on the basis of the conclusions of this comparison, the DistillBERT (distill) model was selected. Although its parameter size and inference time are similar to those of the TinyBERT series models, the DistillBERT (distill) model significantly outperformed the TinyBERT series in terms of the F1 score, highlighting its clear performance advantage. Moreover, compared with the traditional models, the DistillBERT (distill) model also performed better in terms of parameter size and inference time, achieving the optimal balance between model efficiency and performance.

3.4.2. Results Graph

A total of 8512 valid triplets were extracted. The extracted knowledge of LNG carrier PSC inspections is stored in the graph database Neo4j. Nodes represent the head entities or tail entities, whereas edges denote the relationships between head and tail entities. Storing this information in a graph database enables rapid querying and pinpointing of knowledge, offering effective utilization for practical scenarios to aid in inspections. A partial knowledge graph of the steering gear compartment area is shown in Figure 4. The constructed knowledge graph comprehensively covers multiple critical areas of ship safety management and operations, including issues such as failure of the main boiler fuel oil pressure alarm, the absence of gas detectors, and the poor condition of the gas fuel automatic shutdown system, as well as details related to maintenance, inspection, and emergency response preparation of the steering gear installation.
The knowledge graph illustrates a system with various entities and concepts, as well as the relationships between them. Entities represent specific objects or components within the system, such as ventilation equipment, rudders, and hydraulic systems. Concepts, on the other hand, represent functions or attributes of the system, such as steering control and relief valves. The relationships in the constructed graph describe the connections between entities and concepts, including dependencies, cause-and-effect relationships, and hierarchical relationships. These relationships form the structure of the graph, helping us understand how the different parts of the system interact with each other.
For example, within the inspection region of a steering control system, several critical inspection projects are undertaken to maintain the integrity and reliability of the steering mechanisms. One such project involves verifying the operational status of the power supply of the steering gear, ensuring that both the main and emergency power sources are functioning correctly. This is crucial for maintaining control of the vessel during normal operations and in emergency situations. Another key inspection point is the examination of the control system of the steering gear, where inspectors check for any signs of wear, damage, or malfunctions that could impair its steering capabilities. These inspections are complemented by routine tests concerning the response time and accuracy of the steering system, which are essential for ensuring the maneuverability of the vessel and its safety at sea. Any identified deficiencies are promptly recorded and addressed while adhering to the strictest safety standards and regulations. These contents not only reveal existing safety hazards and compliance issues but also provide detailed guidance for crew training, equipment maintenance management, and correct responses in emergency situations. Furthermore, the graph emphasizes the importance of interdepartmental collaboration, providing a basis for the continuous improvement of ship safety management. This ensures the safe operation of vessels under various conditions, effectively prevents accidents, and protects personnel and property.

4. Discussion

4.1. Comparison of Traditional Model Discrepancies

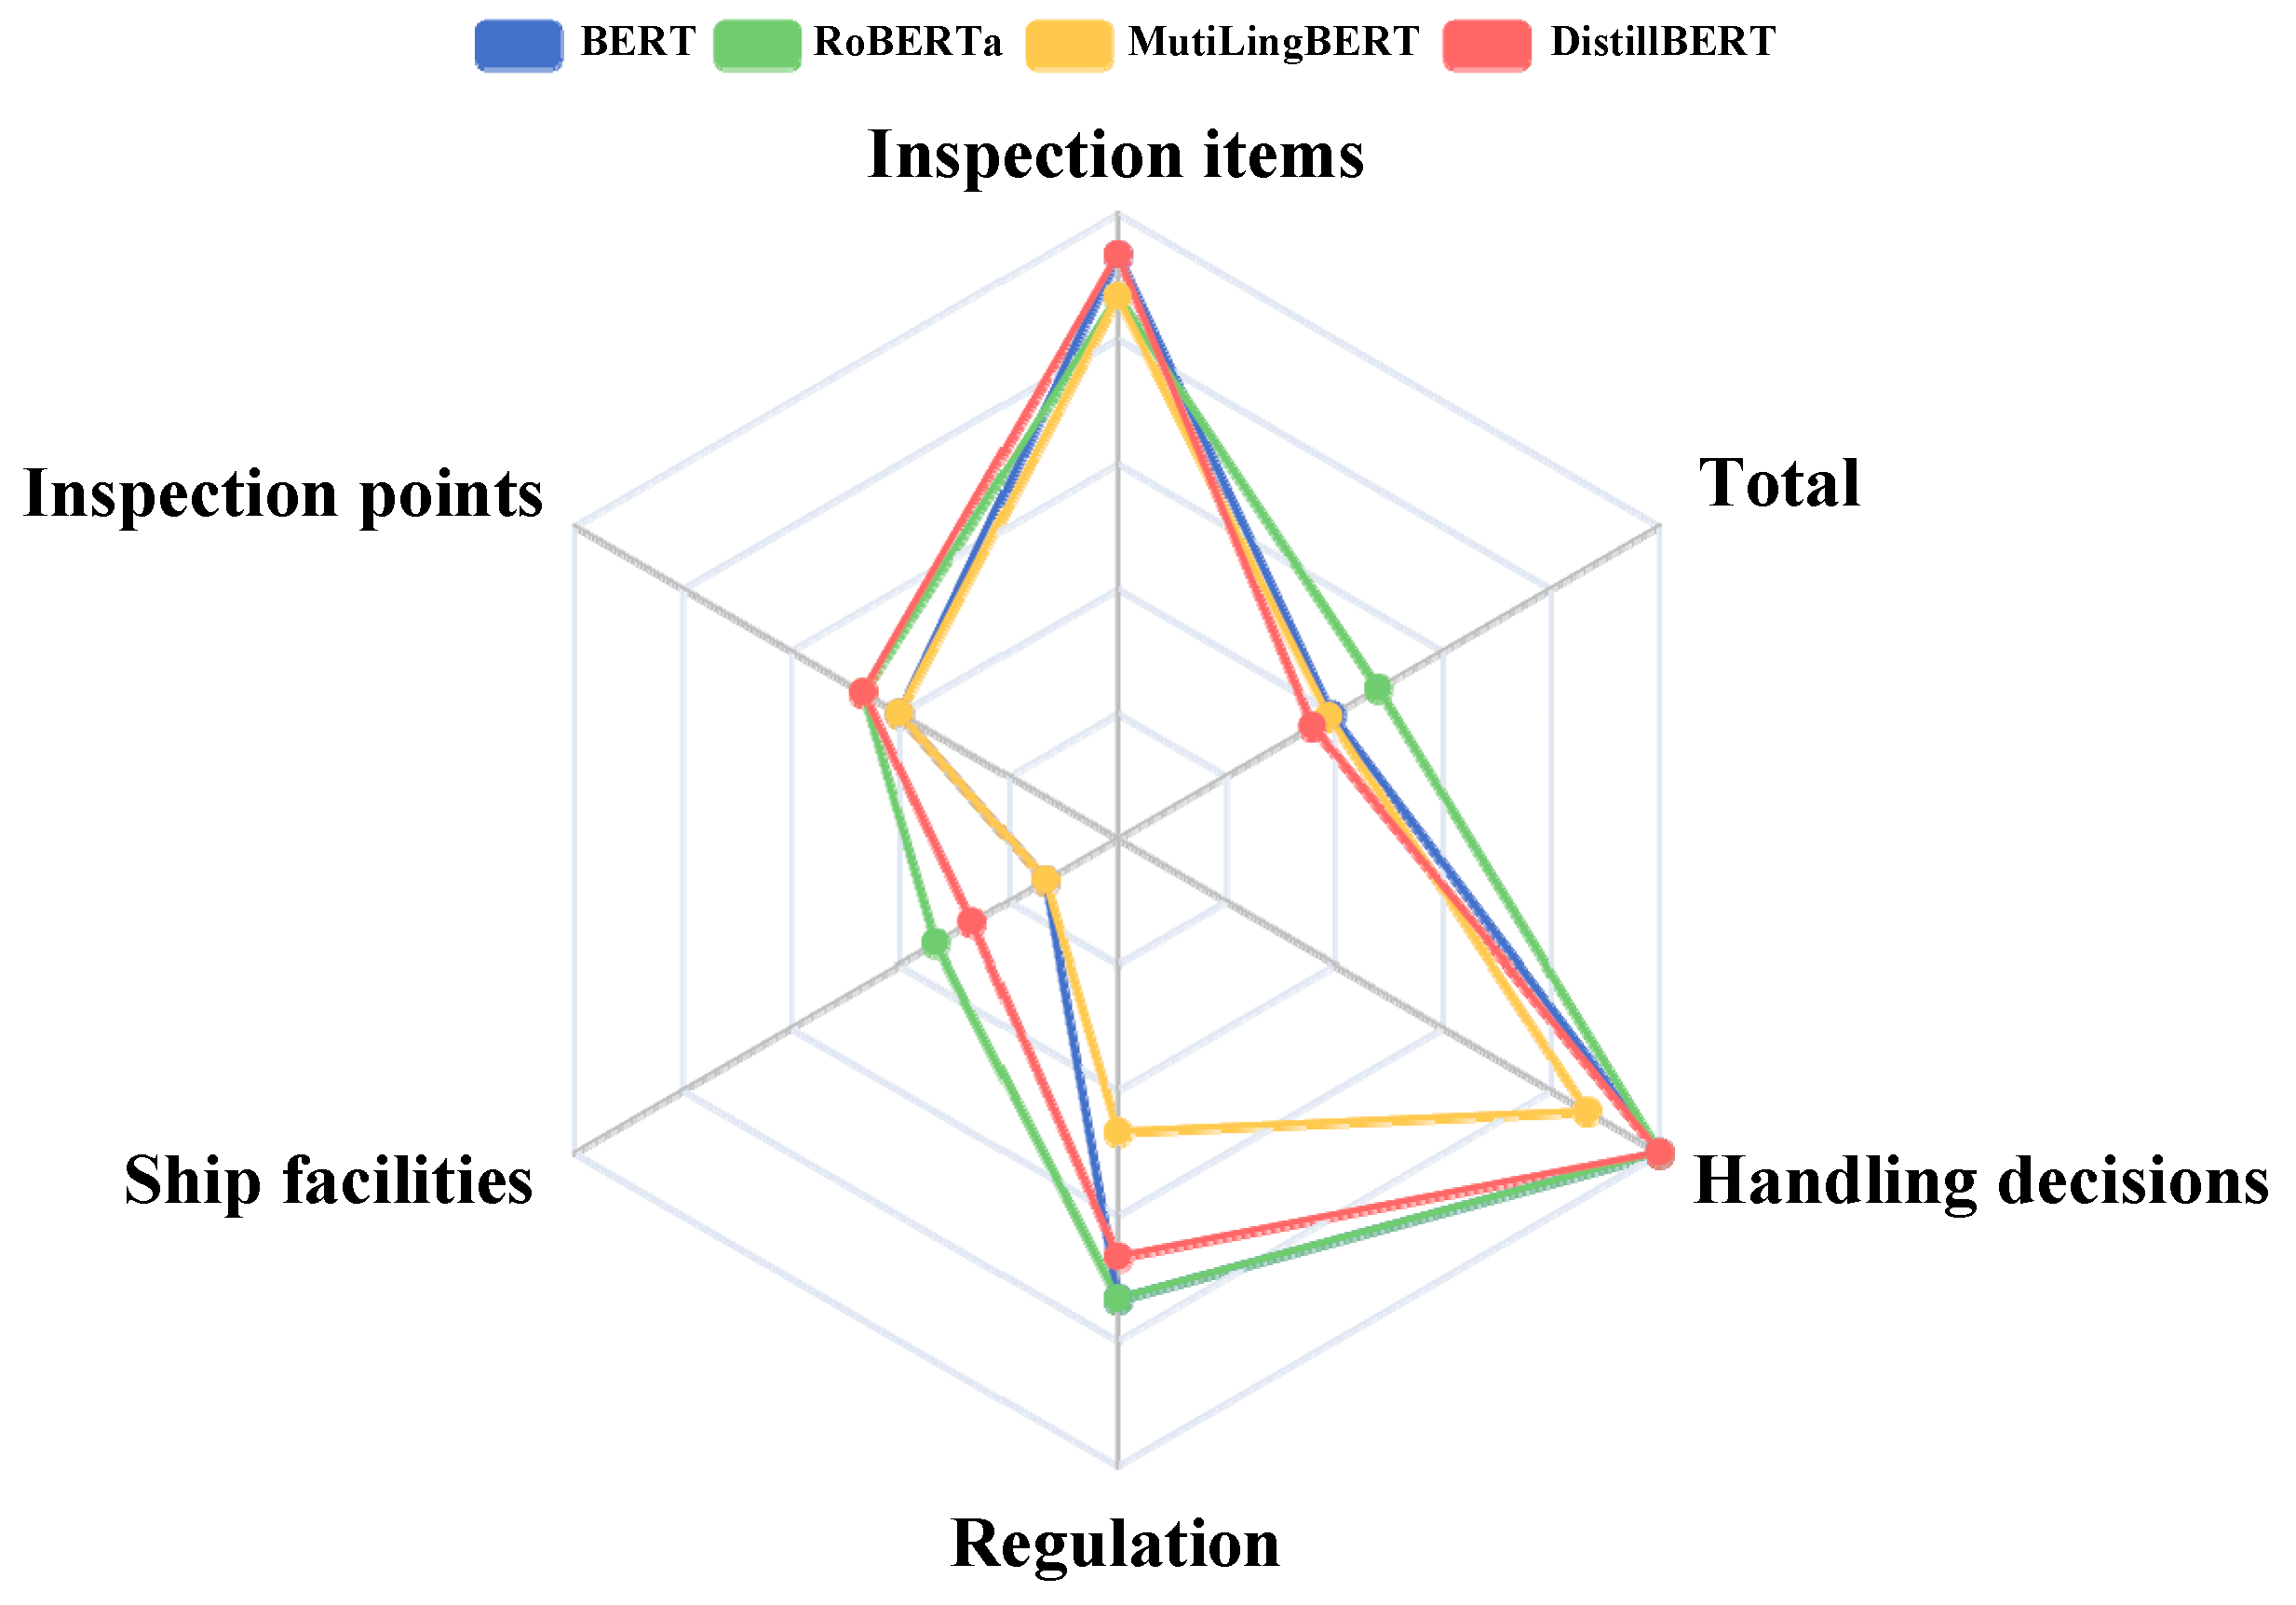
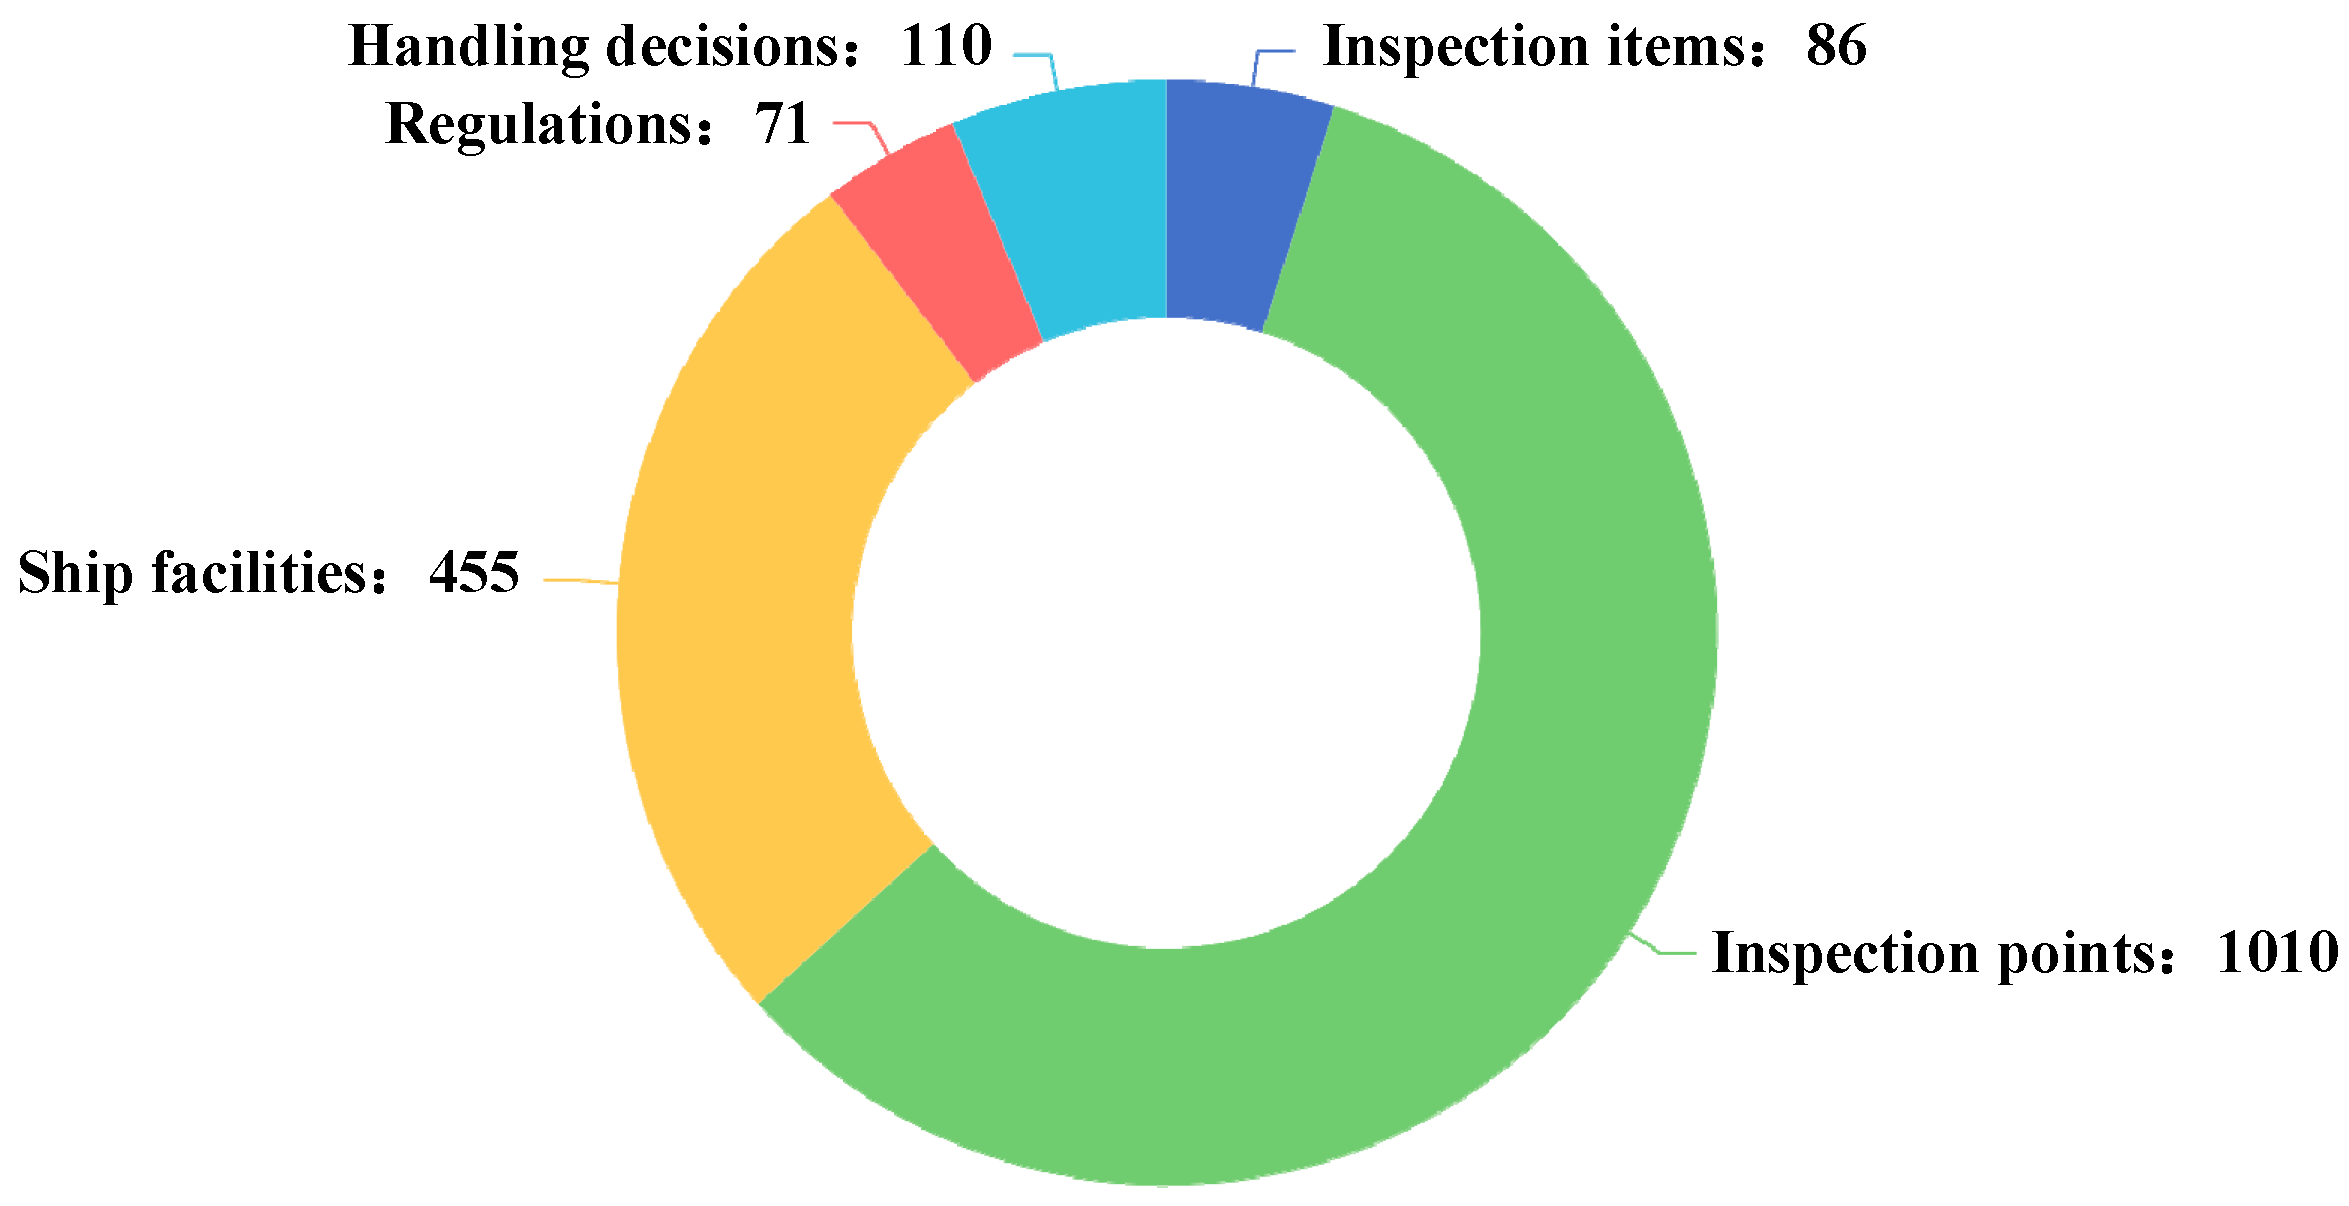
To compare the performance of different models across various labels, a radar chart was implemented as a visualization tool to intuitively display the performance differences between the BERT, RoBERTa, and MutiLingBERT models. The label quantity and F1 score for each label in the test dataset for each model are shown in Figure 5 and Figure 6, respectively. The specific data are shown in Table 4.
The radar chart shows that the performance of the RoBERTa model is relatively balanced across the labels, particularly for the “inspection points” and “ship facilities” labels, which have significantly high scores. This result indicates that the RoBERTa model has a strong ability to handle longer and extensible entities. However, on other labels, such as “inspection items”, “handling decisions”, and “regulations”, the RoBERTa model’s scores are not outstanding, revealing certain limitations. Nevertheless, since inspection points and ship facilities include a rich set of content, the overall performance of the RoBERTa model remains the most impressive.
In contrast, the BERT model’s performance across the labels shows marked unevenness, with both strong and weak areas. Specifically, for the “inspection items”, “handling decisions”, and “regulations” labels, the BERT model’s scores surpass those of the RoBERTa model, indicating its advantage in handling short entities and common entities.
The MutiLingBERT model shows significant advantages in dealing with non-English entities, but in terms of overall performance, the difference in performance compared with that of the BERT model is not pronounced.
On the basis of the above analysis, through radar chart analysis of the performance of the BERT, RoBERTa, and MutiLingBERT models across the evaluation labels, the following conclusions are drawn. The RoBERTa model excels with respect to the “inspection points” and “ship facilities” labels, indicating its strengths in handling complex and extensible entities, and despite being less impressive on other labels, its overall effect is still significant. The BERT model has stronger capabilities with respect to the “inspection items”, “handling decisions”, and “regulations” labels and particularly excels in handling short and common entities, outperforming the RoBERTa model. The MutiLingBERT model stands out in handling English entities, with an overall performance comparable to that of the BERT model. These results reveal the applicability and limitations of different models in various application scenarios.
Similarly, the radar chart also shows that the DistillBERT model, which undergoes distillation, performs relatively well across the labels, also performing well in terms of the “inspection points” and “ship facilities” labels, with high scores observed. This finding indicates that the DistillBERT model also has strong capabilities in handling longer and expandable entities. Although it scores lower for “inspection items”, “handling decisions”, and “regulations”, showing some limitations, the overall effectiveness of the DistillBERT model is still commendable because of the importance of “inspection points” and “ship facilities”.
Further observation reveals that the DistillBERT model, which undergoes dynamic multilayer knowledge distillation learning, performs evenly across all labels, proving that the distillation process successfully inherits the strengths of the larger model across different labels in the smaller model.
Within the domain of Port State Control inspections, model precision is of paramount importance, as even subtle differences in the F1 metric can have cascading effects, potentially resulting in irremediable safety risks. It is imperative that the model employed for PSC inspections exhibits high levels of accuracy and reliability across all labeled dimensions to avoid any form of performance bias. The integration of a student model that has been trained to embody the respective strengths of multiple teacher models confers a competitive edge for ensuring comprehensive and effective inspection outcomes. This approach guarantees a balanced and nuanced assessment, which is critical for ensuring the integrity of PSC inspection protocols.
For example, during the PSC inspection process, inspectors utilize model outcomes to efficiently review the fire extinguishing system in LNG cargo holds. The model highlights critical nodes such as the fire extinguishing agent storage tanks, control valves, sensors, and nozzles, which are essential components for the system’s operation. With the model, inspectors can conduct targeted examinations of these nodes to ensure they are functioning properly. The model also elucidates the relationships between the sensor’s detection of a fire signal, the transmission of information to the control valve, and the control valve’s response to release the extinguishing agent, aiding inspectors in comprehensively understanding the system’s workflow. Furthermore, the model presents a logical chain, for instance, in cases where the sensor fails to detect a fire signal or the control valve is unable to activate due to a malfunction. Inspectors can swiftly identify these potential fault points. This approach enables inspectors to promptly detect deficiencies in the fire extinguishing system within LNG cargo holds, thereby ensuring the safety of the vessel.

4.2. Comparison of Distillation Model Discrepancies

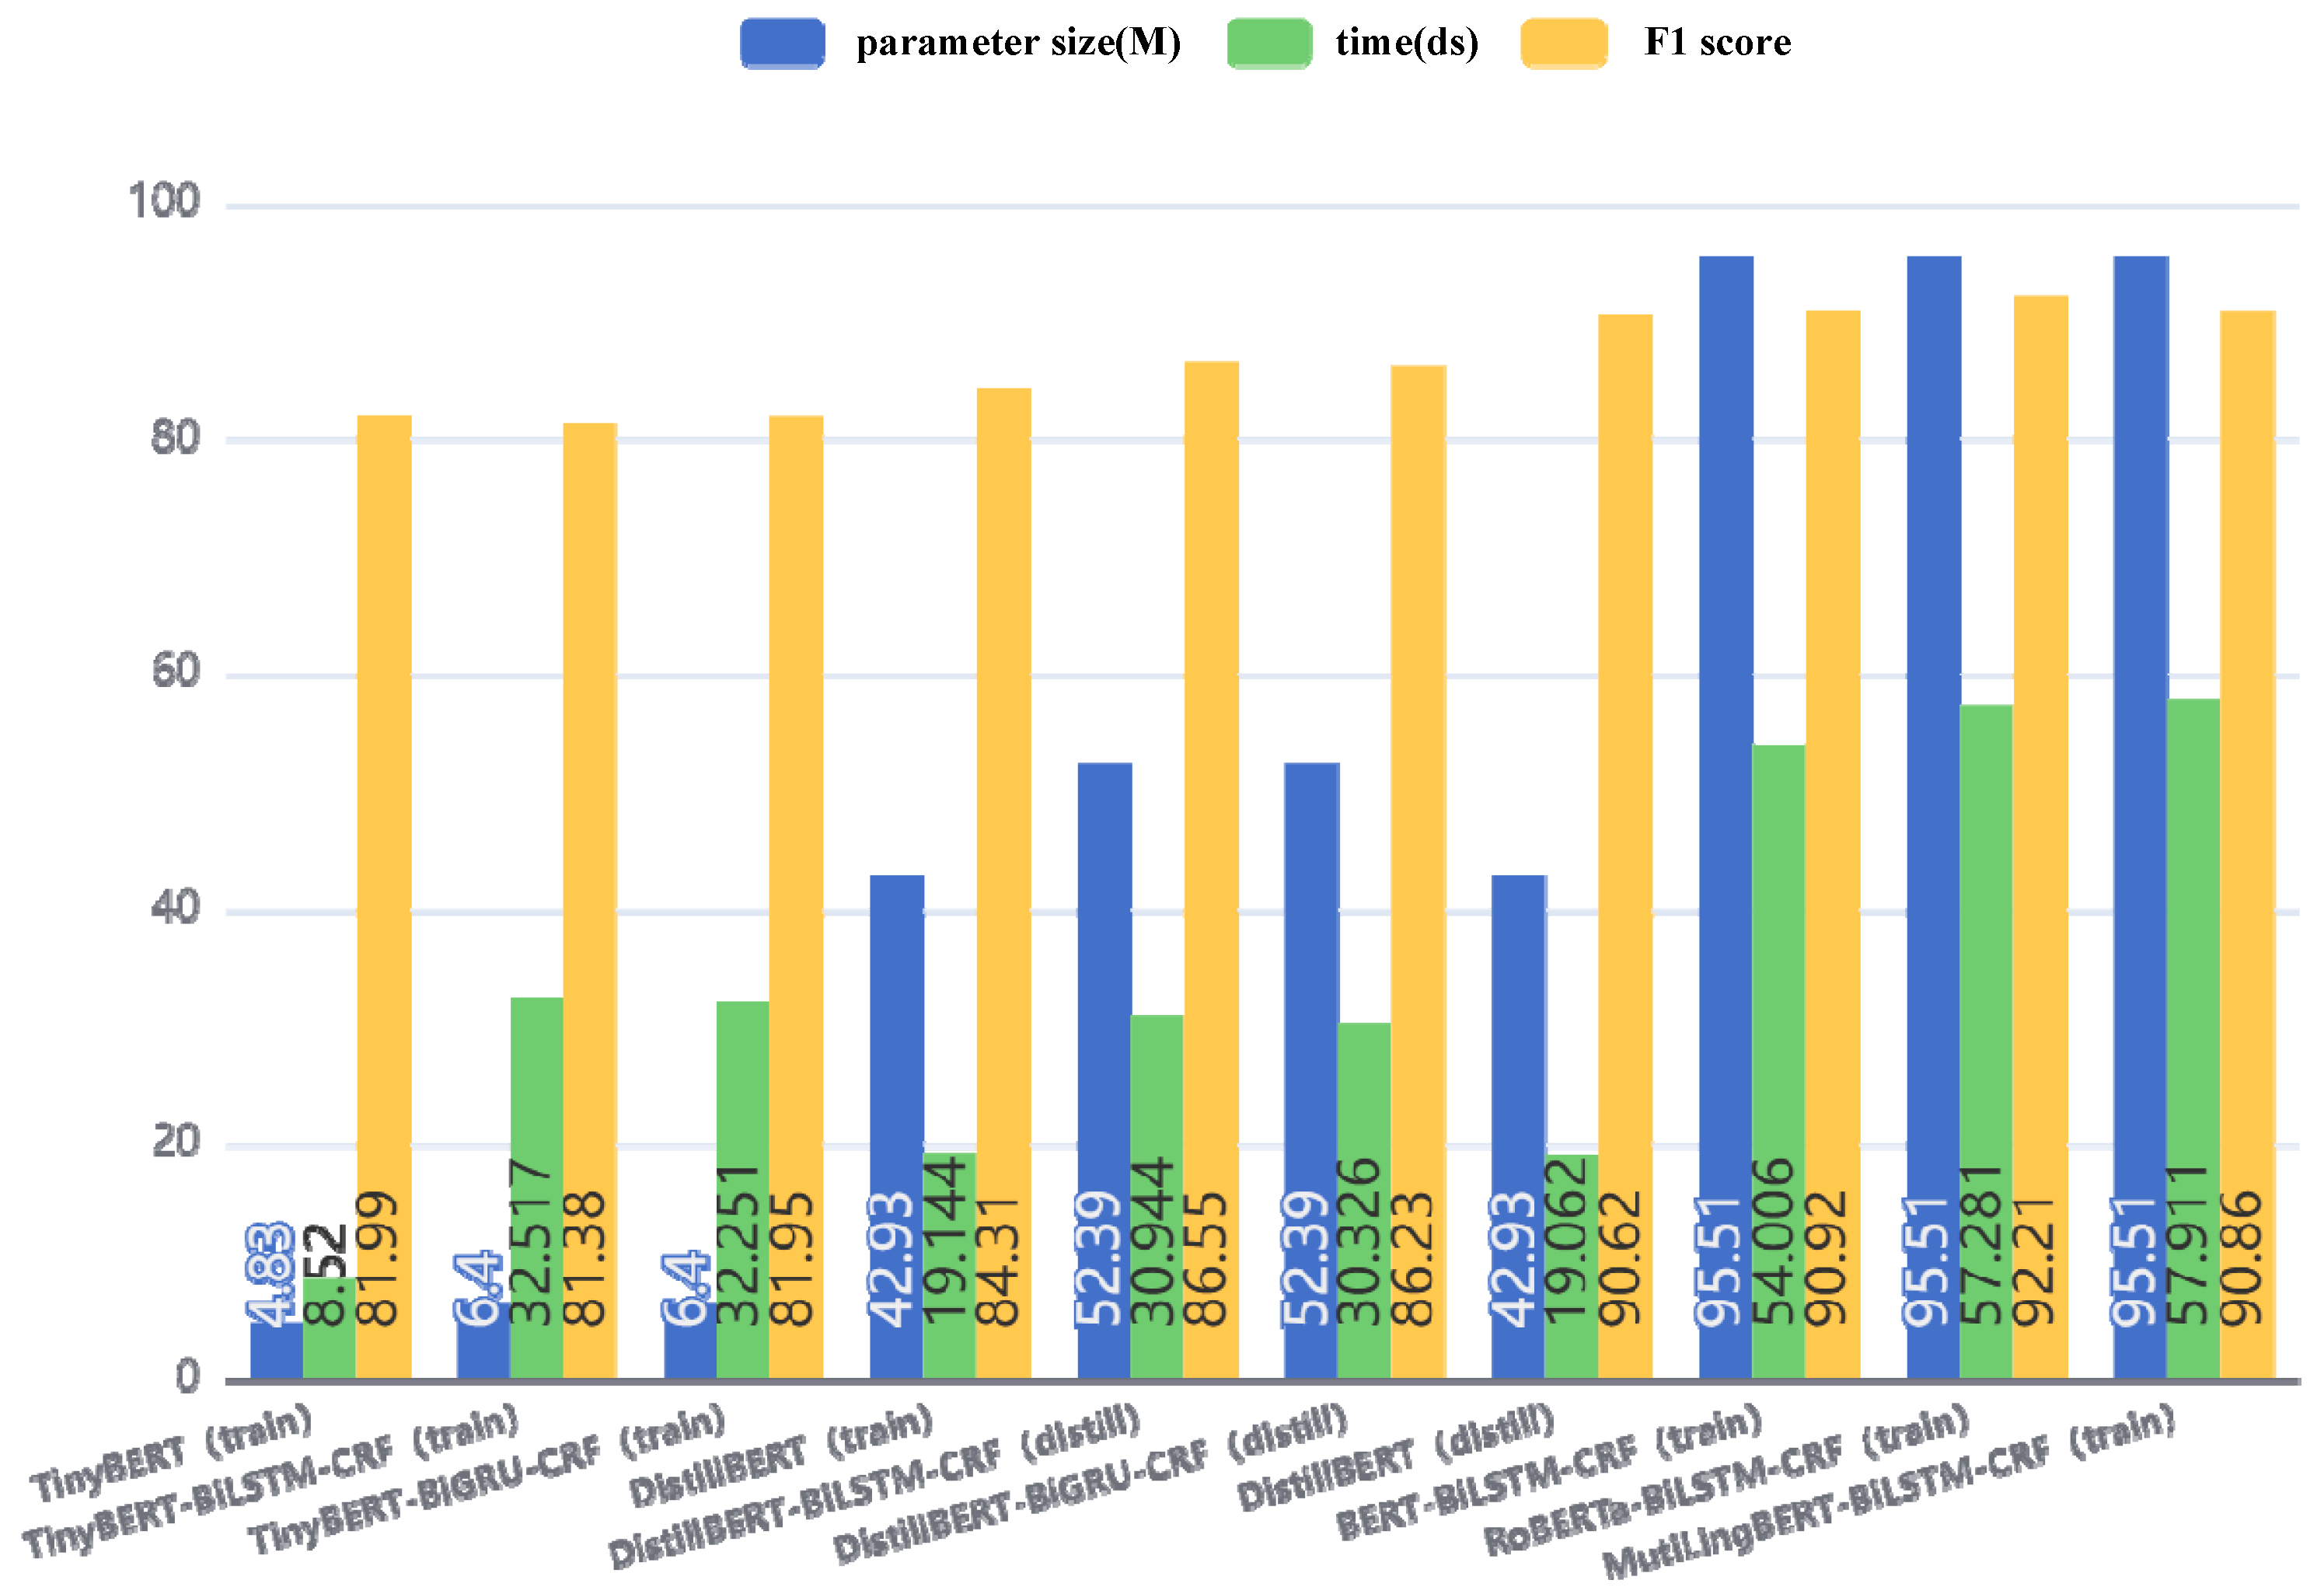
The model distillation was explored via a meticulous comparison of various carefully designed distillation models, including TinyBERT, TinyBERT-BiLSTM-CRF, and TinyBERT-BiGRU-CRF, as well as DistillBERT, DistillBERT-BiGRU-CRF, and DistillBERT-BiLSTM-CRF. In the process of identifying the most suitable distillation model, three core dimensions were comprehensively considered: the model’s parameter scale, the required training duration, and the model’s accuracy. The specific data are shown in Table 5.
Specifically, the TinyBERT model achieves an F1 score of 82.39. As a lightweight transformer model based on BERT, TinyBERT is recognized for its compactness and speed while achieving a performance similar to that of BERT but with a significantly reduced number of parameters. By preserving BERT’s preprocessing layer, the BERT model was utilized to encode the input text, thus outputting data rich in semantic information. TinyBERT achieves extreme parameter reduction and has the fastest training speed among all the candidate models. However, the accuracy of TinyBERT is not satisfactory, suggesting that while miniaturized models offer clear advantages in deployment efficiency and computational resource consumption, these benefits often come at the cost of model performance.
Next, the TinyBERT-BiLSTM-CRF model, which has a larger parameter scale than the DistillBERT model and requires approximately twice the training time, was examined. Despite the increased model complexity of TinyBERT-BiLSTM-CRF, its F1 score is only 85.87, which is significantly lower than that of DistillBERT. This phenomenon indicates that, at the same parameter scale, DistillBERT is more effective at retaining the knowledge of the original model.
Attention was then turned to the TinyBERT-BiGRU-CRF model, which has a reduced parameter scale compared with that of TinyBERT-BiLSTM-CRF and a similar training time. However, TinyBERT-BiGRU failed to meet expectations in terms of critical accuracy, with an F1 score of 85.36, which did not surpass that of DistillBERT.
Finally, the DistillBERT model does not overly increase in terms of the parameter scale and has a relatively short training time. Most importantly, it demonstrates exceptional performance in terms of accuracy, with an F1 score as high as 90.6214, which is significantly higher than those of both TinyBERT-BiLSTM-CRF and TinyBERT-BiGRU-CRF. This result fully illustrates that DistillBERT successfully retains the essence of the original model’s performance while maintaining a moderate model size.
Additionally, the models that combine DistillBERT with BiLSTM and BiGRU, were investigated. These models achieve F1 scores of 89.21 and 88.90, respectively. Although these two models yield slightly lower F1 scores than the standalone DistillBERT model does, they still exhibit high accuracy.
In summary, under the same experimental conditions, when a distillation model was selected, the DistillBERT model achieved the best balance among the parameter scale, training duration, and accuracy. While TinyBERT is small and fast, its insufficient accuracy makes it unsuitable for scenarios with high-performance requirements. Although TinyBERT-BiLSTM-CRF and TinyBERT-BiGRU-CRF, as well as DistillBERT-BiLSTM-CRF and DistillBERT-BiGRU-CRF, increase in terms of parameter scale and time, their improvement in accuracy is not significant. Therefore, after weighing the efficiency and performance of the models, it was ultimately decided to adopt DistillBERT as the preferred distillation model.

4.3. Sensitivity Analysis of the Distillation Model Hyperparameters

In KD, the temperature parameter plays a core role. This parameter is responsible for adjusting the smoothness of the soft labels (i.e., the softmax probability distribution) output by the teacher model [10]. In the calculation of knowledge distillation loss, the outputs of both the teacher and student models need to be adjusted in terms of the temperature value. A higher temperature increases the smoothness of the outputs, causing the model to exhibit greater uncertainty in predictions. This adjustment is beneficial for the student model to learn a broader range of information from the teacher model. Typically, when the temperature value exceeds 1, the distribution of soft labels becomes smoother, aiding the learning process of the student model. Conversely, when the temperature approaches 0, the soft labels tend toward hard labels (i.e., one-hot encoding), which reduces the amount of information the student model can learn.
Another critical hyperparameter is hard_label_weight, which represents the weight of the true labels (hard labels) in the total loss function. This weight determines the relative importance between the loss from true labels and the soft label loss provided by the teacher model when training the student model. When the hard_label_weight is low, the student model relies more on the teacher model’s output; when it is high, the student model relies more on the actual training labels.
Similarly, kd_loss_weight is also an important hyperparameter that determines the weight of the soft label loss from the teacher model’s output in the total loss function. The higher the kd_loss_weight is, the more the student model depends on the teacher model output during training. There is a ratio relationship between kd_loss_weight and hard_label_weight, and together, they determine the relative emphasis the student model places on the soft labels from the teacher model and the true labels during training.
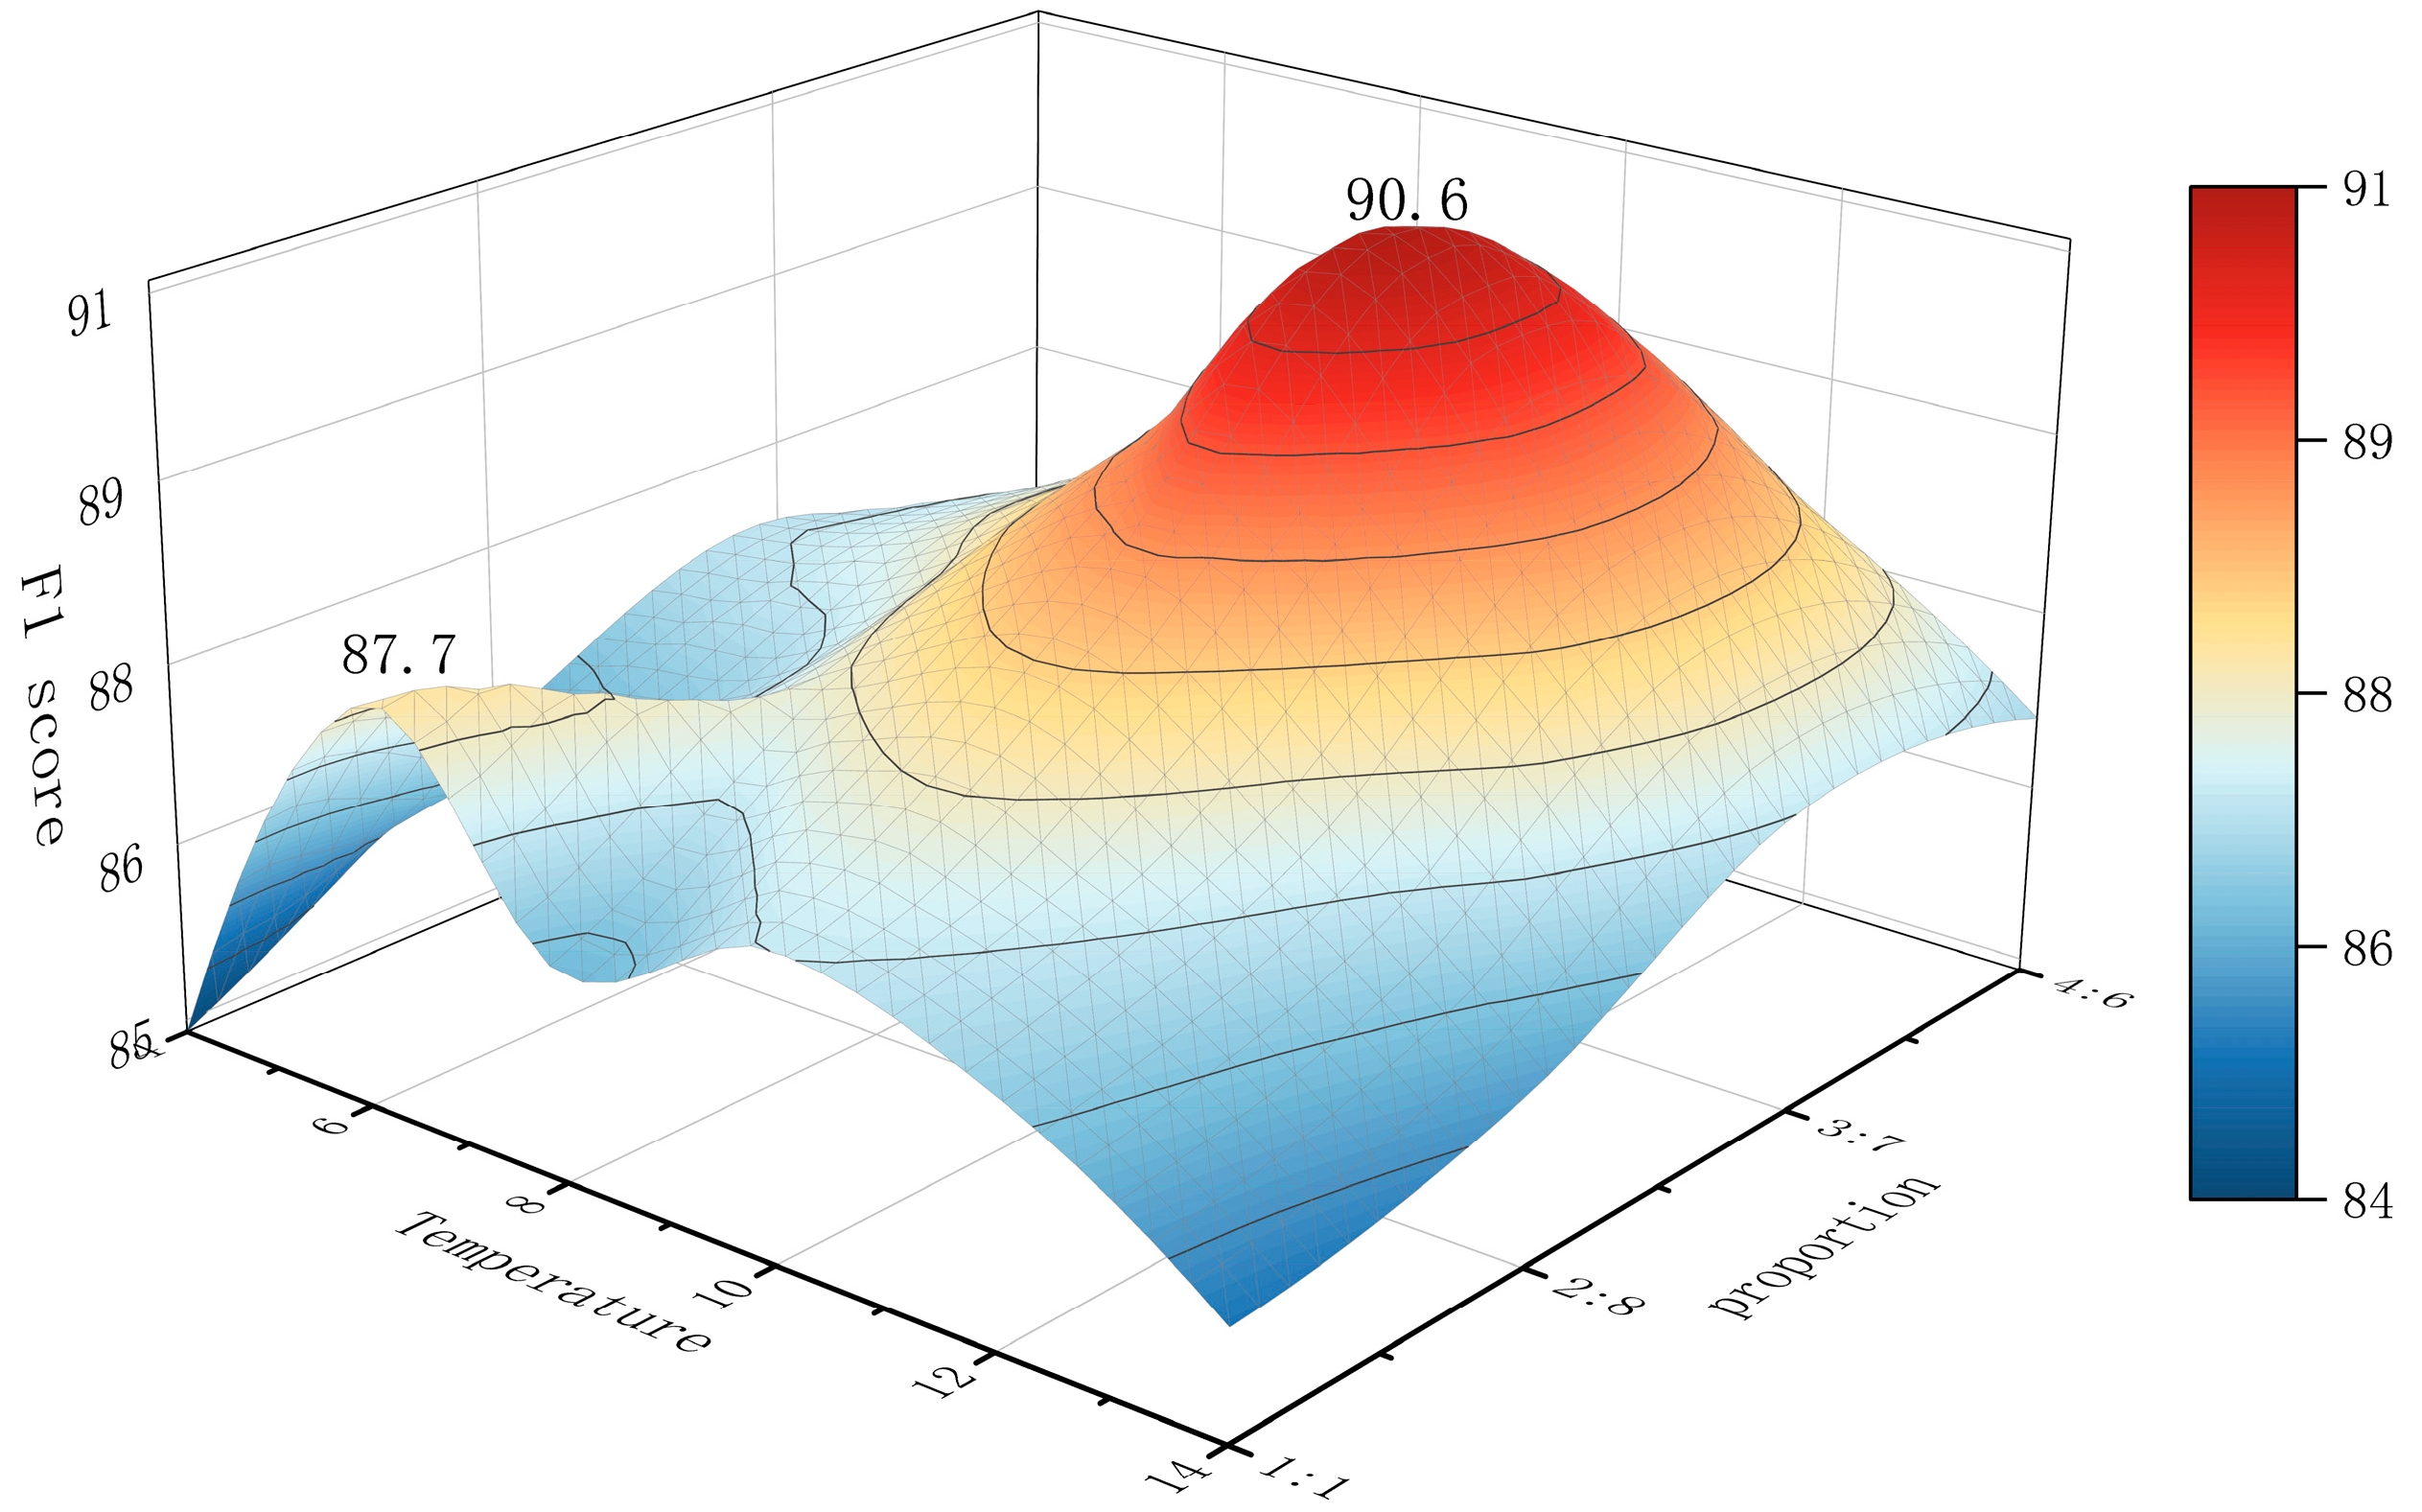
As shown in Figure 7, the following trends can be observed: as the temperature increases, the F1 score clearly first increases but then decreases. Specifically, as the temperature parameter gradually increases from a lower value, the F1 score steadily increases until it reaches its peak at a temperature of 10, indicating that the student model achieves optimal performance at this temperature. Beyond this point, the F1 score begins to decline, suggesting that too high a temperature may lead to a decrease in model performance.
Similarly, for the ratio parameter (the ratio of hard_label_weight to kd_loss_weight), the F1 score shows a similar pattern. As the ratio parameter increases from a lower value, the F1 score gradually improves and reaches its peak at a ratio of 3:7, indicating that at this ratio, the student model achieves the best learning effect by combining hard and soft label information. When the ratio parameter is further increased, the F1 score starts to decrease, suggesting that a higher ratio may not be beneficial for improving model performance.
Notably, when the temperature parameter is set to 6, and the ratio is 1:1, the F1 score reaches 87.7 and does not follow the usual pattern of increasing or decreasing. This phenomenon may indicate that the experimental results have reached a local optimal state. Under this specific configuration, the model may have found the optimal solution for a particular dataset or task environment. This case suggests that there may be multiple locally optimal combinations of parameters in the KD process. Therefore, it cannot be ruled out that other locally optimal parameter configurations may appear in other datasets or different experimental settings, emphasizing the need to consider a variety of factors and finely tune and validate parameters when optimizing models.
In conclusion, through precise adjustment of the temperature and ratio parameters in the KD process, the performance of the student model can be effectively improved. Specifically, when the temperature parameter is set to 10, and the ratio parameter is set to 3:7, the model exhibits the best performance, with an F1 score of 90.6. Therefore, in practical applications, these two parameters should be adjusted according to the specific scenario to achieve the optimal model performance.

5. Conclusions

In PSC inspections of LNG carriers, the comprehensive application of complex regulatory knowledge presents a challenge. This study introduces an MDMD model. This model involves first selecting the teacher-student model and then, while fusing the knowledge from multiple layers of soft labels in the multi-teacher model, dynamically allocating the weights among the multiple teachers. The experimental results indicate that the DistillBERT model trained with a KD approach outperforms the directly trained DistillBERT model by 6.3 percentage points in terms of the F1 score, with a prediction speed increase of approximately 64% compared with those of the traditional BERT-BiLSTM-CRF, RoBERTa-BiLSTM-CRF, and MutiLingBERT-BiLSTM-CRF models and a reduction in model parameters of approximately 55% compared with those of conventional models. Thus, this model achieves an optimized balance between efficiency and performance.
Through sensitivity analysis of hyperparameters, we determined the impacts of temperature and scaling parameters on model performance. The model exhibited optimal performance when the temperature parameter was set to 10, and the scaling parameter was 3:7, providing a basis for parameter tuning in practical applications.
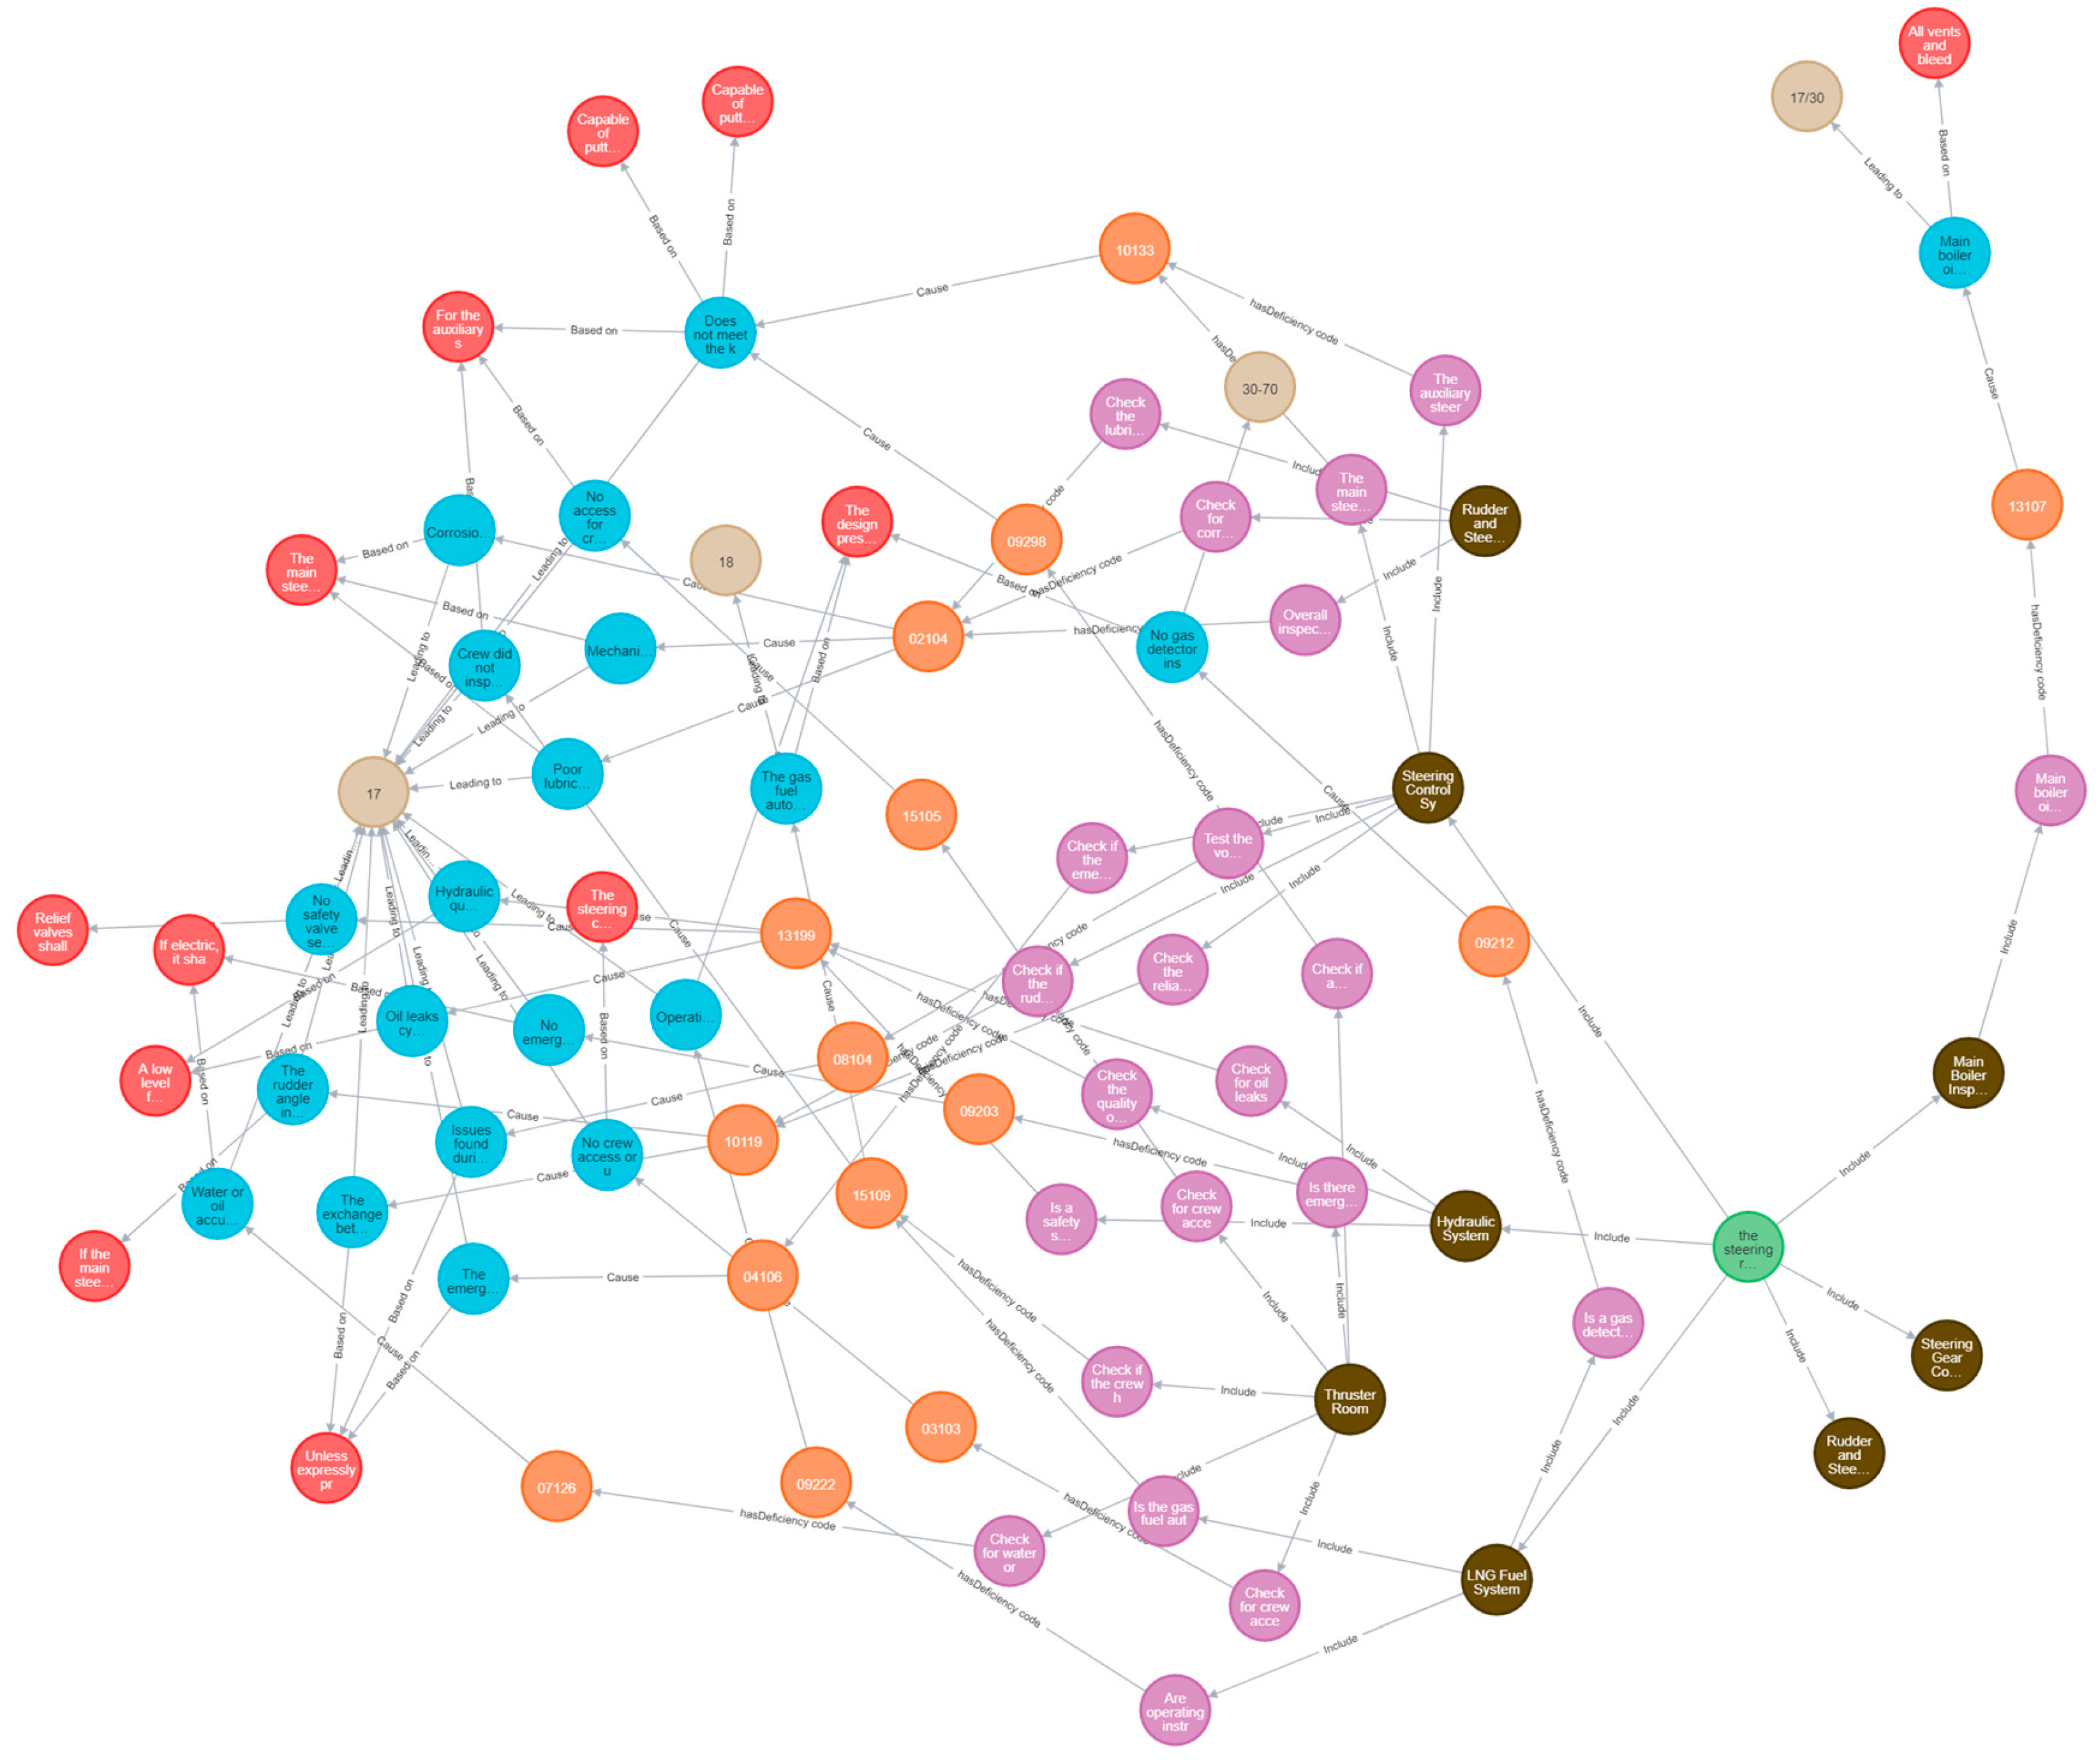
By constructing a knowledge graph, we can assist PSC inspectors in efficient information retrieval and decision-making. The model extracts knowledge and constructs a graph based on LNG vessel safety management laws and regulations, which has been verified with actual inspection data, demonstrating high accuracy. The findings of this study contribute to enhancing the efficiency of PSC inspections and addressing the complex challenges of onsite inspections. Additionally, shipowners and crew members can use this to strengthen safety management and prevent accidents. We hope that this method will contribute to vessel safety management from an inspection perspective, reducing the risk of accidents.
This study has certain limitations. First, the precision of the model needs further improvement. Although the current model achieved reasonable accuracy and stability, further optimization is needed. Second, there is a need to expand the sources of regulatory knowledge. This study relies heavily on data sourced from Chinese regulatory frameworks, limiting its generalizability to global PSC inspections. The current study is primarily based on Chinese laws and regulations. Future studies should incorporate more international regulations and conventions, with the aim of exploring new ways to prevent accidents through PSC inspections and providing strategic recommendations for the management of the shipping industry. Given the impending adoption of the IMO MASS Code, subsequent studies should consider incorporating PSC procedures for autonomous ships into knowledge graphs. Given the high-stakes nature of PSC inspections, explainability mechanisms should be explored to ensure regulatory transparency. The paper does not address the dynamic evolution of maritime regulations. The current knowledge graph relies on fixed versions of international conventions and historical Chinese inspection cases. However, maritime rules are frequently revised in practice due to technological advancements or lessons from accidents. A static knowledge graph would struggle to adapt to additions, deletions, or modifications of regulatory clauses, risking conflicts between the system’s outputs and the latest legal requirements.
The research outcomes offer tangible benefits for maritime companies and crew members alike. From a corporate perspective, the model enhances PSC inspection readiness, thereby minimizing operational delays and financial losses attributable to inspection failures. The AI-driven deficiency prediction capability can optimize maintenance schedules and bolster the operational reliability of LNG carriers. Furthermore, the data-driven insights derived from PSC inspection records can be leveraged to refine vessel management policies and improve compliance with international regulations.
For the crew, the knowledge graph serves as a user-friendly resource for visualizing inspection criteria, thereby mitigating workload and improving on-site safety. The capability to preemptively identify irregularities in critical systems, such as cargo handling, gas detection, and fire suppression, substantially augments risk mitigation efforts. Additionally, by simplifying the comprehension of complex maritime regulations, the knowledge graph empowers seafarers with the requisite knowledge to respond to inspection requirements more effectively.
These practical advantages collectively enhance PSC inspection preparedness and contribute to the overarching goal of safer and more efficient LNG carrier operations. The fusion of domain-specific knowledge with advanced AI techniques provides a solid foundation for further research and development.

Author Contributions

Conceptualization, C.L. and L.G.; Methodology, C.L., Q.Y. and Q.M.; Software, Q.Y. and Q.M.; Validation, C.L., Q.M. and Y.X.; Formal analysis, Q.Y. and Y.X.; Investigation, C.L. and L.G.; Resources, L.G. and Y.X.; Data curation, L.G.; Writing—original draft preparation, C.L. and Q.Y.; Writing—review and editing, C.L. and Q.Y.; Visualization, C.L. and Q.M.; Supervision, L.G., Q.M. and Y.X.; Project administration, C.L. and L.G.; Funding acquisition, C.L. All authors have read and agreed to the published version of the manuscript.

Funding

This study is funded by the National Natural Science Foundation of China (NSFC) through Grant No. 52271369.

Institutional Review Board Statement

Not applicable.

Informed Consent Statement

Not applicable.

Data Availability Statement

The data presented in this study are available on request from the corresponding author. The data are not publicly available due to the data in this study involving the privacy restrictions of the maritime authorities.

Conflicts of Interest

The authors declare no conflicts of interest.

References

  1. Peng, P.; Lu, F.; Cheng, S.; Yang, Y. Mapping the global liquefied natural gas trade network: A perspective of maritime transportation. J. Clean. Prod. 2021, 283, 124640. [Google Scholar]
  2. Peng, Y.; Zhao, X.; Zuo, T.; Wang, W.; Song, X. A systematic literature review on port LNG bunkering station. Transp. Res. Part D Transp. Environ. 2021, 91, 102704. [Google Scholar]
  3. Xiao, Y.; Wang, G.; Lin, K.-C.; Qi, G.; Li, K.X. The effectiveness of the new inspection regime for port state control: Application of the Tokyo MoU. Mar. Policy 2020, 115, 103857. [Google Scholar]
  4. Yuan, C.-C.; Chiu, R.-H.; Cai, C. Important factors influencing the implementation of independent Port State Control regimes. J. Mar. Sci. Eng. 2020, 8, 641. [Google Scholar] [CrossRef]
  5. Fan, L.; Zheng, L.; Luo, M. Effectiveness of port state control inspection using Bayesian network modelling. Marit. Policy Manag. 2022, 49, 261–278. [Google Scholar]
  6. Şanlıer, Ş. Analysis of port state control inspection data: The Black Sea Region. Mar. Policy 2020, 112, 103757. [Google Scholar]
  7. Emecen Kara, E.G.; Okşaş, O.; Kara, G. The similarity analysis of Port State Control regimes based on the performance of flag states. Proc. Inst. Mech. Eng. Part M J. Eng. Marit. Environ. 2020, 234, 558–572. [Google Scholar]
  8. Yan, R.; Wang, S.; Peng, C. An artificial intelligence model considering data imbalance for ship selection in port state control based on detention probabilities. J. Comput. Sci. 2021, 48, 101257. [Google Scholar]
  9. Wang, Y.; Qian, S.; Hu, J.; Fang, Q.; Xu, C. Fake news detection via knowledge-driven multimodal graph convolutional networks. In Proceedings of the 2020 International Conference on Multimedia Retrieval, Dublin, Ireland, 8–11 June 2020. [Google Scholar]
  10. Yang, Z.; Wan, C.; Yang, Z.; Yu, Q. Using Bayesian network-based TOPSIS to aid dynamic port state control detention risk control decision. Reliab. Eng. Syst. Saf. 2021, 213, 107784. [Google Scholar]
  11. Demirci, S.M.E.; Cicek, K. Intelligent ship inspection analytics: Ship deficiency data mining for port state control. Ocean Eng. 2023, 278, 114232. [Google Scholar]
  12. Shu, Y.; Cui, H.; Song, L.; Gan, L.; Xu, S.; Wu, J.; Zheng, C. Influence of sea ice on ship routes and speed along the Arctic Northeast Passage. Ocean Coast. Manag. 2024, 256, 107320. [Google Scholar] [CrossRef]
  13. Liu, J.; Jiang, X.; Huang, W.; He, Y.; Yang, Z. A novel approach for navigational safety evaluation of inland waterway ships under uncertain environment. Transp. Saf. Environ. 2022, 4, tdab029. [Google Scholar] [CrossRef]
  14. Chen, X.; Chen, W.; Wu, B.; Wu, H.; Xian, J. Ship visual trajectory exploitation via an ensemble instance segmentation framework. Ocean. Eng. 2024, 313, 119368. [Google Scholar] [CrossRef]
  15. Hogan, A.; Blomqvist, E.; Cochez, M.; d’Amato, C.; Melo, G.D.; Gutierrez, C.; Kirrane, S.; Gayo, J.E.L.; Navigli, R.; Neumaier, S.; et al. Knowledge graphs. ACM Comput. Surv. 2021, 54, 1–37. [Google Scholar] [CrossRef]
  16. Ji, S.; Pan, S.; Cambria, E.; Marttinen, P.; Yu, P.S. A survey on knowledge graphs: Representation, acquisition, and applications. IEEE Trans. Neural Netw. Learn. Syst. 2021, 33, 494–514. [Google Scholar] [CrossRef]
  17. Chen, X.; Jia, S.; Xiang, Y. A review: Knowledge reasoning over knowledge graph. Expert Syst. Appl. 2020, 141, 112948. [Google Scholar] [CrossRef]
  18. Zareian, A.; Karaman, S.; Chang, S.-F. Bridging knowledge graphs to generate scene graphs. In Proceedings of the Computer Vision–ECCV 2020: 16th European Conference, Glasgow, UK, 23–28 August 2020. [Google Scholar]
  19. Liu, C.; Zhang, X.; Xu, Y.; Xiang, B.; Gan, L.; Shu, Y. Knowledge graph for maritime pollution regulations based on deep learning methods. Ocean Coast. Manag. 2023, 242, 106679. [Google Scholar] [CrossRef]
  20. Gan, L.; Chen, Q.; Zhang, D.; Zhang, X.; Zhang, L.; Liu, C.; Shu, Y. Construction of Knowledge Graph for Flag State Control (FSC) Inspection for Ships: A Case Study from China. J. Mar. Sci. Eng. 2022, 10, 1352. [Google Scholar] [CrossRef]
  21. Gan, L.; Ye, B.; Huang, Z.; Xu, Y.; Chen, Q.; Shu, Y. Knowledge graph construction based on ship collision accident reports to improve maritime traffic safety. Ocean Coast. Manag. 2023, 240, 106660. [Google Scholar] [CrossRef]
  22. Gan, L.; Gao, Z.; Zhang, X.; Xu, Y.; Liu, R.W.; Xie, C.; Shu, Y. Graph neural networks enabled accident causation prediction for maritime vessel traffic. Reliab. Eng. Syst. Saf. 2025, 257, 110804. [Google Scholar] [CrossRef]
  23. Zhang, X.; Liu, C.; Xu, Y.; Ye, B.; Gan, L.; Shu, Y. A knowledge graph-based inspection items recommendation method for port state control inspection of LNG carriers. Ocean. Eng. 2024, 313, 119434. [Google Scholar] [CrossRef]
  24. Liu, C.; Wang, Q.; Xiang, B.; Xu, Y.; Gan, L. Evolutionary Game Strategy Research on PSC Inspection Based on Knowledge Graphs. J. Mar. Sci. Eng. 2024, 12, 1449. [Google Scholar] [CrossRef]
  25. Peng, C.; Xia, F.; Naseriparsa, M.; Osborne, F. Knowledge graphs: Opportunities and challenges. Artif. Intell. Rev. 2023, 56, 13071–13102. [Google Scholar] [CrossRef] [PubMed]
  26. Gou, J.; Yu, B.; Maybank, S.J.; Tao, D. Knowledge distillation: A survey. Int. J. Comput. Vis. 2021, 129, 1789–1819. [Google Scholar] [CrossRef]
  27. Tian, Y.; Krishnan, D.; Isola, P. Contrastive representation distillation. arXiv 2019, arXiv:191010699. [Google Scholar]
  28. Chen, D.; Mei, J.P.; Wang, C.; Feng, Y.; Chen, C. Online knowledge distillation with diverse peers. In Proceedings of the AAAI Conference on Artificial Intelligence, New York, NY, USA, 7–12 February 2020. [Google Scholar]
  29. Goldblum, M.; Fowl, L.; Feizi, S.; Goldstein, T. Adversarially robust distillation. In Proceedings of the AAAI Conference on Artificial Intelligence, New York, NY, USA, 7–12 February 2020. [Google Scholar]
  30. Tang, J.; Shivanna, R.; Zhao, Z.; Lin, D.; Singh, A.; Chi, E.H.; Jain, S. Understanding and improving knowledge distillation. arXiv 2020, arXiv:200203532. [Google Scholar]
  31. Cheng, X.; Rao, Z.; Chen, Y.; Zhang, Q. Explaining knowledge distillation by quantifying the knowledge. In Proceedings of the IEEE/CVF Conference On Computer Vision and Pattern Recognition, Seattle, WA, USA, 13–19 June 2020. [Google Scholar]
  32. Xu, G.; Liu, Z.; Li, X.; Loy, C.C. Knowledge distillation meets self-supervision. In Proceedings of the European Conference on Computer Vision, Glasgow, UK, August 23–28, 2020. Springer: Cham, Switzerland, 2020. [Google Scholar]
  33. Allen-Zhu, Z.; Li, Y. Towards understanding ensemble, knowledge distillation and self-distillation in deep learning. arXiv 2020, arXiv:201209816. [Google Scholar]
  34. Zhang, L.; Ma, K. Improve object detection with feature-based knowledge distillation: Towards accurate and efficient detectors. In Proceedings of the International Conference on Learning Representations, Addis Ababa, Ethiopia, 30 April 2020. [Google Scholar]
  35. Zhao, B.; Cui, Q.; Song, R.; Qiu, Y.; Liang, J. Decoupled knowledge distillation. In Proceedings of the IEEE/CVF Conference on Computer Vision and Pattern Recognition, New Orleans, LA, USA, 18–24 June 2022. [Google Scholar]
  36. Yang, Z.; Cui, Y.; Chen, Z.; Che, W.; Liu, T.; Wang, S.; Hu, G. TextBrewer: An Open-Source Knowledge Distillation Toolkit for Natural Language Processing. In Proceedings of the 58th Annual Meeting of the Association for Computational Linguistics: System Demonstrations, online, 5–10 June 2020; pp. 9–16. [Google Scholar]
  37. Zhang, L.; Bao, C.; Ma, K. Self-distillation: Towards efficient and compact neural networks. IEEE Trans. Pattern Anal. Mach. Intell. 2021, 44, 4388–4403. [Google Scholar] [CrossRef]
  38. Romero, A.; Ballas, N.; Kahou, S.E.; Chassang, A.; Gatta, C.; Bengio, Y. Fitnets: Hints for thin deep nets. arXiv 2014, arXiv:14126550. [Google Scholar]
  39. Wen, T.; Lai, S.; Qian, X. Preparing lessons: Improve knowledge distillation with better supervision. Neurocomputing 2021, 454, 25–33. [Google Scholar] [CrossRef]
  40. Devlin, J.; Chang, M.W.; Lee, K.; Toutanova, K. Bert: Pre-training of deep bidirectional transformers for language understanding. In Proceedings of the 2019 Conference of the North American Chapter of the Association for Computational Linguistics: Human Language Technologies, Minneapolis, MI, USA, 2–7 June 2019. [Google Scholar]
  41. Tan, K.L.; Lee, C.P.; Anbananthen, K.S.M.; Lim, K.M. RoBERTa-LSTM: A hybrid model for sentiment analysis with transformer and recurrent neural network. IEEE Access 2022, 10, 21517–21525. [Google Scholar] [CrossRef]
  42. An, Y.; Xia, X.; Chen, X.; Wu, F.X.; Wang, J. Chinese clinical named entity recognition via multi-head self-attention based BiLSTM-CRF. Artif. Intell. Med. 2022, 127, 102282. [Google Scholar] [CrossRef] [PubMed]
  43. Adoma, A.F.; Henry, N.-M.; Chen, W. Comparative analyses of bert, roberta, distilbert, and xlnet for text-based emotion recognition. In Proceedings of the 2020 17th International Computer Conference on Wavelet Active Media Technology and Information Processing (ICCWAMTIP), Chengdu, China, 18–20 December 2020. [Google Scholar]
Figure 1. Multilayer soft label knowledge fusion.
Jmse 13 00426 g001
Figure 2. Architecture of the proposed knowledge distillation model.
Jmse 13 00426 g002
Figure 3. Result for different models.
Jmse 13 00426 g003
Figure 4. F1 Storage of the results with a triple in Neo4j (partial).
Jmse 13 00426 g004
Figure 5. F1 score for different labels in the test dataset.
Jmse 13 00426 g005
Figure 6. Quantity for different labels in the test dataset.
Jmse 13 00426 g006
Figure 7. Result for hyperparameter sensitivity in distillation models.
Jmse 13 00426 g007
Table 1. Regulations contained in the dataset.
Regulations from ChinaRegulations from IMO
Maritime Traffic Safety Law of the People’s Republic of ChinaSTCW Convention, Part A, Chapter V
Marine Environmental Protection Law of the People’s Republic of ChinaIGC Code, Chapter 18
Ports Law of the People’s Republic of ChinaIGC Code, Chapter 2
Inland River Traffic Safety Management Regulations of the People’s Republic of ChinaISM Code, Chapter 7
Ship Crew Regulations of the People’s Republic of ChinaISM Code, Chapter 13
Regulations on Safety Supervision and Management of Dangerous Goods Carried by ShipsSOLAS Convention, Regulation II-2/19.4
Waterborne Transport Regulations for Dangerous GoodsSOLAS Convention, Regulation IV/18.2
Marine Environmental Protection Law of the People’s Republic of China (repeated)SOLAS Convention, Regulation I/12
Table 2. Teacher parameter setting for the experiment.
Parameter TypeNumber
Embedding matrix(Max_len,768)
Batch size16
Training epoch100
Learning rate1 × 10−5
Deep learning frameworkPyTorch 2.1.0
Table 3. Student parameter settings for the experiment.
Parameter TypeNumber
Batch size16
Training epoch100
Temperature10
Hard_label_weight0.3
Kd_loss_weight0.7
Table 4. F 1 score and quantity for different labels in the test dataset.
ModelLabel
Regulations (71)Handling Decisions (110)Inspection Points (1010)Inspection Items (86)Ship Facilities (455)Total (1732)
BERT9610091998791
RoBERTa9610092989092
MutiLingBERT929891988791
DistillBERT9510092998990
Table 5. Results for different distilled models.
ModelF1 Score
TinyBERT (distill)82.39
TinyBERT-BiLSTM-CRF (distill)85.87
TinyBERT-BiGRU-CRF (distill)85.36
DistillBERT (distill)90.62
DistillBERT-BiLSTM-CRF (distill)89.21
DistillBERT-BiGRU-CRF (distill)88.90
Disclaimer/Publisher’s Note: The statements, opinions and data contained in all publications are solely those of the individual author(s) and contributor(s) and not of MDPI and/or the editor(s). MDPI and/or the editor(s) disclaim responsibility for any injury to people or property resulting from any ideas, methods, instructions or products referred to in the content.

