Abstract
This study presents a comprehensive, data-driven analysis of the causes and risks associated with container loss during maritime transport, utilizing incident data from 2011 to 2023. By employing advanced statistical analysis, machine-learning techniques, and data preprocessing, the study identifies key factors influencing container loss, including vessel size, incident locations, and primary causes. A predictive model based on decision trees was developed to assess the severity of container loss incidents, while K-means clustering was used to classify incident zones. Adverse weather conditions were found to be the predominant cause, accounting for 57.14% of incidents. The study reveals that larger vessels, despite experiencing fewer incidents, face more severe losses, whereas smaller vessels are more prone to frequent but less severe losses. The decision-tree model demonstrated high accuracy in predicting low-risk incidents but showed limitations in moderate- and high-risk scenarios. The findings underscore the importance of understanding the correlation between vessel parameters and incident outcomes to enhance risk management strategies. The study also highlights the potential for improving predictive capabilities by incorporating environmental data. These insights provide a robust framework for ship owners and maritime authorities to anticipate and mitigate risks, emphasizing the need for continuous monitoring and enhanced safety measures in maritime operations.
1. Introduction
The increasing volume of global maritime trade has led to a significant rise in container transport, with millions of containers being shipped across the world’s oceans each year. However, the loss of containers at sea remains a critical challenge, posing severe economic, environmental, and navigational risks. Container loss incidents not only result in substantial financial damage for shipping companies and cargo owners but also contribute to extensive marine pollution and hazards for maritime traffic [1]. Lost containers can float for extended periods, creating collision risks for other vessels, while those that sink release pollutants disrupt marine ecosystems, and contribute to the growing problem of underwater debris. Several high-profile container loss incidents highlight the severity of this issue. The MOL COMFORT disaster (2013) resulted in the loss of 4293 containers after structural failure in rough seas, as shown in Figure 1. The ONE APUS incident (2020) led to the loss of over 1800 containers due to adverse weather conditions. More recently, in July 2024, a CMA CGM vessel lost 44 containers due to rough sea conditions, reinforcing the persistent threat posed by extreme weather events. The frequency and scale of such incidents demonstrate the urgent need for comprehensive risk assessment and preventive strategies.
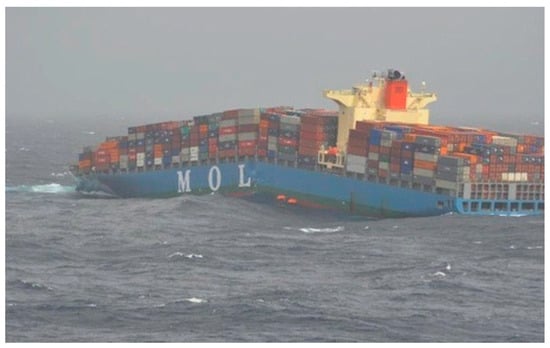
Figure 1.
MOL COMFORT incident (https://gcaptain.com/mol-comfort-incident-photos/ accessed on 10 October 2024).
Beyond the economic losses, the environmental impact of lost containers is alarming. Many containers carry hazardous or plastic-based materials that, when submerged or broken open, release toxins into the marine environment, threatening marine biodiversity. The International Maritime Organization (IMO) and the Marine Environment Protection Committee (MEPC) have recognized this growing issue and proposed measures to mitigate marine pollution caused by lost containers [2,3]. Regulatory amendments, such as MSC 108, have been introduced to establish clearer reporting and recovery responsibilities for shipowners and operators. However, effective enforcement and the development of predictive risk models remain key challenges.
To address these issues, this study employs a data-driven approach to analyze the causes and risk factors associated with container loss incidents, utilizing historical data from 2011 to 2023 [4]. Through advanced statistical analysis, machine-learning techniques, and clustering algorithms, this research aims to identify critical variables influencing container loss, such as vessel size, incident locations, and prevailing environmental conditions. By integrating decision-tree-based predictive modeling and K-means clustering, the study seeks to enhance risk assessment capabilities, enabling shipowners, regulators, and insurers to implement more effective safety measures and loss prevention strategies. Given that adverse weather conditions account for 57.14% of container loss incidents, there is a pressing need to incorporate real-time environmental data into maritime risk assessment frameworks. This study not only highlights the correlation between vessel characteristics and incident severity but also underscores the potential for AI-driven predictive analytics to mitigate container loss risks.
The findings aim to support the development of enhanced cargo-securing protocols, real-time monitoring solutions and updated maritime safety regulations to minimize future incidents. By leveraging machine learning and statistical methodologies, this research contributes to the ongoing efforts to improve maritime safety, protect marine ecosystems, and reduce economic losses associated with container loss incidents. Future work will focus on integrating real-time vessel tracking and environmental monitoring systems to further refine predictive models and develop proactive risk mitigation strategies.
Various studies have been conducted on container accident analysis, risk assessment, and data mining.
Recent related studies focus on enhancing maritime navigation safety and ship trajectory analysis using advanced computational techniques. Liu et al. [5] propose a novel approach for evaluating the navigational safety of inland waterway ships under uncertain conditions, while Chen et al. [6] develop an ensemble instance segmentation framework to improve ship visual trajectory exploitation, contributing to more accurate vessel tracking and situational awareness in ocean environments.
Yeun et al. [7] analyze accident risks in container terminals using a Risk Assessment Matrix (RAM) to systematically evaluate accident frequency and severity. The primary objective is to classify accident types based on operational areas within container terminals and to assess their relative risk levels. By applying quantitative risk assessment techniques, the study aims to propose a structured approach to improving safety measures in terminal operations. The study directly applies to container terminal safety improvements, offering actionable recommendations for reducing accidents. The use of the Risk Assessment Matrix (RAM) helps prioritize safety investments, ensuring cost-effective accident prevention. However, future research should integrate technological advancements, conduct cost-benefit analyses of safety interventions, and expand geographic comparisons to validate the findings across different container terminals. Additionally, addressing climate-related risks would provide a more comprehensive safety framework for the future of containerized freight transportation. Overall, this study serves as an essential reference for container terminal safety management, offering a structured risk evaluation model that can help reduce accidents, improve efficiency, and enhance maritime safety.
Lee [8] makes a valuable contribution to freight transportation risk management by systematically categorizing physical risks and analyzing their impact on cargo security, operational efficiency, and supply chain stability. It offers practical recommendations for minimizing freight damage through better handling, improved cargo-securing, and enhanced monitoring systems. The findings are directly applicable to shipping companies, freight forwarders, and insurers, helping them develop better cargo handling protocols. By identifying major causes of cargo damage, the study helps reduce financial losses associated with freight damage. It highlights best practices that can enhance operational efficiency and cargo security. However, further research is needed to incorporate modern risk mitigation technologies, financial impact assessments, and policy frameworks. By addressing these gaps, future studies can provide a more comprehensive approach to reducing freight transportation risks in an evolving global trade landscape. Overall, this study serves as an important reference for logistics professionals, policymakers, and researchers seeking to improve cargo safety and risk management strategies in global freight transportation.
Kim et al. [9] analyze the accident factors associated with steel cargo handling in ports, which accounts for the highest accident rate (26.3%) among all bulk cargo types. The research aims to identify key safety factors, prioritize them using the Fuzzy Analytical Hierarchy Process (Fuzzy-AHP), and propose measures to enhance port safety. The study quantifies qualitative safety factors, providing a structured, hierarchical prioritization of risks. Ensures that safety concerns reflect real-world experience rather than theoretical assumptions. The study does not analyze the cost-effectiveness of implementing safety improvements. The study prioritizes accident factors but does not propose specific prevention mechanisms. Future research should explore design improvements, cargo-securing technologies, and real-time risk alerts. This research lays a strong foundation for safety prioritization in bulk cargo handling, but future studies should integrate real-world accident analysis, automation solutions, and regulatory frameworks to enhance its practical application.
Jo [10] examines the growing problem of marine plastic pollution caused by lost shipping containers and highlights the urgent need for international policies and regulations to mitigate its environmental impact. The research directly addresses an emerging environmental crisis, aligning with global discussions on marine plastic pollution. It effectively links lost containers to plastic waste and highlights their role in long-term marine pollution. The study not only proposes regulatory changes but also suggests technological improvements, including tracking systems, retrieval strategies, and ship stability enhancements. The study does not include quantitative field data on the actual impact of container loss on microplastic pollution. Future research should analyze contamination levels in affected marine areas. The study focuses on IMO-level solutions but does not explore regional or national initiatives that could be more immediately implementable. The study’s main contribution lies in its detailed policy recommendations, including mandatory container loss reporting, tracking system integration, and retrieval incentives. However, further empirical research is needed to quantify the pollution impact, and a cost-benefit analysis would enhance the practical feasibility of proposed solutions.
Chang et al. [11] evaluate the risks associated with Maritime Autonomous Surface Ships (MASS) and aim to quantify the risk levels of major hazards. The research employs Failure Modes and Effects Analysis (FMEA) combined with Evidential Reasoning (ER) and a Rule-Based Bayesian Network (RBN) to assess the hazards. Unlike many previous studies that assume autonomous systems eliminate human error, this research highlights that software design and programming decisions introduce new types of human error. This insight is crucial for improving the safety and reliability of AI-based ship operations. The findings can be used by ship designers, operators, and regulators to improve safety measures before MASS is widely deployed. The study relies on expert opinions and literature reviews rather than real operational data from autonomous ships. Future research should validate the model using case studies or real-world MASS trial data. MASS implementation involves high initial costs for new infrastructure, training, and cybersecurity. The study does not compare these costs against the expected benefits (e.g., reduced labor costs, lower accident rates, environmental gains).
Hwang [12] investigates the causes and responses to container loss accidents during ship voyages, emphasizing the environmental and operational impacts of such incidents. The study provides detailed case studies of major container loss accidents, making it a valuable resource for maritime safety professionals. It effectively identifies common patterns and contributing factors in container loss accidents. The study acknowledges the marine pollution risks posed by lost containers and stresses the importance of strengthening recovery efforts. While the study references existing reports, it does not present statistical analysis or trend modeling of container loss over time. Future research should incorporate data analytics to predict high-risk scenarios. While the study discusses storm-related container loss, it does not analyze how climate change is increasing extreme weather events, which may heighten container loss risks in the future. Overall, this study is a valuable contribution to maritime safety research, advocating for enhanced regulatory compliance, improved ship design, and stronger cargo-securing measures to reduce container loss incidents and their environmental impact.
Oterkus et al. [13] investigate the structural integrity of shipping containers lost at sea using the Finite Element Method (FEM), with a focus on their ability to withstand hydrostatic pressure at varying depths. The analysis demonstrates that standard ISO containers fail structurally even at shallow depths due to excessive hydrostatic pressure. At depths beyond 50 m, container deformation becomes catastrophic, leading to rapid failure. Given that an estimated 1382 containers are lost at sea annually, understanding their structural behavior is crucial for marine safety, environmental impact assessment, and cargo security. The findings confirm that conventional containers cannot withstand deep-sea conditions, posing risks of structural failure, cargo loss, and environmental damage. By introducing a thicker-walled container design, the research offers a practical engineering solution that could reduce container failures and mitigate marine hazards. Overall, this research significantly advances the understanding of container integrity at sea, providing actionable insights for maritime engineers, regulators, and policymakers. Its findings emphasize the importance of improving container designs to enhance safety, prevent cargo spills, and minimize long-term environmental impacts in oceanic environments.
Kim and Shin [14] investigate the causes of marine accidents related to the weight of container cargo and examine potential solutions to mitigate such risks. The research highlights that overloaded or misreported container weights contribute significantly to structural failures, cargo loss, and vessel instability, leading to serious maritime accidents. The study reviews accident case studies and emphasizes the importance of the Verified Gross Mass (VGM) system, implemented under the International Convention for the Safety of Life at Sea (SOLAS), as a regulatory measure to improve cargo weight verification and enhance maritime safety. Through an analysis of historical container loss incidents, including the Deneb, MSC Napoli, MV Limari, and P&O Nedlloyd Genoa cases, the research demonstrates how inaccurate cargo weight declarations and improper stowage practices have led to container collapses, vessel instability, and even ship capsizing. The study proposes improving weight verification procedures, strengthening regulations, and enhancing industry-wide compliance with the VGM system to reduce maritime accidents caused by overweight containers.
Park [15] examines the importance of cargo-securing in containerized transportation and the need for legal and institutional improvements to enhance maritime safety. While containerization has significantly improved transport efficiency, improper cargo-securing within containers has become a leading cause of marine accidents, cargo damage, and financial losses. The study analyzes current domestic and international regulations on cargo-securing and highlights regulatory gaps that fail to address containerized cargo stability adequately. The study does not include quantitative data on the frequency of cargo-securing failures in different ports or shipping lines. Future research should incorporate statistical data on non-compliance rates and accident trends. The research mainly focuses on South Korean regulations, with limited comparison to global best practices. A more in-depth analysis of European, U.S., and IMO standards would provide stronger policy recommendations. By reviewing case studies of past cargo-related accidents, including the 2014 Sewol ferry disaster, the study argues that better enforcement of cargo-securing regulations is essential to prevent accidents, improve liability assessment, and reduce economic losses in global shipping operations.
NMSCS (National Marine Sanctuaries Conservation Series) [16] provides critical insights into the long-term ecological effects of lost shipping containers in deep-sea environments, highlighting their potential role as artificial hard substrates and stepping stones for species migration. By documenting species succession and faunal community changes over 17 years, the study contributes valuable data to marine conservation and policy discussions regarding container loss and its environmental implications. The study provides one of the longest time-series analyses of a lost shipping container in the deep sea, offering rare and valuable ecological insights. However, further research is needed to address some of the study’s limitations, particularly in understanding chemical pollution, large-scale ecosystem impacts, and container degradation rates. Future studies should also explore replicated cases in different marine environments to assess whether similar ecological patterns emerge across multiple lost containers. Overall, this study is a significant contribution to deep-sea ecology and marine policy discussions, emphasizing the need for improved container tracking, recovery strategies, and long-term environmental monitoring of lost cargo.
Orkun Burak Öztürk [17] investigates the causes and risks associated with container loss at sea, a growing concern due to its financial, operational, and environmental implications. The study develops a Fuzzy Bayesian Network (FBN) model to assess the risk of container loss and identify key contributing factors. The study estimates that 1629 containers are lost at sea annually, with a significant increase in recent years. The study highlights that container losses are highly correlated with the ship’s stability and the effectiveness of lashing and securing processes. While the FBN model provides a strong theoretical framework, the study does not incorporate real-world case studies to validate its accuracy. The model primarily focuses on human and operational factors but does not extensively assess the impact of extreme weather events or dynamic sea conditions. This study is valuable as a benchmark for risk assessment methodologies but leaves room for further innovation through technological and regulatory advancements.
Nicolás Molina-Padrón et al. [18] investigate the increasing issue of container losses in maritime transport, which pose significant risks to marine ecosystems, navigational safety, and supply chain efficiency. Given that an estimated 1566 containers are lost at sea annually, the research highlights the urgent need for technological solutions to track and monitor these lost containers in real time. The study systematically evaluates existing detection and surveillance methods, including radar, sonar, thermal imaging, and communication-based tracking systems, with the ultimate goal of proposing a global container monitoring network. However, practical implementation, cost feasibility, and real-world validation remain open challenges that need to be addressed in future research. By incorporating empirical testing, cost-benefit analysis, and AI-based tracking enhancements, this study could serve as a foundational reference for the development of a truly effective global surveillance system for lost containers at sea. This study offers valuable insights into maritime safety and environmental protection but needs further empirical validation, economic analysis, and AI integration for practical deployment.
The current study makes a significant contribution to maritime risk analysis by moving beyond descriptive risk assessment methods and introducing predictive analytics, advanced data handling, and enhanced severity classification models. These improvements bridge critical gaps in prior research by:
- [1]
- Shifting from qualitative to quantitative risk modeling through machine learning.
- [2]
- Addressing missing data limitations using advanced imputation techniques.
- [3]
- Introducing a structured risk classification system that enables proactive decision-making.
These advancements position the study as a practical tool for industry stakeholders, offering a data-driven approach to reducing container loss incidents and enhancing global maritime safety protocols. Future research could further build upon this foundation by integrating real-time vessel monitoring systems and AI-driven risk prediction algorithms to develop next-generation maritime safety solutions.
2. Container Loss Incidents
This chapter provides a comprehensive examination of container loss incidents at sea, analyzing their frequency, primary causes, and long-term impacts on maritime safety and environmental sustainability. By integrating historical data and statistical evaluations, the study identifies key risk factors contributing to container loss, emphasizing the predominance of adverse weather conditions and operational deficiencies. The chapter further discusses trends in container loss, highlighting correlations between vessel characteristics, incident severity, and geographical risk zones, laying the foundation for predictive modeling and risk assessment in subsequent sections.
2.1. Frame Work
The research framework presented in Figure 2 of this study represents a systematic and structured methodology for analyzing the risks and root causes of container loss at sea. Unlike previous research, which primarily relied on descriptive statistical analyses or qualitative risk assessments, this study integrates a data-driven and predictive approach through machine learning, clustering, and advanced data preprocessing techniques. This comprehensive workflow enhances both the accuracy of risk estimation and the applicability of preventive measures.
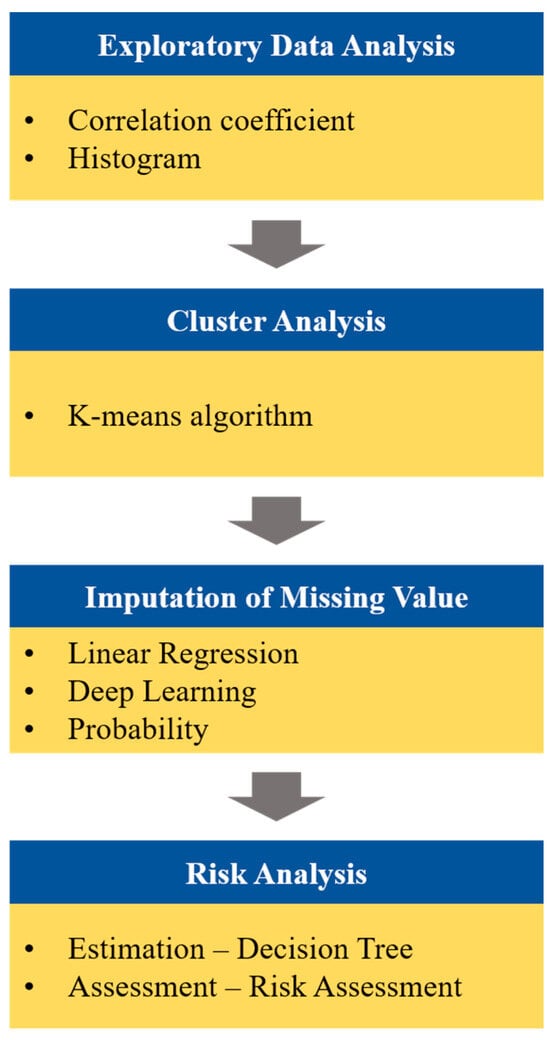
Figure 2.
Flowchart of the study.
The key distinguishing features of the flowchart, compared to prior studies, are outlined below:
- -
- Integrated Machine-Learning Framework for Predictive Risk Modeling
Prior research predominantly relied on historical accident analysis or traditional risk assessment models such as Risk Assessment Matrices (RAM) and Bayesian Networks. While these models provided insight into risk probability and severity, they lacked predictive capabilities for assessing future incidents based on real-time vessel and environmental conditions. The methodology outlined in Figure 2 distinguishes itself by implementing machine-learning algorithms, particularly decision trees, K-means clustering, and deep-learning techniques, to predict the likelihood and severity of container loss incidents. This approach offers three main advantages:
- -
- Automated classification of risk zones based on clustered incident data, allowing for better geographical risk mapping.
- -
- Predictive modeling of container loss severity using decision trees, improving risk mitigation strategies.
- -
- Handling of missing data through deep-learning imputation, which enhances data reliability and ensures a more complete dataset for analysis.
- -
- Advanced Data Preprocessing and Missing Data Handling
One of the significant challenges in maritime accident data analysis is the presence of incomplete records, particularly in environmental variables (e.g., wind speed, wave height, sea state). Traditional studies, such as those by Oterkus et al. (2022) [13] and Yeun et al. (2014) [7], often handled missing data by either removing incomplete records or using simple mean imputation techniques, which can introduce biases and reduce analytical robustness. The flowchart in Figure 2 demonstrates a more systematic and data-driven approach to handling missing values by employing:
- -
- Regression-based imputation for moderately missing ship characteristics (e.g., vessel capacity, draught).
- -
- Deep-learning estimation for parameters with nonlinear relationships, reducing data loss and improving model accuracy.
- -
- Randomized assignment for categorical variables, ensuring unbiased class distribution.
This structured data-cleaning pipeline enhances the integrity and predictive reliability of the model, addressing one of the key limitations faced by earlier studies.
- -
- Risk Classification and Assessment Through Clustered Data Analysis
Previous research efforts on container loss risk assessment, such as Hwang (2022) [12] and Kim and Shin (2022) [14], largely focused on categorical classifications of risk severity (e.g., low, medium, high). These methods, however, lacked a systematic classification framework that could identify incident patterns and trends over time. The flowchart in Figure 2 introduces a structured classification system using K-means clustering to define incident zones and categorize risk levels based on loss ratios:
- -
- Three-tier severity classification (low, moderate, high) based on damage-to-capacity ratio, allowing for more precise risk assessments.
- -
- Geospatial clustering of incidents, which helps in identifying high-risk maritime routes.
- -
- Application of risk assessment metrics to prioritize prevention efforts based on historical loss patterns.
This quantifiable risk classification system makes the study highly applicable to regulatory agencies by enabling data-driven decision-making regarding maritime safety regulations, container-securing protocols, and vessel design improvements.
2.2. Trends in Attraction
Figure 3 and Table 1 present a comprehensive analysis of container loss incidents at sea, divided into two parts: Figure 3 is the total number of containers lost annually from 2008 to 2023 and Table 1 detailed case studies of significant container loss incidents. The data are presented to highlight trends, causes, and consequences of container loss, which are critical for understanding the risks associated with maritime container and transportation. The graph in Figure 3 illustrates the annual total number of containers lost at sea from 2008 to 2023, along with a three-year moving average. The moving average smooths out short-term fluctuations and highlights long-term trends. The graph shows fluctuations in the number of containers lost annually, with notable peaks in certain years. For instance, 2013 stands out with a significant spike in container loss, primarily due to the MOL Comfort incident, where 4293 containers were lost. The three-year moving average line indicates a general upward trend from 2008 to 2013, followed by a decline and subsequent stabilization in recent years. The peaks in the graph correspond to major maritime incidents, such as the MOL Comfort (2013) and MSC Zoe (2019), which resulted in the loss of thousands of containers. These incidents underscore the vulnerability of large vessels to severe weather conditions and structural failures. The data suggests that while the frequency of container loss incidents may vary, the severity of incidents involving larger vessels can lead to significant losses. This highlights the need for enhanced risk management strategies, particularly for large container ships operating in adverse weather conditions.
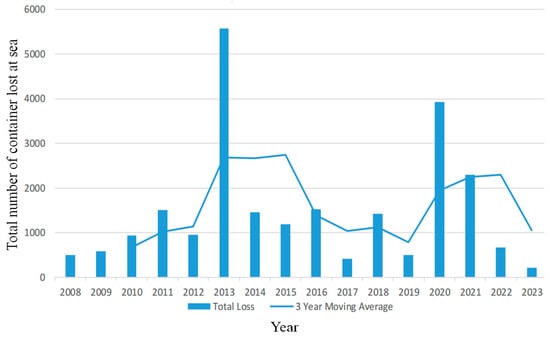
Figure 3.
Total number and detailed information about container loss at sea [3].

Table 1.
Detailed information about container loss at sea [17].
Table 1 provides a detailed account of specific container loss incidents, including the date, vessel name, and a description of the accident. This section offers insights into the causes and consequences of container loss, which are essential for developing preventive measures. The case studies reveal that adverse weather conditions, such as heavy seas and hurricanes, are the primary causes of container loss. For example, the MSC Napoli (2007) and Zim Kingston (2021) incidents were both attributed to severe weather, resulting in the loss of hazardous materials and posing environmental risks. The detailed descriptions highlight the environmental and economic consequences of container loss. Incidents such as the MSC Zoe (2019) and Dyros (2022) resulted in hazardous materials being washed ashore, causing pollution and posing risks to marine life and coastal communities. The economic impact is also significant, with losses amounting to thousands of containers and associated cargo. The case studies illustrate the operational challenges faced by shipping companies, including the difficulty of securing containers during extreme weather and the risks associated with transporting hazardous materials. These challenges necessitate improved container-securing systems, better weather forecasting, and enhanced vessel design to mitigate the risks of container loss.
Table 2 presents the correlation coefficients between various parameters related to container loss incidents at sea, derived from a dataset collected from 2011 to 2023. The dataset, comprising 158 data points, includes information on vessel characteristics, accident locations, and causes of container loss. The correlation coefficients were calculated to explore the relationships between these parameters, providing insights into the factors influencing container loss severity and frequency. The data used in this analysis were obtained from the TopTier Report [4], which comprehensively reviews incidents resulting in container loss at sea. The report, spanning pages 6 to 177, provides detailed case studies and statistical data on container loss incidents, including vessel dimensions, operational conditions, and environmental factors. This extensive dataset served as the foundation for calculating the correlation coefficients presented in Table 2. The correlation coefficient has a value between −1 and 1, which expresses the correlation between two variables. The closer the correlation coefficient is to −1, the stronger the negative correlation between the two variables, and the closer it is to 1, the stronger the positive correlation. In addition, if it is close to 0, the relationship between the two variables is considered to be non-existent.

Table 2.
Correlation coefficients between each parameter.
Strong positive correlations were observed between Capacity and vessel dimensions such as LOA (0.94), LBP (0.93), B (0.96), and Draught Max. (0.92). This indicates that larger vessels with greater length, breadth, and draught tend to have higher container capacities. The correlation between Capacity and D (0.87) is also strong, suggesting that deeper vessels are designed to carry more containers. Vs shows weak correlations with most parameters, except for a moderate positive correlation with D (0.33). This implies that vessel speed is not strongly influenced by other vessel dimensions or capacity. The correlation between Damaged and Lost Containers and other parameters is generally weak, with the highest correlation observed with LBP (0.28). This suggests that vessel dimensions alone do not strongly predict the number of containers lost or damaged during an incident. The weak negative correlation between Vs and Damaged and Lost Containers (−0.08) indicates that vessel speed has little to no direct impact on the severity of container loss incidents. The correlation analysis highlights that while vessel dimensions and capacity are closely related, they do not strongly predict the severity of container loss incidents. This underscores the importance of considering other factors, such as weather conditions, cargo-securing systems, and operational practices, in risk assessment and management. The weak correlations with Damaged and Lost Containers suggest that incident severity is influenced by a combination of factors beyond vessel size and speed, necessitating a holistic approach to maritime safety.
Figure 4 presents a series of histograms that illustrate the distribution of key vessel parameters, including Length Overall (LOA), Length Between Perpendiculars (LBP), Breadth (B), Depth (D), Built Year, and Capacity. These histograms provide a visual representation of the frequency distribution of each parameter, allowing for a comparative analysis of their ranges and central tendencies. The data used for these histograms were derived from a comprehensive dataset of container loss incidents, enabling a detailed examination of vessel characteristics and their potential impact on maritime safety. The LOA histogram (Figure 4a) shows the distribution of the total length of vessels involved in container loss incidents. The frequency distribution indicates that most vessels fall within a specific range of lengths, with a peak frequency suggesting a common vessel size category. This distribution is crucial for understanding the typical dimensions of vessels prone to container loss and for identifying any outliers that may require further investigation. The LBP histogram (Figure 4b) displays the distribution of the length between the forward and aft perpendiculars of the vessels. Similar to LOA, the LBP distribution shows a concentration of vessels within a particular range, reflecting standard design practices in the maritime industry. The histogram helps in assessing whether certain LBP ranges are more susceptible to container loss incidents. The Breadth histogram (Figure 4c) illustrates the distribution of vessel widths. The frequency distribution reveals a central tendency, indicating that most vessels have a breadth within a specific range. This information is valuable for evaluating the stability and structural integrity of vessels, as broader vessels may have different risk profiles compared to narrower ones. The Depth histogram (Figure 4d) shows the distribution of the vertical distance from the baseline to the main deck. The frequency distribution highlights a common depth range among the vessels, which is essential for understanding the design characteristics that may influence container loss. Deeper vessels may have different loading and securing requirements, impacting their vulnerability to incidents. The Built Year histogram (Figure 4e) provides insights into the age distribution of vessels involved in container loss incidents. The frequency distribution indicates whether newer or older vessels are more prone to such incidents. This analysis can inform maintenance and retrofitting strategies to enhance vessel safety and reduce the risk of container loss. The Capacity histogram (Figure 4f) displays the distribution of the number of containers vessels can carry. The frequency distribution reveals the typical capacity ranges of vessels involved in incidents, helping to identify whether larger or smaller vessels are more susceptible to container loss. This information is critical for risk assessment and for developing targeted safety measures for different vessel sizes. By understanding these distributions, the maritime industry can develop more effective strategies to mitigate container loss, enhance vessel design, and improve overall operational safety. This analysis serves as a critical reference for stakeholders aiming to reduce the frequency and severity of container loss incidents at sea.
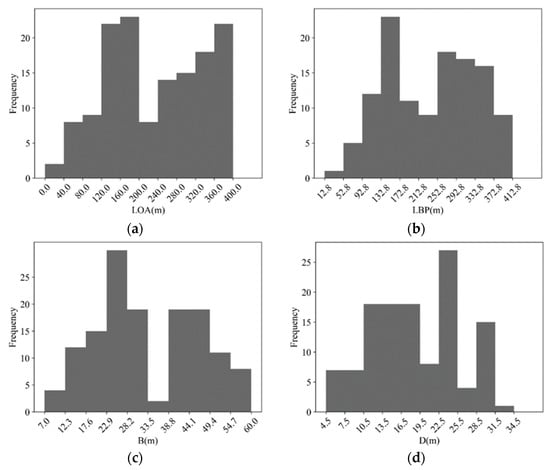
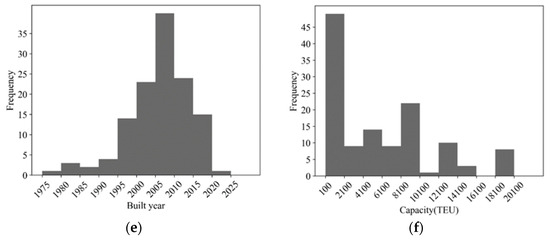
Figure 4.
Histogram of each parameter: (a) LOA, (b) LBP, (c) B, (d) D, (e) Built Year, and (f) Capacity.
The TopTier Report [4] compiles data from various maritime incidents over a specified period, categorizing the causes of container loss into distinct groups. For Figure 5, the causes were classified into several categories, with adverse weather conditions being the most prominent. The methodology involved analyzing incident reports and assigning each incident to a primary cause based on the sequence of events. In cases where multiple factors contributed to an incident, the cause that occurred first was designated as the primary cause. Adverse weather conditions were identified as the leading cause of container loss, accounting for 57.14% of the incidents. This high percentage underscores the significant impact of severe weather, such as storms, high winds, and rough seas, on maritime operations. These conditions can lead to the destabilization of cargo, failure of securing systems, and even structural damage to vessels, resulting in the loss of containers overboard. The remaining incidents were attributed to a combination of other factors, such as equipment failure, fire, and grounding. While these causes were less frequent, they highlight the diverse risks associated with maritime container transportation. The findings from Figure 5 emphasize the critical role of adverse weather conditions in container loss incidents, necessitating enhanced weather forecasting and real-time monitoring systems. Additionally, the significant contribution of cargo operation errors and collisions highlights the need for improved operational protocols, crew training, and advanced navigation technologies.
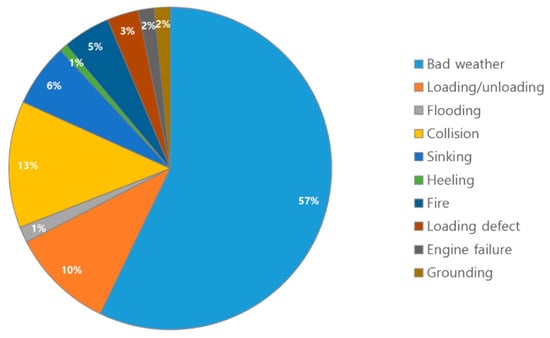
Figure 5.
Distribution of container loss causes [4].
2.3. Data Processing
Table 3 outlines the number of missing values across several key parameters, such as ship characteristics and environmental conditions, for incidents of container loss. Notably, parameters related to the sea state, including wave height (Hs), period (Tp), wind speed, and wind direction, exhibit a high proportion of missing values. This trend suggests that while sea state data are significant for understanding incident causes, consistent collection has been challenging, potentially limiting their role in predictive analyses. In response, this study implements methods to handle missing data effectively, using regression and deep learning for parameters with relatively lower missing rates and random assignment methods for higher missing rate parameters. This approach preserves the robustness of the dataset and mitigates bias introduced by incomplete data.

Table 3.
Mechanical properties of the structural members.
The number of missing values for parameters expressing the sea state, such as Hs and Tp, was very high compared with the parameters expressing ship characteristics, such as capacity and LOA. Although parameters related to the sea state can have a significant impact on the cause of a lost vessel accident, the proportion of missing values was exceedingly high to be used in the analysis; therefore, we excluded them and proceeded with the analysis. Several methods are available for handling missing data. Missing data can be handled in various ways, such as removing them completely, using average values, or using predictive models, such as regression equations, to use the predicted values. In this study, we used a prediction model using regression, deep learning, and a random selection method based on the probability of handling missing data. Figure 6 presents a series of scatter plots that illustrate the relationships between the Length Overall (LOA) of vessels and other key vessel parameters, including Length Between Perpendiculars (LBP), Breadth (B), Depth (D), and Maximum Draught (Draught Max.). These scatter plots are used to visualize the linear relationships between LOA and the other parameters, which are critical for understanding the structural dimensions of vessels involved in container loss incidents.
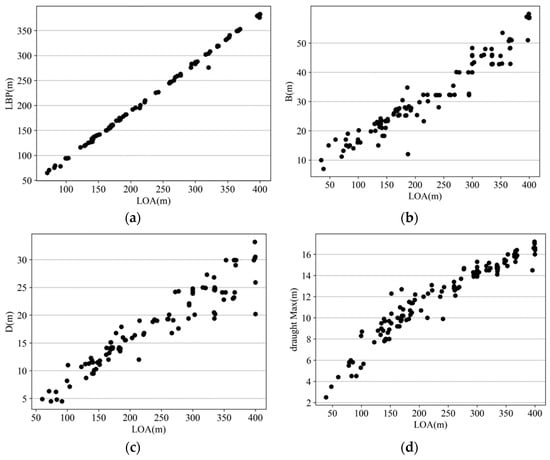
Figure 6.
Scatter plot of LOA, LBP, B, D, and draught max; (a) LOA-LBP, (b) LOA-B, (c) LOA-D, and (d) LOA-draught Max.
This scatter plot (Figure 6a) shows the relationship between the Length Overall (LOA) and the Length Between Perpendiculars (LBP). LBP is the distance between the forward and aft perpendiculars of the vessel, which are vertical lines at the bow and stern. The plot reveals a strong positive correlation between LOA and LBP, indicating that as the overall length of the vessel increases, the distance between the perpendiculars also increases. This relationship is expected, as LBP is a subset of LOA and is directly influenced by the vessel’s overall length. Fig-6b illustrates the relationship between Length Overall (LOA) and Breadth (B), which is the width of the vessel. The plot shows a strong positive correlation, suggesting that larger vessels (with greater LOA) tend to have greater breadth. This is consistent with ship design principles, where larger vessels are designed to be wider to maintain stability and accommodate more cargo. Figure 6c depicts the relationship between Length Overall (LOA) and Depth (D), which is the vertical distance from the baseline to the main deck. The plot indicates a positive correlation, meaning that as the vessel’s length increases, its depth also tends to increase. This is because deeper vessels are required to support larger cargo loads and maintain structural integrity. Fig-6d shows the relationship between Length Overall (LOA) and Maximum Draught (Draught Max.), which is the maximum vertical distance from the waterline to the lowest part of the hull. The plot reveals a strong positive correlation, indicating that larger vessels (with greater LOA) tend to have a deeper draught. This is because larger vessels require a deeper draught to maintain stability and buoyancy, especially when fully loaded. The strong correlations observed in these scatter plots suggest that vessel dimensions are interrelated and play a significant role in determining the vessel’s capacity and stability. Larger vessels, with greater LOA, LBP, B, D, and Draught Max., are designed to carry more containers, but they may also be more susceptible to structural failures under adverse conditions, such as heavy weather. Understanding these relationships is crucial for designing vessels that can withstand the stresses of maritime operations and reduce the risk of container loss.
Figure 7 presents the results of a deep-learning model used to predict the capacity of vessels based on their dimensions, including LOA, LBP, B, D, and Draught Max. The model was trained to estimate the capacity of vessels, which is the number of containers a vessel can carry, using these five features. The figure includes a comparison between the actual capacity and the predicted capacity generated by the deep-learning model. The deep-learning model uses five input features: LOA, LBP, B, D, and Draught Max. These features were chosen because they are strongly correlated with the vessel’s capacity, as demonstrated in Figure 6. The output of the model is the predicted capacity of the vessel, measured in twenty-foot equivalent units (TEU), which is the standard unit for measuring container capacity. The model’s performance was evaluated using the Symmetric Mean Absolute Percentage Error (SMAPE), which measures the accuracy of the model’s predictions. The SMAPE is calculated using the following Formula (1). The SMAPE value for this model was calculated to be 8.74%, indicating a high level of accuracy in predicting vessel capacity.
where is the actual value, is the predicted value, is the number of data points.
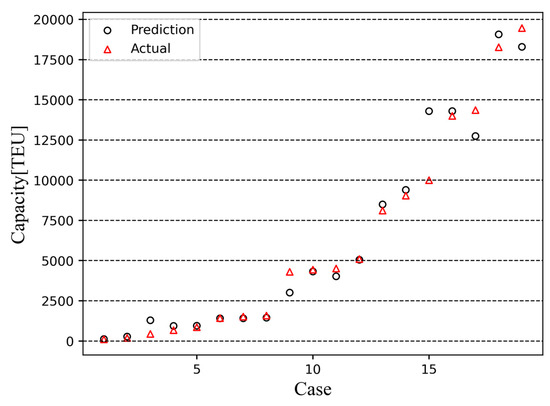
Figure 7.
Results of the deep-learning model in predicting capacity.
Figure 7 demonstrates the effectiveness of a deep-learning model in predicting vessel capacity based on dimensional data. The model’s high accuracy (SMAPE = 8.74%) suggests that it can be a valuable tool for risk assessment and vessel design optimization. The ability to accurately predict vessel capacity based on dimensions is crucial for risk assessment and management in maritime operations. By understanding the relationship between vessel dimensions and capacity, shipping companies and maritime authorities can better assess the potential risks associated with different vessel sizes. For example, larger vessels with greater capacity may be more prone to severe losses in the event of an incident, even if the frequency of incidents is lower. This information can be used to develop targeted safety measures and improve the design of vessels to reduce the risk of container loss.
3. Analysis Methods
This chapter presents the analytical methodologies employed in this study, focusing on the application of machine-learning techniques and statistical approaches to assess container loss risks. The methods include K-means clustering for incident zone classification, decision trees for severity prediction, and advanced data preprocessing techniques for handling missing data. These approaches aim to enhance predictive accuracy and provide a structured framework for assessing the likelihood and impact of container loss incidents.
3.1. Machine-Learning Backgrounds and Methodology
Machine learning (ML) has emerged as a powerful tool for analyzing complex datasets, particularly in the field of maritime safety, where large volumes of incident data are often characterized by missing values, nonlinear relationships, and diverse contributing factors. In this study, machine-learning techniques were employed to analyze container loss incidents, with a focus on predictive modeling and risk classification. The primary algorithms used include K-means clustering for incident zone classification and decision trees for risk severity prediction. Additionally, advanced data preprocessing techniques, such as regression-based imputation and deep learning, were applied to handle missing data and enhance model accuracy.
3.1.1. K-Means Clustering for Incident Zone Classification
K-means clustering is an unsupervised machine-learning algorithm used to partition data into distinct groups (clusters) based on similarity. In this study, K-means clustering was applied to classify container loss incidents into 11 distinct geographical zones. The algorithm works by minimizing the within-cluster variance, ensuring that data points within the same cluster are as similar as possible while data points in different clusters are as dissimilar as possible.
The mathematical formulation of K-means clustering involves minimizing the following objective function:
where k is the number of clusters, represents the i-th cluster, is a data point within the cluster, is the centroid of the i-th cluster.
The clustering results, as shown in Figure 8, provide a geographical mapping of high-risk zones, which is crucial for targeted risk mitigation strategies. By identifying clusters with higher incident frequencies, maritime authorities can prioritize safety measures in these regions. Eleven clusters were classified as accident areas, and the results were used as inputs for further analyses using decision trees.
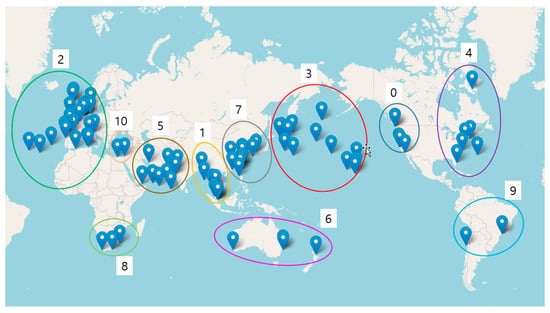
Figure 8.
Results of the K-means algorithm.
3.1.2. Decision Trees for Risk Severity Prediction
Decision trees are a supervised machine-learning algorithm used for classification and regression tasks. In this study, a decision-tree model was developed to predict the severity of container loss incidents based on vessel characteristics, incident location, and cause. The decision tree operates by recursively splitting the dataset into subsets based on the most significant attributes, using criteria such as the Gini index or information gain to determine the optimal splits. The Gini index, used in this study, measures the impurity of a node and is calculated as:
where D is the dataset at a given node, is the proportion of instances belonging to class i in the dataset.
The decision-tree model, as depicted in Figure 10, classifies incidents into three risk levels: Class 1 (low risk), Class 2 (moderate risk), and Class 3 (high risk). The model’s performance was evaluated using precision and recall metrics, with high precision observed for low-risk incidents (Class 1) and moderate precision for high-risk incidents (Class 3). However, the model struggled with moderate-risk incidents (Class 2), indicating a need for further refinement.
3.1.3. Handling Missing Data: Regression and Deep Learning
One of the significant challenges in maritime incident data analysis is the presence of missing values, particularly in environmental parameters such as wave height, wind speed, and sea state. Traditional methods, such as mean imputation or complete case analysis, often introduce bias or reduce the dataset’s robustness. In this study, advanced techniques were employed to handle missing data:
Regression-based imputation: For parameters with a linear relationship, such as LOA, LBP, B, and D, linear regression was used to estimate missing values. The regression model was formulated as:
where is the dependent variable (e.g., LBP), , , , are independent variables (e.g., LOA, B, D), , , , are regression coefficients, is the error term.
3.1.4. Risk Classification and Severity Assessment
The severity of container loss incidents was quantified using the loss ratio, defined as the ratio of the number of lost or damaged containers to the vessel’s capacity, expressed as a percentage. This metric provides a standardized measure to assess the impact of incidents across vessels of different sizes and capacities. The loss ratio was calculated using Equation (5):
This calculation allows for a consistent comparison of incident severity, regardless of the vessel’s size. The loss ratio was then categorized into three risk levels, as outlined in Table 4:

Table 4.
Risk levels for the loss ratio.
Level 1 (low risk): Loss ratio ≤ 3.5%,
Level 2 (moderate risk): 3.5% < loss ratio ≤ 20%,
Level 3 (high risk): Loss ratio > 20%.
A loss ratio of ≤3.5% indicates minimal impact on the vessel’s overall cargo capacity. Incidents in this category typically involve a small number of lost containers relative to the vessel’s total capacity, suggesting that the incident did not significantly disrupt the vessel’s stability or operational efficiency. This level of risk is often associated with minor operational errors or minor environmental factors that do not escalate into major incidents. A loss ratio between 3.5% and 20% represents a more substantial impact, where a significant portion of the vessel’s cargo is lost or damaged. Incidents in this category may result from more severe operational failures, adverse weather conditions, or collisions. While these incidents do not typically lead to catastrophic outcomes, they can still cause considerable economic losses and operational disruptions, necessitating targeted risk mitigation strategies. A loss ratio of>20% indicates a severe incident where a large proportion of the vessel’s cargo is lost or damaged. These incidents often result from extreme weather events, structural failures, or major collisions, leading to significant economic losses, environmental damage, and potential risks to crew safety. High-risk incidents require immediate attention and robust preventive measures to avoid recurrence.
Figure 9 illustrates the distribution of the loss ratio across the dataset, providing a visual representation of the frequency and severity of container loss incidents. The histogram reveals that most incidents fall into the low-risk category (Level 1), with a smaller proportion classified as moderate-risk (Level 2) and high-risk (Level 3). This distribution aligns with the general trend in maritime incidents, where minor incidents are more frequent, while severe incidents, though less common, have a disproportionately high impact.
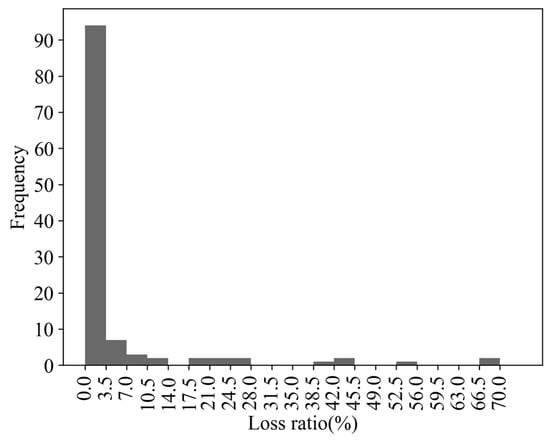
Figure 9.
Distribution of the loss ratio.
The classification system and loss ratio calculation provide a quantifiable and logical basis for assessing the severity of container loss incidents. By categorizing incidents into low, moderate, and high-risk levels, maritime stakeholders can prioritize resources and implement targeted safety measures to reduce the frequency and impact of such incidents. The results from Figure 9 and Table 4 highlight the importance of focusing on high-risk scenarios, which, although less frequent, have the potential to cause significant economic and environmental damage.
4. Discussion of Data Results
This chapter presents a detailed analysis of the results obtained from the machine-learning models and risk assessment methodologies employed in this study. The findings are discussed in the context of their implications for maritime safety, with a focus on the predictive accuracy of the decision-tree model, the classification of risk levels, and the identification of high-risk zones through K-means clustering. The discussion also highlights the limitations of the models, particularly in predicting moderate- and high-risk incidents, and underscores the importance of incorporating more comprehensive environmental data to enhance predictive capabilities. The results provide valuable insights for maritime stakeholders, offering a data-driven framework for risk assessment and mitigation strategies.
4.1. Results from Machine Learning
The decision tree in Figure 10 of the paper serves as a predictive model to estimate the severity of container loss incidents based on specific parameters. This decision tree uses key vessel characteristics, accident location, and cause as input variables to categorize incidents into three risk levels (Classes 1, 2, and 3). The input variables include the ship’s physical dimensions, such as Length Overall (LOA), Length Between Perpendiculars (LBP), Breath (B), Depth (D), and maximum draught (Draught Max.). Additionally, it includes the cluster number representing the accident location and the primary cause of the incident. Each incident is classified into a risk level from 1 to 3 based on the predicted damage ratio. Class 1 represents low risk (loss ratio ≤ 3.5%), Class 2 is moderate risk (3.5% < loss ratio ≤ 20%), and Class 3 is high risk (loss ratio > 20%). The decision tree operates by splitting the data iteratively based on thresholds defined for each parameter, which are selected to maximize the separation of data according to risk class. At each node, the tree evaluates a parameter and establishes a threshold value. If the data meets this threshold, it proceeds down one branch; if not, it follows another. The Gini index, a measure of impurity, is calculated at each node to determine the optimal threshold for separation. Lower Gini values indicate purer nodes, meaning that instances in each branch are more homogenous concerning risk classification. This decision-tree model helps in understanding the interaction between vessel characteristics, incident location, and incident cause, thus allowing shipping operators to assess potential risks before an incident occurs. For practical application, this model aids in decision-making processes by highlighting the parameters most critical to risk, emphasizing the need for more resilient designs, especially for larger vessels frequently exposed to high-risk conditions like severe weather. In summary, the decision tree in Figure 10 functions as a logical and data-driven tool to classify container loss risk. By leveraging specific vessel and environmental parameters, the model guides risk management strategies, aligning preventive efforts with areas of higher predicted risk.
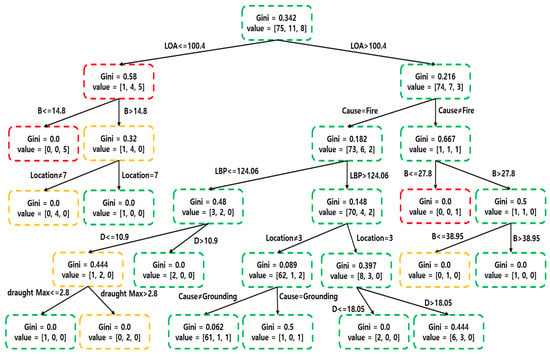
Figure 10.
Result of the decision tree.
The decision-tree model predicted the damage ratio using parameters such as ship dimensions, load, and sea area as inputs. The accuracy of the model predictions is indicated in Table 5.

Table 5.
Input and output parameters of the decision tree.
The decision tree branched into new branches based on the rules of each branch, and the Gini index was used to determine the impurity at each node.
Table 6 shows that for Class 1, both the precision and recall were high. This means that 86% of the results predicted as Class 1 by the decision-tree model were actually Class 1, and the model correctly predicted 95% of the cases that were actually Class 1. However, for Class 2, both values were low; therefore, we can conclude that the confidence in the predictions for Class 2 was low. For Class 3, the recall was low at 0.5, but the precision was high at 1. This means that the vessels predicted as Class 3 by the model were actually Class 3, and we expected that vessels predicted as Class 3 would require more risk management for loss-of-life incidents.

Table 6.
Results of the decision tree.
4.2. Risk Assessment Findings
Furthermore, the analysis was conducted through risk assessment. The risk level can be defined as
Table 7 categorizes ships based on their capacity in twenty-foot equivalent units (TEU) and assesses the risk associated with each category. The risk is calculated as the product of frequency (how often incidents occur) and consequence (the magnitude of the incident in terms of container loss). These large ships (>14,000 TEU) have the second-lowest frequency of accidents (0.12) but the highest consequence (4619 containers lost), resulting in the highest risk (0.0606). Smaller ships (<2000 TEU) have the highest frequency of accidents (0.40) but a relatively low consequence (779 containers lost), resulting in a moderate risk (0.0327). Ships with capacities between 2000 and 14,000 TEU show varying frequencies and consequences, with risks ranging from 0.0124 to 0.0356. The frequency of incidents is calculated based on historical data, representing the proportion of incidents that occur within each capacity category. The consequence is measured by the average number of containers lost per incident within each capacity category. For large ships, the focus should be on preventing high-consequence incidents, such as structural failures or severe weather-related losses. For smaller ships, the focus should be on reducing the frequency of incidents through improved operational practices and safety measures.

Table 7.
Risk assessment for capacity.
Table 8 categorizes incidents by their primary cause and assesses the risk associated with each cause. The risk is calculated as the product of frequency (how often the cause leads to incidents) and consequence (the magnitude of the incident in terms of container loss). Bad weather is the most frequent cause (0.57) and has the highest consequence (12,436 containers lost), resulting in the highest risk (0.403). Although less frequent (0.05), fires have a high consequence (2150 containers lost), resulting in a moderate risk (0.006). Causes such as engine failure, grounding, and collision have lower frequencies and consequences, resulting in minimal risks (ranging from 0.000 to 0.006). The frequency of incidents is calculated based on historical data, representing the proportion of incidents caused by each factor. The consequence is measured by the average number of containers lost per incident caused by each factor. Risk is calculated using the same formula as in Table 7. This formula quantifies the overall risk by combining how often a specific cause leads to incidents with the severity of their impact. The high risk associated with bad weather suggests that shipping companies should prioritize investments in weather-resistant container-securing systems and advanced navigation technologies. Additionally, incidents caused by fires, although less frequent, still pose a significant risk, indicating the need for improved fire prevention and response measures on board. Both tables use the same risk calculation formula, which combines frequency and consequence to quantify the overall risk. Frequency is unitless, consequence is measured in the number of containers lost, and risk is the product of these two, representing expected container loss. The results suggest that risk management strategies should be tailored based on ship size and the primary causes of incidents. For large ships, the focus should be on preventing high-consequence incidents, while for smaller ships, reducing the frequency of incidents is key. Adverse weather conditions require special attention due to their high frequency and consequences.

Table 8.
Risk assessment for cause.
5. Conclusions Remarks
This study provides a comprehensive analysis of container loss at sea, leveraging advanced statistical methods and machine-learning techniques to identify critical risk factors and develop predictive models for risk assessment. By analyzing incident data from 2011 to 2023, the research highlights the significant impact of adverse weather conditions, vessel size, and operational factors on container loss incidents. The integration of machine-learning algorithms, such as K-means clustering and decision trees, along with advanced data preprocessing techniques, has enabled the development of a robust framework for predicting and classifying container loss risks. The findings offer valuable insights for maritime stakeholders, including ship operators, regulators, and insurers, to enhance safety measures and mitigate the economic and environmental impacts of container loss.
The study reveals that adverse weather conditions are the predominant cause of container loss, accounting for 57.14% of incidents. This underscores the urgent need for improved weather monitoring systems and proactive safety protocols to mitigate the risks associated with extreme weather events. Furthermore, the analysis demonstrates that vessel size and capacity play a crucial role in determining the severity of container loss incidents. Larger vessels, despite experiencing fewer incidents, tend to suffer more severe losses, while smaller vessels are more prone to frequent but less severe incidents. This finding suggests that risk management strategies should be tailored to the specific characteristics of vessels, with a focus on enhancing the structural resilience of larger ships and improving operational practices for smaller vessels. The decision-tree model developed in this study demonstrates high accuracy in predicting low-risk incidents, with a precision of 86% and a recall of 95% for Class 1 (low risk). However, the model faces challenges in accurately classifying moderate- and high-risk incidents, particularly for Class 2 (moderate risk), where both precision and recall are relatively low. This indicates a need for further refinement of the model, particularly through the incorporation of more comprehensive environmental data, such as wave height and wind speed, which were often missing in the dataset. Despite these limitations, the decision-tree model provides a valuable tool for assessing the severity of container loss incidents based on vessel characteristics, incident location, and cause. The application of K-means clustering has enabled the classification of container loss incidents into 11 distinct geographical zones, providing a clear mapping of high-risk areas. This geographical clustering allows maritime authorities to prioritize safety measures in regions with higher incident frequencies, thereby enhancing targeted risk mitigation strategies. Additionally, the study introduces a structured risk classification system based on the loss ratio, which quantifies the severity of incidents by comparing the number of lost or damaged containers to the vessel’s capacity. This classification system, which categorizes incidents into low, moderate, and high-risk levels, offers a standardized approach for assessing and managing container loss risks across different vessel sizes and operational conditions. The study also highlights the importance of advanced data preprocessing techniques, such as regression-based imputation and deep learning, in handling missing data and improving the reliability of predictive models. By addressing the challenges posed by incomplete datasets, these techniques enhance the accuracy and robustness of the analysis, ensuring that the findings are based on a comprehensive and reliable dataset.
In conclusion, this study makes a significant contribution to maritime safety research by providing a data-driven framework for understanding and mitigating container loss risks. The findings underscore the importance of integrating advanced weather monitoring, enhancing vessel design, and improving operational practices to reduce the frequency and severity of container loss incidents. Future research should focus on expanding the dataset to include more complete environmental variables, exploring advanced modeling techniques, and incorporating real-time data to further refine predictive models. By leveraging these insights, maritime stakeholders can develop more effective risk management strategies, ultimately contributing to the safety, resilience, and sustainability of global maritime logistics operations.
Author Contributions
Conceptualization, J.-S.P. and B.-K.L.; methodology, J.-S.P. and M.-S.Y.; data curation, M.-S.Y.; writing—original draft preparation, J.-S.P.; writing—review and editing, M.-S.Y. and B.-K.L. All authors have read and agreed to the published version of the manuscript.
Funding
This study was supported by a research fund from Chosun University in 2022.
Institutional Review Board Statement
Not applicable.
Informed Consent Statement
Not applicable.
Data Availability Statement
The data are not publicly available. The data presented in this study are available on request from the corresponding author.
Conflicts of Interest
Authors Byung-Keun Lee and Joo-Shin Park were employed by the company Samsung Heavy Industries Co., Ltd. The remaining authors declare that the research was conducted in the absence of any commercial or financial relationships that could be construed as a potential conflict of interest.
References
- Hwang, D.J. 2019. Available online: https://www.monthlymaritimekorea.com/news/articleView.html?idxno=23518 (accessed on 10 October 2024).
- Korean Register (KR). IMO News Flash-MSC 108; KR: Busan, Republic of Korea, 2024. [Google Scholar]
- World Shipping Council (WSC). Containers Lost at Sea-2024 Update; World Shipping Council (WSC): Washington, DC, USA, 2024. [Google Scholar]
- TopTier Report. Review of Incidents Resulting in Loss of Containers; Report No. 33039-1-SEA; TopTier Report: Wageningen, The Netherlands, 2021; pp. 6–177. [Google Scholar]
- Liu, J.; Jiang, X.; Huang, W.; He, Y.; Yang, Z. A Novel Approach for Navigational Safety Evaluation of Inland Waterway Ships under Uncertain Environment. Transp. Saf. Environ. 2022, 4, tdab029. [Google Scholar] [CrossRef]
- Chen, X.; Chen, W.; Wu, B.; Wu, H.; Xian, J. Ship Visual Trajectory Exploitation via an Ensemble Instance Segmentation Framework. Ocean Eng. 2024, 313, 119368. [Google Scholar] [CrossRef]
- Yeun, D.H.; Choi, Y.S.; Kim, S.G. An Assessment & Analysis of Risk Based on Accident Category for Container Terminals. J. Shipp. Logist. 2014, 30, 843–858. [Google Scholar]
- Lee, S.M. A Study on Categorization of Physical Risk in Freight Transportation. Master’s Thesis, Chung-Ang University, Seoul, Republic of Korea, 2016. [Google Scholar]
- Kim, B.-H.; Park, S.-H.; Gong, J.-M.; Yeo, G.-T. A Study on the Safety Factor Analysis of Bulk Cargo Handling Using Fuzzy-AHP: Focused on Steel Cargo. J. Digit. Converg. 2018, 16, 179–188. [Google Scholar]
- Jo, G.-W. The Need for International Policy Regarding Lost Containers at Sea for Reducing Marine Plastic Litter. J. Int. Marit. Saf. Environ. Aff. Shipp. 2020, 4, 80–83. [Google Scholar] [CrossRef]
- Chang, C.-H.; Kontovas, C.; Yu, Q.; Yang, Z. Risk Assessment of the Operations of Maritime Autonomous Surface Ships. Reliab. Eng. Syst. Saf. 2021, 207, 23–36. [Google Scholar] [CrossRef]
- Hwang, D.J. A Discussion on Container Loss Accidents and Responses During Ship Voyage. J. Korean Navig. Port Res. 2022, 46, 331–337. [Google Scholar]
- Oterkus, S.; Wang, B.; Oterkus, E.; Galadima, Y.K.; Cocard, M.; Mokas, S.; Buckley, J.; McCullough, C.; Boruah, D.; Gilchrist, B. Structural Integrity Analysis of Containers Lost at Sea Using Finite Element Method. Sustain. Mar. Struct. 2022, 4, 11–17. [Google Scholar] [CrossRef]
- Kim, D.Y.; Shin, H.S. A Study on the Causes and Solutions of Marine Accidents According to the Weight of Container Cargo. Korean Acad. Trade Credit. Insur. 2022, 23, 3–13. [Google Scholar]
- Park, J.H. A Study on the Need to Materialize Laws Related to Cargo Securing in Container. Master’s Thesis, Korea Maritime and Ocean University, Busan, Republic of Korea, 2023. [Google Scholar]
- National Oceanic and Atmospheric Administration. Effect of a Lost Shipping Container in the Deep Sea; National Marine Sanctuaries Conservation Science Series ONMS-23-05; National Oceanic and Atmospheric Administration: Washington, DC, USA, 2023; pp. 1–27. [Google Scholar]
- Öztürk, O.B. Evaluation of the factors causing container lost at sea through fuzzy-based Bayesian network. Reg. Stud. Mar. Sci. 2024, 73, 103466. [Google Scholar] [CrossRef]
- Molina-Padrón, N.; Cabrera-Almeida, F.; Araña-Pulido, V.; Tovar, B. Towards a Global Surveillance System for Lost Containers at Sea. J. Mar. Sci. Eng. 2024, 12, 299. [Google Scholar] [CrossRef]
Disclaimer/Publisher’s Note: The statements, opinions and data contained in all publications are solely those of the individual author(s) and contributor(s) and not of MDPI and/or the editor(s). MDPI and/or the editor(s) disclaim responsibility for any injury to people or property resulting from any ideas, methods, instructions or products referred to in the content. |
© 2025 by the authors. Licensee MDPI, Basel, Switzerland. This article is an open access article distributed under the terms and conditions of the Creative Commons Attribution (CC BY) license (https://creativecommons.org/licenses/by/4.0/).