Article

The Impact of Ekman Pumping and Transport on Dosidicus gigas (Jumbo Flying Squid) Fishing Ground by Chinese Jiggers off the Coast of Peru

1
College of Marine Living Resource Sciences and Management, Shanghai Ocean University, Shanghai 201306, China
2
National Engineering Research Center for Oceanic Fisheries, Shanghai 201306, China
3
Key Laboratory of Sustainable Exploitation of Oceanic Fisheries Resources, Ministry of Education, Shanghai 201306, China
4
Key Laboratory of Oceanic Fisheries Exploration, Ministry of Agriculture and Rural Affairs, Shanghai 201306, China
5
Scientific Observing and Experimental Station of Oceanic Fishery Resources, Ministry of Agriculture and Rural Affairs, Shanghai 201306, China
*
Author to whom correspondence should be addressed.
J. Mar. Sci. Eng. 2025, 13(2), 280; https://doi.org/10.3390/jmse13020280
Submission received: 22 December 2024 / Revised: 19 January 2025 / Accepted: 30 January 2025 / Published: 31 January 2025
(This article belongs to the Section Marine Biology)

Abstract

:
Upwelling is often associated with high productivity, biodiversity, and fishery resource abundance. This study employed a generalized additive model (GAM) to analyze the effects of Ekman pumping and transport on the abundance and distribution of jumbo flying squid (Dosidicus gigas) using wind field data and Chinese commercial fishing catch data off Peru from 2012 to 2020. The results indicate that the spatial distribution of Ekman pumping and transport exhibited significant monthly variation and exerted a considerable impact on the abundance and distribution of D. gigas. Ekman pumping fluctuated between 4.98 × 10⁻⁹ to 6.84 × 10⁻⁷ m/s, with the strongest upwelling effects observed from February to March and October to December. Ekman transport varied from 0.89 to 2.56 m3/s and peaked in August. The GAM results indicate that the catch per unit effort (CPUE) of D. gigas was significantly affected by Ekman pumping, while the latitudinal gravity centers (LATG) of D. gigas were significantly influenced by Ekman transport and chlorophyll-a concentration (Chl-a). Both hydrodynamic processes had a significant influence on Chl-a. Ekman pumping contributed greatly to upwelling formation, significantly increasing Chl-a concentration in the northern region, while strong Ekman transport pushed high-Chl-a coastal waters offshore in the central and southern regions when Ekman pumping was weaker, resulting in increasing offshore Chl-a concentrations. Furthermore, Chl-a concentration was significantly positively correlated with Ekman pumping after a two-month lag. An El Niño weakened the intensity of Ekman pumping, leading to notable declines in Chl-a concentration and D. gigas CPUE. These findings demonstrate that Ekman pumping and transport significantly influence the distribution of Chl-a, to which D. gigas is sensitive, influencing the abundance and distribution of this species off the coast of Peru.

1. Introduction

At various spatiotemporal scales, a multitude of complex oceanic mesoscale processes occur, often significantly impacting the physical, chemical, and biological aspects of the marine environment [1,2,3]. For instance, upwelling transports cold, nutrient-rich coastal waters to the photic zone, resulting in phytoplankton blooms [4,5,6]. The four most notable eastern boundary upwelling systems (Benguela, California, Iberia/Canary, and Humboldt) are known for high productivity, rich fishery resources, and their ecological mechanisms that draw global attention [6,7,8,9,10]. Some of the most globally intense fishing activities occur within these ecosystems, accounting for approximately 20% of the world’s total marine fish catch [8,10,11,12].
The differences between the four upwelling systems are related to their location characteristics and latitude. Low-latitude upwelling has strong intensity and a wide area, with lower oxygen concentrations. In contrast, high-latitude upwelling typically occurs in spring and summer, covering a smaller area [8,10]. Furthermore, these characteristics determine the biological community features and fisheries resource differences of the four upwelling systems. For example, the annual yield of herring, sardines, and anchovies in the Humboldt Current can reach up to 9 × 10⁶ metric tons [8,10]. In the Benguela and California upwelling systems, the annual yield of herring, sardines, and anchovies is even lower than that of cephalopods in the Humboldt Current [8,10,11,12]. Additionally, salmon, trout, and smelts are only captured in the California upwelling [8]. However, the Humboldt Current Large Marine Ecosystem (HCLME, Peruvian upwelling system) extends across much of the southeastern Pacific Ocean coastline, covering latitudes from 4° S to 40° S [13,14,15]. The HCLME is closer to the equator than the other three and is influenced the most by the El Niño-Southern Oscillation [7,8,9,10]. Additionally, of the four systems, fishery resources are the most abundant in the HCLME [10,11,12].
According to the classic Ekman theory, Ekman pumping and transport are often used as indicators to describe the spatial distribution patterns of upwelling [13,14,15,16,17,18,19]. For example, in the California Current System (CCS), the roles of Ekman pumping generated by wind stress curl, and Ekman transport induced by coastal winds are of equal influence in the marine environment [18,19,20,21]. The vertical transport rate driven by Ekman pumping is approximately 1.0 × 10⁶ m3/s, while Ekman transport measures approximately 0.5 × 10⁶ m3/s [18]. Various forcing mechanisms and power sources can cause high intensity coastal upwelling and its impact on the environment can be difficult to infer [10,22,23]. For instance, during El Niño events, anomalies in wind stress and Ekman transport resulted in increased Chl-a concentrations and reduced sea surface temperature (SST) on the southern coast of the Lesser Sunda Islands [24]. On the southern coast of Java, La Niña events and negative Indian Ocean Dipole (IOD) phases tend to weaken offshore Ekman processes, thereby reducing the rate at which Chl-a concentration increases and SST decreases [19]. Off the coast of Peru, strong upwelling can be generated by Ekman pumping, indicating that wind stress curl induces upwelling and significantly impacts primary productivity [16,17,25]. However, Ekman transport is also a critical component of upwelling [18]. During El Niño events, a pronounced negative Ekman pumping effect occurs off the coast of Peru, deepening the thermocline [17].
Fishery productivity in the HCLME primarily relies on small pelagic fish species [10,12,13,14,15], which are central in the trophic network as prey of species across trophic levels. Therefore, they are important in ecosystem regulation within upwelling systems [10,12,13,14]. Jumbo flying squid (Dosidicus gigas) is one of the key species within this ecosystem, with an annual production of up to 1 million tons in 2021 [13,14,26,27]. Previous studies have focused too much on spatial prediction of the D. gigas distribution in the environment factors (sea surface temperature, sea surface salinity, sea surface high, chlorophyll-a etc.), explaining changes in its catch per unit effort (CPUE) and latitudinal gravity center of the fishing grounds (LATG) [28,29,30,31]. For example, Fang et al. used various environmental factors to predict the monthly north–south migration patterns of D. gigas, which are related to ecological activities [30]. It was recently shown that the abundance and distribution of D. gigas are strongly influenced by mesoscale eddies [26,32,33,34], which generate Ekman pumping, driving upwelling causing localized lower water temperatures and higher Chl-a concentrations, resulting in D. gigas aggregations [34].
Apart from large-scale climatic forces, Ekman processes act as a localized forcing and significantly impact fishery resources [11,35,36,37,38,39,40,41,42]. Using wind field data and remote sensing Chl-a data, this study analyzes monthly variations in Ekman processes of coastal upwelling in Peruvian waters and their effects on Chl-a concentrations by using Ekman processes as proxies for upwelling intensity. Based on previous research, this study will explain the variations in the D. gigas CPUE and LATG from a completely new perspective, using Ekman pumping and transport, and provide a basis for effective and scientific commercial production and sustainable use of D. gigas in the future.

2. Materials and Methods

2.1. Fisheries and Environmental Data

Data were obtained from the China Distant-Water Fisheries Data Center between 2012 and 2020 within the region spanning 8° S to 20° S and 75° W to 95° W [29,34]. This dataset included D. gigas catch volume (in tons), the operational location (latitude and longitude), operation dates, and fishing days (effort). This research primarily investigates the monthly variations in Ekman processes and the influence on Chl-a concentration and, thus, the distribution and abundance of D. gigas off the coast of Peru. All data were analyzed monthly.
Wind field data at 10 meters above sea level were provided by the NOAA Coast Watch ERDDAP database (https://coastwatch.pfeg.noaa.gov/erddap/griddap/erdlasFnWind10.html, accessed on 19 January 2025), which included the east–west components of the wind field (m/s) and wind stress (N/m2), and wind stress curl (MPa/m). The data had a monthly temporal resolution and a spatial resolution of 1° × 1°, with the wind field and wind stress data in vector format. Chl-a concentrations were sourced from the Asia-Pacific Data Research Center at the University of Hawaii (http://apdrc.soest.hawaii.edu, accessed on 19 January 2025) with a spatial resolution of 4 km and a temporal resolution of one month and were interpolated for analysis. El Niño events were characterized by the Ocean Niño Index (ONI), which uses sea surface temperature anomalies in the Niño 3.4 region and were provided by the NOAA Climate Prediction Center (https://origin.cpc.ncep.noaa.gov/products/analysis_monitoring/ensostuff/ONI_v5.php, accessed on 19 January 2025).

2.2. Data Processing and Analysis

2.2.1. The Calculation of Ekman Transport and Pumping

HCLME is composed of Ekman transport, driven by the flow of the Ekman layer induced by trade winds, and Ekman pumping, driven by the variability of the wind field at the sea surface. Ekman transport leads to offshore mass transport, and when coupled with coastal topography, it induces the upwelling of cold bottom waters [16,17,25]. The variability of the sea surface wind field directly influences horizontal mass transport, causing either divergence or convergence in certain areas, and results in the generation of vertical flow velocity at the top of the Ekman layer, known as Ekman pumping [16,17]. Both Ekman transport and pumping are crucial components of Ekman theory. Therefore, Ekman transport represents the horizontal transport capability of seawater, while Ekman pumping represents the vertical velocity of seawater, indicating upwelling when positive and downwelling when negative [16,17]. In offshore Peruvian waters, Ekman transport is primarily driven by coastal wind stress (τ), while Ekman pumping is driven by wind stress curl (τ) and meridional wind stress [16,17], and they were calculated using the following formulae:
T E = τ a l o n g s h o r e ρ × f
W E = C u r l ( τ ) ρ × f + β × τ x ρ × f 2
Here, T E   represents Ekman transport, W E represents Ekman pumping, ρ is the density of water (1024 kg/m3), τ a l o n g s h o r e is the meridional component of wind stress, τ x is the zonal component of wind stress, C u r l ( τ ) is the wind stress curl, and f and β relate to the Coriolis parameter. The Coriolis parameter and its meridional variation were calculated as follows:
f = 2 × Ω × s i n ( φ )
β = 2 × Ω × c o s ( φ ) R
Here, f is the Coriolis parameter, β is the meridional variation of the Coriolis parameter; Ω is the Earth’s angular velocity (7.292 × 10⁻⁵ rad/s), φ is the latitude, and R is the Earth’s radius (6.4 × 10⁶ m). In the Northern Hemisphere, f is positive, and mass transport is eastwards.
However, in waters off Peru in the Southern Hemisphere, T E is mostly negative, indicating that mass transport is towards the west, moving away from the coast of Peru. T E and W E were calculated for each grid from 2012 to 2020, and the monthly averages for each grid cell were obtained. Spatial distribution maps of T E and W E were then plotted to analyze the monthly spatial distribution characteristics of upwelling.

2.2.2. Fishery Data Processing

The total monthly catch and fishing effort, represented by the number of fishing days, were obtained between 2012 and 2020. Using these, the catch per unit effort (CPUE) and the latitudinal gravity center of the fishing grounds (LATG) of D. gigas were calculated using the following formulae [28,30]:
C P U E i j = X i j E i j
L A T G i j = i = 1 k ( C i j k × Y i j k ) / k = 1 m C i j k
where C P U E i j is the catch per unit effort in month i of year j , X i j is the total catch in month i of year j , L A T G i j represents the latitudinal gravity center of the fishing grounds in month i of year j , C i j k   is the catch from the kth fishing day in month i of year j , Y i j k is the latitude of the kth fishing day in month i of year j , and m is the total number of fishing days for that month.

2.2.3. Impact of Ekman Processes on the D. gigas Fishing Ground

The monthly averages of these Ekman processes from 2012 to 2020 were calculated and the relationships between these and the CPUE and LATG of D. gigas were analyzed. To better explain the significance of monthly differences, we used Analysis of Variance (ANOVA) to compare the monthly differences of four variables, and relevant results are provided in the Supplementary File (Table S1). Additionally, spatial distribution maps of Ekman transport and pumping were created and overlaid with the monthly fishing locations of D. gigas to analyze the changes in the distribution of D. gigas in response to Ekman transport. The monthly averages of these Ekman processes from 2012 to 2020 were calculated and the relationships between these and the CPUE and LATG of D. gigas were analyzed. Finally, cross-correlation analyses were used to examine the lagged correlations between Ekman pumping and the CPUE and between Ekman transport and the LATG of D. gigas. Since the monthly values of Ekman transport were negative, the absolute values were used.

2.2.4. The Impact of Ekman Processes on Chl-a Concentration

Chl-a concentration is higher nearshore, gradually decreasing with offshore distance off the coast of Peru. Because the fishery data in this article is only from the high seas, this study selected two isoclines to represent the variations in Chl-a. Areas with Chl-a concentrations greater than 0.2 mg/m3 were defined as high-Chl-a areas. To investigate the transport process of high-Chl-a area facilitated by Ekman transport, 0.6 mg/m3 Chl-a contours were selected to analyze nutrient distributions in coastal upwelling areas, while 0.2 mg/m3 Chl-a contours were used to examine Chl-a distributions in offshore waters. Monthly Chl-a distribution maps were generated to assess the influence of Ekman processes on offshore Chl-a distributions, and cross-correlation analyses were used to examine the lagged relationship between Ekman pumping and Chl-a concentrations.

2.2.5. Generalized Additive Model (GAM)

To explain the nonlinear effects of Ekman transport and pumping of Chl-a on CPUE and LATG of D. gigas, this study employed nonlinear GAM modeling. GAM is a powerful nonlinear statistical regression model that requires various smoothing functions to address the issues between nonlinear factors. To eliminate the autocorrelation in the time series data, we randomly shuffled all the data before modeling. The GAM model was constructed using the R package ‘mgcv’, with the following calculation formula:
L n ( C P U E + 1 ) = s ( T E ) + s ( W E ) + s ( C h l a ) + ε
L A T G = s ( T E ) + s ( W E ) + s ( C h l a ) + ε
Here, T E   represents Ekman transport, W E represents Ekman pumping, C h l a represents Chl-a concentration, s is a smooth curve function, and ε represents the error term.

2.2.6. The Impact of El Niño Events on Ekman Transport, Chlorophyll-a Concentrations, and D. gigas CPUE

According to NOAA, an El Niño event occurs when the five-month running average of sea surface temperature anomalies (SSTA) in the El Niño 3.4 region exceeds 0.5 °C [29]. Based on this definition, an El Niño event occurred in the first half of 2016 and 2015, and 2016 had a greater intensity. For comparison, 2013 was selected as a reference year with normal climatic conditions. A comparative analysis of Ekman transport, Chl-a concentration, and D. gigas CPUE was conducted from January to June in 2013 (normal) and 2016 (El Niño) to investigate the impact of El Niño events on upwelling processes.

3. Results

3.1. The Impact of Ekman Processes on the Abundance and Distribution of D. gigas

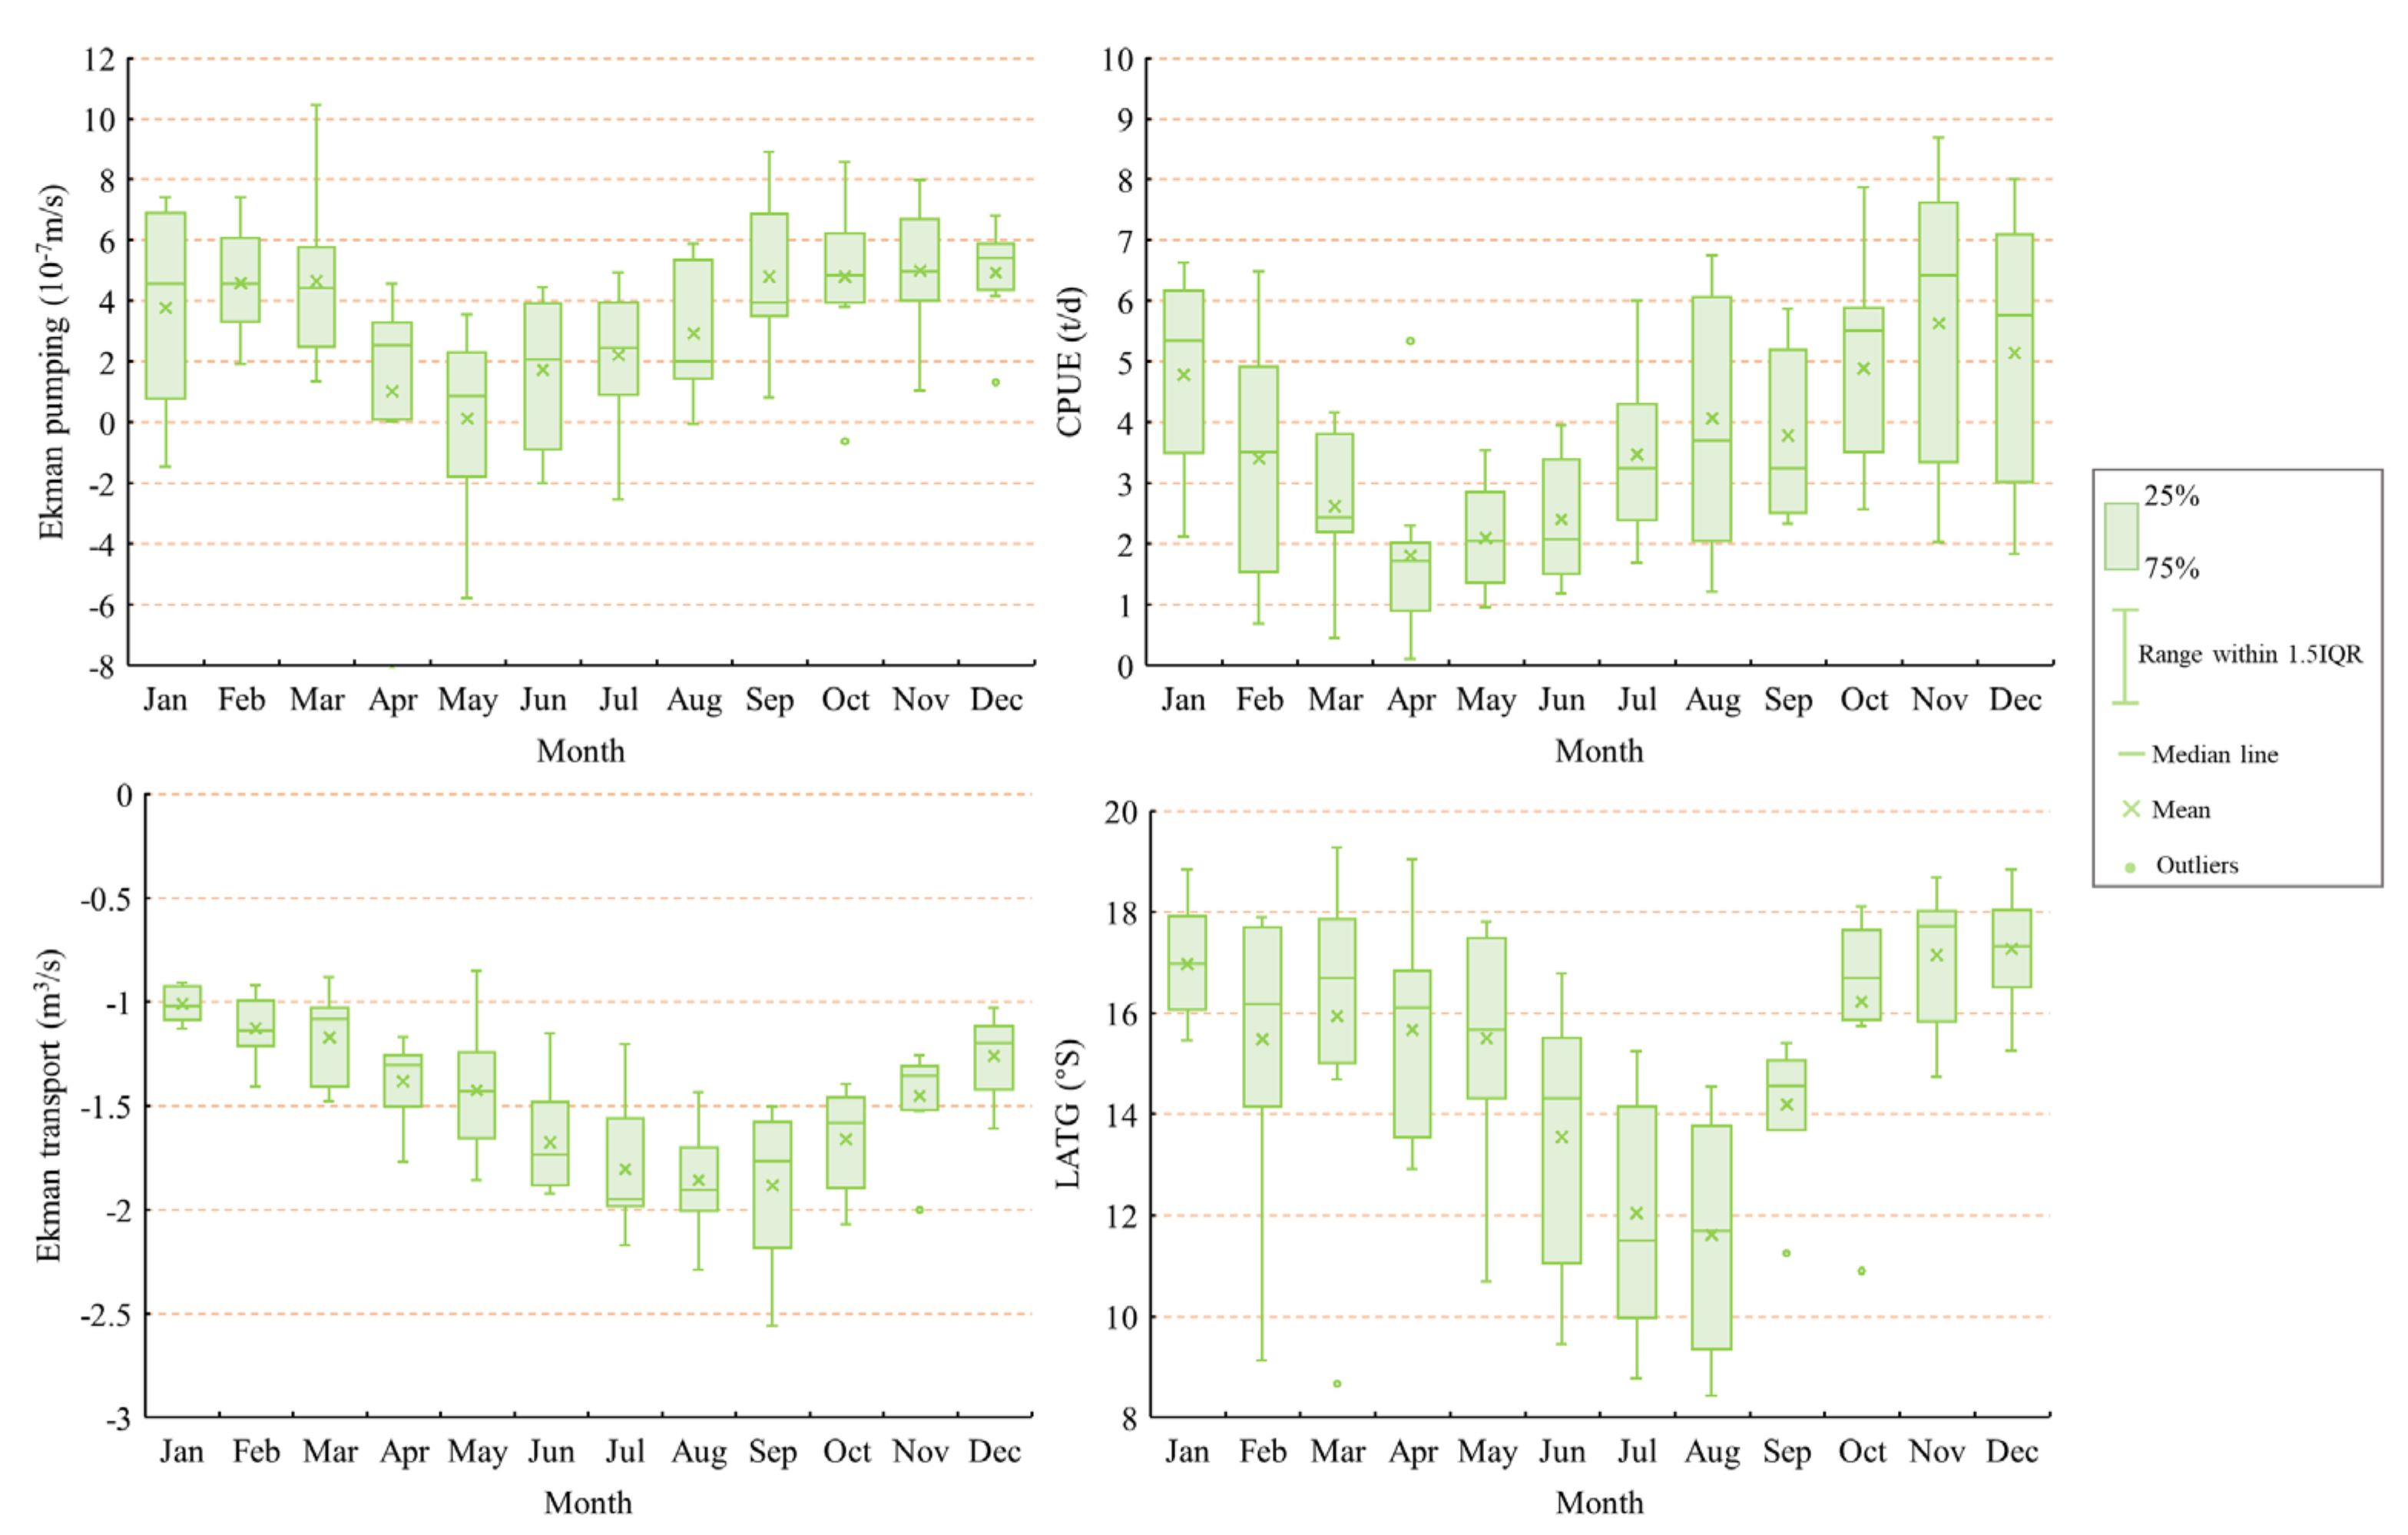
3.1.1. Monthly Variations in Ekman Pumping and Transport, and the CPUE and LATG of D. gigas

As shown in Figure 1, there were significant monthly variations in Ekman transport and pumping and the CPUE and LATG of D. gigas (p < 0.01, Supplementary File: Table S1). Ekman pumping increased in February, gradually decreased until May, and subsequently gradually increased from June, levelling off in December. Ekman transport (intensity) showed a trend of increasing and then decreasing, reaching its maximum in August. D. gigas CPUE first decreased, reaching below 3 t/d from March to June, subsequently increasing and exceeding 5 t/d from October to January. The LATG of D. gigas showed clear north–south movements, with minor shifts from January to May, with a subsequent northward movement until August, and a southward movement thereafter.

3.1.2. The Spatial Distribution Characteristics of Ekman Pumping

Figure 2 illustrates the monthly distribution of Ekman pumping (positive values) associated with upwelling. Based on the analysis of the upwelling area, it is observed that the extent of upwelling area generally decreased and subsequently increased with latitude, with the smallest upwelling area near 16° S. From January to March, the upwelling area expanded significantly westward, while the expansion of the upwelling area in southern regions was relatively smaller. In April, May, and June, the upwelling area significantly decreased in the northern and southern sea regions. From July, the upwelling area gradually increased and expanded westward, while in the central region (near 16° S), upwelling remained limited. Regarding monthly upwelling intensity, this gradually decreased with increasing distance offshore. Near the Peruvian coast, the monthly variation in upwelling intensity was more pronounced, with minimal variation from January to May and a significantly increased intensity from June to September, subsequently decreasing from October to December.

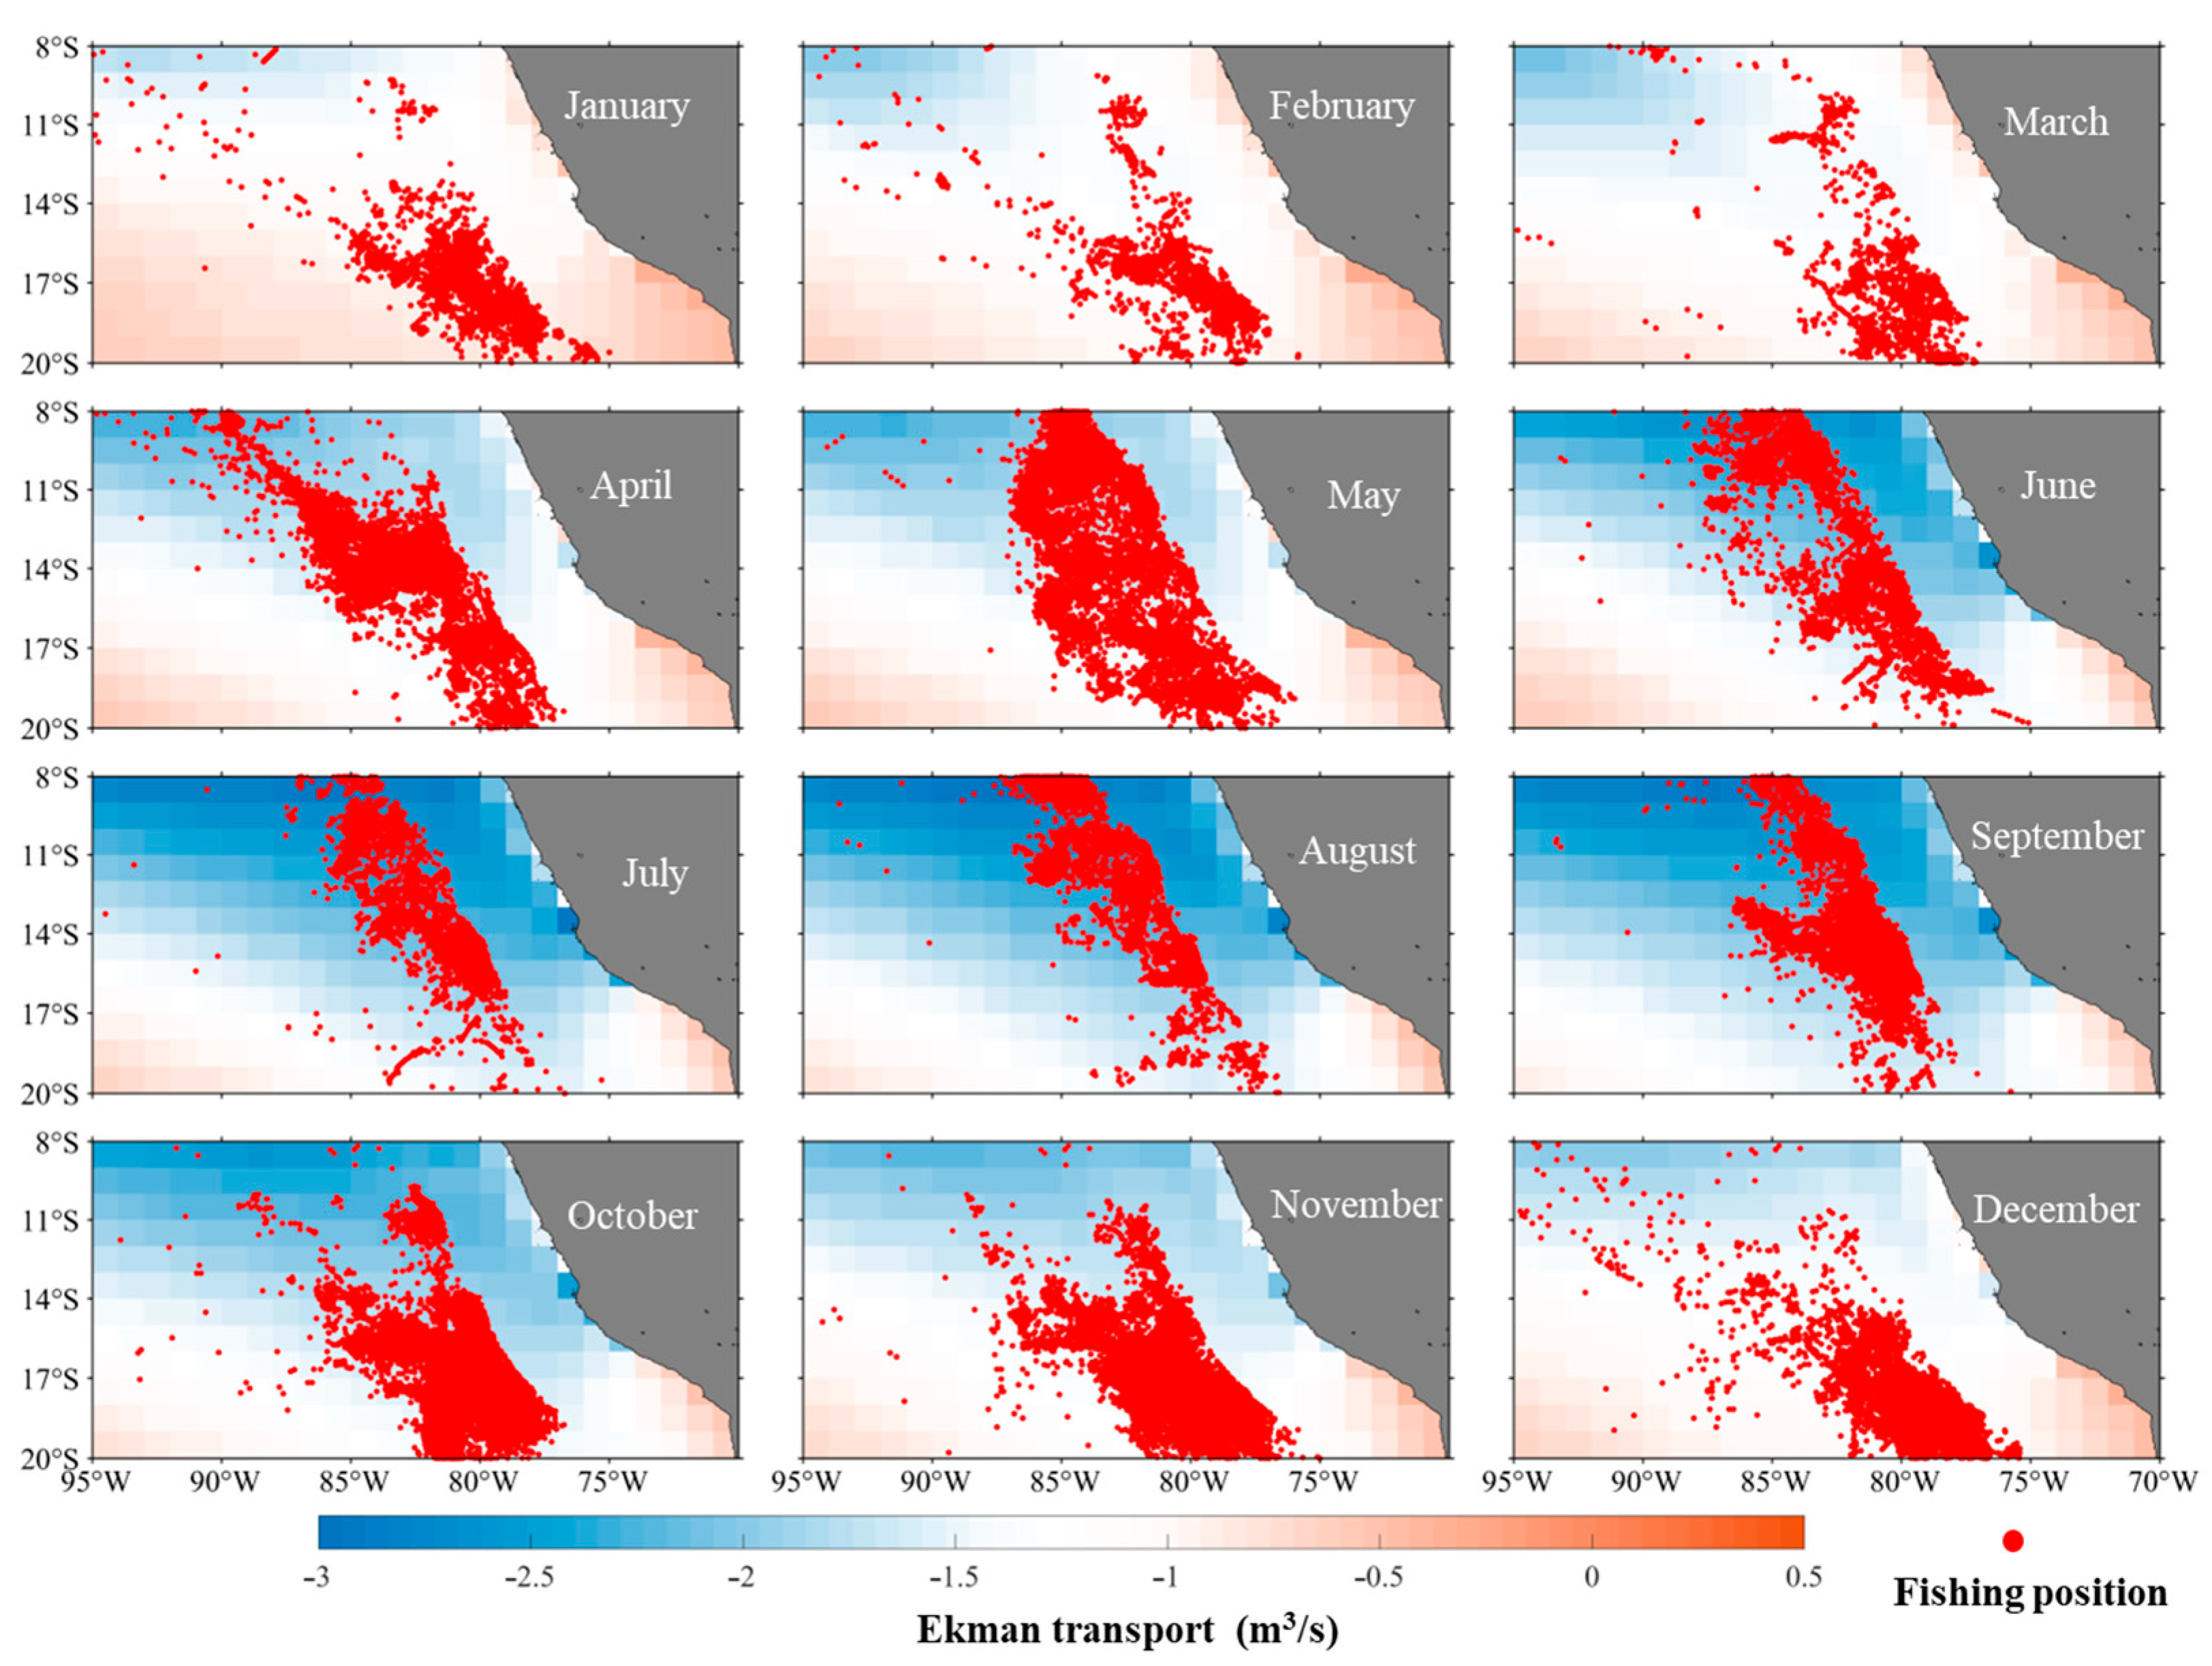
3.1.3. The Relationship Between the Spatial Distribution of Ekman Transport and D. gigas

Figure 3 demonstrates obvious monthly variations in the spatial distributions of Ekman transport in the offshore waters of Peru. Overall, Ekman transport near the Peruvian coast was notably weaker than in the offshore areas. From January to March, Ekman transport was stronger in the northwest offshore waters compared to weaker transport in the south, with stronger transport gradually shifting southeastward. From April, Ekman transport intensity offshore significantly increased and gradually extended into the south, while also affecting the nearshore regions. By August and September, offshore Ekman transport reached its maximum strength, thereafter gradually decreasing in the south from October to December. Regarding monthly fishing vessel positions, the offshore distribution of D. gigas was closely correlated with Ekman transport intensity. From January to March, when Ekman transport was weak, D. gigas aggregated in the south, gradually migrating northward from April to September as the strength of Ekman transport increased. From October to December, D. gigas gradually returned to the south as Ekman transport weakened in this region.

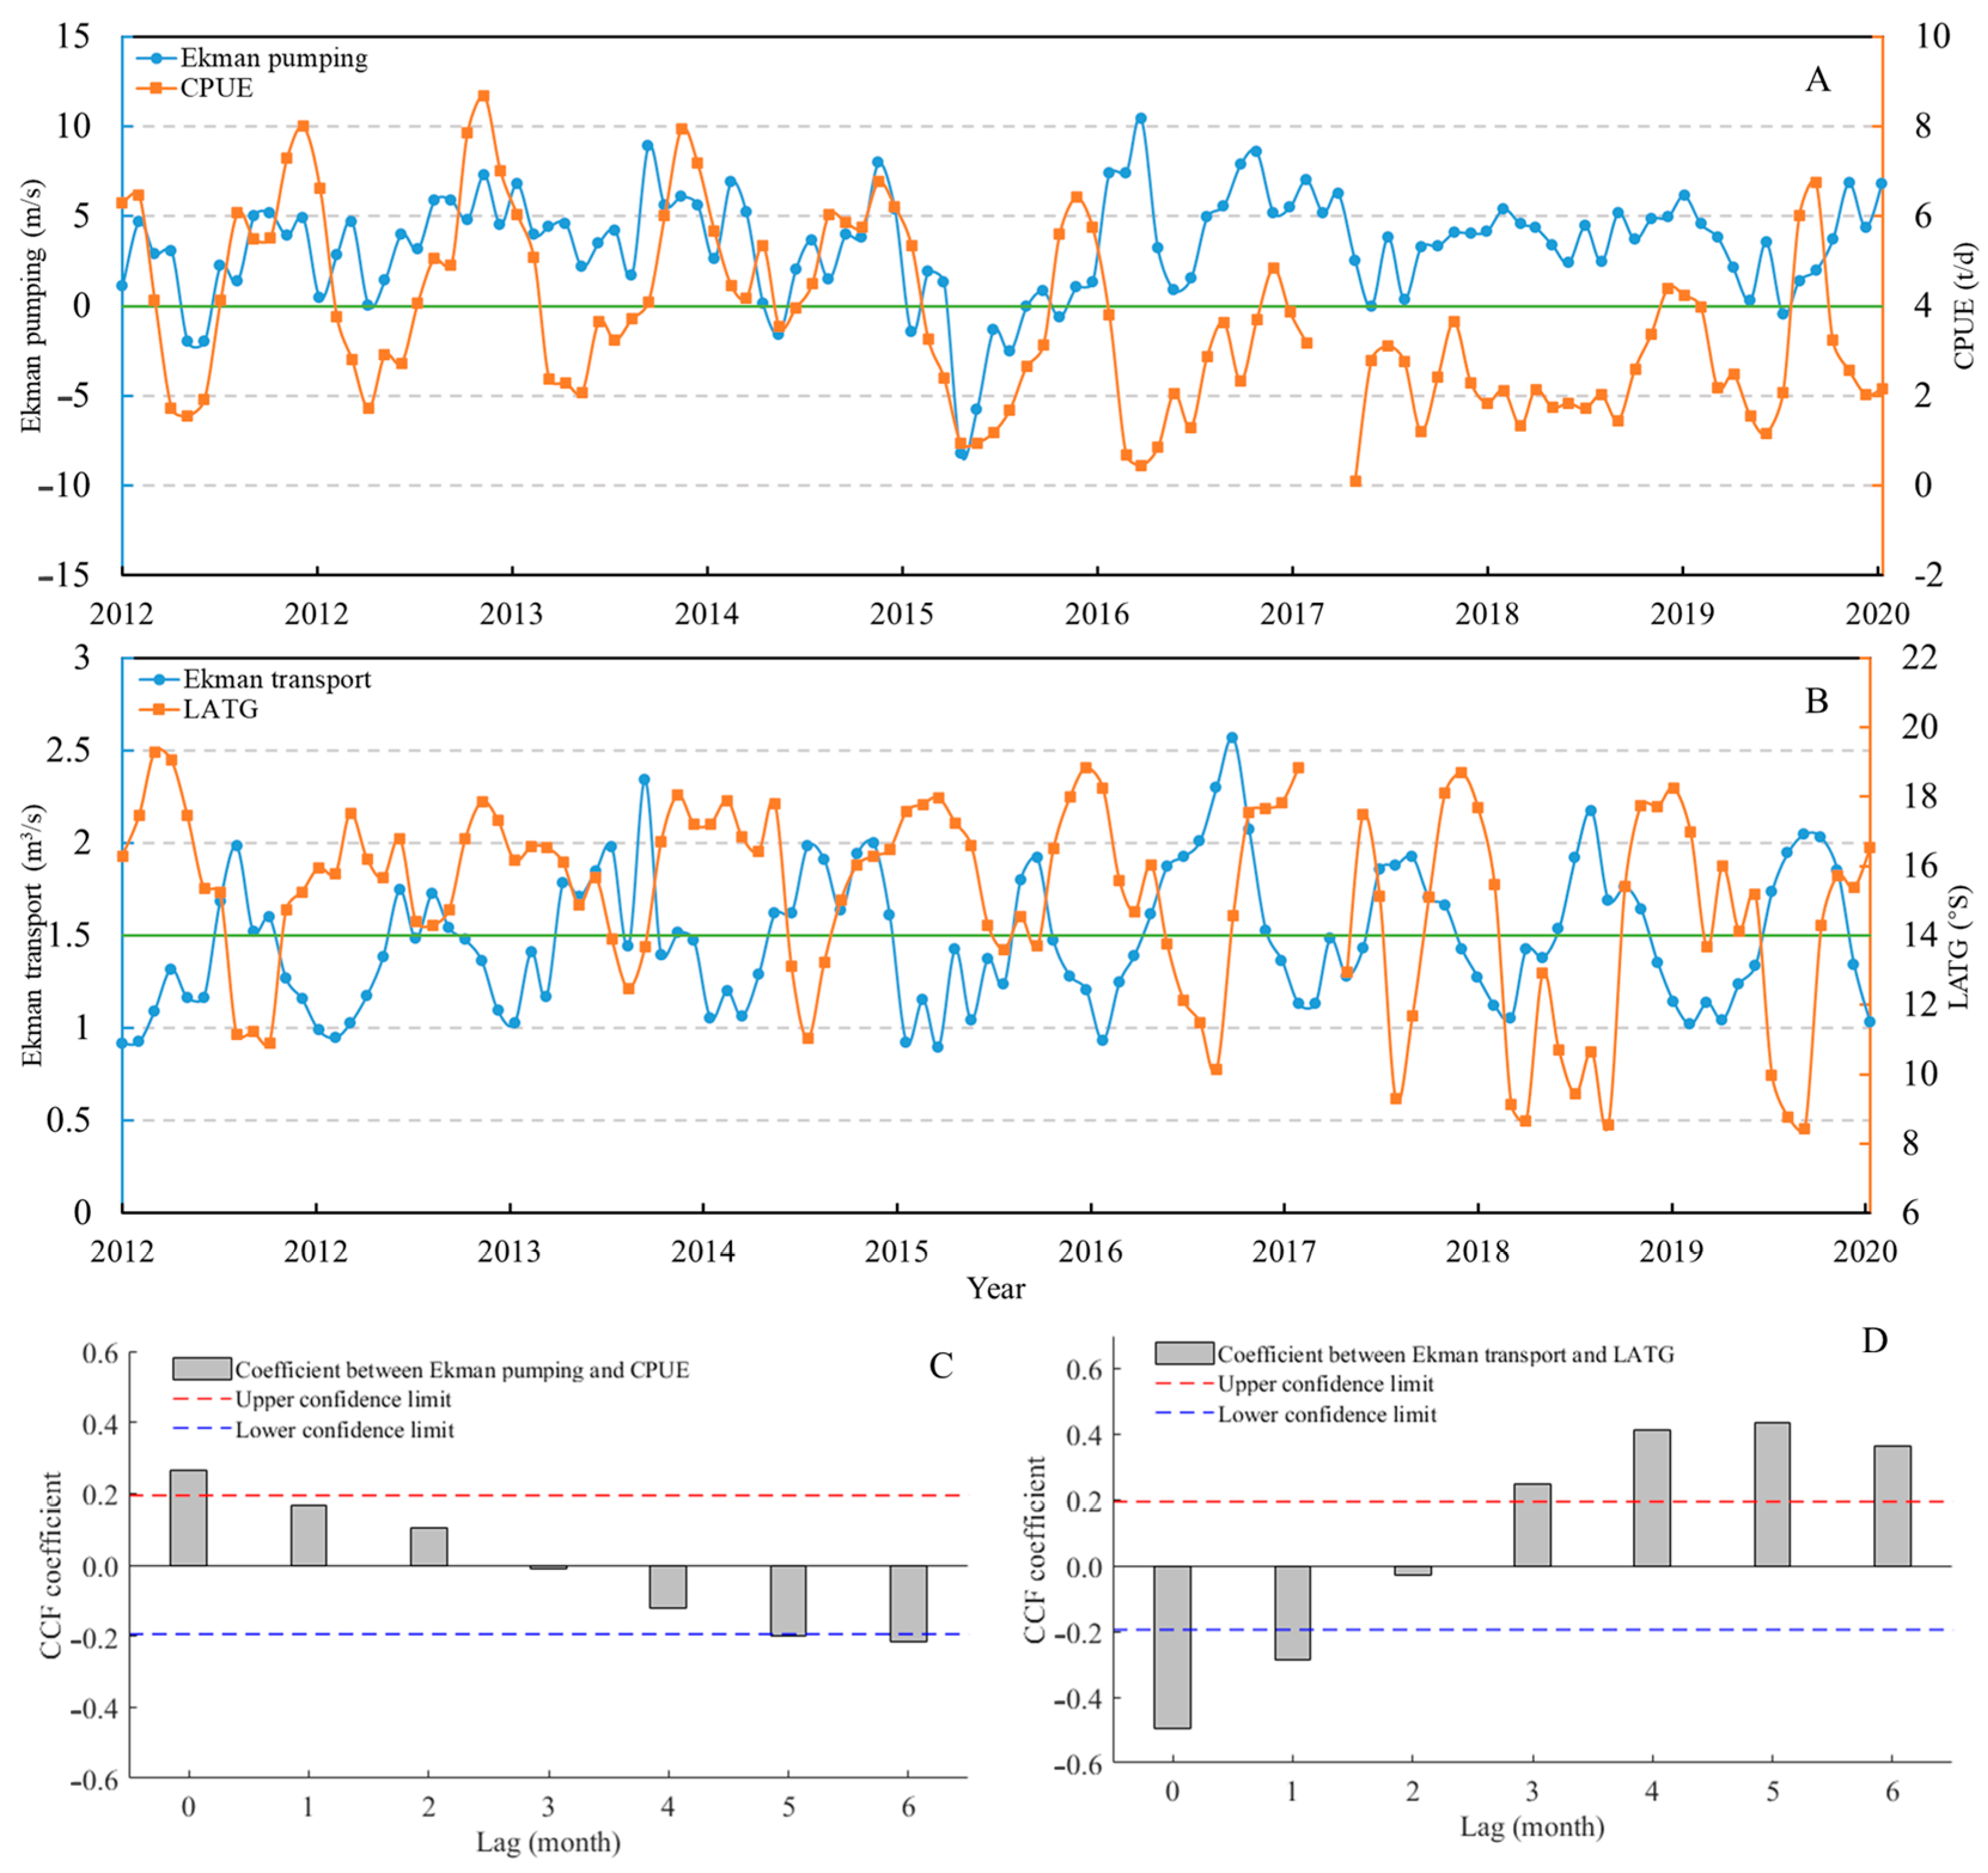
3.1.4. Annual Variation in Ekman Transport and Pumping, and the CPUE and LATG of D. gigas in 2012 to 2020

Figure 4 shows that both Ekman pumping and the CPUE of D. gigas and Ekman transport and the LATG of D. gigas exhibited similar or opposite annual fluctuation patterns from 2012 to 2020. Ekman pumping ranged from 4.98 × 10⁻⁹ and 6.84 × 10⁻⁷ m/s, and negative values were only observed when the intensity was at its lowest in May and June. The CPUE of D. gigas fluctuated between 0.1 and 8 t/d over the period and varied considerably, similarly to Ekman pumping. In each year, D. gigas CPUE was lower between March and June, reaching relatively higher numbers during October and January. The cross-correlation analysis showed a significant positive correlation between D. gigas CPUE and Ekman pumping at a lag of zero months, with the highest correlation coefficient being 0.26. Over the period, Ekman transport fluctuated between 0.89 and 2.56 m3/s, and the LATG of D. gigas exhibited a significant north–south migration, in contrast to Ekman transport strength. The cross-correlation analysis indicated a significant negative correlation between the LATG of D. gigas and Ekman transport at a lag of zero months, with the highest correlation coefficient being −0.49.

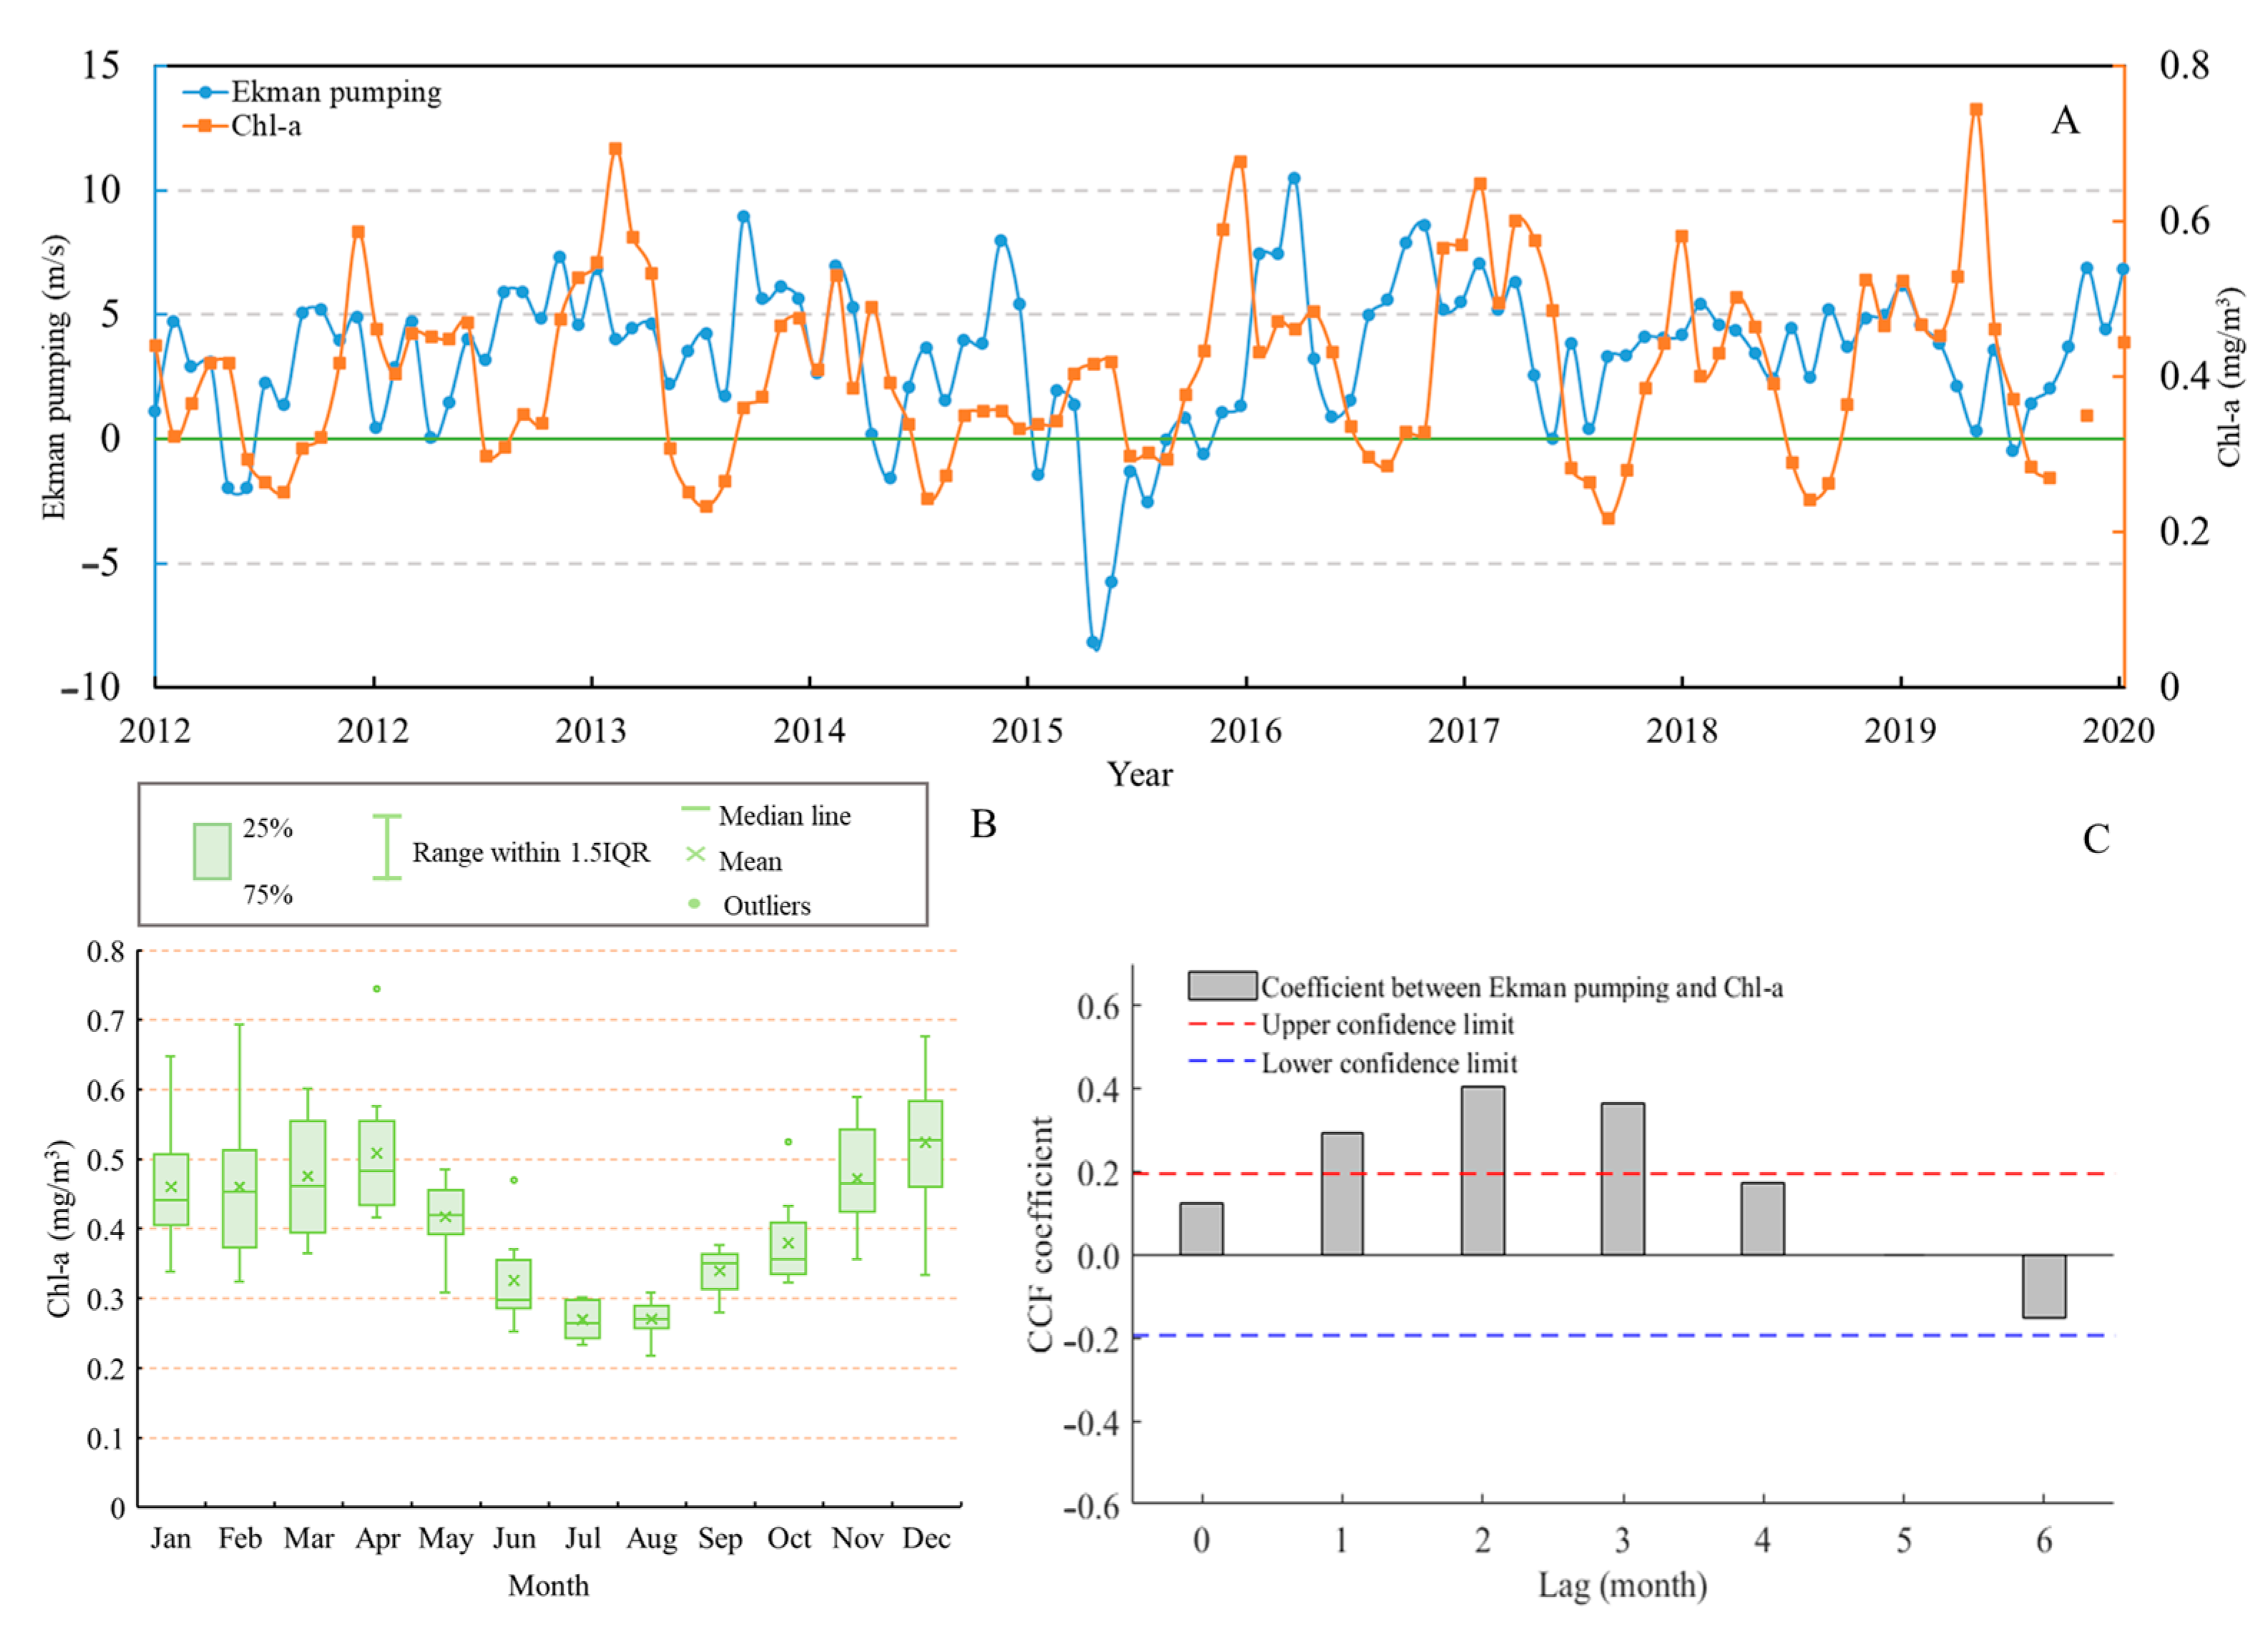
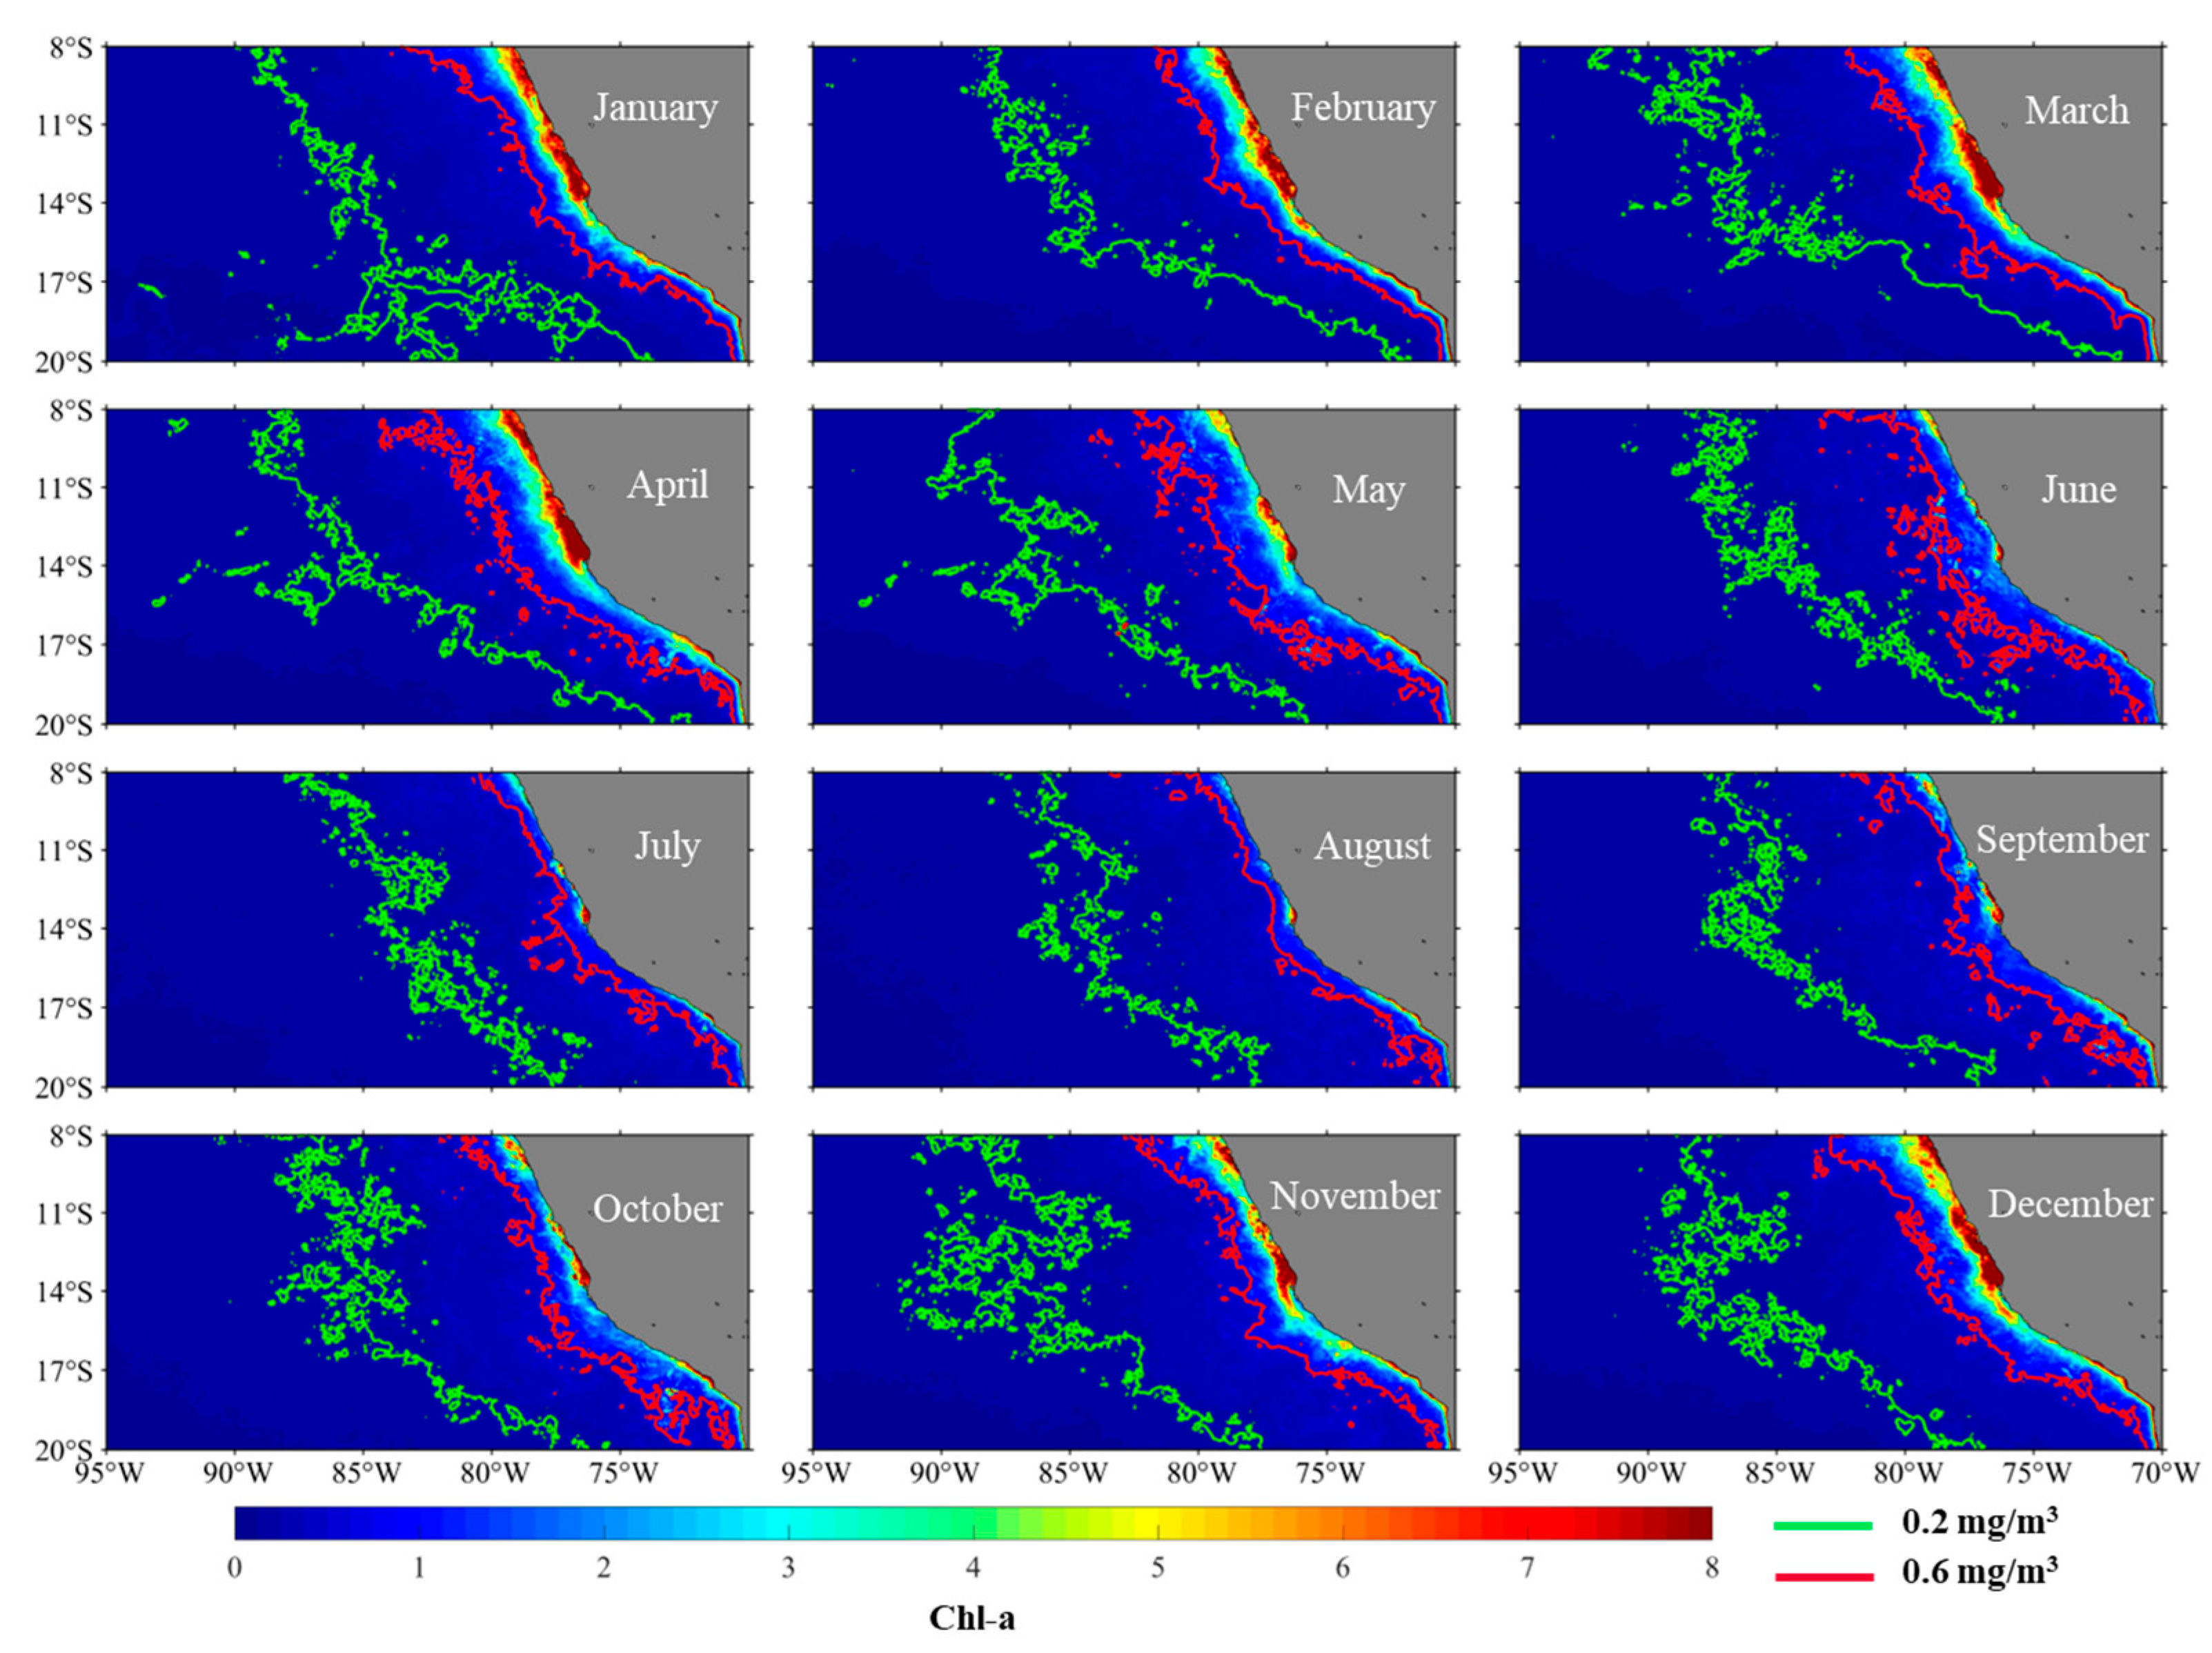
3.2. The Spatial Distribution Characteristics of Chl-a and Influence of Ekman Pumping on It

Figure 5 shows that the Chl-a concentration offshore of Peru exhibited small fluctuations from January to April, subsequently decreasing and then increasing, reaching its lowest in July and highest in December. To explore the distribution of Chl-a in coastal and offshore areas, 0.6 mg/m3 and 0.2 mg/m3 isopleths were selected, respectively. Figure 6 illustrates that the northern offshore Peru region exhibited higher Chl-a concentrations with a greater distance between the two isopleths, while the southern region showed significant monthly variations. The high Chl-a concentration area in the north was considerably broader than that in the south from January to April, and from April, the high Chl-a concentration area in the south gradually widened, while that in the north gradually moved coastward. From July to September, the high Chl-a concentration area in the central waters was somewhat broader than in the north, after which the high Chl-a concentration zone in the north remained broader than that in the south, with the width of the area in the south remaining consistent. The distribution of Chl-a in the coastal region resembled that of the offshore areas except during July and August, when the 0.6 mg/m3 coastal isopleth shifted noticeably closer to the shore. The cross-correlation analysis indicated that Chl-a had a positive correlation with Ekman pumping at a lag of two months, with the highest correlation coefficient being 0.42.

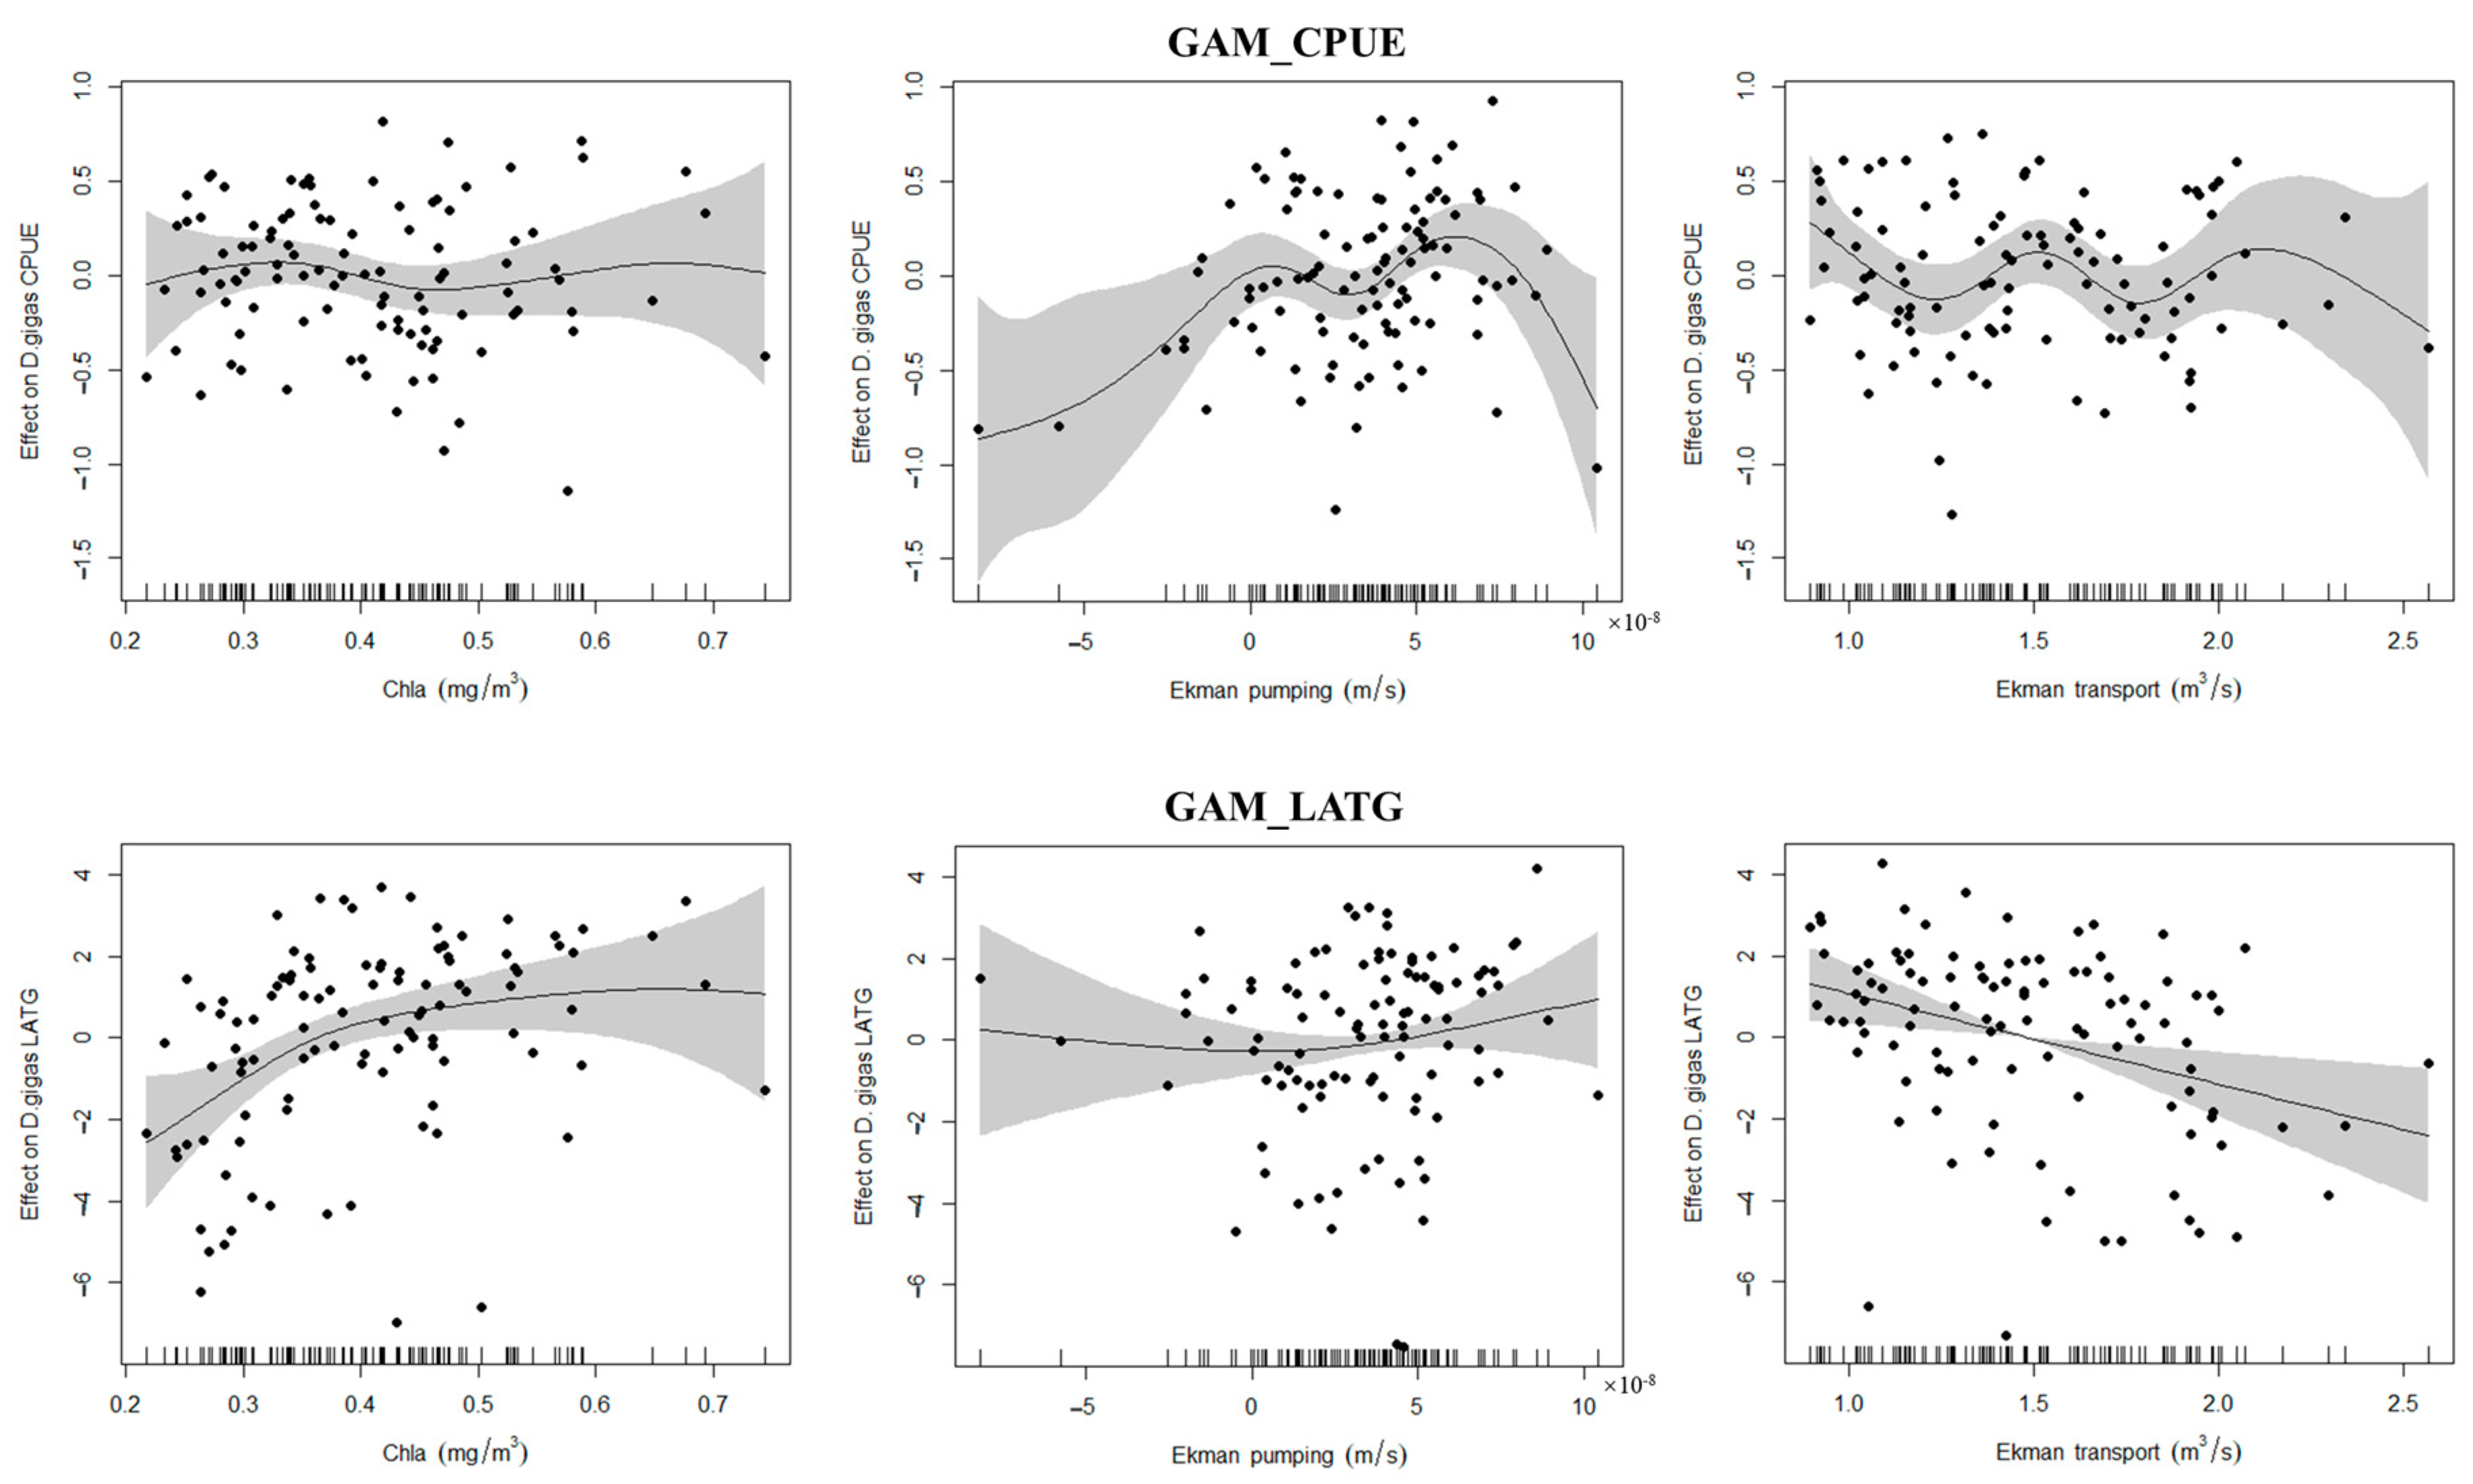
3.3. Relationship Between Ekman Pumping, Transport, and Chl-a on D. gigas CPUE and LATG

The results indicate that Ekman pumping had a significant impact on D. gigas CPUE (p < 0.01, Supplementary File: Table S2), while Ekman transport and Chl-a significantly affected the D. gigas LATG of (p < 0.01, Supplementary File: S3). Their nonlinear patterns were shown in Figure 7. For D. gigas CPUE, there was a trend of initially increasing and then gradually decreasing with the increase in Ekman pumping. The influence of Chl-a concentration on D. gigas LATG showed a clear positive nonlinear relationship, while Ekman transport had a distinct negative linear relationship with D. gigas LATG.

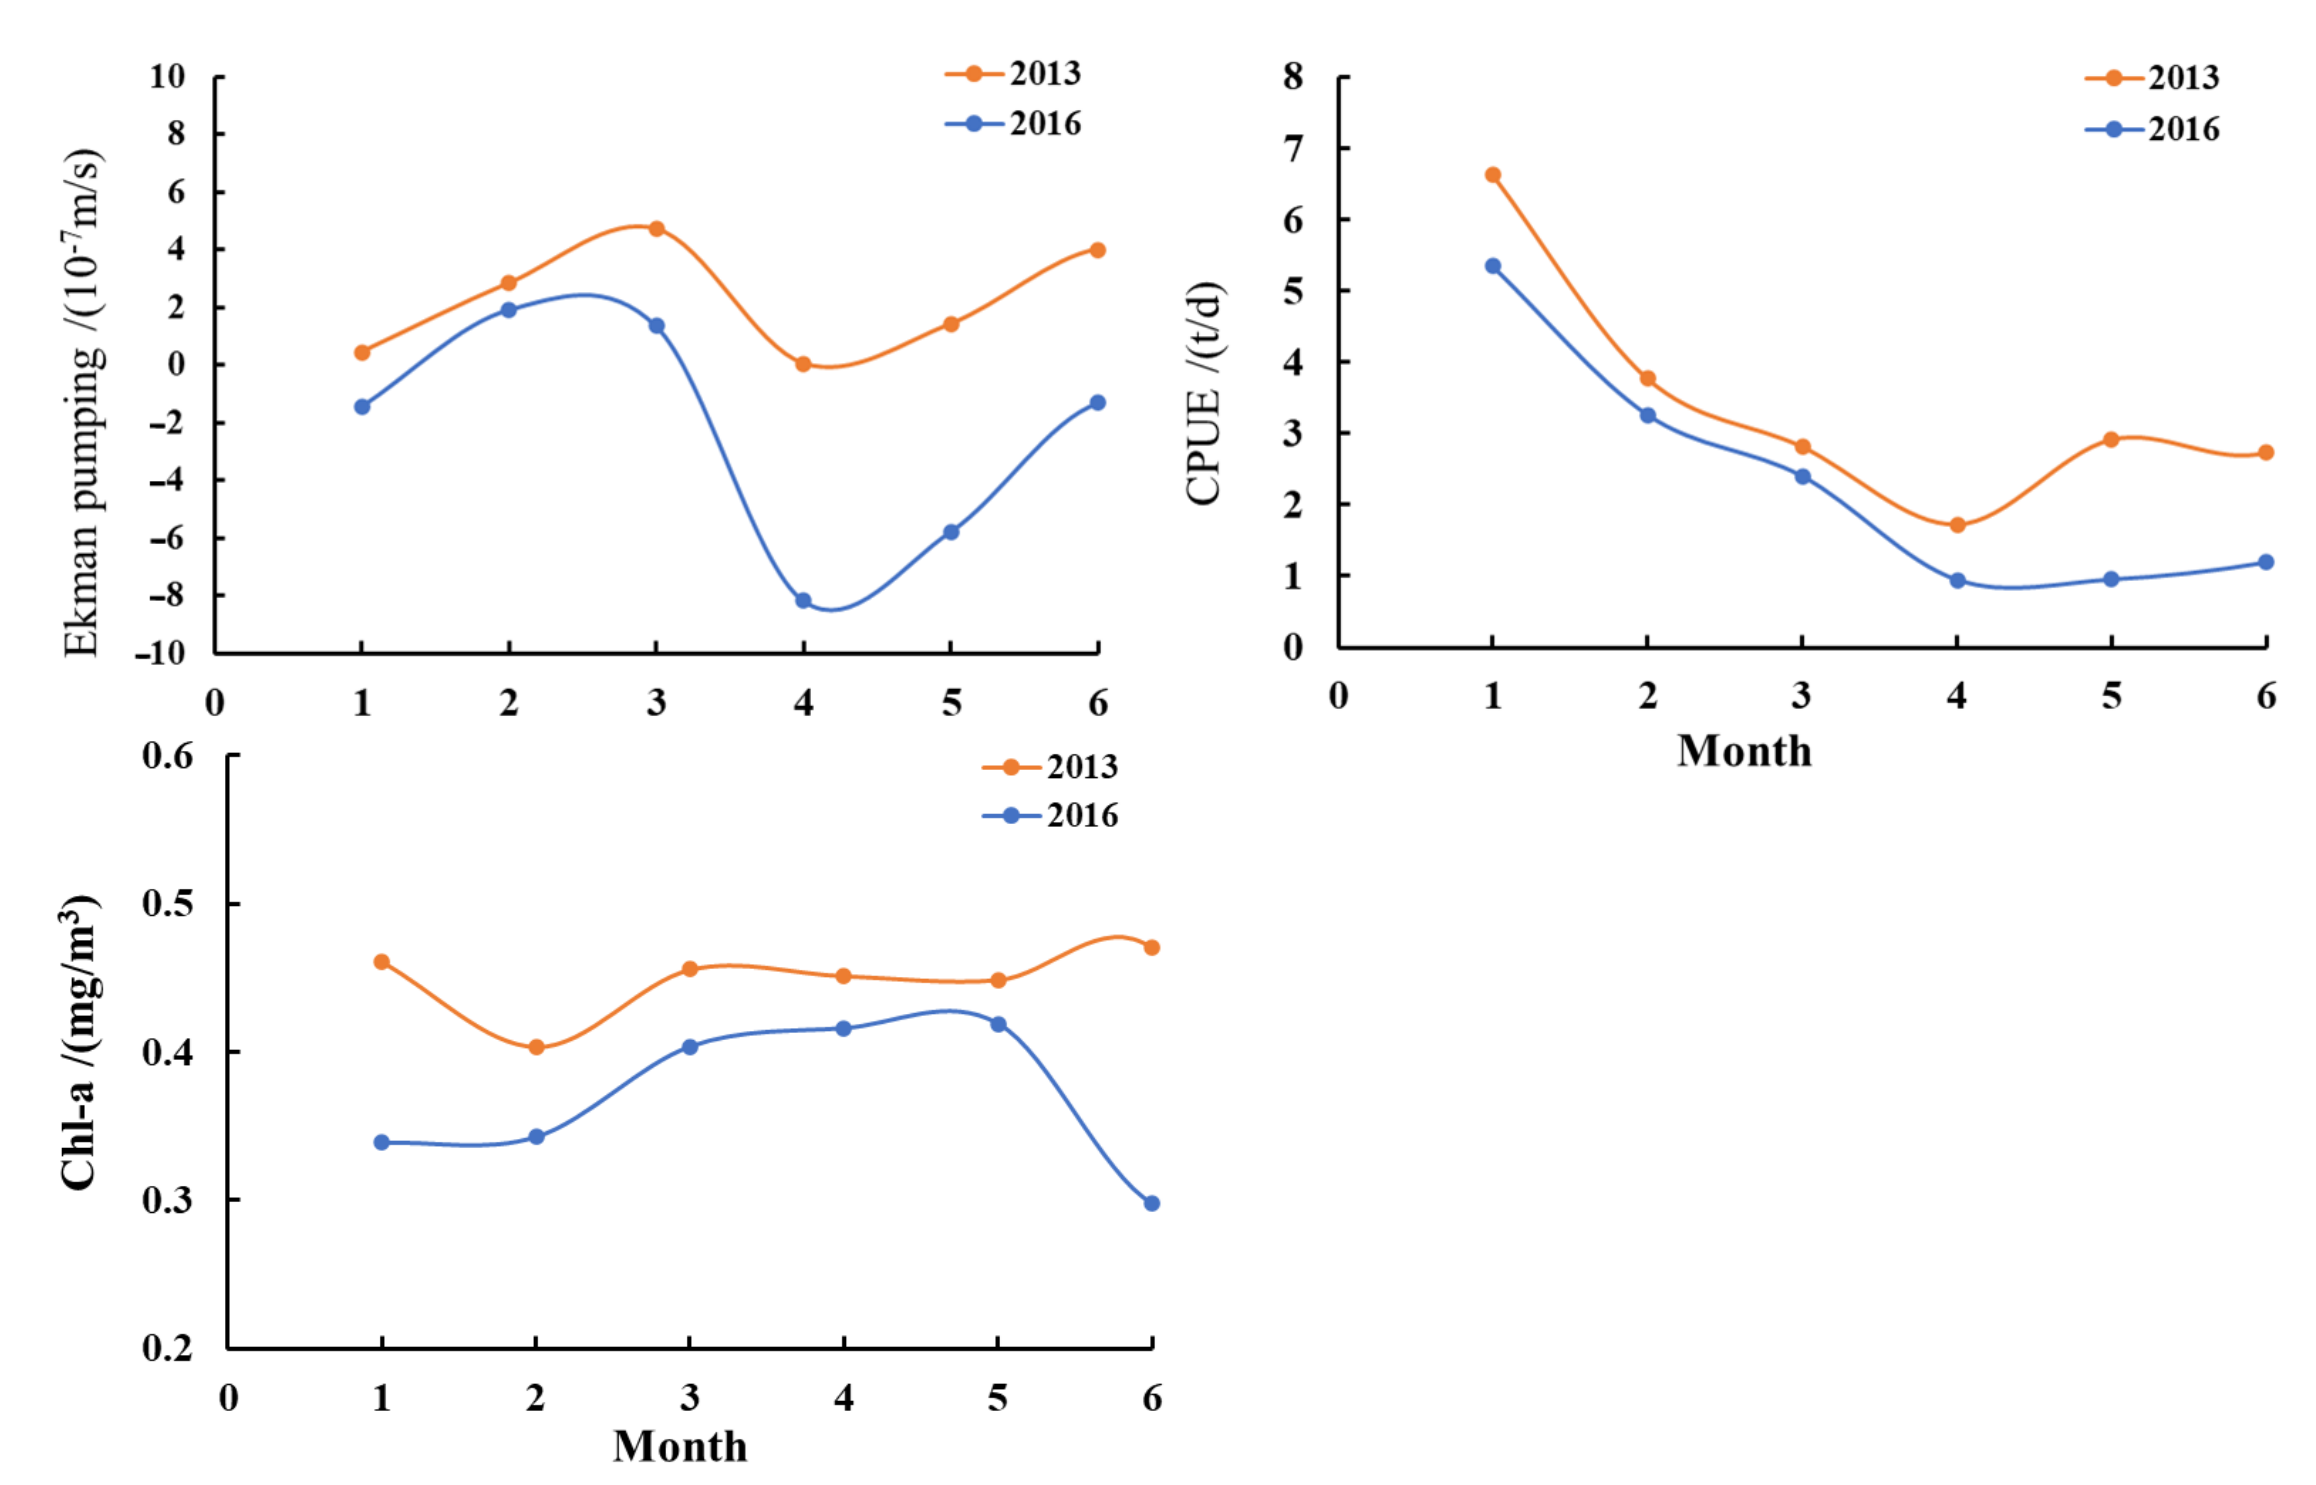
3.4. The Impact of El Niño on Ekman Pumping, Chl-a Concentration, and D. gigas CPUE

A comparison of Ekman pumping, Chl-a concentration, and D. gigas CPUE in the offshore waters of Peru between 2013 and 2016 (Figure 8) shows that all three parameters were greater in 2013. In April 2016, Ekman pumping decreased significantly compared to all other months, remaining lower than that in 2013 throughout. This may explain the sudden decline in Chl-a concentration in June 2016, which remained higher in 2013. Furthermore, D. gigas CPUE gradually increased in May and June, although the rate of increase was considerably higher in 2013 than in 2016. Therefore, it is speculated that the El Niño event weakened Ekman pumping in 2016, which, in turn, led to significant reductions in Chl-a concentration and D. gigas CPUE.

4. Discussion

Based on wind field and remote sensing satellite data, this article explores the monthly variations in spatial distribution of two hydrodynamic processes (Ekman transport and pumping) off the coast of Peru, with focus on the southern and year-round northern Peruvian upwelling subsystems [13]. The upwelling area (Ekman pumping) in northern Peru was significantly bigger than that in the south, with both Ekman transport and pumping exhibiting distinct monthly variability.
This article attempted to explain the variation patterns of D. gigas CPUE and LATG from a new perspective, specifically focusing on Ekman transport, pumping and Chl-a concentration. Cross-correlation analysis showed a significant positive correlation between Ekman pumping and D. gigas CPUE, while a significant negative correlation existed between Ekman transport and D. gigas LATG, with no lag effects observed. This indicates that, as a mesopelagic fish species, D. gigas appears to be highly sensitive, capable of promptly detecting changes in the two dynamic factors and responding accordingly. Furthermore, Chl-a exhibits a notable positive correlation with Ekman pumping with a two-month lag, and its distribution is also related to transport, collectively affecting D. gigas LATG. The results from the two GAM models reveal both linear and nonlinear relationships among them, indicating that Ekman pumping significantly influences D. gigas CPUE, while Ekman transport and Chl-a concentration significantly affect D. gigas LATG.

4.1. Analysis of Ekman Processes and Their Effects on the Physical Marine Environment

Upwelling transports cold, nutrient-rich deep water to the surface, resulting in low temperatures and high Chl-a concentrations, key physical characteristics of upwelling systems [10,14,16]. In northern Peruvian waters, which are influenced by the equatorial current system, subtropical surface water masses move southward during spring and summer, significantly affecting the temperature and salinity structures of the northern waters [43]. Additionally, the two Ekman processes offshore Peru exhibit distinct distribution patterns in different regions, where there is no correlation between SST and the seasonal variations in Ekman pumping in the north [44], indicating complex seasonality in SST in this region. Off the coast of Chile, upwelling intensity decreases with increasing latitude, and SST shows a strong negative correlation with upwelling intensity and wind stress [45,46]. Overall, there is a mismatch in the trend of temperature and upwelling intensity offshore Peru, and a similar description is also found along the southern coast of Java, which is another reason why the temperature is not included in this study [19,45,46].
Our results validate Halphern’s conclusion that the weakest upward pumping occurring in May and the strongest from February to March and from October to December [17]. If we only consider the dynamics near the coast, both Ekman pumping and transport exhibit similar responses, reaching maximum intensity in September, which is consistent with Véra Oerder’s results [47]. However, it is noteworthy that there was an obvious difference between the intensity and area of Ekman pumping; that is, when the intensity was high, the area was small, and when the intensity was low, the area was large. Additionally, the distribution pattern of Ekman pumping correlates with that described by Croquette et al. [43]. In contrast, our study area was extended westward to 95°W, with Ekman transport extending to approximately 93°W. This may be attributed to differences in the temporal scales of the two studies. Overall, upwelling off the coast of Peru is driven by both Ekman transport and pumping, and between April and August, as the upwelling distribution driven by pumping decreases, the effect of Ekman transport effectively compensates this. In summary, the synergistic interaction of these two mechanisms sustains the persistent and robust upwelling phenomenon off the coast of Peru.
Conversely, Gutiérrez et al. observed a strong negative correlation between Chl-a concentration and wind stress, and Chl-a concentration had a positive correlation with temperature off the Peruvian coast [14]. Coastal negative wind stress curl (Ekman pumping) can generate strong upwelling, significantly impacting coastal circulation and primary productivity [16]. Our findings indicate that both Ekman pumping and transport significantly influence Chl-a distribution off the Peruvian coast, where Ekman-induced upwelling correlates with the distribution of high Chl-a concentration areas in the north. In central and southern waters (15°–18° S), regions with high Chl-a concentration expanded offshore between April and September; however, no corresponding increase in upwelling area associated with Ekman pumping was observed, while Ekman transport consistently increased. Additionally, the 0.6 mg/m3 Chl-a concentration contour in nearshore waters shifted closer to the coast, indicating that Ekman pumping contributes significantly to upwelling formation in northern Peru. In central and southern regions, when Ekman pumping was weak, strong Ekman transport pushed nearshore high-Chl-a waters offshore, resulting in increased offshore Chl-a concentration, supporting the hypothesis of Wirasatriya et al. Meanwhile, strong Ekman transport limits Chl-a concentrations nearshore. We also demonstrate a significant positive correlation between Chl-a concentration and Ekman pumping with a two-month lag, consistent with Gutiérrez et al.
El Niño events are known to significantly impact Ekman hydrodynamic processes off the coast of Peru. During the strong El Niño event of 1998–1999 [17], Ekman transport off the Peruvian coast was enhanced, while Ekman pumping shifted, resulting in pronounced downwelling and, thus, a deeper thermocline and a significant increase in SST. We compared Ekman pumping and Chl-a concentration off the Peruvian coast in 2013 and 2016, revealing that El Niño events can significantly reduce the intensity of Ekman pumping (leading to downwelling), consequently reducing Chl-a concentration.

4.2. The Effects of Ekman Processes on the D. gigas CPUE and LATG

The results of this study indicate a significant positive correlation between the CPUE of D. gigas and Ekman pumping, and a significant negative correlation between Ekman transport and the LATG of D. gigas, with no observed lag effects. The area of upwelling increases which means the regions and abundance of prey organisms are gradually increased, allowing D. gigas to consume sufficient prey in a timely manner and leading to a gradual increase in CPUE. This indicates that under the influence of upwelling, D. gigas can directly access the existing prey in the current ecosystem, demonstrating strong sensitivity to Ekman pumping and quickly responding with feeding behavior. The GAM model showed that as the intensity of Ekman pumping gradually increases, the abundance of D. gigas CPUE also gradually rises. However, when the wind field strengthens to a certain extent, it can cause stronger pumping, which is detrimental to D. gigas feeding activities, leading to the dispersion of fishing grounds and a decrease in CPUE.
Our results suggested that the north–south migration of D. gigas offshore Peru may be driven by changes in pumping concentration in the south because, between January and March, when Ekman transport was relatively weak, D. gigas was primarily found in the south where Chl-a concentrations were low. During this time, the Chl-a concentration in the north was higher, causing D. gigas to migrate northward. When Ekman transport intensifies off the Peruvian coast, central and south nearshore areas with high Chl-a concentrations are transported westward, resulting in a larger distance between Chl-a concentration contours in the central region compared to the north (August and September). Additionally, Chl-a concentrations in the south also gradually increased. As competition for food is high in the north, D. gigas migrates to the central and southern waters. Although Chl-a concentration and Ekman pumping, with a two-month lag, are correlated, Ekman transport regulates Chl-a distribution offshore Peru, thereby influencing the spatial distribution of D. gigas. The GAM model further confirms the above viewpoint, that is, when the Ekman transport is enhanced, it will drive the chlorophyll distribution in the southern sea area, and the latitude center of gravity gradually shifts southward. The north–south migration of D. gigas is closely related to its life history stages, such as growth, development, and reproduction [29,30,31]. Additionally, this migration is also influenced by the oceanic environment such as SST, sea surface salinity, net primary productivity, and photosynthetically active radiation [30]. During the El Niño period, the decrease in the intensity of Ekman pumping leaded to a decline in the abundance of prey organisms, resulting in a lower D. gigas CPUE. We recommend reducing fishing activities during this period to ensure the sustainable use of species. Additionally, attention should be paid to the changes in Ekman pumping and transport to better predict the abundance and location of squid fishing grounds.

4.3. Effects of Upwelling on Other Marine Organisms

Ekman transport and pumping also have the same effect to other marine organisms. For example, Escribano et al. used Ekman transport as an indicator of upwelling intensity and found it had a positive correlation with zooplankton biomass in northern Chilean waters. Furthermore, increased upwelling intensity in southern Chile lowers coastal water temperatures, increases acidity, and reduces oxygen levels, thereby affecting the habitat of the Peruvian scallop (Argopecten purpuratus), which adapts to such environmental changes through physiological regulation [48]. In the CCS, variation in upwelling driven by Ekman pumping correlated with variation in Pacific sardine (Sardinops sagax) stock recruitment, in contrast to upwelling caused by Ekman transport [11]. Rykaczewski et al. also highlighted a significant positive correlation between Ekman pumping-induced upwelling and Chl-a concentration at 10 m depth and at the nutricline depth (depth where nitrate concentration exceeds 1.0 μmol/L) [11].

5. Conclusions

This study examined the spatiotemporal distribution of Ekman processes off the coast of Peru and their impact on the distribution of Chl-a. Additionally, the study explored how upwelling mechanisms off the Peruvian coast affect the distribution and abundance of D. gigas, a large economically important species. The results demonstrate that Ekman processes significantly influence the abundance and distribution of D. gigas, as well as Chl-a concentration. Ekman pumping shows variation that correlates with D. gigas CPUE variations, while Ekman transport affects its spatial distribution. According to the Ekman theory, both Ekman processes generate upwelling. Based on the GAM model, this study explored the impacts of these processes on the distribution of D. gigas and Chl-a by considering the unique physical characteristics of pumping and transport independently. Given the complexity of temperature variations off the Peruvian coast, the study did not investigate the mechanisms by which these Ekman processes influence temperature.
As an important species in the Peruvian waters, previous studies may have focused too much on predicting habitats based on marine environmental factors and attempting to predict long-term changes based on climate change at different scales. We provide a scientific basis for optimizing fishing strategies and implementing sustainable resource management by explaining the distribution pattern of D. gigas resources from a new perspective. For convenience, this study utilized a detailed wind field dataset with a relatively low resolution; however, it has been suggested that differences in wind data sources and resolution sizes can significantly affect upwelling analyses [42,46]. Therefore, future research should incorporate more precise, higher-resolution satellite and field observation data, combined with physical oceanography-biogeochemistry models, to comprehensively analyze the mechanisms of upwelling formation, spatial distribution characteristics, and their impacts on marine ecosystems and important fisheries species.

Supplementary Materials

The following supporting information can be downloaded at: https://www.mdpi.com/article/10.3390/jmse13020280/s1, Figure S1: Combined figures of GAM_CPUE model diagnostics; Figure S2: Combined figures of GAM_LATG model diagnostics; Table S1: Results of Variance Analysis in factors ; Table S2: GAM_CPUE evaluates the significance of environmental factors, with a cumulative explanatory rate of 32%; Table S3: GAM_CPUE evaluates the significance of environmental factors, with a cumulative explanatory rate of 38%.

Author Contributions

Conceptualization, X.F. and W.Y.; methodology, X.F., X.Z., and W.Y.; soft-ware, X.F. and W.Y.; writing—original draft preparation, X.F. and W.Y; writing—review and editing, W.Y.; funding acquisition, X.C. and W.Y. All authors have read and agreed to the published version of the manuscript.

Funding

This study was financially supported by the 2024 International Cooperation Seed Funding Project for China’s Ocean Decade Actions (GHZZ3702840002024020000024), National Key R&D Program of China (2023YFD0901405), Natural Science Foundation of Shanghai (23ZR1427100), and the Shanghai talent development funding (2021078).

Institutional Review Board Statement

Not applicable.

Informed Consent Statement

Not applicable.

Data Availability Statement

The fishery data that support the findings of this study are not available for sharing at the request of the copyright holder. The environmental factor (Chl-a) data used in this study are available from International Pacific Research Center and the University of Hawaii. Users can download these data from online services: http://apdrc.soest.hawaii.edu/las/v6/constrain?var=13002 (accessed on 19 January 2025). Wind field data at 10 meters above sea level were provided by the NOAA (National Oceanic and Atmospheric Administration) Coast Watch ERDDAP database (https://coastwatch.pfeg.noaa.gov/erddap/griddap/erdlasFnWind10.html (accessed on 19 January 2025). Ocean Niño Index (ONI) data, which use sea surface temperature anomalies in the Niño 3.4 region, were provided by the NOAA Climate Prediction Center (https://origin.cpc.ncep.noaa.gov/products/analysis_monitoring/ensostuff/ONI_v5.php (accessed on 19 January 2025)).

Acknowledgments

We thank the vessel crews and scientists involved in collecting fishery data and environmental data which were supported by the International Pacific Research Center, the University of Hawaii, and National Oceanic and Atmospheric Administration.

Conflicts of Interest

The authors declare that they have no known competing financial interests or personal relationships that could have appeared to influence the work reported in this paper.

References

  1. Seo, H.; O’Neill, L.W.; Bourassa, M.A.; Czaja, A.; Drushka, K.; Edson, J.B.; Fox-Kemper, B.; Frenger, I.; Gille, S.T.; Kirtman, B.P.; et al. Ocean mesoscale and frontal-scale ocean–atmosphere interactions and influence on large-scale climate: A review. J. Clim. 2023, 36, 1981–2013. [Google Scholar] [CrossRef]
  2. Mahadevan, A. The impact of submesoscale physics on primary productivity of plankton. Annu. Rev. Mar. Sci. 2016, 8, 161–184. [Google Scholar] [CrossRef]
  3. McGillicuddy, D.J. Mechanisms of physical-biological-biogeochemical interaction at the oceanic mesoscale. Annu. Rev. Mar. Sci. 2016, 8, 125–159. [Google Scholar] [CrossRef]
  4. McGillicuddy, D.J.; Anderson, L.A.; Bates, N.R.; Bibby, T.; Buesseler, K.O.; Carlson, C.A.; Davis, C.S.; Falkowski, P.G.; Ewart, C.; Goldthwait, S.A.; et al. Eddy/Wind Interactions Stimulate Extraordinary Mid-Ocean Plankton Blooms. Deep-Sea Res. 2003, 1, 829. [Google Scholar] [CrossRef]
  5. Muñoz, R.; Vergara, O.A.; Figueroa, P.A.; Mardones, P.; Sobarzo, M.; Saldías, G.S. On the phenology of coastal upwelling off central-southern Chile. Dyn. Atmos. Ocean. 2023, 104, 101405. [Google Scholar] [CrossRef]
  6. Rossi, V.; Lopez, C.; Hernández-García, E.; Sudre, J.; Garçon, V.; Morel, Y. Surface mixing and biological activity in the four Eastern Boundary Upwelling Systems. Nonlinear Process. Geophys. 2009, 16, 557–568. [Google Scholar] [CrossRef]
  7. Chang, P.; Xu, G.; Kurian, J.; Small, R.; Danabasoglu, G.; Yeager, S.G.; Castruccio, F.S.; Zhang, Q.; Rosenbloom, N.A.; Chapman, P. Uncertain future of sustainable fisheries environment in eastern boundary upwelling zones under climate change. Commun. Earth Environ. 2023, 4, 19. [Google Scholar] [CrossRef]
  8. Chavez, F.P.; Messié, M. A comparison of eastern boundary upwelling ecosystems. Prog. Oceanogr. 2009, 83, 80–96. [Google Scholar] [CrossRef]
  9. Bograd, S.J.; Jacox, M.G.; Hazen, E.L.; Lovecchio, E.; Montes, I.; Pozo Buil, M.; Rykaczewski, R.R. Climate change impacts on eastern boundary upwelling systems. Annu. Rev. Mar. Sci. 2023, 15, 303–328. [Google Scholar] [CrossRef]
  10. Fréon, P.; Barange, M.; Arístegui, J. Eastern boundary upwelling ecosystems: Integrative and comparative approaches. Prog. Oceanogr. 2009, 83, 1–14. [Google Scholar] [CrossRef]
  11. Rykaczewski, R.R.; Checkley, D.M. Influence of ocean winds on the pelagic ecosystem in upwelling regions. Proc. Natl. Acad. Sci. USA 2008, 105, 1965–1970. [Google Scholar] [CrossRef] [PubMed]
  12. Cury, P.; Bakun, A.; Crawford, R.J.M.; Jarre, A.; Quinones, R.A.; Shannon, L.J.; Verheye, H.M. Small pelagics in upwelling systems: Patterns of interaction and structural changes in “wasp-waist” ecosystems. ICES J. Mar. Sci. 2000, 57, 603–618. [Google Scholar] [CrossRef]
  13. Montecino, V.; Lange, C.B. The Humboldt Current System: Ecosystem components and processes, fisheries, and sediment studies. Prog. Oceanogr. 2009, 83, 65–79. [Google Scholar] [CrossRef]
  14. Gutiérrez, D.; Akester, M.; Naranjo, L. Productivity and sustainable management of the Humboldt current large marine ecosystem under climate change. Environ. Dev. 2016, 17, 126–144. [Google Scholar] [CrossRef]
  15. Garteizgogeascoa, M.; Kluger, L.C.; Gonzales, I.E.; Damonte, G.; Flitner, M. Contextualizing scenarios to explore social-ecological futures: A three step participatory case study for the humboldt current upwelling system. Front. Mar. Sci. 2020, 7, 557181. [Google Scholar] [CrossRef]
  16. Albert, A.; Echevin, V.; Lévy, M.; Aumont, O. Impact of nearshore wind stress curl on coastal circulation and primary productivity in the Peru upwelling system. J. Geophys. Res. Ocean. 2010, 115(C12), C12033. [Google Scholar] [CrossRef]
  17. Halpern, D. Offshore Ekman transport and Ekman pumping off Peru during the 1997–1998 El Nino. Geophys. Res. Lett. 2002, 29, 19-1–19-4. [Google Scholar] [CrossRef]
  18. Pickett, M.H.; Paduan, J.D. Ekman transport and pumping in the California Current based on the US Navy’s high-resolution atmospheric model (COAMPS). J. Geophys. Res. Ocean. 2003, 108, 3327. [Google Scholar] [CrossRef]
  19. Wirasatriya, A.; Setiawan, J.; Sugianto, D.; Rosyadi, I.; Haryadi, H.; Winarso, G.; Setiawan, R.; Susanto, R. Ekman dynamics variability along the southern coast of Java revealed by satellite data. Int. J. Remote Sens. 2020, 41, 8475–8496. [Google Scholar] [CrossRef]
  20. Jacox, M.G.; Edwards, C.A.; Hazen, E.L.; Bograd, S.J. Coastal upwelling revisited: Ekman, Bakun, and improved upwelling indices for the US West Coast. J. Geophys. Res. Ocean. 2018, 123, 7332–7350. [Google Scholar] [CrossRef]
  21. Combes, V.C.F.D.L.E.; Chenillat, F.; Di Lorenzo, E.; Rivière, P.; Ohman, M.D.; Bograd, S.J. Cross-shore transport variability in the California Current: Ekman upwelling vs. eddy dynamics. Prog. Oceanogr. 2013, 109, 78–89. [Google Scholar] [CrossRef]
  22. Sachin, T.S.; Rasheed, K. Dynamics and forcing mechanisms of upwelling along the south eastern Arabian sea during south west monsoon. Reg. Stud. Mar. Sci. 2020, 40, 101519. [Google Scholar] [CrossRef]
  23. Kumar, J.; Ratheesh, S.; Agarwal, N.; Sharma, R. Study of upwelling and mixing process in the Somali coastal region using satellite and numerical model observations: A Lagrangian approach. Deep. Sea Res. Part II Top. Stud. Oceanogr. 2024, 216, 105381. [Google Scholar] [CrossRef]
  24. Simanjuntak, F.; Lin, T.H. Monsoon effects on chlorophyll-a, sea surface temperature, and ekman dynamics variability along the southern coast of lesser Sunda islands and its relation to ENSO and IOD based on satellite observations. Remote Sens. 2022, 14, 1682. [Google Scholar] [CrossRef]
  25. Belmadani, A.; Echevin, V.; Codron, F.; Takahashi, K.; Junquas, C. What dynamics drive future wind scenarios for coastal upwelling off Peru and Chile? Clim. Dyn. 2014, 43, 1893–1914. [Google Scholar] [CrossRef]
  26. Wu, X.C.; Jin, P.C.; Zhang, Y.; Yu, W. Spatial Distribution and Abundance of a Pelagic Squid during the Evolution of Eddies in the Southeast Pacific Ocean. J. Mar. Sci. Eng. 2024, 12, 1015. [Google Scholar] [CrossRef]
  27. Nigmatullin, C.M.; Nesis, K.N.; Arkhipkin, A.I. A review of the biology of the jumbo squid Dosidicus gigas (Cephalopoda: Ommastrephidae). Fish. Res. 2001, 54, 9–19. [Google Scholar] [CrossRef]
  28. Yu, W.; Chen, X.J. Ocean warming-induced range-shifting of potential habitat for jumbo flying squid Dosidicus gigas in the southeast pacific ocean off peru. Fish. Res. 2018, 204, 137–146. [Google Scholar] [CrossRef]
  29. Yu, W.; Yi, Q.; Chen, X.J.; Chen, Y. Modelling the effects of climate variability on habitat suitability of jumbo flying squid, Dosidicus gigas, in the Southeast Pacific Ocean off Peru. ICES J. Mar. Sci. 2016, 73, 239–249. [Google Scholar] [CrossRef]
  30. Fang, X.N.; Zhang, Y.; Yu, W.; Chen, X.J. Geographical distribution variations of Humboldt squid habitat in the Eastern Pacific Ocean. Ecosyst. Health Sustain. 2023, 9, 0010. [Google Scholar] [CrossRef]
  31. Anderson, C.I.H.; Rodhouse, P.G. Life cycles, oceanography and variability: Ommastrephid squid in variable oceanographic environments. Fish. Res. 2001, 54, 133–143. [Google Scholar] [CrossRef]
  32. Wu, X.C.; Jin, P.C.; Zhang, Y.; Yu, W. Changing Humboldt Squid Abundance and Distribution at Different Stages of Oceanic Mesoscale Eddies. J. Mar. Sci. Eng. 2024, 12, 626. [Google Scholar] [CrossRef]
  33. Jin, P.C.; Fan, J.T.; Wu, X.C.; Du, Y.L.; Yu, W. Jumbo flying squid distribution within anticyclonic eddies under anomalous climatic conditions. Ecosyst. Health Sustain. 2024, 10, 0177. [Google Scholar] [CrossRef]
  34. Fang, X.N.; Yu, W.; Chen, X.J.; Zhang, Y. Response of abundance and distribution of Humboldt squid (Dosidicus gigas) to short-Lived eddies in the eastern equatorial Pacific Ocean from April to June 2017. Front. Mar. Sci. 2021, 8, 721291. [Google Scholar] [CrossRef]
  35. Tiedemann, M.; Brehmer, P. Larval fish assemblages across an upwelling front: Indication for active and passive retention. Estuar. Coast. Shelf Sci. 2017, 187, 118–133. [Google Scholar] [CrossRef]
  36. Sato, M.; Barth, J.A.; Benoit-Bird, K.J.; Pierce, S.D.; Cowles, T.J.; Brodeur, R.D.; Peterson, W.T. Coastal upwelling fronts as a boundary for planktivorous fish distributions. Mar. Ecol. Prog. Ser. 2018, 595, 171–186. [Google Scholar] [CrossRef]
  37. Reese, D.C.; O’Malley, R.T.; Brodeur, R.D.; Churnside, J.H. Epipelagic fish distributions in relation to thermal fronts in a coastal upwelling system using high-resolution remote-sensing techniques. ICES J. Mar. Sci. 2011, 68, 1865–1874. [Google Scholar] [CrossRef]
  38. Subarna, D. The effect of monsoon variability on fish landing in the Sadeng Fishing Port of Yogyakarta, Indonesia. IOP Conf. Ser. Earth Environ. Sci. 2018, 139, 012027. [Google Scholar] [CrossRef]
  39. Villanoy, C.L.; Cabrera, O.C.; Yniguez, A.; Camoying, M.; de Guzman, A.; David, L.T.; Flament, P. Monsoon-driven coastal upwelling off Zamboanga Peninsula, Philippines. Oceanography 2011, 24, 156–165. [Google Scholar] [CrossRef]
  40. Menon, N.N.; Sankar, S.; Smitha, A.; George, G.; Shalin, S.; Sathyendranath, S.; Platt, T. Satellite chlorophyll concentration as an aid to understanding the dynamics of Indian oil sardine in the southeastern Arabian Sea. Mar. Ecol. Prog. Ser. 2019, 617, 137–147. [Google Scholar] [CrossRef]
  41. Van Der Sleen, P.; Rykaczewski, R.R.; Turley, B.D.; Sydeman, W.J.; García-Reyes, M.; Bograd, S.J.; Van Der Lingen, C.D.; Coetzee, J.C.; Lamont, T.; Black, B.A. Non-stationary responses in anchovy (Engraulis encrasicolus) recruitment to coastal upwelling in the Southern Benguela. Mar. Ecol. Prog. Ser. 2018, 596, 155–164. [Google Scholar] [CrossRef]
  42. Sonderblohm, C.P.; Pereira, J.S.; Erzini, K. Environmental and fishery-driven dynamics of the common octopus (Octopus vulgaris) based on time-series analyses from leeward Algarve, southern Portugal. ICES J. Mar. Sci. 2014, 71, 2231–2241. [Google Scholar] [CrossRef]
  43. Echevin, V.; Puillat, I.; Grados, C.; Dewitte, B. Seasonal and mesoscale variability in the Peru upwelling system from in situ data during the years 2000 to 2004. Gayana 2004, 68, 167–173. [Google Scholar] [CrossRef]
  44. Croquette, M.; Eldin, G.; Echevin, V. On the contributions of Ekman transport and pumping to the dynamics of coastal upwelling in the South-East Pacific. Gayana 2004, 68, 136–141. [Google Scholar] [CrossRef]
  45. Aravena, G.; Broitman, B.; Stenseth, N.C. Twelve years of change in coastal upwelling along the central-northern coast of Chile: Spatially heterogeneous responses to climatic variability. PLoS ONE 2014, 9, e90276. [Google Scholar] [CrossRef]
  46. Escribano, R.; Hidalgo, P.; Fuentes, M.; Donoso, K. Zooplankton time series in the coastal zone off Chile: Variation in upwelling and responses of the copepod community. Prog. Oceanogr. 2012, 97, 174–186. [Google Scholar] [CrossRef]
  47. Oerder, V.; Colas, F.; Echevin, V.; Codron, F.; Tam, J.; Belmadani, A. Peru-chile upwelling dynamics under climate change. J. Geophys. Res. Ocean. 2015, 120, 1152–1172. [Google Scholar] [CrossRef]
  48. Ramajo, L.; Valladares, M.; Astudillo, O.; Fernández, C.; Rodríguez-Navarro, A.B.; Watt-Arévalo, P.; Núñez, M.; Grenier, C.; Román, R.; Aguayo, P.; et al. Upwelling intensity modulates the fitness and physiological performance of coastal species: Implications for the aquaculture of the scallop Argopecten purpuratus in the Humboldt Current System. Sci. Total Environ. 2020, 745, 140949. [Google Scholar] [CrossRef] [PubMed]
Figure 1. The monthly variations in Ekman transport and pumping and D. gigas CPUE and LATG off the coast of Peru. It is important to note that both transport and pumping are vector data. In the Southern Hemisphere, negative transport values indicate westward transport, while positive pumping values signify upward water movement, forming upwelling currents; negative values, on the other hand, indicate downwelling currents.
Jmse 13 00280 g001
Figure 2. The spatial distribution of Ekman pumping off the coast of Peru. Only positive values (upwelling) were retained and logarithmically transformed.
Jmse 13 00280 g002
Figure 3. The spatial distribution of Ekman transport off the coast of Peru, with the fishing locations overlaid.
Jmse 13 00280 g003
Figure 4. (A): Monthly variations in Ekman pumping and D. gigas CPUE from 2012 to 2020. (B): Monthly variations in Ekman transport intensity and D. gigas LATG from 2012 to 2020. (C): Cross-correlation coefficient between Ekman pumping and D. gigas CPUE. (D): Cross-correlation coefficient between Ekman transport and D. gigas LATG.
Jmse 13 00280 g004
Figure 5. (A): The monthly variations in Ekman pumping and offshore Chl-a concentration from 2012 to 2020. (B): The monthly variations in Chl-a concentration off the coast of Peru. (C): Cross-correlation coefficient between Ekman pumping and Chl-a concentration.
Jmse 13 00280 g005
Figure 6. The spatial distribution of Chl-a concentration off the coast of Peru, with the 0.2 and 0.6 mg/m3 isopleths overlaid.
Jmse 13 00280 g006
Figure 7. Relationship between Ekman pumping, transport, and Chl-a and effect on D. gigas CPUE and LATG.
Jmse 13 00280 g007
Figure 8. The monthly variation in Ekman pumping, Chl-a concentration, and D. gigas CPUE off Peru from January to June in 2013 and 2016.
Jmse 13 00280 g008
Disclaimer/Publisher’s Note: The statements, opinions and data contained in all publications are solely those of the individual author(s) and contributor(s) and not of MDPI and/or the editor(s). MDPI and/or the editor(s) disclaim responsibility for any injury to people or property resulting from any ideas, methods, instructions or products referred to in the content.

