

Innovations in Wave Energy: A Case Study of TALOS-WEC’s Multi-Axis Technology


Abstract
1. Introduction
2. Work Packages (WPs)
3. WP1: Concept Development
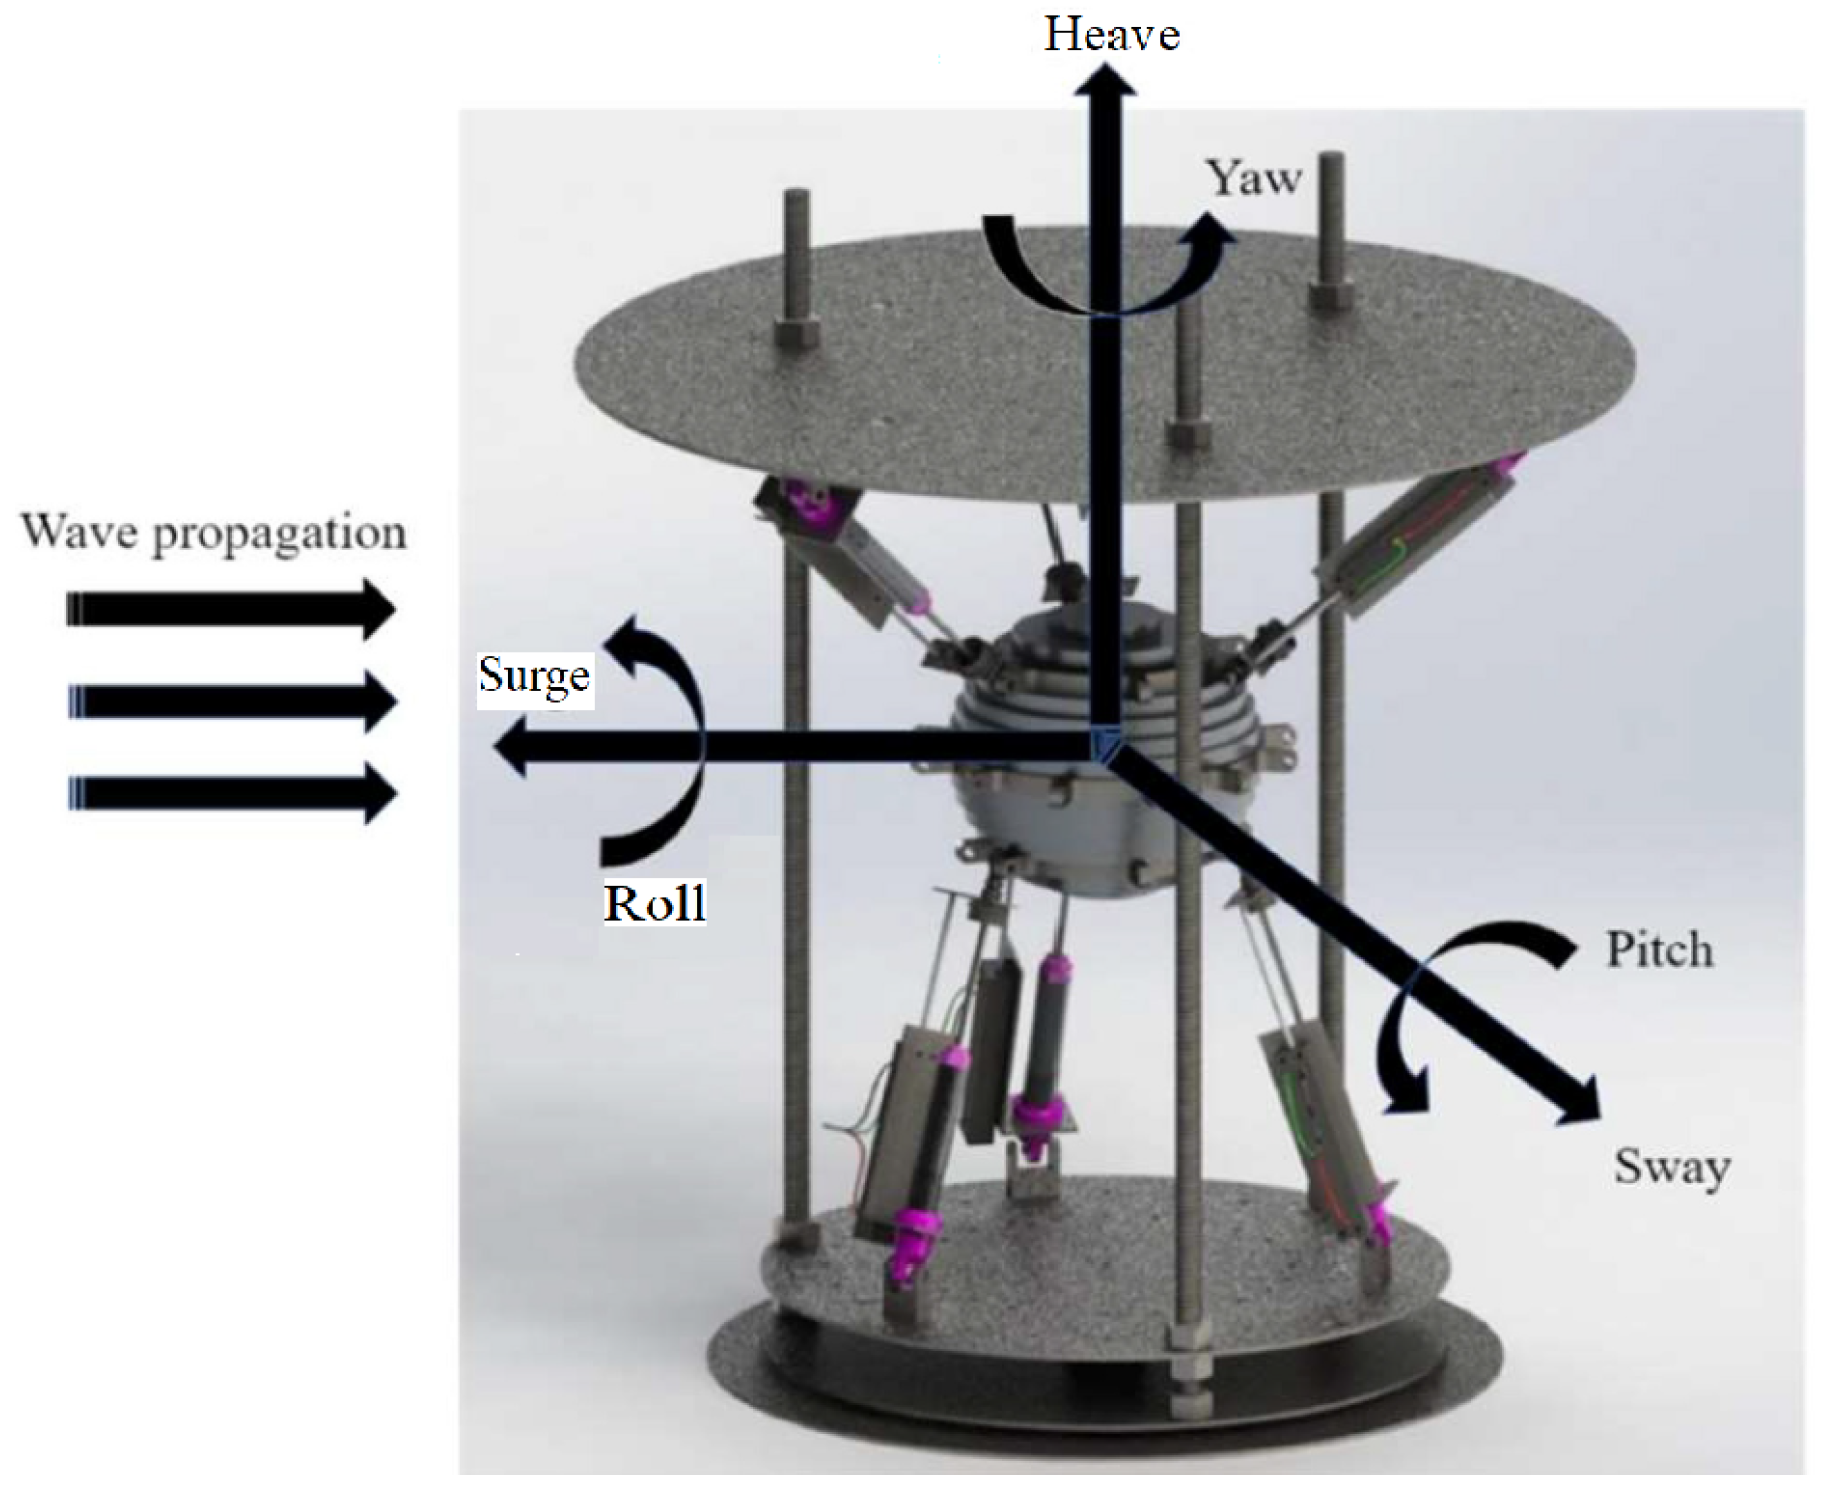
3.1. WP1.1—Experimental and Numerical Hydrodynamics
3.1.1. Hydrodynamic Modelling Framework
- Governing equations
- Hydrodynamic coefficients
- Frequency-domain and time-domain analyses
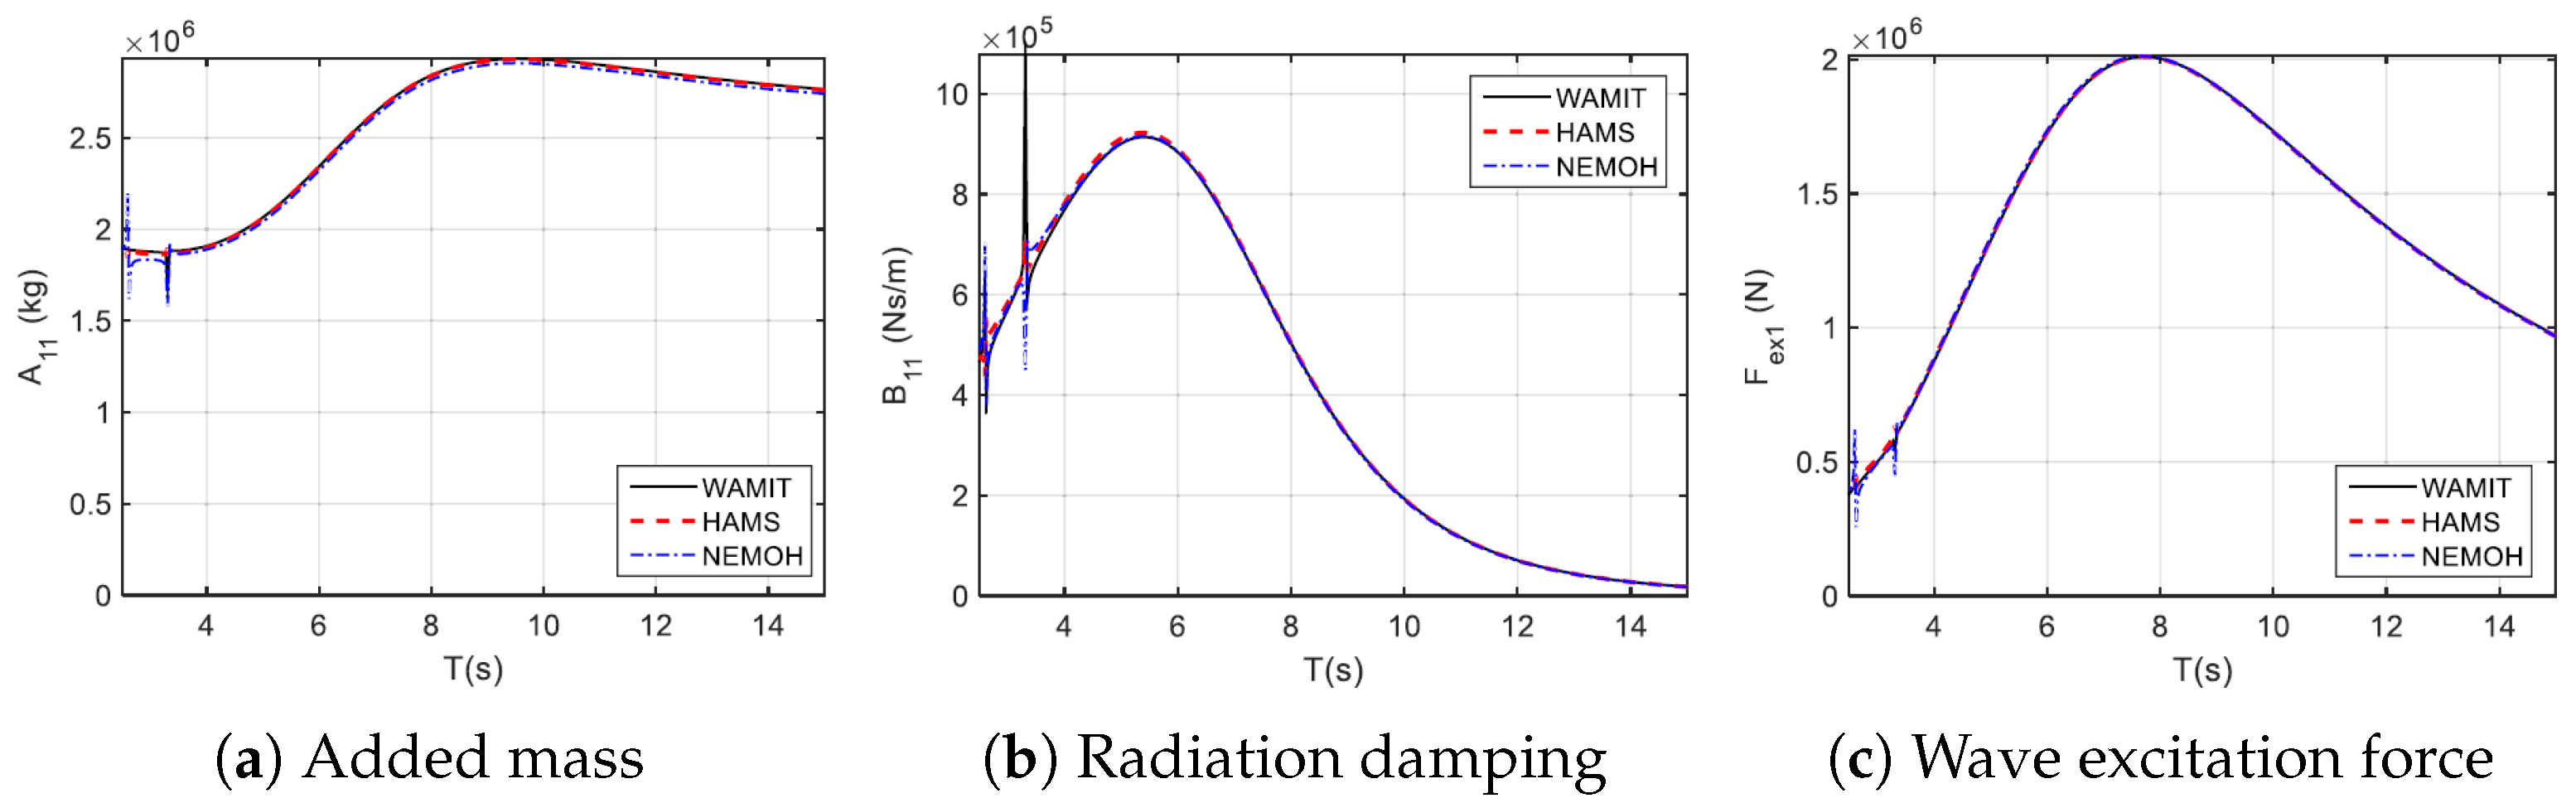
3.1.2. Numerical Tools for Hydrodynamic Analysis
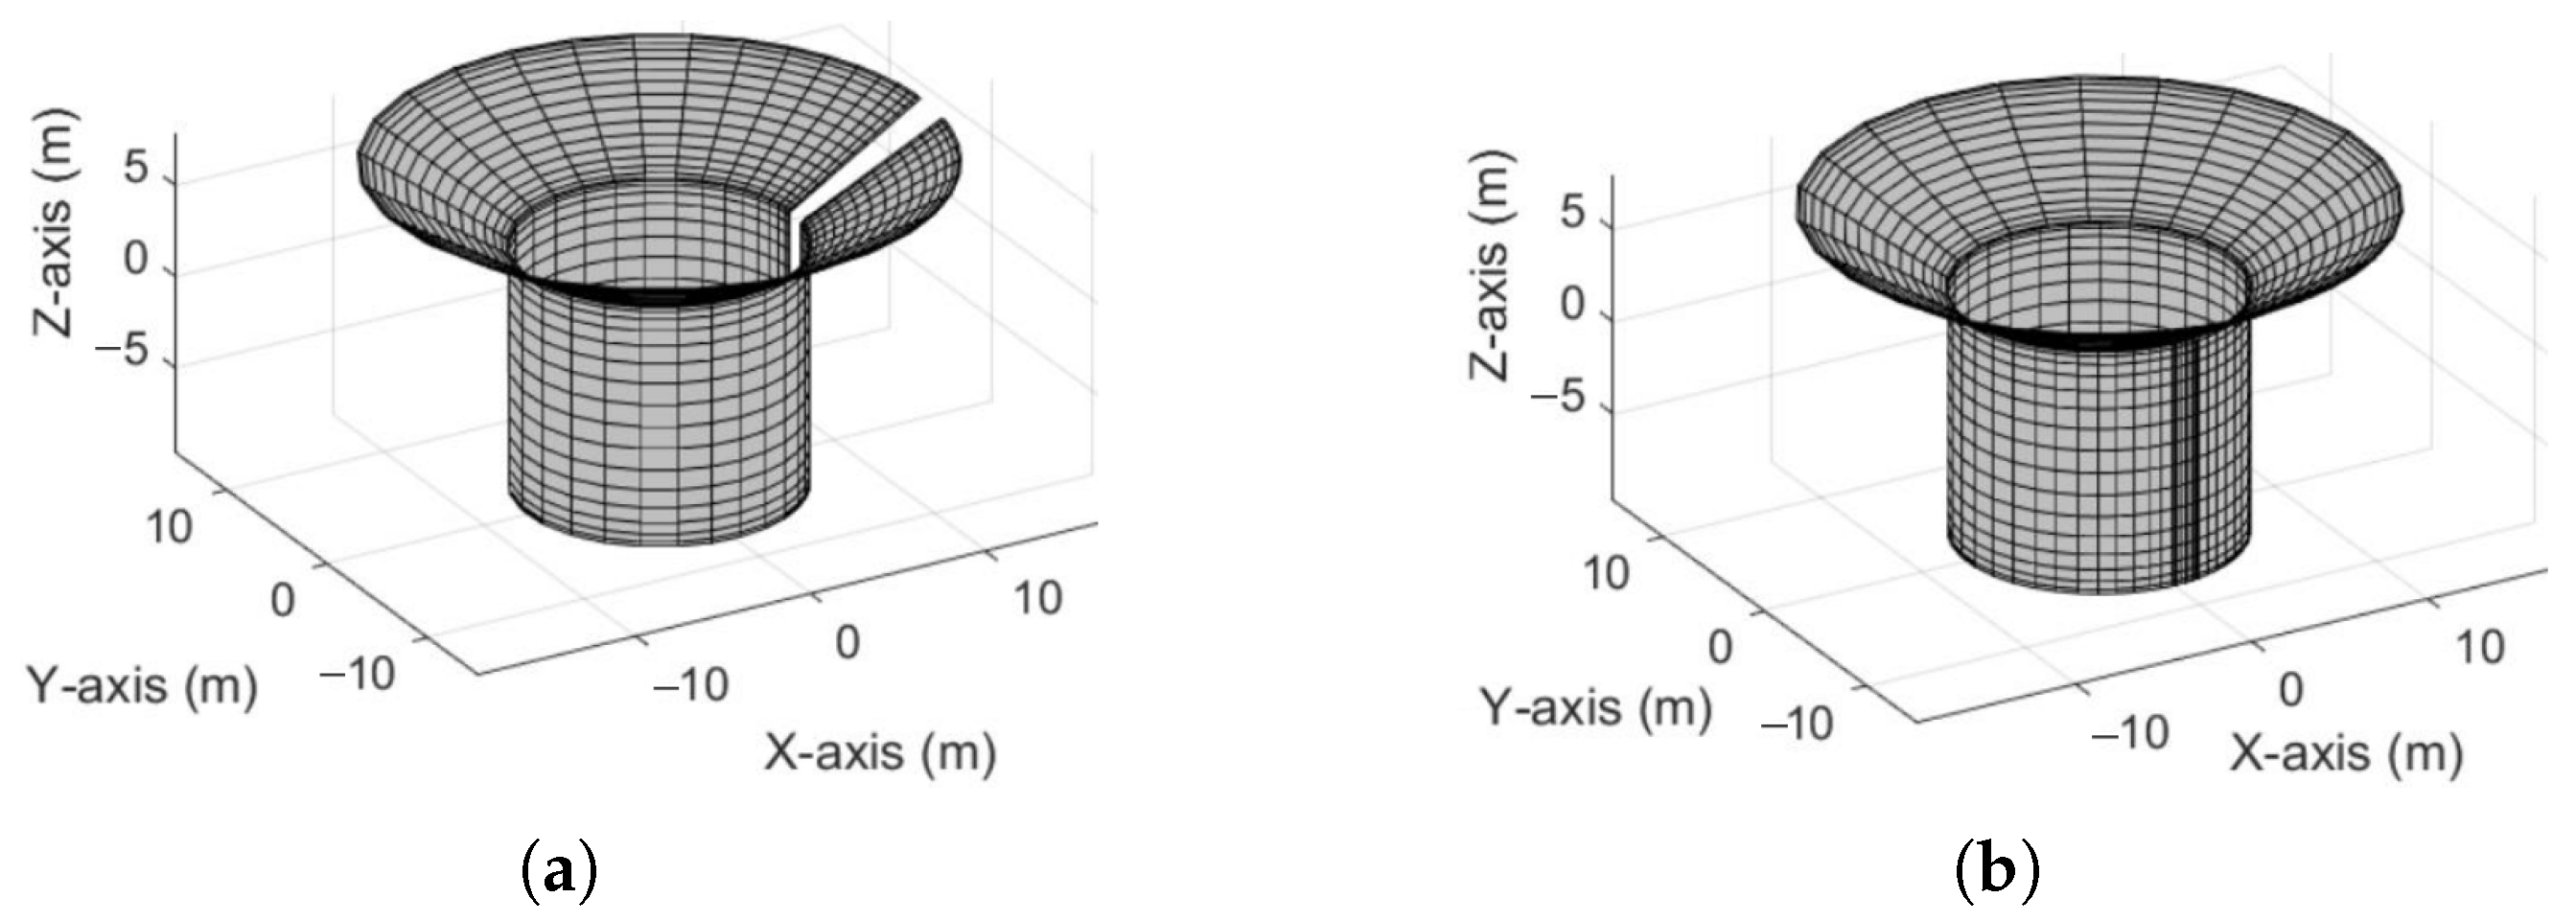
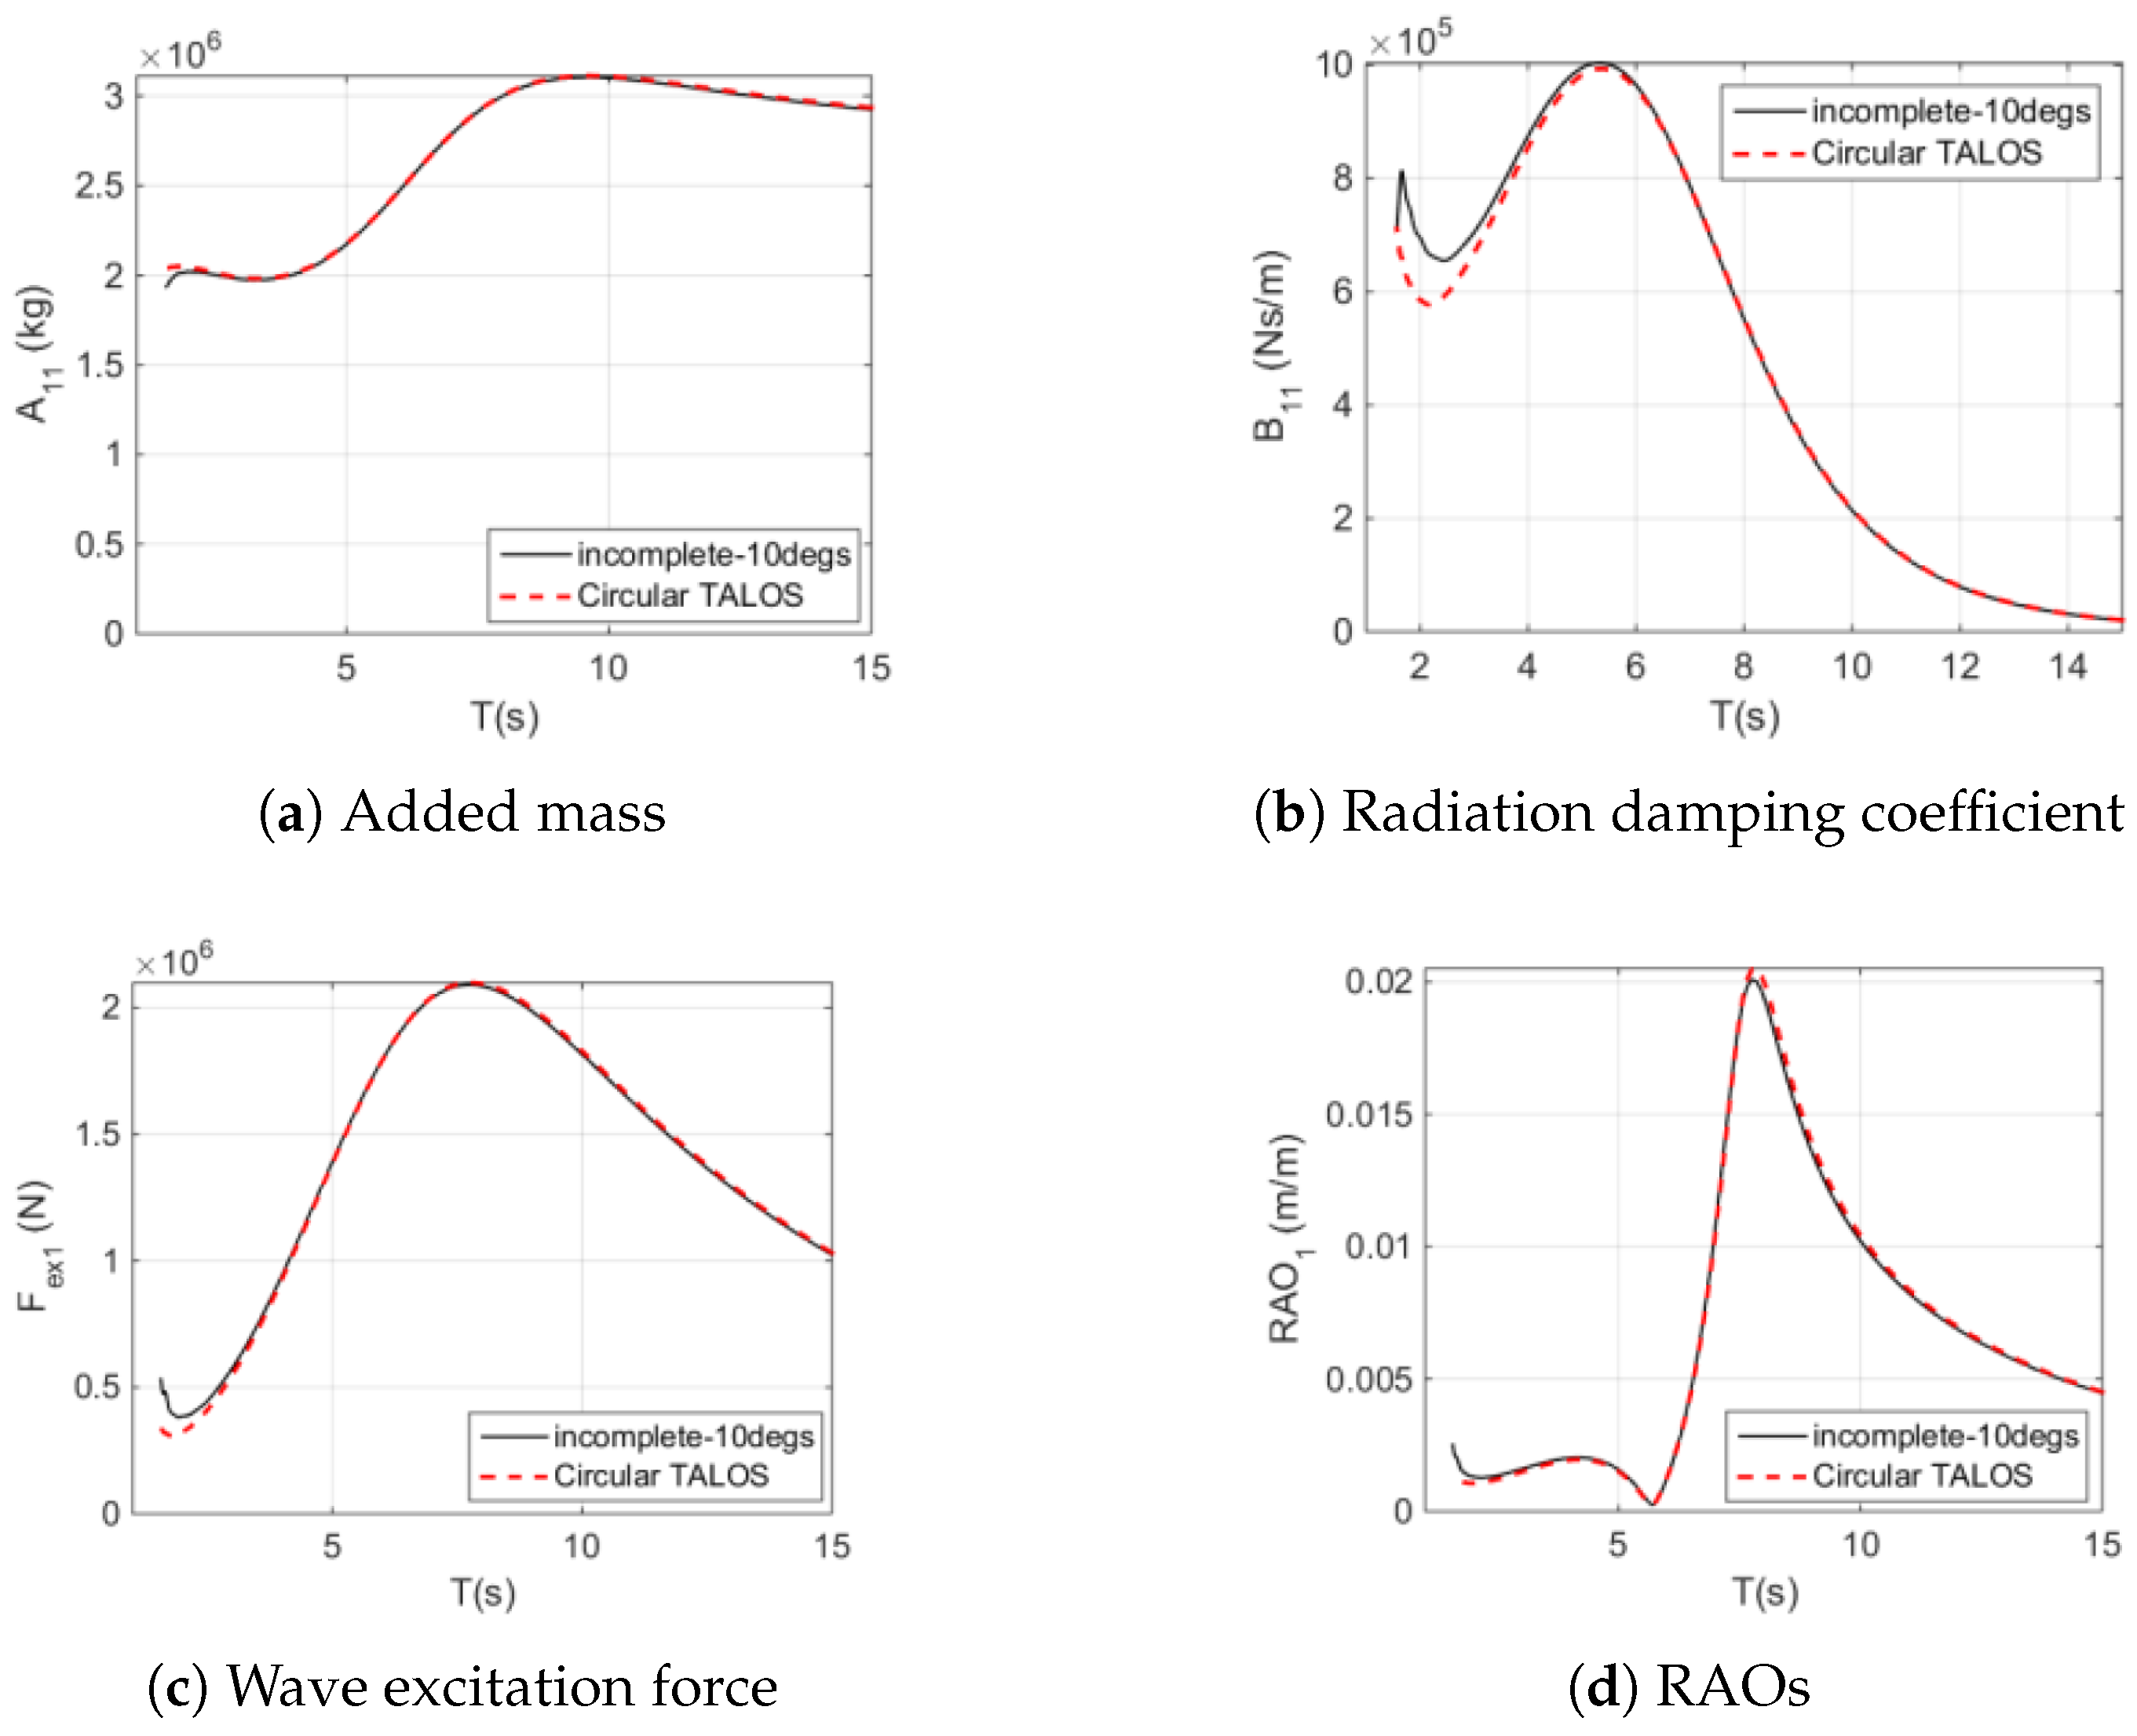
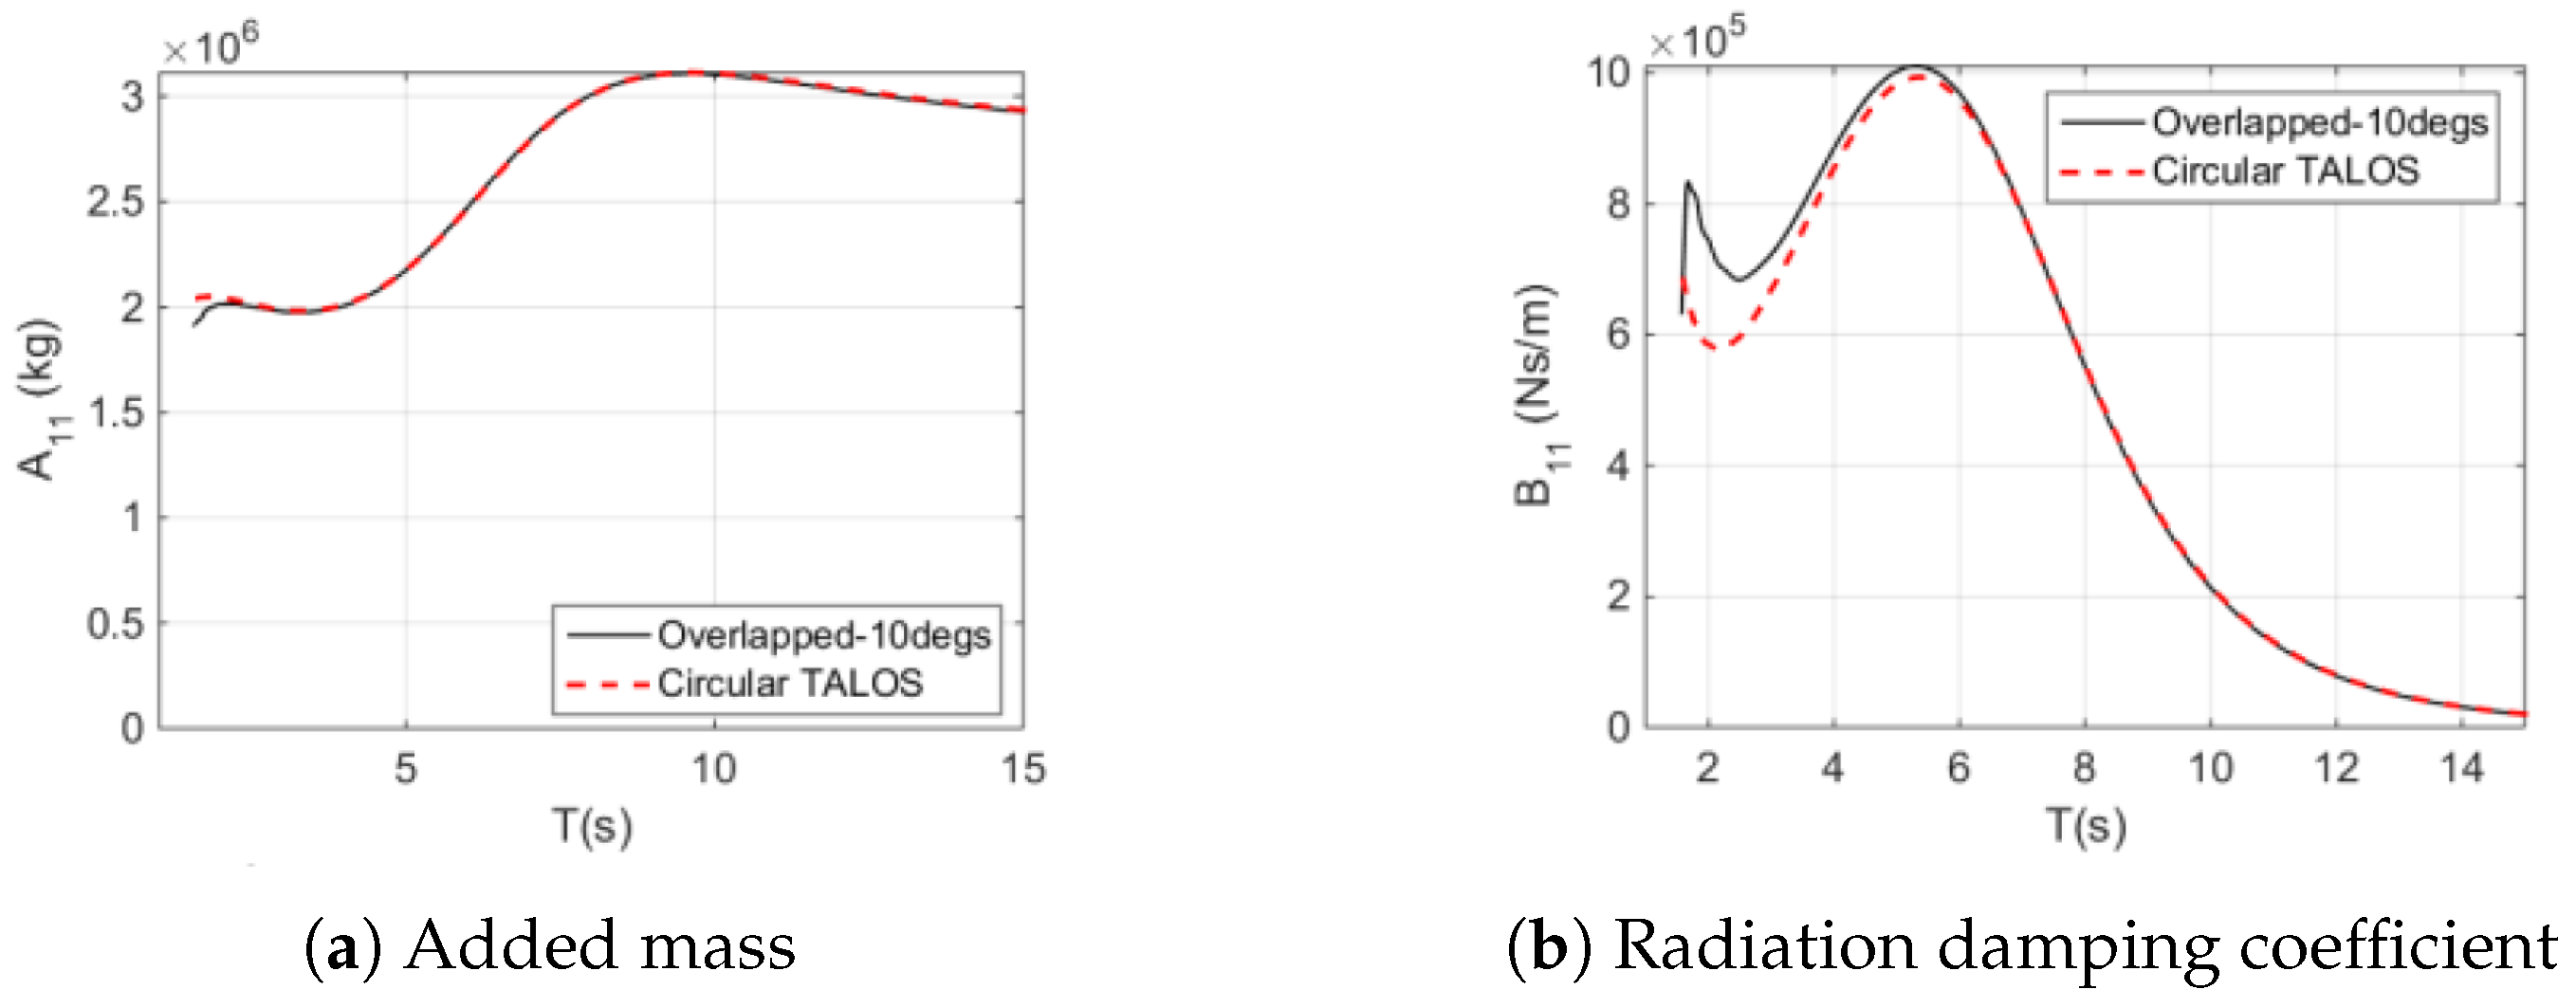
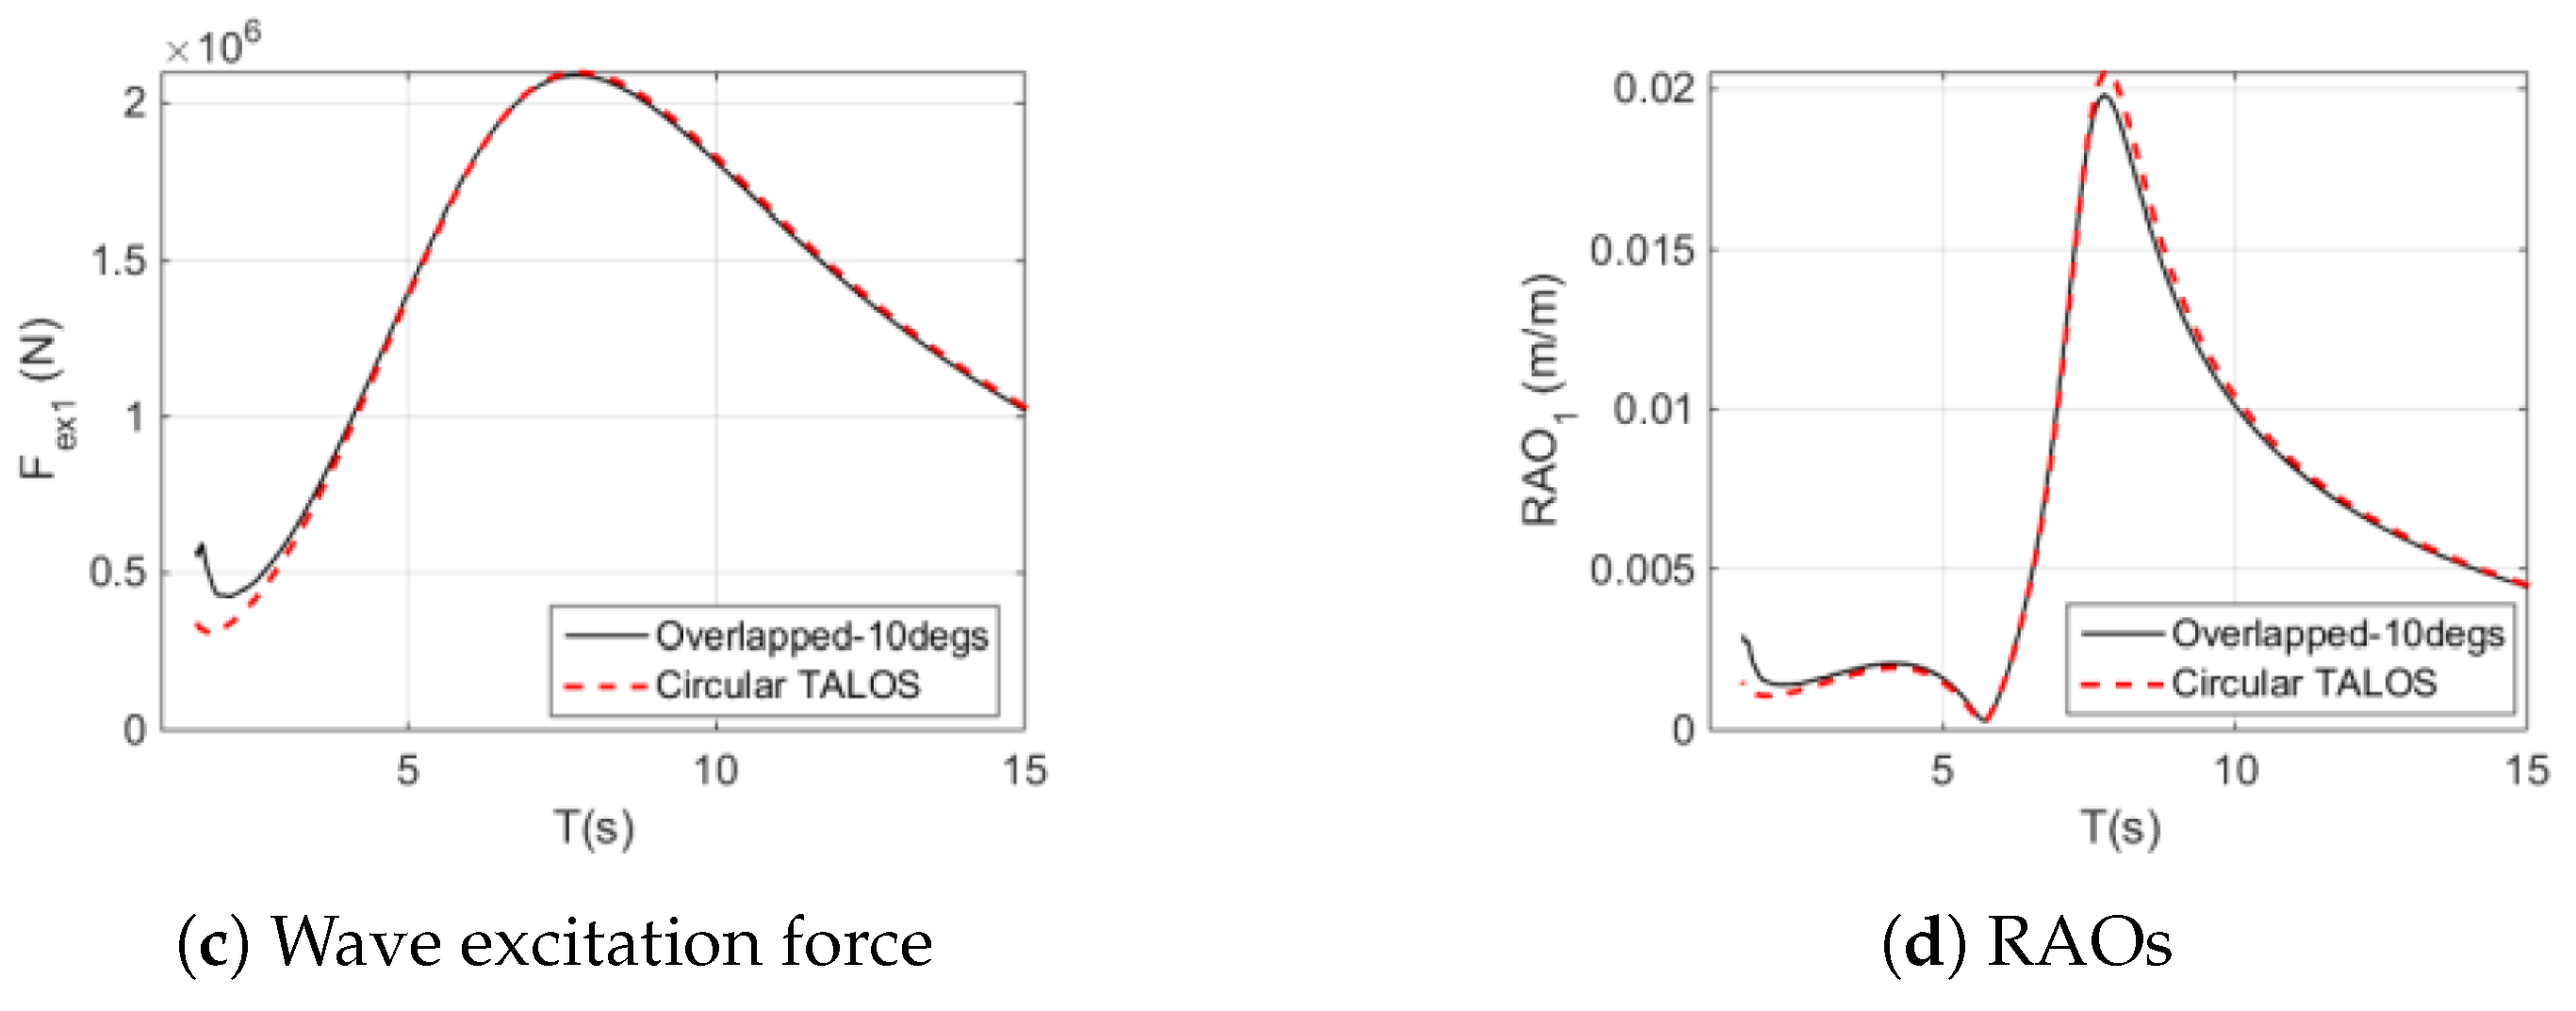
- Validation and Accuracy of Numerical Tools
3.1.3. Numerical Modelling
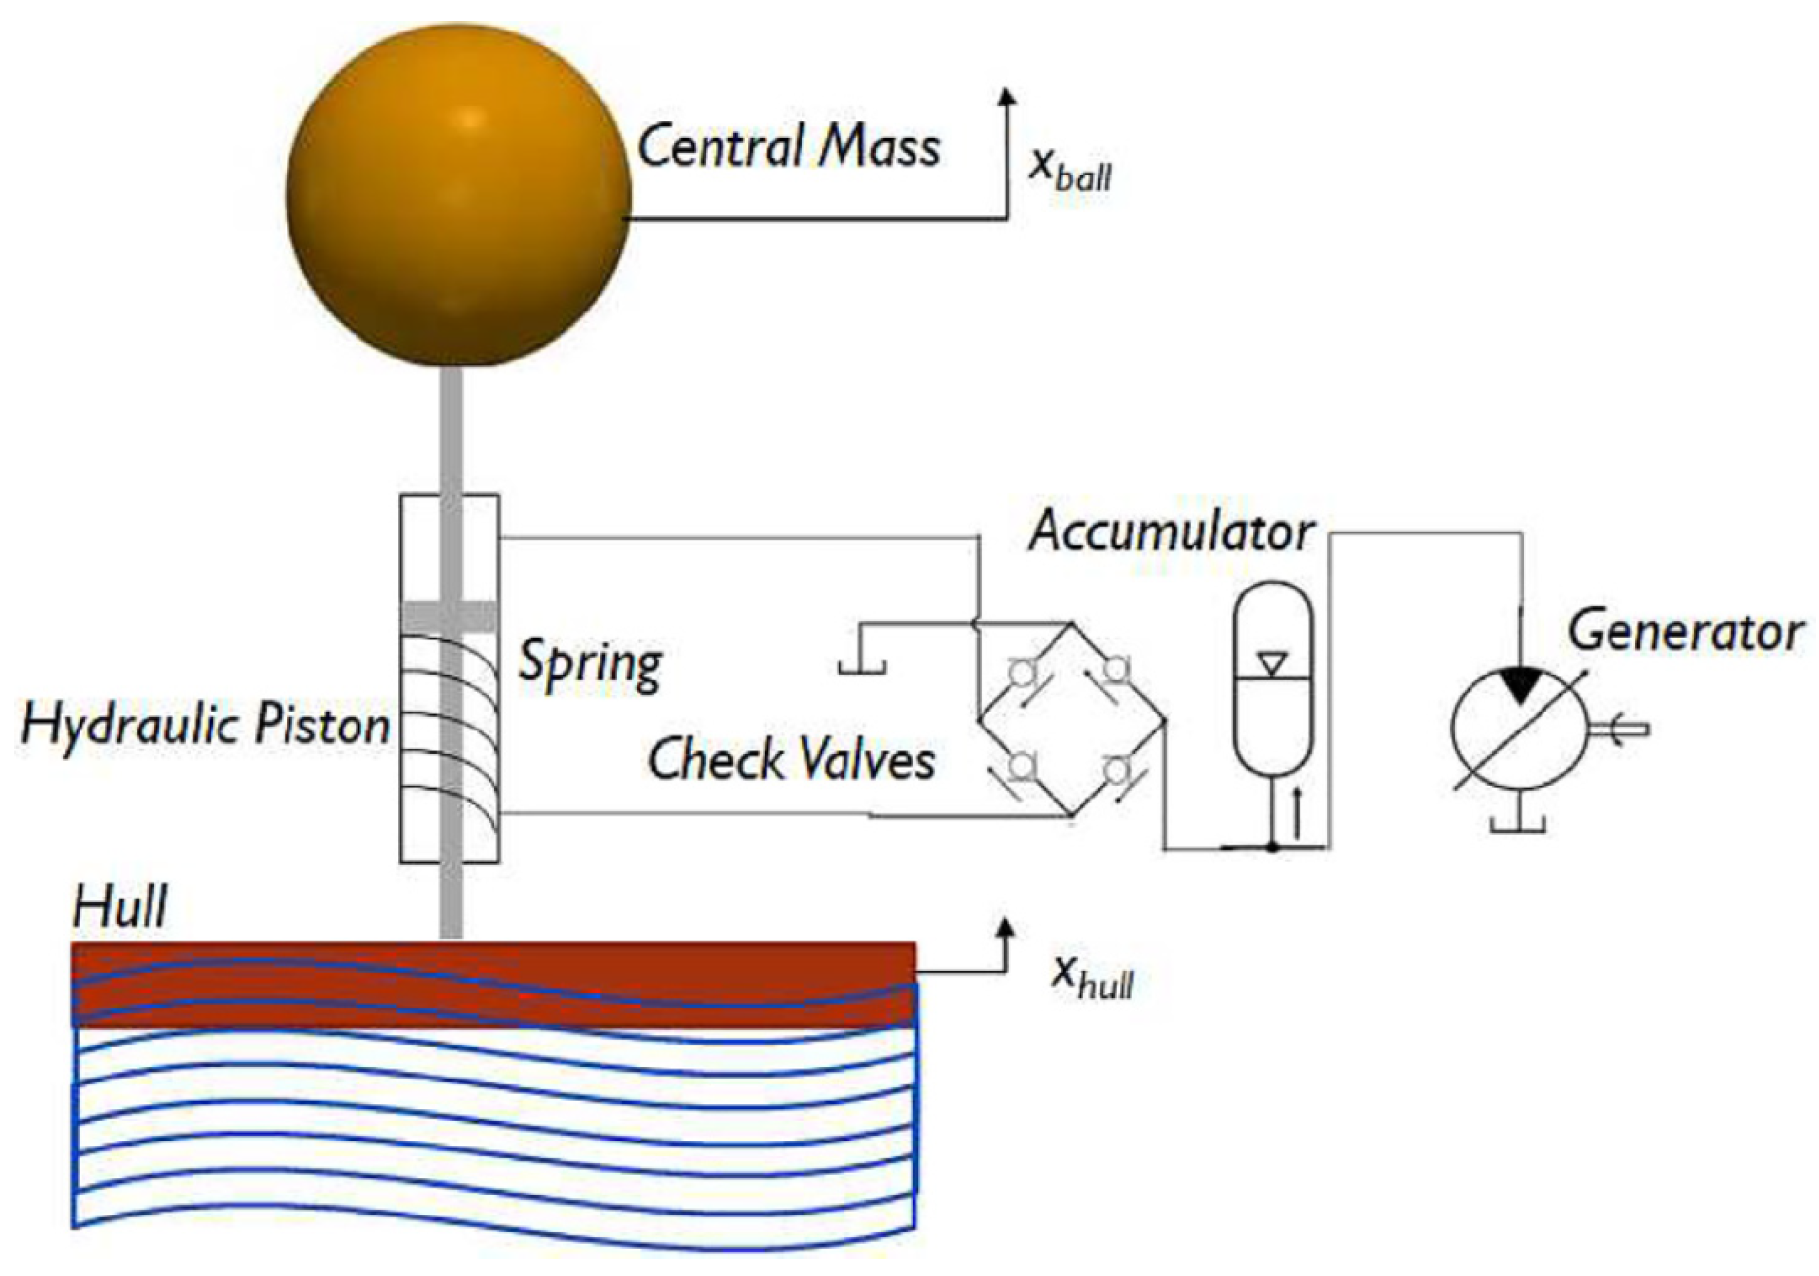
- Hydraulic PTO System Modelling
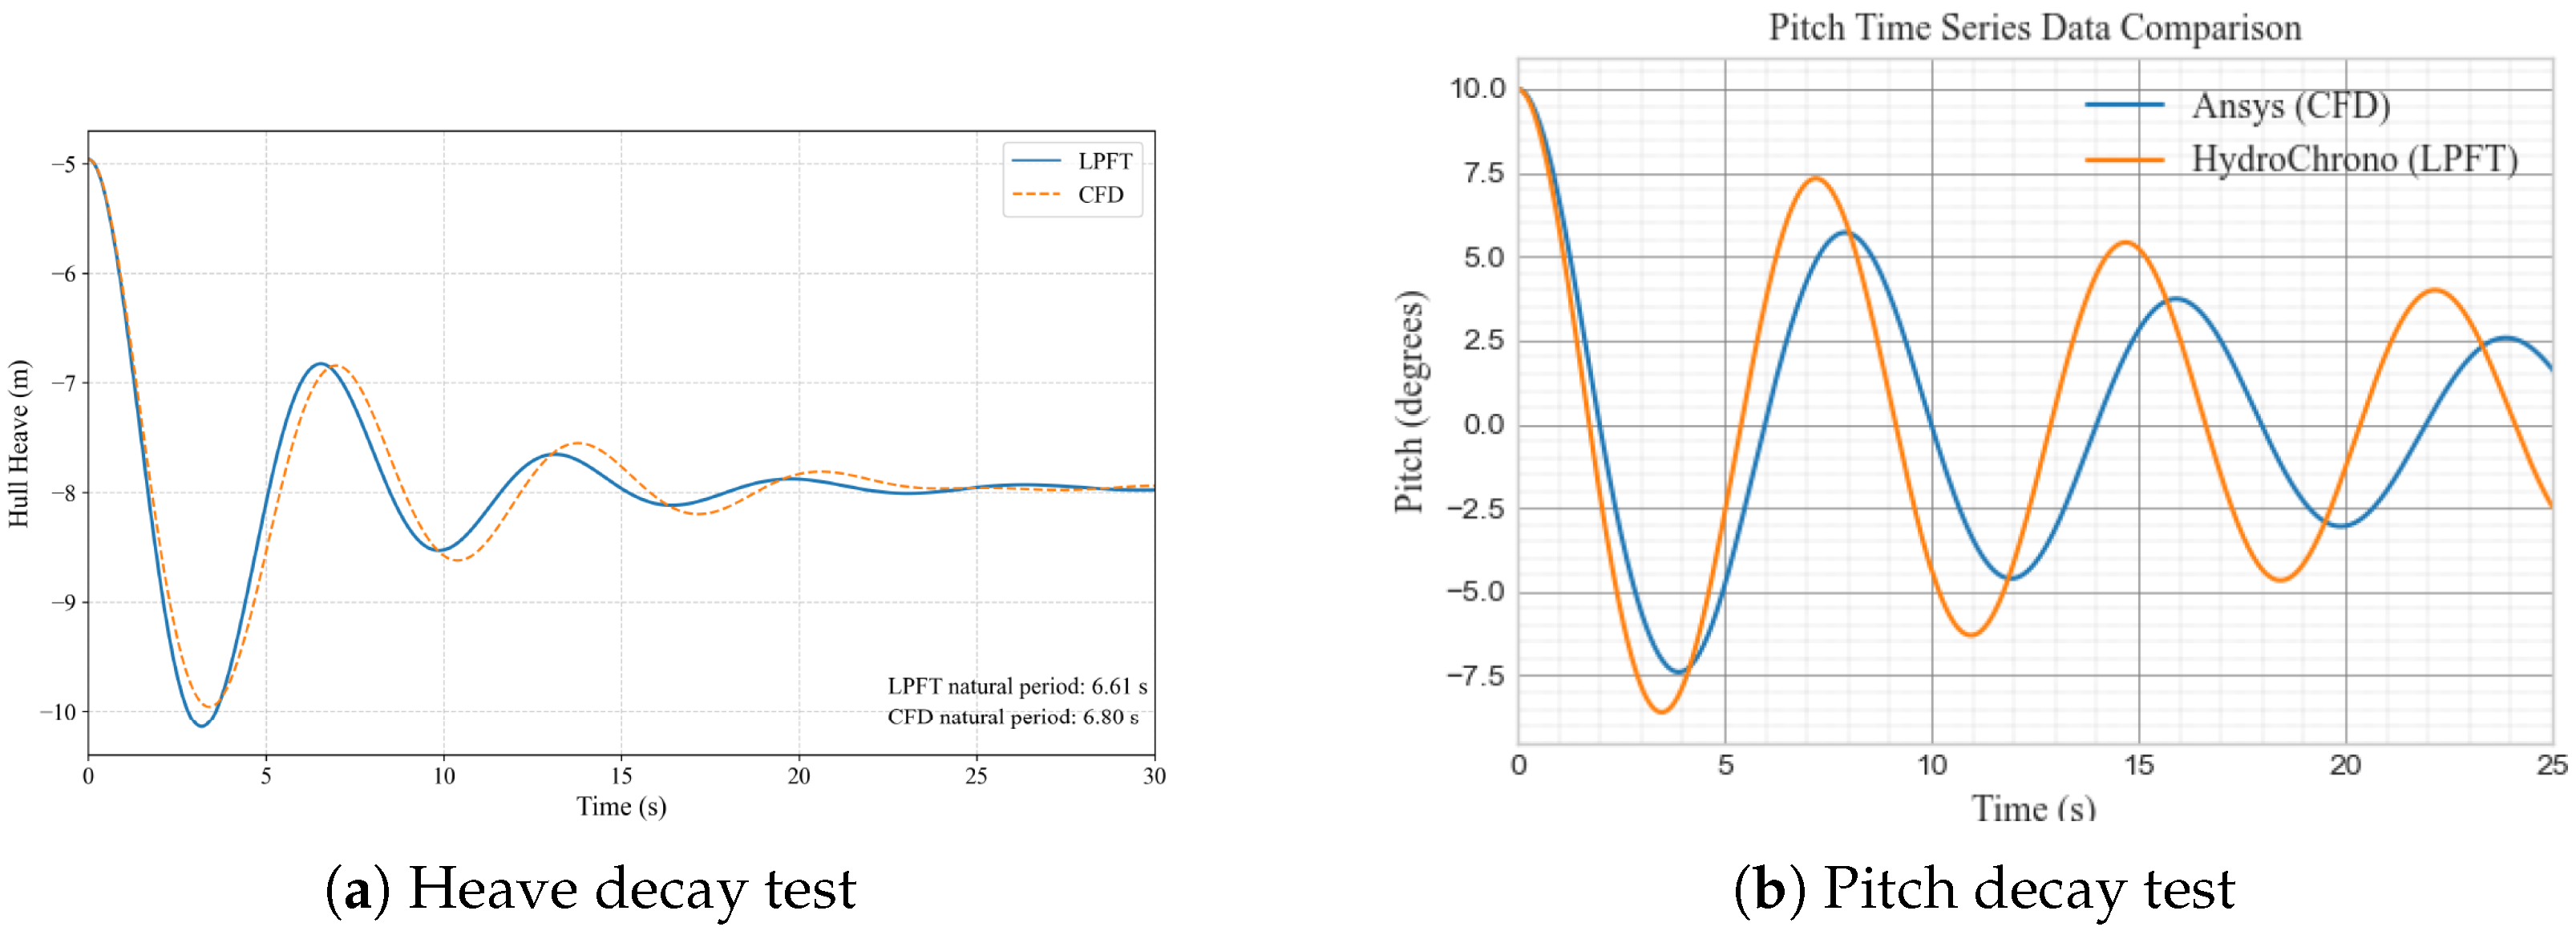
3.1.4. Validation of TALOS-WEC Numerical Models Using CFD
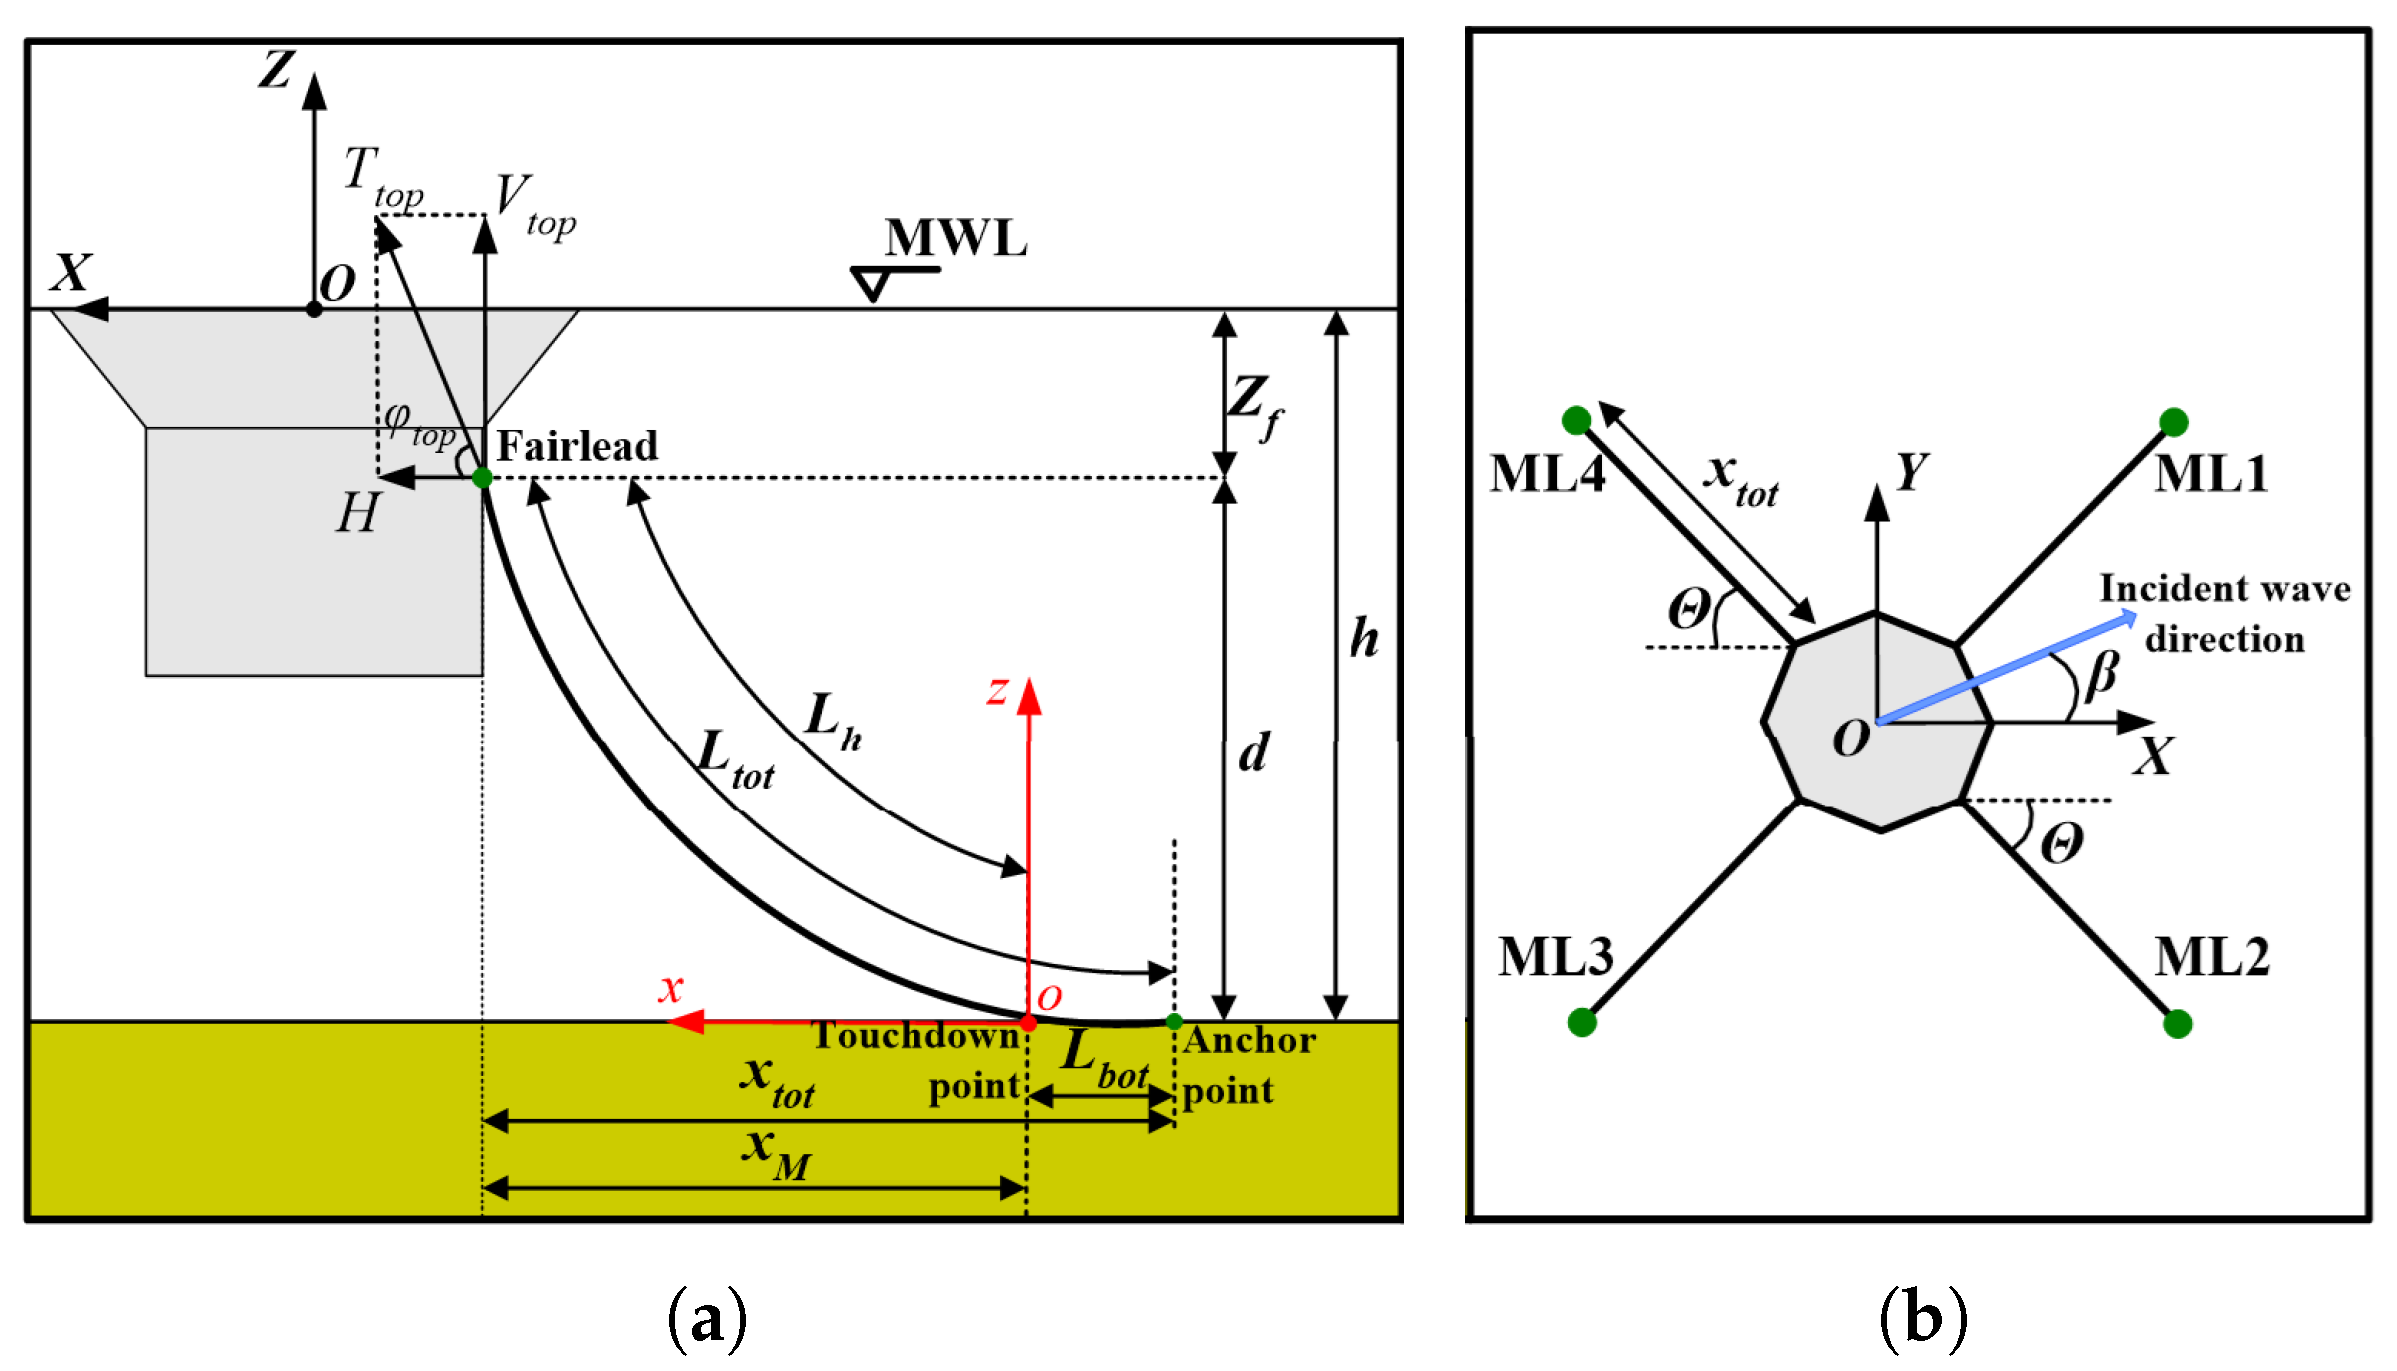
3.1.5. Mooring System Effects on Hydrodynamics
- Power Absorption Analysis for Single-Mode and Multi-Mode PTOs
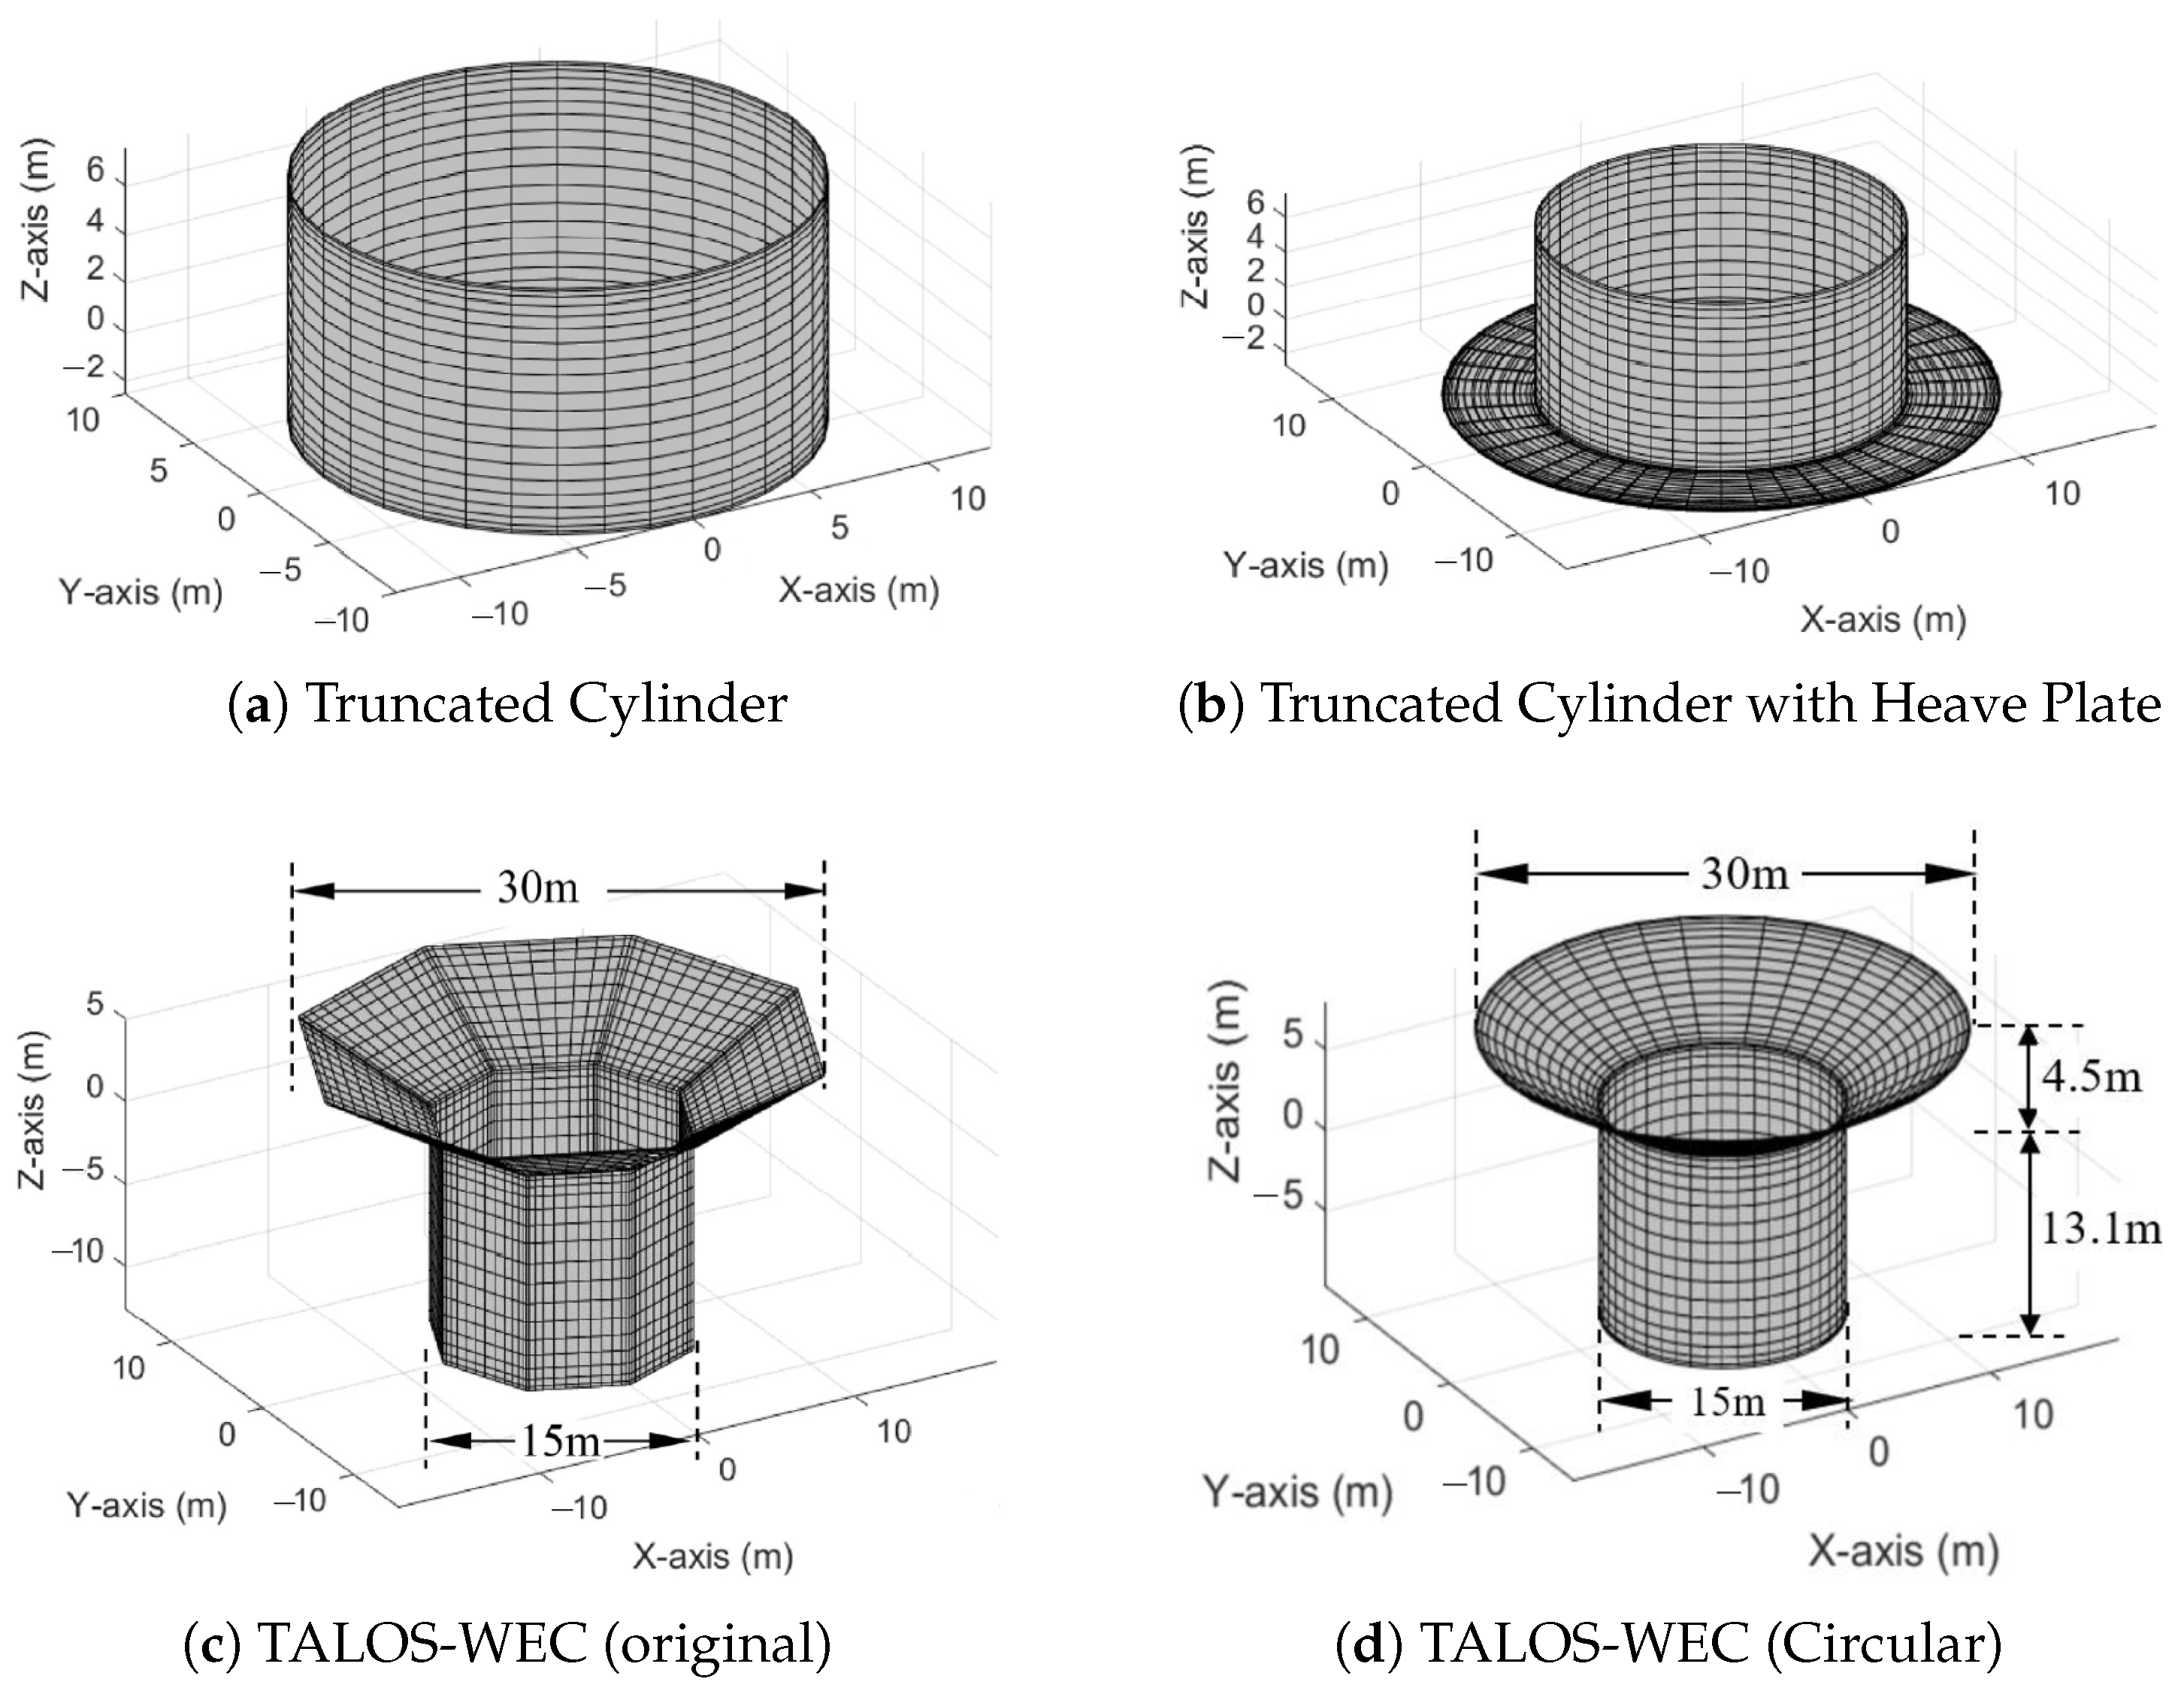
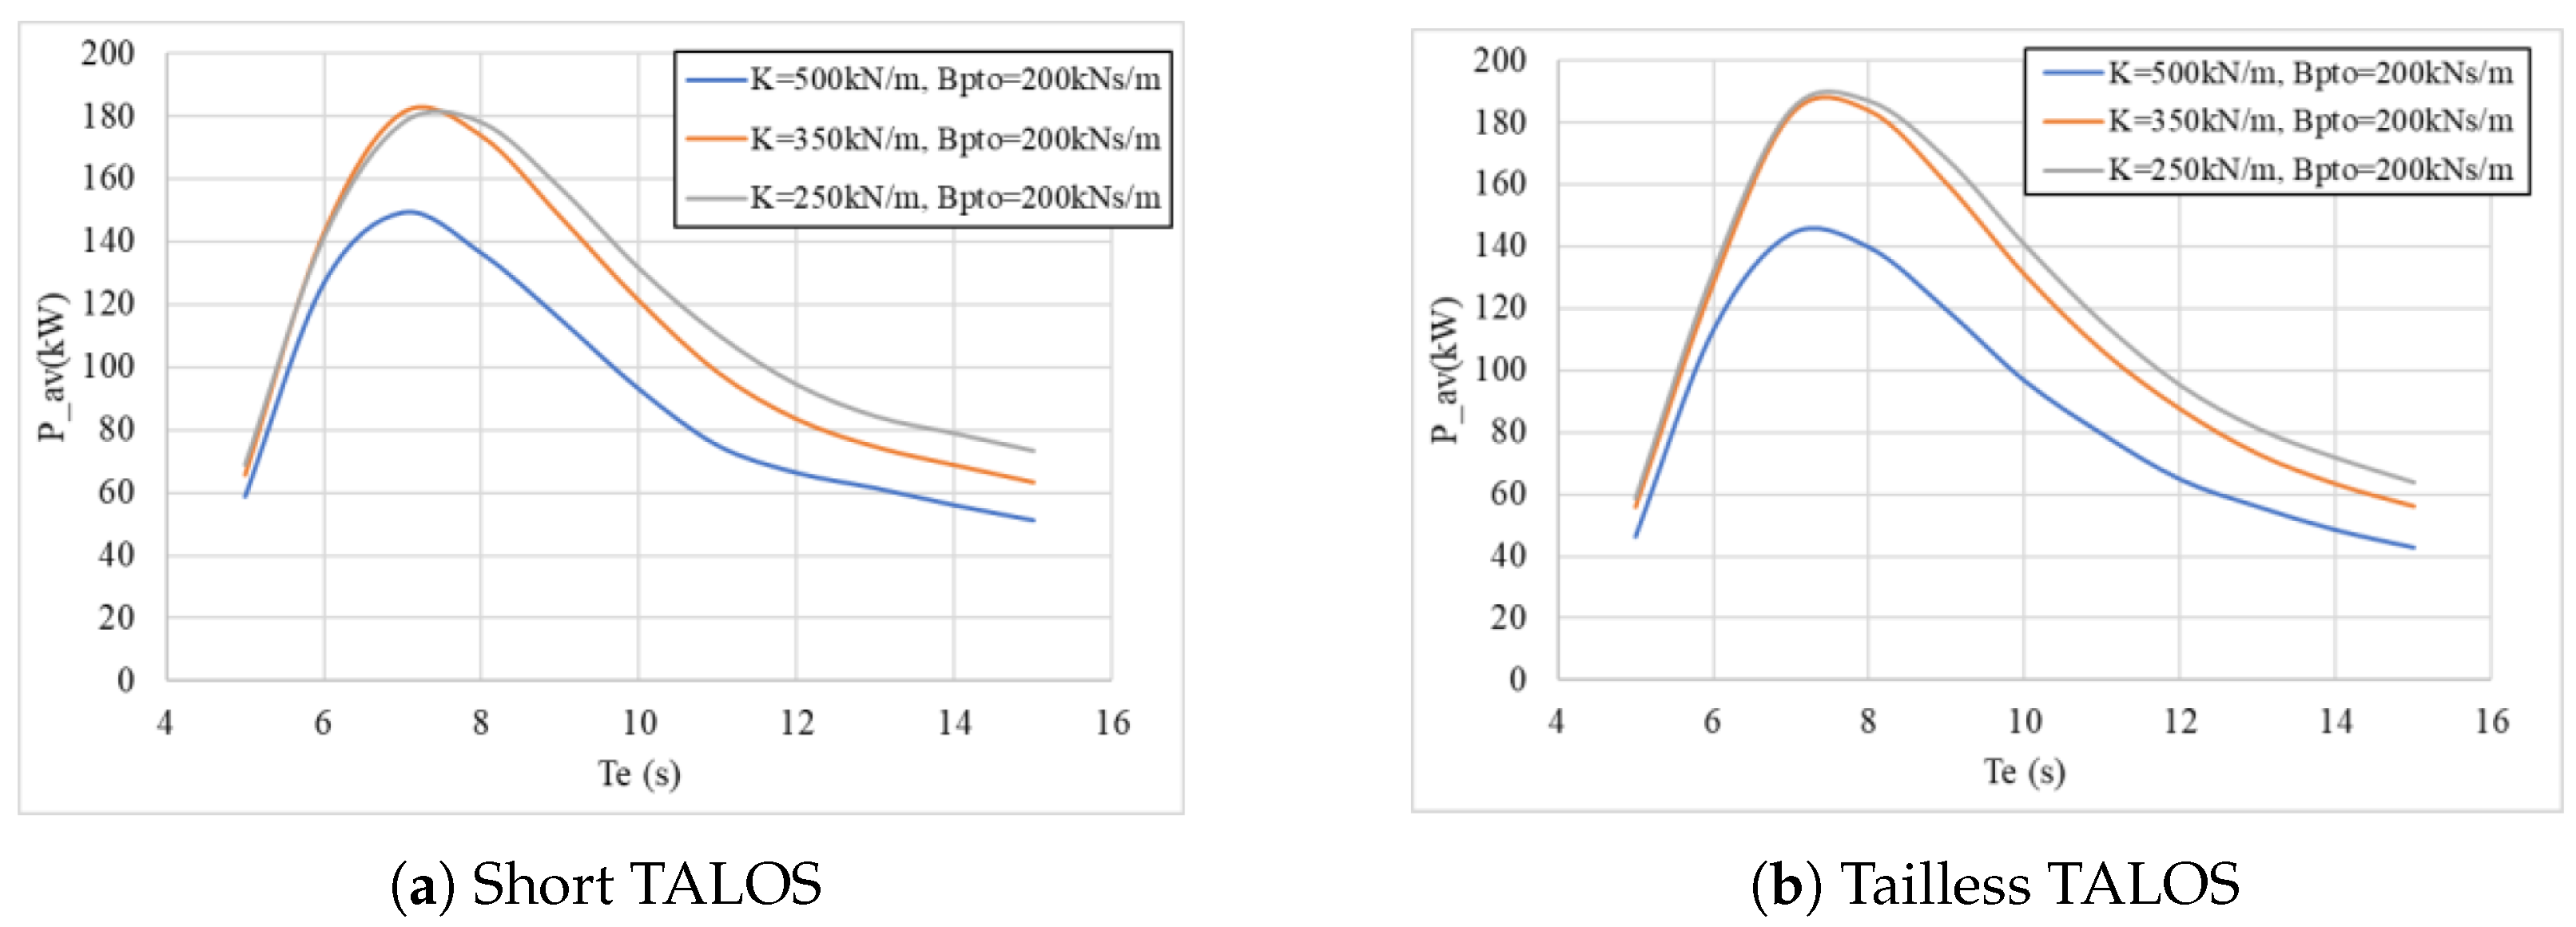
3.2. WP1.2: Geometric Optimisation
3.2.1. Baseline Geometry Studies for Optimisation
- A truncated cylinder, an axisymmetric design with well-documented hydrodynamic properties, serves as a baseline for validation and numerical tool testing.
- A truncated cylinder with a heave plate, which enhances vertical stability by increasing added mass and radiation damping.
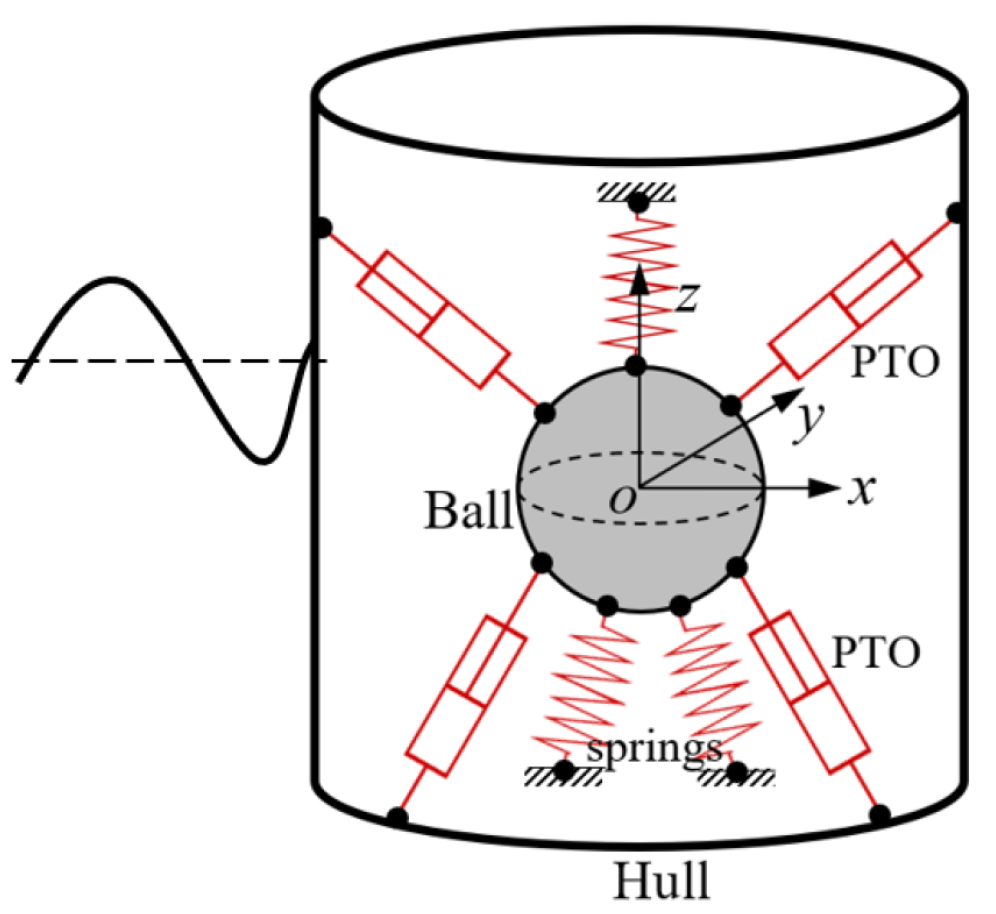
- The original TALOS-WEC, a multi-axis point absorber optimised for energy absorption but characterised by its complex thin structures and overlapping panels.
- A simplified circular version of TALOS, designed to address numerical modelling challenges while retaining critical hydrodynamic features and improving computational efficiency.
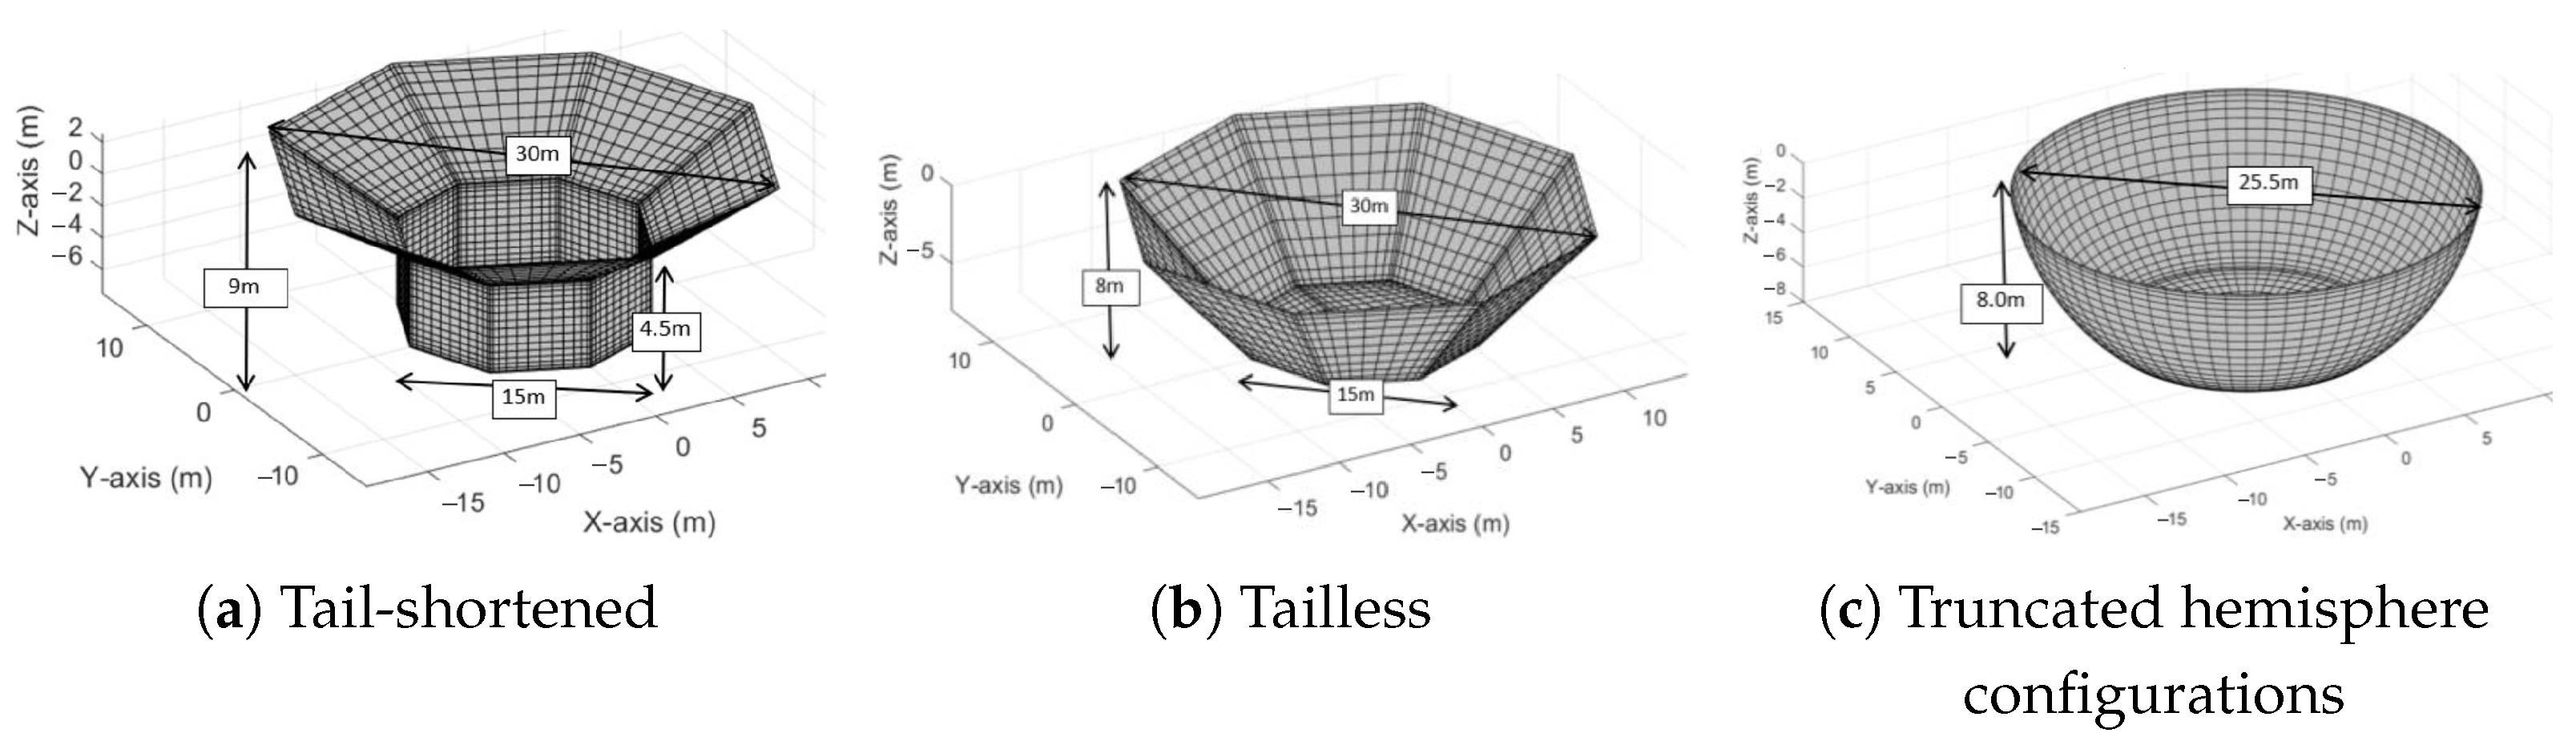
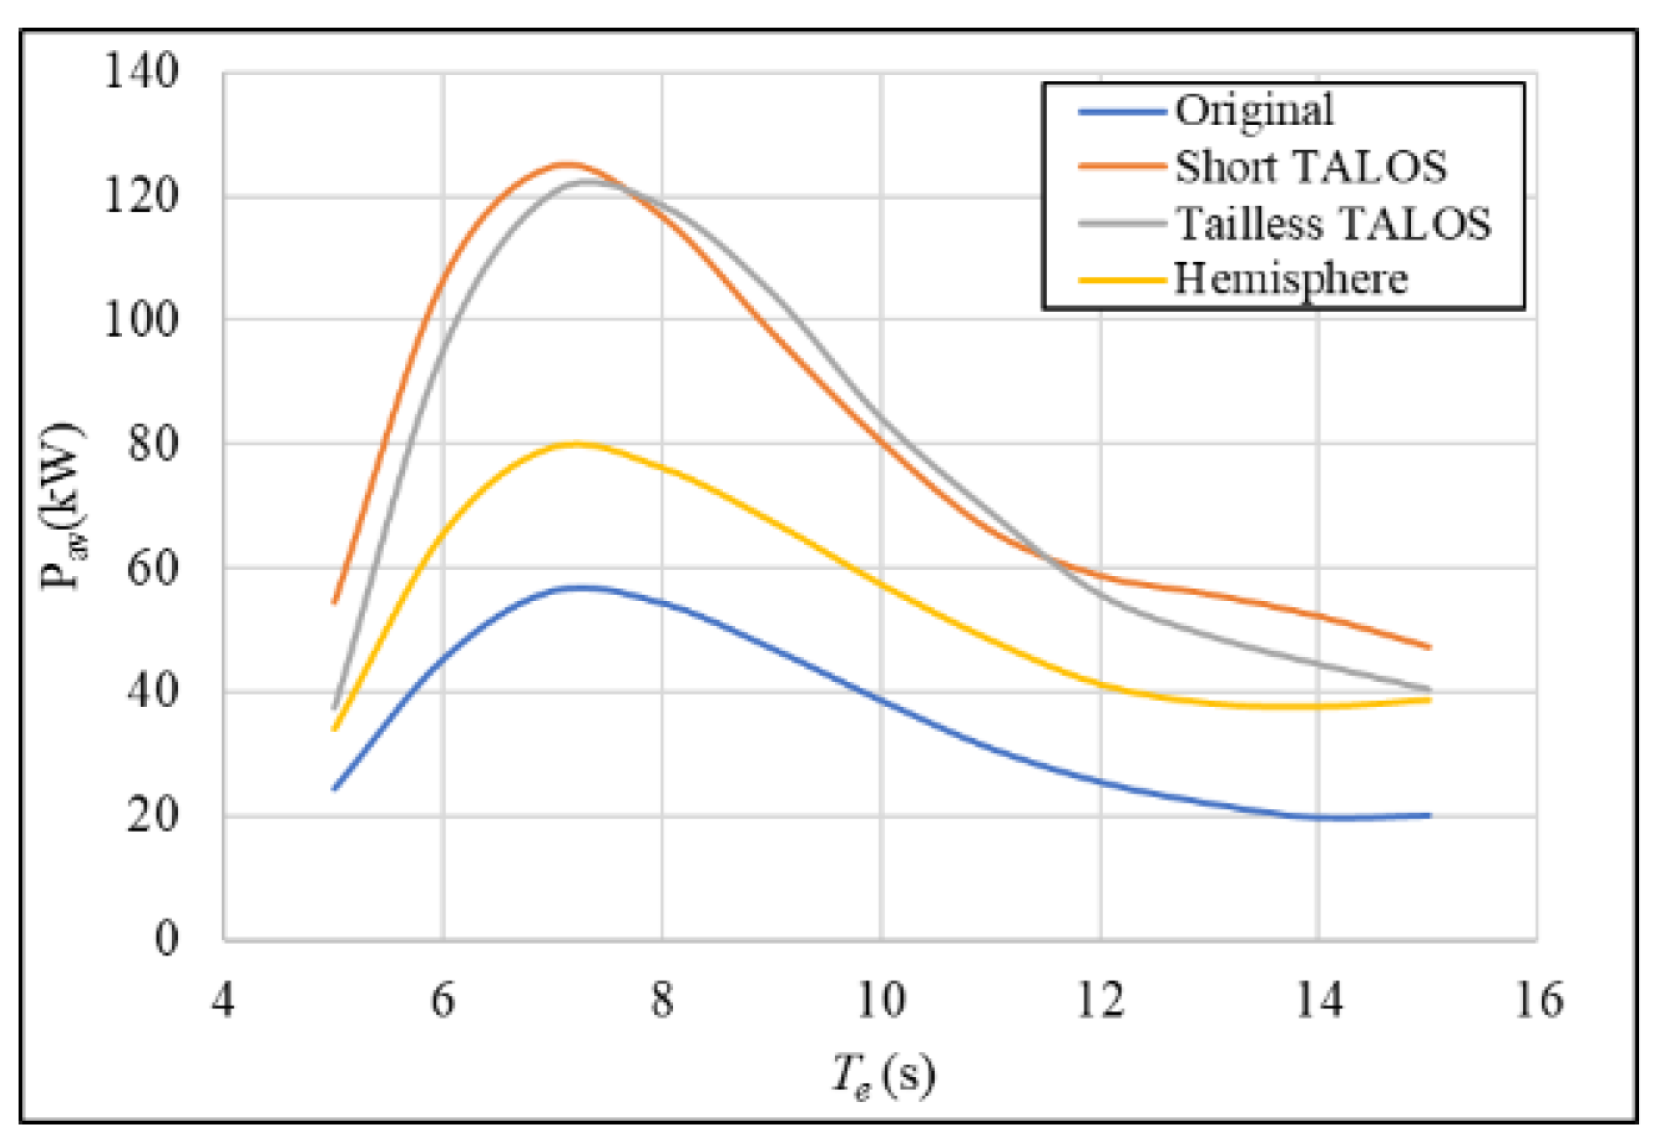
3.2.2. Geometric Modifications
3.2.3. Geometric Optimisation Strategies
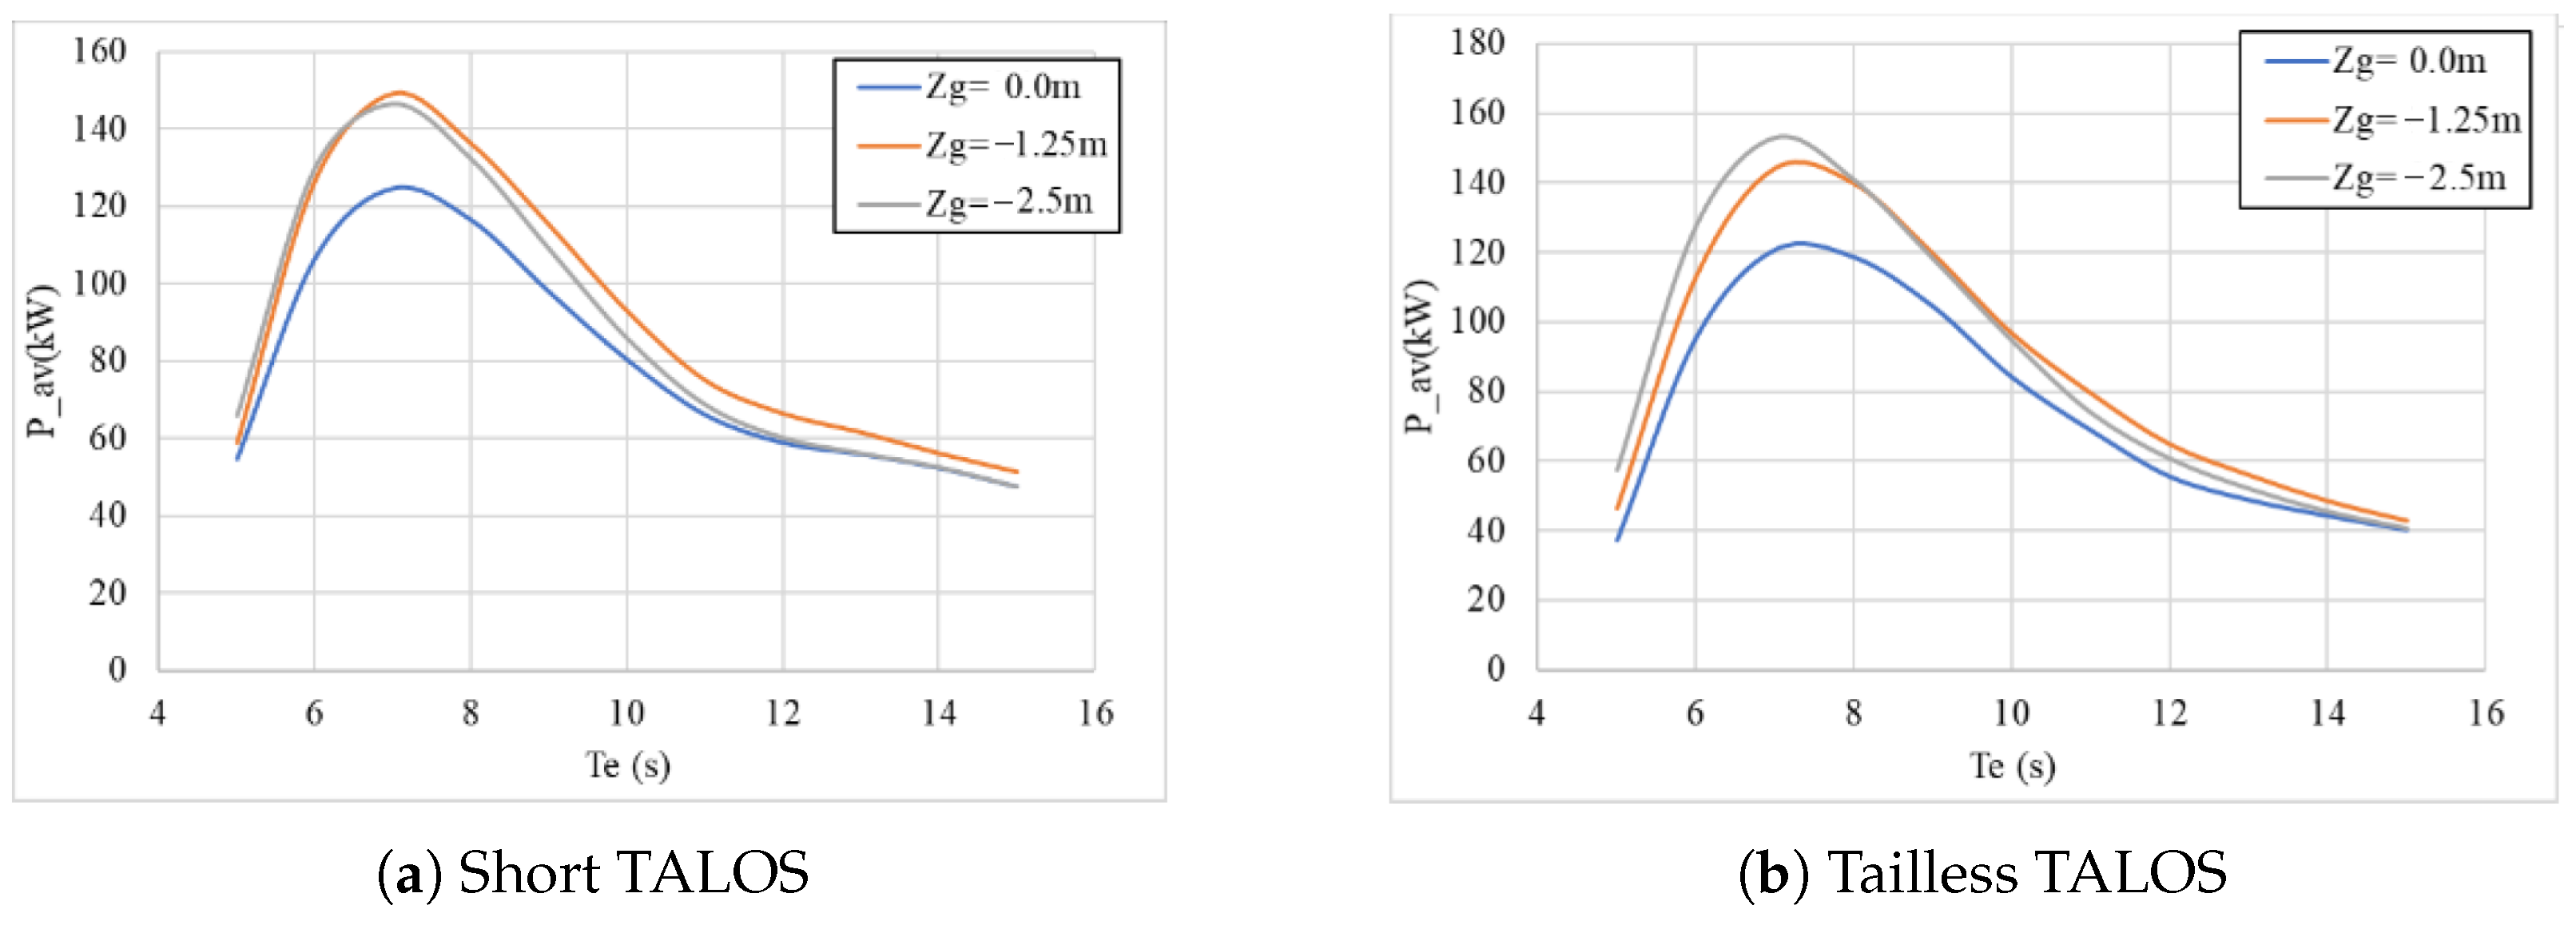
- CoG Adjustments
- Panel Configurations: Panel Gaps and Overlaps
3.3. PTO Design and Optimisation for TALOS-WEC
Optimisation of the PTO System
- Role of PTO Damping Coefficients
- Influence of PTO spring stiffness
4. WP2: Survivability, Reliability, and Control
4.1. WP2.1—Smart Sensors
4.2. WP2.2—Intelligent Condition Monitoring
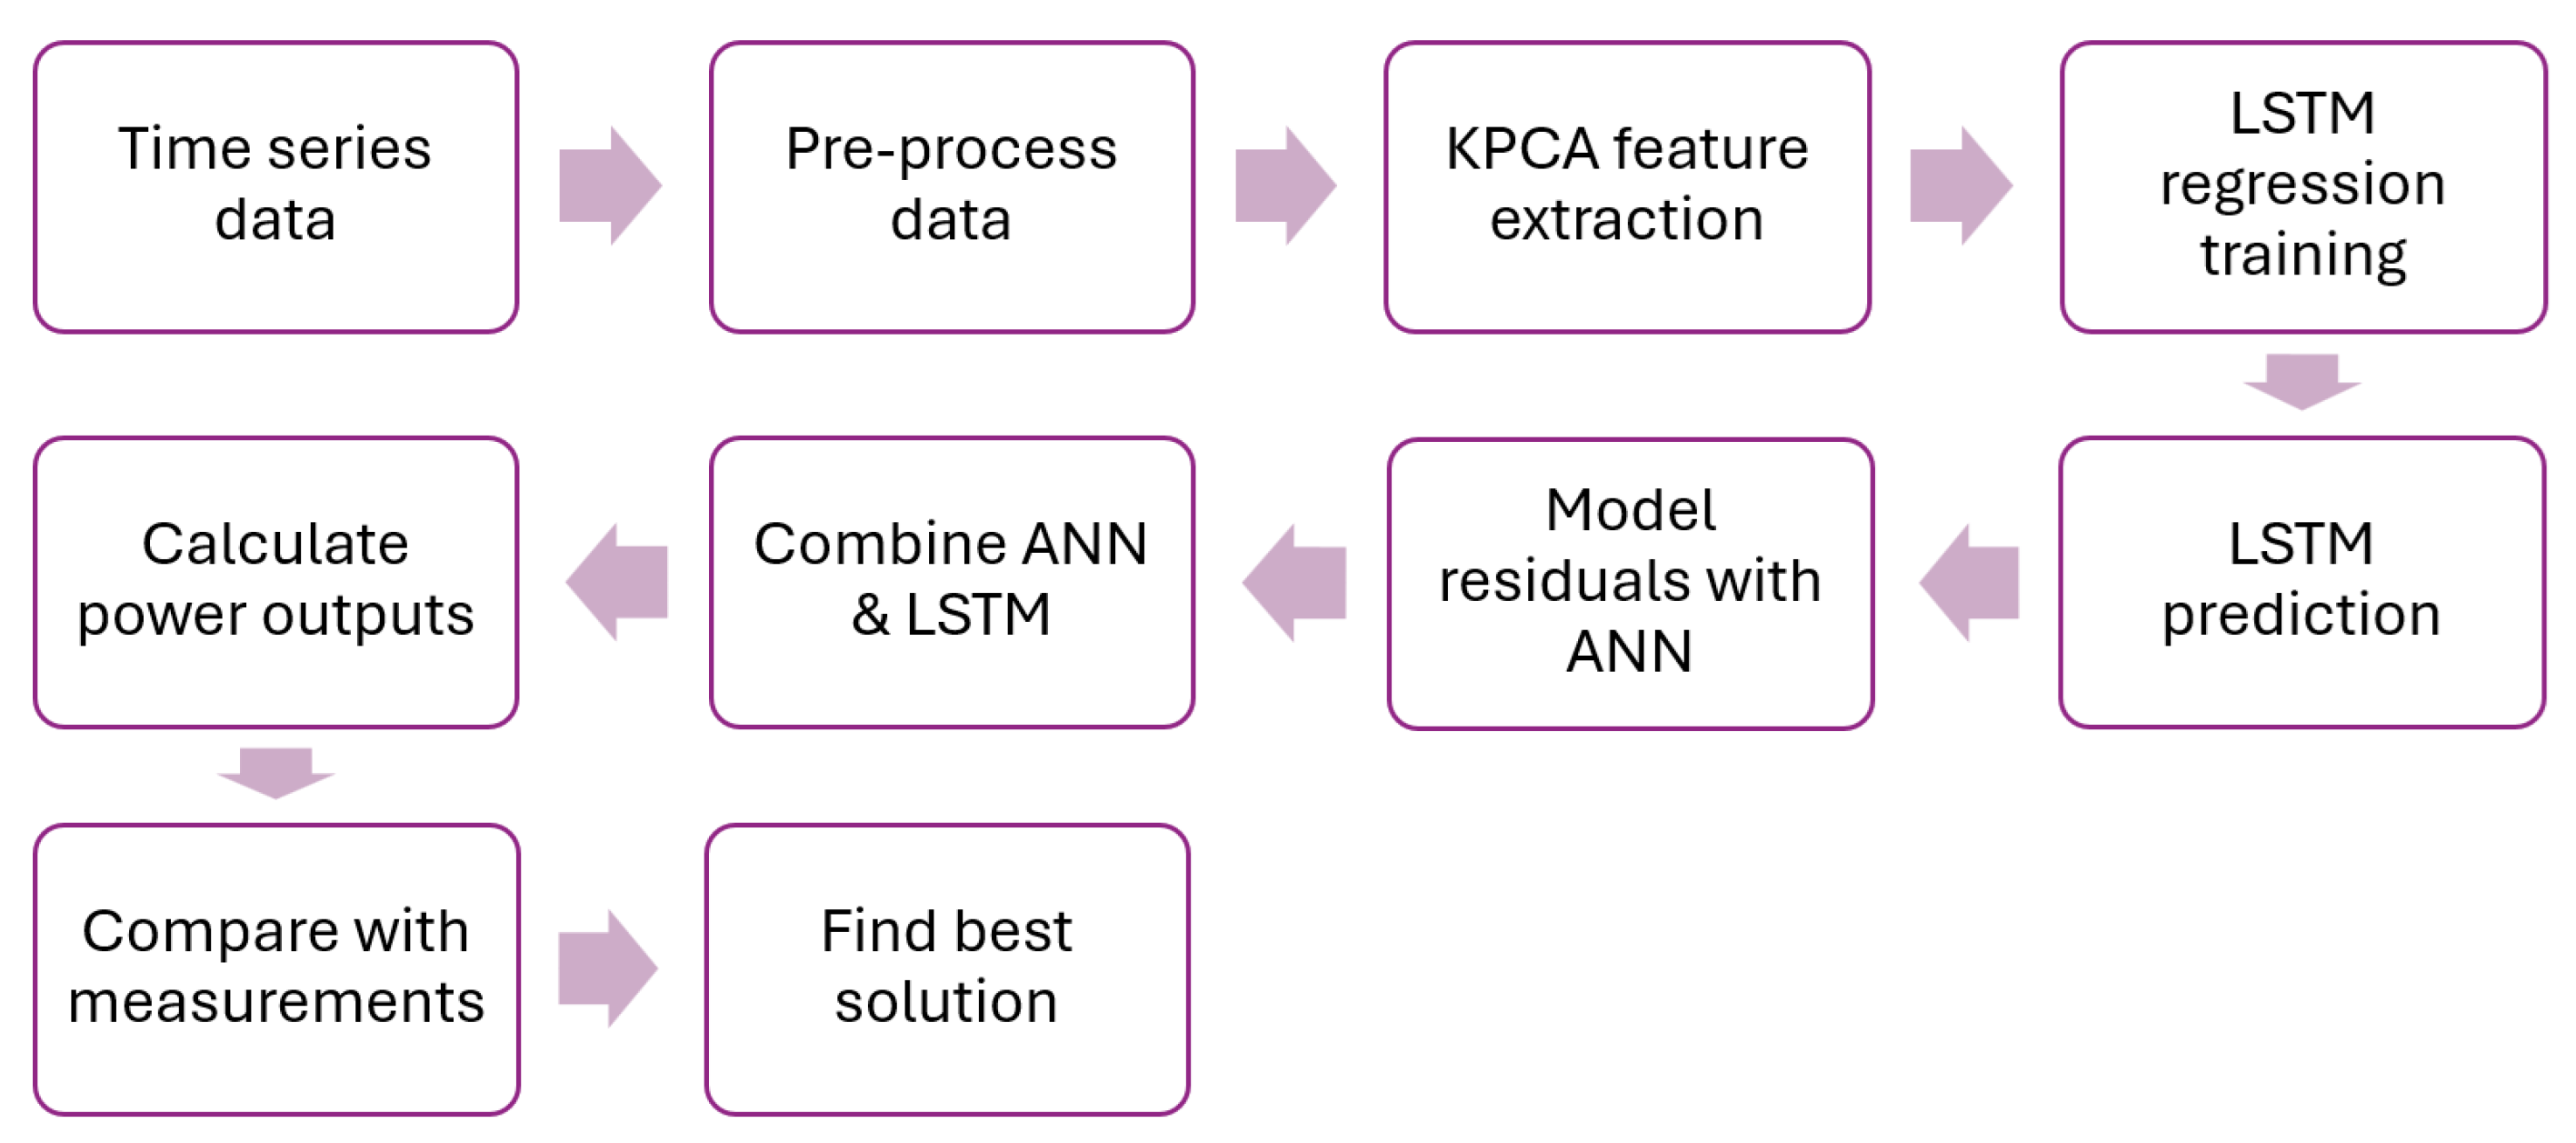
4.2.1. ANN-LSTM Framework
- LSTM for Primary Power Prediction
- ANN for Residual Adjustment
4.2.2. KPCA-LSTM Framework
- KPCA for feature extraction
4.2.3. Evaluation Metrics and Model Comparison
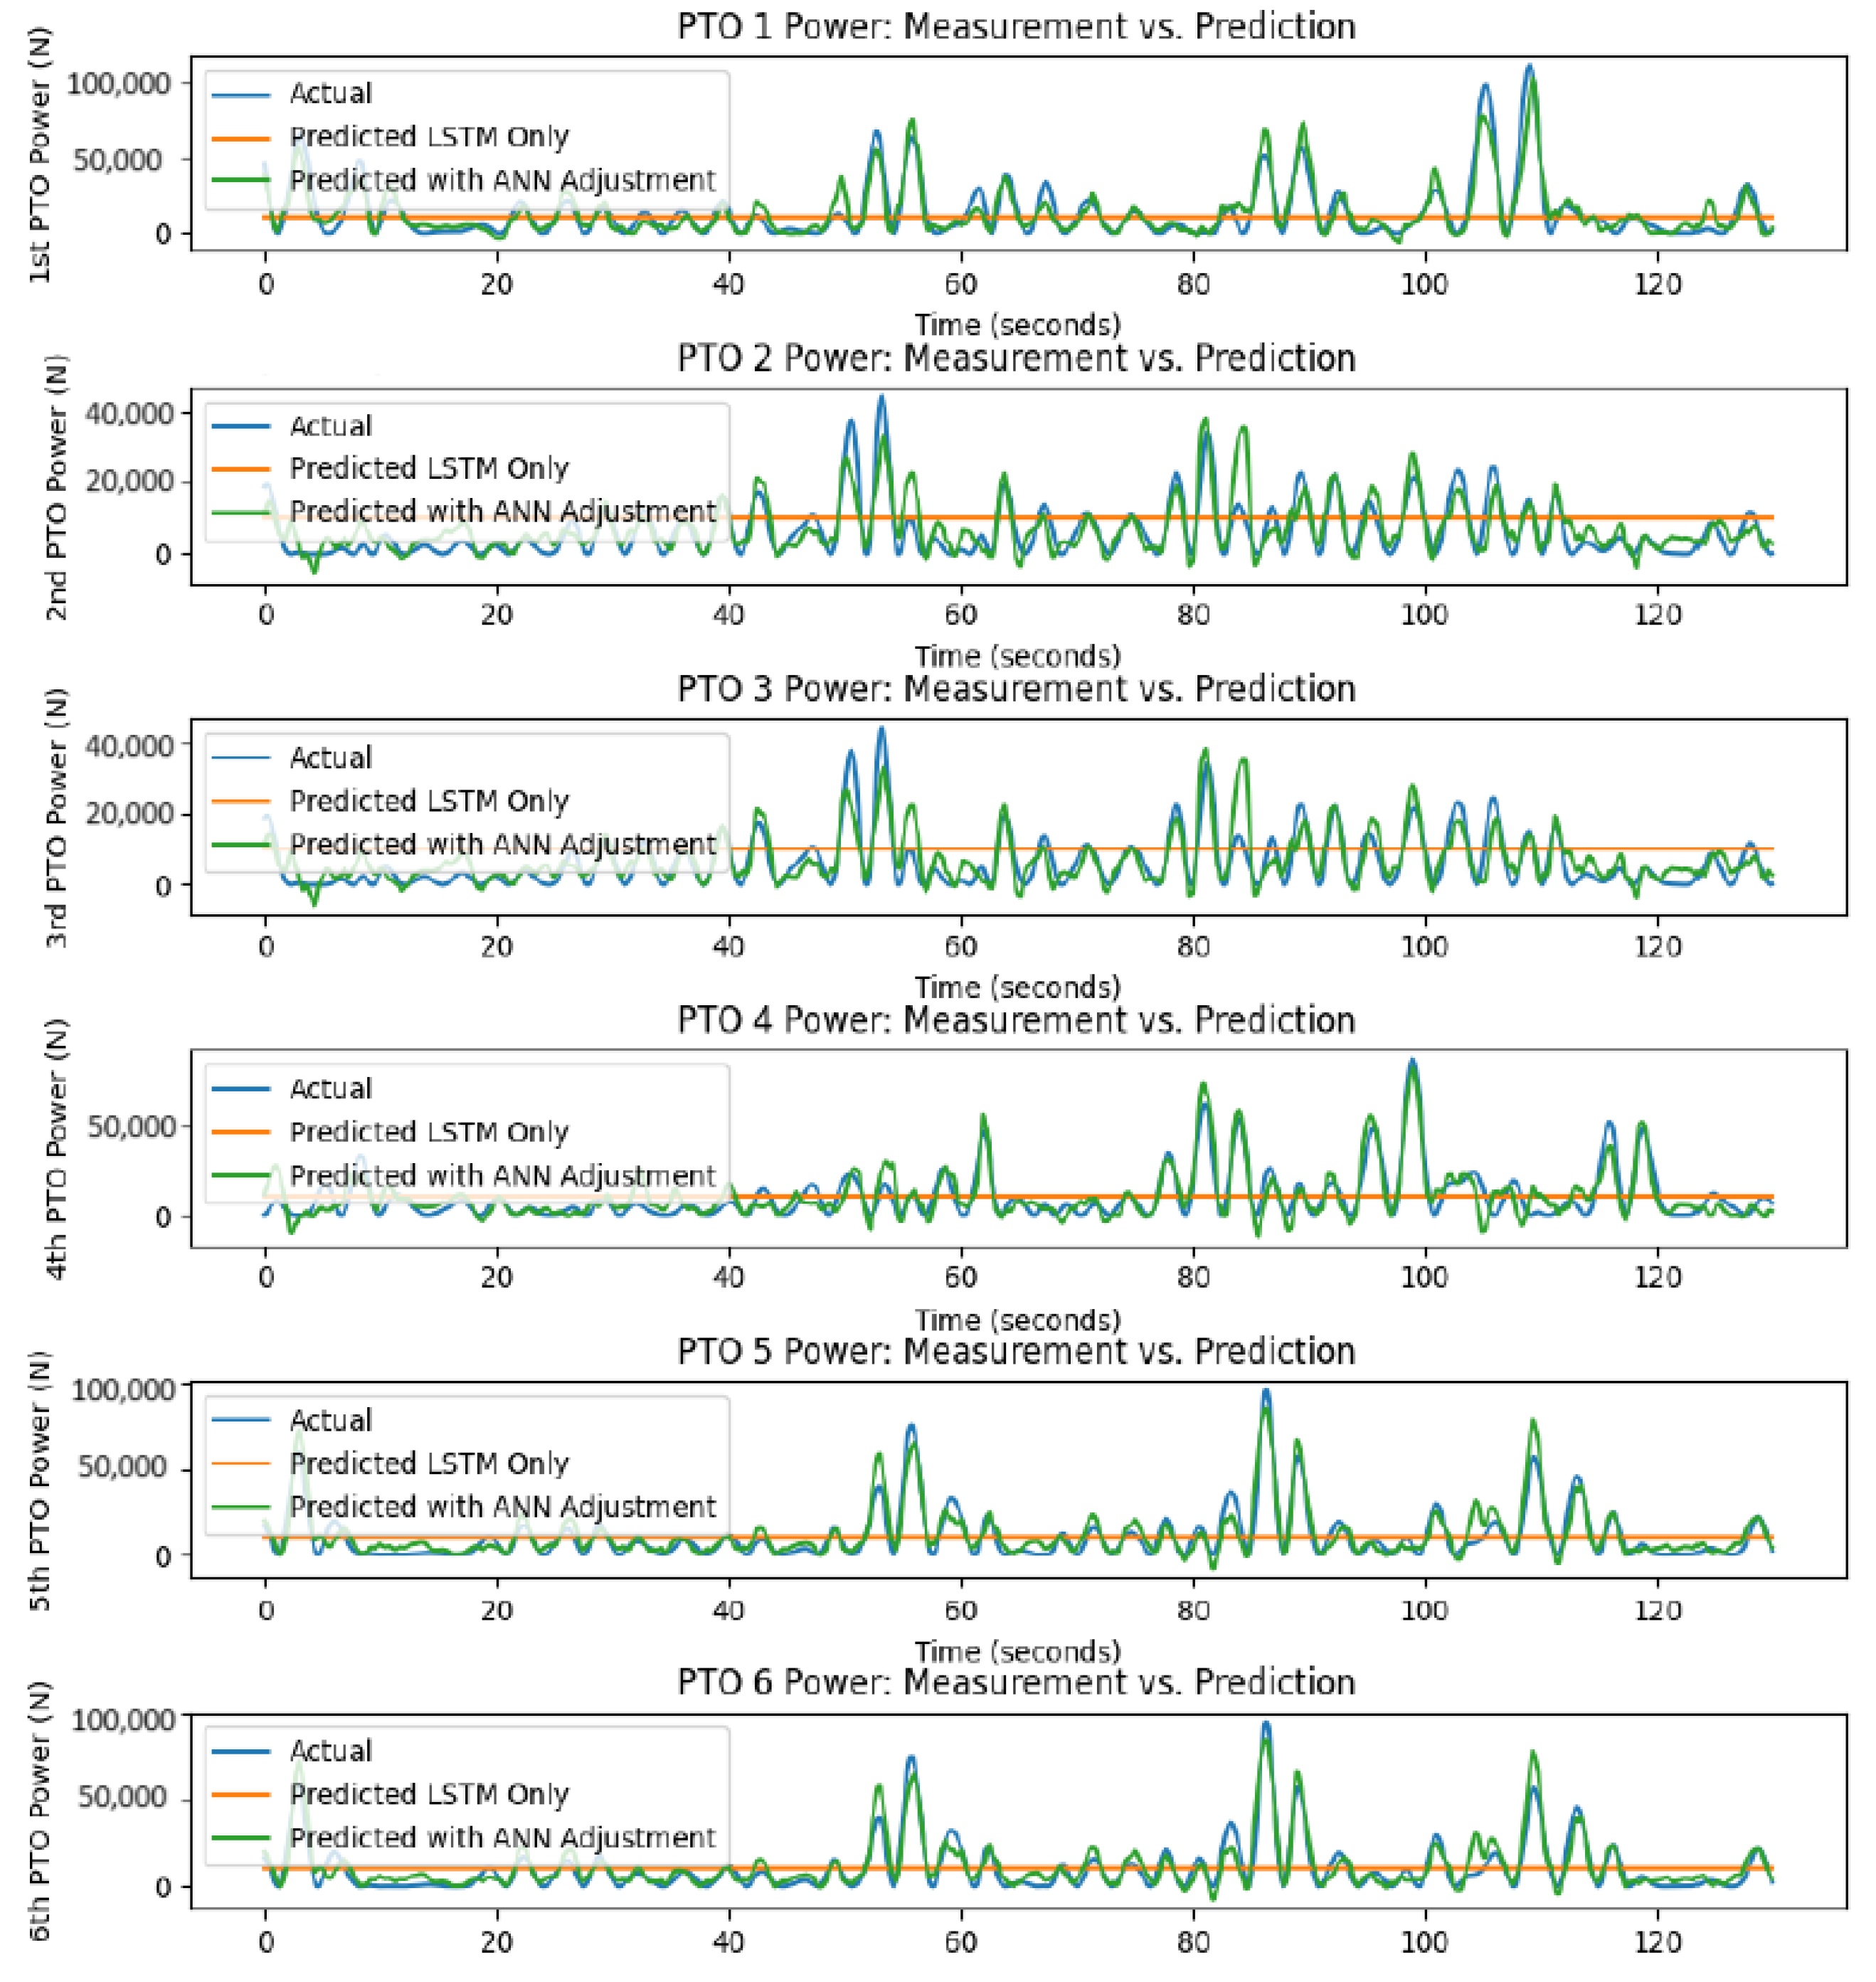
4.2.4. PTO Power Output Prediction Comparison
4.3. WP2.3—Predictive Maintenance
4.4. WP2.4—Optimised Control
4.4.1. System Dynamics and State-Space Representation
4.4.2. MPC Control Framework

| Control Approach | Description | Advantages | Limitations |
|---|---|---|---|
| Baseline Proportional Control (Figure 26a) | Simple control where PTO force is proportional to velocity. optimised for average wave conditions and includes position constraints for stability. | Computationally efficient; ensures system stability. | Limited adaptability to varying sea states and nonlinear dynamics. |
| Reduced-State Linear MPC (Figure 26b) | Focuses on hydrodynamic states using a simplified linear model. Solves quadratic programming to optimise energy capture and enforce position/velocity constraints. | Balances computational efficiency and adaptability to wave states. | Excludes PTO dynamics; may yield suboptimal results. |
| Full-State Linear MPC (Figure 26c) | Incorporates hydrodynamic, mechanical, and PTO dynamics for comprehensive control. Solves an optimisation problem with physical constraints over a prediction horizon. | Achieves superior energy output and ensures compliance with constraints. | High computational cost due to complexity. |
- System Constraints
- Wave Prediction
4.4.3. Results and Discussion
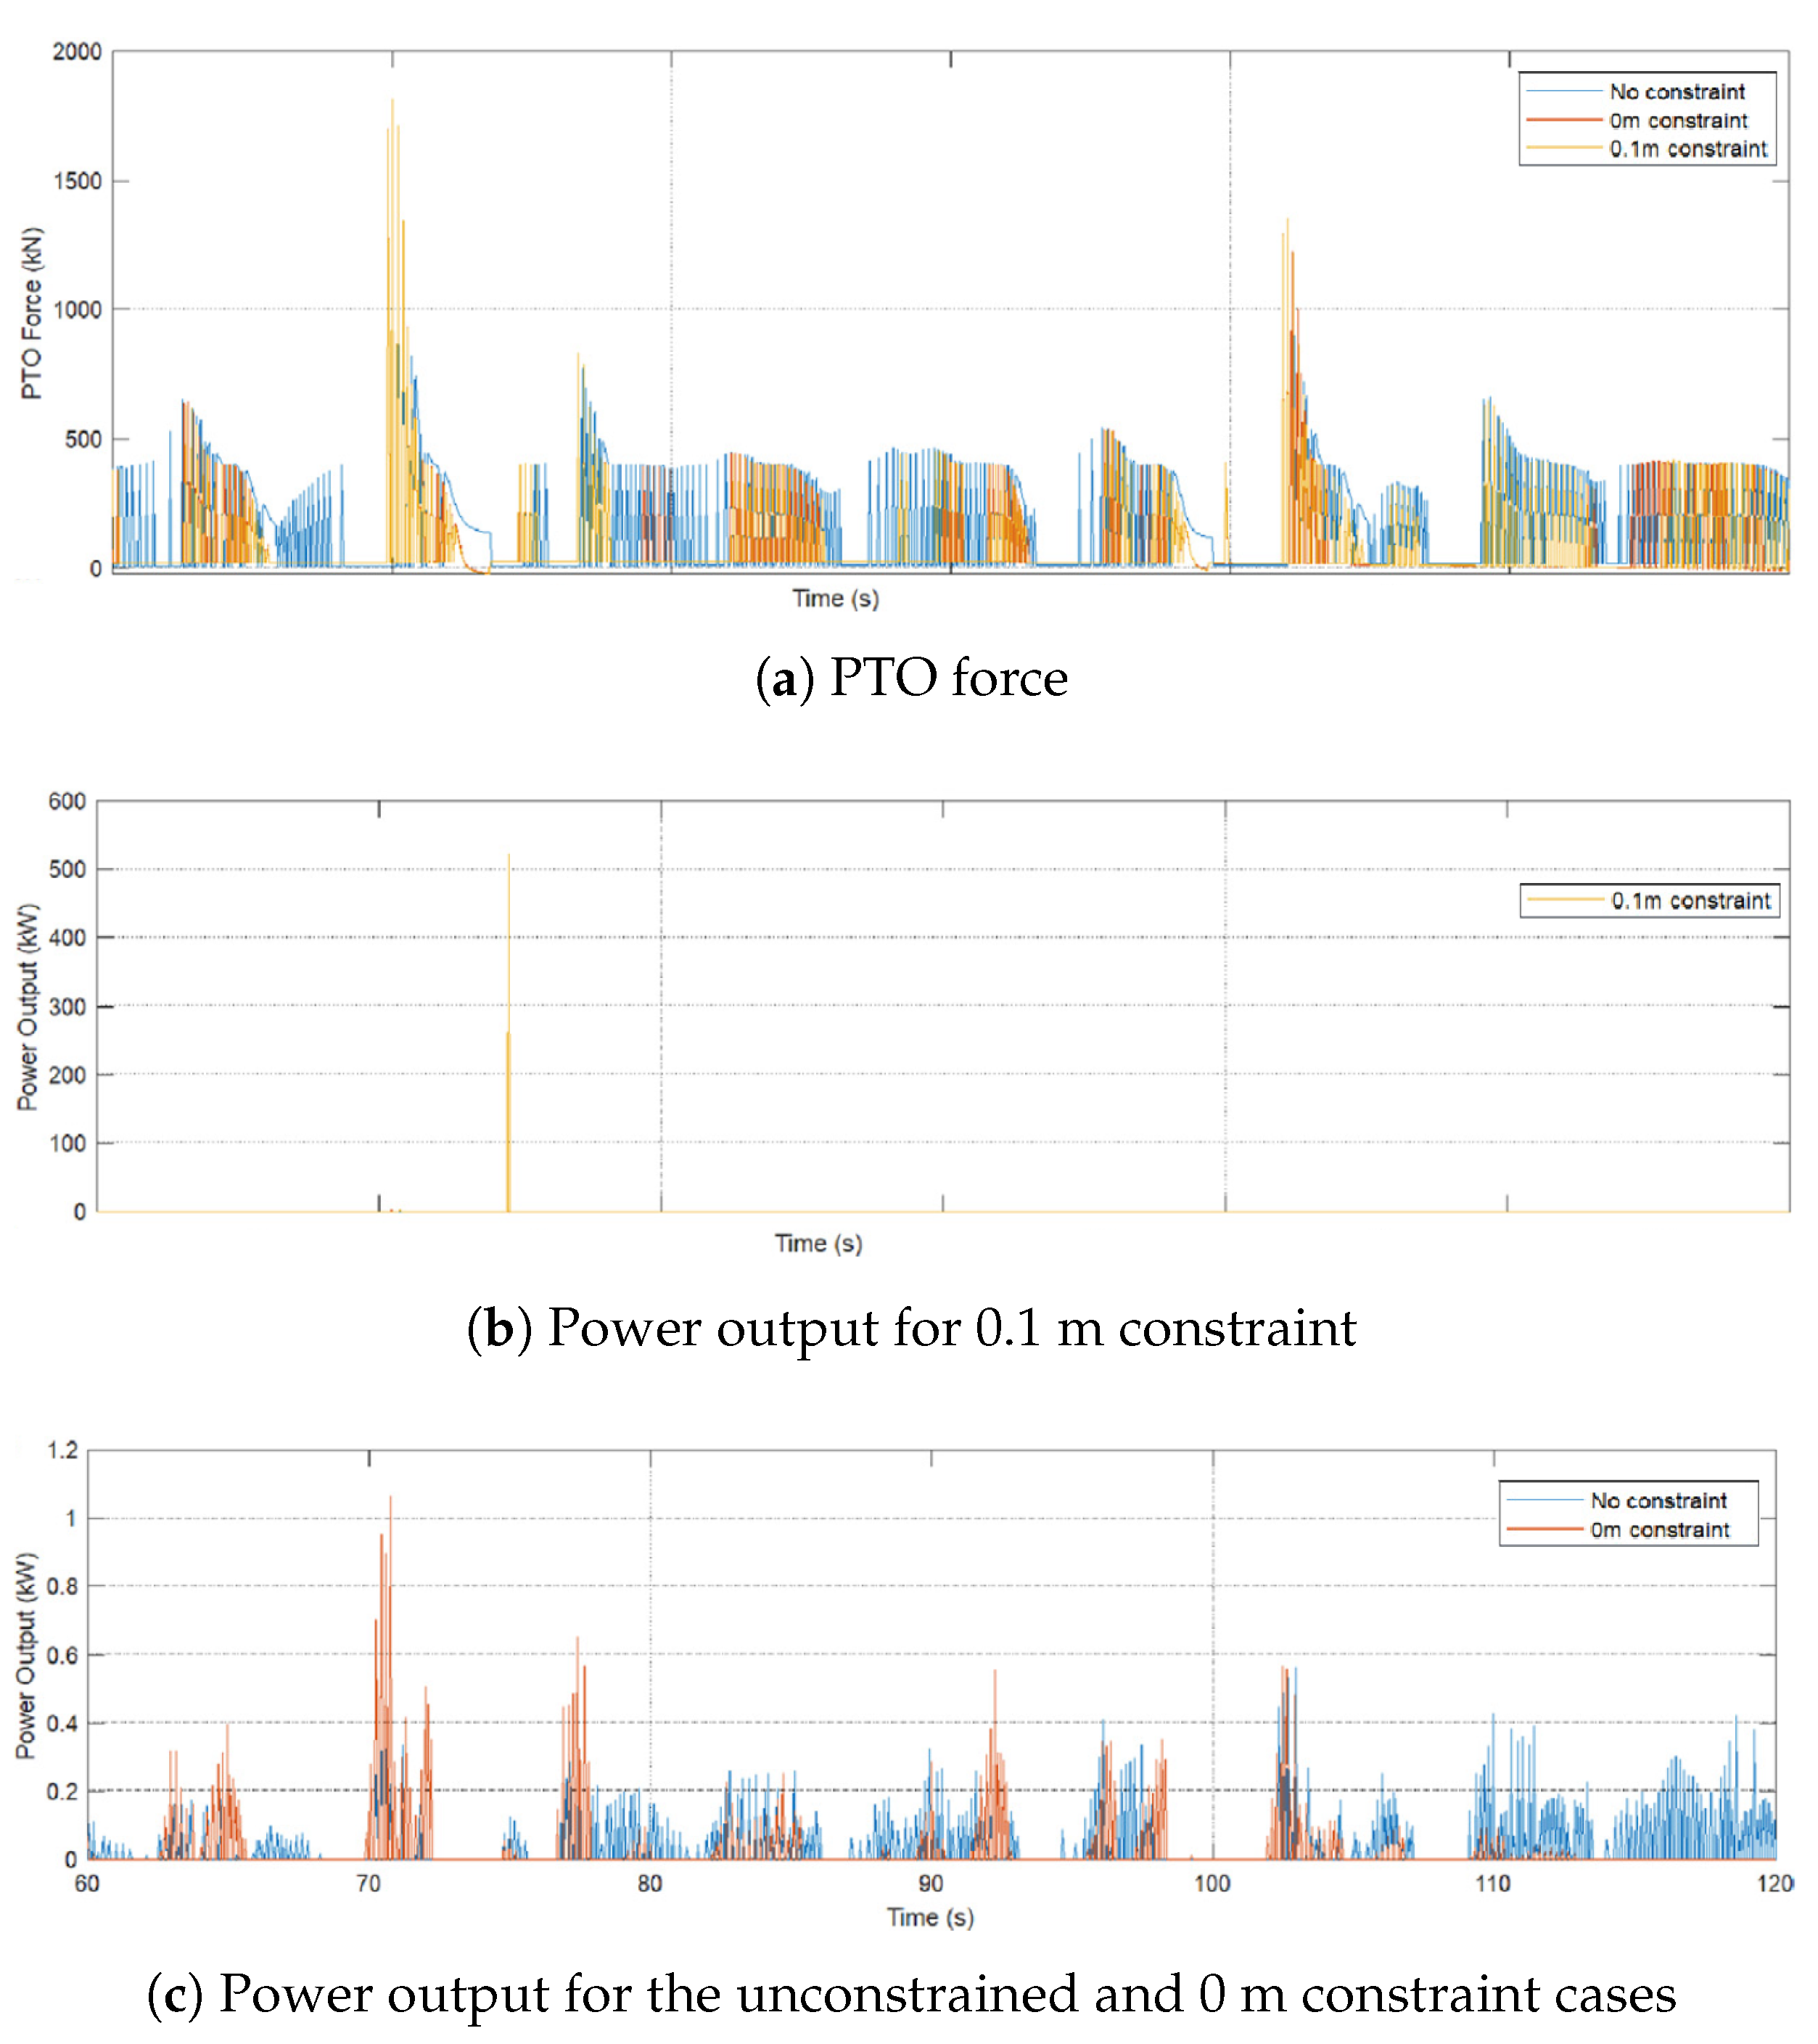
- Impact of Constraints on Reduced-State MPC
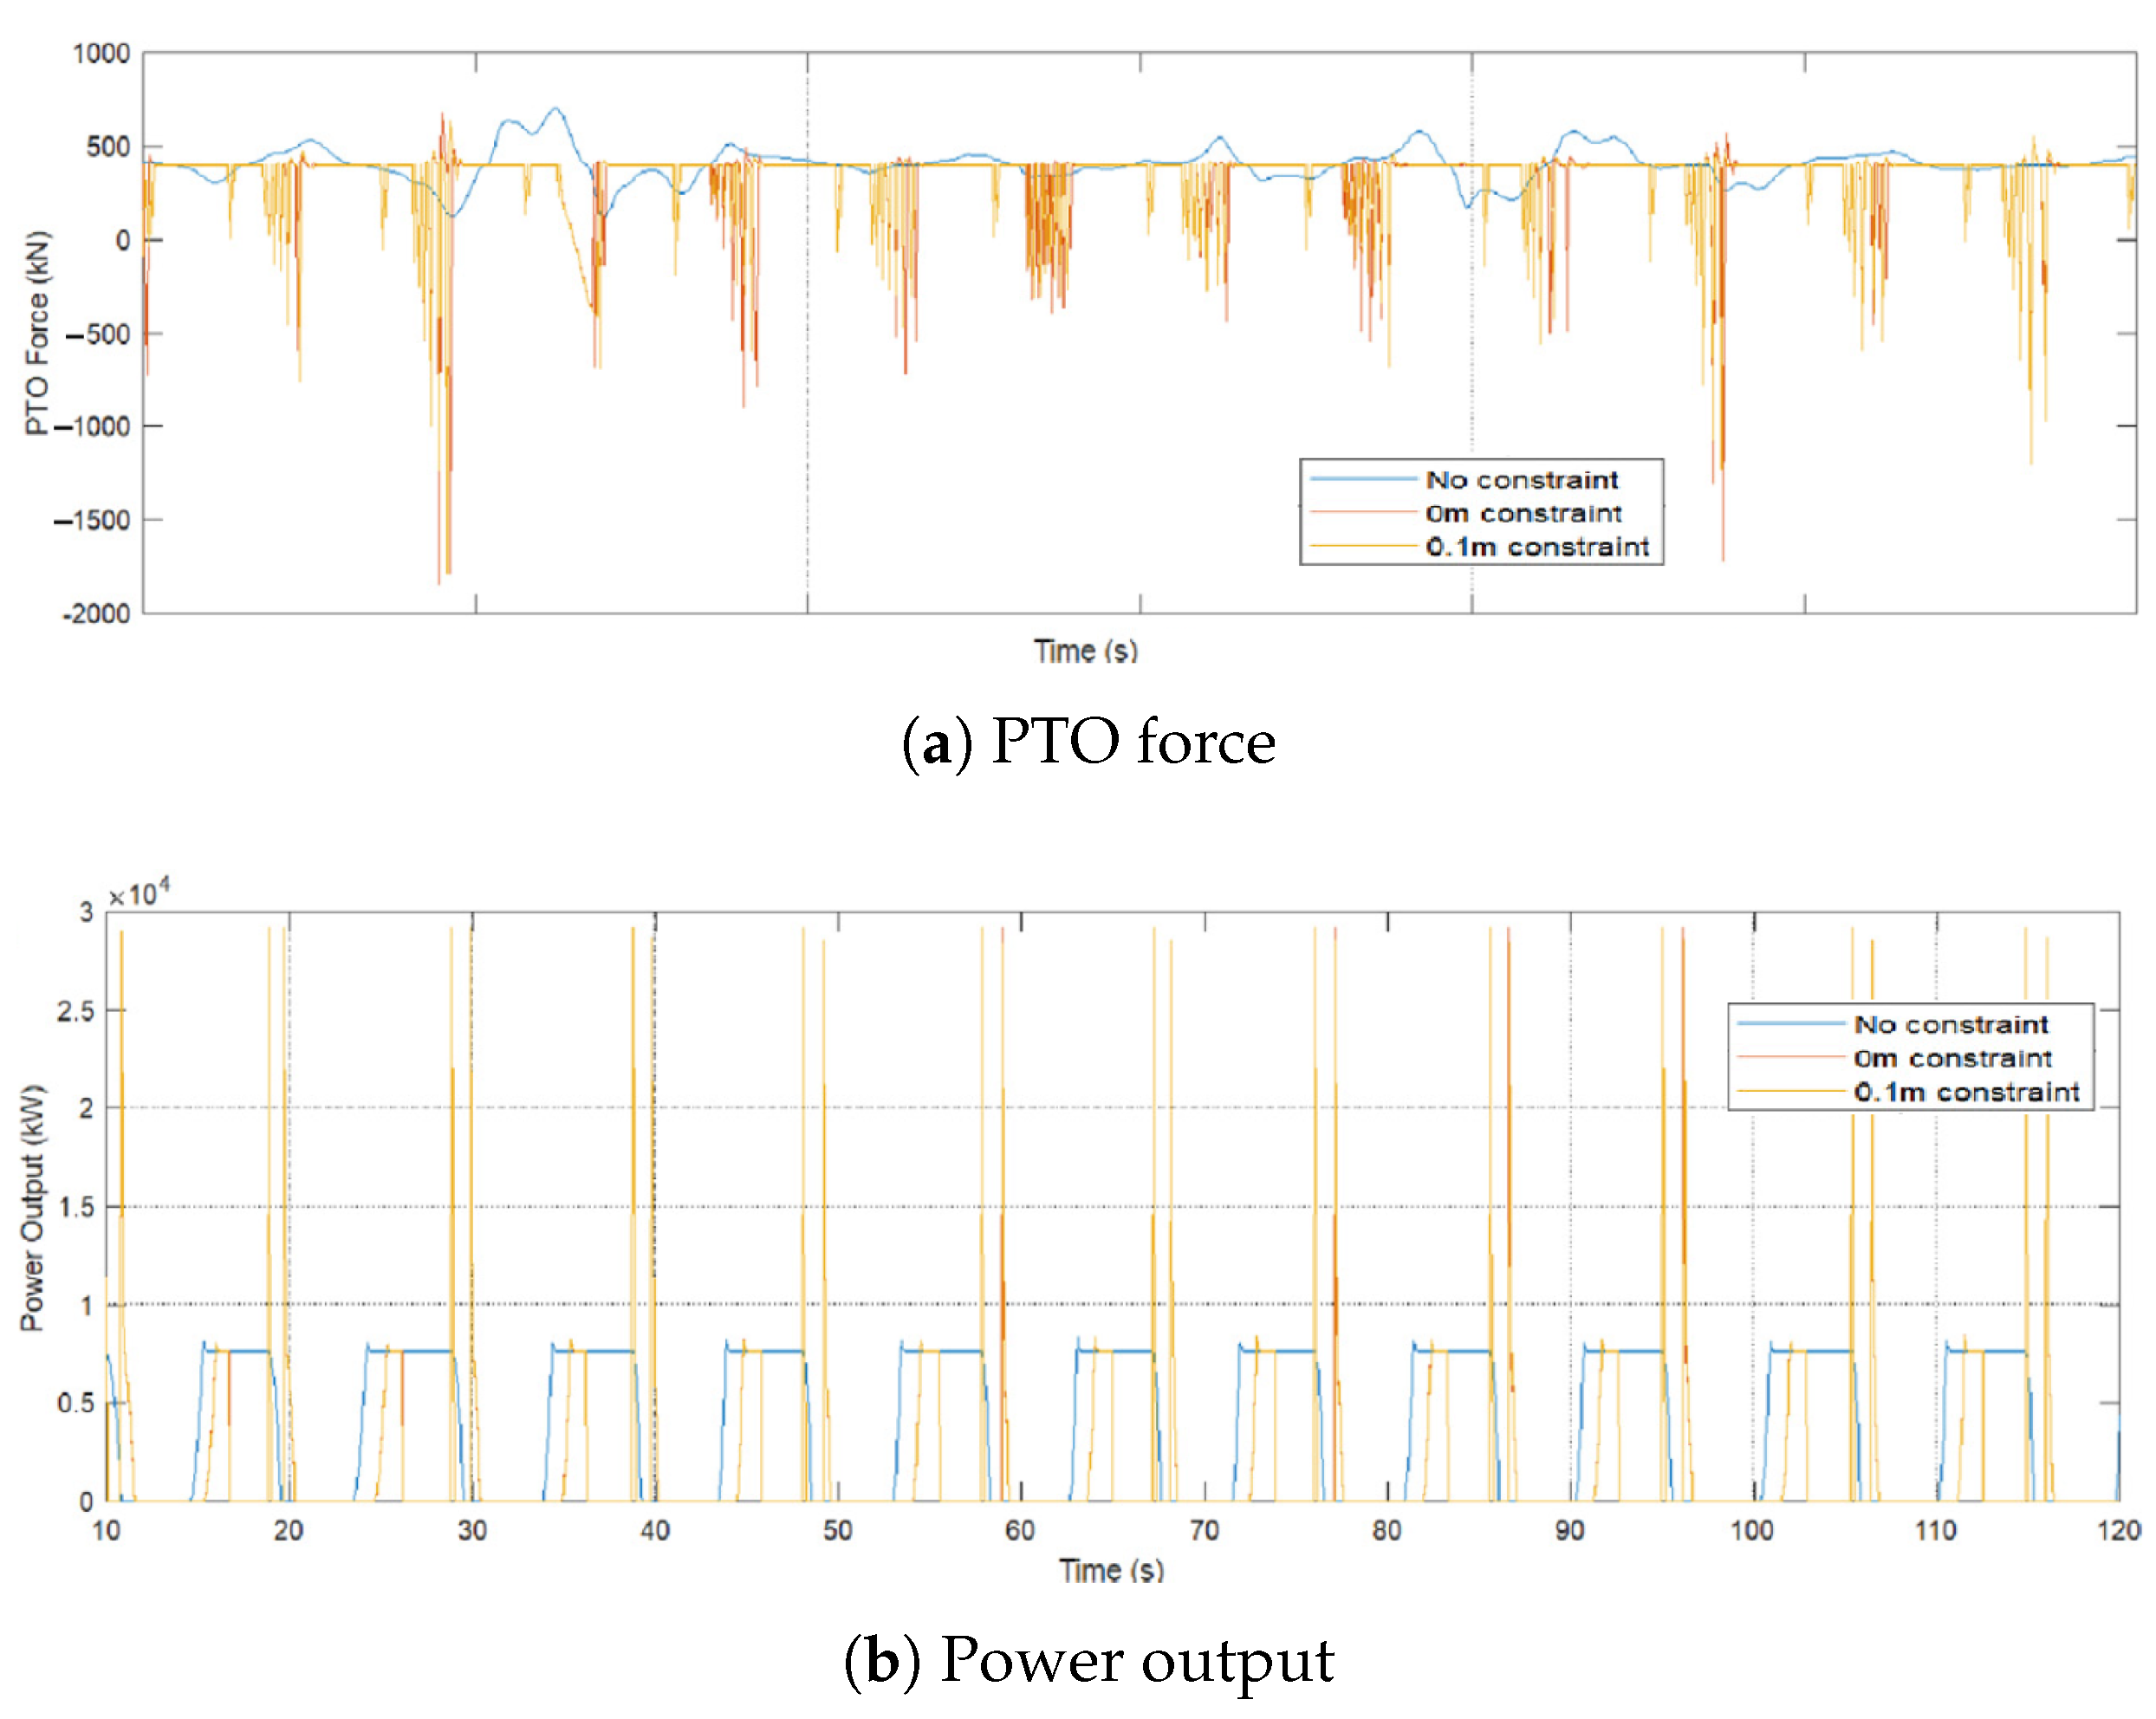
- Performance of Full-State MPC
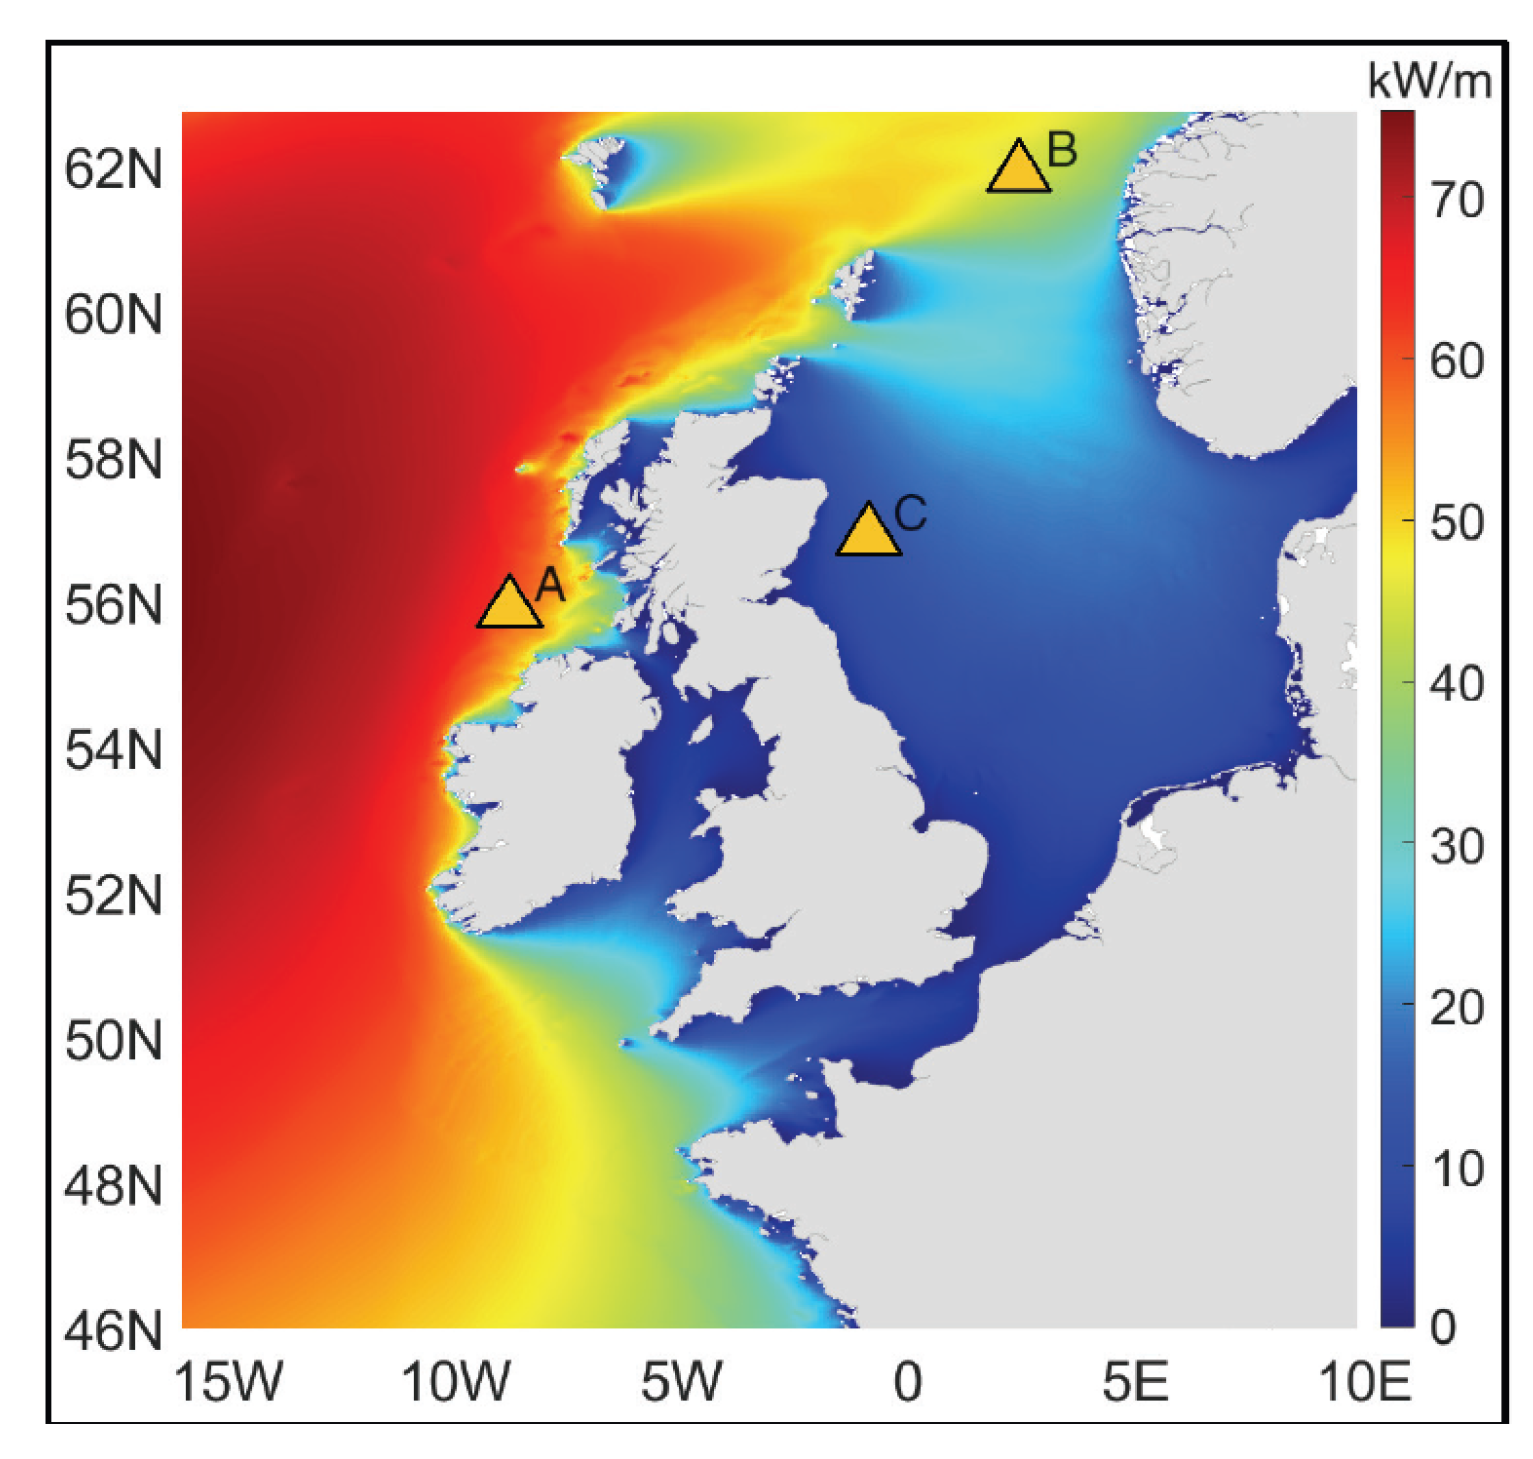
5. WP3: Sea State Forecasting and Resource Evaluation
5.1. WP3.1—Resource Characterisation
5.1.1. Wave Energy Resource Dynamics in the North-West European Shelf
- Wave Power Calculation
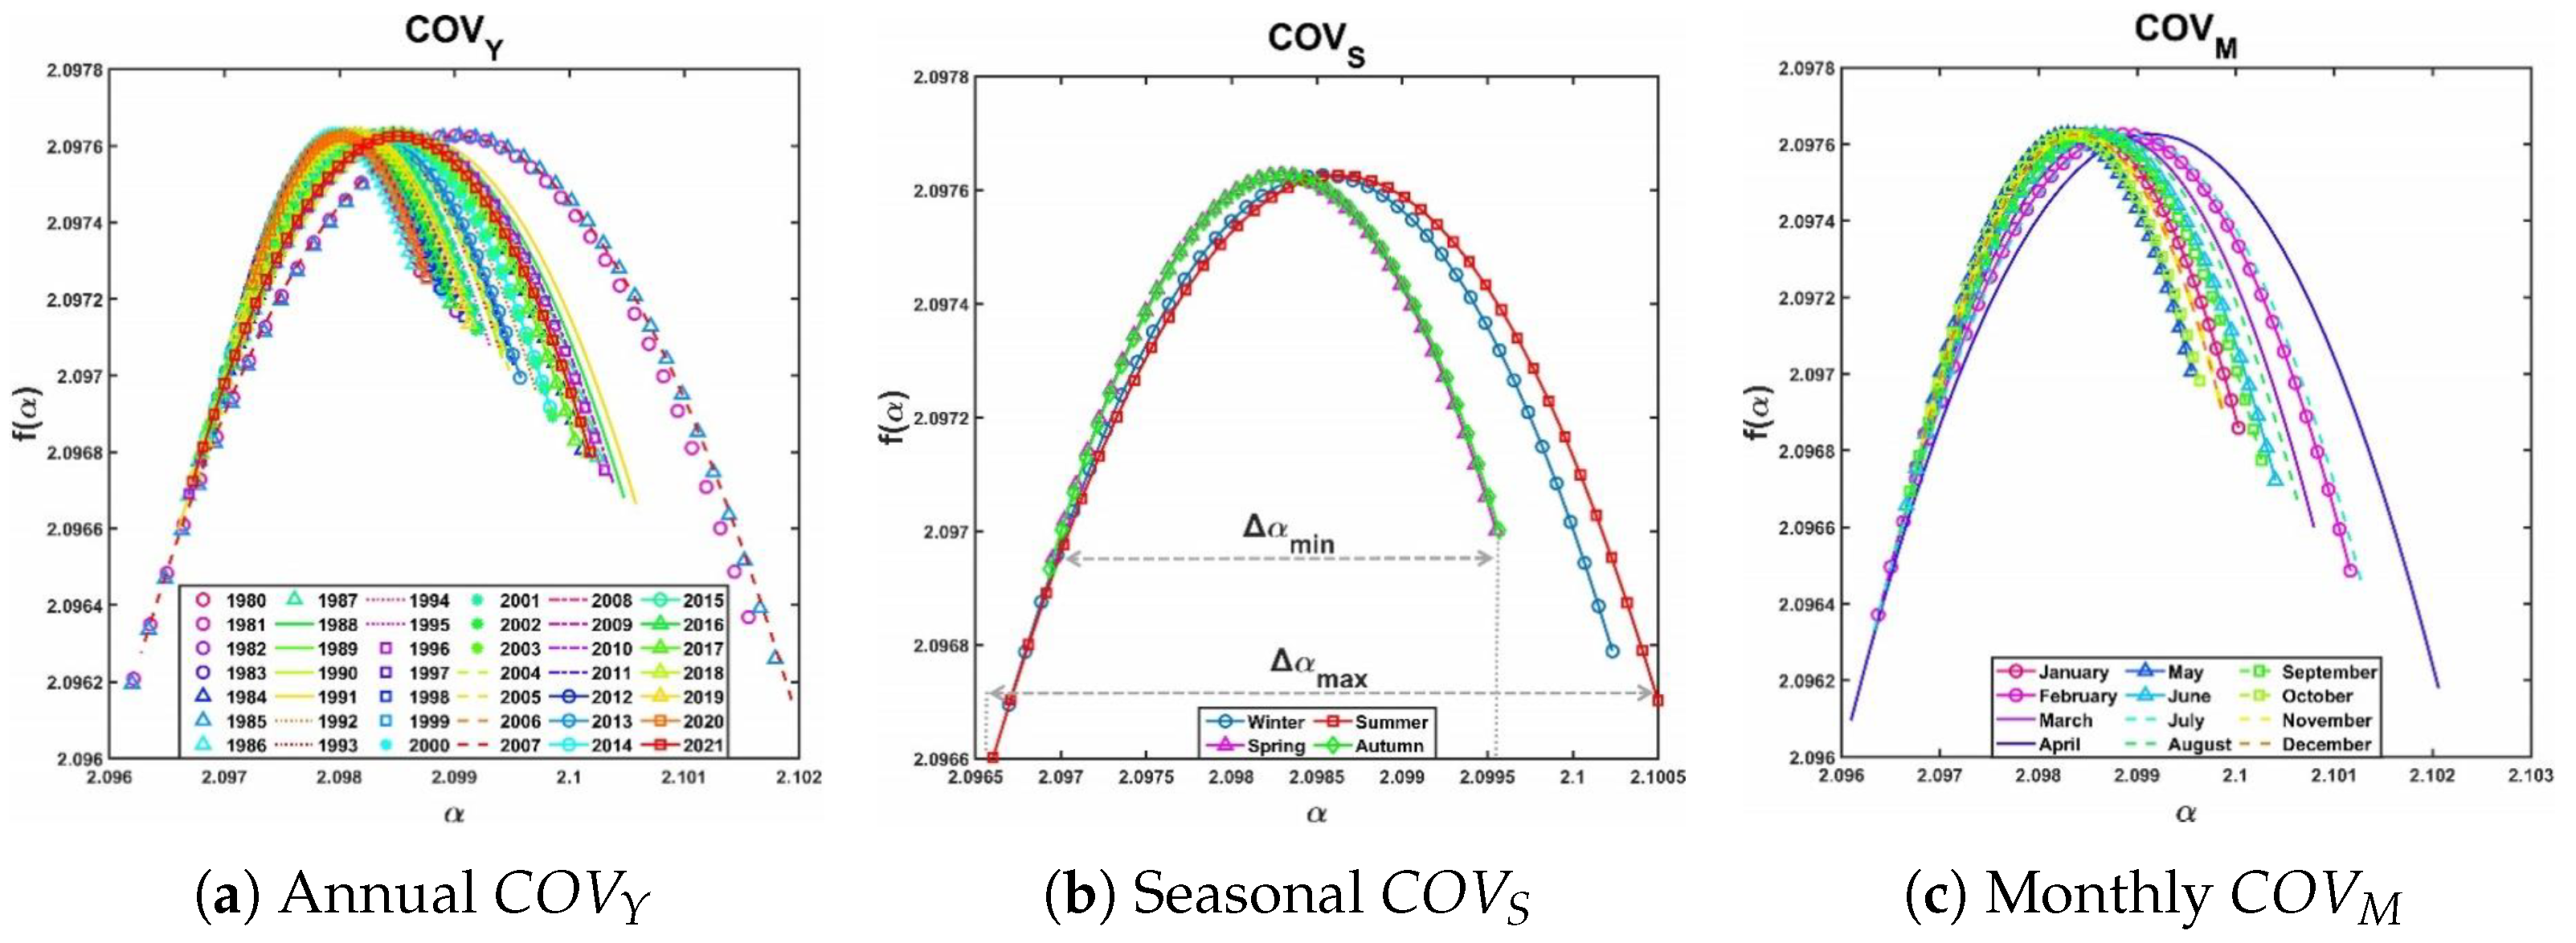
- Variability Metrics
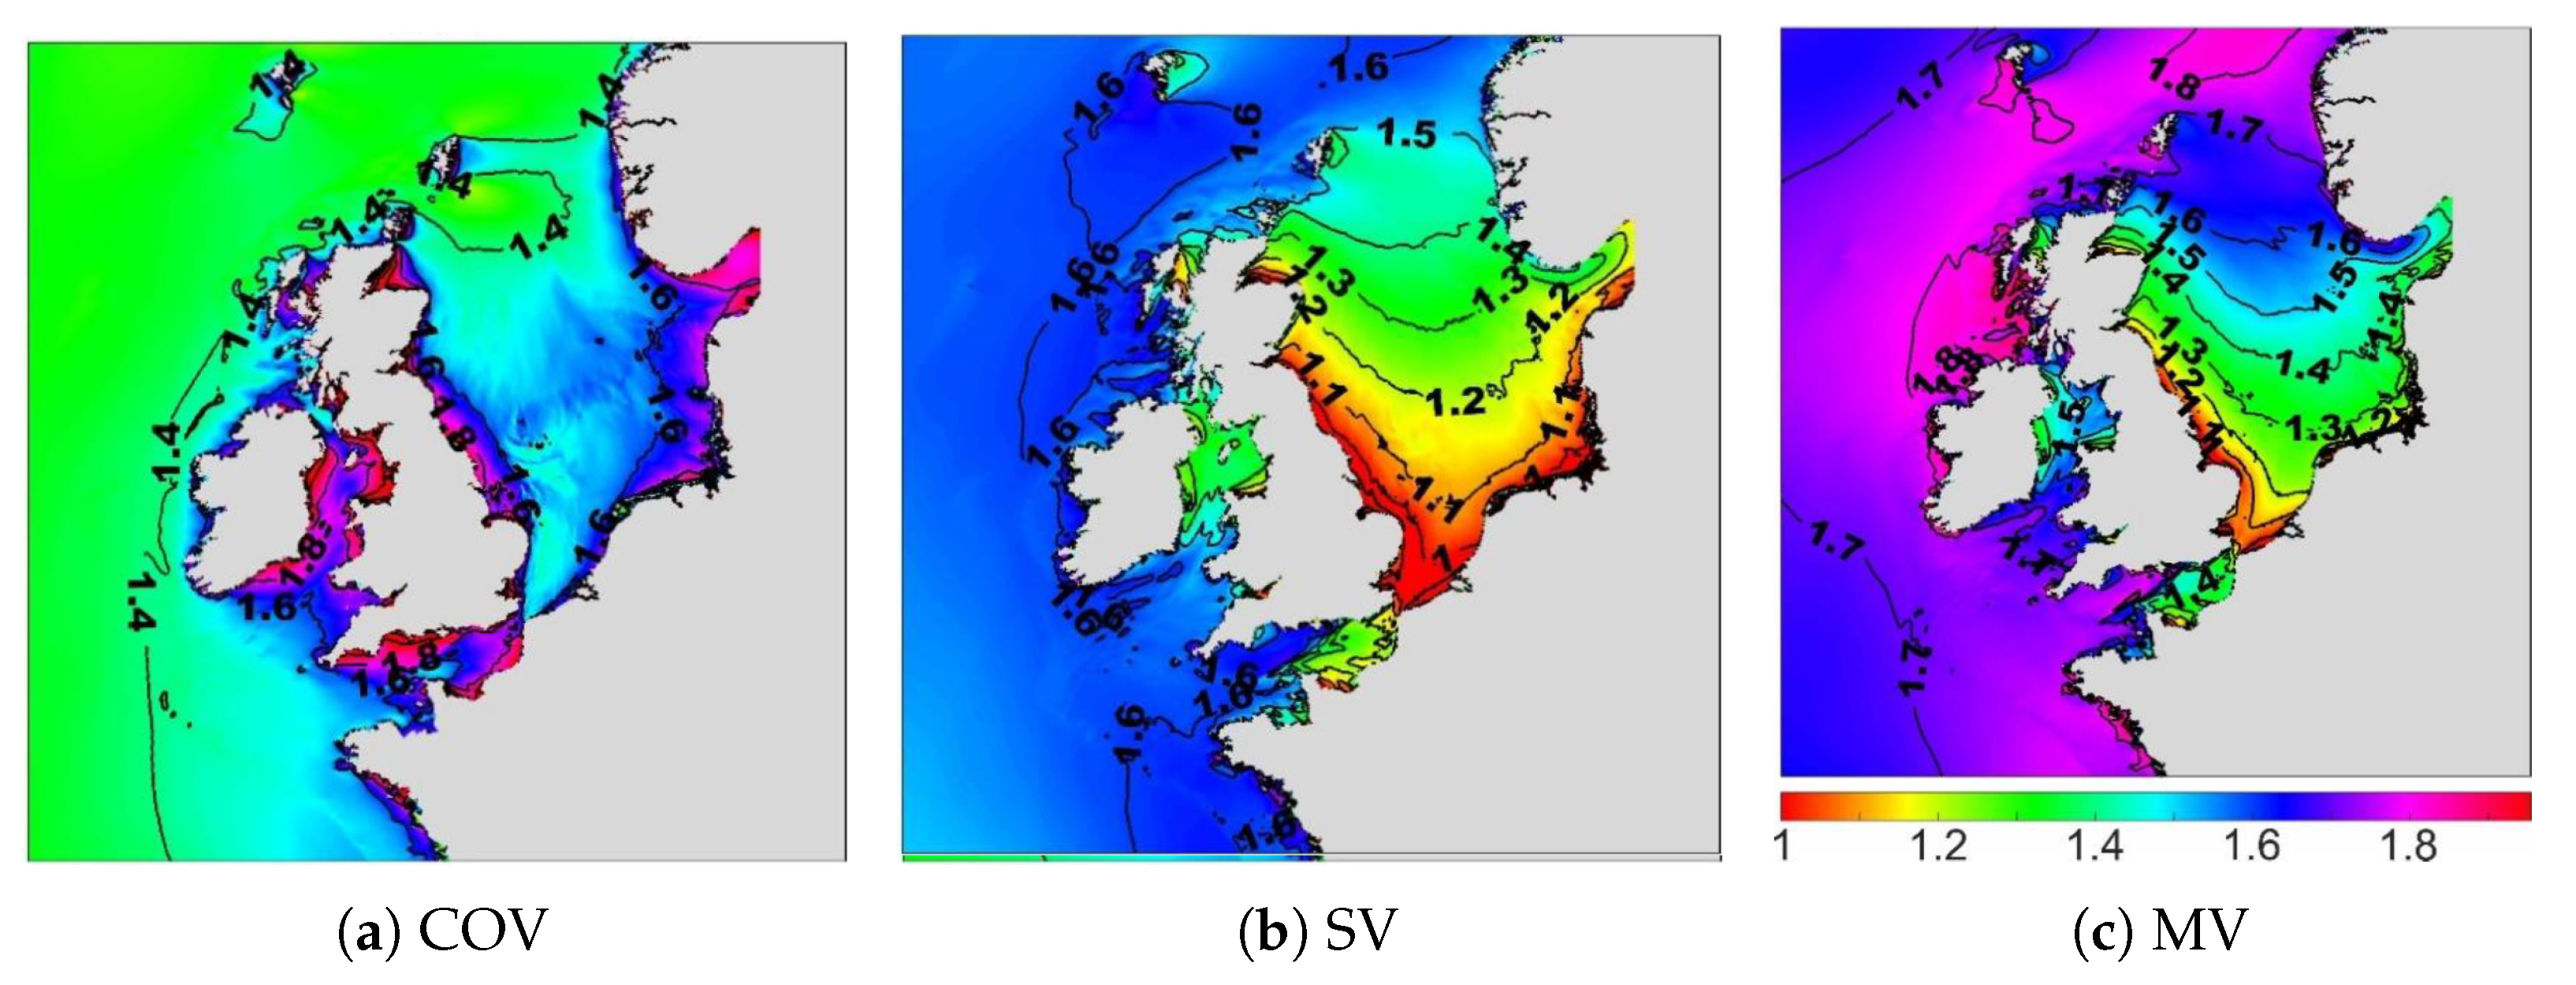
- Results
5.1.2. Site-Specific Assessments and Optimisation
5.1.3. Uncertainty Mitigation and Reliability Improvement in Wave Energy Resource Assessments
- Wave Energy Flux and Uncertainty Metrics
- Bias Correction Techniques
- Comparison of Metrics and BC Efficiency
5.2. WP3.2—Efficiency Testing
5.3. WP3.3—Array Effects
6. WP4: Validation and Cost Analysis
6.1. WP4.1—Validation and Demonstration
6.2. WP4.2—Array Deployment
6.2.1. Scalability of TALOS-WEC Arrays
- Distributed energy extraction: Arrays of TALOS-WECs exploit constructive wave interactions, enhancing energy capture while mitigating destructive interference effects.
- Adaptive spacing and alignment: Optimal spacing ensures maximum energy absorption while minimising wake-induced losses. Alignment with dominant wave directions improves array performance under varying marine conditions.
- Modular design flexibility: Each TALOS-WEC unit operates independently, allowing scalable configurations customised to site-specific wave climates and energy demands.
6.2.2. Array Performance and Interference Effects
6.2.3. Challenges for Large-Scale Deployment
- Wake effects and hydrodynamic loads: Arrays face complex wake interactions, which can reduce energy capture efficiency for downstream units. Advanced simulations are necessary to model these effects and optimise array configurations.
- Grid integration and power management: Scaling up arrays requires efficient power conditioning and smoothing. Integration with BESS ensures grid compatibility by addressing variability in wave energy output.
- Structural and mooring system durability: Large arrays impose significant loads on mooring and structural systems, especially under extreme marine conditions.
6.3. WP4.3—LCOE Assessment
6.3.1. Levelised Cost of Wave Energy
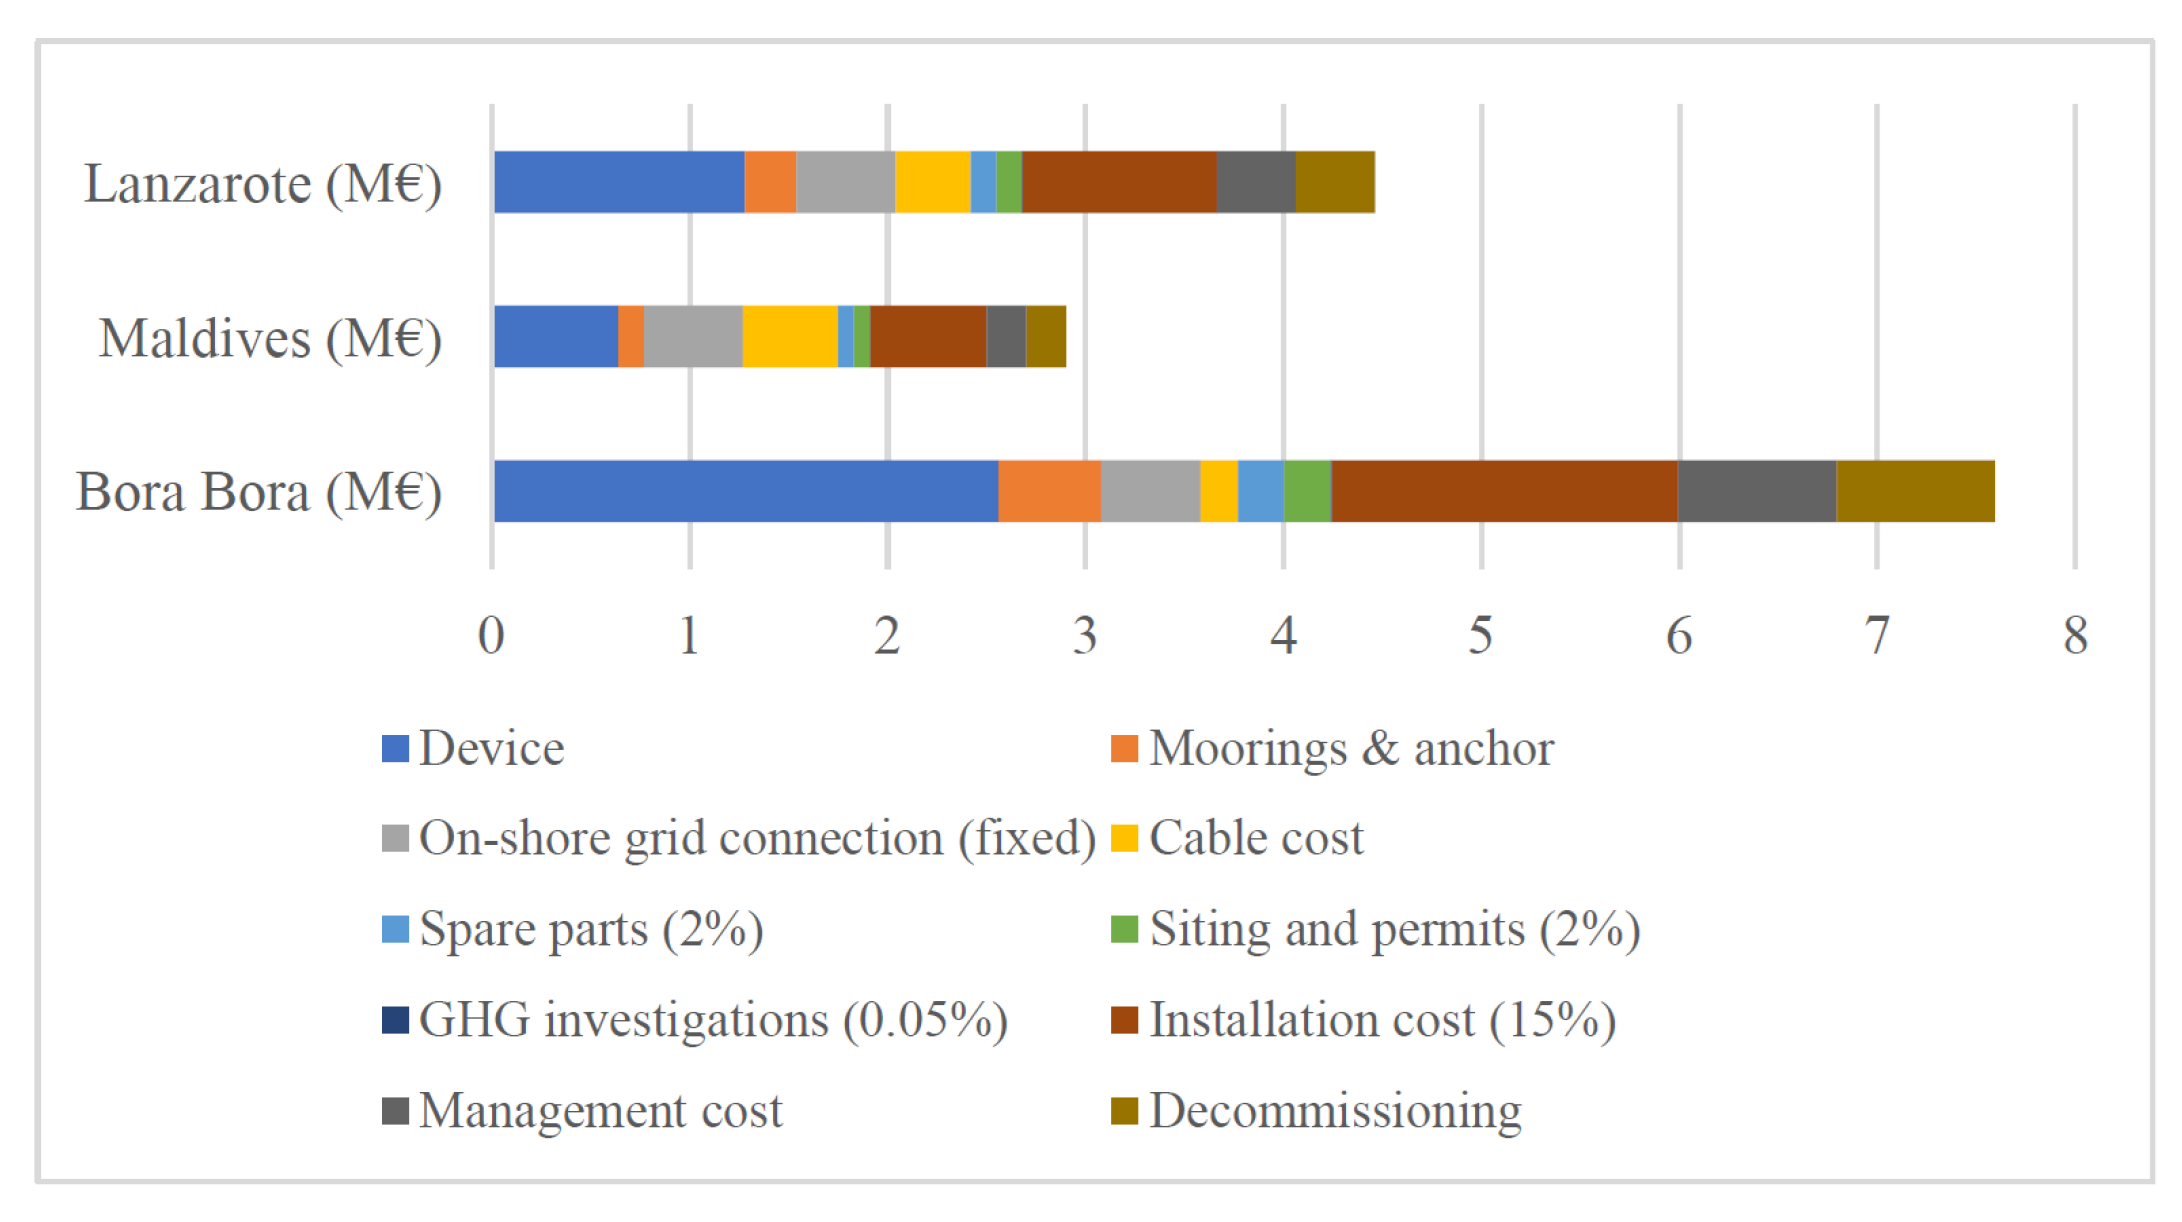
6.3.2. Cost Breakdown
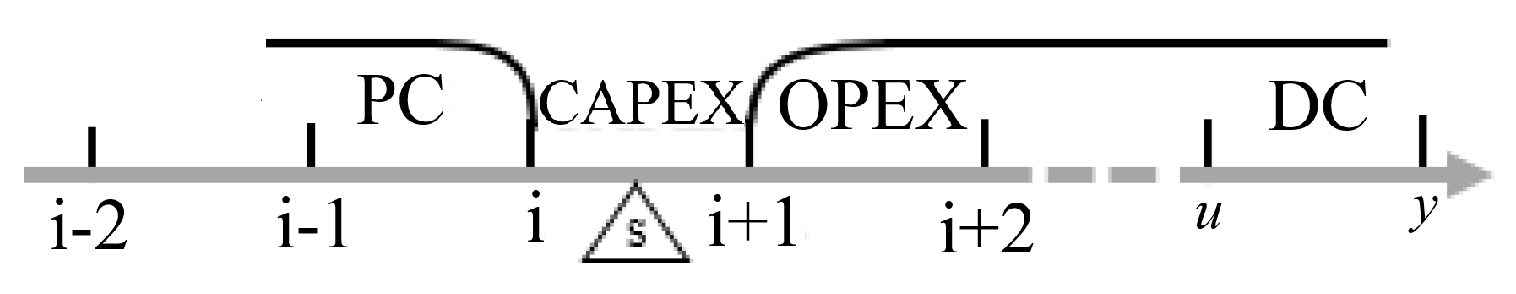
- Capital Expenditure (CAPEX)
- Operational Expenditure (OPEX)
- Decommissioning costs (DC)
- Pre-installation Costs (PC)
6.3.3. Seasonal and Geographic Variability
6.3.4. Advanced Financial Metrics
6.3.5. LCOE Sensitivity to Discount Rate and Discount Factor
- At , the LCOE exceeds $160/MWh, limiting cost competitiveness.
- Lowering to 6% reduces the LCOE to approximately $102/MWh, demonstrating the importance of favourable financing conditions.
7. Results and Key Findings
8. Discussions and Conclusions
9. Challenges and Future Work
Author Contributions
Funding
Conflicts of Interest
References
- Kober, T.; Schiffer, H.W.; Densing, M.; Panos, E. Global energy perspectives to 2060–WEC’s World Energy Scenarios 2019. Energy Strategy Rev. 2020, 31, 100523. [Google Scholar] [CrossRef]
- Kwilinski, A.; Dobrovolska, O.; Wołowiec, T.; Cwynar, W.; Didenko, I.; Artyukhov, A.; Dluhopolskyi, O. Carbon dioxide, nitrous oxide, and methane: What types of greenhouse gases are most affected by green investments and renewable energy development? Energies 2024, 17, 804. [Google Scholar] [CrossRef]
- Hassan, S.T.; Baloch, M.A.; Bui, Q.; Khan, N.H. The heterogeneous impact of geopolitical risk and environment-related innovations on greenhouse gas emissions: The role of nuclear and renewable energy in the circular economy. Gondwana Res. 2024, 127, 144–155. [Google Scholar] [CrossRef]
- Gayen, D.; Chatterjee, R.; Roy, S. A review on environmental impacts of renewable energy for sustainable development. Int. J. Environ. Sci. Technol. 2024, 21, 5285–5310. [Google Scholar] [CrossRef]
- Girgibo, N.; Hiltunen, E.; Lü, X.; Mäkiranta, A.; Tuomi, V. Risks of climate change effects on renewable energy resources and the effects of their utilization on the environment. Energy Rep. 2024, 11, 1517–1534. [Google Scholar] [CrossRef]
- Nasr Esfahani, F.; Darwish, A.; Massoud, A. PV/Battery Grid Integration Using a Modular Multilevel Isolated SEPIC-Based Converter. Energies 2022, 15, 5462. [Google Scholar] [CrossRef]
- Shan, B.; Ai, T.; Wang, K. Triboelectric nanogenerator for ocean energy harvesting: A review of technological advances and future perspectives. Int. J. Electrochem. Sci. 2024, 19, 100694. [Google Scholar] [CrossRef]
- Meyssignac, B.; Fourest, S.; Mayer, M.; Johnson, G.C.; Calafat, F.M.; Ablain, M.; Benveniste, J. North Atlantic heat transport convergence derived from a regional energy budget using different ocean heat content estimates. Surv. Geophys. 2024, 45, 1855–1874. [Google Scholar] [CrossRef] [PubMed]
- Lu, Z.Q.; Zhao, L.; Fu, H.L.; Yeatman, E.; Ding, H.; Chen, L.Q. Ocean wave energy harvesting with high energy density and self-powered monitoring system. Nat. Commun. 2024, 15, 6513. [Google Scholar] [CrossRef] [PubMed]
- Al Mubarak, F.; Rezaee, R.; Wood, D.A. Economic, societal, and environmental impacts of available energy sources: A review. Eng 2024, 5, 1232–1265. [Google Scholar] [CrossRef]
- IEA. Key World Energy Statistics 2021. Available online: https://iea.blob.core.windows.net/assets/52f66a88-0b63-4ad2-94a5-29d36e864b82/KeyWorldEnergyStatistics2021.pdf (accessed on 23 October 2024).
- Reikard, G.; Robertson, B.; Bidlot, J.R. Combining wave energy with wind and solar: Short-term forecasting. Renew. Energy 2015, 81, 442–456. [Google Scholar] [CrossRef]
- Wan, L.; Moan, T.; Gao, Z.; Shi, W. A review on the technical development of combined wind and wave energy conversion systems. Energy 2024, 294, 130885. [Google Scholar] [CrossRef]
- Mahdy, A.; Hasanien, H.M.; Aleem, S.H.A.; Al-Dhaifallah, M.; Zobaa, A.F.; Ali, Z.M. State-of-the-Art of the Most Commonly Adopted Wave Energy Conversion Systems. Ain Shams Eng. J. 2024, 15, 102322. [Google Scholar] [CrossRef]
- Guo, B.; Ringwood, J.V. A Review of Wave Energy Technology from a Research and Commercial Perspective. IET Renew. Power Gener. 2021, 14, 3065–3090. [Google Scholar] [CrossRef]
- Ramos-Marin, S.; Soares, C.G. Overview of the Wave Energy Resources in European Regional Seas. In Advances in Maritime Technology and Engineering; CRC Press: Boca Raton, FL, USA, 2024. [Google Scholar] [CrossRef]
- Martić, I.; Degiuli, N.; Grlj, C.G. Scaling of Wave Energy Converters for Optimum Performance in the Adriatic Sea. Energy 2024, 294, 130922. [Google Scholar] [CrossRef]
- Yun, S.-M.; Shin, H.-S.; Park, J.-C. Two-Way Coupling Simulation of Fluid-Multibody Dynamics for Estimating Power Generation Performance of Point Absorber Wave Energy Converters. Energies 2024, 17, 930. [Google Scholar] [CrossRef]
- Phan, C.B.; Ahn, K.K. Experimental Investigation of a Point Absorber Wave Energy Converter Using an Inertia Adjusting Mechanism. Appl. Sci. 2024, 14, 5506. [Google Scholar] [CrossRef]
- Gaspar, J.F.; Pinheiro, R.F.; Mendes, M.J.; Kamarlouei, M.; Soares, C.G. Review on Hardware-in-the-Loop Simulation of Wave Energy Converters and Power Take-Offs. Renew. Sustain. Energy Rev. 2024, 191, 114144. [Google Scholar] [CrossRef]
- Chen, G.; Kuang, R.; Li, W.; Cui, K.; Fu, D.; Yang, Z.; Shen, Y. Numerical Study on Efficiency and Robustness of Wave Energy Converter-Power Take-Off System for Compressed Air Energy Storage. Renew. Energy 2024, 232, 121080. [Google Scholar] [CrossRef]
- Yang, B.; Duan, J.; Chen, Y.; Wu, S.; Li, M.; Cao, P.; Jiang, L. A critical survey of power take-off systems based wave energy converters: Summaries, advances, and perspectives. Ocean Eng. 2024, 298, 117149. [Google Scholar] [CrossRef]
- Sun, P.; Wang, J. Long-Term Variability Analysis of Wave Energy Resources and Its Impact on Wave Energy Converters along the Chinese Coastline. Energy 2024, 288, 129644. [Google Scholar] [CrossRef]
- Kara, F. Hydrodynamic Performances of Wave Energy Converter Arrays in Front of a Vertical Wall. Ocean Eng. 2021, 235, 109459. [Google Scholar] [CrossRef]
- Falcão, A.; Gato, L.; Nunes, E. A Novel Radial Self-Rectifying Air Turbine for Use in Wave Energy Converters. Part 2: Results from Model Testing. Renew. Energy 2013, 53, 159–164. [Google Scholar] [CrossRef]
- Simmons, J.W., II; Van de Ven, J.D. A Comparison of Power Take-Off Architectures for Wave-Powered Reverse Osmosis Desalination of Seawater with Co-Production of Electricity. Energies 2023, 16, 7381. [Google Scholar] [CrossRef]
- Mehdipour, H.; Amini, E.; Naeeni, S.T.O.; Neshat, M.; Gandomi, A.H. Optimization of Power Take-Off System Settings and Regional Site Selection Procedure for a Wave Energy Converter. Energy Convers. Manag. X 2024, 22, 100559. [Google Scholar] [CrossRef]
- Abbaspour, M.; Farshforoush, A. Optimal Arrangements for Semi-Submersible Cylindrical Wave Energy Converters: A Study in Layout Optimization and Power Extraction Efficiency. Ocean Eng. 2024, 296, 116833. [Google Scholar] [CrossRef]
- Noad, I.F.; Porter, R. Optimization of Arrays of Flap Type Oscillating Wave Surge Converters. Appl. Ocean Res. 2015, 50, 237–253. [Google Scholar] [CrossRef]
- Mansouri, A.; El Magri, A.; Lajouad, R.; Giri, F.; Watil, A. Nonlinear Control Strategies with Maximum Power Point Tracking for Hybrid Renewable Energy Conversion Systems. Asian J. Control 2024, 26, 1047–1056. [Google Scholar] [CrossRef]
- Taylor, C.J.; Bradshaw, A.; Chaplin, R.V.; French, M.; Widden, M.B. Wave Energy Research at Lancaster University: PS Frog and Frond. In Proceedings of the World Renewable Energy Congress VII, Cologne, Germany, 29 June–5 July 2002. [Google Scholar]
- Orecon. Wave Energy Developer Orecon Hits Stormy Waters. Renewable Energy Focus. Available online: http://www.renewableenergyfocus.com/view/5700/wave-energy-developer-orecon-hits-stormy-waters (accessed on 29 October 2024).
- Tan, M.; Cen, Y.; Yang, Y.; Liu, X.; Si, Y.; Qian, P.; Zhang, D. Power Absorption Modelling and Analysis of a Multi-Axis Wave Energy Converter. IET Renew. Power Gener. 2021, 15, 3368–3384. [Google Scholar] [CrossRef]
- Antoniadis, I.A.; Georgoutsos, V.; Paradeisiotis, A.; Kanarachos, S.; Gryllias, K. Preliminary Assessment of a Wave Energy Conversion Principle, Using Fully Enclosed Multi-Axis Inertial Reaction Mechanisms. In Proceedings of the 2016 Sound and Vibration Conference, Athens, Greece, 10–14 July 2016; pp. 10–14. [Google Scholar]
- Shadmani, A.; Nikoo, M.R.; Gandomi, A.H.; Chen, M. An Optimization Approach for Geometry Design of Multi-Axis Wave Energy Converters. Energy 2024, 301, 131714. [Google Scholar] [CrossRef]
- Zhang, D.; George, A.; Wang, Y.; Gu, X.; Li, W.; Chen, Y. Wave Tank Experiments on the Power Capture of a Multi-Axis Wave Energy Converter. J. Mar. Sci. Technol. 2015, 20, 520–529. [Google Scholar] [CrossRef]
- Huang, S.; Shi, H.; Cao, F.; Tan, J.; Cheng, H.; Li, D.; Liu, S.; Gong, H.; Tao, J. Experimental Study on Interaction Between Degrees of Freedom in a Wave Buoy. J. Ocean Univ. China 2019, 18, 1256–1264. [Google Scholar] [CrossRef]
- Cordonnier, J.; Gorintin, F.; De Cagny, A.; Clément, A.H.; Babarit, A. SEAREV: Case Study of the Development of a Wave Energy Converter. Renew. Energy 2015, 80, 40–52. [Google Scholar] [CrossRef]
- Zhang, D.; Aggidis, G.; Wang, Y.; McCabe, A.; Li, W. Experimental Results from Wave Tank Trials of a Multi-Axis Wave Energy Converter. Appl. Phys. Lett. 2013, 103, 10. [Google Scholar] [CrossRef]
- Wu, Y.; Sheng, W.; Taylor, C.J.; Aggidis, G.; Ma, X. Enhancing Long-Term Predictive Accuracy in Wave Energy Converters Through a Dual-Model Approach. In Proceedings of the ISOPE International Ocean and Polar Engineering Conference, Rhodes, Greece, 16–21 June 2024. [Google Scholar]
- Cummins, W.E. The Impulse Response Function and Ship Motions; Report No. 1661; Department of the Navy, David Taylor Model Basin: Washington, DC, USA, 1962. [Google Scholar]
- Jama, M.; Mon, B.F.; Wahyudie, A.; Mekhilef, S. Maximum Energy Capturing Approach for Heaving Wave Energy Converters Using an Estimator-Based Finite Control Set Model Predictive Control. IEEE Access 2021, 9, 67648–67659. [Google Scholar] [CrossRef]
- Ogden, D.; Koukouvinis, F.; Sheng, W.; Aggidis, G.; Anagnostopoulos, J.; Bharath, A. Numerical Modelling of the TALOS Wave Energy Converter—Using HydroChrono and Ansys Fluent. In Proceedings of the 15th European Wave and Tidal Energy Conference, Bilbao, Spain, 3–7 September 2023; pp. 532-1–532-6. [Google Scholar]
- Sheng, W.; Aggidis, G. Optimisations for Improving Energy Absorption of TALOS-WEC. In Proceedings of the Thirty-Fourth (2024) International Ocean and Polar Engineering Conference, Rhodes, Greece, 16–21 June 2024; pp. 608–615. [Google Scholar]
- Sheng, W.; Tapoglou, E.; Ma, X.; Taylor, C.J.; Dorrell, R.M.; Parsons, D.R.; Aggidis, G. Hydrodynamic Studies of Floating Structures: Comparison of Wave-Structure Interaction Modelling. Ocean Eng. 2022, 249, 110878. [Google Scholar] [CrossRef]
- Sheng, W.; Aggidis, G. Hydrodynamic Comparisons of TALOS Wave Energy Converter Using Panel Methods. In Proceedings of the ISOPE 2023, Ottawa, ON, Canada, 19–23 June 2023; pp. 597–604. [Google Scholar]
- Leon-Quiroga, J.A.; Ogden, D.; Husain, S.; Sheng, W.; Aggidis, G.; Bharath, A. Design and Performance Evaluation of a Resistive Control Using a Hydraulic PTO System for the TALOS Wave Energy Converter. In Proceedings of the Thirty-Fourth (2024) International Ocean and Polar Engineering Conference, Rhodes, Greece, 16–21 June 2024; pp. 649–655. [Google Scholar]
- Loukogeorgaki, E.; Michaelides, C.; Sheng, W.; Aggidis, G. Effects of Mooring Lines on TALOS-WEC Performance. In Proceedings of the Thirty-Fourth (2024) International Ocean and Polar Engineering Conference, Rhodes, Greece, 16–21 June 2024; pp. 616–623. [Google Scholar]
- Hall, C.; Sheng, W.; Wu, Y.; Aggidis, G. The Impact of Model Predictive Control Structures and Constraints on a Wave Energy Converter with Hydraulic Power Take-Off System. Renew. Energy 2024, 224, 120172. [Google Scholar] [CrossRef]
- Hall, C.; Wu, Y.; Sheng, W.; Aggidis, G. The Impact of Control Structure and Constraints on the Performance of a Wave Energy Converter with a Hydraulic PTO System. In Proceedings of the 2023 International Society of Offshore and Polar Engineers (ISOPE) Conference, Ottawa, ON, Canada, 19–23 June 2023. [Google Scholar]
- Wu, Y.; Sheng, W.; Taylor, J.; Aggidis, G.; Ma, X. TALOS Wave Energy Converter Power Output Prediction Analysis Based on a Machine Learning Approach. Int. J. Offshore Polar Eng. 2024, 34, 306–313. [Google Scholar] [CrossRef]
- Hall, C.; Wu, Y.; Sheng, W.; Aggidis, G. The Impact of Linear and Nonlinear Control Structures on the Performance of a Wave Energy Converter. Int. J. Offshore Polar Eng. 2024, 34, 422–430. [Google Scholar] [CrossRef]
- Hall, C.; Sheng, W.; Yavuz, H.; Aggidis, G. PTO Control Design for a Multi-Axis WEC Device. In Proceedings of the Thirty-Fourth (2024) International Ocean and Polar Engineering Conference, Rhodes, Greece, 16–21 June 2024; pp. 641–648. [Google Scholar]
- Oikonomou, C.; Sheng, W.; Korres, G.; Aggidis, G. Operating of TALOS Wave Energy Converter in Different Wave Climates. In Proceedings of the ISOPE, Ottawa, ON, Canada, 19–23 June 2023; pp. 650–656. [Google Scholar]
- Guo, C.; Sheng, W.; De Silva, D.G.; Aggidis, G. A Review of the Levelized Cost of Wave Energy Based on a Techno-Economic Model. Energies 2023, 16, 2144. [Google Scholar] [CrossRef]
- DiLellio, J.A.; Butler, J.C.; Rizaev, I.; Sheng, W.; Aggidis, G. Evaluating the Long-Term Investment Opportunities of Wave Energy Conversion with Real Options. In Proceedings of the ISOPE International Ocean and Polar Engineering Conference, Rhodes, Greece, 16–21 June 2024. [Google Scholar]
- Bacelli, G.; Gilloteaux, J.-C.; Ringwood, J. State Space Model of a Hydraulic Power Take-Off Unit for Wave Energy Conversion Employing Bond Graphs. In Proceedings of the World Renewable Energy Conference, Glasgow, UK, 19–25 July 2008. [Google Scholar]
- Duarte, T.; Sarmento, A.; Alves, M.; Jonkman, J. State-Space Realization of the Wave-Radiation Force Within FAST; Technical Report; National Renewable Energy Lab (NREL): Golden, CO, USA, 2013. [Google Scholar]
- Tavakoli, A.; Roohi, E.; Sanaee Namaghi, M. Numerical Simulation of Free Surface Water Waves Around Wavy Hydrofoils: Prediction of Hydrodynamic Coefficients Using Machine Learning. J. Fluids Eng. 2024, 146, 021501. [Google Scholar] [CrossRef]
- Choi, J.; Kalogirou, A.; Lu, Y.; Bokhove, O.; Kelmanson, M. A Study of Extreme Water Waves Using a Hierarchy of Models Based on Potential-Flow Theory. Water Waves 2024, 6, 225–277. [Google Scholar] [CrossRef]
- Li, J.; Hao, H. Structural Damage Quantification Using Long Short-Term Memory (LSTM) Auto-Encoder and Impulse Response Functions. J. Infrastruct. Intell. Resil. 2024, 3, 100086. [Google Scholar]
- Zobel, O.M.; Trainotti, F.; Rixen, D.J. Enabling Experimental Impulse-Based Substructuring Through Time Domain Deconvolution and Downsampling. arXiv 2024, arXiv:2404.14802. [Google Scholar] [CrossRef]
- Zabala, I.; Henriques, J.C.C.; Kelly, T.E.; Ricci, P.P.; Blanco, J.M. Post-Processing Techniques to Improve the Results of Hydrodynamic Boundary Element Method Solvers. Ocean Eng. 2024, 295, 116913. [Google Scholar] [CrossRef]
- Raghavan, V.; Loukogeorgaki, E.; Mantadakis, N.; Metrikine, A.; Lavidas, G. HAMS-MREL: A New Open Source Multiple Body Solver for Marine Renewable Energies. Renew. Energy 2024, 237, 121577. [Google Scholar] [CrossRef]
- Raghavan, V.; Lavidas, G.; Metrikine, A.V. Comparing Open-Source BEM Solvers for Analysing Wave Energy Converters. J. Phys. Conf. Ser. 2024, 2647, 072002. [Google Scholar] [CrossRef]
- Asiikkis, A.T.; Grigoriadis, D.G.; Vakis, A.I. Wave-to-Wire Modelling and Hydraulic PTO Optimization of a Dense Point Absorber WEC Array. Renew. Energy 2024, 237, 121620. [Google Scholar] [CrossRef]
- Jia, H.; Pei, Z.; Tang, Z.; Li, M. Properties Analysis of Hydraulic PTO Output Fluctuation Regulating Based on Accumulator. Actuators 2024, 13, 261. [Google Scholar] [CrossRef]
- Yi, Y.; Sun, K.; Liu, Y.; Ma, G.; Zhao, C.; Zhang, F.; Zhang, J. Experimental and CFD Assessment of Harmonic Characteristics of Point-Absorber Wave-Energy Converters with Nonlinear Power Take-Off System. J. Mar. Sci. Eng. 2023, 11, 1860. [Google Scholar] [CrossRef]
- Rui, S.; Zhou, Z.; Gao, Z.; Jostad, H.P.; Wang, L.; Xu, H.; Guo, Z. A Review on Mooring Lines and Anchors of Floating Marine Structures. Renew. Sustain. Energy Rev. 2024, 199, 114547. [Google Scholar] [CrossRef]
- Alkhabbaz, A.; Hamza, H.; Daabo, A.M.; Yang, H.S.; Yoon, M.; Koprulu, A.; Lee, Y.H. The Aero-Hydrodynamic Interference Impact on the NREL 5-MW Floating Wind Turbine Experiencing Surge Motion. Ocean Eng. 2024, 295, 116970. [Google Scholar] [CrossRef]
- Zhang, C.; Li, D.; Ding, Z.; Liu, Y.; Cao, F.; Ning, D. Wave Energy Converter with Multiple Degrees of Freedom for Sustainable Repurposing of Decommissioned Offshore Platforms: An Experimental Study. Appl. Energy 2024, 376, 124204. [Google Scholar] [CrossRef]
- Li, D.; Duan, W.; Huang, L.; Lu, W.; Zhang, X.; Li, X.; Zhang, J. Effects of the Current-Wave Interaction on a Cylinder Platform. Ships Offshore Struct. 2024, 19, 935–947. [Google Scholar] [CrossRef]
- Michele, S.; Zheng, S.; Renzi, E.; Borthwick, A.G.L.; Greaves, D.M. Hydroelastic Theory for Offshore Floating Plates of Variable Flexural Rigidity. J. Fluids Struct. 2024, 125, 104060. [Google Scholar] [CrossRef]
- Han, Z.; Cao, F.; Tao, J.; Zhang, C.; Shi, H. Study on the Energy Capture Spectrum (ECS) of a Multi-DOF Buoy with MMR-PTO Damping. Ocean Eng. 2024, 294, 116698. [Google Scholar] [CrossRef]
- Chaudhary, V.; Gaur, P.; Rustagi, S. Sensors, Society, and Sustainability. Sustain. Mater. Technol. 2024, 40, e00952. [Google Scholar] [CrossRef]
- Gao, L.; Xu, X.; Han, H.; Yang, W.; Zhuo, R.; Wei, Q.; Hu, N. A Broadband Hybrid Blue Energy Nanogenerator for Smart Ocean IoT Network. Nano Energy 2024, 127, 109697. [Google Scholar] [CrossRef]
- Lei, Y. A Wave Forecasting Method Based on Probabilistic Diffusion LSTM Network for Model Predictive Control of Wave Energy Converters. Appl. Soft Comput. 2024, 164, 112006. [Google Scholar] [CrossRef]
- Xu, S.; Wang, S.; Soares, C.G. Prediction of Mooring Tensions of a Wave Energy Converter Considering the Effects of Nonlinear Axial Stiffness by a Deep Learning Neural Network. Ocean Eng. 2024, 305, 117810. [Google Scholar] [CrossRef]
- Ahmed, A.A.M.; Jui, S.J.J.; Al-Musaylh, M.S.; Raj, N.; Saha, R.; Deo, R.C.; Saha, S.K. Hybrid Deep Learning Model for Wave Height Prediction in Australia’s Wave Energy Region. Appl. Soft Comput. 2024, 150, 111003. [Google Scholar] [CrossRef]
- Ouro-Koura, H.; Jung, H.; Li, J.; Borca-Tasciuc, D.A.; Copping, A.E.; Deng, Z.D. Predictive Model Using Artificial Neural Network to Design Phase Change Material-Based Ocean Thermal Energy Harvesting Systems for Powering Uncrewed Underwater Vehicles. Energy 2024, 301, 131660. [Google Scholar] [CrossRef]
- Liu, J.; Zhang, B.-j.; Lai, Y.-y.; Fang, L.-q. Multi-Objective Optimisation Research of Ship Form in Waves Based on Kernel Principal Component Analysis. Ships Offshore Struct. 2024, 1–14. [Google Scholar] [CrossRef]
- Wu, K.; Sun, Y. Short Term Wind Power Prediction Based on Empirical Mode Decomposition and Kernel Principal Component Analysis. In Proceedings of the 5th International Seminar on Artificial Intelligence, Networking and Information Technology (AINIT), Nanjing, China, 29–31 March 2024; pp. 1810–1816. [Google Scholar]
- Rajanand, A.; Singh, P. ErfReLU: Adaptive Activation Function for Deep Neural Network. Pattern Anal. Appl. 2024, 27, 68. [Google Scholar] [CrossRef]
- Zhang, X.; Bose, I. Reliability Estimation for Individual Predictions in Machine Learning Systems: A Model Reliability-Based Approach. Decis. Support Syst. 2024, 186, 114305. [Google Scholar] [CrossRef]
- Hassan, M.K.; Youssef, H.; Gaber, I.M.; Shehata, A.S.; Khairy, Y.; El-Bary, A.A. A Predictive Machine Learning Model for Estimating Wave Energy Based on Wave Conditions Relevant to Coastal Regions. Results Eng. 2024, 21, 101734. [Google Scholar] [CrossRef]
- Firozjaei, M.R.; Hajebi, Z.; Naeeni, S.T.O.; Akbari, H. Discharge Performance of a Submerged Seawater Intake in Unsteady Flows: Combination of Physical Models and Decision Tree Algorithms. J. Water Process Eng. 2024, 60, 105198. [Google Scholar] [CrossRef]
- Poguluri, S.K.; Bae, Y.H. Enhancing Wave Energy Conversion Efficiency Through Supervised Regression Machine Learning Models. J. Mar. Sci. Eng. 2024, 12, 153. [Google Scholar] [CrossRef]
- Rokni, M.N.; Tavasoli, O.; Esmaeilabadi, R.; Saraf, A. Evaluating Ground Vibration Attenuation Through Leca-Filled Trenches: A Support Vector Machine Approach. Eng. Rep. 2024, 6, e12960. [Google Scholar] [CrossRef]
- Simmons, J.W., II; Van de Ven, J.D. Limits on the Range and Rate of Change in Power Take-Off Load in Ocean Wave Energy Conversion: A Study Using Model Predictive Control. Energies 2023, 16, 5909. [Google Scholar] [CrossRef]
- KhalafAnsara, H.M.; Keighobadi, J. Deep Reinforcement Learning with Immersion-and Invariance-Based State Observer Control of Wave Energy Converters. Int. J. Eng. Trans. C Asp. 2024, 37, 1085–1097. [Google Scholar]
- Rizaev, I.G.; Dorrell, R.M.; Oikonomou, C.L.G.; Tapoglou, E.; Hall, C.; Aggidis, G.A.; Parsons, D.R. Wave Power Resource Dynamics for the Period 1980–2021 in Atlantic Europe’s Northwest Seas. In Proceedings of the 33rd International Ocean and Polar Engineering Conference, Ottawa, ON, Canada, 18–23 June 2023. [Google Scholar]
- The WAVEWATCH III® Development Group. User Manual and System Documentation of WAVEWATCH III® Version 6.07. NOAA/NWS/NCEP/MMAB Technical Note 333, 465p. 2019. Available online: https://www.envlab.eu/documents/Papers/WaveWatch-III_manual_v.6.0.7.pdf (accessed on 23 January 2025).
- Selman-Caro, D.; Gorr-Pozzi, E.; Odériz, I.; Díaz-Hernández, G.; García-Nava, H.; Silva, R. Assessing Wave Energy for Possible WEC Installations at La Serena, Central Chile. Ocean Eng. 2024, 295, 116854. [Google Scholar] [CrossRef]
- Gohari, A.; Akpınar, A. Projected Changes in Wind Speed and Wind Energy Resources Over the Persian Gulf Based on Bias Corrected CMIP6 Models. J. Clim. Chang. 2024. [Google Scholar] [CrossRef]
- Liu, T.; Zhu, X.; Tang, M.; Guo, C.; Lu, D. Multi-Model Ensemble Bias-Corrected Precipitation Dataset and Its Application in Identification of Drought-Flood Abrupt Alternation in China. Atmos. Res. 2024, 307, 107481. [Google Scholar] [CrossRef]
- Dinku, M.B.; Gibre, A.M. Comparison of Bias Correction Methods to Regional Climate Model Simulations for Climate Change Projection in Muger Subbasin, Upper Blue Nile Basin, Ethiopia. J. Water Clim. Chang. 2024, 15, 2612–2627. [Google Scholar] [CrossRef]
- Satymov, R.; Bogdanov, D.; Dadashi, M.; Lavidas, G.; Breyer, C. Techno-Economic Assessment of Global and Regional Wave Energy Resource Potentials and Profiles in Hourly Resolution. Appl. Energy 2024, 364, 123119. [Google Scholar] [CrossRef]


| WP & Objective | Sub-Package | Refs. | Description | Outcome |
|---|---|---|---|---|
| WP1: Concept Development Establish the foundational design and concept of the WEC. | WP1.1—Experimental and Numerical Hydrodynamics | [43,45,46,47,48] | Study WEC interaction with wave dynamics through wave tank testing and CFD modelling. | Define hydrodynamic parameters for optimal energy capture. |
| WP1.2—Geometric Optimisation | [44] | Refine the WEC’s geometry using simulation and testing. | Achieve a balance between energy efficiency and structural integrity. | |
| WP1.3—PTO Design and Optimisation | [44] | Design an efficient PTO system. | A robust PTO design ensuring reliable power output. | |
| WP2: Survivability, Reliability, and Control Ensure operational reliability in harsh marine environments. | WP2.1—Smart Sensors | N/A | Integrate sensors for real-time monitoring. | Comprehensive data on health and environmental performance. |
| WP2.2—Condition Monitoring | [40,51] | Use AI algorithms to assess system health and predict maintenance needs. | Minimised downtime and extended lifespan. | |
| WP2.3—Predictive Maintenance | [40,51] | Develop models to anticipate failures. | Improved reliability and reduced costs. | |
| WP2.4—Optimised Control | [49,50,52,53] | Implement adaptive controls for varying sea conditions. | Enhanced energy capture and safe operation. | |
| WP3: Sea State Forecasting and Resource Evaluation Analyse and predict wave resources for optimised deployment. | WP3.1—Resource Characterisation | [40,54] | Map wave energy potential in deployment areas. | Identify high-energy zones for WEC operation. |
| WP3.2—Efficiency Testing | [54] | Test WEC performance in wave tanks. | Establish performance benchmarks for marine conditions. | |
| WP3.3—Array Effects | N/A | Study the interactions between multiple WECs in arrays. | Optimise array layout to maximise energy capture. | |
| WP4: Validation and Cost Analysis Validate performance and assess economic feasibility of the WEC. | WP4.1—Validation and Demonstration | N/A | Conduct real-world testing to validate performance. | Verified data for commercialisation. |
| WP4.2—Array Deployment | N/A | Test scalability of WEC arrays. | Awarenesses into large-scale deployment challenges. | |
| WP4.3—LCOE Assessment | [55,56] | Calculate the LCOE. | Cost analysis to ensure commercial competitiveness. |
| Coefficient | Surge (kg) | Sway (kg) | Heave (kg) | Roll (kg·m2) | Pitch (kg·m2) | Yaw (kg·m2) |
| Added Mass | ||||||
| Coefficient | Surge (Ns/m) | Sway (Ns/m) | Heave (Ns/m) | Roll (Nms/rad) | Pitch (Nms/rad) | Yaw (Nms/rad) |
| Damping | ||||||
| Coefficient | Surge (N) | Sway (N) | Heave (N) | Roll (Nm) | Pitch (Nm) | Yaw (Nm) |
| Wave Excitation Force |
| Feature/Capability | WAMIT | HAMS | NEMOH |
|---|---|---|---|
| Runtime (125 frequencies) | 1395 s | 1076 s | 5620 s |
| Multi-core support | Yes | Yes | No |
| Thin structures handling | Effective | Effective | Limited |
| Overlapping panels | Effective | Effective | Limited |
| Impulse response functions | Yes | Yes | Yes |
| Irregular frequency removal | Yes | Yes | No |
| RAO computation | Yes | Yes | Limited |
| Accuracy (based on validation) | High | High | Moderate |
| Mesh sensitivity | Low | Low | High |
| Cost (Licensing/Usage) | High | Moderate | Open-source |
| User interface | Moderate (command-line) | Moderate (command-line) | Moderate (command-line with MATLAB wrapper) |
| Applications for TALOS | Excellent | Excellent | Adequate |
| PTO | Hull (m) | Sphere (m) | ||||
|---|---|---|---|---|---|---|
| x | y | z | x | y | z | |
| PTO1 | 5.00 | 0 | 8.66 | 2.50 | 0 | 4.33 |
| PTO2 | −2.50 | 4.33 | 8.66 | −1.25 | 2.16 | 4.33 |
| PTO3 | −2.50 | −4.33 | 8.66 | −1.25 | −2.16 | 4.33 |
| PTO4 | 5.00 | 0 | −8.66 | 2.50 | 0 | −4.33 |
| PTO5 | −2.50 | 4.33 | −8.66 | −1.25 | 2.16 | −4.33 |
| PTO6 | −2.50 | −4.33 | −8.66 | −1.25 | −2.16 | −4.33 |
| Parameter | Value | Description |
|---|---|---|
| Domain Size | Defines the computational domain dimensions, ensuring sufficient space to capture wave–structure interactions and minimise boundary effects. | |
| Mesh Type | Overset Mesh | Refined overlapping grids near the TALOS structure allow for detailed resolution while enabling flexible simulation of large wave domains. |
| Boundary Conditions | Pressure outlet, symmetry walls | Configures flow behaviour at domain boundaries, ensuring waves and fluid exit the domain without reflections. |
| Time Step | Specifies the temporal resolution for accurately capturing dynamic responses while maintaining numerical stability. |
| Parameter | MLC1 (Slack) | MLC2 (Moderately Slack) |
|---|---|---|
| Hanging length, (m) | 134 | 199 |
| Submerged weight, w (N/m) | 1230 | 1230 |
| Pretension, (kN) | 174.1 | 314.9 |
| Configuration | Wave Period (s) | Mean Power (kW) | Power Std. Dev. (kW) |
|---|---|---|---|
| MLC1 (Slack) | 7.0 | 15.3 | 1.2 |
| MLC2 (Moderately Slack) | 7.0 | 14.8 | 0.9 |
| MLC1 (Slack) | 8.5 | 16.8 | 1.5 |
| MLC2 (Moderately Slack) | 8.5 | 15.2 | 1.0 |
| MLC1 (Slack) | 10.0 | 15.0 | 1.1 |
| MLC2 (Moderately Slack) | 10.0 | 14.9 | 0.8 |
| Configuration | Displacement (m3) | Reduction from Original (%) |
|---|---|---|
| Original TALOS | 3755 | — |
| Tail-Shortened TALOS | 2387 | 36.4 |
| Tailless TALOS | 2969 | 20.9 |
| Truncated Hemisphere TALOS | 3046 | 18.9 |
| Subsystem | Detection Targets | Types of Sensors |
|---|---|---|
| Structural | Humidity | Relative humidity (RH) sensors, dew point sensors |
| Water leak detection | Pressure sensors, radar sensors, acoustic emission sensors | |
| Applied force | Fibre optic strain gauge | |
| Incoming waves | Wave probes | |
| Acceleration | Accelerometers | |
| Hydraulic | Oil leakage | Pressure transducers, ultrasonic level sensors |
| Contamination | Inline contamination monitor | |
| Position | Linear position sensors | |
| Electrical | Electrical parameters | Voltage transducers, current transducers, power transducers |
| Generator speed | Absolute encoders | |
| Generator torque | Torque transducers | |
| Temperature | Thermocouples, infrared, and resistance temperature sensors | |
| Mooring | Position | Global Positioning System (GPS) |
| Entanglement | Load shackles | |
| Inertial | Inertial measurement unit | |
| Instrumentation | Data collection and processing | Remote diagnostic sensors |
| PTO | Metric | KPCA-LSTM | LSTM | RT | SVR | ANN |
|---|---|---|---|---|---|---|
| 0.87 | 0.67 | 0.44 | 0.78 | 0.56 | ||
| 1st | RMSE | 0.12 | 0.13 | 0.17 | 0.13 | 0.16 |
| MAE | 0.09 | 0.10 | 0.13 | 0.11 | 0.12 | |
| 0.93 | 0.49 | 0.56 | 0.67 | 0.45 | ||
| 2nd | RMSE | 0.08 | 0.15 | 0.16 | 0.14 | 0.17 |
| MAE | 0.07 | 0.12 | 0.13 | 0.10 | 0.15 | |
| 0.92 | 0.83 | 0.75 | 0.74 | 0.78 | ||
| 3rd | RMSE | 0.09 | 0.11 | 0.14 | 0.13 | 0.13 |
| MAE | 0.08 | 0.09 | 0.11 | 0.10 | 0.10 | |
| 0.89 | 0.93 | 0.74 | 0.74 | 0.77 | ||
| 4th | RMSE | 0.11 | 0.08 | 0.13 | 0.13 | 0.13 |
| MAE | 0.10 | 0.06 | 0.11 | 0.10 | 0.09 | |
| 0.85 | 0.92 | 0.52 | 0.81 | 0.83 | ||
| 5th | RMSE | 0.12 | 0.09 | 0.13 | 0.12 | 0.12 |
| MAE | 0.11 | 0.08 | 0.10 | 0.09 | 0.10 | |
| 0.92 | 0.92 | 0.79 | 0.89 | 0.80 | ||
| 6th | RMSE | 0.09 | 0.09 | 0.13 | 0.11 | 0.12 |
| MAE | 0.08 | 0.07 | 0.09 | 0.09 | 0.10 |
| Ref. | Methodology | Novelty | Advantages | Limitations |
|---|---|---|---|---|
| [49] | Compared MPC with hydrodynamics-only and PTO-integrated models; analysed prediction horizons. | Integrated PTO dynamics; prediction horizon analysis. | 23% increase in power, better constrained performance. | High computational cost, limited nonlinear interaction analysis. |
| [50] | Incorporated constraints (position, force, power) in MPC with nonlinear PTO models. | Detailed study of realistic constraints. | Improved reliability and control accuracy. | Increased computational burden, reduced max output power. |
| [52] | Compared linear and nonlinear MPC under constraints. | First comparison of linear vs. nonlinear MPC for TALOS. | Nonlinear improves power by 10%; linear is computationally efficient. | Nonlinear is computationally heavy; sensitive to wave prediction errors. |
| [53] | Developed six-DOF WEC-Sim model; evaluated PTO actuation strategies. | Selective actuation for multi-axis PTOs. | More energy capture, scalable, lower computation demand. | Coupling effects complicate control; real-time optimisation is prohibitive. |
| Metric | Observed | Model (Original) | Model (BC-DC) | Model (BC-EQM) |
|---|---|---|---|---|
| (m) | ||||
| Mean | ||||
| Bias | − | |||
| RMSD | − | |||
| 50th Percentile | ||||
| 95th Percentile | ||||
| Pearson r | − | |||
| (s) | ||||
| Mean | ||||
| Bias | − | |||
| RMSD | − | |||
| 50th Percentile | ||||
| 95th Percentile | ||||
| Pearson r | − | |||
| Aspect | Key Findings |
|---|---|
| Hydrodynamic Modelling | Heave motion plays a dominant role in energy absorption, exhibiting the highest added mass () and damping coefficient (). Coupled surge–pitch dynamics are critical for multi-modal energy transfers, highlighting the importance of addressing transient dynamics in design. |
| Numerical Tools | WAMIT excels in validating complex configurations, HAMS offers computational efficiency for iterative designs, and NEMOH is suitable for cost-effective preliminary studies. |
| Numerical Modelling | The hydraulic PTO system ensures stable energy harvesting with synchronised heave oscillations. Asymmetric PTO placements, such as PTO2 and PTO3, highlight the need for optimised spatial design. |
| Mooring System Effects | Slack mooring (MLC1) enhances energy absorption but increases variability and structural instability. Moderately slack mooring (MLC2) balances energy efficiency and stability. |
| Geometric optimisation | Shortened and Tailless TALOS configurations excel in energy absorption (8–9 s wave periods). Lowering the centre of gravity and adding overlapping panels enhance stability and performance. |
| PTO optimisation | Soft springs () and damping coefficients () maximise energy absorption. Low damping improves efficiency but risks instability. |
| Condition Monitoring | KPCA-LSTM provides computational efficiency for long-term trends, while ANN-LSTM is effective for real-time monitoring. Combined approaches enhance reliability and reduce downtime. |
| Control Strategies | Full-state MPC delivers the highest power output (3.7 MW) but requires significant computational resources. Reduced-state MPC balances performance (3 MW) with efficiency. |
| Wave Energy Resource Dynamics | The highest wave energy potential (>70 kW/m) is west of the UK and Ireland, with peaks in winter (>140 kW/m). Coastal areas offer moderate but stable energy levels (35 kW/m). |
| Site-Specific Assessments | High-energy sites (Isle of Islay, SW Irish Coast) require minimal optimisation for deployment. Moderate-energy sites (Cantabrian Sea) need customised adjustments, while low-energy sites (West of Sardinia) necessitate significant design modifications. |
| Uncertainty Mitigation | Bias correction techniques (e.g., BC-QM) improve data reliability, achieving high correlation ( for ), particularly under extreme conditions. |
| Validation and Demonstration | Laboratory experiments validated numerical predictions, aligning strongly with real-world performance. Modular, scalable designs ensure efficient array deployment and energy extraction. |
| LCOE optimisation | Competitive LCOE (0.2–0.35 €/kWh) achieved through modular designs, predictive maintenance, and targeted high-wave-energy deployments. Reactive control improves efficiency and scalability. |
Disclaimer/Publisher’s Note: The statements, opinions and data contained in all publications are solely those of the individual author(s) and contributor(s) and not of MDPI and/or the editor(s). MDPI and/or the editor(s) disclaim responsibility for any injury to people or property resulting from any ideas, methods, instructions or products referred to in the content. |
© 2025 by the authors. Licensee MDPI, Basel, Switzerland. This article is an open access article distributed under the terms and conditions of the Creative Commons Attribution (CC BY) license (https://creativecommons.org/licenses/by/4.0/).
Share and Cite
Nasr Esfahani, F.; Sheng, W.; Ma, X.; Hall, C.M.; Aggidis, G. Innovations in Wave Energy: A Case Study of TALOS-WEC’s Multi-Axis Technology. J. Mar. Sci. Eng. 2025, 13, 279. https://doi.org/10.3390/jmse13020279
Nasr Esfahani F, Sheng W, Ma X, Hall CM, Aggidis G. Innovations in Wave Energy: A Case Study of TALOS-WEC’s Multi-Axis Technology. Journal of Marine Science and Engineering. 2025; 13(2):279. https://doi.org/10.3390/jmse13020279
Chicago/Turabian StyleNasr Esfahani, Fatemeh, Wanan Sheng, Xiandong Ma, Carrie M. Hall, and George Aggidis. 2025. "Innovations in Wave Energy: A Case Study of TALOS-WEC’s Multi-Axis Technology" Journal of Marine Science and Engineering 13, no. 2: 279. https://doi.org/10.3390/jmse13020279
APA StyleNasr Esfahani, F., Sheng, W., Ma, X., Hall, C. M., & Aggidis, G. (2025). Innovations in Wave Energy: A Case Study of TALOS-WEC’s Multi-Axis Technology. Journal of Marine Science and Engineering, 13(2), 279. https://doi.org/10.3390/jmse13020279