Abstract
Blockchain technology holds the potential to significantly enhance efficiency and safety in freeport operations. However, fully realising its benefits necessitates a thorough assessment of the obstacles hindering its applications, which often depends on expert opinions characterised by uncertainty and inconsistency. This issue remains inadequately addressed in the existing literature due to the limitations of currently employed methods. To address this gap, this study aims to develop a novel methodology for assessing blockchain adoption barriers in freeports. It makes methodological contributions by combining the Decision-Making Trial and Evaluation Laboratory (DEMATEL) and Bayesian Network (BN) methods to identify and quantify complex interrelationships between barriers and facilitate probabilistic predictions of barrier strength. The model is parameterised using the ranked nodes method to reduce the reliance on expert-assigned probabilities. Primary data on barriers’ causal relationships are collected from experts with interdisciplinary experience in blockchain and freeport operations, grounding the analysis in real-world insights. This study makes practical contributions by analysing the blockchain application within a new context (i.e., freeports) and presenting novel findings. Key managerial insights include identifying high investment costs as the most interactive barrier and lack of trust among stakeholders as the most essential barrier. Additionally, evaluating the overall impact of barriers enables targeted strategies for freeport policymakers.
1. Introduction
The notion of a freeport is often derived from a broader concept of free trade zones, which are a series of government-assigned special economic zones where normal tax and customs rules are relaxed to stimulate national economies [1]. Freeports are typically situated near seaports or airports, serving as hubs for international trade and industrial growth. Some of the busiest freeports, such as the Port of Singapore, Jebel Ali Free Zone, Tanger Med in Morocco, Hong Kong, and major Chinese ports, illustrate the significant role of freeports in handling millions of TEUs annually and enabling seamless international commerce. For instance, the Port of Singapore processed over 39 million TEUs in 2023, setting a new record for the port [2]. However, the increasing volume of global tradecoupled with rising expectations for efficiency and security, necessitates a paradigm shift in the operational modalities of freeports. Vulnerabilities in traditional port logistics, such as fragmented systems and reliance on paper-based processes, expose operations to fraud and data breaches [3]. Similarly, free trade ports (FTPs) face issues like untidy information sharing, low transparency, and payment insecurity [4]. The increasing complexity and fragility of global supply chains, alongside inconsistent regulatory environments and logistical disruptions, leave freeports highly susceptible to cyberattacks and operational failures as trade volumes and interconnectedness continue to grow [5,6]. To address these vulnerabilities, there is a growing push toward digitalisation—an integral process that incorporates digital technologies into all areas of freeport operations, fundamentally transforming how they function and deliver value. This shift highlights the increasing importance of data-driven solutions in enhancing operational efficiency and decision-making in maritime [7,8]. According to a global survey, the digital transformation of freeport operations, through advancements in digital trade and information resource sharing, drives unparalleled operational efficiency while playing a crucial role in promoting sustainable freeport systems [9]. Moreover, the adoption of digital technologies equips freeports with robust security protocols and surveillance systems [1].
While the digital transformation of freeports signals a new era of operational efficiency and security, the integration of blockchain technology stands out as a promising development. Blockchain technology, first introduced by Nakamoto (2008) [10], with its inherent features of decentralisation, transparency, and immutability, offers remarkable benefits for enhancing the efficiency and safety of freeport operations. This potential is underscored in various industry and academic publications. For instance, the Malta Freeport and Hainan Free Trade Zone are among the freeports that have implemented blockchain technology. Despite its potential to transform freeport operations, its widespread adoption remains limited, facing numerous barriers and challenges that have to be addressed. For instance, the challenges faced by TradeLens, a blockchain-based platform developed by IBM and Maersk, reflect such key obstacles as the lack of full global industry collaboration and difficulties in convincing stakeholders, including shippers and freight forwarders, of its value. These issues, along with high costs and limited incentives, exemplify the organisational and economic barriers that can hinder blockchain adoption in complex ecosystems [11]. Moreover, a literature review, coupled with expert consultations conducted for this study, highlights several barriers, including technological barriers, such as difficulties in integrating blockchain with existing IT systems, and organisational hurdles, e.g., resistance to change and a general lack of understanding about blockchain among employees. Additionally, regulatory and legal ambiguities related to blockchain technology present significant impediments, deterring its broad implementation in freeports. However, no study has yet explored the barriers to blockchain adoption specifically in freeport operations. While research in maritime and supply chain contexts has identified key barriers, their interrelationships have been inadequately explored. Understanding these interrelationships is crucial because the interconnected barriers often amplify each other, making it difficult to address them in isolation. Existing methods fail to effectively handle the uncertainty and variability inherent in these complex interdependencies, limiting their ability to provide actionable insights. To bridge these research gaps, this study aims to develop an innovative methodology for evaluating the barriers to blockchain adoption in freeports. Specifically, it seeks to answer the following key research questions:
- What are the primary barriers to blockchain adoption in freeport operations, and how do these barriers influence one another?
- What methods can be employed to systematically evaluate these barriers while addressing uncertainty?
- How can the findings inform policymakers and stakeholders in developing effective strategies for blockchain implementation in freeports?
Initially, this study undertakes a comprehensive literature review within the realms of freeports, maritime operations, and supply chains to identify common barriers to blockchain adoption. Subsequently, it involves professionals with expertise in both blockchain technology and freeport operations to assess the causal relationships among the identified barriers through a semi-structured survey based on the Decision-Making Trial and Evaluation Laboratory (DEMATEL). Furthermore, this study applies a hybrid DEMATEL and Bayesian Network (DEMATEL-BN) methodology to construct a causal network and probabilistic model, combining the DEMATEL findings and BN’s capabilities for learning and inference, with the BN structure parameterised using the ranked nodes approach. The model’s consistency is confirmed through sensitivity analysis.
The rest of the paper is structured as follows: Section 2 reviews blockchain adoption in freeport-related industries, barrier assessment methods, and adoption barriers, and highlights the study’s novel contributions. Section 3 outlines the methodology designed for this study, including the steps for barrier identification, assessment, and sensitivity analysis. Section 4 demonstrates the practical application of these steps, while Section 5 discusses the implications of this research. Finally, Section 6 concludes the paper.
2. Literature Review
This literature review is divided into four subsections. It provides an overview of research on blockchain adoption in industries relevant to freeports, established and emerging methodologies for analysing its adoption barriers, and the examined barriers in existing literature. Finally, it outlines the novel contributions of this study.
2.1. Blockchain Adoptions in Related Industries
Although digital transformation in freeports is gaining attention in the industry, academic investigation in this area is very limited, particularly research focusing on the potential of blockchain to enhance efficiency and security in freeport operations. Wang et al. [1] formulated an innovative conceptual framework illustrating a generic freeport model supported by 5G technology. Several studies have examined blockchain’s transformative role in the Hainan FTP. For instance, Liu and Wu [3] examined blockchain’s application in Hainan’s intelligent port logistics, offering insights into how blockchain technology can revolutionise logistics and trade in free trade zones. Shi and Fan [4] focused on the rapid development of cross-border e-commerce within the Hainan FTP, identifying blockchain as a solution to challenges such as information service inefficiencies and payment security. They proposed a blockchain-based supply chain information service platform tailored to Hainan’s local needs and free trade policies. Similarly, Tian et al. [6] explored the strategic implications of incorporating blockchain in the Hainan FTP’s supply chain network, suggesting that its adoption significantly influenced global supply chain redesign and pricing strategies.
Given the scarcity of research on freeport operations, the literature review broadens its scope to include maritime and supply chain studies. Blockchain technology is increasingly recognised as a transformative force in both the maritime industry and supply chain management (SCM), offering unparalleled transparency, efficiency, and security [12]. It enhances logistics and supply chains by enabling secure, real-time information exchanges and automating transactions via smart contracts. Key applications include tracking product origins, managing product flow, forecasting demand, reducing fraud, providing open access to supply chain data, minimising environmental impact, and streamlining transactions [13]. These applications often intersect, offering comprehensive improvements in SCM. According to the study by Han and Fang [14], blockchain technology transformed supply chain finance by modernising traditional methods and fostering new models, enhancing green practices and risk management, and promoting transparent, efficient, and sustainable operations across different industries. Despite its potential, technological, organisational, and environmental challenges hinder its broad adoption in SCM, keeping blockchain in SCM at an early stage of development. For example, adopting blockchain technology may reduce the demand from privacy-sensitive customers, even if they do not use blockchain traceability services, despite the increase in the product’s retail price due to blockchain adoption [15].
Blockchain use cases have been steadily developed and tested in the maritime industry since 2017, particularly in documents, operations, finance, and insurance, while also pointing to its synergy with IoT and smart grids for more secure and efficient maritime operations [16]. Shin et al. [17] delved into blockchain’s specific applications within the maritime and shipping sectors, pinpointing document management, transaction oversight, and operational enhancements as key areas of implementation. Kapidani et al. [18] analysed expert opinions from two developing countries, Montenegro and South Africa, to highlight the benefits, uncertainties, and knowledge gaps associated with blockchain implementation in emerging maritime economies. In recent studies, Zhang et al. [19] proposed an improved blockchain-based cold chain traceability system for marine fishery vessels, using the Node-grouped and Reputation-evaluated Practical Byzantine Fault Tolerance (NR-PBFT) consensus algorithm to enhance the reliability and efficiency of the blockchain system. H. Li et al. [20] used a hotelling model to examine the pricing strategies and blockchain technology investment preferences of two competitive shipping platforms across three scenarios: neither platform invests, only one platform invests, and both platforms invest. Meanwhile, Z. Li et al. [21] used a game model to analyse the investment and subsidy strategy for low-carbon port operations, considering the effectiveness of blockchain in enhancing cargo owners’ low-carbon trust.
Current research outlines a promising yet challenging path ahead for blockchain in enhancing the transparency, efficiency, and sustainability of freeport operations, as well as the relevant supply chains and maritime transport. The exploration of blockchain’s potential, coupled with strategies to overcome its adoption barriers, is crucial in realising its full benefits across these sectors. However, the existing literature lacks a thorough quantitative analysis of the risks and obstacles associated with blockchain applications. As an exploratory study, Nguyen et al. [22] assessed potential risks in container shipping blockchain information systems with inputs from the industry, using a network model and a quantitative analysis with probabilistic indexes for multi-event risk scenarios. Nevertheless, their study presupposed blockchain’s adoption, neglecting the pre-adoption phase barriers. Additionally, their methodology relied on expert-provided probabilities to assess the likelihood of causal connection among different risk events and overlooked the magnitude of the risks themselves. A more thorough approach is required to address these limitations. This study enriches the discourse by proposing a new method to identify and evaluate critical obstacles to blockchain adoption, specifically within the freeport context, offering valuable insights into facilitating its broader integration.
2.2. Methods for Assessing Barriers to Blockchain Adoptions
Existing research on blockchain application barriers employs both qualitative and quantitative methodologies, with qualitative approaches such as literature reviews, case studies, and thematic analyses being particularly prevalent. For instance, Mohammed et al. [23] utilised a systematic literature review of 52 articles from 2016 to 2021 to craft a conceptual framework that outlines the enablers, benefits, and challenges of adopting blockchain in food supply chains. Similarly, Sargent and Breese [24] conducted a structured literature review of 76 articles to identify major barriers to blockchain adoption in supply chains, while Moretto and Macchion [25] engaged with blockchain providers and companies in the fashion sector to evaluate perspectives on adoption influencers and obstacles, as well as the effects on supply chain variables. Nonetheless, these qualitative methods fall short in evaluating the importance of various criteria and their interrelationships.
Some studies resort to more sophisticated Multi-Criteria Decision-Making (MCDM) techniques. Table 1 showcases the MCDM methods used in the referenced literature, highlighting their respective benefits and drawbacks. Although these methods offer valuable insights for identifying and prioritising key barriers against the implementation of blockchain technology, each has inherent limitations. For example, the Analytic Hierarchy Process (AHP) and Delphi are inadequate for analysing interdependencies among the influential factors. Interpretive Structural Modelling (ISM) identifies relationships between the factors but is restricted to transitive relationships, lacks the ability to quantify the strength of these relationships, and does not classify them into cause-and-effect groups. In contrast, DEMATEL effectively analyses complex systems with interdependencies and causal relationships. However, as with other MCDM methods discussed above, it does not address uncertainty or variability in these interrelationships and lacks adaptability for dynamic scenario analysis, limiting its applicability in formulating actionable strategies.

Table 1.
MCDM methods used in existing research.
Recognising the limitations of traditional MCDM methodologies, hybrid emerging models have been proposed to overcome these challenges by integrating advanced quantitative methods, such as BNs. Specifically, the combination of DEMATEL and BN is selected for its superior capacity to delineate and quantify the complex interdependencies and uncertainties that characterise blockchain adoption scenarios. As a kind of MCDM tool, DEMATEL was first proposed by the Battelle Memorial Institute at the Geneva Research Center [36]. DEMATEL visualises complicated, structural, and causal relationships with a matrix and graph and can convert a relationship between causes and effects of criteria into a unique structural model [37]. It has been widely applied in evaluating key success factors or barriers in many emerging issues [38,39]. While DEMATEL uses “influence intensity” to measure the impact of one element on another, the Weighted Influence Non-linear Gauge System (WINGS) method, inspired by DEMATEL and first introduced by Michnik [40], incorporates a second measure: “strength of elements”. However, WINGS has been criticised for its limitations in handling uncertain information [41], particularly uncertainties related to the strength of elements. Additionally, due to its static nature, WINGS fails to account for consistency, where changes in one element’s strength should affect another if they share a strong causal relationship. This study integrates BN with DEMATEL to address these limitations.
BN theory, introduced by Pearl [42], employs a probabilistic graphical model to evaluate the importance of variables and their interconnections while accounting for system uncertainties [43,44,45]. Among various risk assessment techniques, BN stands out for its superior capabilities in learning and inference, offering robust data tolerance and enabling both backward and forward risk diagnosis and predictive analysis [46,47,48]. These attributes make BN particularly adept at overcoming DEMATEL’s limitations in handling probabilistic assessments and uncertainties.
On the other hand, constructing a BN based on the opinions of decision-makers presents significant challenges, especially when a large converging connection of multiple parent nodes exists. This convergence results in an exponential increase in the complexity of CPT, exceeding expert capacity. Often, these decision-makers struggle to differentiate between direct and indirect causal relationships, which can result in inconsistencies and the formation of cycles in the BN model. Moreover, when multiple decision-makers are involved, their opinions may conflict, leading to divergent and contradictory inputs. This issue becomes particularly problematic when attempting to amalgamate these varying opinions into a cohesive decision-making support model. To address these complexities, it is crucial to adopt a systematic approach like DEMATEL. This method leverages the knowledge of decision-makers in a structured manner, enabling the effective identification and integration of their insights into the BN construction process [49]. Additionally, this study incorporates the ranked nodes method introduced by Fenton et al. [50] into the DEMATEL-BN approach to address the complexity of configuring CPTs based on expert opinions. This method relies on minimal expert elicitation to construct CPTs, reducing the need for significant subjective judgement. Other methods sharing this characteristic, such as the symmetric model [51,52] and the noisy-or approach [53], are limited to Boolean nodes with binary states. In contrast, the ranked nodes approach stands out by enabling analysis across multiple states, which better aligns with real-world scenarios.
Although some studies have applied the combination of DEMATEL and BN across various fields, such as safety management in the high-tech industry [49], smart Product Service System (PSS) design [51], supplier selection for a large automobile manufacturer [54], and marine ranching risk management [53], to the authors’ best knowledge, there are no relevant studies in the context of freeports, and the applications of DEMATEL-BN are highly context-specific. This highlights the need for further investigation on how to adapt the DEMATEL-BN approach to best fit the new field of blockchain barriers in freeports. This research pioneers the application of the hybrid approach to formulating a comprehensive framework enabling the assessment of barriers affecting blockchain applications in freeports. Additionally, this study enriches the limited research that integrates DEMATEL and BN with a clear and comprehensive framework. It specifically elaborates on the processes of causal network construction and refinement, BN parameterisation, and the model’s consistency test. In doing so, it establishes best practices that can be applied to similar research challenges. Such benefits can be achieved through the development of the proposed new methodology in Section 3.
2.3. Barriers to Blockchain Adoption
To identify critical barriers to blockchain adoption in freeports, this study broadens the literature review to include the relevant applied contexts, such as ports, maritime, and supply chains, given the limited research specifically focused on freeports. Consequently, Table 2 presents barriers to blockchain implementation examined in relevant research across various scenarios, including manufacturing, e-commerce, container shipping, and diverse supply chain types. It provides a comprehensive view of the challenges in integrating blockchain technology in these areas. However, the frequency of occurrence of these barriers varies, and some have not been explicitly defined in the existing literature, highlighting the need for further refinement. The barriers chosen for this study will be presented and explained in the next section.
Table 2.
The examined barriers in the existing research.
2.4. New Contributions
The new contributions of this paper are as follows:
- (1)
- Pioneering BN for blockchain adoption analysis.
- This study introduces the use of a BN inference mechanism in analysing blockchain adoption, presenting a novel quantitative model that enables probabilistic prediction of the internal strength of barriers to blockchain adoption in freeports under uncertainty.
- (2)
- Integrating DEMATEL and BN.
- By integrating the DEMATEL and BN methods, this study offers a systematic approach to identifying and quantifying the interrelationships among blockchain adoption barriers. This integrated model makes a valuable contribution to systems analysis by offering a robust framework for understanding and addressing the multifaceted nature of factors within complex systems.
- (3)
- Applying the ranked nodes approach.
- The ranked nodes approach is applied to configure Conditional Probability Tables (CPTs) within the DEMATEL-BN model. This innovation minimises reliance on expert-assigned probabilities, reducing uncertainty while maintaining the BN model’s capacity to account for multi-state effects.
- (4)
- Analysing the blockchain application in the freeport context.
- From an applied research perspective, this study pioneers the exploration of blockchain application in the freeport context, offering actionable managerial insights into the most interactive and essential barriers to blockchain application and the combined effects of these barriers.
3. Methodology
This section comprises four subsections, outlining the interactive steps to formulate its logic flow. The first subsection presents the proposed framework for this study, the second presents the most commonly examined barriers identified from the literature review, and the last two sections elaborate on the detailed steps of barrier assessment and sensitivity analysis, respectively.
3.1. The Proposed Framework
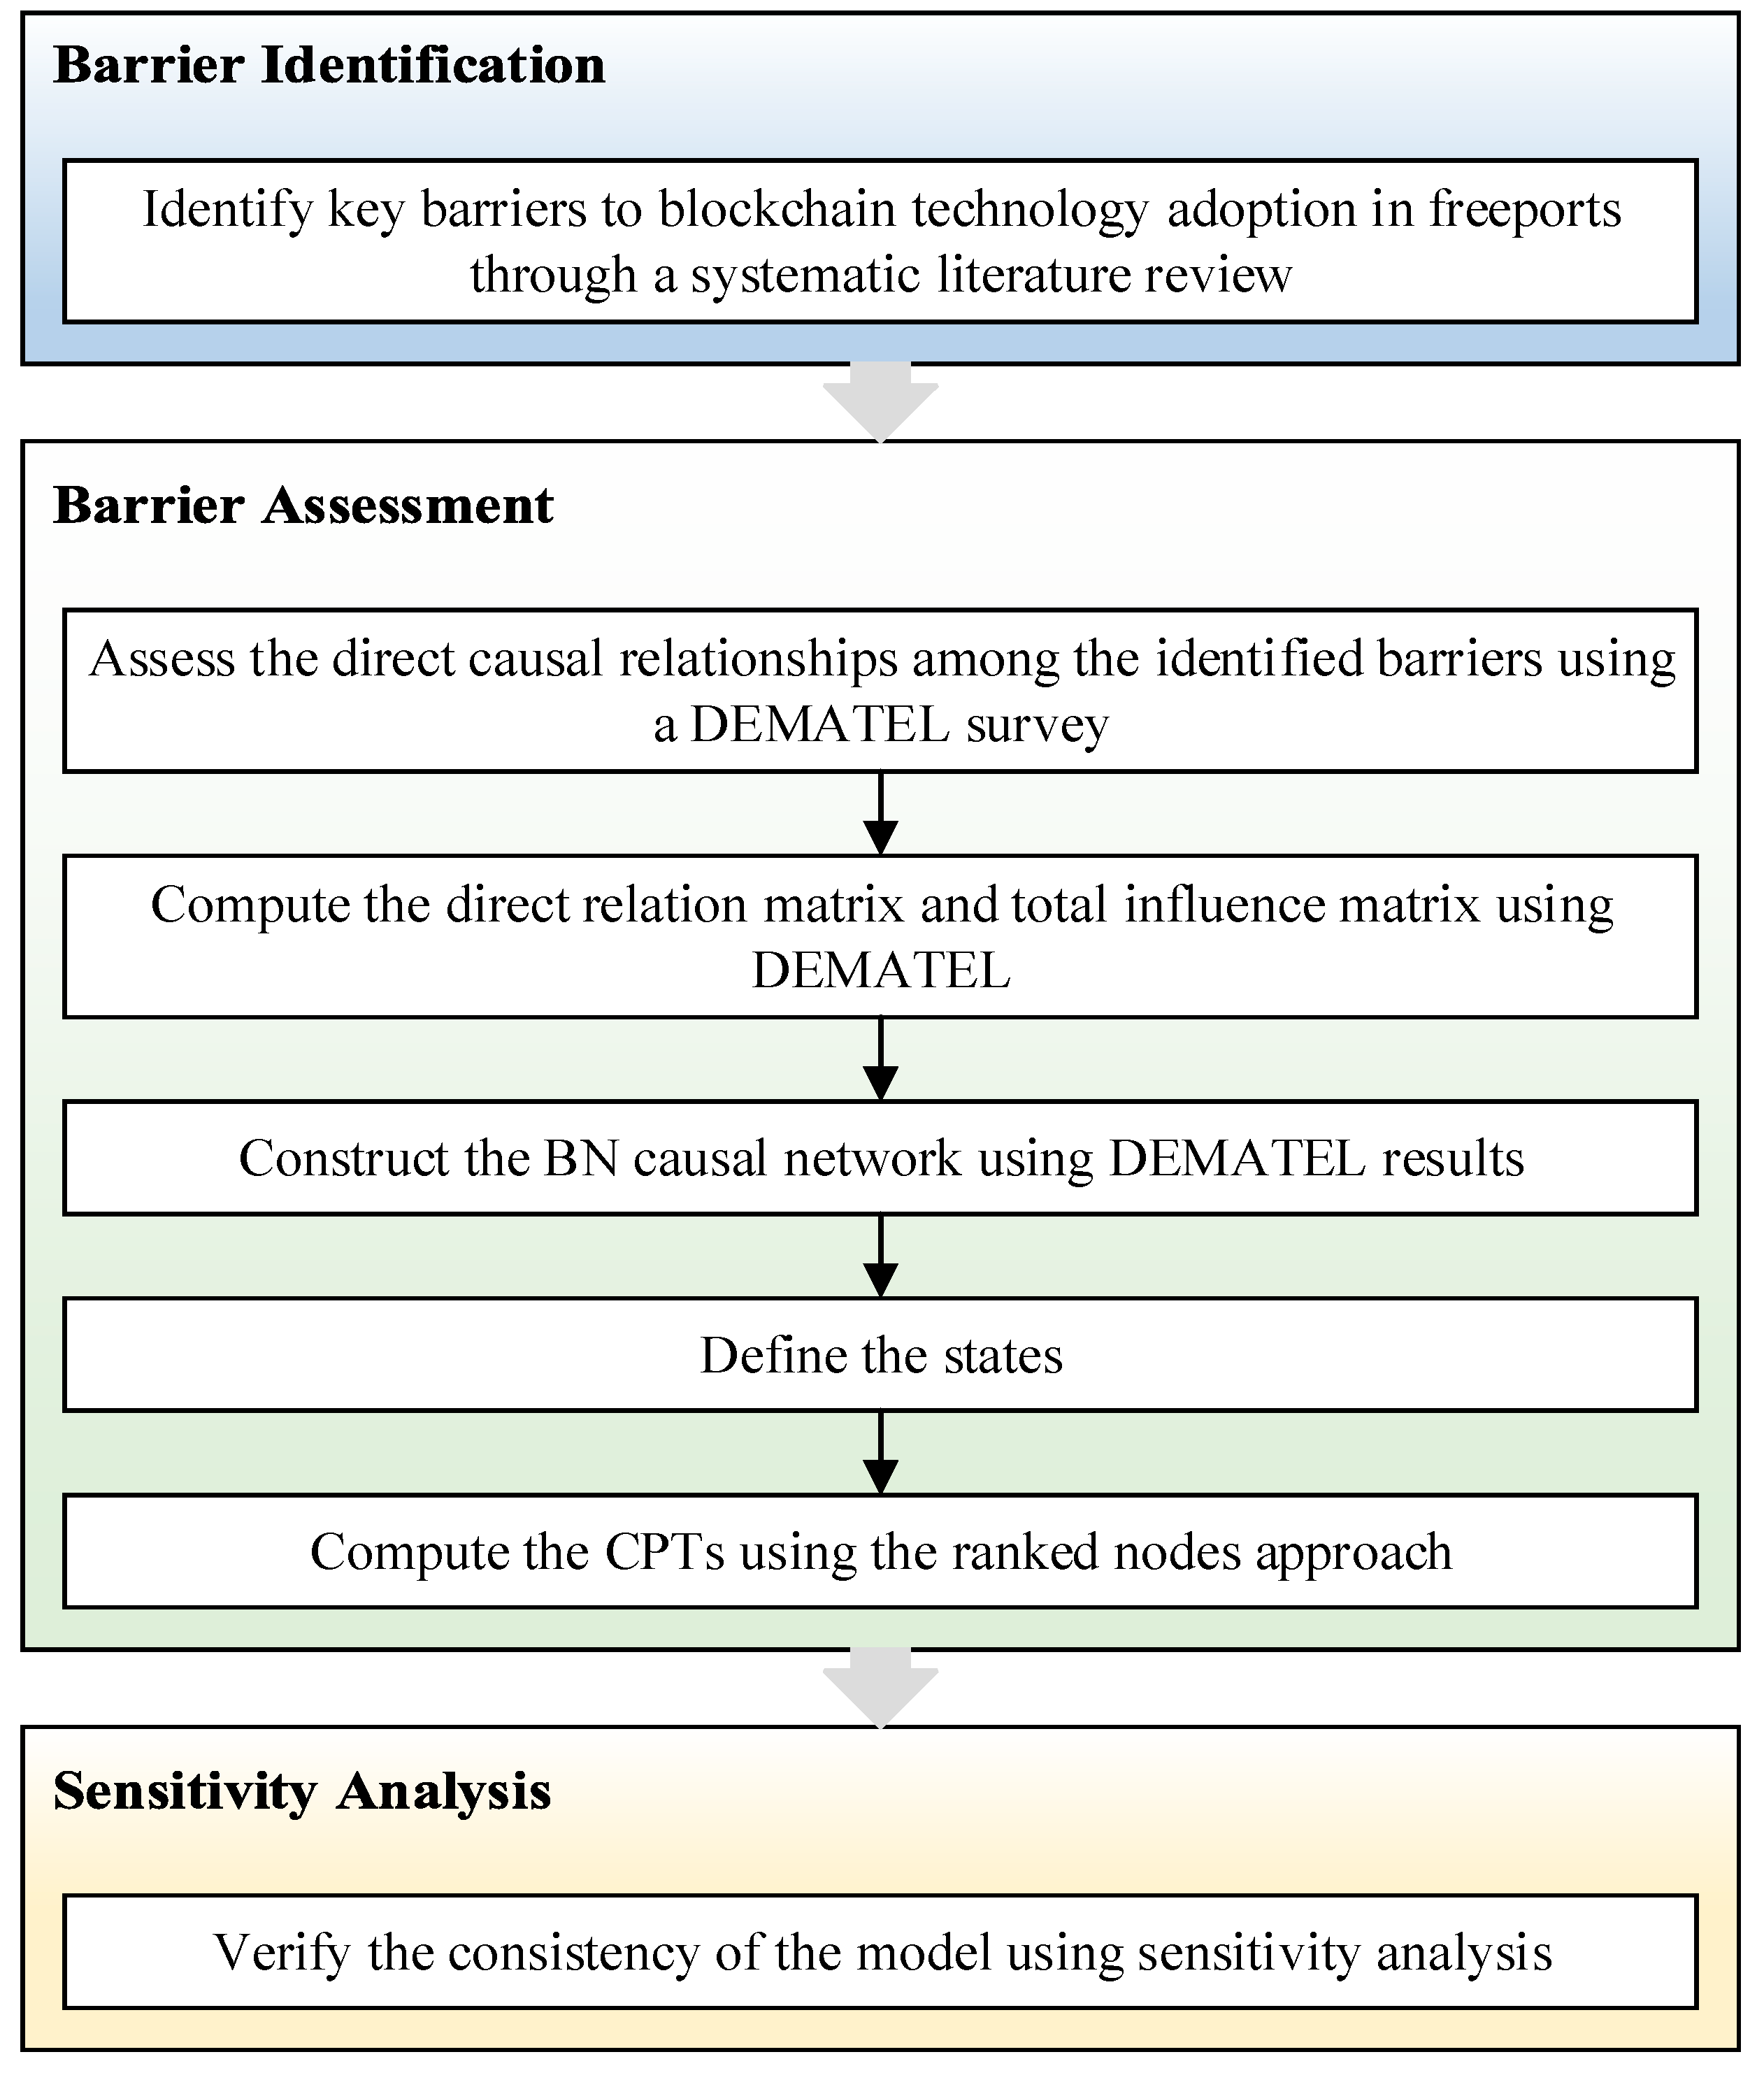
This study integrates DEMATEL and BN to develop a new model for assessing barriers to blockchain technology application and applies it in the freeport context. Compared to the traditional DEMATEL approach, the BN component offers a significant advantage by effectively addressing uncertainty and variability in the interrelationships among barriers. The proposed framework is presented in Figure 1. First, key barriers to the adoption of blockchain in supply chains and maritime scenarios are identified through a systematic literature review. In the barrier assessment stage, the DEMATEL approach is employed to evaluate the causal relationship among the identified barriers. It leverages expert insights with interdisciplinary knowledge in freeports and blockchain. The total influence matrix derived from DEMATEL forms the basis for constructing the causal network of the following BN model, thereby enhancing BN with a systematic approach to gathering expert judgment. Additionally, CPTs are generated using the ranked nodes approach, which further advances the DEMATEL-BN model by addressing the uncertainty of expert-assigned probabilities. The consistency of the model is subsequently verified through sensitivity analysis.
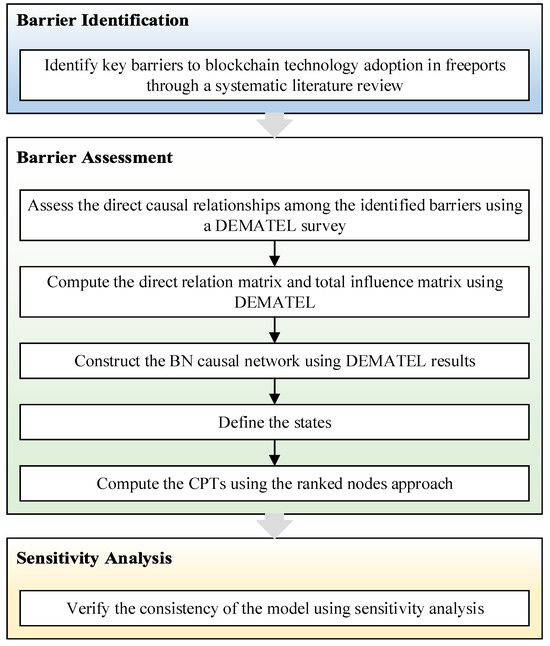
Figure 1.
The proposed framework.
3.2. Barrier Identification
From the 18 barriers listed in Table 2, this study selected the 10 most frequently examined barriers (B1 to B10) to analyse their interrelationships. The remaining eight barriers were excluded due to their low frequency of appearance in the literature, occurring no more than twice, and vague definitions. This selection aligns with the majority of existing studies on interrelationship analysis of barriers to blockchain adoption. For instance, Govindan, Khan et al., and Nguyen et al. [30,31,57] analysed 10 barriers, while Balci and Surucu-Balci [34] examined 8. Table 3 provides descriptions of the identified barriers.
Table 3.
Descriptions of the identified barriers.
3.3. Barrier Assessment
A DEMATEL-BN model is implemented to evaluate the causal relationships among the identified barriers using the following steps. For a detailed illustration of this process, please refer to Section 4.2.
- (1)
- A DEMATEL-based survey is conducted to rate direct causal relationships among the identified barriers using expert opinions. A scale from 0 to 4 is used to indicate the influence level () of the ith identified barrier on the jth, where “0” stands for no influence and “4” stands for very high influence.
- (2)
- Equations (1)–(4) are used to compute the direct relation matrix and total relation matrix [30,58]. In particular, the initial relationship matrix A is established for a total of n barriers, as shown in Equation (1).
The normalising factor K and the normalised matrix N are calculated according to Equations (2) and (3).
The total influence matrix T () is obtained according to Equation (4).
where “I” signifies the unit (identity) matrix.
Based on the total influence matrix, the DEMATEL causal influence graph can be set up with “R + C” on the x-axis and “R − C” on the y-axis, where R is the sum of rows and C is the sum of columns for each barrier, as depicted in Equations (5) and (6).
- (3)
- In this step, the total influence matrix of DEMATEL is utilised to establish a basis for constructing a Directed Acyclic Graph (DAG) as a preparatory step for building a BN model. With representing the intensity of total influence that one barrier has on another, this process consists of connecting all causal relations where exceeds a certain threshold value and refining the network by removing cycles [49,59]. This threshold is determined to ensure that the network connects the identified barriers as extensively as possible while minimising the occurrence of cycles and reverse arcs. It preserves the network’s logical consistency and focuses on significant interactions.
- (4)
- In this study, five mutually exclusive and collectively exhaustive states are defined for the internal strength of all barriers within the constructed network: very high (VH), high (H), moderate (M), low (L), and very low (VL). This classification aligns with previous risk studies employing a BN-based methodology [49,60,61].
- (5)
- In this step, CPTs are produced by employing the ranked nodes method. This method determines the probabilities of a child node utilising a weighted function derived from the values of its parent nodes. Ranked nodes represent discrete variables with states expressed on an ordinal scale, which can be translated into a continuous and monotonically ordered bounded numerical scale. In this study, the Doubly Truncated Normal Distribution (TNormal) is applied to model ranked causes using the Weighted Mean (WMEAN). Unlike the standard normal distribution, which extends from negative to positive infinity, the TNormal distribution is bounded by specific endpoints. It is denoted as TNormal (mu, sigma, lower, upper), where ‘mu’ represents the WMEAN based on the parent nodes’ values, and ‘sigma’ determines the central tendency and uncertainty for the child node’s conditional probability distribution. The ‘lower’ and ‘upper’ parameters are used to set the finite range of the child node’s value, for instance, between [0, 1]. This study parameterises the TNormal distribution using outputs from DEMATEL, a method proven effective in previous research [49,54,62]. Specifically, the initial average matrix from the DEMATEL approach is used to derive the weights of parent nodes for each child node. Standard Deviation (SD) values are calculated based on the initial relationship matrices from experts. The parameter ‘sigma’ is calculated by normalising the summed SD values for the parent nodes.
Given a set of causes X containing ranked nodes , Equation (7) computes the probability distribution of Y:
where are the parent nodes of Y.
3.4. Sensitivity Analysis
A sensitivity analysis is performed to examine the impact of minor input changes on the corresponding outputs. This analysis is crucial to establish the robustness of the methodology and its capacity for logical inference. To be considered robust, the sensitivity analysis has to satisfy the following two axioms [46,47,63]. Specifically, the process involves systematically adjusting the prior probabilities of each parent node and computing the updated expected utility of the corresponding child node. These utility values are evaluated in relation to anticipated changes or trends, guided by the established axioms.
- Axiom 1. A nominal increase or decrease in the prior probabilities of each parent node (representing the strength of each parent barrier) should correspondingly lead to an increase or decrease in the posterior probability of each child node (representing the strength of each child barrier).
- Axiom 2. The cumulative impact of probability changes in a set of evidence should not be less than the impact derived from any of its subsets.
4. Model Application and Analysis of Results
This section demonstrates the application of the designed framework in real-world freeport operations in the subsequent three subsections.
4.1. Survey Participants
The survey targeted industrial experts with cross-disciplinary experience in blockchain technology and freeport operations. However, professionals with dual expertise in blockchain and specific industries, particularly freeports, are rare due to the nascent stage of blockchain applications in this domain. Consequently, three experts who fulfilled these criteria participated in the survey. Despite the small sample size, their extensive experience and specialised knowledge add significant value and credibility to the findings. This reflects the good practices of existing studies in the field regarding the number of experts used to support a DEMATEL analysis. For instance, Feng et al., Kaya et al., and Yazdi et al. [49,51,62] collected data from three experts, while Gan et al. [64] obtained data from four experts. The credentials of the three experts are presented in Table 4. In the first section of the survey, open-ended questions were used to gather experts’ perspectives on the reasons behind freeports’ reluctance to adopt blockchain technology. Their insights provided specific clarifications on some of the identified barriers, as detailed in Table 5.
Table 4.
Expert credentials.
Table 5.
Expert interpretations of the identified barriers.
4.2. Assessing Barriers to Blockchain Adoption in Freeports
The implementation of the designed process to assess the interrelationships among the barriers, along with the results, is outlined as follows:
- (1)
- The total influence matrix. Appendix A displays the initial matrices from the three experts and their average initial matrix. The total influence matrix was derived using Equations (1)–(4) (refer to Section 3.3), with K = 0.040541, illustrated in Table 6. According to Equations (5) and (6), the following indicators were computed using the total influence matrix: the sum of the degree of driving (R), the sum of the degree of being influenced (C), the degree of central role (R + C), and the degree of relation (R − C), as presented in Table 7. Consequently, Figure 2 illustrates the causal and effect graph with R + C as the horizontal axis and R − C as the vertical axis. All causal barriers (B4, B5, B7, and B10) are positioned above the horizontal axis, while the effect barriers (B1, B2, B3, B6, B8, and B9) are located below it. The R + C axis represents the varying central roles of barriers. Those positioned farther along the axis have a more central role, such as B9, interacting with many other barriers.
Table 6. The total influence matrix.
Table 7. The sum of the degree of driving and being influenced.
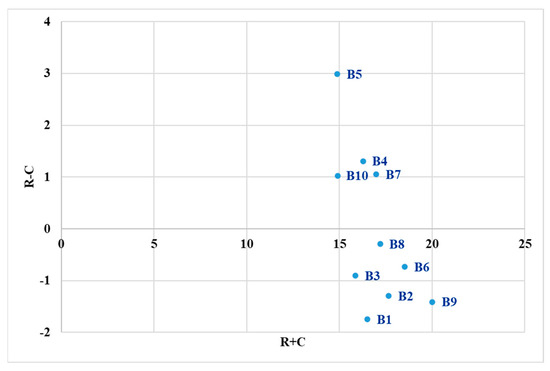 Figure 2. Causal diagram with the degree of central role and the degree of relation.
- (2)
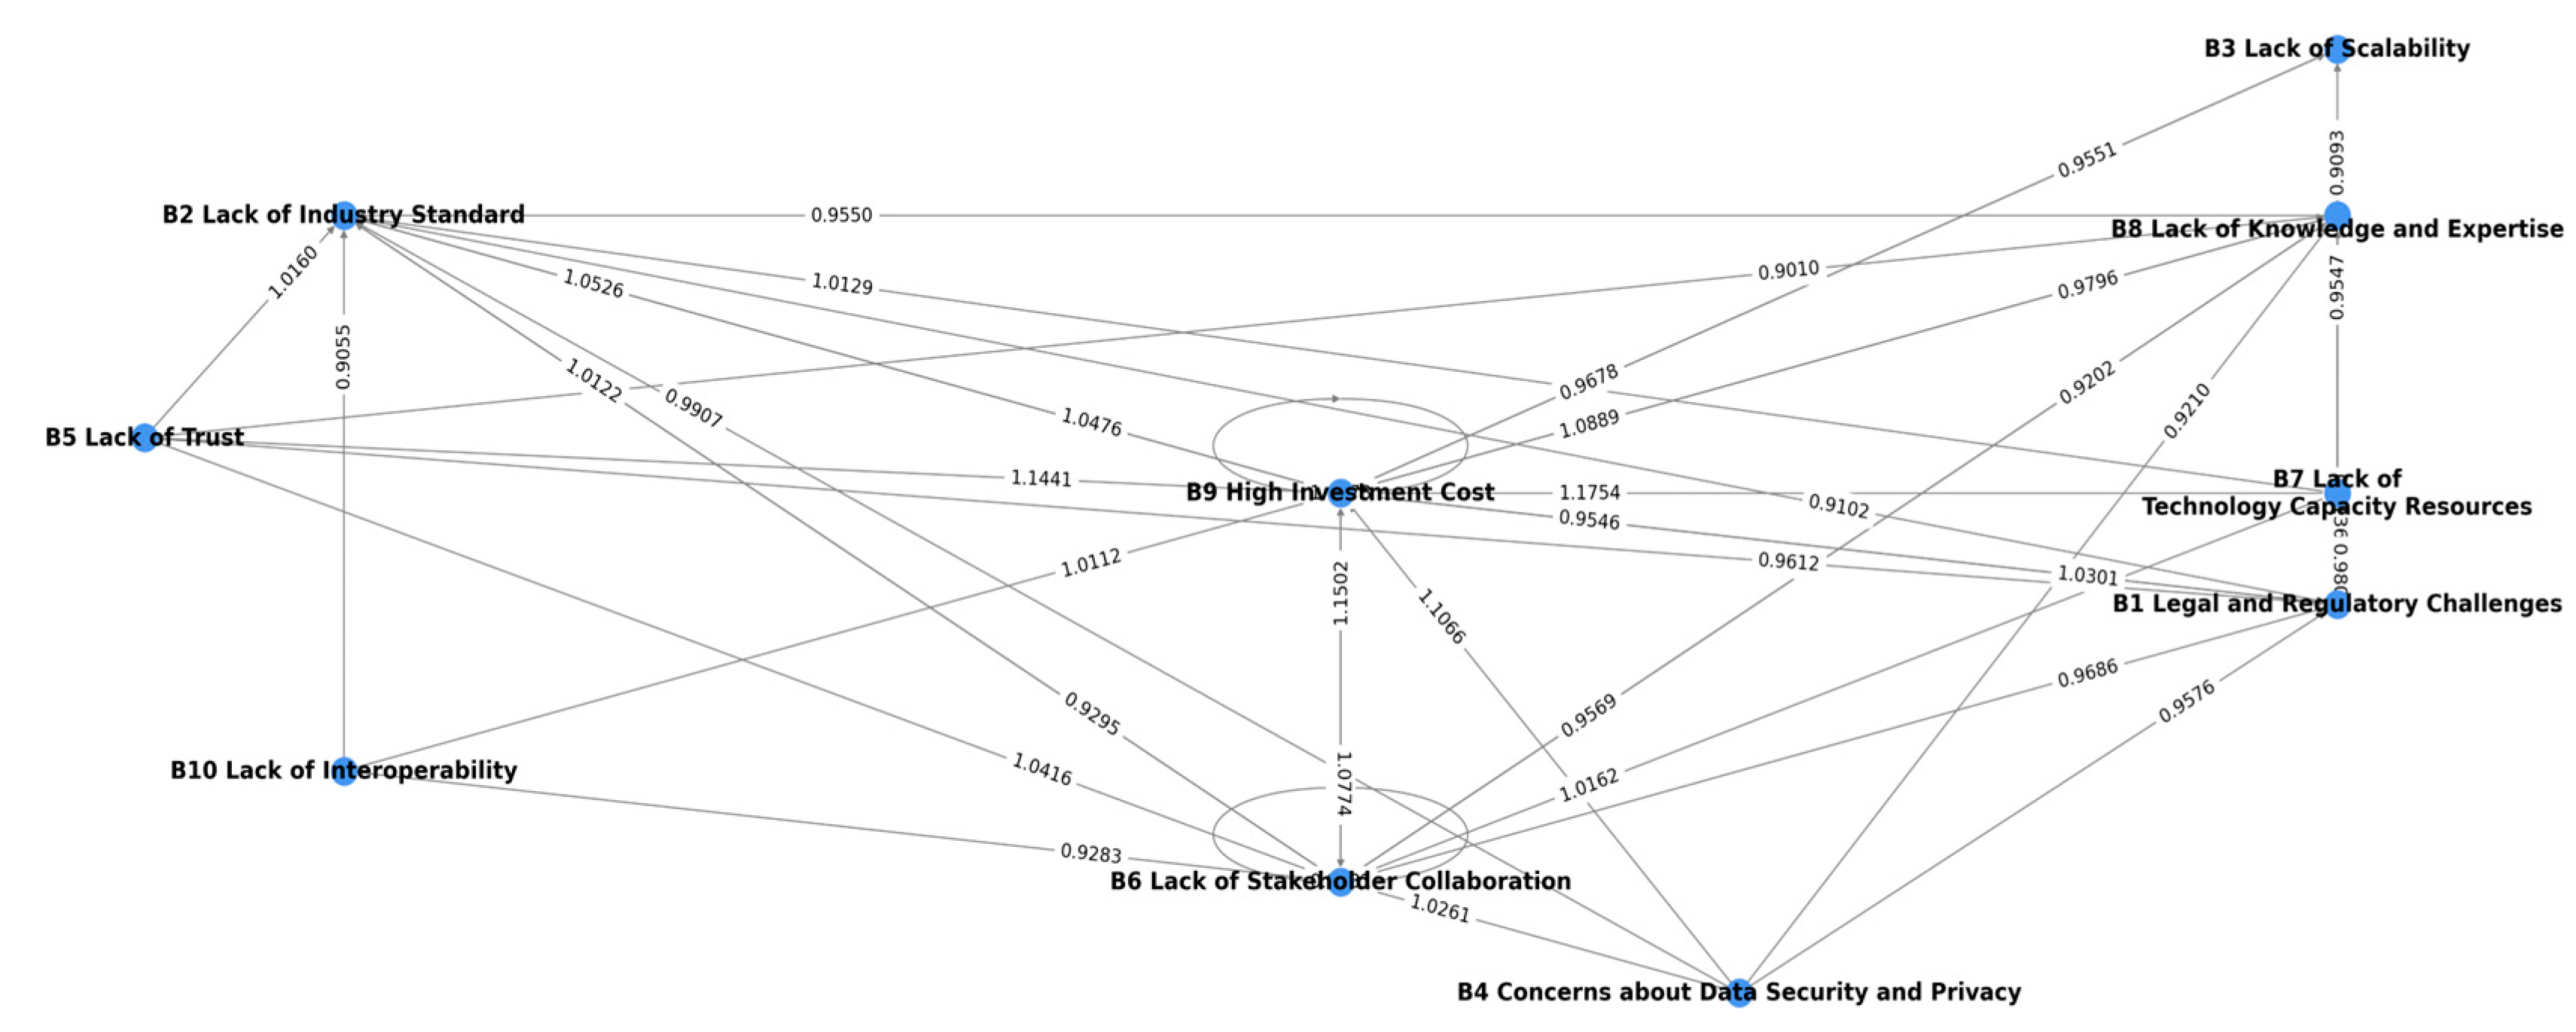
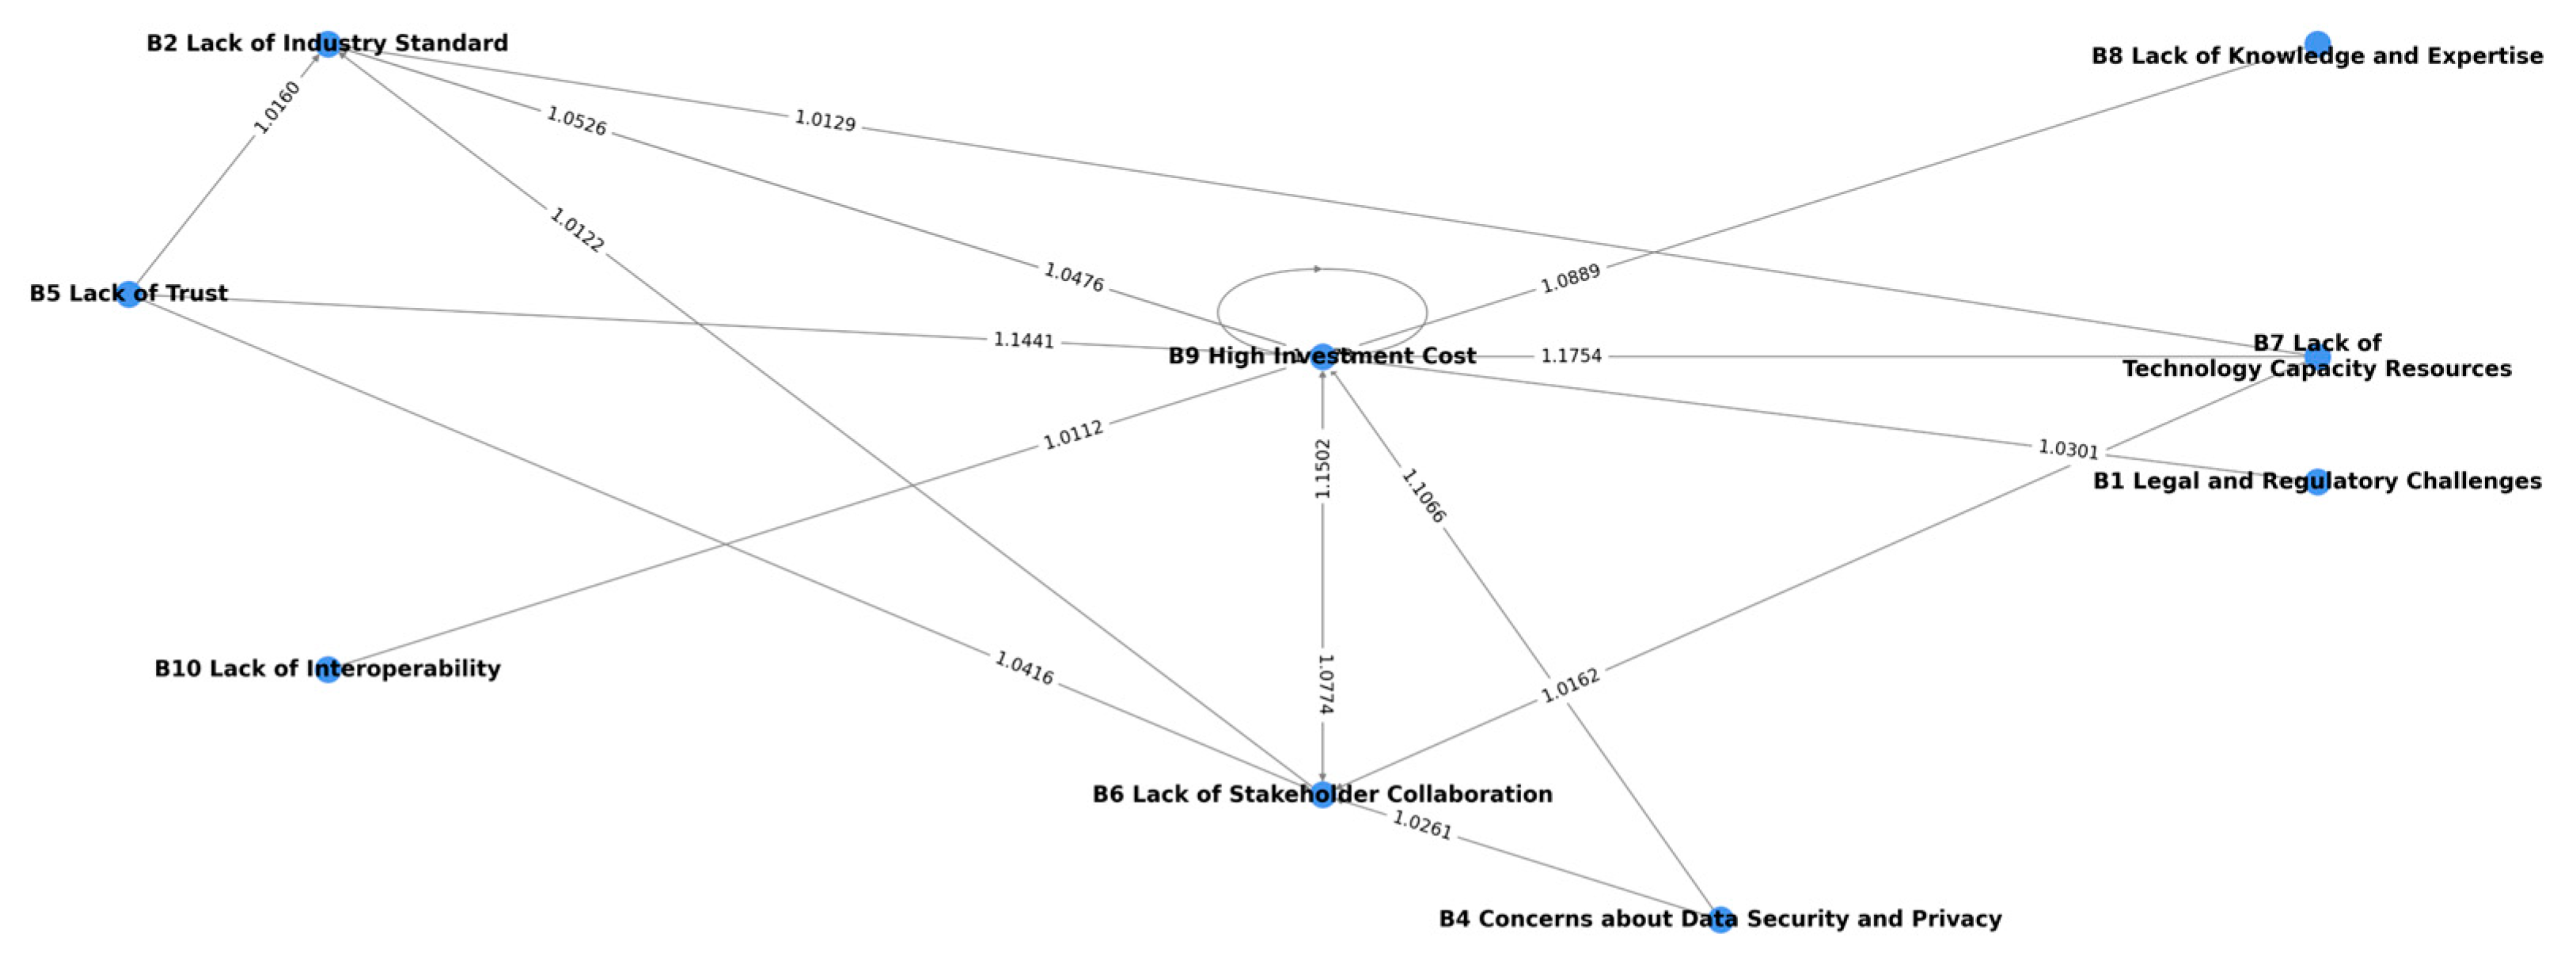
- The causal network. As detailed in Section 3, the total influence matrix from Table 6 was utilised to develop the causal network for BN. After incrementally testing all possible values (0.8, 0.9, and 1) using a probing approach, a threshold of 1 was found to be the most effective, as it resulted in a structural network that connected the majority of the identified barriers while minimising the occurrence of cycles and reverse arcs. Figure 3 and Figure 4 illustrate the directed graphs for thresholds 0.9 and 1, respectively. Notably, although connecting all identified barriers, a significant number of cycles emerge when the threshold is set at 0.9 or lower, making it ineffective for constructing a DAG. Specifically, the directed graph for threshold 0.9 consists of 31 cycles, including two self-loops. In contrast, applying threshold 1 significantly reduces the cycles to just 4: B9→B6→B9, B9→B2→B9, B9→B6→B2→B9, and a self-loop B9.
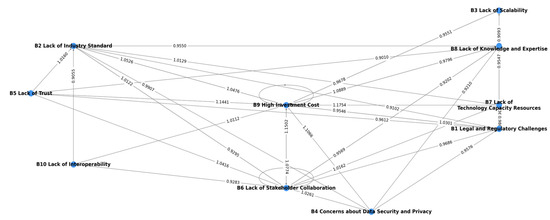 Figure 3. Directed graph for threshold 0.9.
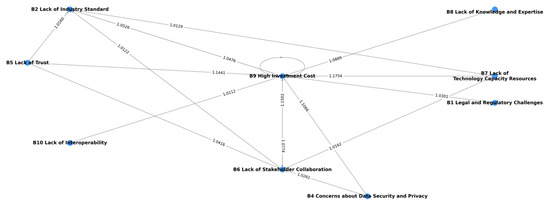 Figure 4. Directed graph for threshold 1.
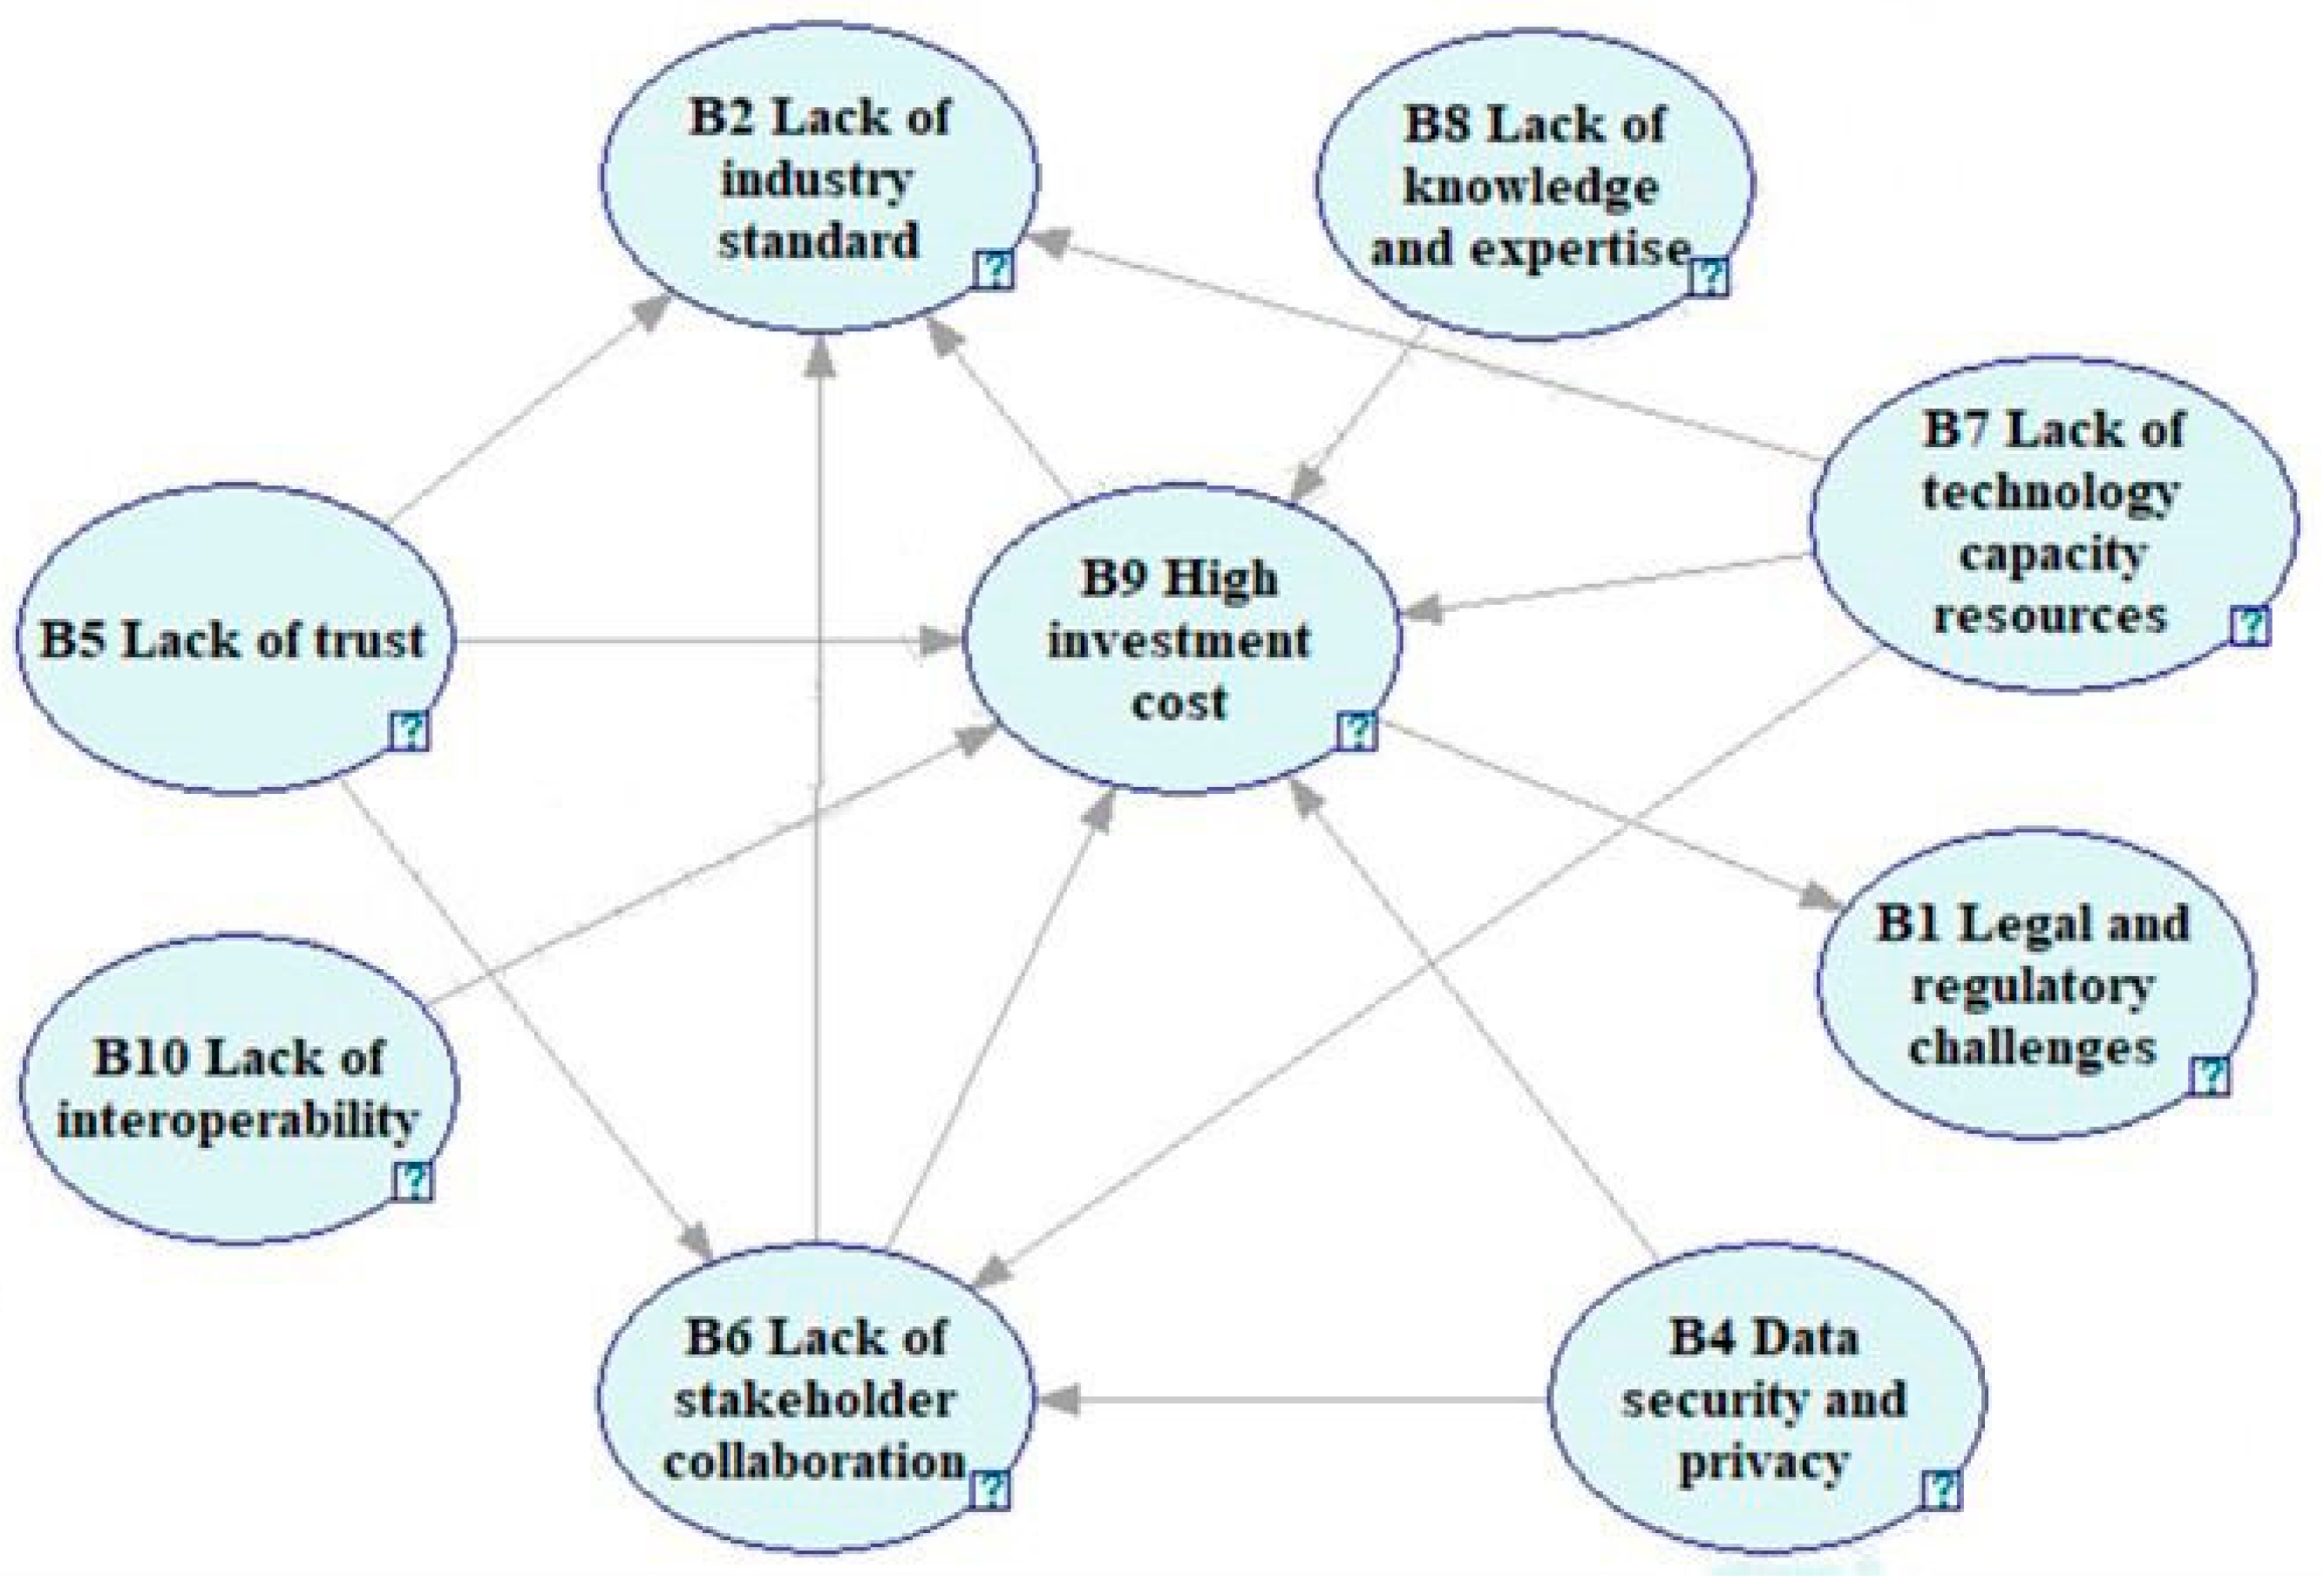
Subsequently, the initial network, established with a threshold of 1, was refined and converted into a DAG to serve as the foundation for building a BN model. Aside from the self-loop at B9, the refinement involved removing two reverse arcs with relatively lower influence values: one from “B2 Lack of Industry Standard” to “B9 High Investment Cost” (1.0476) and the other from “B9 High Investment Cost” to “B6 Lack of Stakeholder Collaboration” (1.0774). The refined causal network is depicted in Figure 5. This revised network consists of nine factors, excluding the “B3 Lack of Scalability” barrier due to its absence of any causal relationships exceeding the threshold of 1.
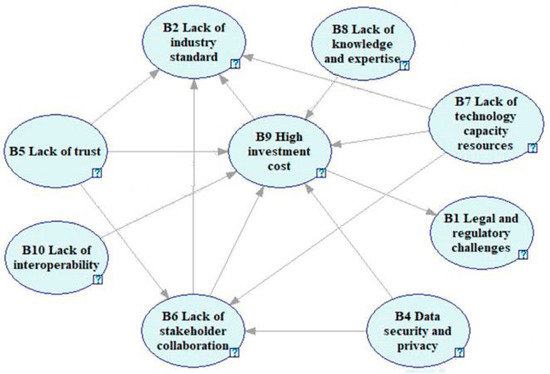
Figure 5.
The refined causal network.
- (3)
- The CPT configuration. To parameterise the BN structure based on TNormal (mu, sigma, lower, upper), the initial average matrix from the DEMATEL approach was used to derive the weights of parent nodes for each child node (see Table A4 in the Appendix A). Taking the barrier “Lack of industry standard (B2)” as an example, the weights of its four parents (B5, B6, B7, and B9) were deduced from a numerical set (3.0000, 3.0000, 2.6667, and 3.0000), resulting in normalised weights of (0.2571, 0.2571, 0.2286, and 0.2571). On the other hand, the SD values were calculated and added up for each child node, as presented in Table 8. The summed SD values were further normalised to be used as an input (sigma) for the TNormal distribution. For instance, the SD values of parent nodes of B2 are (0.0000, 0.0000, 0.5774, and 1.0000). The normalisation, achieved by dividing their sum by the total of (3.0000, 3.0000, 2.6667, and 3.0000), resulted in a value of 0.1352.
Table 8. SD values in three experts’ assessments.
Thus, . The GeNIe 4.1 academic software (https://www.bayesfusion.com) (accessed on 19 December 2023) was used to configure the BN parameters, as this software supports the TNormal function natively. The BN structure, configured through the ranked nodes method, is illustrated in Figure 6. This figure illustrates the predictive probabilities for each state of the child nodes (B1, B2, B6, and B9) when the internal strength of all causal barriers (B4, B5, B7, B8, and B10) is set to 100% very low.
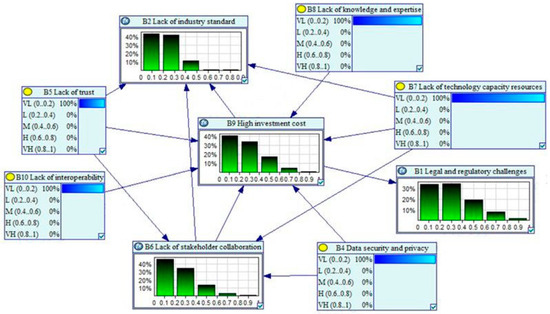
Figure 6.
The parameterised BN structure through TNormal.
4.3. Sensitivity Analysis Results
The fulfilment of the two axioms was demonstrated through the following process, with Table 9 providing an example of B9. Initially, each parent node experienced a minor adjustment of 10%, redistributed from VL (−10%) to VH (+10%). The consequent change in the expected utility of the corresponding child node was computed. This calculation revealed that the value of a child node varied in direct proportion to the changes in its parent nodes’ values. Specifically, the values 0.2831, 0.2850, 0.2893, 0.2819, and 0.2825 are all greater than the original value of 0.2777, thereby satisfying Axiom 1. Subsequently, for Axiom 2, the expected utility values of the child node were recalculated with a 10% reallocation in multiple parent nodes. This process confirmed the attainment of Axiom 2, as the values follow the progression 0.2777 < 0.2947 < 0.3012 < 0.3160 < 0.3162. Building on the works of Fan et al., Li et al., and Yang et al. [46,47,63], the consistency of the trends demonstrates that the sensitivity analysis results meet the set axioms, thereby supporting the verification of the model.
Table 9.
Sensitivity analysis results (B9).
5. Implication and Discussion
The implications of the developed model are manifold and significant for decision-makers and practitioners. Although existing research has identified many challenges in integrating blockchain technology across various contexts, the methodologies applied have intrinsic limitations, with only a few studies successfully addressing the interrelationships among these challenges [26,30,31,32,34,57]. Understanding these interrelationships is essential for developing integrated solutions to address these challenges effectively. Moreover, no prior studies have specifically explored the emerging context of freeports, which is distinct due to its regulatory frameworks, handling of luxury goods, and complex stakeholder interactions.
This study addresses this gap by providing a strategic tool to evaluate the complex interrelationships among various barriers to blockchain implementation within a freeport system. First, by identifying the barriers that hold a central role within a freeport system, attention and funding can be efficiently directed to the most influential factors for substantial improvements. For instance, high investment costs (B9) emerge as the primary barrier requiring attention due to their central position in the system. Given businesses’ focus on return on investment, demonstrating the tangible financial benefits of blockchain applications becomes crucial. A recommended strategy involves developing a phased implementation plan, starting with pilot projects to showcase immediate value and scalability potential, thereby attracting further investment and support for broader integration.
Second, the ability to differentiate between causal and effect barriers allows for a targeted approach to managing systemic challenges. To be specific, addressing causal barriers with the most significant influence may lead to a cascading positive effect on other barriers, optimising the efficacy of interventions. For example, addressing the lack of trust (B5) among partners in freeport supply chains might not only resolve that specific issue but also help mitigate the lack of industry standard (B2), the lack of stakeholder collaboration (B6), and high investment costs (B9). Conversely, addressing effect barriers, even those with a central position, such as high investment costs (B9), requires implementing mitigation measures to address their underlying causes.
Moreover, the influence of barriers on one another is not fixed but can vary across different combinations. Therefore, freeport policymakers should avoid evaluating each factor’s influence in isolation and instead consider it within specific scenarios. However, this variability has not been addressed in current research, as highlighted in Section 2.2. In this light, the proposed model holds significant implications for advancing factor analysis in blockchain applications by accommodating this uncertainty. It enables a more nuanced understanding of complex systems and promotes the integration of network analysis and probabilistic models to examine interdependent factors and capture their dynamic, combined effects across scenarios. In contrast, existing frameworks based on MCDM methods can evaluate the influence between barriers but are limited in their ability to infer the strength of a barrier occurring based on the strength of its influential factors.
Additionally, the strength of barriers, such as the lack of technology capacity or knowledge, varies across regions. The dynamic nature of this model makes it region-specific, adapting to local conditions and enabling customised applications. It also offers the flexibility to incorporate regional trends and future developments, ensuring that the model remains relevant as local conditions evolve.
Finally, the developed model is applicable not just for the blockchain adoption scenarios but also catalyses the strategic planning and implementation of broader digitalisation initiatives within freeports and other special economic zones. It fosters economic growth while maintaining a balance between operational efficiency and security.
6. Conclusions
This study proposed a novel hybrid methodology for assessing the barriers to blockchain adoption in freeports, offering significant contributions both methodologically and practically. Although numerous studies have examined the adoption of blockchain technology across industries, the associated challenges and causal relationships remain insufficiently addressed. Furthermore, little research has explored its implementation in freeports. This study began with a comprehensive literature review on blockchain adoption in maritime and supply chain activities, providing a foundation for defining the current state-of-the-art practices in freeport operations while highlighting the advantages and limitations of existing methods. Through the literature review, key barriers were identified. Subsequently, a hybrid DEMATEL-BN model was employed to analyse the probabilistic causal relationships of these barriers, effectively addressing variability across different scenarios. The initial influence matrices were collected from experts through a semi-structured survey. The ranked nodes approach was applied to parameterise the model, offering the advantage of minimising reliance on subjective probabilities assigned by experts. Finally, the model’s consistency was verified through sensitivity analysis.
The findings of this study provide important implications for the digital transformation in freeports. First, it provides stakeholders, including freeport authorities, regulatory bodies, logistics companies, and technology providers, with a comprehensive overview of the primary challenges that need to be addressed to harness the full potential of blockchain technology. Second, by identifying the causal barriers and central barriers, this study can more effectively inform the development of targeted interventions and strategies to overcome the most crucial obstacles, thereby speeding up the adoption process. Furthermore, the methodology enables probabilistic inferences about the internal strength of individual barriers, accounting for the combined influence of other barriers through dynamic scenario analysis, thereby enhancing its practical applicability. Lastly, assessing the barriers to blockchain adoption contributes to the broader discourse on digital transformation in freeports and various logistics hubs, offering valuable insights into how digital technologies can be effectively integrated to enhance operational efficiency and safety.
This research is limited in its scope of scenario exploration due to the early stage of blockchain application in freeports. Future research could improve the proposed methodology by leveraging more comprehensive datasets as they become available, enabling case analyses across diverse scenarios in different freeports or similar contexts to improve the framework’s practical applicability. Moreover, future research could focus on developing strategies to address these barriers by exploring key criteria and employing quantitative assessment methods to evaluate their effectiveness and identify the strategies that have the most significant impact on overcoming these challenges.
Author Contributions
Conceptualisation, X.L.; methodology, X.L., S.F., H.L. and Z.Y.; software, X.L.; validation, X.L.; formal analysis, X.L.; investigation, X.L.; resources, X.L., S.F., H.L. and Z.Y.; data curation, X.L. and G.J.; writing—original draft preparation, X.L.; writing—review and editing, S.F., H.L. and Z.Y.; visualisation, X.L.; supervision, S.F., H.L. and Z.Y.; project administration, S.F., H.L. and Z.Y.; funding acquisition, Z.Y. All authors have read and agreed to the published version of the manuscript.
Funding
This project received funding from the European Research Council (ERC) under the European Union’s Horizon 2020 research and innovation programme (Grant Agreement No. 864724).
Institutional Review Board Statement
This study is organised by Liverpool John Moores University (LJMU). It has received ethics approval through LJMU’s Research Ethics Committee (Approval Reference: 23/ENR/004, date of approval: 29 September 2023).
Informed Consent Statement
Informed consent was obtained from all participants in this study. By completing and returning the questionnaire, participants consented to be part of the research study and for their data to be used as described.
Data Availability Statement
The research data used in this study have been included in this manuscript. The personal data of participants are unavailable due to ethical restrictions.
Conflicts of Interest
The authors declare no conflicts of interest.
Appendix A
Table A1.
The initial matrix of Expert 1.
Table A1.
The initial matrix of Expert 1.
| B1 | B2 | B3 | B4 | B5 | B6 | B7 | B8 | B9 | B10 | |
|---|---|---|---|---|---|---|---|---|---|---|
| B1 | 0 | 3 | 3 | 4 | 2 | 2 | 1 | 2 | 3 | 2 |
| B2 | 3 | 0 | 3 | 4 | 2 | 2 | 3 | 2 | 3 | 3 |
| B3 | 4 | 3 | 0 | 4 | 2 | 3 | 2 | 2 | 3 | 2 |
| B4 | 4 | 4 | 4 | 0 | 4 | 4 | 4 | 4 | 4 | 3 |
| B5 | 3 | 3 | 3 | 4 | 0 | 3 | 3 | 3 | 4 | 3 |
| B6 | 4 | 3 | 3 | 4 | 3 | 0 | 3 | 3 | 4 | 3 |
| B7 | 4 | 3 | 3 | 4 | 3 | 3 | 0 | 3 | 4 | 3 |
| B8 | 3 | 3 | 2 | 4 | 3 | 3 | 3 | 0 | 3 | 3 |
| B9 | 4 | 3 | 3 | 4 | 4 | 4 | 3 | 3 | 0 | 3 |
| B10 | 3 | 2 | 2 | 4 | 2 | 3 | 3 | 4 | 3 | 0 |
Table A2.
The initial matrix of Expert 2.
Table A2.
The initial matrix of Expert 2.
| B1 | B2 | B3 | B4 | B5 | B6 | B7 | B8 | B9 | B10 | |
|---|---|---|---|---|---|---|---|---|---|---|
| B1 | 0 | 3 | 2 | 0 | 0 | 4 | 1 | 3 | 4 | 1 |
| B2 | 3 | 0 | 1 | 0 | 0 | 3 | 2 | 3 | 3 | 1 |
| B3 | 3 | 2 | 0 | 0 | 0 | 4 | 2 | 3 | 4 | 1 |
| B4 | 3 | 2 | 1 | 0 | 0 | 3 | 2 | 3 | 3 | 1 |
| B5 | 3 | 3 | 2 | 0 | 0 | 3 | 3 | 1 | 4 | 1 |
| B6 | 2 | 3 | 2 | 0 | 0 | 0 | 2 | 3 | 3 | 1 |
| B7 | 3 | 2 | 2 | 0 | 0 | 3 | 0 | 3 | 4 | 1 |
| B8 | 3 | 2 | 2 | 0 | 0 | 3 | 3 | 0 | 3 | 1 |
| B9 | 3 | 4 | 4 | 0 | 0 | 3 | 3 | 4 | 0 | 1 |
| B10 | 2 | 3 | 3 | 0 | 0 | 3 | 3 | 3 | 4 | 0 |
Table A3.
The initial matrix of Expert 3.
Table A3.
The initial matrix of Expert 3.
| B1 | B2 | B3 | B4 | B5 | B6 | B7 | B8 | B9 | B10 | |
|---|---|---|---|---|---|---|---|---|---|---|
| B1 | 0 | 3 | 1 | 2 | 2 | 2 | 2 | 2 | 2 | 1 |
| B2 | 3 | 0 | 3 | 3 | 2 | 2 | 3 | 3 | 3 | 1 |
| B3 | 1 | 2 | 0 | 1 | 1 | 2 | 2 | 2 | 2 | 1 |
| B4 | 1 | 2 | 1 | 0 | 3 | 3 | 1 | 1 | 1 | 3 |
| B5 | 1 | 3 | 2 | 4 | 0 | 4 | 1 | 1 | 2 | 3 |
| B6 | 2 | 3 | 2 | 3 | 4 | 0 | 1 | 1 | 4 | 4 |
| B7 | 1 | 3 | 3 | 3 | 2 | 1 | 0 | 3 | 4 | 3 |
| B8 | 1 | 3 | 3 | 2 | 2 | 1 | 3 | 0 | 4 | 3 |
| B9 | 3 | 2 | 3 | 3 | 2 | 3 | 2 | 2 | 0 | 1 |
| B10 | 1 | 3 | 2 | 1 | 2 | 3 | 1 | 1 | 1 | 0 |
Table A4.
The average initial matrix.
Table A4.
The average initial matrix.
| B1 | B2 | B3 | B4 | B5 | B6 | B7 | B8 | B9 | B10 | |
|---|---|---|---|---|---|---|---|---|---|---|
| B1 | 0.0000 | 3.0000 | 2.0000 | 2.0000 | 1.3333 | 2.6667 | 1.3333 | 2.3333 | 3.0000 | 1.3333 |
| B2 | 3.0000 | 0.0000 | 2.3333 | 2.3333 | 1.3333 | 2.3333 | 2.6667 | 2.6667 | 3.0000 | 1.6667 |
| B3 | 2.6667 | 2.3333 | 0.0000 | 1.6667 | 1.0000 | 3.0000 | 2.0000 | 2.3333 | 3.0000 | 1.3333 |
| B4 | 2.6667 | 2.6667 | 2.0000 | 0.0000 | 2.3333 | 3.3333 | 2.3333 | 2.6667 | 2.6667 | 2.3333 |
| B5 | 2.3333 | 3.0000 | 2.3333 | 2.6667 | 0.0000 | 3.3333 | 2.3333 | 1.6667 | 3.3333 | 2.3333 |
| B6 | 2.6667 | 3.0000 | 2.3333 | 2.3333 | 2.3333 | 0.0000 | 2.0000 | 2.3333 | 3.6667 | 2.6667 |
| B7 | 2.6667 | 2.6667 | 2.6667 | 2.3333 | 1.6667 | 2.3333 | 0.0000 | 3.0000 | 4.0000 | 2.3333 |
| B8 | 2.3333 | 2.6667 | 2.3333 | 2.0000 | 1.6667 | 2.3333 | 3.0000 | 0.0000 | 3.3333 | 2.3333 |
| B9 | 3.3333 | 3.0000 | 3.3333 | 2.3333 | 2.0000 | 3.3333 | 2.6667 | 3.0000 | 0.0000 | 1.6667 |
| B10 | 2.0000 | 2.6667 | 2.3333 | 1.6667 | 1.3333 | 3.0000 | 2.3333 | 2.6667 | 2.6667 | 0.0000 |
References
- Wang, Y.; Potter, A.; Naim, M.; Vafeas, A.; Mavromatis, A.; Simeonidou, D. 5G Enabled Freeports: A Conceptual Framework. IEEE Access 2022, 10, 91871–91887. [Google Scholar] [CrossRef]
- Loi, E. S’pore Port Handled Record 39.01 Million Shipping Containers in 2023. Straits Times, 13 January 2024. [Google Scholar]
- Liu, C.; Wu, S. The Application of Blockchain to Intelligent Port Logistics—Taking Hainan Free Trade Port as an Example. J. Phys. Conf. Ser. 2020, 1624, 032053. [Google Scholar] [CrossRef]
- Shi, W.; Fan, Y. Based on Blockchain, Hainan Free Trade Port Information Platform Architecture Design. In Proceedings of the 2021 3rd International Conference on Machine Learning, Big Data and Business Intelligence (MLBDBI), Taiyuan, China, 3–5 December 2021; pp. 721–730. [Google Scholar]
- Stevens, C. Free Ports and the Blockchain Come Together to Speed up Seamless Trade; EU Reporter: Brussels, Belgium, 2021. [Google Scholar]
- Tian, S.; Ye, L.; Jiang, F.; Huang, C. Pricing and Redesign Decisions for Global Supply Chain of Free Trade Port Based on the Complex System. Alex. Eng. J. 2023, 66, 607–618. [Google Scholar] [CrossRef]
- Jović, M.; Tijan, E.; Brčić, D.; Pucihar, A. Digitalization in Maritime Transport and Seaports: Bibliometric, Content and Thematic Analysis. J. Mar. Sci. Eng. 2022, 10, 486. [Google Scholar] [CrossRef]
- Chen, X.; Zheng, J.; Li, C.; Wu, B.; Wu, H.; Montewka, J. Maritime Traffic Situation Awareness Analysis via High-Fidelity Ship Imaging Trajectory. Multimed. Tools Appl. 2024, 83, 48907–48923. [Google Scholar] [CrossRef]
- Liang, X.; Fan, S.; Lucy, J.; Chen, J.; Coleman, J.; Li, Y.; Qu, Z.; Li, H.; Yang, Z. Quantitative Sustainability Assessment of Freeports: Hybrid Model Evidence from the UK. J. Clean. Prod. 2025, 487, 144521. [Google Scholar] [CrossRef]
- Nakamoto, S. Bitcoin: A Peer-to-Peer Electronic Cash System. Decentralized Bus. Rev. 2008, 21260. [Google Scholar] [CrossRef]
- PierNext The Closure of TradeLens: When Technology Is Not Enough. PierNext, 26 January 2023. Available online: https://piernext.portdebarcelona.cat/en/technology/the-closure-of-tradelens/ (accessed on 7 December 2024).
- Dutta, P.; Choi, T.-M.; Somani, S.; Butala, R. Blockchain Technology in Supply Chain Operations: Applications, Challenges and Research Opportunities. Transp. Res. Part E Logist. Transp. Rev. 2020, 142, 102067. [Google Scholar] [CrossRef]
- Dujak, D.; Sajter, D. Blockchain Applications in Supply Chain. In SMART Supply Network; Kawa, A., Maryniak, A., Eds.; EcoProduction; Springer International Publishing: Cham, Switzerland, 2019; pp. 21–46. ISBN 978-3-319-91668-2. [Google Scholar]
- Han, Y.; Fang, X. Systematic Review of Adopting Blockchain in Supply Chain Management: Bibliometric Analysis and Theme Discussion. Int. J. Prod. Res. 2024, 62, 991–1016. [Google Scholar] [CrossRef]
- Fang, C.; Chi, M.; Fan, S.; Choi, T.-M. Who Should Invest in Blockchain Technology under Different Pricing Models in Supply Chains? Eur. J. Oper. Res. 2024, 319, 777–792. [Google Scholar] [CrossRef]
- Pu, S.; Lam, J.S.L. Blockchain Adoptions in the Maritime Industry: A Conceptual Framework. Marit. Policy Manag. 2021, 48, 777–794. [Google Scholar] [CrossRef]
- Shin, S.; Wang, Y.; Pettit, S.; Abouarghoub, W. Blockchain Application in Maritime Supply Chain: A Systematic Literature Review and Conceptual Framework. Marit. Policy Manag. 2023, 51, 1062–1095. [Google Scholar] [CrossRef]
- Kapidani, N.; Bauk, S.; Davidson, I.E.A. Developing Countries’ Concerns Regarding Blockchain Adoption in Maritime. J. Mar. Sci. Eng. 2021, 9, 1326. [Google Scholar] [CrossRef]
- Zhang, Z.; Zhu, H.; Liang, H. Blockchain-Based Cold Chain Traceability with NR-PBFT and IoV-IMS for Marine Fishery Vessels. J. Mar. Sci. Eng. 2024, 12, 1371. [Google Scholar] [CrossRef]
- Li, H.; Gao, J.; Li, X. Blockchain Adoption Strategy of Two-Sided Shipping Platforms Connecting Forwarder and Liner Company. Ocean Coast. Manag. 2024, 247, 106932. [Google Scholar] [CrossRef]
- Li, Z.; Wang, L.; Wang, G.; Xin, X.; Chen, K.; Zhang, T. Investment and Subsidy Strategy for Low-Carbon Port Operation with Blockchain Adoption. Ocean Coast. Manag. 2024, 248, 106966. [Google Scholar] [CrossRef]
- Nguyen, S.; Shu-Ling Chen, P.; Du, Y. Risk Assessment of Maritime Container Shipping Blockchain-Integrated Systems: An Analysis of Multi-Event Scenarios. Transp. Res. Part E Logist. Transp. Rev. 2022, 163, 102764. [Google Scholar] [CrossRef]
- Mohammed, A.; Potdar, V.; Quaddus, M.; Hui, W. Blockchain Adoption in Food Supply Chains: A Systematic Literature Review on Enablers, Benefits, and Barriers. IEEE Access 2023, 11, 14236–14255. [Google Scholar] [CrossRef]
- Sargent, C.S.; Breese, J.L. Blockchain Barriers in Supply Chain: A Literature Review. J. Comput. Inf. Syst. 2023, 64, 124–135. [Google Scholar] [CrossRef]
- Moretto, A.; Macchion, L. Drivers, Barriers and Supply Chain Variables Influencing the Adoption of the Blockchain to Support Traceability along Fashion Supply Chains. Oper. Manag. Res. 2022, 15, 1470–1489. [Google Scholar] [CrossRef]
- Kaur, J.; Kumar, S.; Narkhede, B.E.; Dabić, M.; Rathore, A.P.S.; Joshi, R. Barriers to Blockchain Adoption for Supply Chain Finance: The Case of Indian SMEs. Electron. Commer. Res. 2022, 24, 303–340. [Google Scholar] [CrossRef]
- Mangla, S.K.; Kazançoğlu, Y.; Yıldızbaşı, A.; Öztürk, C.; Çalık, A. A Conceptual Framework for Blockchain-Based Sustainable Supply Chain and Evaluating Implementation Barriers: A Case of the Tea Supply Chain. Bus. Strategy Environ. 2022, 31, 3693–3716. [Google Scholar] [CrossRef]
- Naseem, M.H.; Yang, J.; Zhang, T.; Alam, W. Utilizing Fuzzy AHP in the Evaluation of Barriers to Blockchain Implementation in Reverse Logistics. Sustainability 2023, 15, 7961. [Google Scholar] [CrossRef]
- Nazam, M.; Hashim, M.; Nută, F.M.; Yao, L.; Zia, M.A.; Malik, M.Y.; Usman, M.; Dimen, L. Devising a Mechanism for Analyzing the Barriers of Blockchain Adoption in the Textile Supply Chain: A Sustainable Business Perspective. Sustainability 2022, 14, 16159. [Google Scholar] [CrossRef]
- Govindan, K. Tunneling the Barriers of Blockchain Technology in Remanufacturing for Achieving Sustainable Development Goals: A Circular Manufacturing Perspective. Bus. Strategy Environ. 2022, 31, 3769–3785. [Google Scholar] [CrossRef]
- Khan, S.; Haleem, A.; Husain, Z.; Samson, D.; Pathak, R.D. Barriers to Blockchain Technology Adoption in Supply Chains: The Case of India. Oper. Manag. Res. 2023, 16, 668–683. [Google Scholar] [CrossRef]
- Kumar, S.; Raut, R.D.; Agrawal, N.; Cheikhrouhou, N.; Sharma, M.; Daim, T. Integrated Blockchain and Internet of Things in the Food Supply Chain: Adoption Barriers. Technovation 2022, 118, 102589. [Google Scholar] [CrossRef]
- Sahebi, I.G.; Masoomi, B.; Ghorbani, S. Expert Oriented Approach for Analyzing the Blockchain Adoption Barriers in Humanitarian Supply Chain. Technol. Soc. 2020, 63, 101427. [Google Scholar] [CrossRef]
- Balci, G.; Surucu-Balci, E. Blockchain Adoption in the Maritime Supply Chain: Examining Barriers and Salient Stakeholders in Containerized International Trade. Transp. Res. Part E Logist. Transp. Rev. 2021, 156, 102539. [Google Scholar] [CrossRef]
- Heidary-Dahooie, J.; Rafiee, M.; Mohammadi, M.; Meidute-Kavaliauskienė, I. Proposing a New LSGDM Framework Based on BWM with Hesitant Fuzzy Information for Prioritizing Blockchain Adoption Barriers in Supply Chain. Technol. Soc. 2022, 71, 102146. [Google Scholar] [CrossRef]
- Gabus, A.; Fontela, E. World Problems, an Invitation to Further Thought Within the Framework of DEMATEL; Battelle Geneva Research Center: Geneva, Switzerland, 1972; Volume 1, pp. 12–14. [Google Scholar]
- Falatoonitoosi, E.; Leman, Z.; Sorooshian, S. Decision-Making Trial and Evaluation Laboratory. Res. J. Appl. Sci. Eng. Technol. 2013, 5, 3476–3480. [Google Scholar] [CrossRef]
- Hsu, C.-T.; Chou, M.-T.; Ding, J.-F. Key Factors for the Success of Smart Ports during the Post-Pandemic Era. Ocean Coast. Manag. 2023, 233, 106455. [Google Scholar] [CrossRef]
- Zhou, Q.; Huang, W.; Zhang, Y. Identifying Critical Success Factors in Emergency Management Using a Fuzzy DEMATEL Method. Saf. Sci. 2011, 49, 243–252. [Google Scholar] [CrossRef]
- Michnik, J. Weighted Influence Non-Linear Gauge System (WINGS)—An Analysis Method for the Systems of Interrelated Components. Eur. J. Oper. Res. 2013, 228, 536–544. [Google Scholar] [CrossRef]
- Gao, F.; He, W.; Bi, W. An Intuitionistic Fuzzy Weighted Influence Non-Linear Gauge System for Equipment Evaluation under System-of-Systems Warfare Environment. Expert Syst. Appl. 2024, 238, 122187. [Google Scholar] [CrossRef]
- Pearl, J. Probabilistic Reasoning in Intelligent Systems: Networks of Plausible Inference; Morgan Kaufmann: Burlington, MA, USA, 1988; ISBN 978-1-55860-479-7. [Google Scholar]
- Jones, B.; Jenkinson, I.; Yang, Z.; Wang, J. The Use of Bayesian Network Modelling for Maintenance Planning in a Manufacturing Industry. Reliab. Eng. Syst. Saf. 2010, 95, 267–277. [Google Scholar] [CrossRef]
- Yang, Z.; Wan, C.; Yang, Z.; Yu, Q. Using Bayesian Network-Based TOPSIS to Aid Dynamic Port State Control Detention Risk Control Decision. Reliab. Eng. Syst. Saf. 2021, 213, 107784. [Google Scholar] [CrossRef]
- Mohsendokht, M.; Li, H.; Kontovas, C.; Chang, C.-H.; Qu, Z.; Yang, Z. Decoding Dependencies among the Risk Factors Influencing Maritime Cybersecurity: Lessons Learned from Historical Incidents in the Past Two Decades. Ocean Eng. 2024, 312, 119078. [Google Scholar] [CrossRef]
- Fan, S.; Yang, Z.; Wang, J.; Marsland, J. Shipping Accident Analysis in Restricted Waters: Lesson from the Suez Canal Blockage in 2021. Ocean Eng. 2022, 266, 113119. [Google Scholar] [CrossRef]
- Li, H.; Ren, X.; Yang, Z. Data-Driven Bayesian Network for Risk Analysis of Global Maritime Accidents. Reliab. Eng. Syst. Saf. 2023, 230, 108938. [Google Scholar] [CrossRef]
- Liang, X.; Fan, S.; Lucy, J.; Yang, Z. Risk Analysis of Cargo Theft from Freight Supply Chains Using a Data-Driven Bayesian Network. Reliab. Eng. Syst. Saf. 2022, 226, 108702. [Google Scholar] [CrossRef]
- Yazdi, M.; Khan, F.; Abbassi, R.; Rusli, R. Improved DEMATEL Methodology for Effective Safety Management Decision-Making. Saf. Sci. 2020, 127, 104705. [Google Scholar] [CrossRef]
- Fenton, N.E.; Neil, M.; Caballero, J.G. Using Ranked Nodes to Model Qualitative Judgments in Bayesian Networks. IEEE Trans. Knowl. Data Eng. 2007, 19, 1420–1432. [Google Scholar] [CrossRef]
- Feng, D.; Zhou, J.; Jing, L.; Jiang, S.; Wu, T.; Jiang, X. Adaptability Evaluation of Conceptual Design for Smart Product-Service System: An Integrated Rough DEMATEL and Bayesian Network Model. J. Clean. Prod. 2023, 417, 137999. [Google Scholar] [CrossRef]
- Riahi, R.; Li, K.; Robertson, I.; Jenkinson, I.; Bonsall, S.; Wang, J. A Proposed Decision-Making Model for Evaluating a Container’s Security Score. Proc. Inst. Mech. Eng. Part M J. Eng. Marit. Environ. 2014, 228, 81–104. [Google Scholar] [CrossRef]
- Qin, M.; Wang, X.; Du, Y. Factors Affecting Marine Ranching Risk in China and Their Hierarchical Relationships Based on DEMATEL, ISM, and BN. Aquaculture 2022, 549, 737802. [Google Scholar] [CrossRef]
- Kaya, R.; Yet, B. Building Bayesian Networks Based on DEMATEL for Multiple Criteria Decision Problems: A Supplier Selection Case Study. Expert Syst. Appl. 2019, 134, 234–248. [Google Scholar] [CrossRef]
- Kazancoglu, Y.; Ozbiltekin-Pala, M.; Sezer, M.D.; Luthra, S.; Kumar, A. Resilient Reverse Logistics with Blockchain Technology in Sustainable Food Supply Chain Management during COVID-19. Bus. Strategy Environ. 2023, 32, 2327–2340. [Google Scholar] [CrossRef]
- Kumar, S.; Barua, M.K. Exploring the Hyperledger Blockchain Technology Disruption and Barriers of Blockchain Adoption in Petroleum Supply Chain. Resour. Policy 2023, 81, 103366. [Google Scholar] [CrossRef]
- Nguyen, S.; Chen, P.S.-L.; Du, Y. Blockchain Adoption in Container Shipping: An Empirical Study on Barriers, Approaches, and Recommendations. Mar. Policy 2023, 155, 105724. [Google Scholar] [CrossRef]
- Govindan, K.; Chaudhuri, A. Interrelationships of Risks Faced by Third Party Logistics Service Providers: A DEMATEL Based Approach. Transp. Res. Part E Logist. Transp. Rev. 2016, 90, 177–195. [Google Scholar] [CrossRef]
- Chang, B.; Chang, C.-W.; Wu, C.-H. Fuzzy DEMATEL Method for Developing Supplier Selection Criteria. Expert Syst. Appl. 2011, 38, 1850–1858. [Google Scholar] [CrossRef]
- Chang, C.-H.; Kontovas, C.; Yu, Q.; Yang, Z. Risk Assessment of the Operations of Maritime Autonomous Surface Ships. Reliab. Eng. Syst. Saf. 2021, 207, 107324. [Google Scholar] [CrossRef]
- Zhou, J.; Chen, S.-L.; Shi, W.; Nguyen, S.; Kanrak, M.; Ge, J. A Belief Rule-Based Bayesian Network Approach for Assessing Risks in the Cruise Supply Chain: An Empirical Study in Shanghai, China. Ocean Coast. Manag. 2023, 232, 106443. [Google Scholar] [CrossRef]
- Kaya, R.; Salhi, S.; Spiegler, V. A Novel Integration of MCDM Methods and Bayesian Networks: The Case of Incomplete Expert Knowledge. Ann. Oper. Res. 2023, 320, 205–234. [Google Scholar] [CrossRef]
- Yang, Z.L.; Wang, J.; Bonsall, S.; Fang, Q.G. Use of Fuzzy Evidential Reasoning in Maritime Security Assessment. Risk Anal. 2009, 29, 95–120. [Google Scholar] [CrossRef]
- Gan, X.; Liu, L.; Wen, T.; Webber, R. Modelling Interrelationships between Barriers to Adopting Green Building Technologies in China’s Rural Housing via Grey-DEMATEL. Technol. Soc. 2022, 70, 102042. [Google Scholar] [CrossRef]


Disclaimer/Publisher’s Note: The statements, opinions and data contained in all publications are solely those of the individual author(s) and contributor(s) and not of MDPI and/or the editor(s). MDPI and/or the editor(s) disclaim responsibility for any injury to people or property resulting from any ideas, methods, instructions or products referred to in the content. |
© 2025 by the authors. Licensee MDPI, Basel, Switzerland. This article is an open access article distributed under the terms and conditions of the Creative Commons Attribution (CC BY) license (https://creativecommons.org/licenses/by/4.0/).