Results produced by CWMS-NWA (run FC) are compared with in-situ and satellite data and reanalysis data to assess the model performance.
3.1. Accuracy of Blended Winds
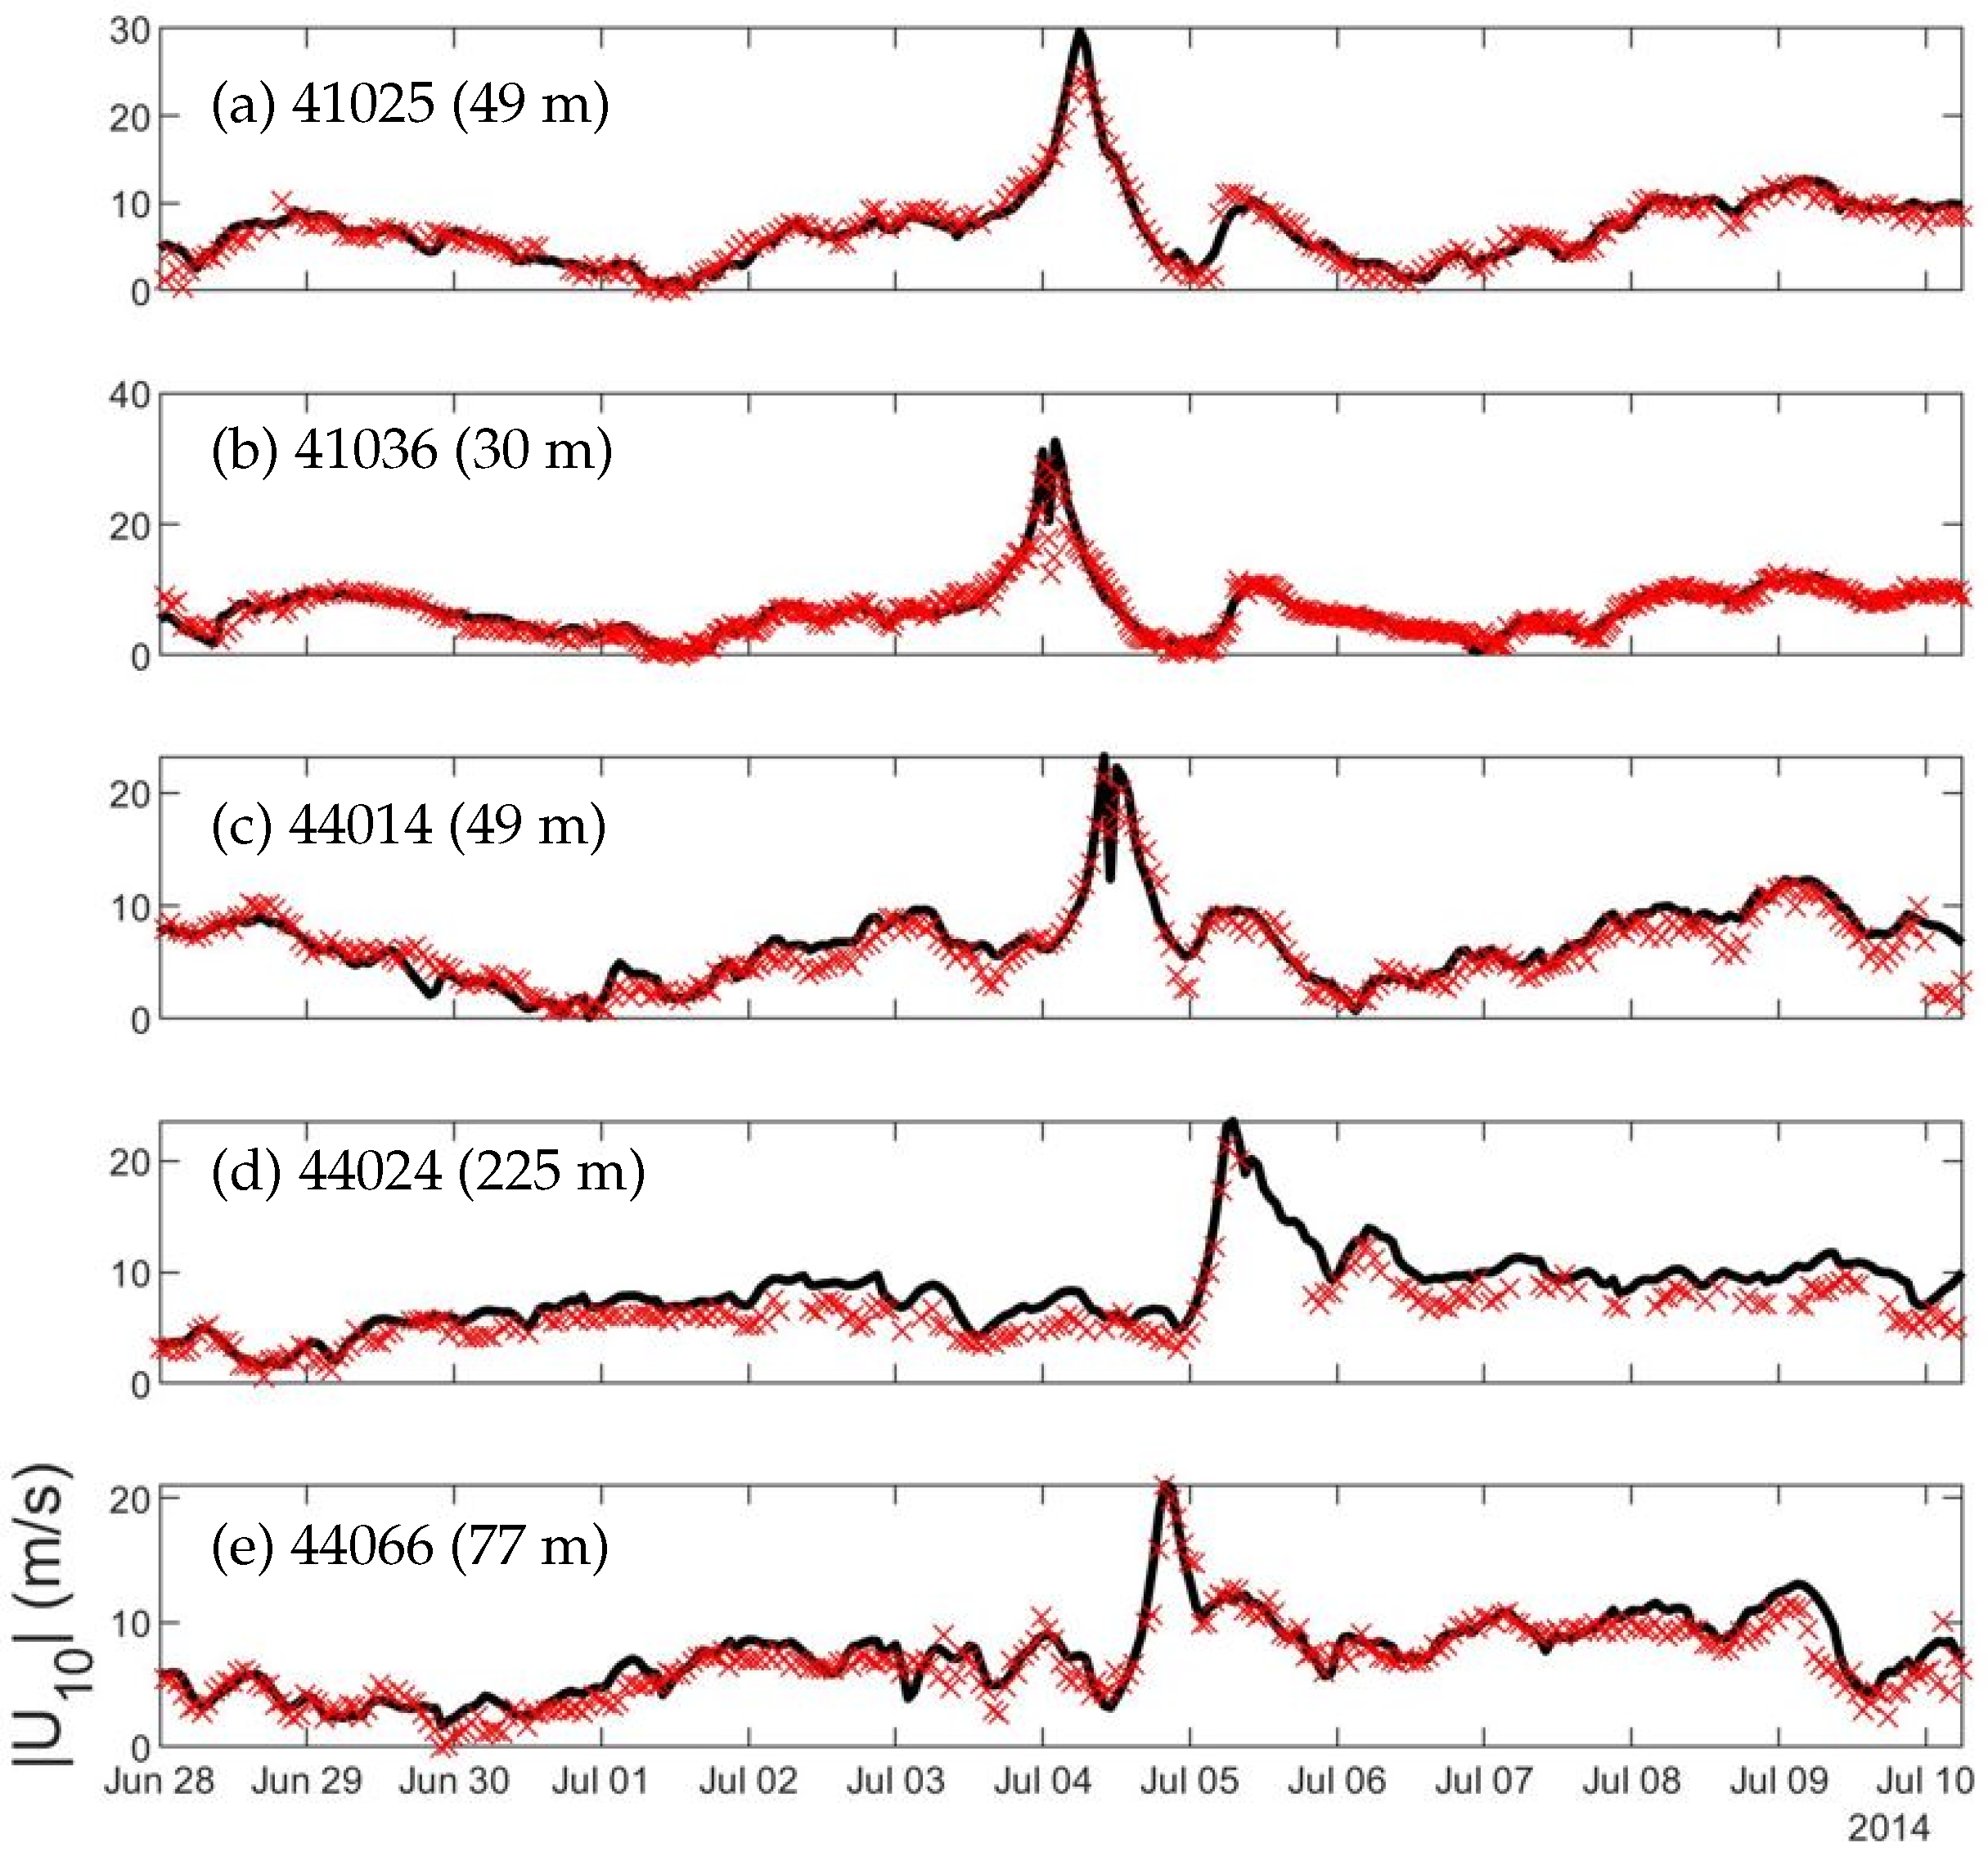
Since wind stress is an important driving force for CWMS-NWA, particularly during extreme weather conditions, we first examine the accuracy of blended winds during Hurricane Arthur. The blended wind speeds (
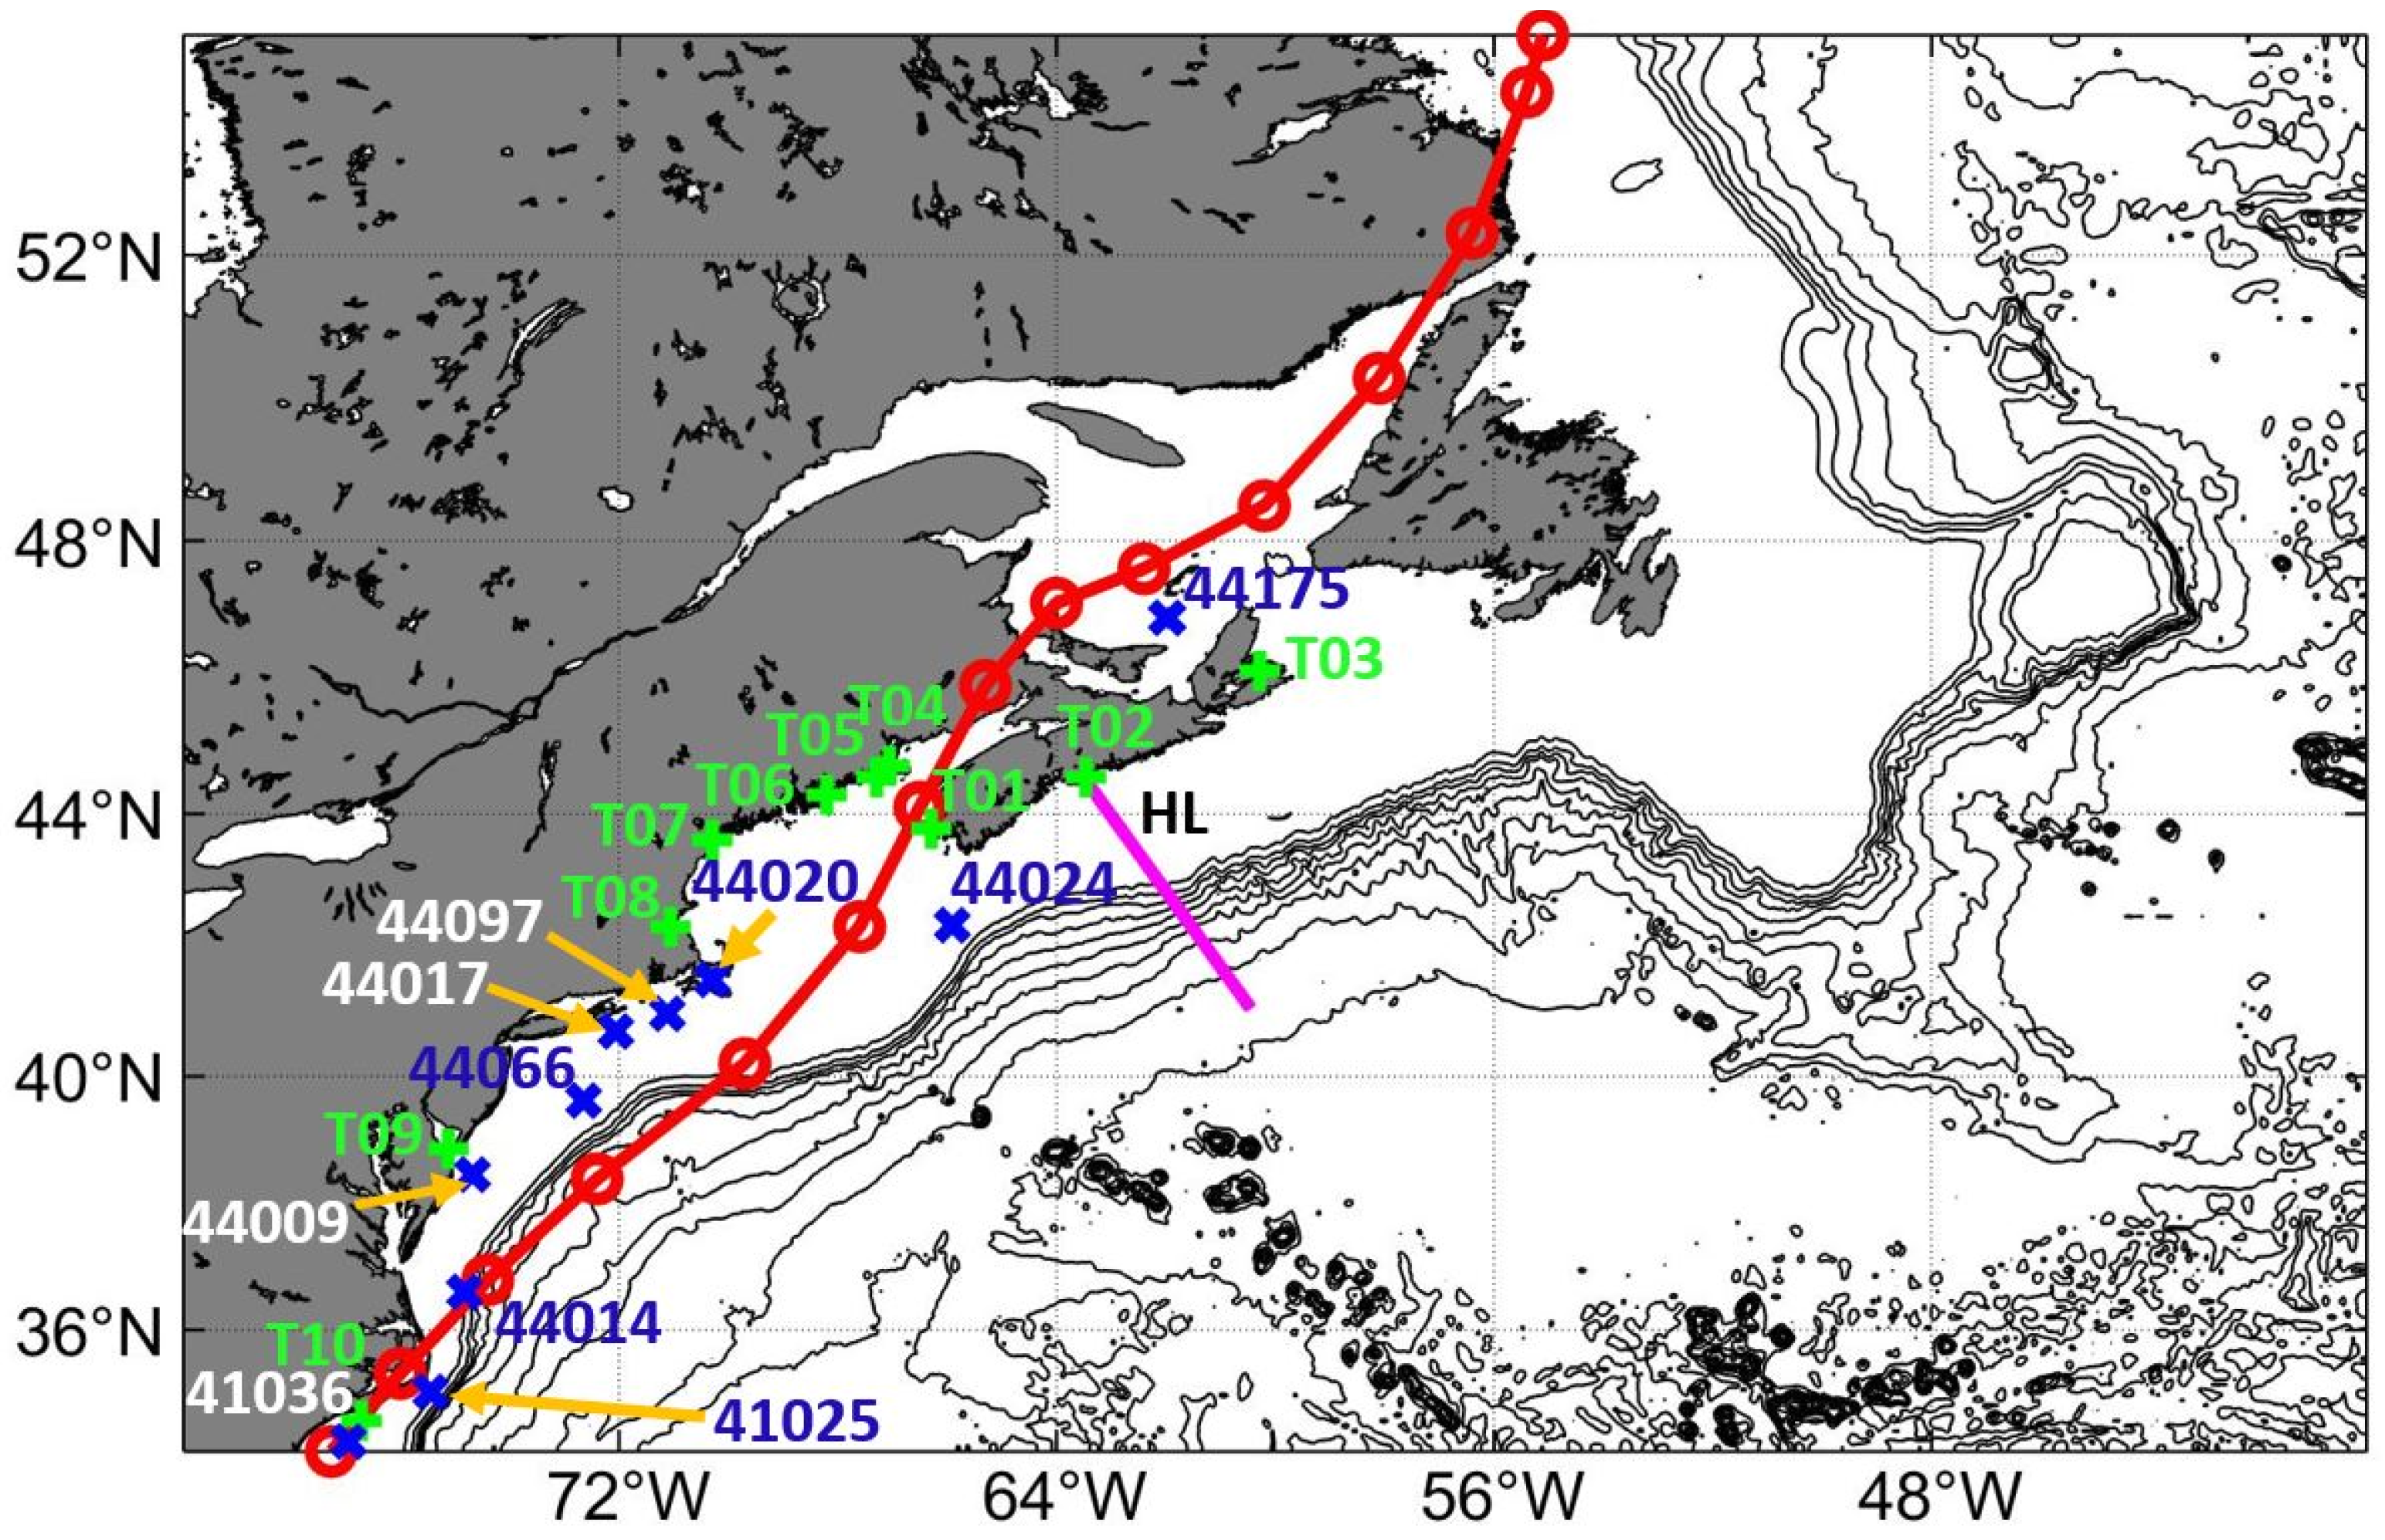
Figure 2) and directions are compared with observations made at the National Data Buoy Center (NDBC) and ECCC buoys. The locations of these buoys are marked in
Figure 1. Buoys 41025, 44024 and 44175 are all on the RHS of the storm, buoys 41036 and 44014 are along the storm track, and the rest (44009, 44017, 44020, 44066 and 44097) are on the left hand side (LHS) of the storm track. Buoys 41025 and 41036 are along the GuS while buoy 44024 is under the influence of tidal currents in the GoM.
As shown in
Figure 2, the observed wind speeds are well represented by the blended winds during Hurricane Arthur at five buoys (41025, 41036, 44014, 44024 and 44066). At buoy 41025, for example, the blended winds agree very well the observations with only minor discrepancies (overestimated by up to ∼4 m/s) on 28 June and (overestimated by up to ∼5 m/s) 4 July (
Figure 2a). The blended wind speeds at buoy 41036 (
Figure 2b) also agree with the observations except for noticeable differences on 4 July. At buoy 44014 (
Figure 2c), the blended winds are also in general agreement with observations except some over/underestimations. The blended winds at buoy 44024 (
Figure 2d) reproduces well the temporal variations for the observed winds with slight overestimation at the low winds. Finally, the blended winds at buoy 44066 (
Figure 2e) match the observed winds apart from some minor differences during a few of the fluctuations of the wind speed.
The performance of the blended winds in presenting the observed wind speeds at each buoy is quantified using five error metrics (
Appendix A and
Table 2). Note that observational wind data at buoys 44009, 44017 and 44097 are not available for the study period.
At buoy 41025 located just west of Hatteras canyon and offshore of North Carolina, the blended wind speeds represent very well the observational wind speed data (
Figure 2a) with R ≈ 96.5%, RMSE ≈ 1.11 m/s,
≈ 0.08, RB ≈ 2 cm/s and SI ≈ 0.16. Buoy 41036 is near the southern boundary of the model domain and has error metrics highly similar to buoy 41025; with R ≈ 95.2%, RMSE ≈ 1.35 m/s,
≈ 0.11, RB ≈ 3 cm/s and SI ≈ 0.20. The observational wind speeds at buoy 41036 suggest that the eye of Arthur passed over the buoy at about 12:00:00 4 July. While the eye does appear in the blended wind speeds, it is far less pronounced and thus the wind speeds are overestimated (
Figure 2b). Buoy 44014, which is 64 nautical miles (∼119 km) east of Virginia Beach also has particularly good error metrics: R ≈ 91.9%, RMSE ≈ 1.49 m/s,
≈ 0.17, RB ≈ 9 cm/s and SI ≈ 0.24. Over the study period, some differences between the blended and observed wind speeds at buoy 44014 are due mainly to the overestimation by Moody’s HWind during 3–5 July (
Figure 2c). The statistical errors at buoy 44020 situated in Nantucket Sound are very similar to the other buoys discussed above. The relatively large errors of the blended wind speeds at buoy 44024 in Northeast Channel come from the small but systemic overestimations of the observed wind speeds at this buoy (
Figure 2d). With minor discrepancies, the blended wind speeds at buoy 44066, located at about 139 km to the east of Long Beach, New Jersey, resemble the buoy wind speed data (
Figure 2e). The error metrics for the blended winds at buoy 44066 are very comparable to the average of the seven buoys. Buoy 44175 is near the Madeleine Islands in the Gulf of St. Lawrence (GSL). The error metrics at this buoy (R ≈ 83.4%, RMSE ≈ 3.46 m/s, RB ≈ 55 cm/s, SI ≈ 0.41 and
≈ 0.48) are all noticeably worse than the average of the seven buoys. Note that by the time that Arthur reaches buoy 44175, it is an extra-tropical cyclone. Moody’s HWind does not cover Arthur at this intensity.
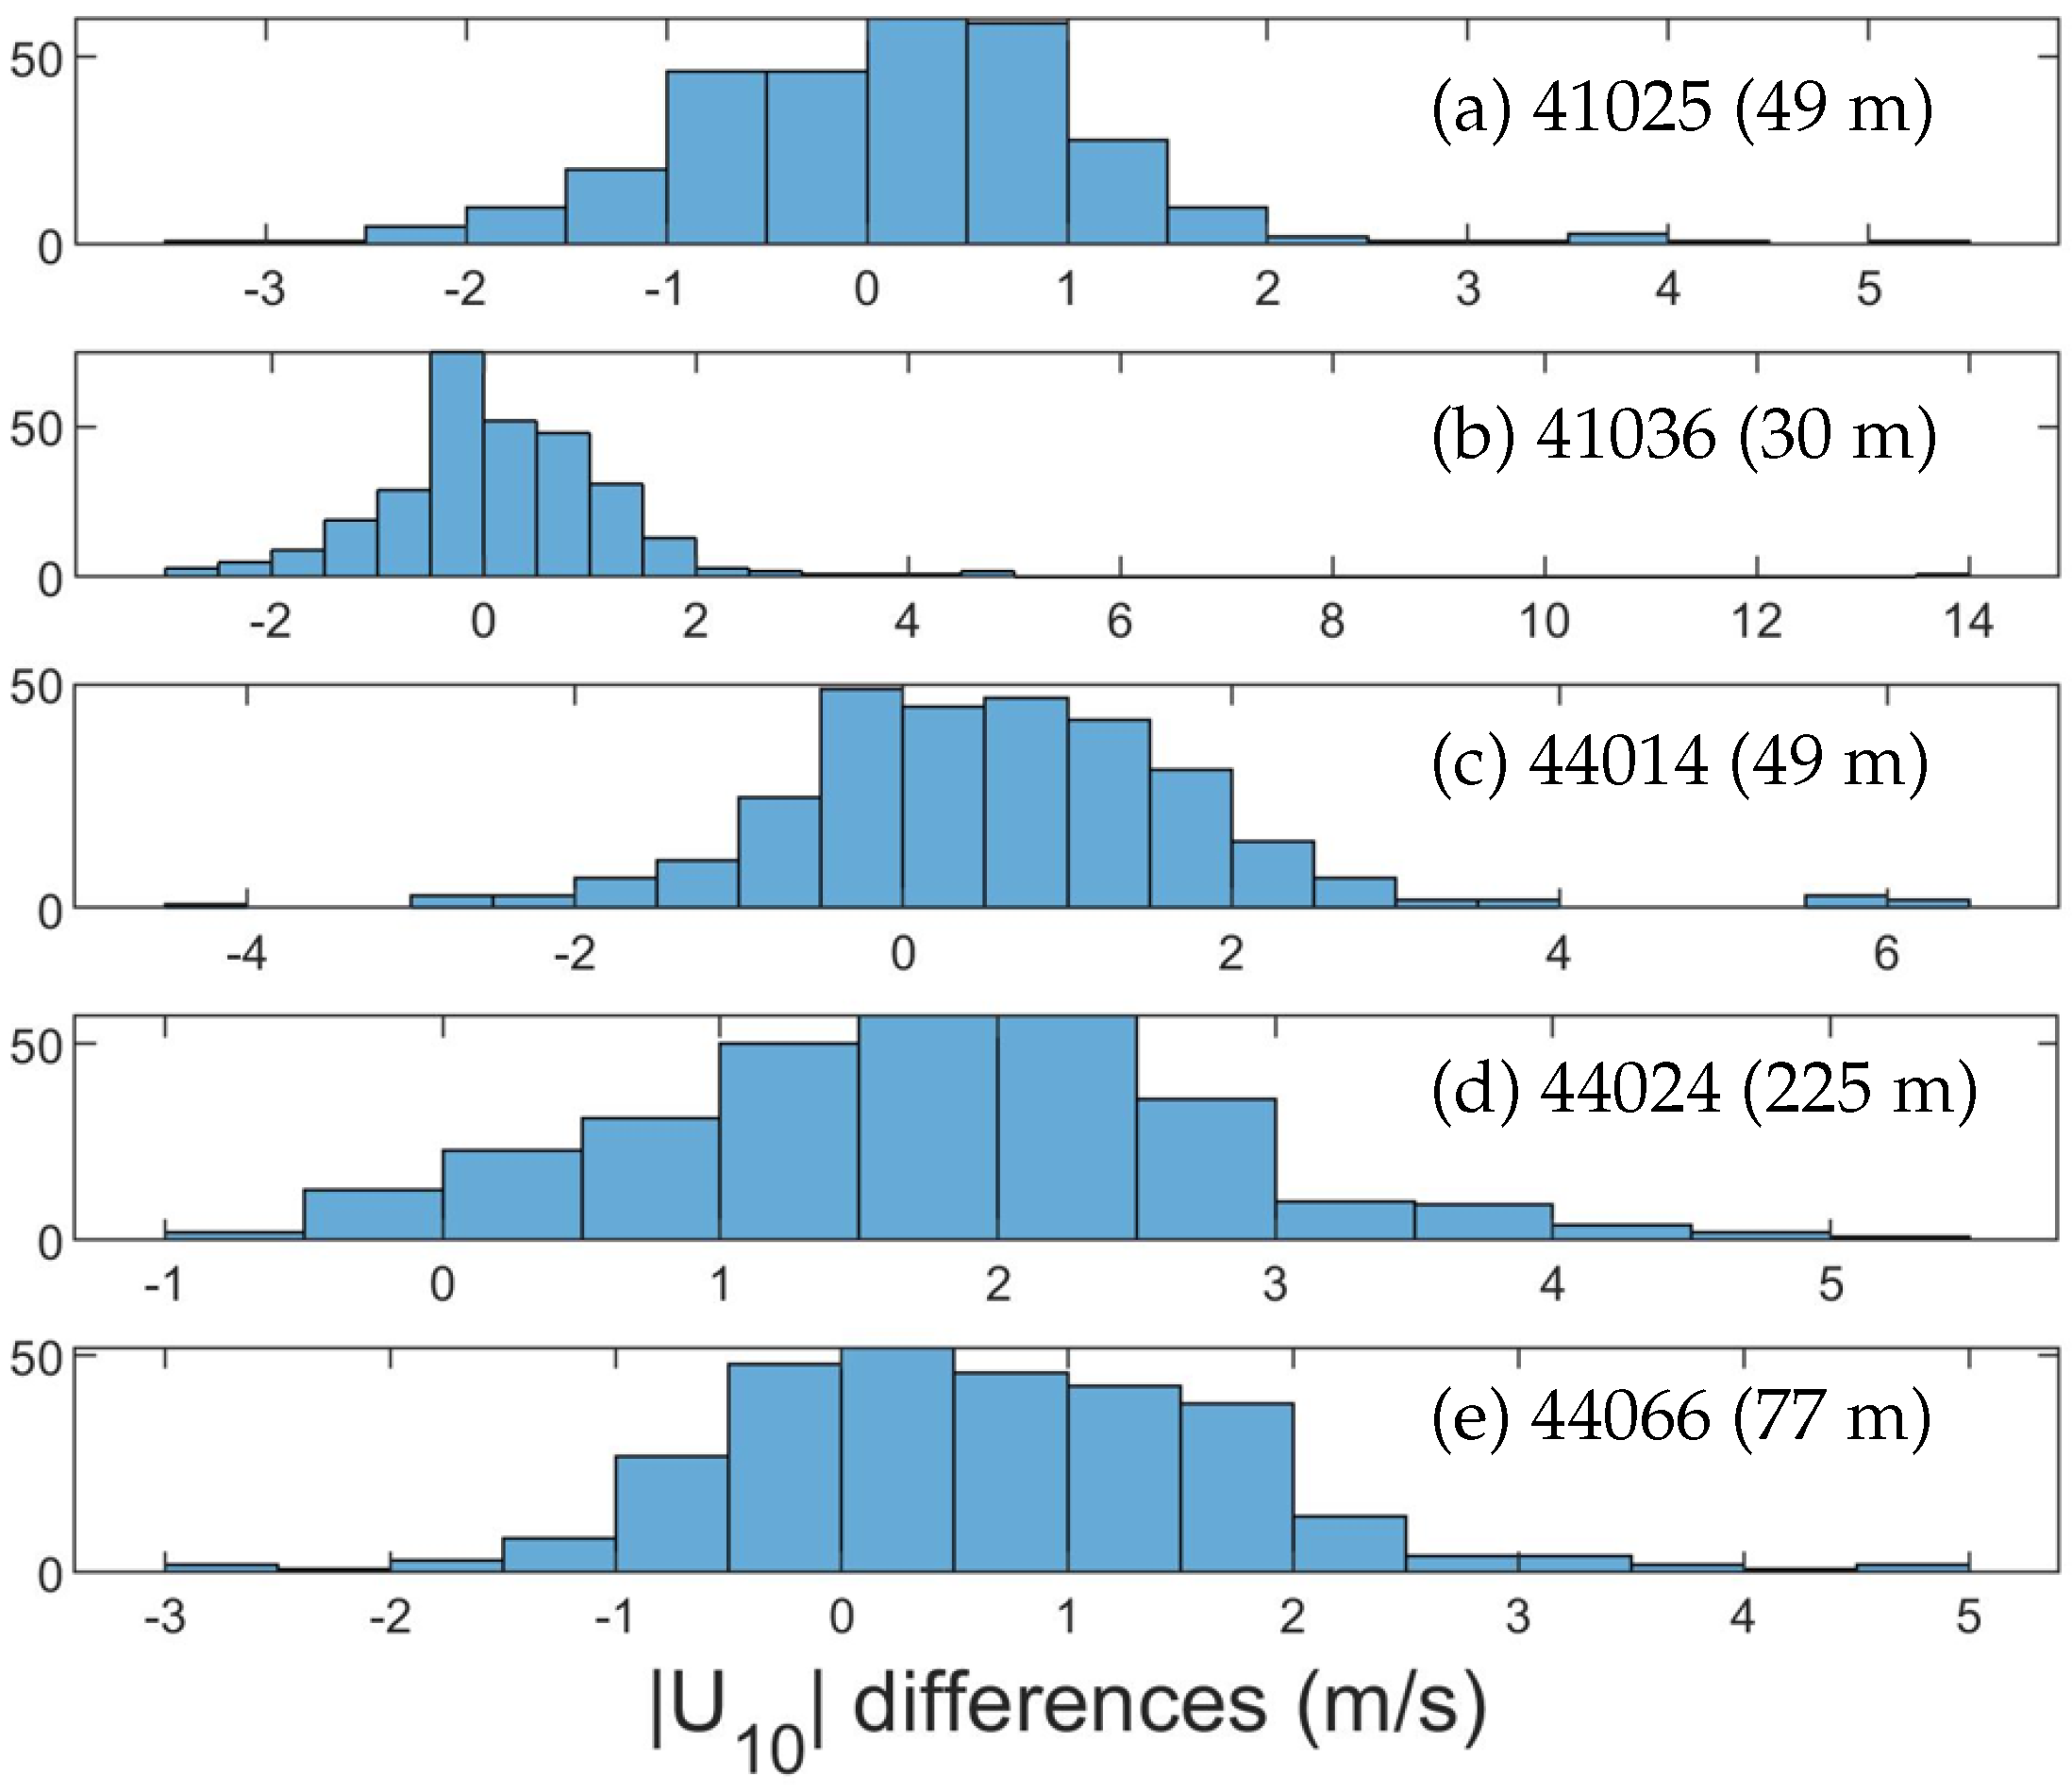
Differences between the blended wind speeds and buoy data are presented in histograms (
Figure 3). At these five buoys, most of the differences in the wind speed are within ±2 m/s. At buoy 41025 near Diamond Shoals, NC, the maximum wind speed difference is ∼5 m/s (
Figure 3a). While nearly all of the differences in the wind speeds are confined to ±5 m/s at buoy 41036, there is an outlier of ∼13.5 m/s (
Figure 3b). Note that both the blended wind and buoy data show the eye of the hurricane passing over this location. The large difference of ∼13.5 m/s occurs on 02:00:00 July 4 where the blended wind speed is ∼32.6 m/s. At 02:00:00 July 4, the temporally-interpolated wind speed data is ∼19.1 m/s. However, the data at buoy 41036 is recorded as 14.9 m/s at 01:50:00 July 4 and 27.4 m/s at 02:20:00 July 4. This very large discrepancy appears to be a result of limits in the temporal output of the data and simple linear interpolation. By contrast, the histograms for the wind speed differences at buoys 44014, 44024 and 44066 are similar (
Figure 3c, d and e respectively). The differences at these three buoys show a slightly positive skew, especially at buoy 44024.
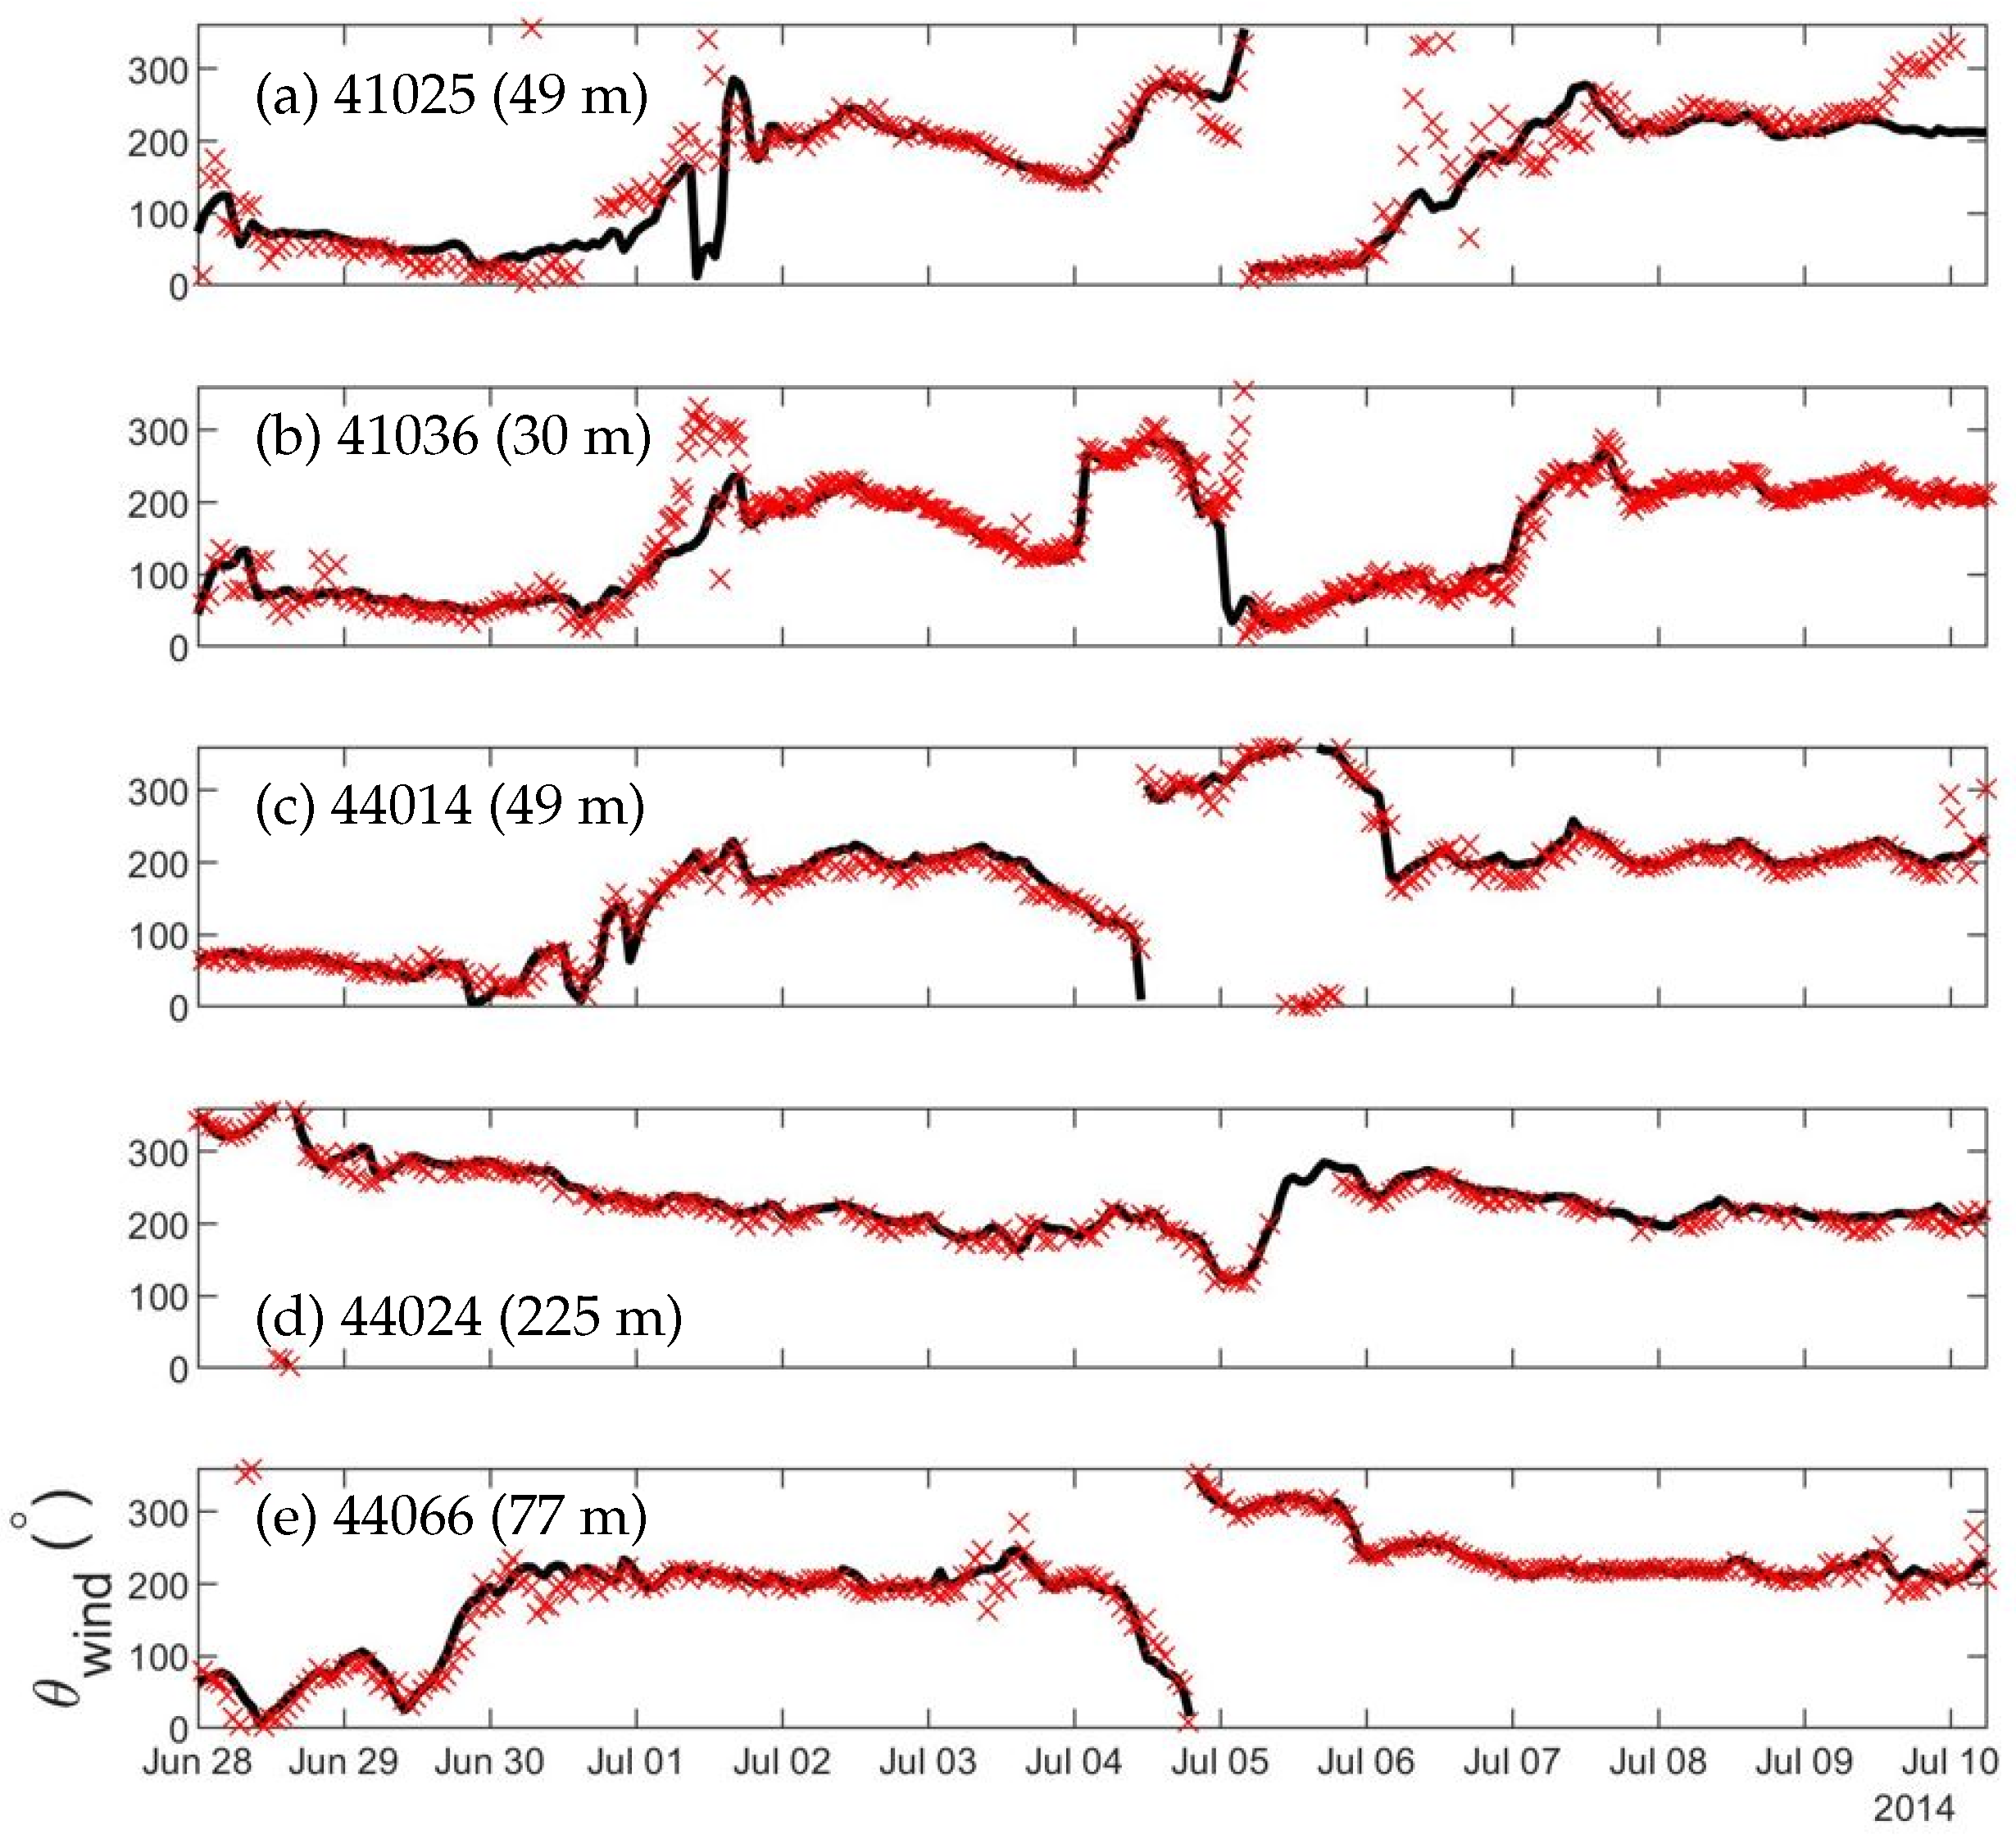
The observed wind directions are also generally captured well by the blended wind directions, but with relatively larger discrepancies than the wind speeds (
Figure 4). At buoy 41025, for example, the blended wind directions agree very well with the observations during the study period, except for relatively large differences in wind direction on 1, 6 and 9 July. Some of the virtually large outliers such as on 30 June at buoy 41025 are due to the plotting style with the vertical axis being the 0–360 degree scale (
Figure 4a). At buoy 41036, the large observed wind directional changes are not fully captured by Moody’s HWind on 1 July and at the beginning of 5 July (
Figure 4b). The moderate changes in the observed wind directions at buoy 44014 are also not captured by the blended winds on 10 July (
Figure 4c). At buoy 44024, differences between the blended wind directions and observed data are small (
Figure 4d).
The blended wind directions at 41025 are in good agreement with observations, with R ≈ 84.6%, RMSE ≈ 51.0°,
≈ 0.29, RB ≈ −0.07° and SI ≈ 0.31. The errors for the Moody’s HWind directions are smaller at buoy 41036 with R ≈ 91.1%, RMSE ≈ 33.2°,
≈ 0.17, RB ≈ −0.03° and SI ≈ 0.21. Most of the observed wind directions are captured by the blended winds, but large discrepancies during a few short periods make up most of the RMSE (
Figure 4b). The errors in the blended wind directions at buoy 44014 are highly similar to those at buoy 41025 (
Table 3). By contrast, the errors in the Moody’s HWind directions are relatively small at buoy 44024, with comparable R,
and RB values to buoy 41036. The RMSE and SI at buoy 44024 are both significantly smaller than the corresponding values at buoy 41036. The blended wind directions at buoy 44066 also have small errors that are consistently smaller than the average of the errors at the selected seven buoys. The ERA5-only winds at buoy 44175 reproduced the observed wind directions over the study period reasonably well.
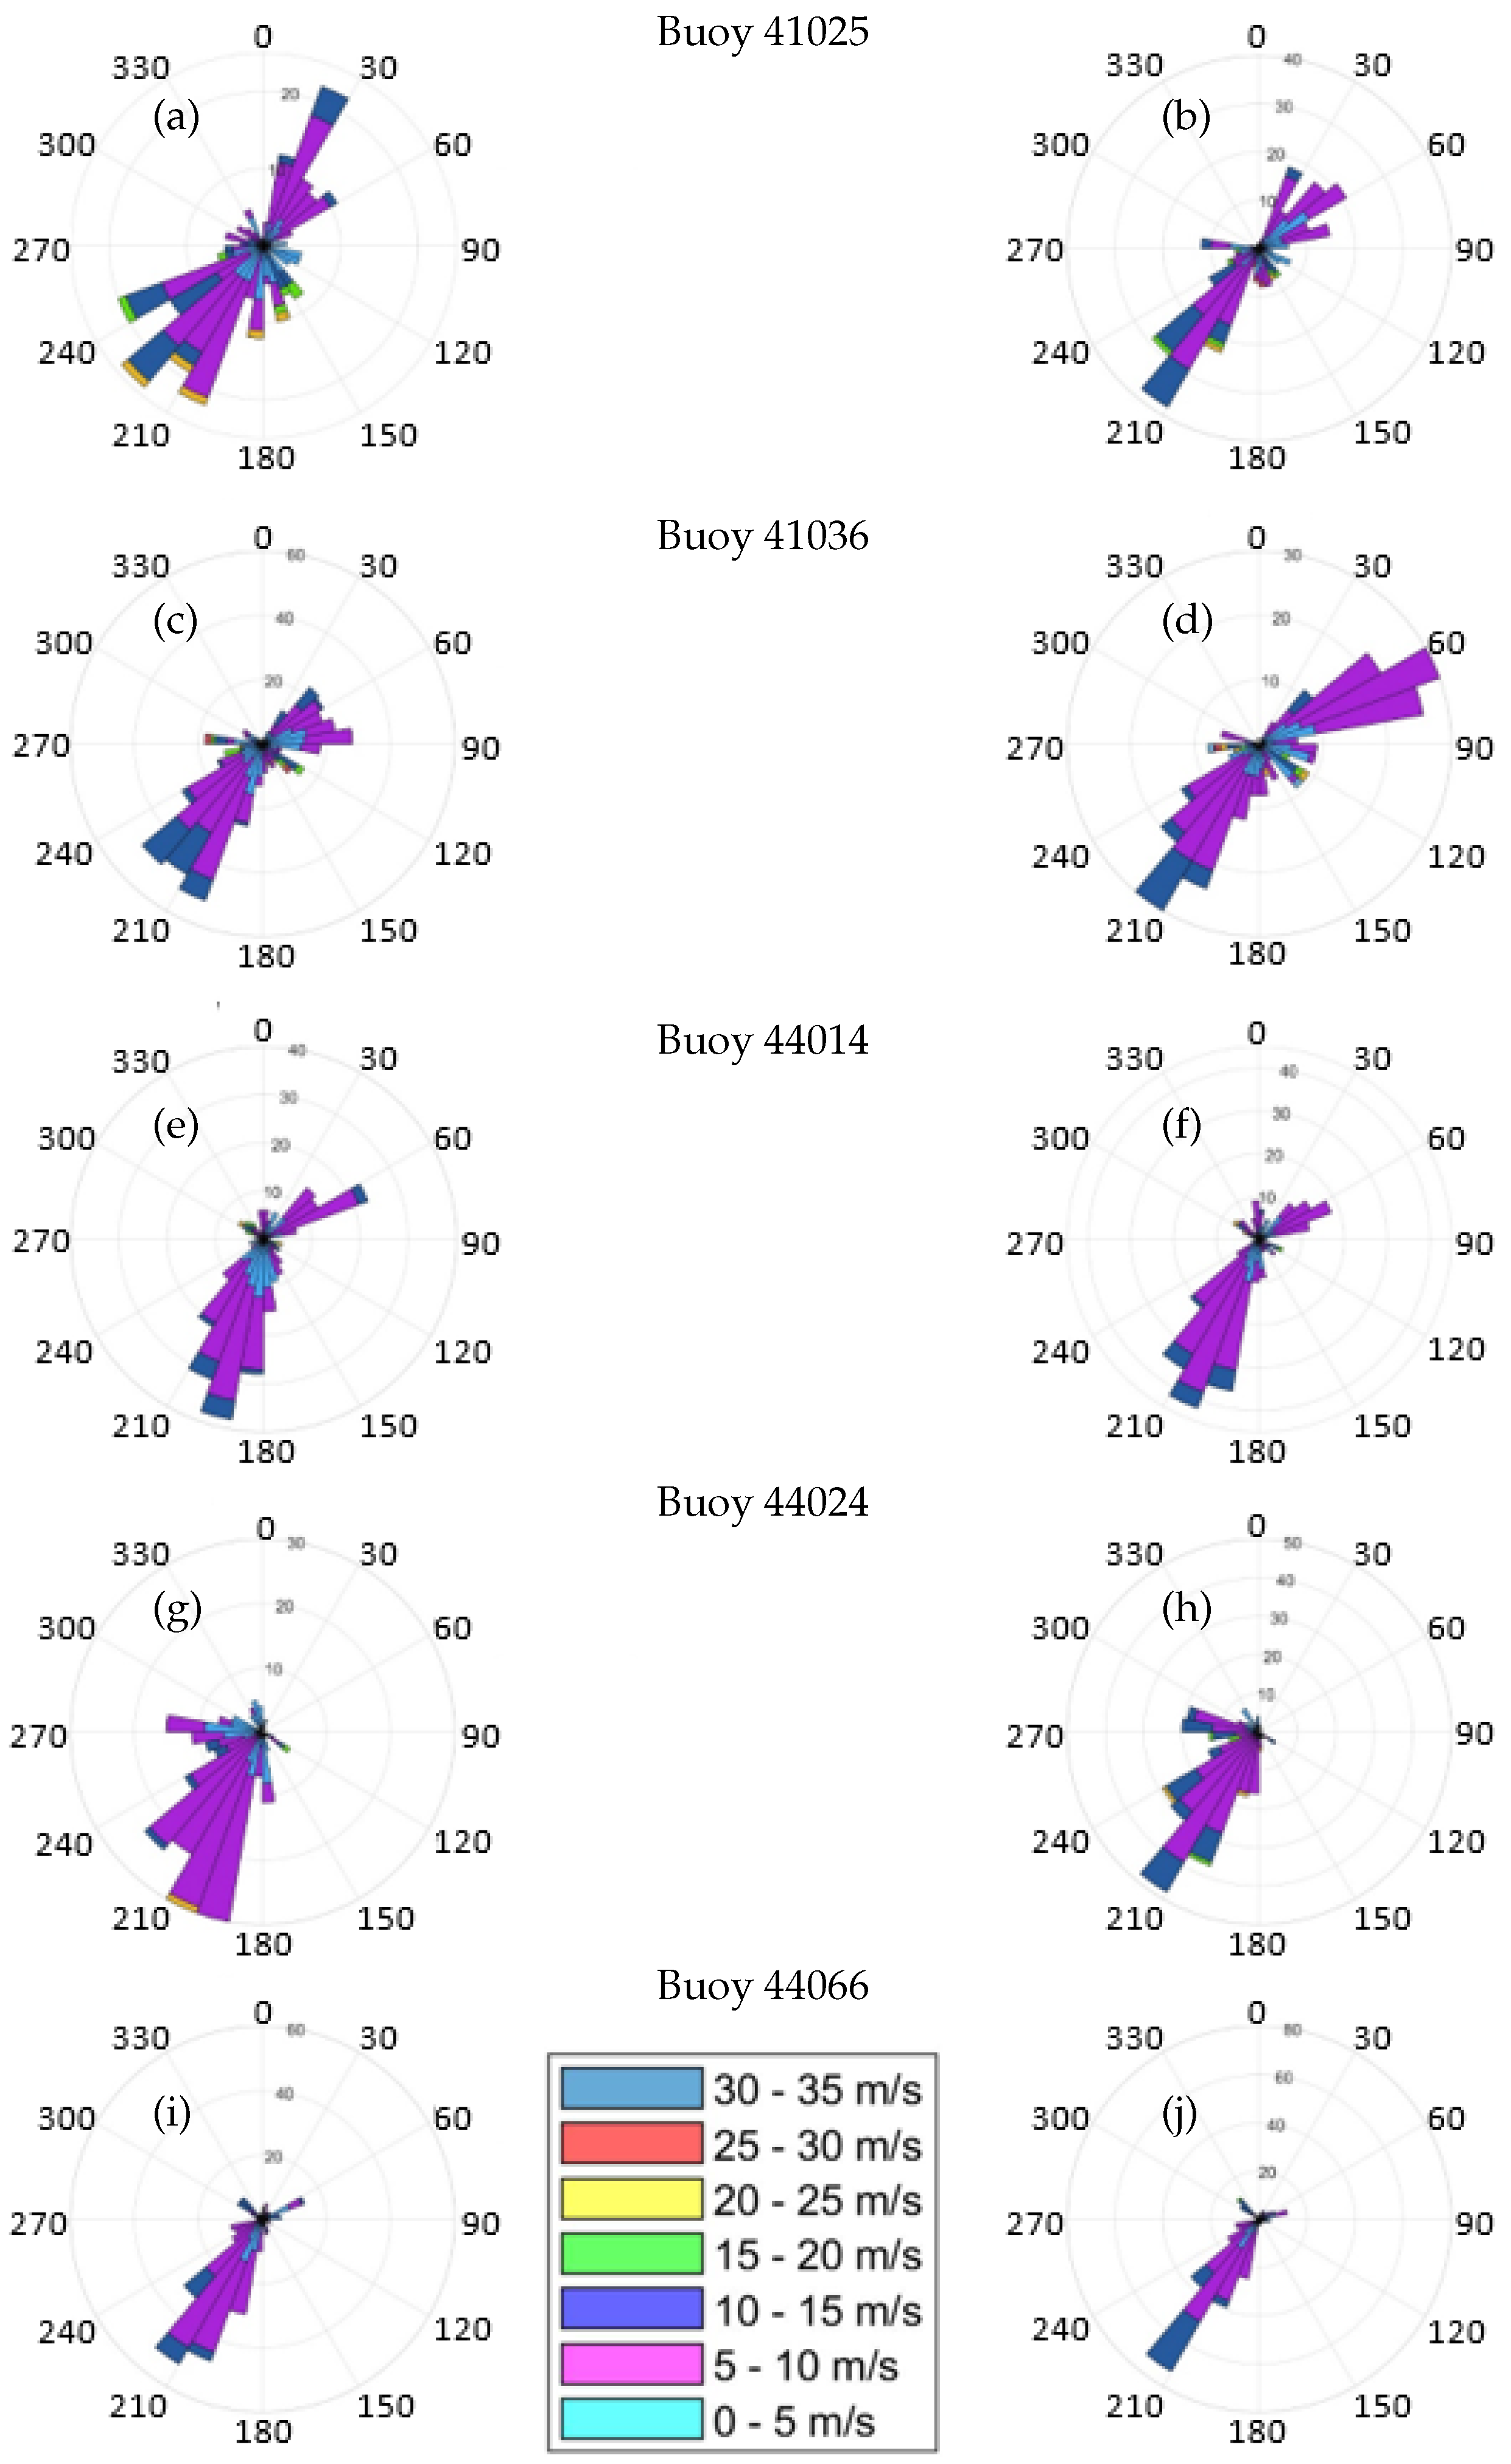
The observed wind speed and directional data and the wind speeds and directions from the blended winds at the five buoys are also displayed in wind roses in
Figure 5. The wind rose for the data at buoy 41025 (
Figure 5a) has a similar distribution to the wind rose for the blended wind at the buoy 41025 location (
Figure 5b). Both the buoy data and blended winds are predominantly southwesterly with significant northeasterly winds as well. The blended winds are more southwesterly than the buoy data. At buoy 41036, the wind rose of the buoy data (
Figure 5c) is also primarily southwesterly with an easterly to slightly northeasterly secondary component. There are fewer southwesterly components and more northeasterly components in the blended wind at 41036 (
Figure 5d). Both the buoy data (
Figure 5e) and blended winds (
Figure 5f) are mostly slightly southwesterly with a secondary northeasterly component at buoy 44014. At buoy 44024, both the buoy data (
Figure 5g) and blended winds (
Figure 5h) are southwesterly with a smaller westerly component. The buoy data and blended winds at buoy location 44066 are both overwhelmingly southwesterly (
Figure 5i and
Figure 5j respectively).
3.2. Model Performance in Simulating Surface Waves
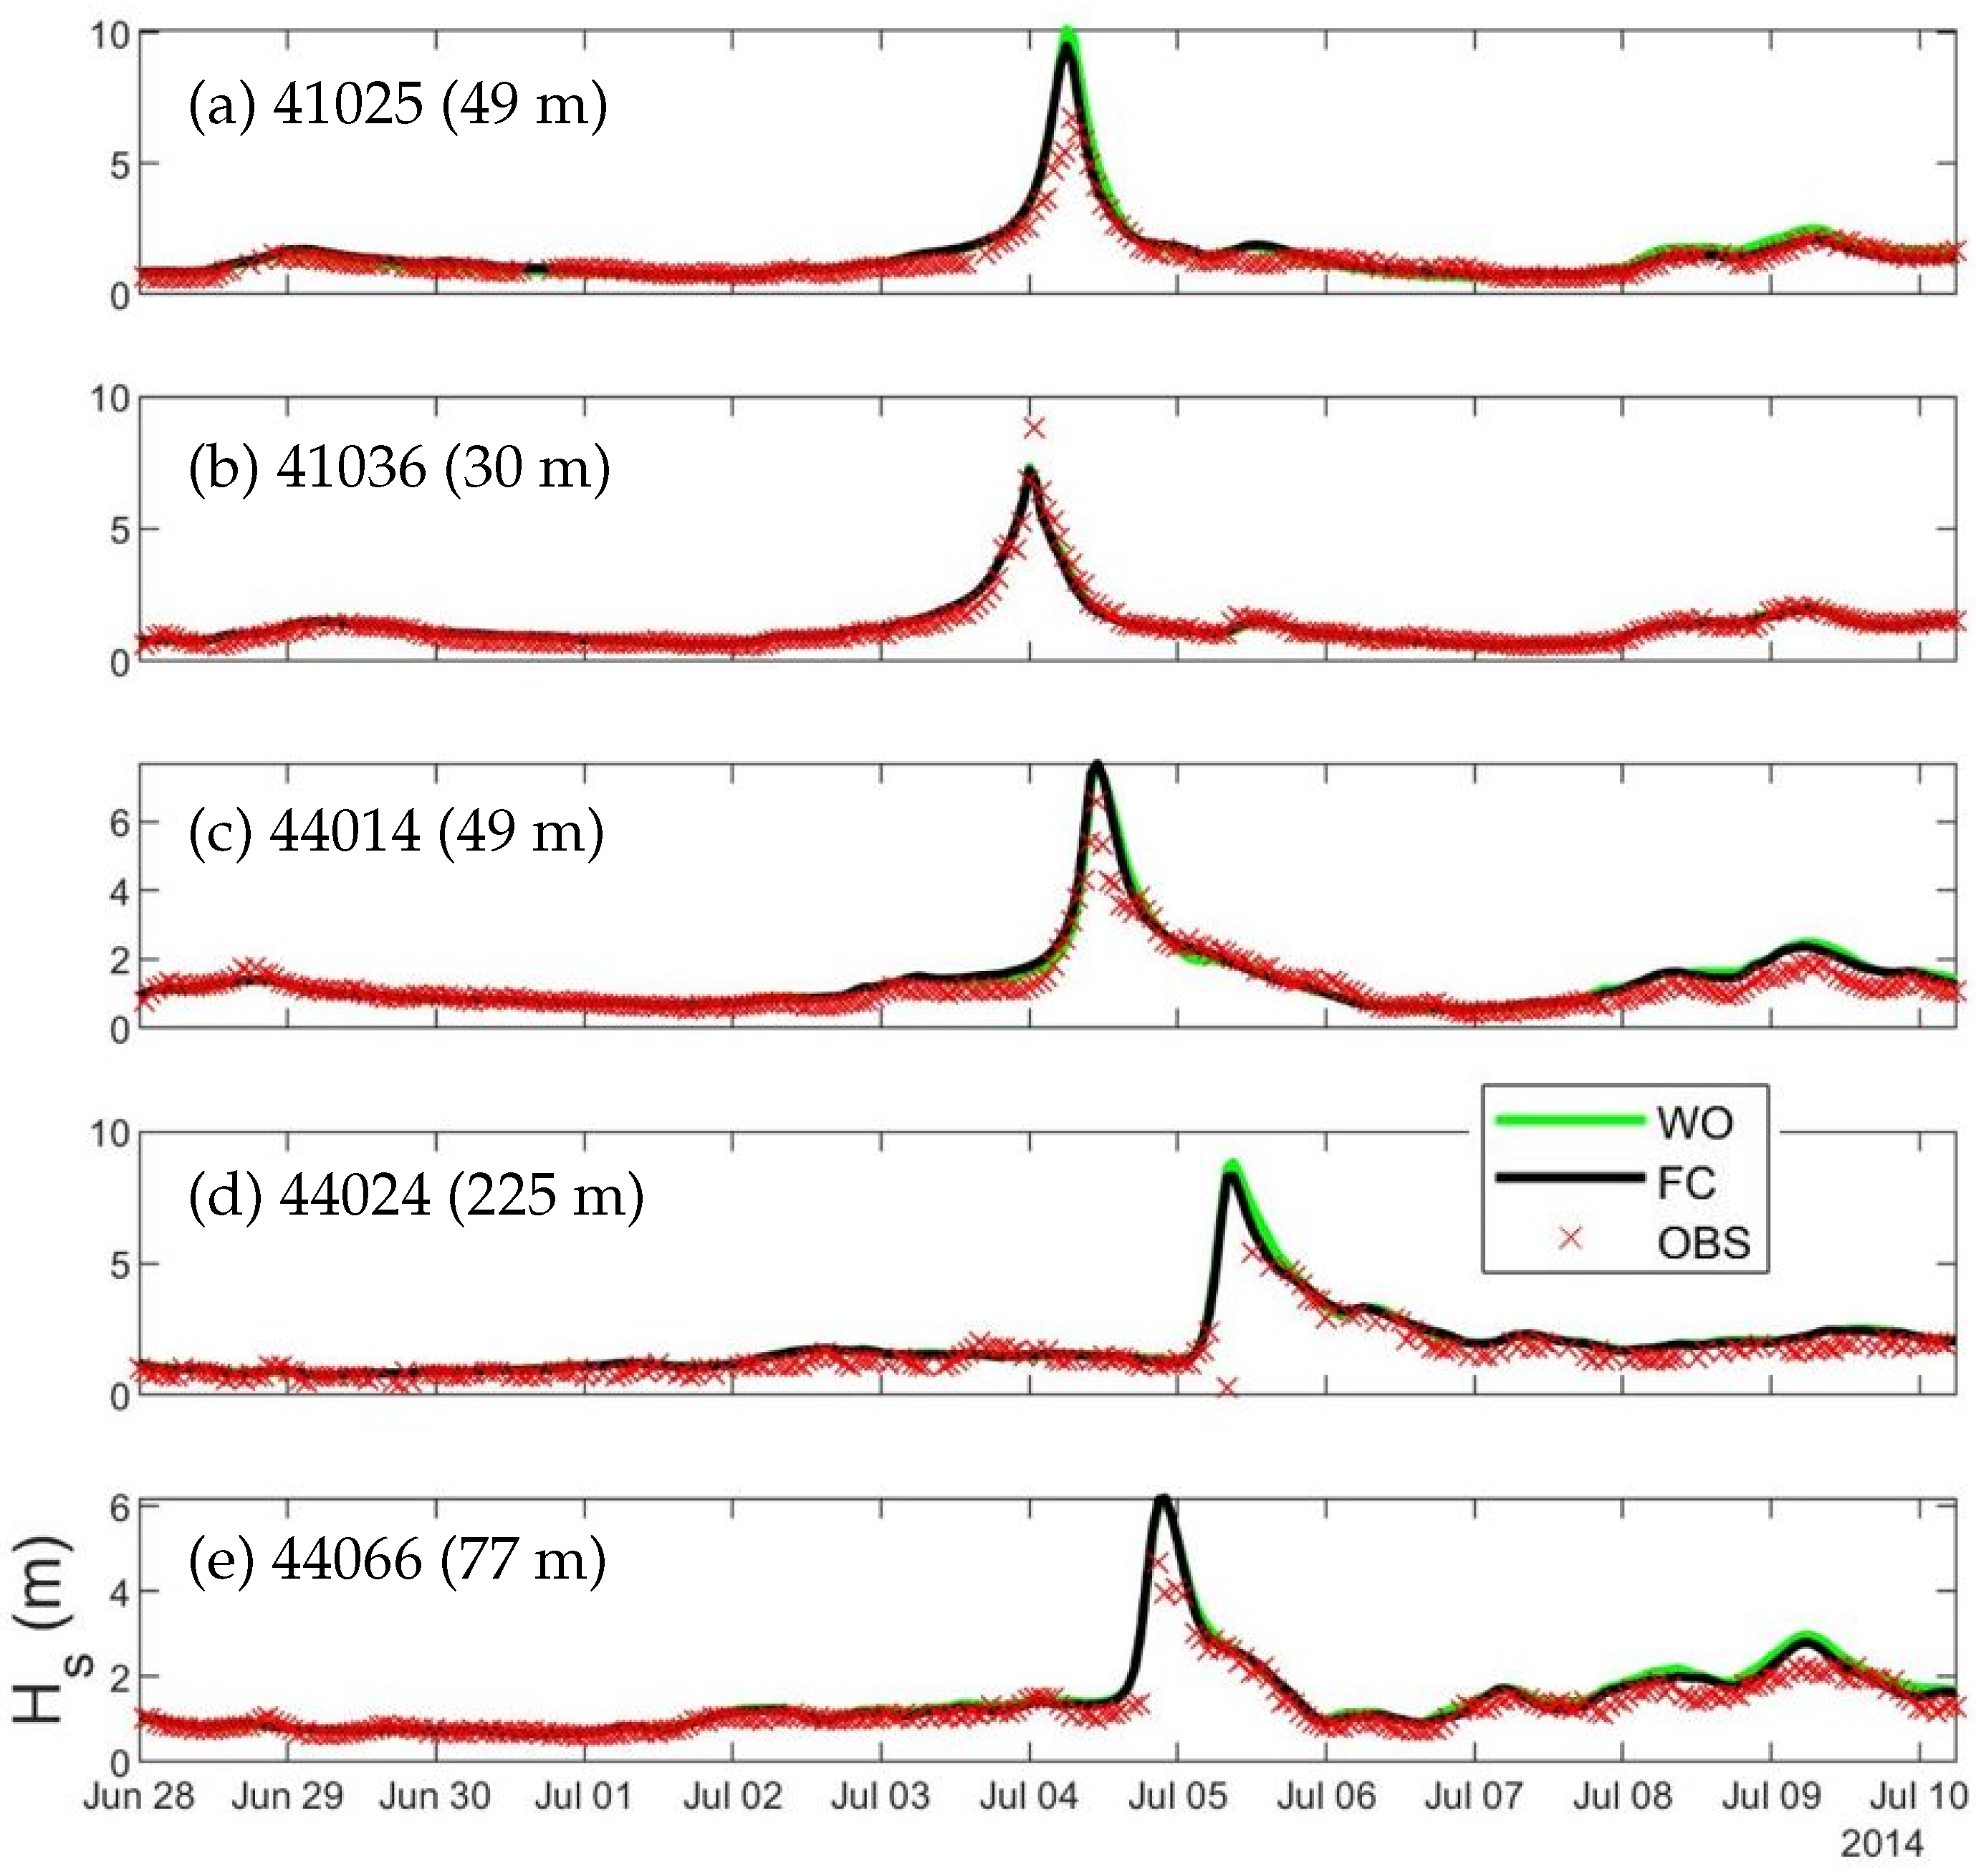
We next assess the performance of CWMS-NWA in simulating surface waves. The simulated SWHs are compared with wave observations at the NDBC and ECCC buoys within 150 km of the storm track over the model domain (
Figure 6). At buoy 41025 on the RHS of the storm track, the SWHs in run FC generally agree with the observations. However, CWMS-NWA overestimates the maximum value of the observed SWHs (
) during the peak of the storm (
Figure 6a). This overestimation of
is due partly to the fact that the blended winds are higher than the observed winds (with differences up to ∼5 m/s) during the peak of the storm (
Figure 2a). At buoy 41036, by comparison, the simulated
is smaller than the observed value even though the blended winds are reasonable in comparison with the wind observations during the peak of the storm. Exact reasons for the large model deficiency at this buoy are unknown. Plausible reasons include model resolution, proximity of the southern boundary and observational errors. Relatively large model deficiencies in SWHs also occur during the peak of the storm at buoys 44014 (∼1.0 m or ∼15%), 44024 (∼1.0 m or ∼18%) and 44066 (∼1.1 m or ∼23%).
The simulated SWHs at buoy 44024 (on the RHS of the storm) are in good agreement with the observed SWHs except that the simulated
is larger (up to ∼1.0 m) than the observation (
Figure 6d). The lack of observational data at the peak of the storm at this buoy prevents us from calculating the actual model errors in simulating
. At buoy 44066 (LHS), there are also some missing observational surface wave data during the peak of the storm (
Figure 6e).
To assess the performance of CWMS-NWA in simulating SWHs during the study period, three model error statistics (R, RMSE and
) are calculated. At buoy 41036, which is located near the southern boundary of the model domain, the model performs reasonably well with R ≈ 88.8%, RMSE ≈ 19.7 cm and
≈ 0.05. The model results in run FC underestimate the
and lead the observed SWHs near the peak of the storm. These differences between the simulated and observed SWHs contribute to the large error metrics at buoy 41036 (
Figure 6b). Buoy 44020 is located in the shallow water in Nantucket Sound. Model errors at this buoy likely result from the relatively coarse model resolution (1/12°) which is not able to capture all of the local dynamics over shallow coastal waters. Note that the surface wave observations at buoy 44024 were not available when Hurricane Arthur passed by the area of this buoy.
Differences in SWHs between model simulations (runs FC and WO) and the buoy data are shown in
Figure 7. At buoy 41025 on the RHS, differences between the two model simulations and buoy data are similar for most of the storm time. However, when Arthur passes by, run FC has smaller differences with the data than run WO (
Figure 7a). Both experiments overestimate the peak waves, although model results in run WO overestimate them more (by ∼0.6 m more than in run FC) and for a longer time period (∼7–8 h longer). At buoy 41036, the differences between the simulated SWHs in both runs and the buoy data are smaller, with underestimations of the maximum by ∼2 m (
Figure 7b). Buoy 41036 is along the storm track and just north of the model southern boundary. Buoy 44014 is slightly to the left of the storm track. As with buoy 41025, both experiments overestimate the SWHs during the peak by over 2 m at buoy 44014 (
Figure 7c). Here, run WO overestimates the peak SWH by ∼0.25 m more than run FC. Buoy 44024 is on the RHS of the storm track along the Northeast Channel and has large surface waves during the storm. Despite the buoy data missing at the peak, model results in both runs WO and FC overestimate the SWHs by over 2 m. The model errors in simulating
are relatively larger in run WO than run FC just before and after the peak (
Figure 7d). After the peak, run WO overestimates the SWHs by ∼0.28 m more than run FC. Buoy 44066 is on the LHS of the storm track in the MAB. Both runs WO and FC overestimate the SWHs by over 2 m along the peak (
Figure 7e). However, in the 2–3 days leading up to the peak and the time after the peak, the differences between the model results in run WO and the buoy data are slightly larger than the differences between those in run FC and the buoy data, hence the larger RMSE (
Table 4).
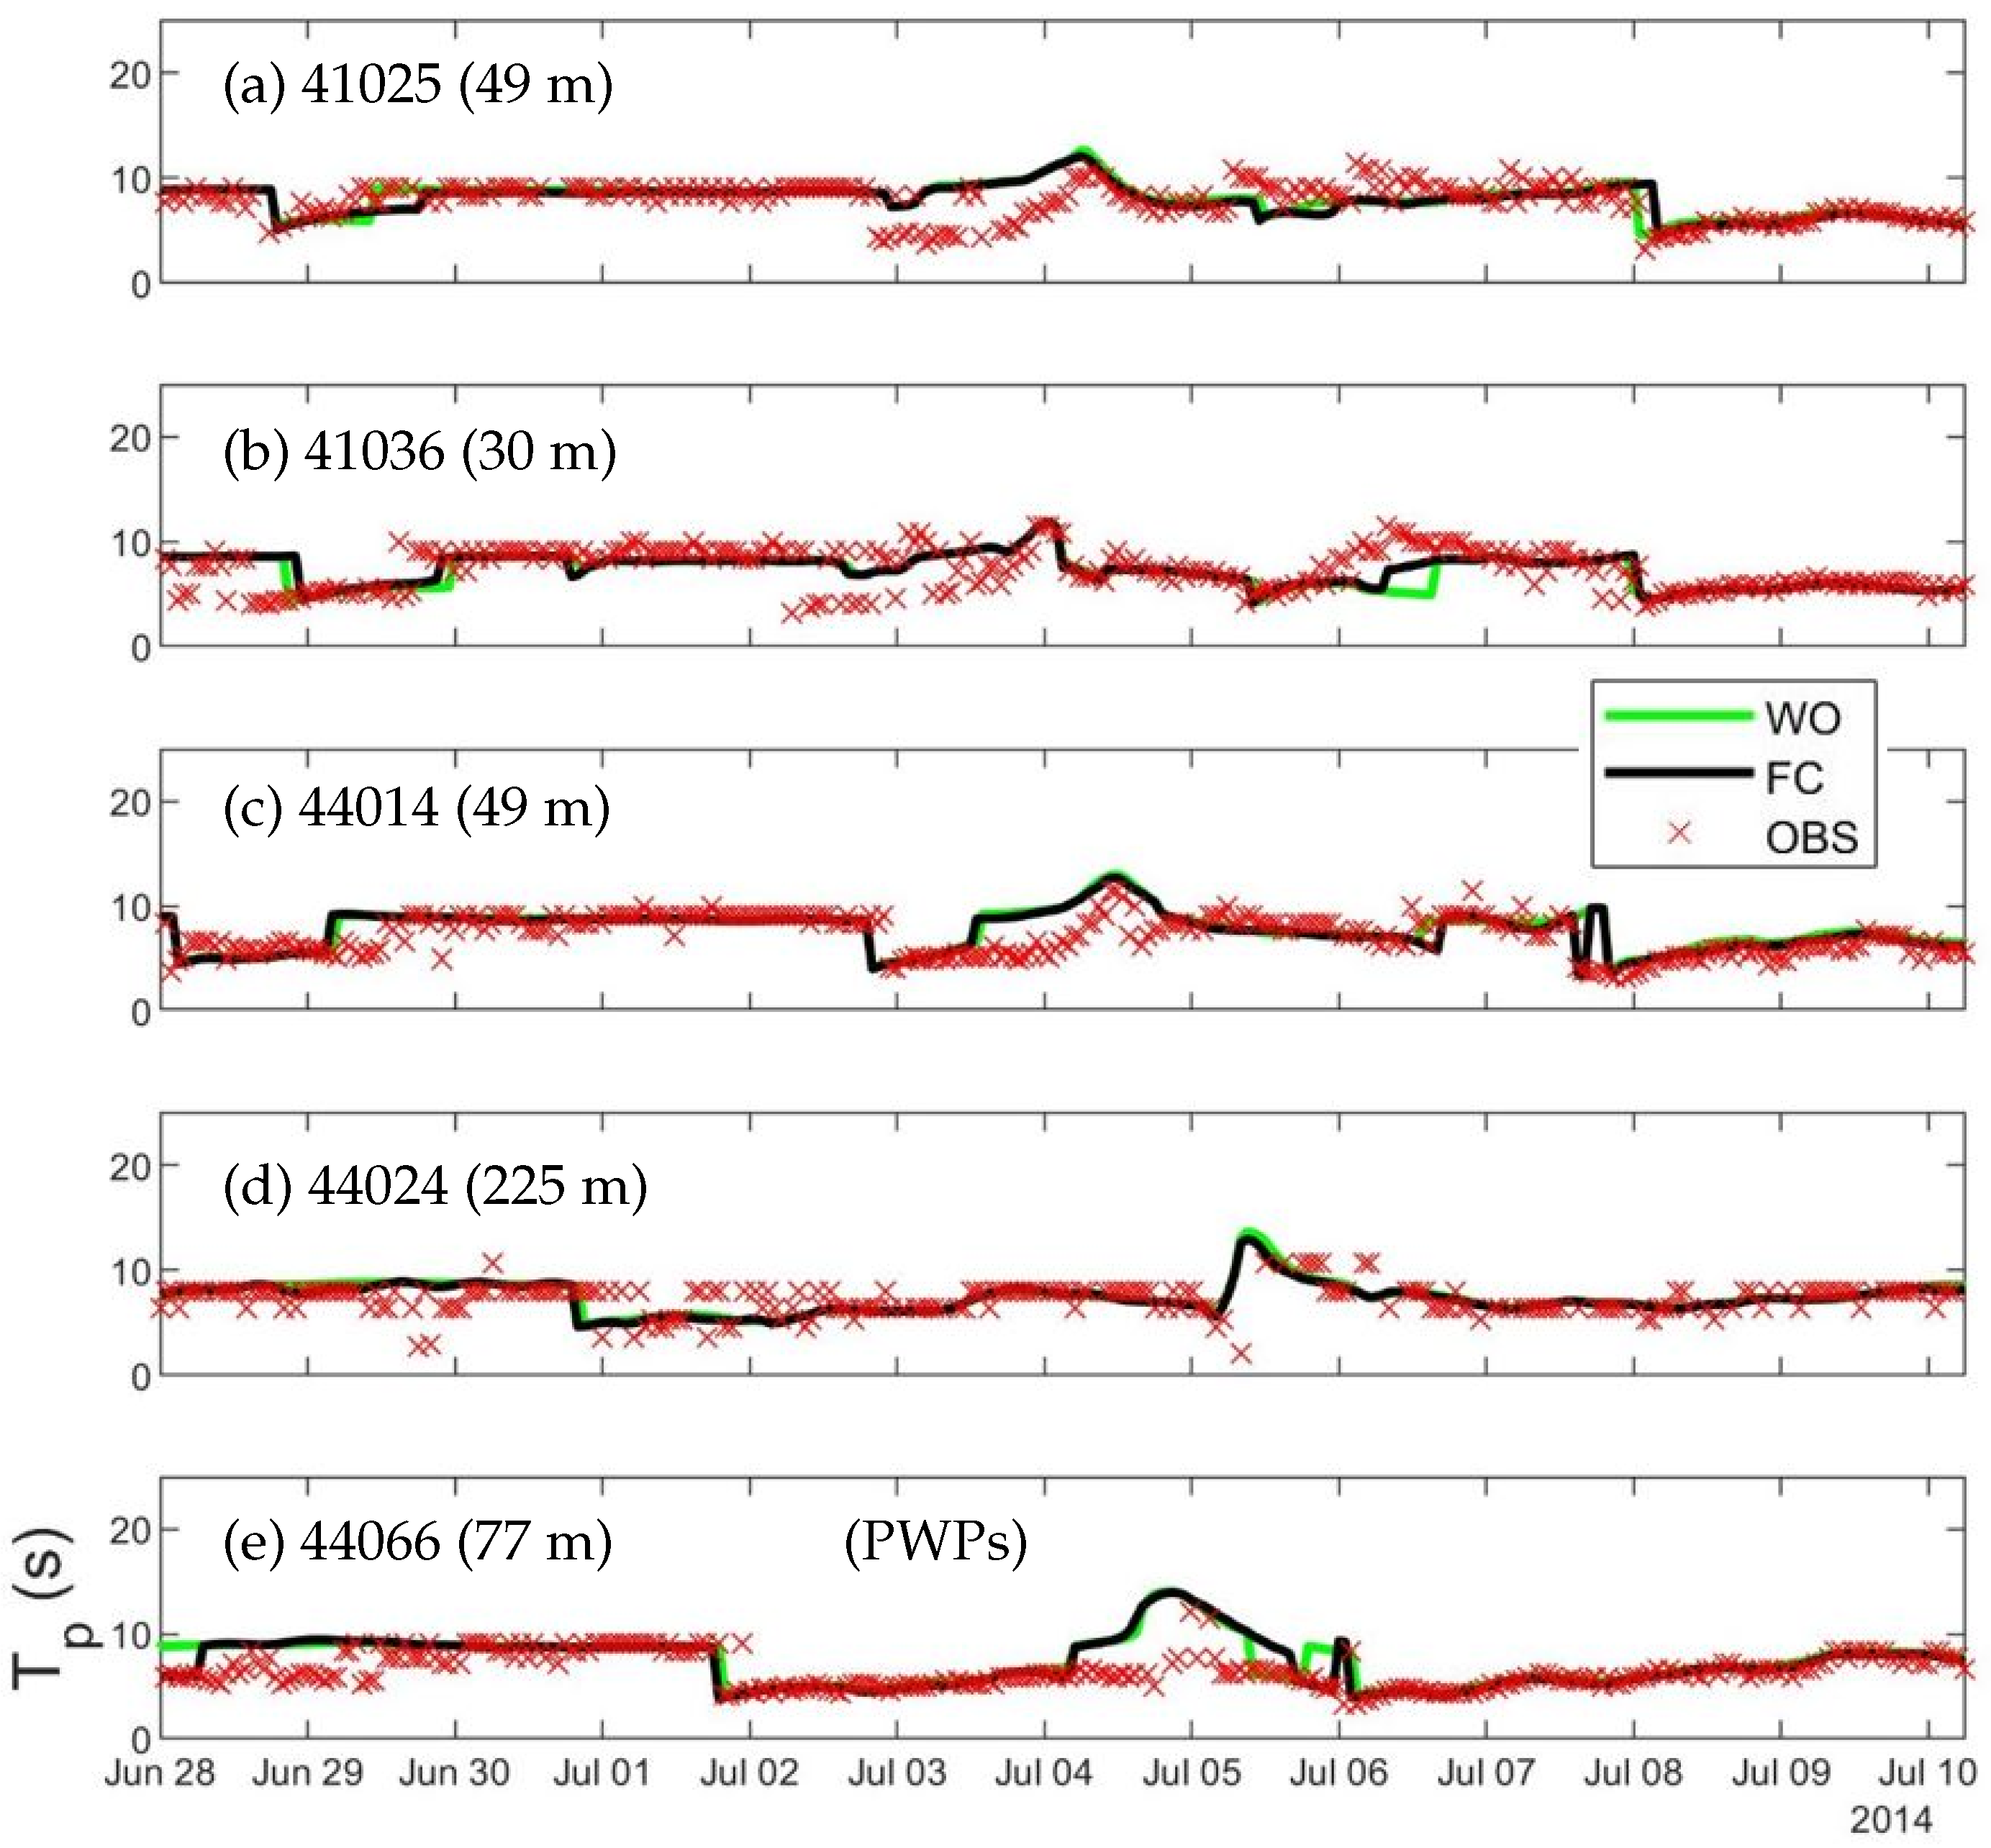
We next assess the model performance in simulating the surface wave periods by comparing the smoothed peak wave periods (PWPs) calculated from model results in run FC to observed PWPs at buoys 41025, 41036, 44014, 44024 and 44066 (
Figure 8). The smoothed PWPs are calculated from the relative PWPs by applying a parabolic fit to the highest bin as well as two bins on both sides of the highest bin of the discrete wave spectrum [
46]. The SWAN Team [
46] recommends the smoothed PWP as a better estimate of the real PWP than the relative PWP. This is because the relative PWP “is related to the absolute maximum bin of the discrete wave spectrum and hence, might not be the ’real’ PWP” [
46].
Examination of
Figure 6 and
Figure 8 suggests that the agreement between the simulated and observed PWPs is reasonable (average R ≈ 53.1%, average
1.43), but not as good as the agreement for the simulated and observed SWHs (average R ≈ 94.0%, average
0.16). For example, CWMS-NWA in run FC reproduces reasonably well most of the observed PWP time series at buoy 41025 with the typical values of PWPs about 5–9 s (
Figure 8a). The only noticeable discrepancies occur on 3–4 July before the maximum value of PWP. The model results capture the general trends of the observed PWPs at buoy 41036 (
Figure 8b) as well, with the simulated and observed results of about 5–10 s. Noticeable differences occur at this buoy with plausible reasons being the coarse model resolution and the limited discretization of the wave spectra (more detail at the end of the section). The agreement between the PWPs from the model results and the observations at buoy 44014 (
Figure 8c) are similar to buoy 41025 with the relatively large discrepancies before the storm peak and small discrepancies at other times of the study period. CWMS-NWA also reproduces reasonably well the general pattern of the observed PWPs at buoy 44024, but the observed PWPs have more small-scale fluctuations than model results (
Figure 8d). Finally, the model results at buoy 44066 match the observational PWPs, but the peak of the storm lasts much longer in CWMS-NWA (
Figure 8e).
As shown in
Figure 8, CWMS-NWA has deficiency in representing high-frequency variations of the observed PWPs. Different from SWHs, the PWPs are not based on the integral of the entire wave spectrum. The PWP is the inverse of the peak frequency (
), the frequency corresponding to the maximum wave spectral density. Capturing the peak wave spectral changes is thus more difficult than the full spectral SWHs, especially with limited discretized wave frequencies. The model relatively coarse resolution used in this study also limits how well the model reproduces the local topography, which also influences the surface waves. Despite these model deficiencies, CWMS-NWA has satisfactory skills in simulating the PWPs at these buoys (
Table 5). The PWP error metrics in this study are comparable to those in Lin et al. [
18] with a few exceptions. Buoys 41025 and 41036 are both located near the southern boundary of the model domain. Thus, any errors in the boundary conditions could propagate through the model output at both buoys. Buoy 44175 is situated in the GSL between Prince Edward Island and the Madeleine Island. Only the coarse-resolution background ERA5 winds are available over the GSL. SWHs and PWPs are also limited at buoy 44175 by the reduced fetch and local topography.
3.3. Model Performance in Simulating Surface Elevations
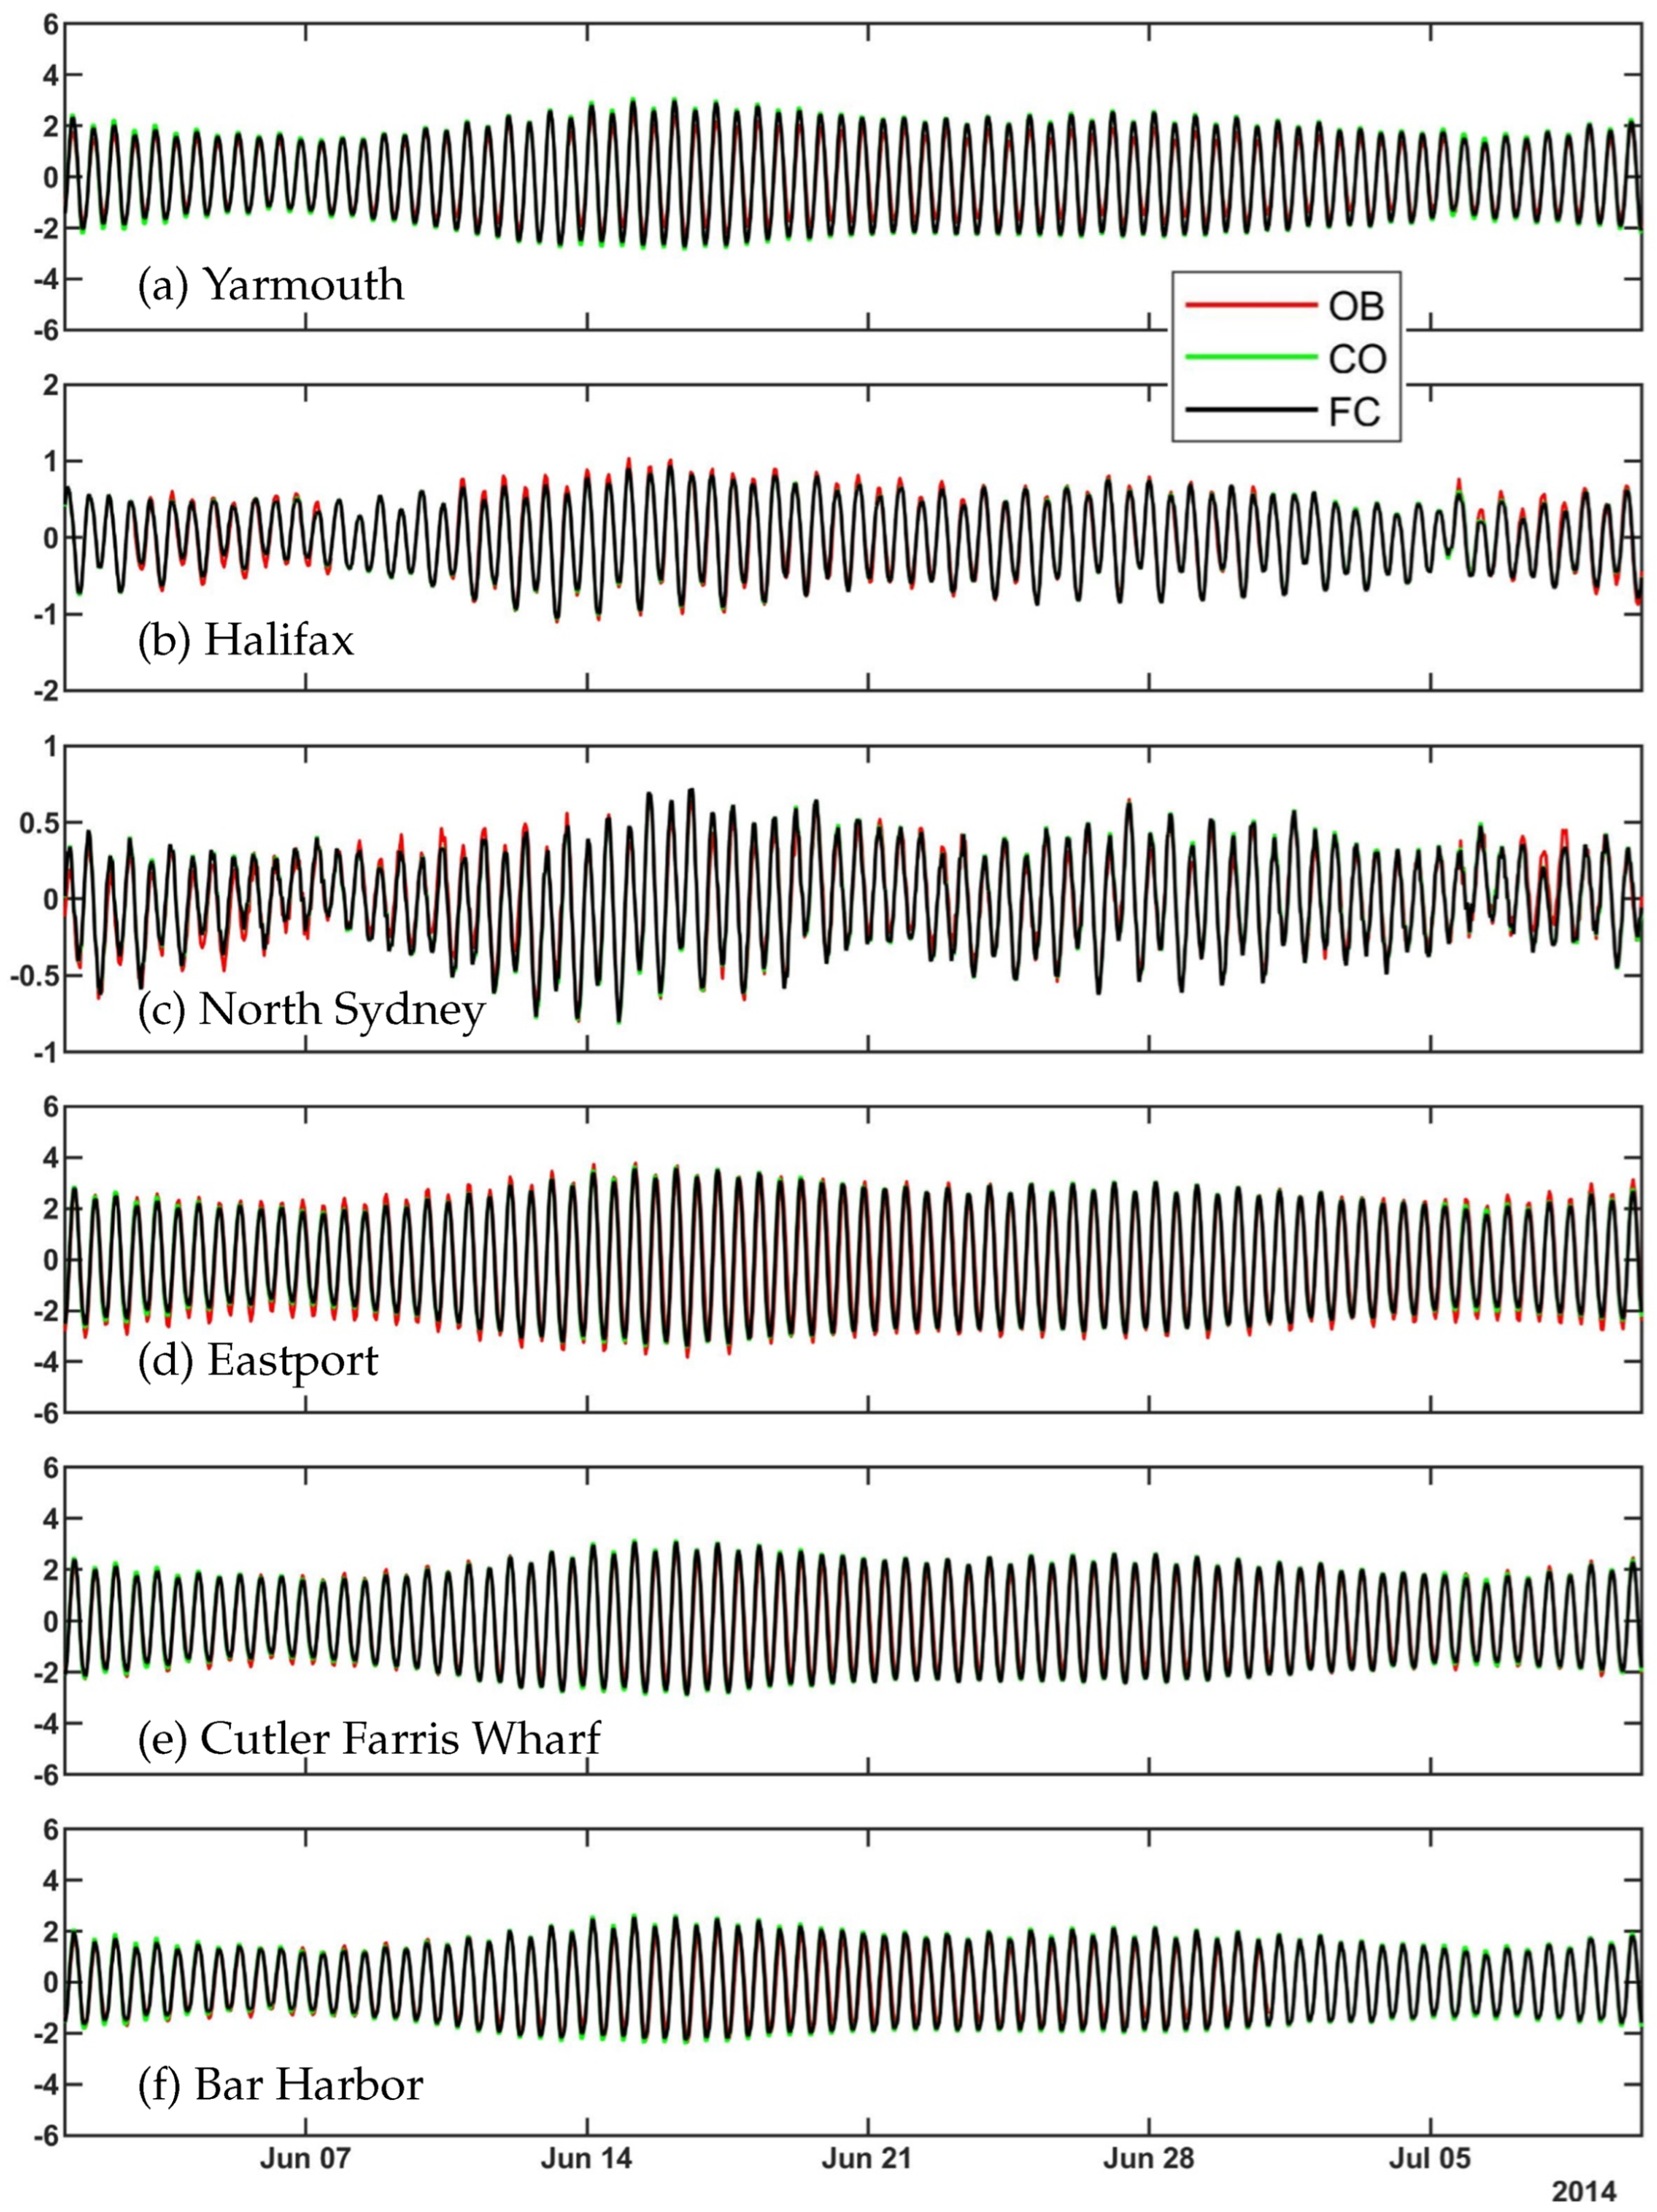
The simulated surface elevations in run FC are compared with in-situ measurements at ten tidal gauge stations whose locations are shown in
Figure 1. The observed and simulated total surface elevations at six of these stations are shown in
Figure 9, from the beginning of June to the end of the Hurricane Arthur storm period on 10 July. The tidal gauge observations at Saint John, NB are excluded due to some issues with data quality in 2014. The observed total surface elevations at Yarmouth, Eastport, Cutler Farris Wharf and Bar Harbor all have large oscillations associated with large tides in the inner GoM and BoF. Large tidal elevations also occur at Halifax and North Sydney, but the tides are weaker over the Scotian Shelf (ScS) than the GoM and BoF.
There is a good agreement between the simulated and observed total surface elevations at ten tidal gauge stations listed in
Table 6. The error metrics for the simulated total surface elevation at Yarmouth are: R ≈ 99.1%, RMSE ≈ 33.3 cm and
≈ 0.07. The relatively large R value and
value at Yarmouth suggest that the CWMS-NWA is able to reproduce the large observed tides exceptionally well at this location. Model results of the total surface elevations have high R and low errors at four locations in the GoM: Eastport, Cutler Farris Wharf, Portland and Boston with R at 96% or higher. The RMSEs at these four stations are about 46.2 cm at Eastport and about 27.8, 28.5 30.0 and 31.6 cm respectively at Cutler Farris Wharf, Bar Harbor, Portland and Boston. The simulated results of the total surface elevations at these GoM tidal stations all have very small
values as well. Cutler Farris Wharf has the smallest
of the GoM tidal stations (≈ 0.03), followed by Eastport and Bar Harbor (≈ 0.06), Portland (≈ 0.09) and Boston (≈ 0.10).
Though some spatial variability occurs in the model errors of CWMS-NWA for simulating the total observed surface elevations, the consistent low values of model errors in the GoM demonstrate a very good simulation of the tidal oscillations. Along the coast of Nova Scotia, the simulated total surface elevation at Halifax and North Sydney have comparable R and values to the GoM locations. However, the RMSEs are much smaller at Halifax (∼8.0 cm) and North Sydney (∼7.1 cm) than the values at the four GoM tidal gauges. The main reason for small RMSEs at Halifax and North Sydney is that tides are much weaker at Halifax and North Sydney than they are within the GoM. The RMSEs are smaller at Cape May, NJ and Duck, NC than the GoM locations, but the R and values at the Mid-Atlantic Bight (MAB) locations are similar to the model results at Boston.
The observed and simulated surface elevations are further examined using the tidal analysis. Tidal harmonics are computed from both the observational data and the model results by the MATLAB T_TIDE package [
47]. Thirty-five tidal constituents are identified from the 39-day time series of the total surface elevations for both the observational data and model output. From the identified tidal constituencies of the observed data, only the O1, K1, N2, M2, S2 and L2 have amplitudes greater than 0.09 m at any of the six tidal gauge stations. The simulated tidal surface elevations are in good agreement with the observed tidal elevations at the six tidal gauge stations. Tidal surface elevations largely resemble the total surface elevations at the six tidal gauge stations. The model errors in both the magnitudes and the phases of the tides could be due to the limited horizontal resolution of the model. The error metrics for the simulated tidal surface elevations are small.
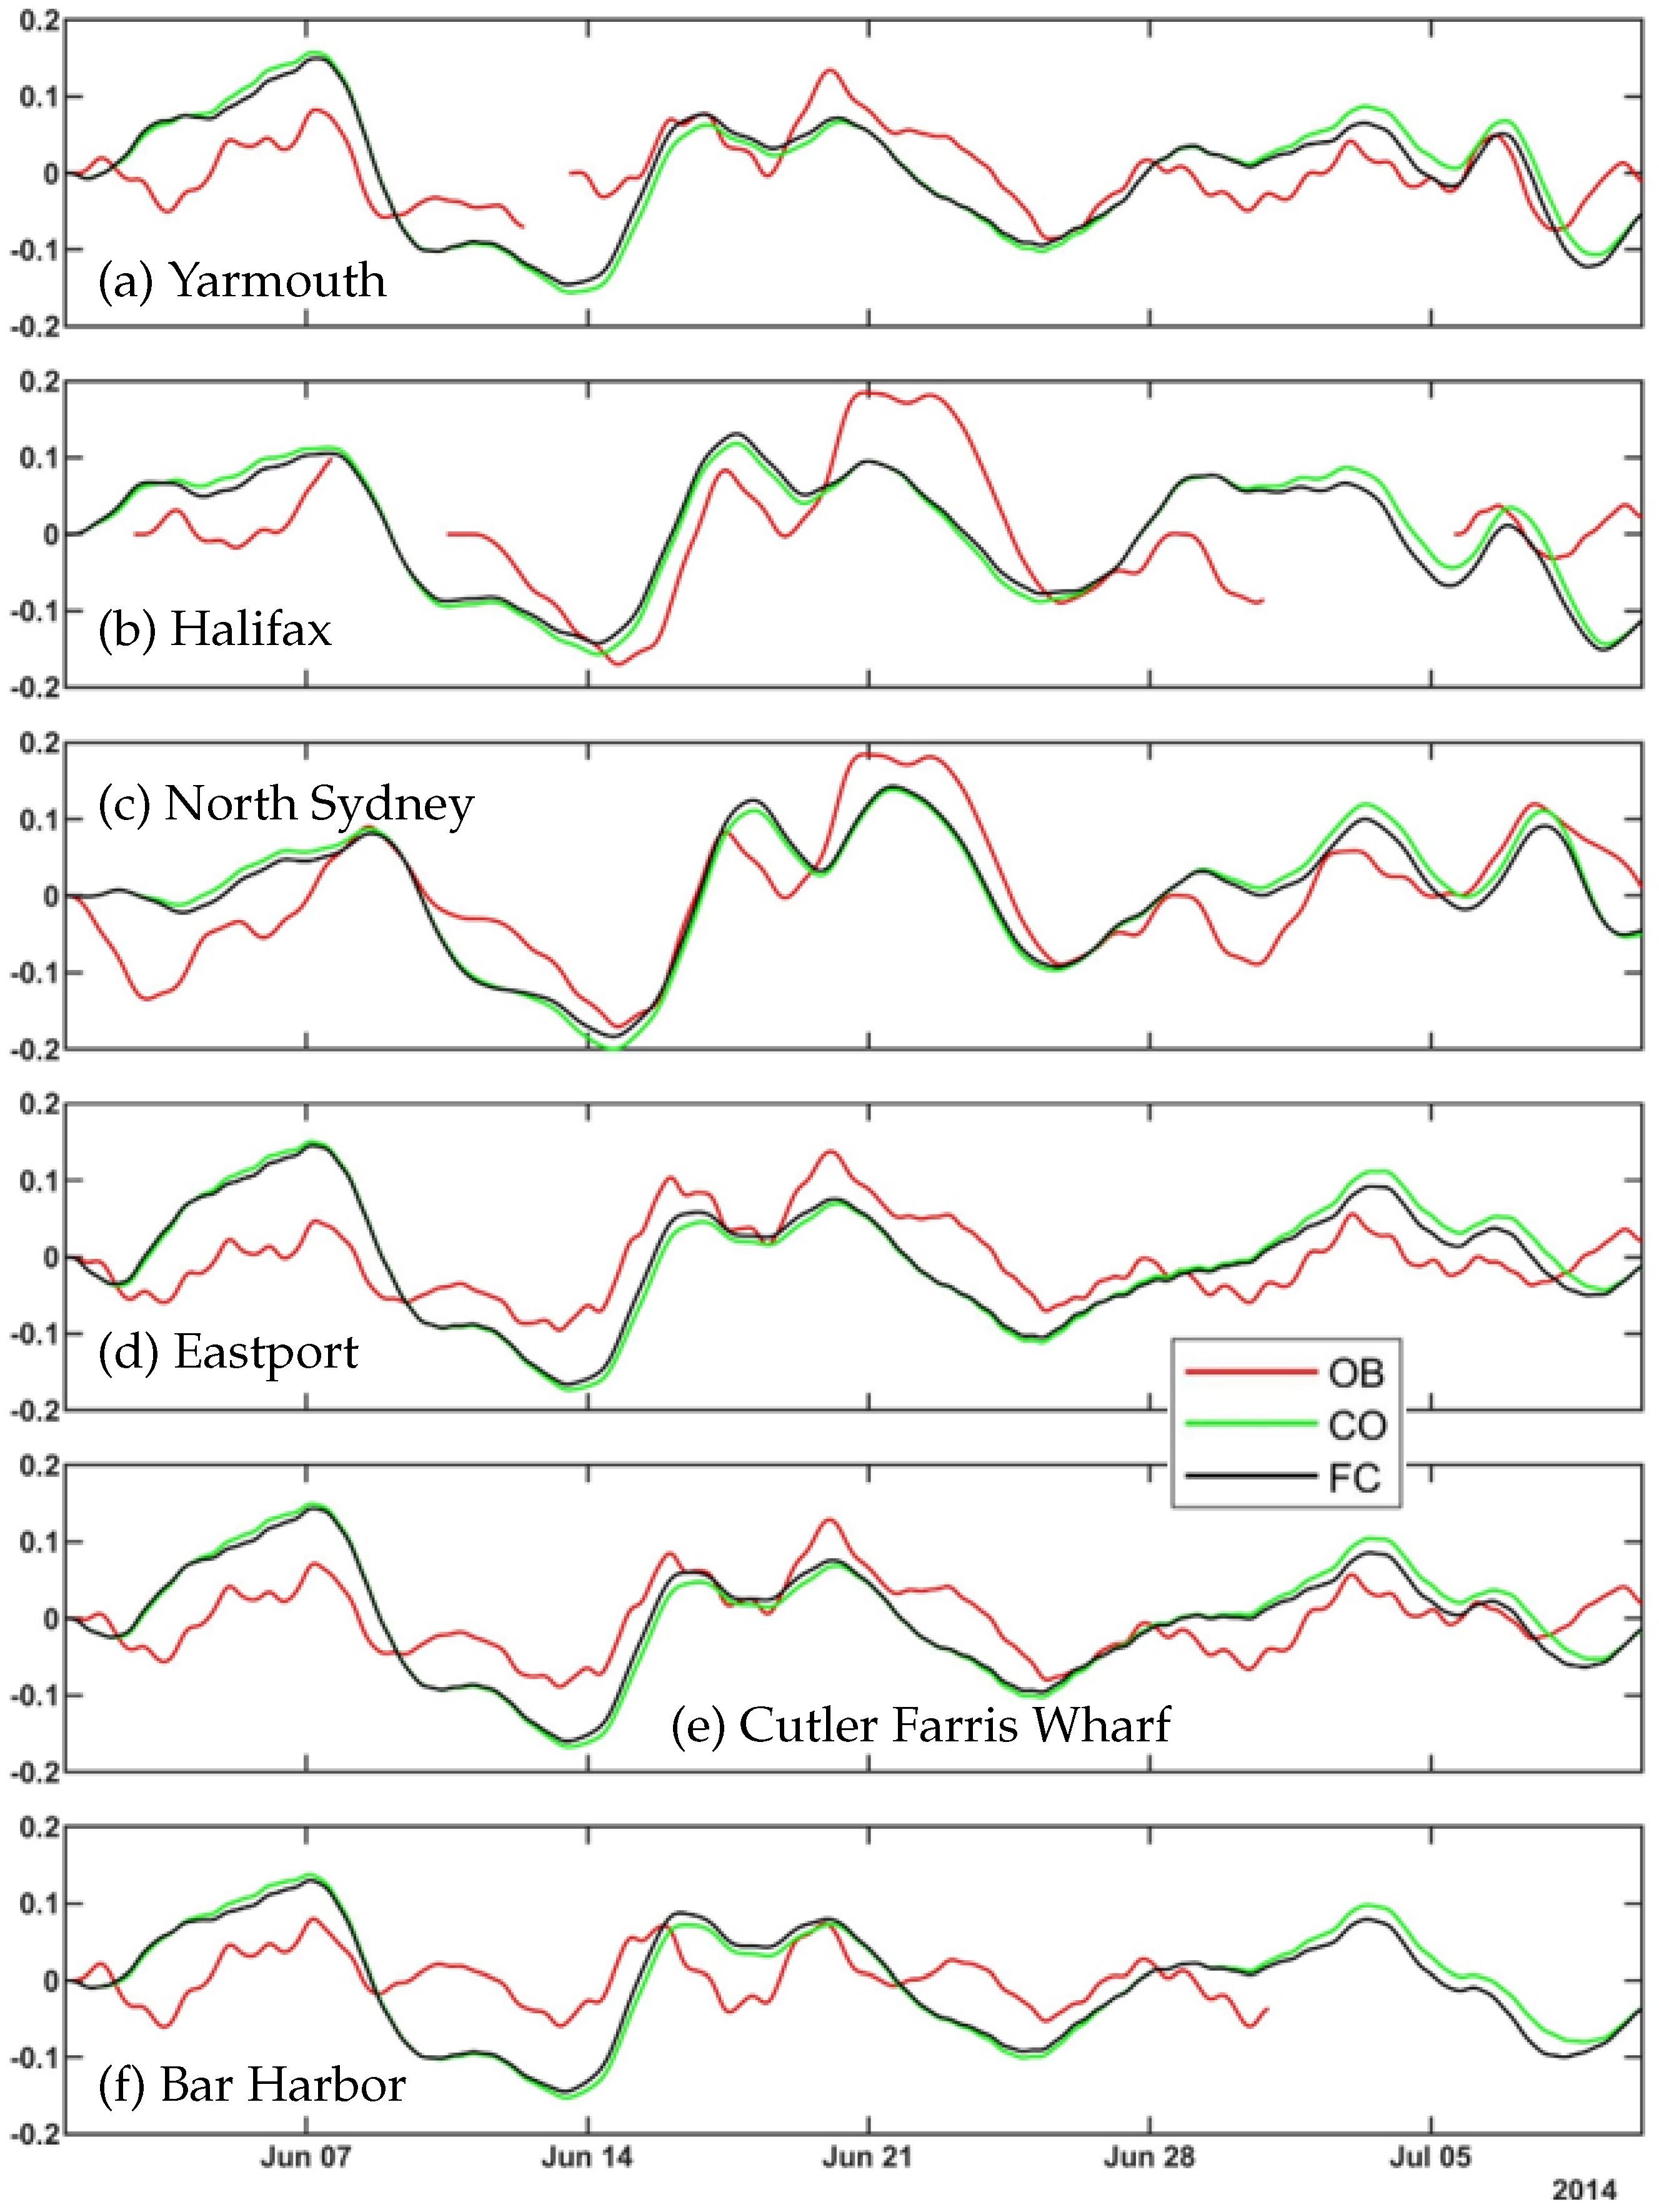
Tidal residuals of the surface elevations are calculated by subtracting the tidal elevations from the total surface elevations. To remove any tidal signals, the residuals are passed through a low pass filter with a cutoff frequency corresponding to a period of 13 h to remove high-frequency noise. The model output residuals and the residuals of the observed data are shown in
Figure 10. The tidal residuals from the model results agree fairly well with those from the observed data. Slight differences between the residuals from run CO and run FC occur at all six stations plotted. These small differences suggest that WCIs have a minor role in modifying the residual surface elevations.
Zhang and Sheng [
48] used a 2D barotropic ocean circulation model to examine extreme sea levels resulting from tides and storm surges over 32-year simulations over coastal waters of the NWA. The atmospheric and tidal forcing were used in their studies. They also decomposed the simulated and observed sea levels into tidal and non-tidal components. They examined hourly time series of both the tides and storm surges associated with hurricanes and winter storms. From their experiments, they found that the 2D model has satisfactory skills in simulating storm surge magnitudes. Yang et al. [
49] used ROMS in barotropic mode to study interactions between tides and storm surge during Hurricanes Bill in 2009 and Dorian in 2019. Consistent with previous studies, they found relatively large non-linear tide-surge interactions, with maximum changes to the sea levels over the BoF, GSL and Northumberland Strait reaching 0.2 m, 0.4 m, and 0.3 m, respectively during Hurricane Dorian. They found that the non-linear bottom friction effect had a much larger contribution than the advection effect and the non-linear shallow water effect over coastal shelf waters. A more thorough analysis would be required here to investigate the non-linear tide-surge interactions during Hurricane Arthur. However, other studies used numerical models to investigate storm surge during Hurricane Arthur (as discussed later) [
17,
50,
51].
3.4. Model Performance in Simulating Temperature and Salinity
We next assess the performance of CWMS-NWA in simulating temperature and salinity using satellite remote sensing data and in-situ hydrographic observations.
The simulated daily-mean sea surface temperature (SST) in run FC is first compared with the daily averaged SST from the European Space Agency (ESA) SST Climate Change Initiative (CCI) project [
52] which is the Level-4 (L4) global SST product with a resolution of
[
53]. As shown in
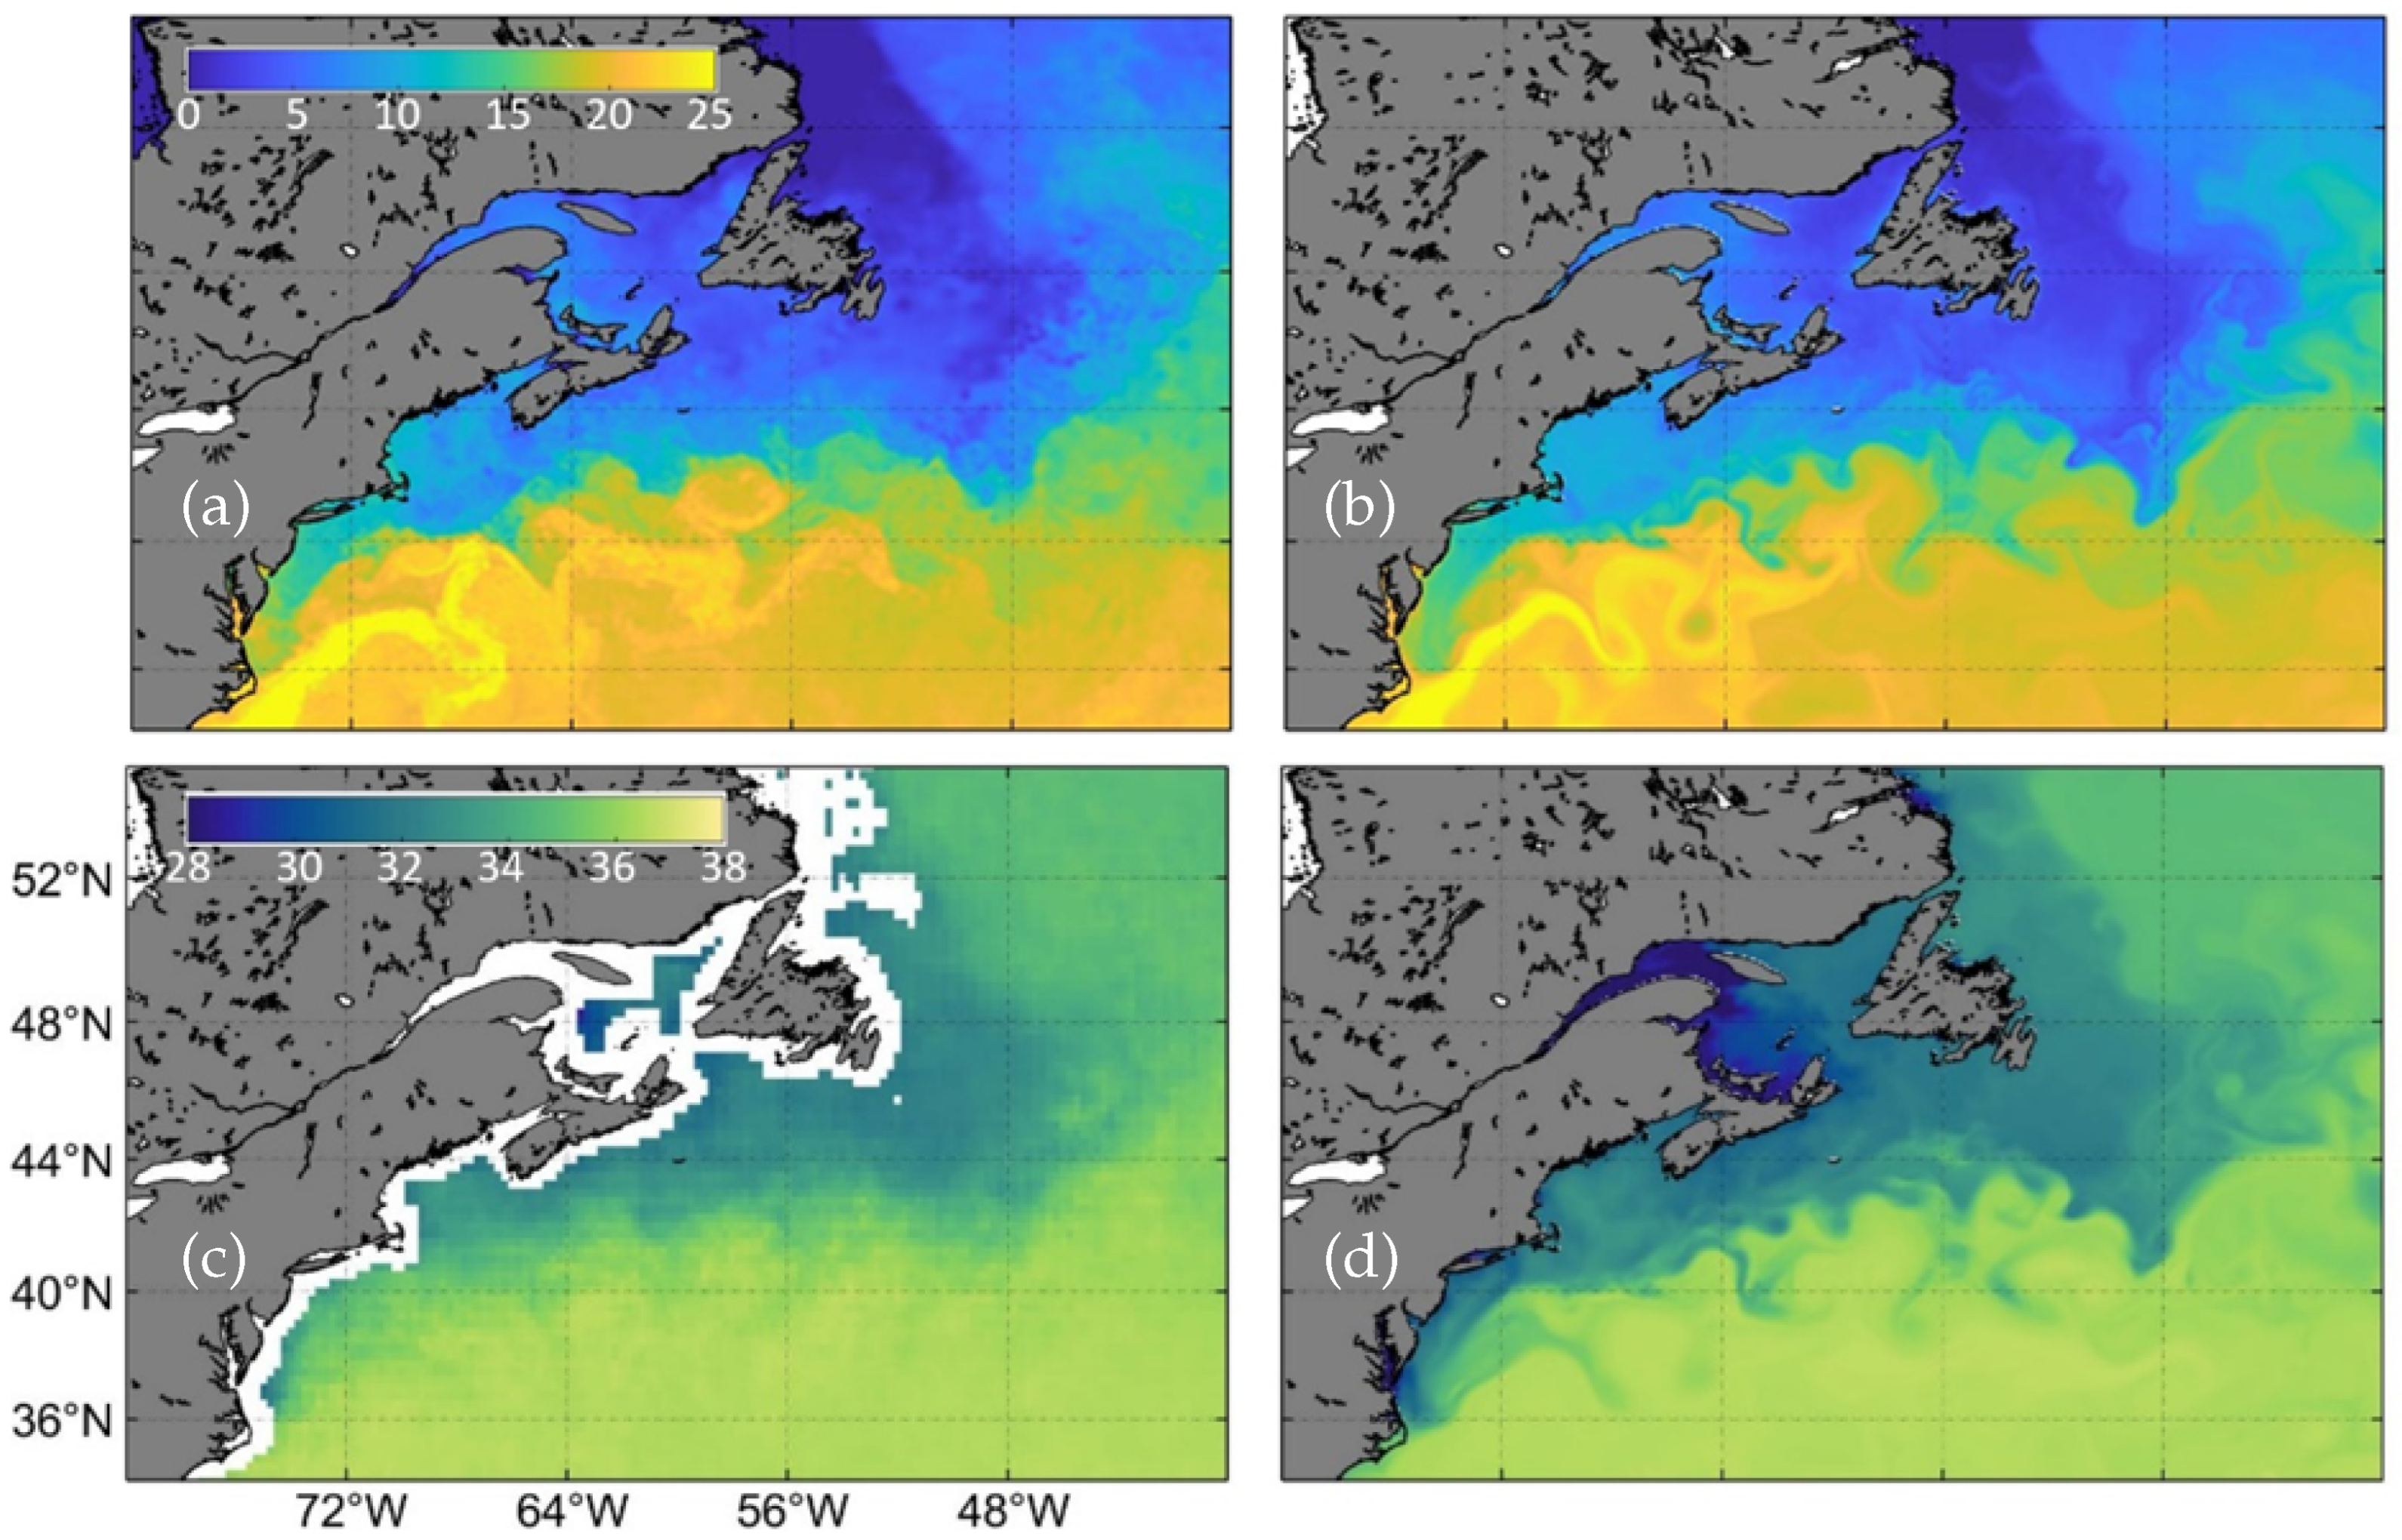
Figure 11 on 22 May 2014, CWMS-NWA reproduces reasonably well the observed large-scale temperature patterns such as warm SST carried by the GuS and the cold water carried by the Labrador current (LaC). Some of the cooler water on Georges Bank as well as the cooler water in the GSL are also reproduced by CWMS-NWA. It should be noted that without data assimilation, CWMS-NWA has limited skills in reproducing the observed locations, sizes and shapes of meanders and smaller scale features due mainly to highly nonlinear processes controlling evolution of meanders, filaments and smaller scale frontal structures associated with the GuS and LaC. Furthermore, the simulated GuS is located further to the north in comparison with observations. CWMS-NWA also reproduces two prominent coastal currents on the ScS: the Nova Scotia Current (NSC) [
54] and the Shelfbreak Current (SbC) [
55]. The horizontal resolution of CWMS-NWA is about 6 km on the ScS and GoM. Therefore, this modelling system has limited skills in generating small-scale features of circulation and hydrography.
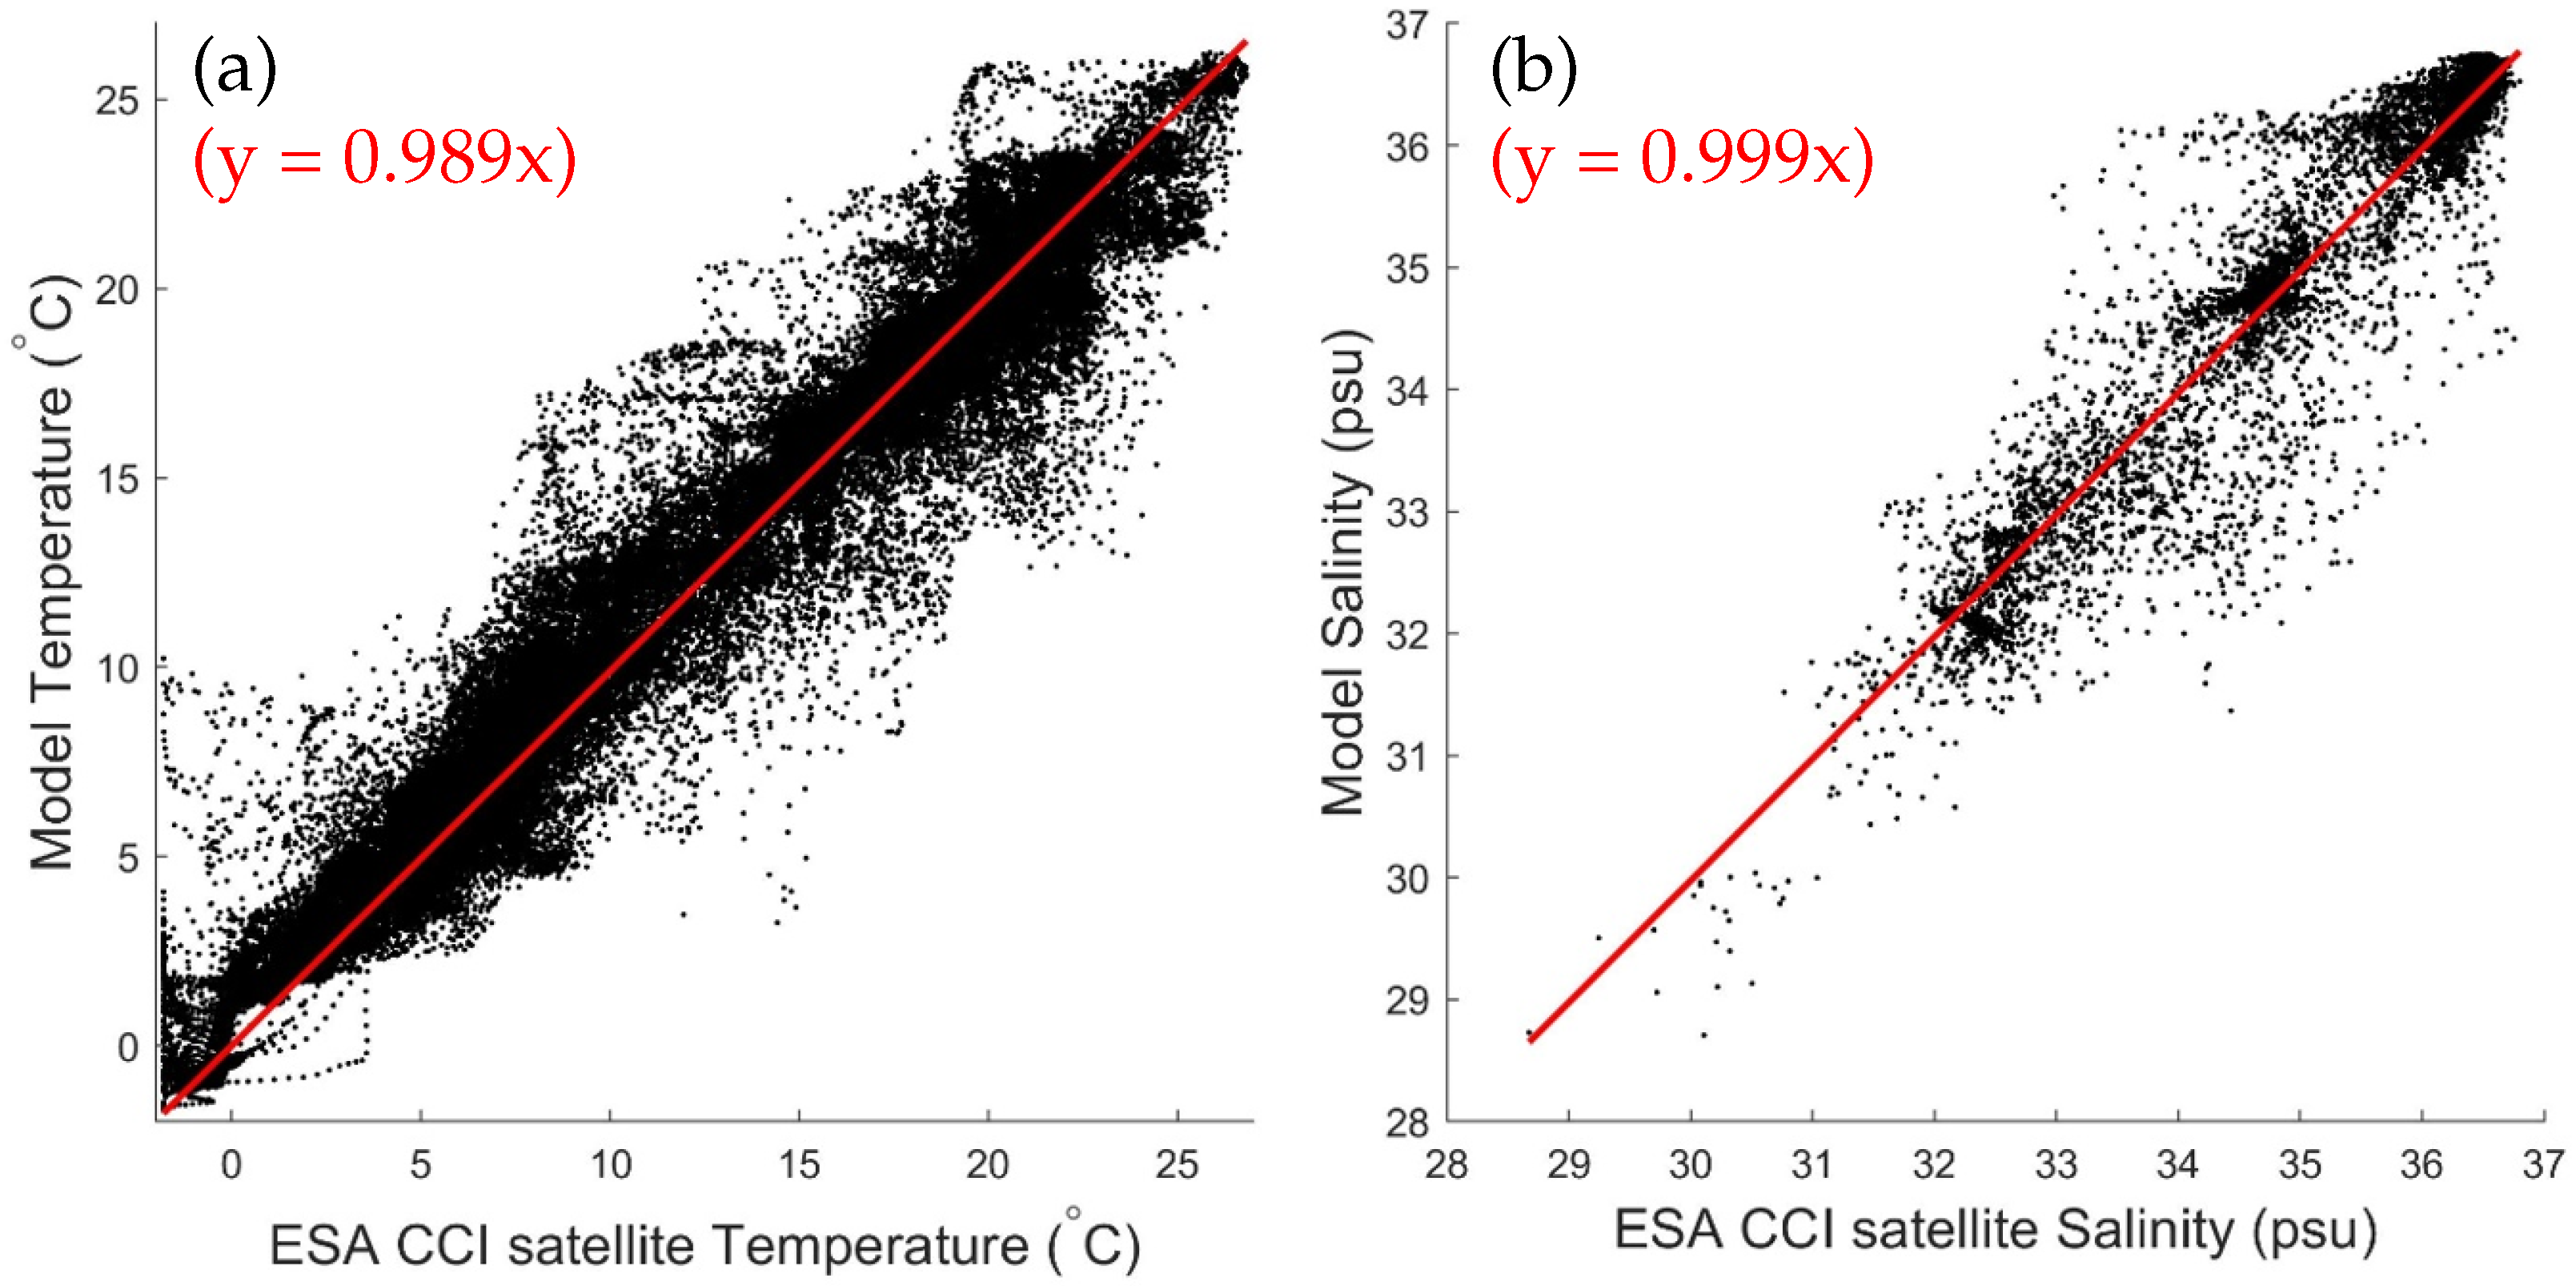
Figure 12a is a scatter plot of the SST between the ESA CCI satellite and model results with the R value of about 97.8%. The small bias demonstrated by the red line bisecting the scatter is confirmed by the small RB (∼8.6 ×
°C). The comparatively large RMSE (∼1.6 °C) and SI (∼0.12) can be attributed to large model–biases for the small-scale features. For example, both the satellite SST data and model results show warm and cold core eddies, but with large differences in size, shape and position which result in large RMSE and SI. However, the small RB indicates that the simulated SST produced by CWMS-NWA is not systemically too warm or too cold on average over the entire model domain.
The simulated weekly average sea surface salinity (SSS) in run FC is also compared with ESA CCI satellite SSS data [
56] (
Figure 11). The ESA satellite SSS data calculated using a 7-day running mean for May 18–25 has a horizontal resolution of 1/4°. The satellite SSS data have relatively large errors over coastal regions. Thus, we cannot assess the model performance in simulating SSS over coastal waters near river mouths, where there are freshwater discharges to estuaries and the ocean. Both the satellite SSS data and the model results show that lower salinity water is confined to the shelves and shoreward of the shelves, with meanders and eddies from the higher salinity GuS present. To the south of the GuS, both the observed salinity data and results from run FC show relatively high SSS.
The weekly averaged SSS comparison between the ESA satellite data and model results is also examined in the scatter plot shown in
Figure 12b. This SSS produced by CWMS-NWA has a relatively small RB with respect to the satellite data and a high R (∼
), with the RMSE ≈ 0.5 psu and SI ≈
. The main reasons for large model deficiencies in simulating salinity (and temperature) include (a) less reliable air-sea fluxes and vertical mixing, (b) coarse horizontal resolution of CWMS-NWA and (c) the absence of data assimilation to reduce model errors arising from the initial conditions and the nonlinear nature of ocean circulation and vertical mixing.
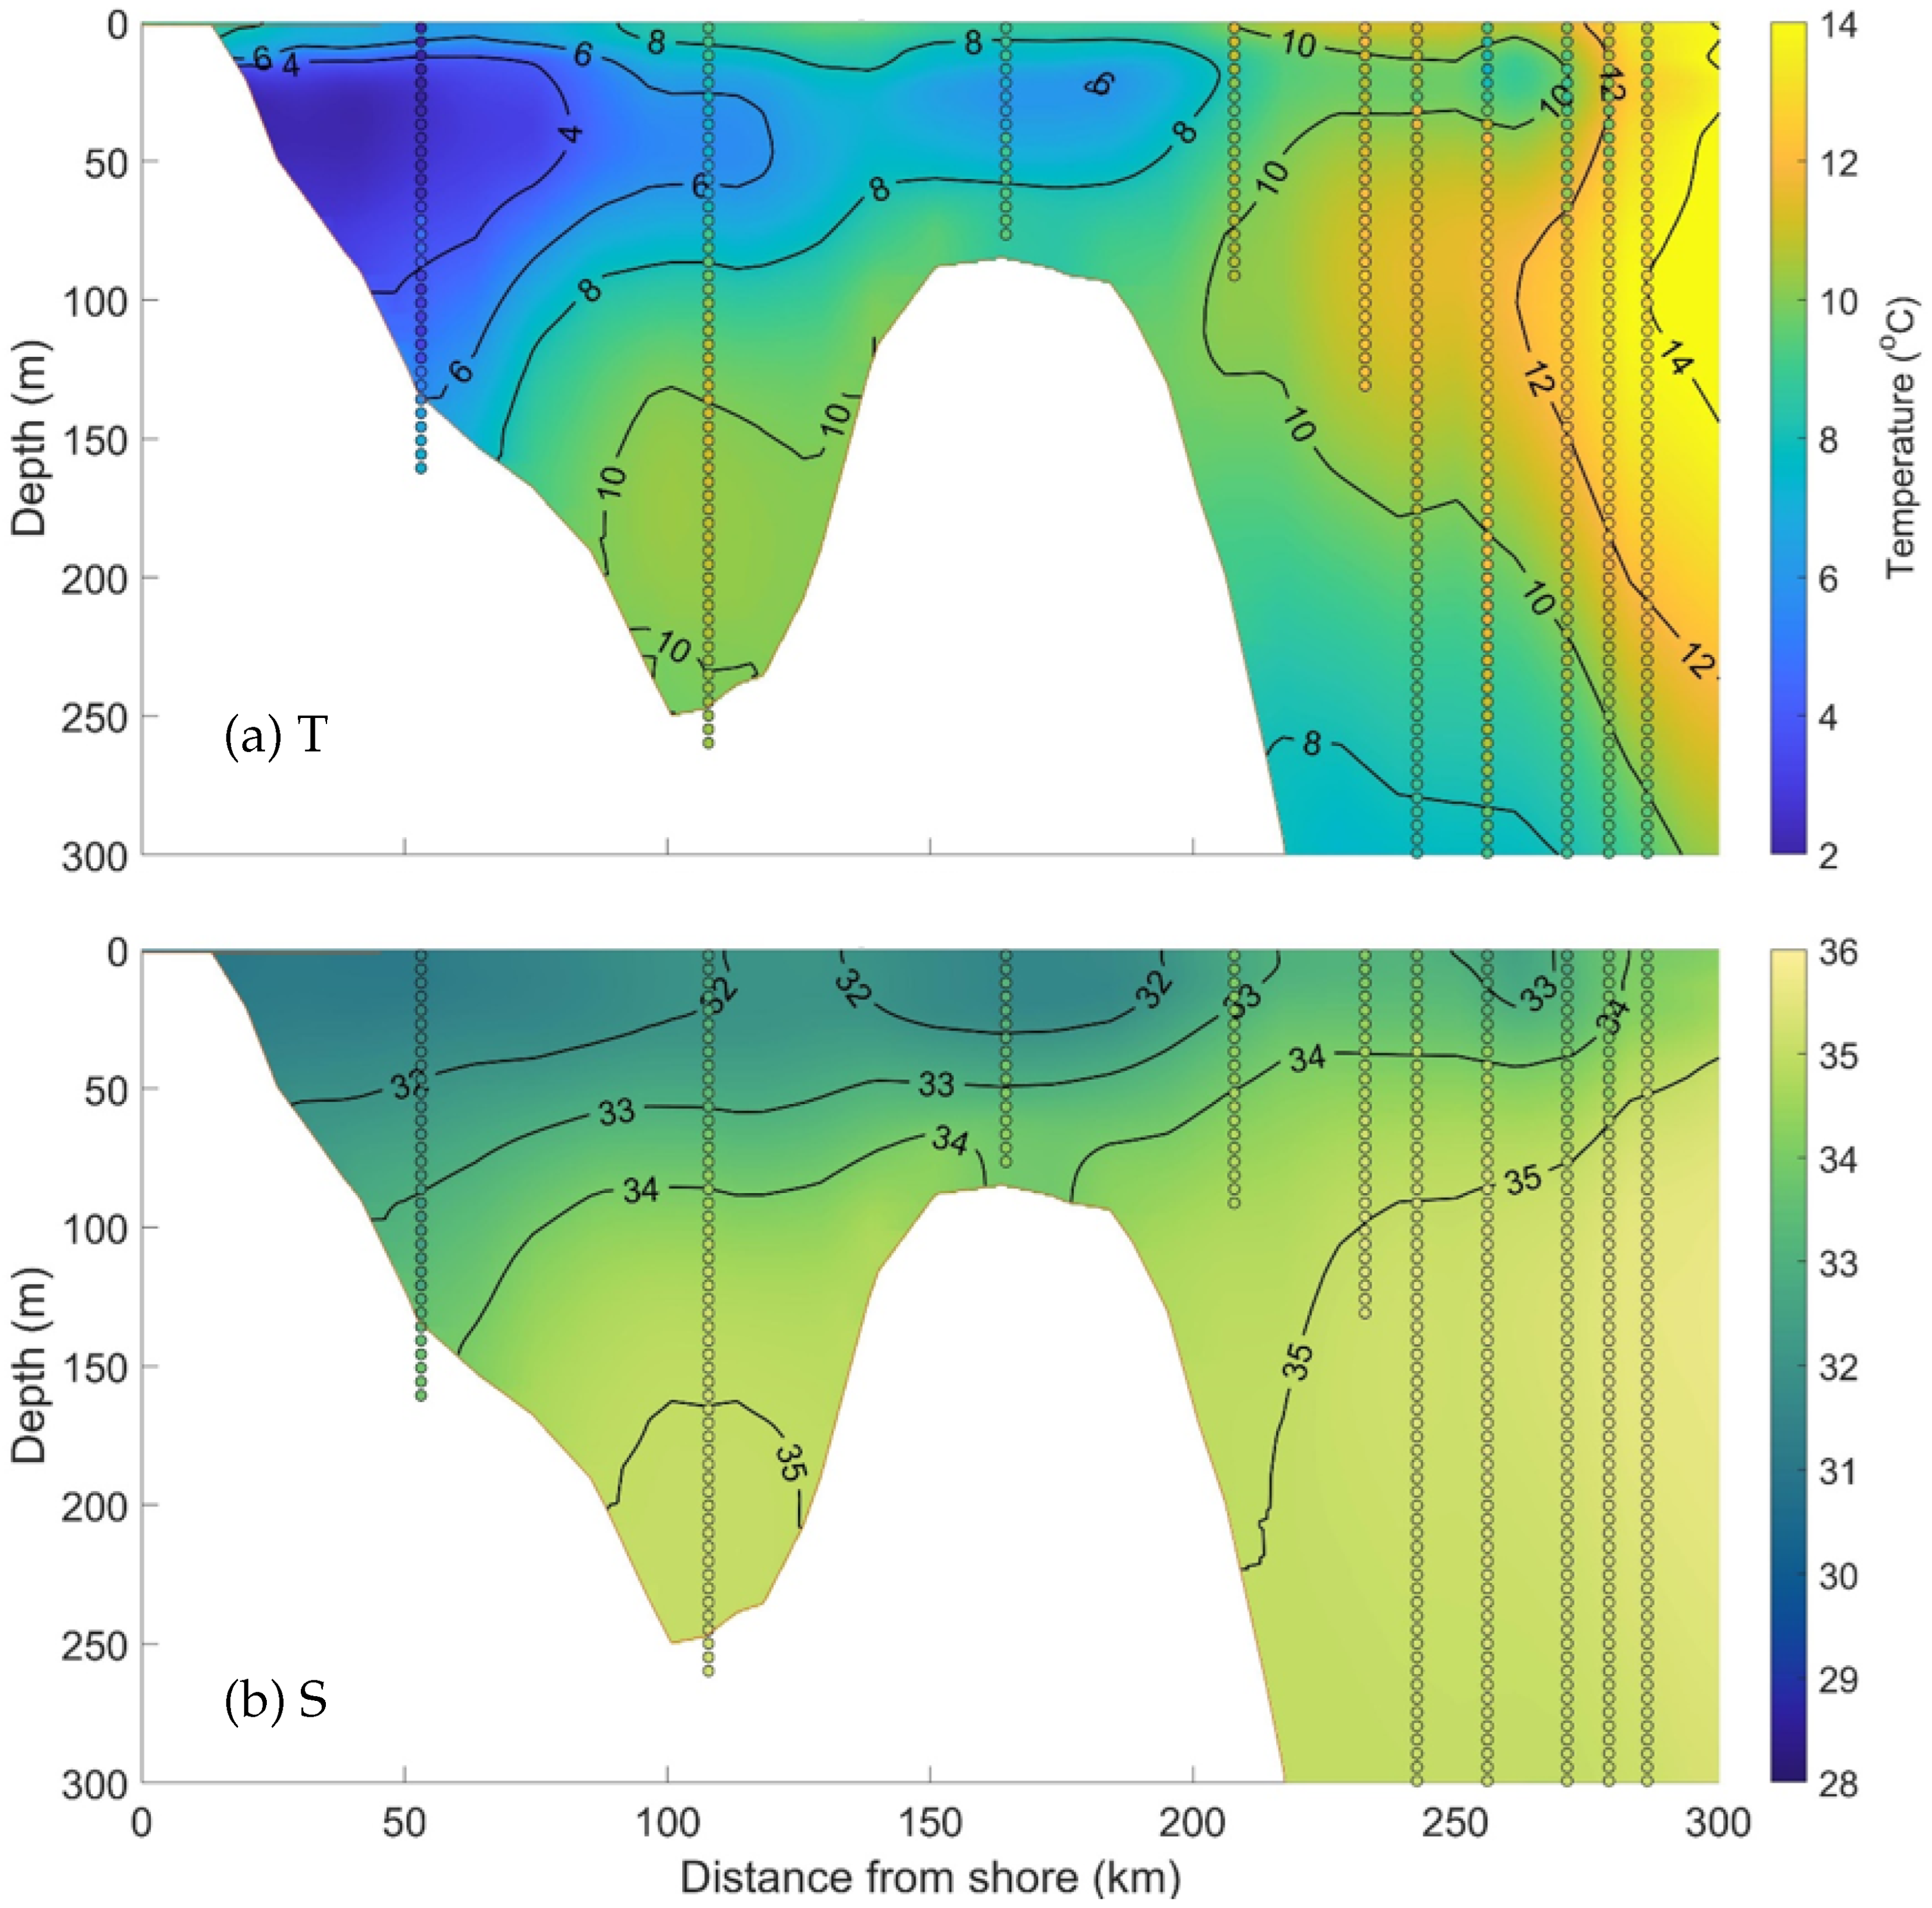
Vertical distributions of the model results in run FC are compared with in-situ hydrographic observations made by the Atlantic Zone Monitoring Program (AZMP). The AZMP temperature data along the Halifax Line (HL as marked in
Figure 1) are shown in
Figure 13a together with the two-day average (00:00:00 21 May 2014 to 00:00:00 23 May 2014) of the simulated temperature in run FC. Both the observed and simulated temperature along the Halifax line show the cold water near the coast associated with the coastal cold water mass transported by the NSC from the eastern ScS to the southwestern ScS. A second cold water mass near the shelf break indicates the presence of the SbC which carries the relatively cold water mass from the eastern ScS to the shelf break of the southwestern ScS. Offshore from the slope, the warmer temperature signifies the presence of Warm Slope Water (WSW). The Slope Water is a mixture of warm GuS water with colder water from the SbC and consists of two parts: the aforementioned WSW and Labrador Slope Water (LSW) [
55,
57,
58,
59]. Examination of observed and simulated temperatures shown in
Figure 13a suggests the reasonable skills of CWMS-NWA in simulating the vertical distributions of temperature over the ScS.
Vertical distributions of simulated and observed (AZMP) salinity along the Halifax line are shown in
Figure 13b. The simulated salinity in the upper layer near the coast and over the shelf break is significantly lower than the salinity at greater depths and offshore. These lower salinities show the presence of the NSC and the SbC respectively. Lower salinity water near the surface and further offshore indicates the flow of water from the GSL in the upper ∼50 m of the Halifax line. The saltier water seaward of the shelf break indicates the presence of the previously described WSW. The tilted haloclines suggest that there is a shoreward flow of the WSW from ∼50–200 m where some of it spills over the shelf break and into Emerald Basin.
Figure 13b demonstrates general agreement between the AZMP salinity data and simulated salinity along Halifax line. It should be noted that, at around 50 km from the shore, the salinity in run FC at depths greater than ∼110 m is saltier than the observed salinity data. The simulated salinity is fresher near the surface at the ∼110 km, ∼170 km and ∼210 km water columns. Exact reasons for model deficiency in simulating salinity and temperature along transect of the Halifax line are not known. Plausible reasons include the coarse model resolution, inaccurate vertical mixing and insufficient air-sea fluxes.
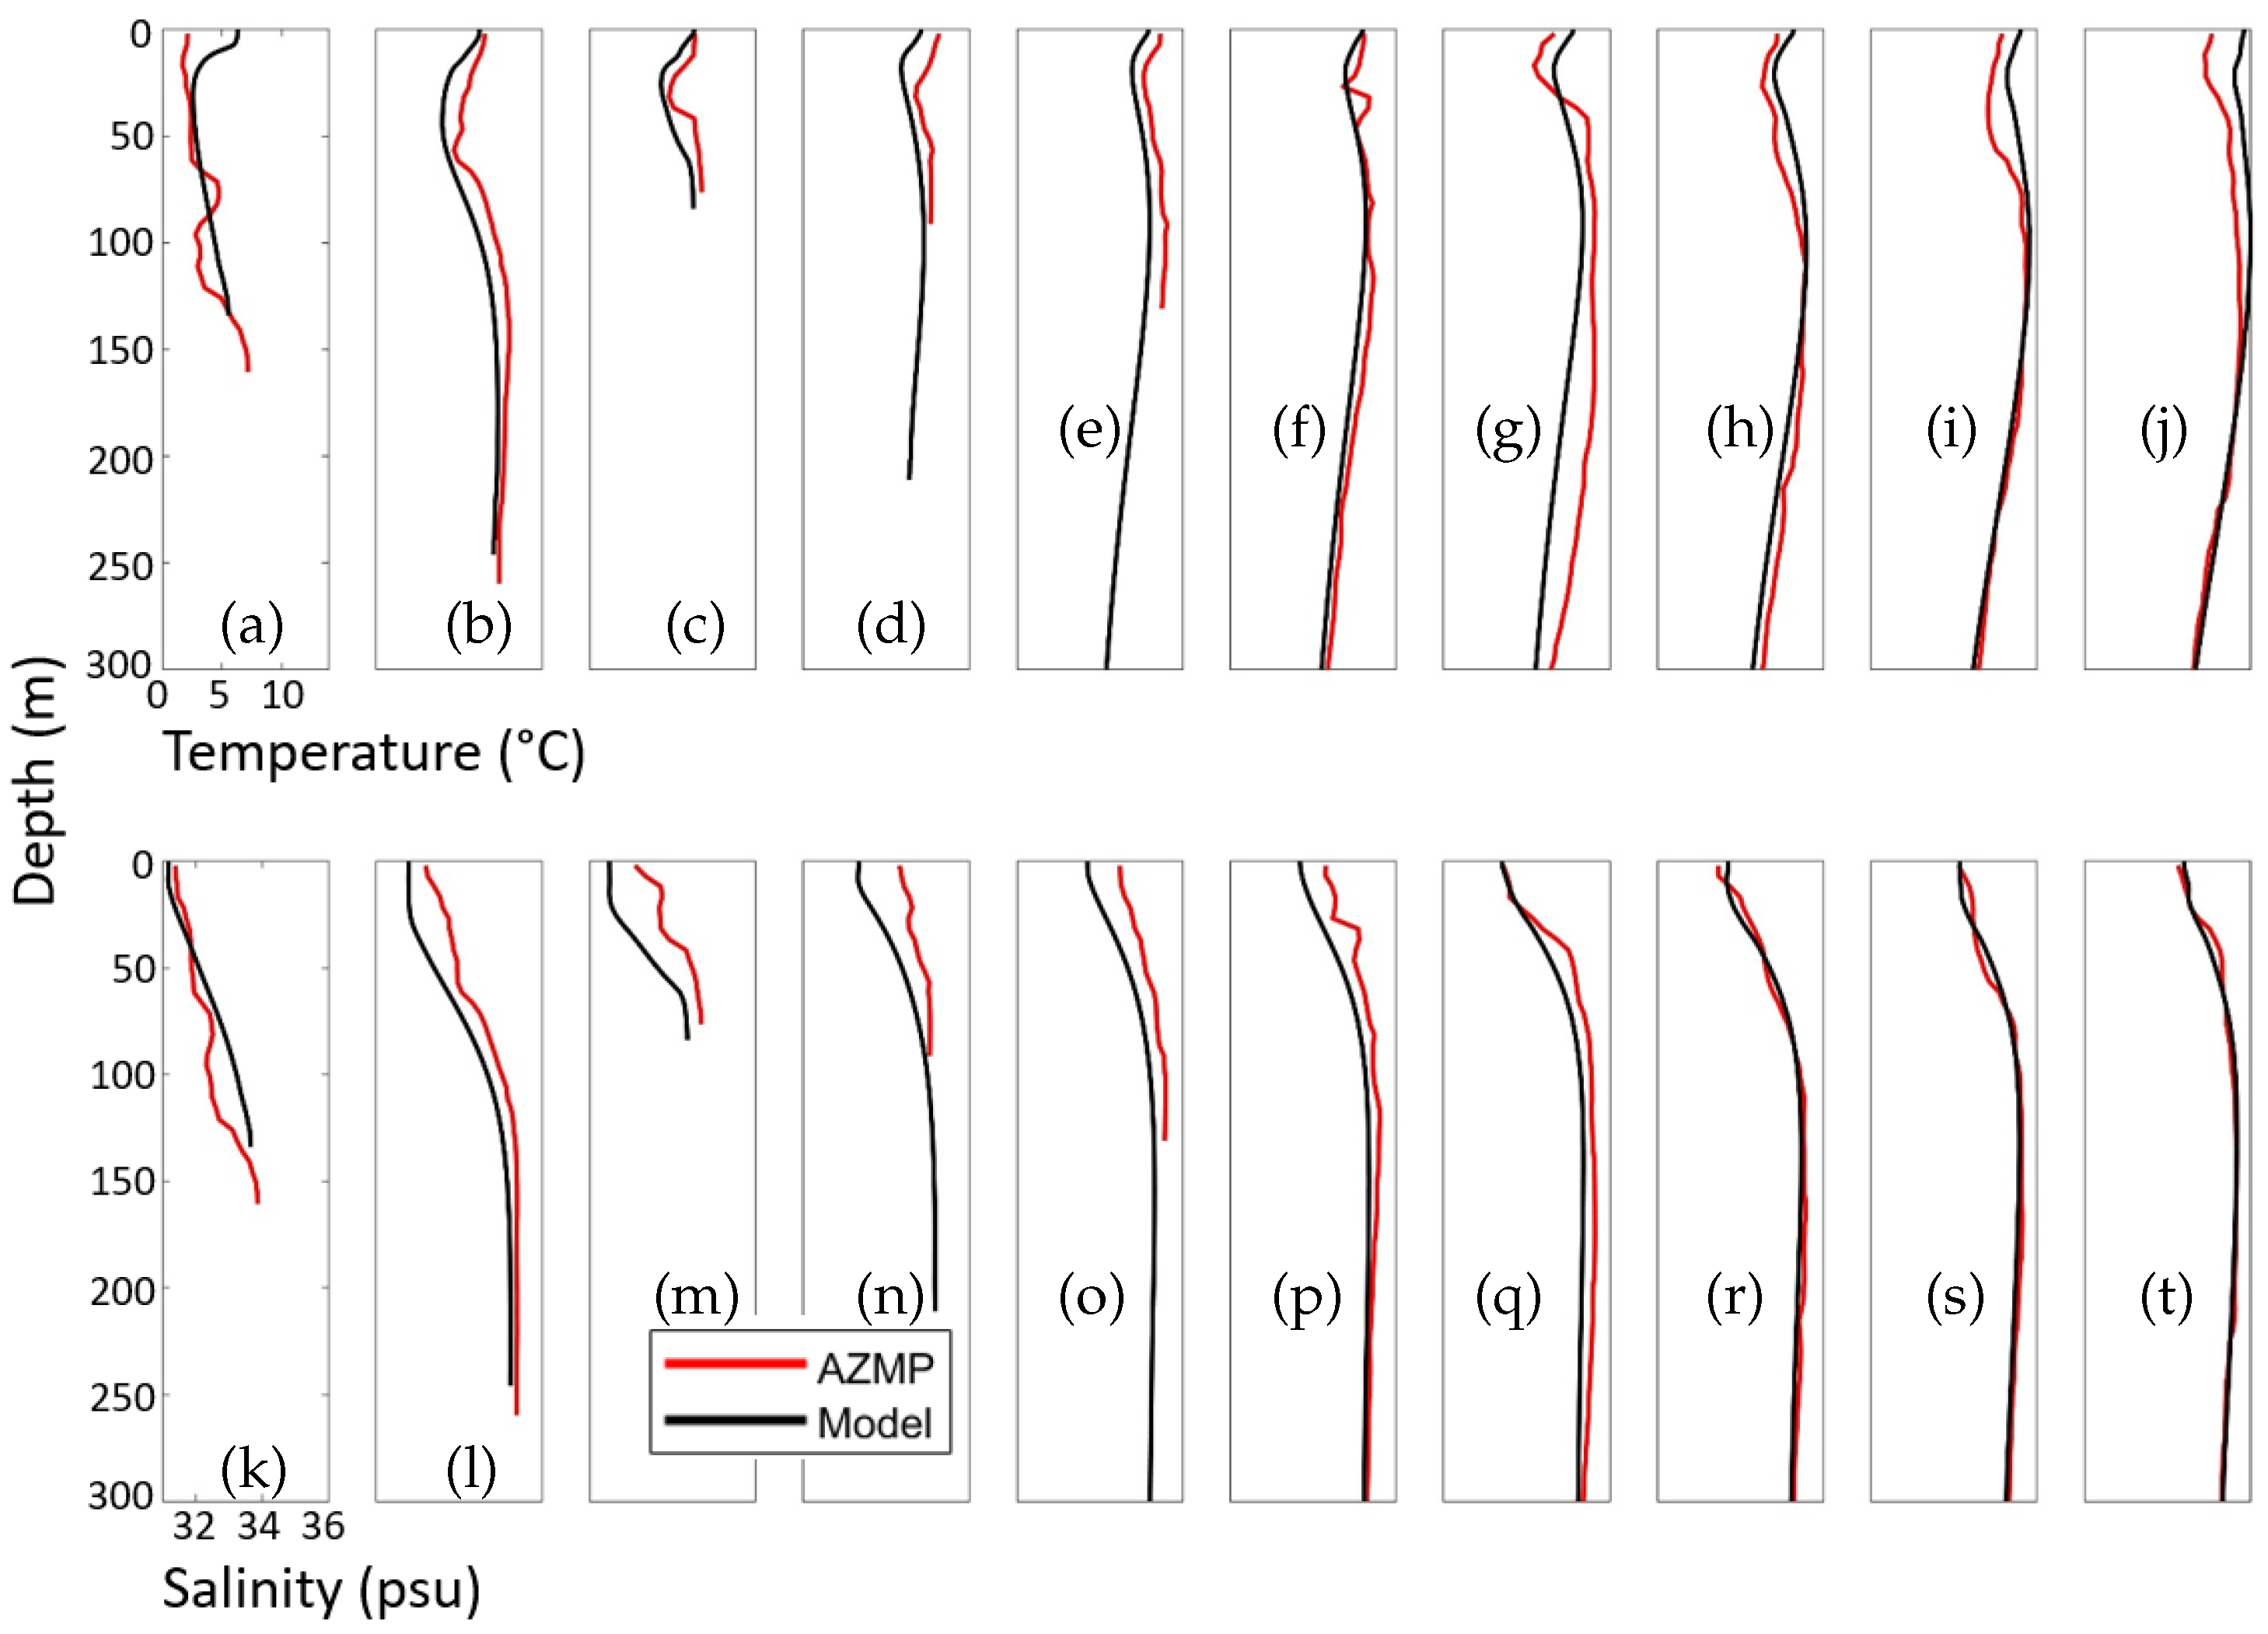
The ten vertical profiles of the observed temperature and salinity data from AZMP are compared with interpolated model results along Halifax line (
Figure 14). For the two-day average of the simulated temperature on 22 May at the 10 vertical profiles, the RB is small (∼−3.5 ×
°C) while the RMSE (∼1.2 °C) and SI (∼0.11) are relatively large but still acceptable. In particular, CWMS-NWA reproduces very well the AZMP temperature data towards the middle temperature range with more bias at higher and lower temperatures, especially at the surface (
Figure 14a). Note that there are limits on the amount of data available. For example, the model results include both the NSC and SbC, but it cannot resolve all of the detailed local circulation. The relatively coarse 1/12° horizontal resolution also produces some discrepancy with the bathymetry which in turn affects the local dynamics.
Examination of ten vertical profiles of the observed (AZMP) and simulated salinity along the Halifax line (
Figure 14b) shows that most of the variability of the salinity is near the surface. Salinity for most of the water at depths deeper than 200 m is confined to a narrow range of salinity (∼34.9–35.6 psu), with a small degree of scatter. Overall for the model performance in generating the vertical distribution of salinity along the Halifax line, the RB (∼−6.8
psu) and SI (∼0.01) are both small and the RMSE (∼0.42 psu) is also reasonable.
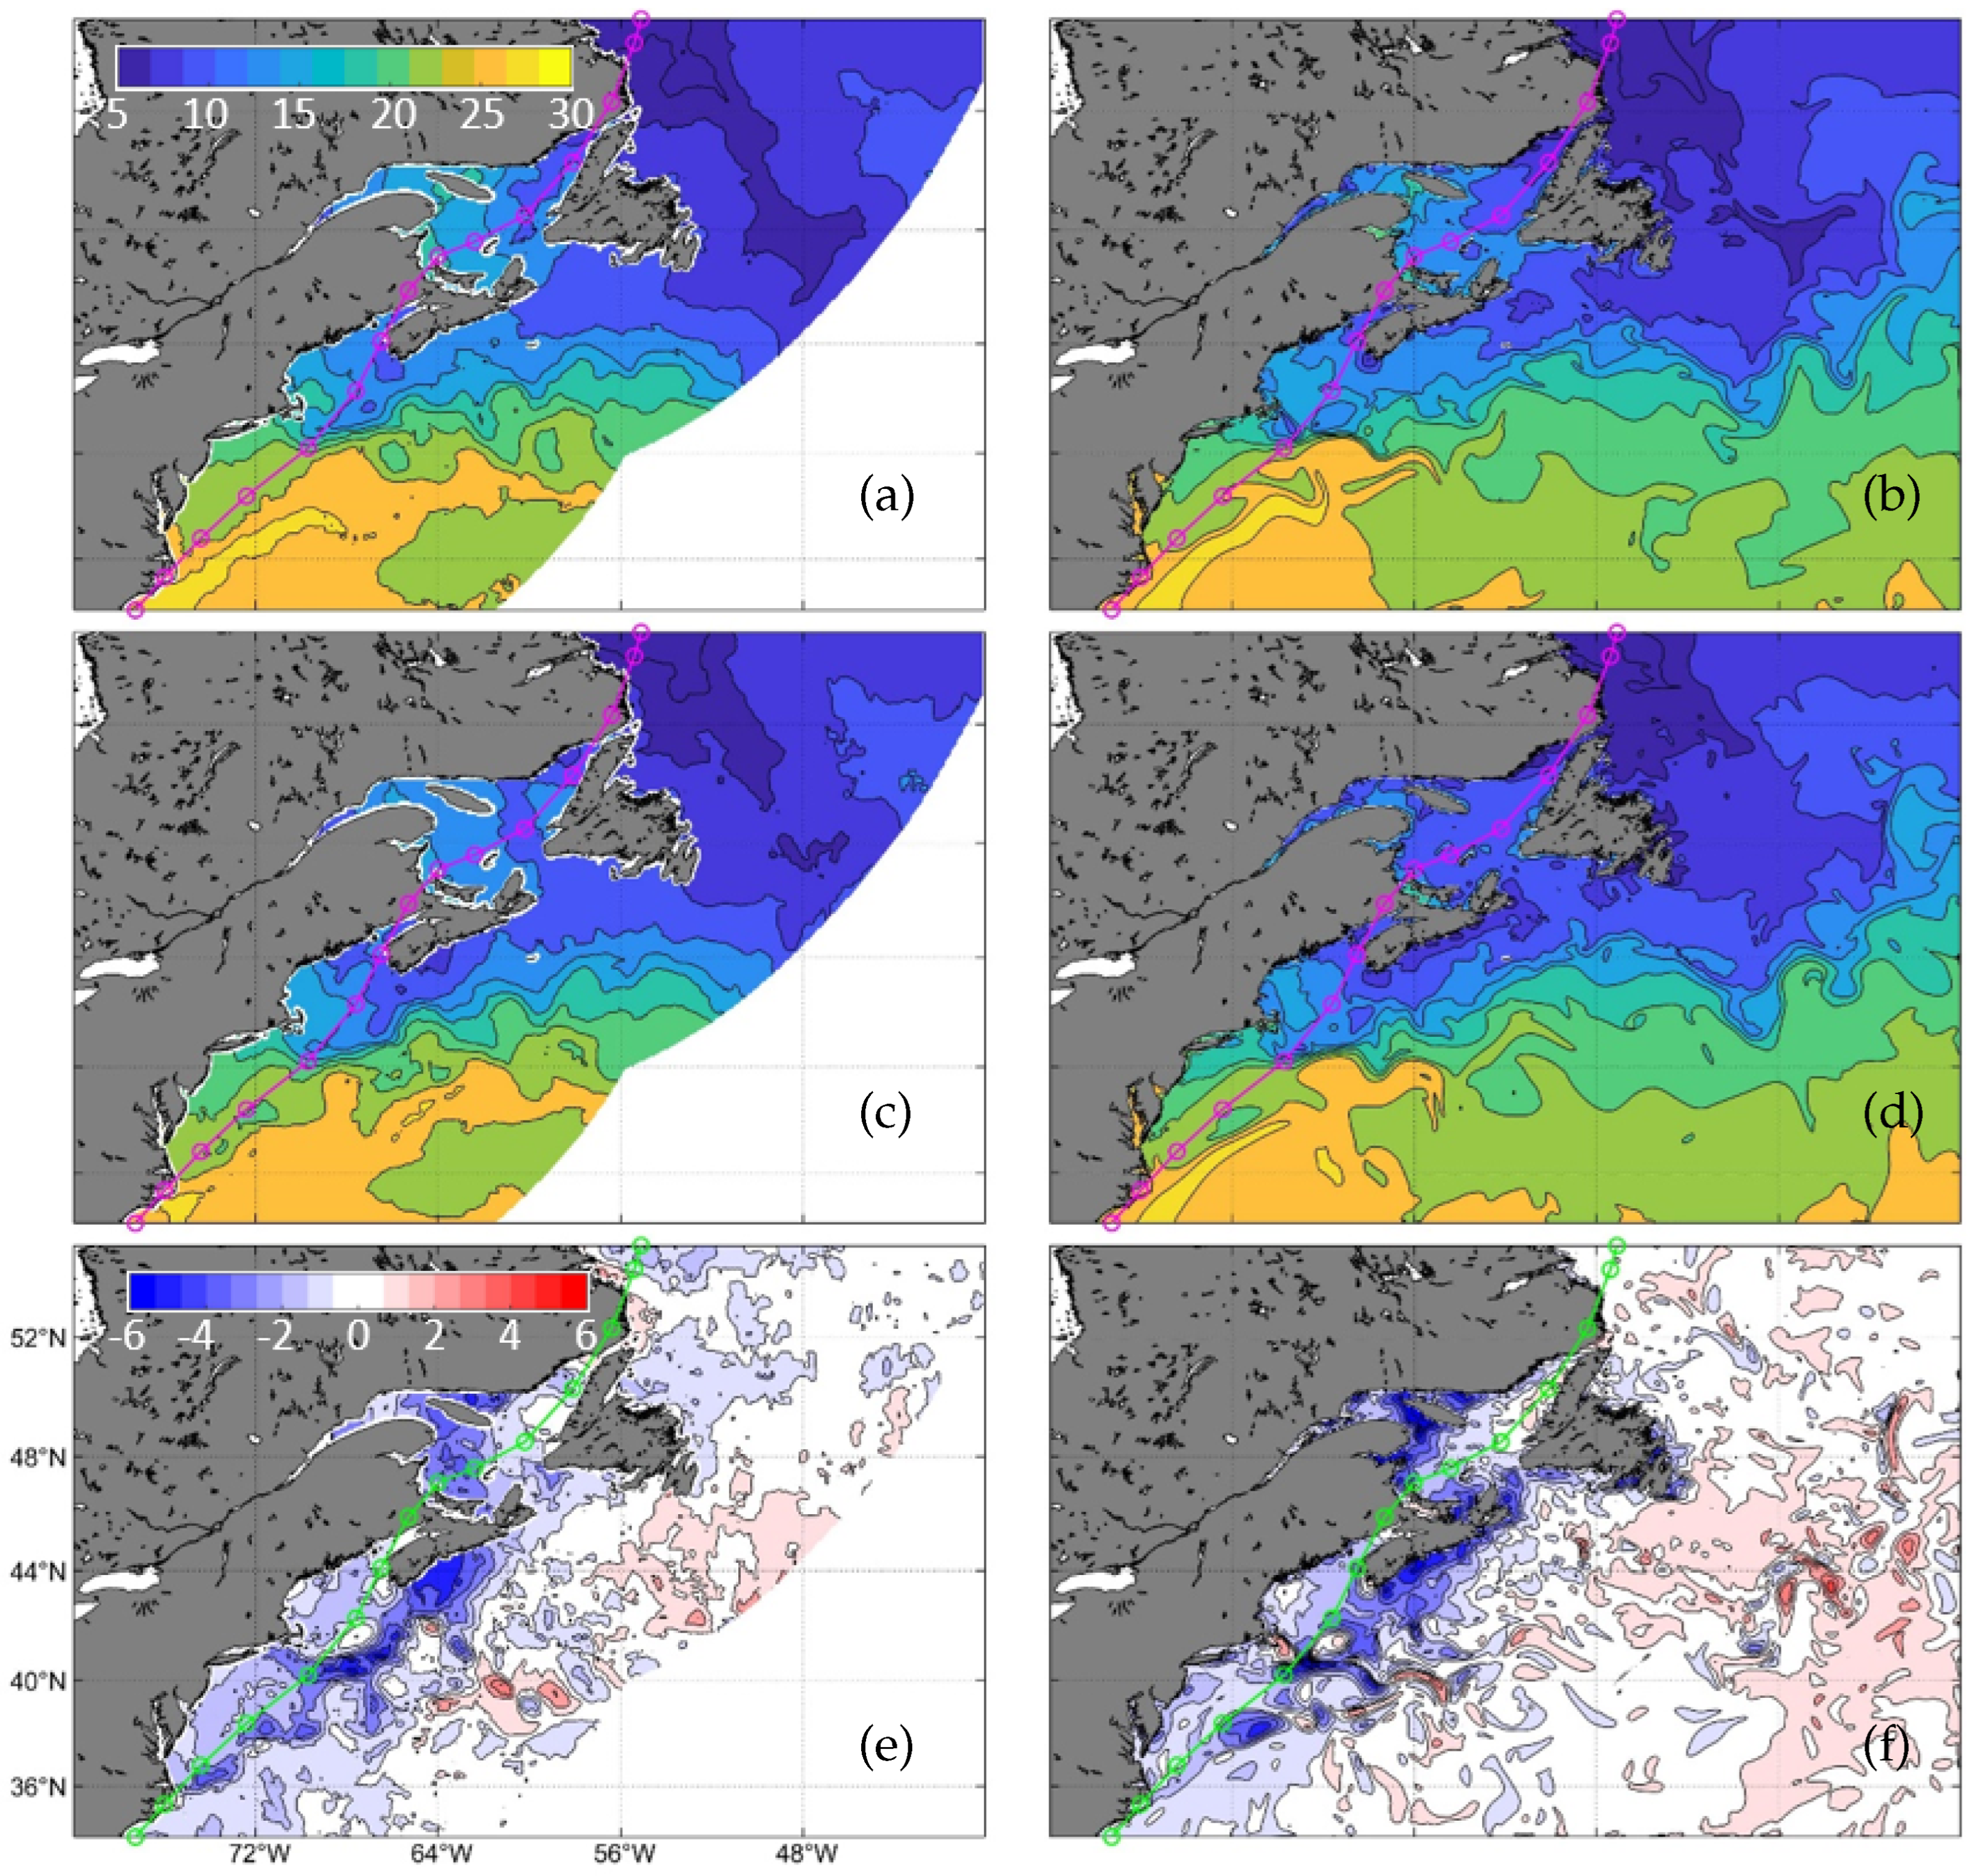
The international MAXSS (Marine Atmospheric eXtreme Satellite Synergy) Project funded by the ESA has an archive of analyzed satellite data for major storms from 2009–2020 (
https://data-maxss.ifremer.fr/added_value/storm-wake/) [
60] e.g., (accessed on 1 March 2023). These satellite remote sensing data include the SST as well as changes in the SST due to Hurricane Arthur. The pre-storm SST (SST
pre) and post-storm SST (SST
post) as well as the difference (
SST = SST
post− SST
pre) between the MAXSS SST data and CWMS-NWA results are shown in
Figure 15. Here, SST
pre denotes the pre-storm SST averaged between 06:00:00 30 June 2014 and 06:00:00 5 July 2014. SST
post denotes the post-storm SST averaged between 06:00:00 5 July 2014 and 06:00:00 10 July 2014.
The warm waters carried by the GuS are visible in both the observed and simulated fields of SST
pre and SST
post (
Figure 15a–d). Over the southwest part of the model domain and off the coast of North Carolina, the high SST in both the MAXSS observations and model results suggest the intense northeastward jet as part of the GuS. Large differences occur however in the simulated and observed positions of a large-size meander. The meander is close to the storm track and centered at ∼70° W, ∼38° N in the simulated SST
pre (
Figure 15b), but is further to the southeast and centered at ∼68° W, ∼37° N in the MAXSS observations (
Figure 15a). Large differences between the observed and simulated SST also occur with other small-scale features such as eddies separating the warmer water from cooler SST. These small-scale eddies are shaped differently and located in different positions in the model results than the MAXSS observations. These differences in the eddies and meanders in the SST
pre are due to the highly nonlinear nature of the ocean circulation. Pathways of the LaC are also visible in both the simulated and observed SST
pre. The LaC includes a cold SST at the northern boundary of the model domain along the coast of Labrador. This cold water is transported to the southeast along the shelf edge towards Flemish Cap. Multiple bifurcations of the LaC are visible to the east of Newfoundland in the MAXSS SST
pre data. One branch heads to the east and a second smaller and branch turns southwest along the coast of southeastern Newfoundland. The second bifurcation occurs to the east of the first bifurcation. At the second bifurcation, the main branch of the LaC continues eastward, while the rest of the cold water flows southward through Flemish Pass. Both the model results and MAXSS SST
pre show relatively warm water in the GSL. In the GoM and ScS relatively mild SST
pre occurs with slightly different cool anomalies such as the colder water along Georges Bank. CWMS-NWA reproduces the general distribution of the observed post-storm SST over the NWA (
Figure 15c,d), with relatively warm waters carried by the GuS and relatively cold waters carried by the LaC. Large differences however occur between the observed and simulated post-storm SST.
Noticeable differences occur in the observed and simulated locations and shapes of small-scale features in SSTpost. SSTpost is cooler along the RHS of the storm track than SSTpre for both the MAXSS SST data and the model results. Along the Grand Banks and Flemish Cap, the cold water from the LaC bifurcations is warmer than the SSTpre for both MAXSS and CWMS-NWA.
Examination of observed and simulated storm-induced changes of SST (
Figure 15e,f) shows that CWMS-NWA has skills in simulating the storm-induced cold wake, especially to the right of the storm track, and warm anomalies over Georges Bank and the southwest tip of Nova Scotia. The stronger storm-induced cooling ∼−4 to −6 °C covers a broader area of Georges Bank in the MAXSS SST data than in CWMS-NWA. Conversely, the SST cooling in the GSL near Anticosti Island is more intense in the model results (∼6 °C) than the observations (∼3 °C). CWMS-NWA does not reproduce the ∼1 °C cooling to the north of Newfoundland and along the coast of Labrador. The simulated
SST is also smaller than the observed storm-induced cooling on the LHS of the storm track in the MAB and GoM. Both the satellite and simulated
SST also have warming (∼1–2 °C) to the east of the cold wake. The observed storm-induced warm pattern between 56 and 64° W and ∼38 and 40° N is not in the simulated
SST. Instead, the simulated storm-induced warming is more dispersed than the satellite observations.
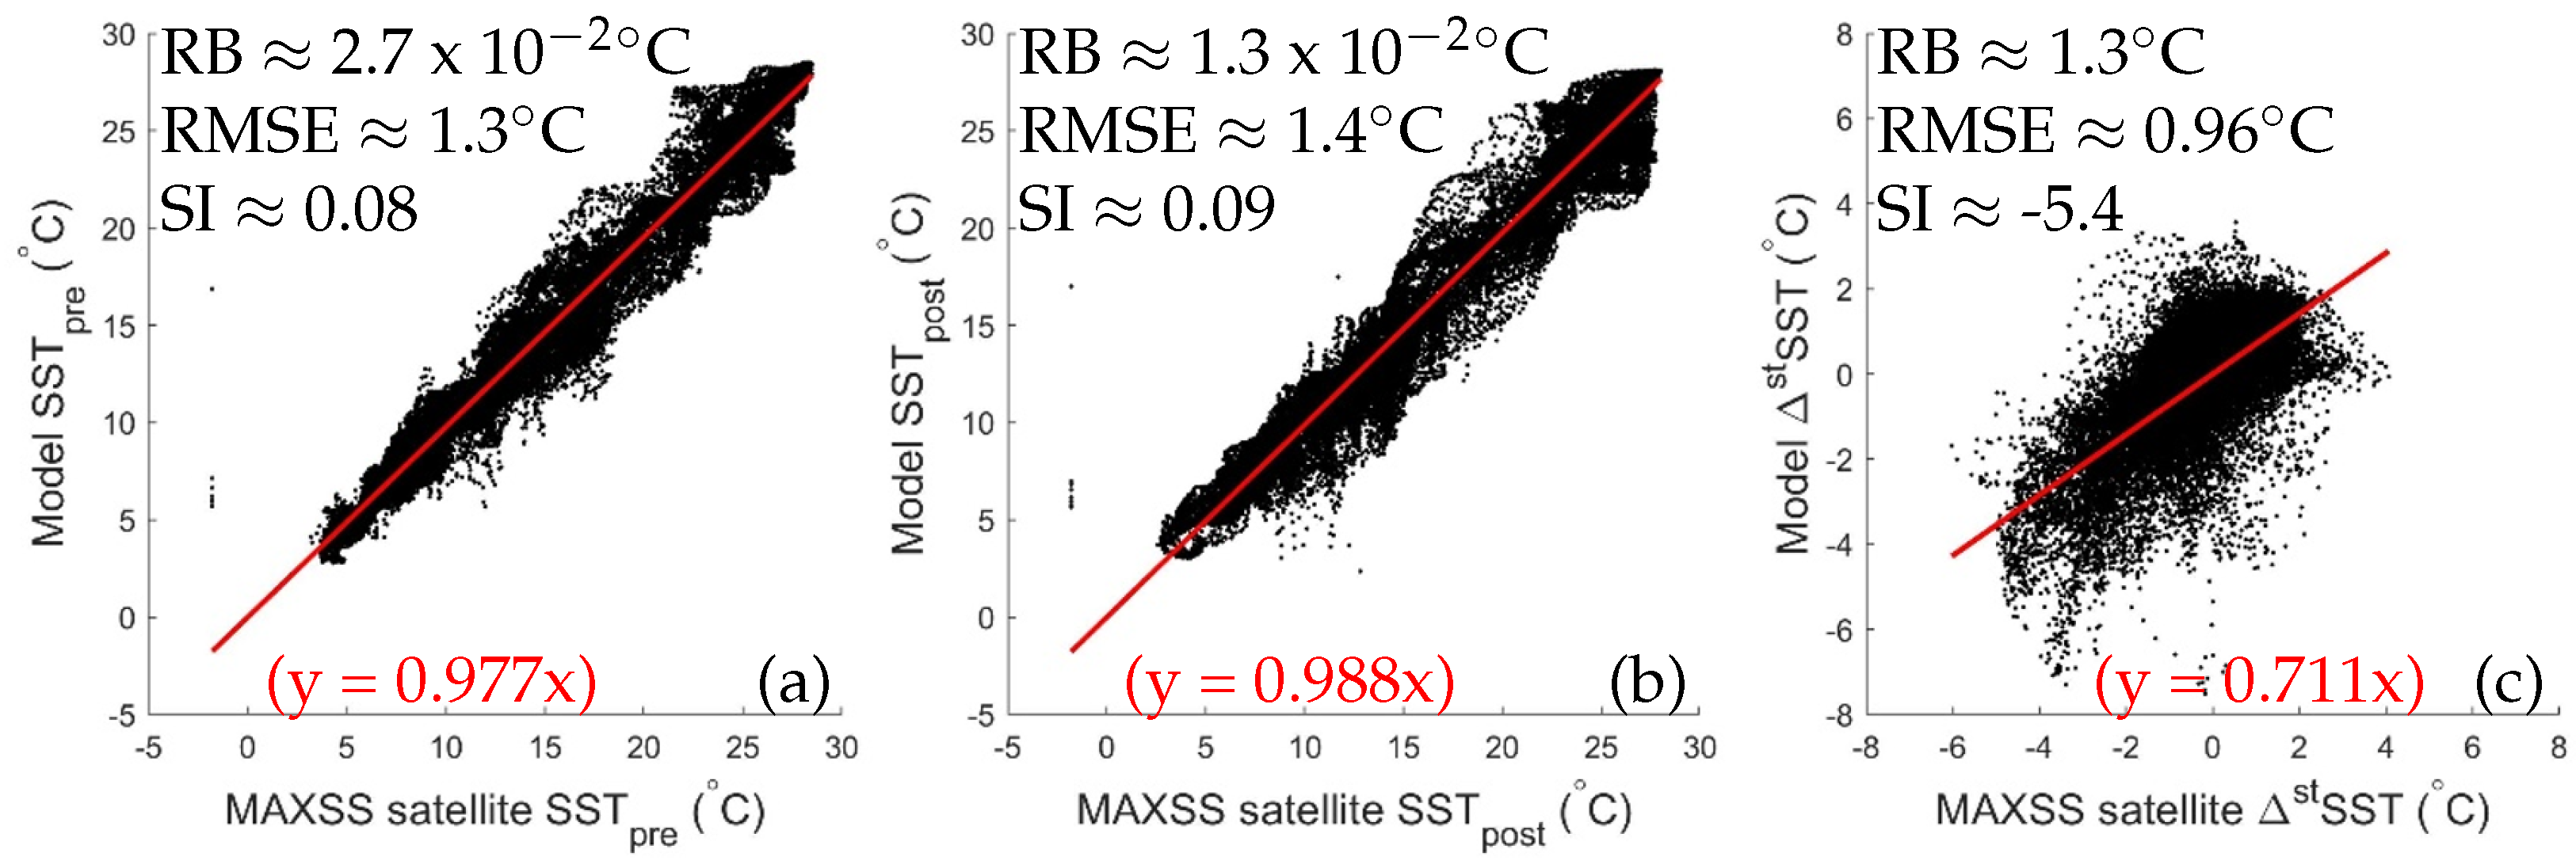
Comparisons of the SST
pre, SST
post and
SST between satellite data and simulated results are further examined in the scatter plots shown in
Figure 16a, b and c respectively. Both the simulated SST
pre and SST
post have small RBs (∼2.7
°C and ∼1.3
°C respectively) and SIs (∼0.08 and ∼0.09 respectively). The RMSEs of SST
pre and SST
post are not large either (∼1.3 °C and ∼1.4 °C respectively). By contrast,
SST has a larger RB (∼1.3 °C) and SI (∼−5.4) with a smaller RMSE (∼0.96 °C). Some of the RB in
SST in run FC results partially from underestimating cooling over Georges Bank. Another possible source of large RB for simulating
SST is the smaller region of cooling and the weaker magnitude of the cooling on the ScS in CWMS-NWA. The simulated
SST also does not have the large region of weak cooling (∼1 °C) to the north of Newfoundland and along the coast of Labrador in comparison with the MAXSS satellite data. Finally, the simulated cooling in the northwestern GSL is larger than the observations. There is also less cooling near the southern and northern boundaries produced by CWMS-NWA.
3.5. Model Performance in Simulating Currents
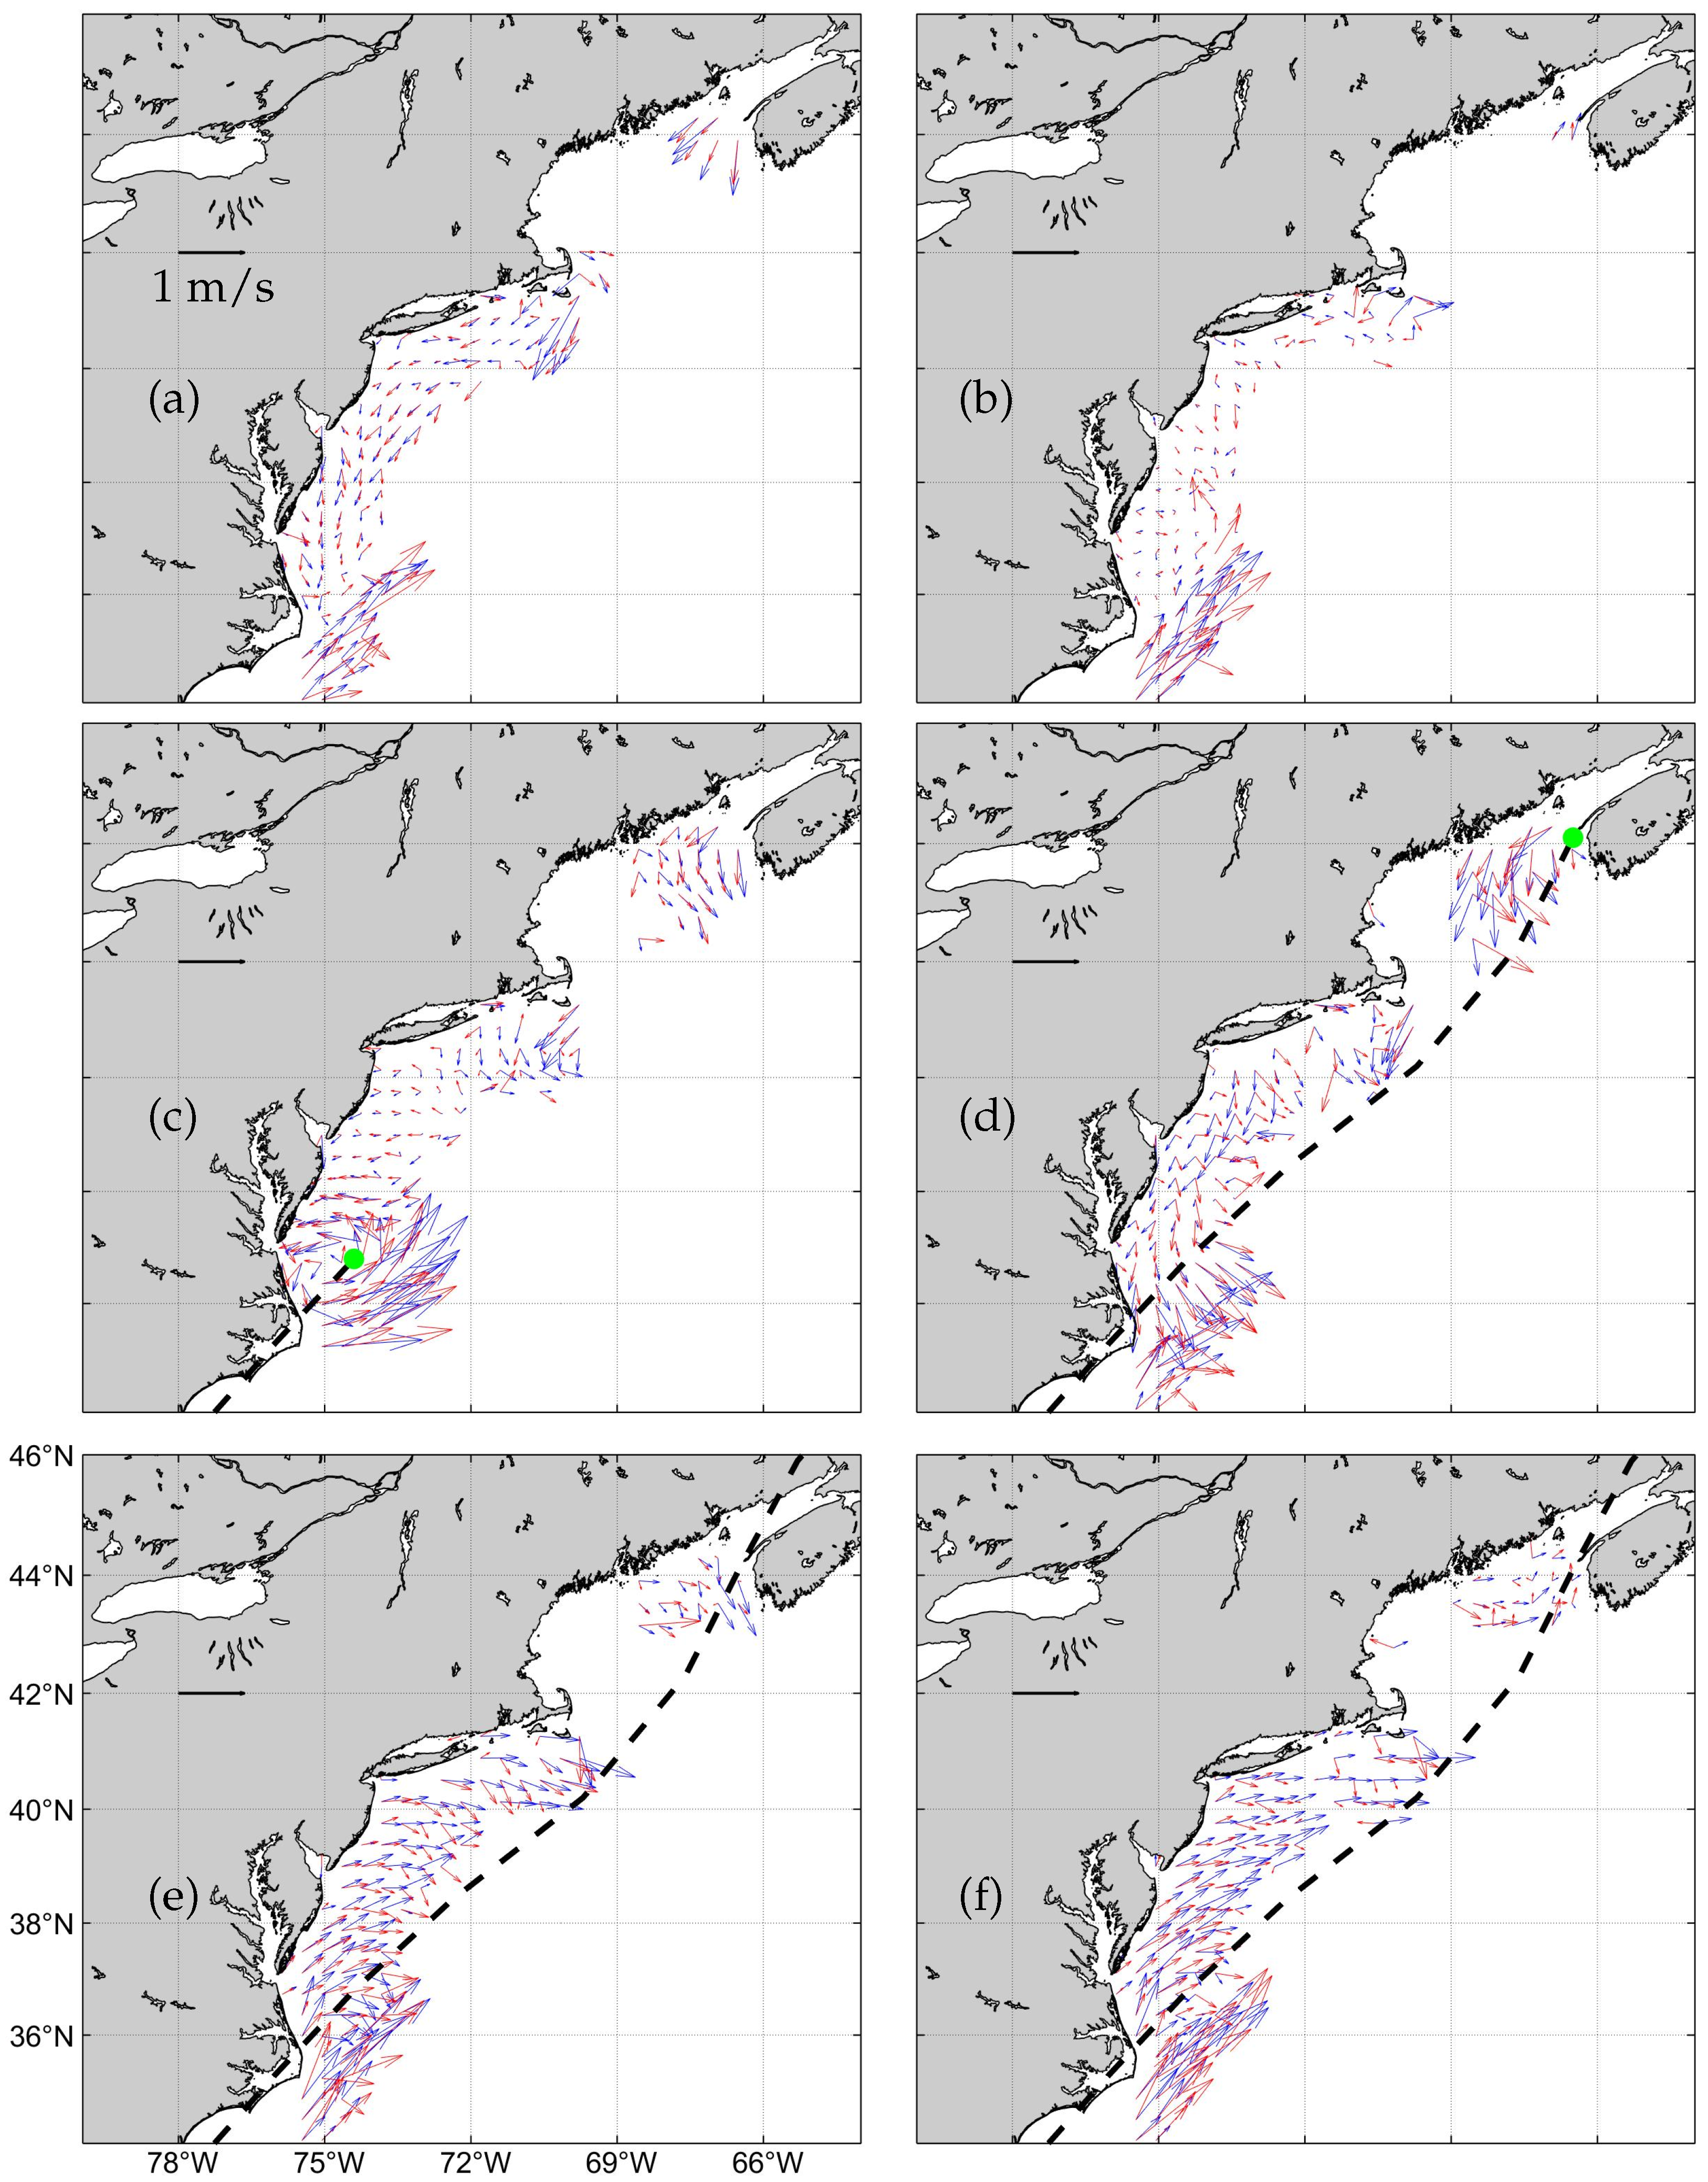
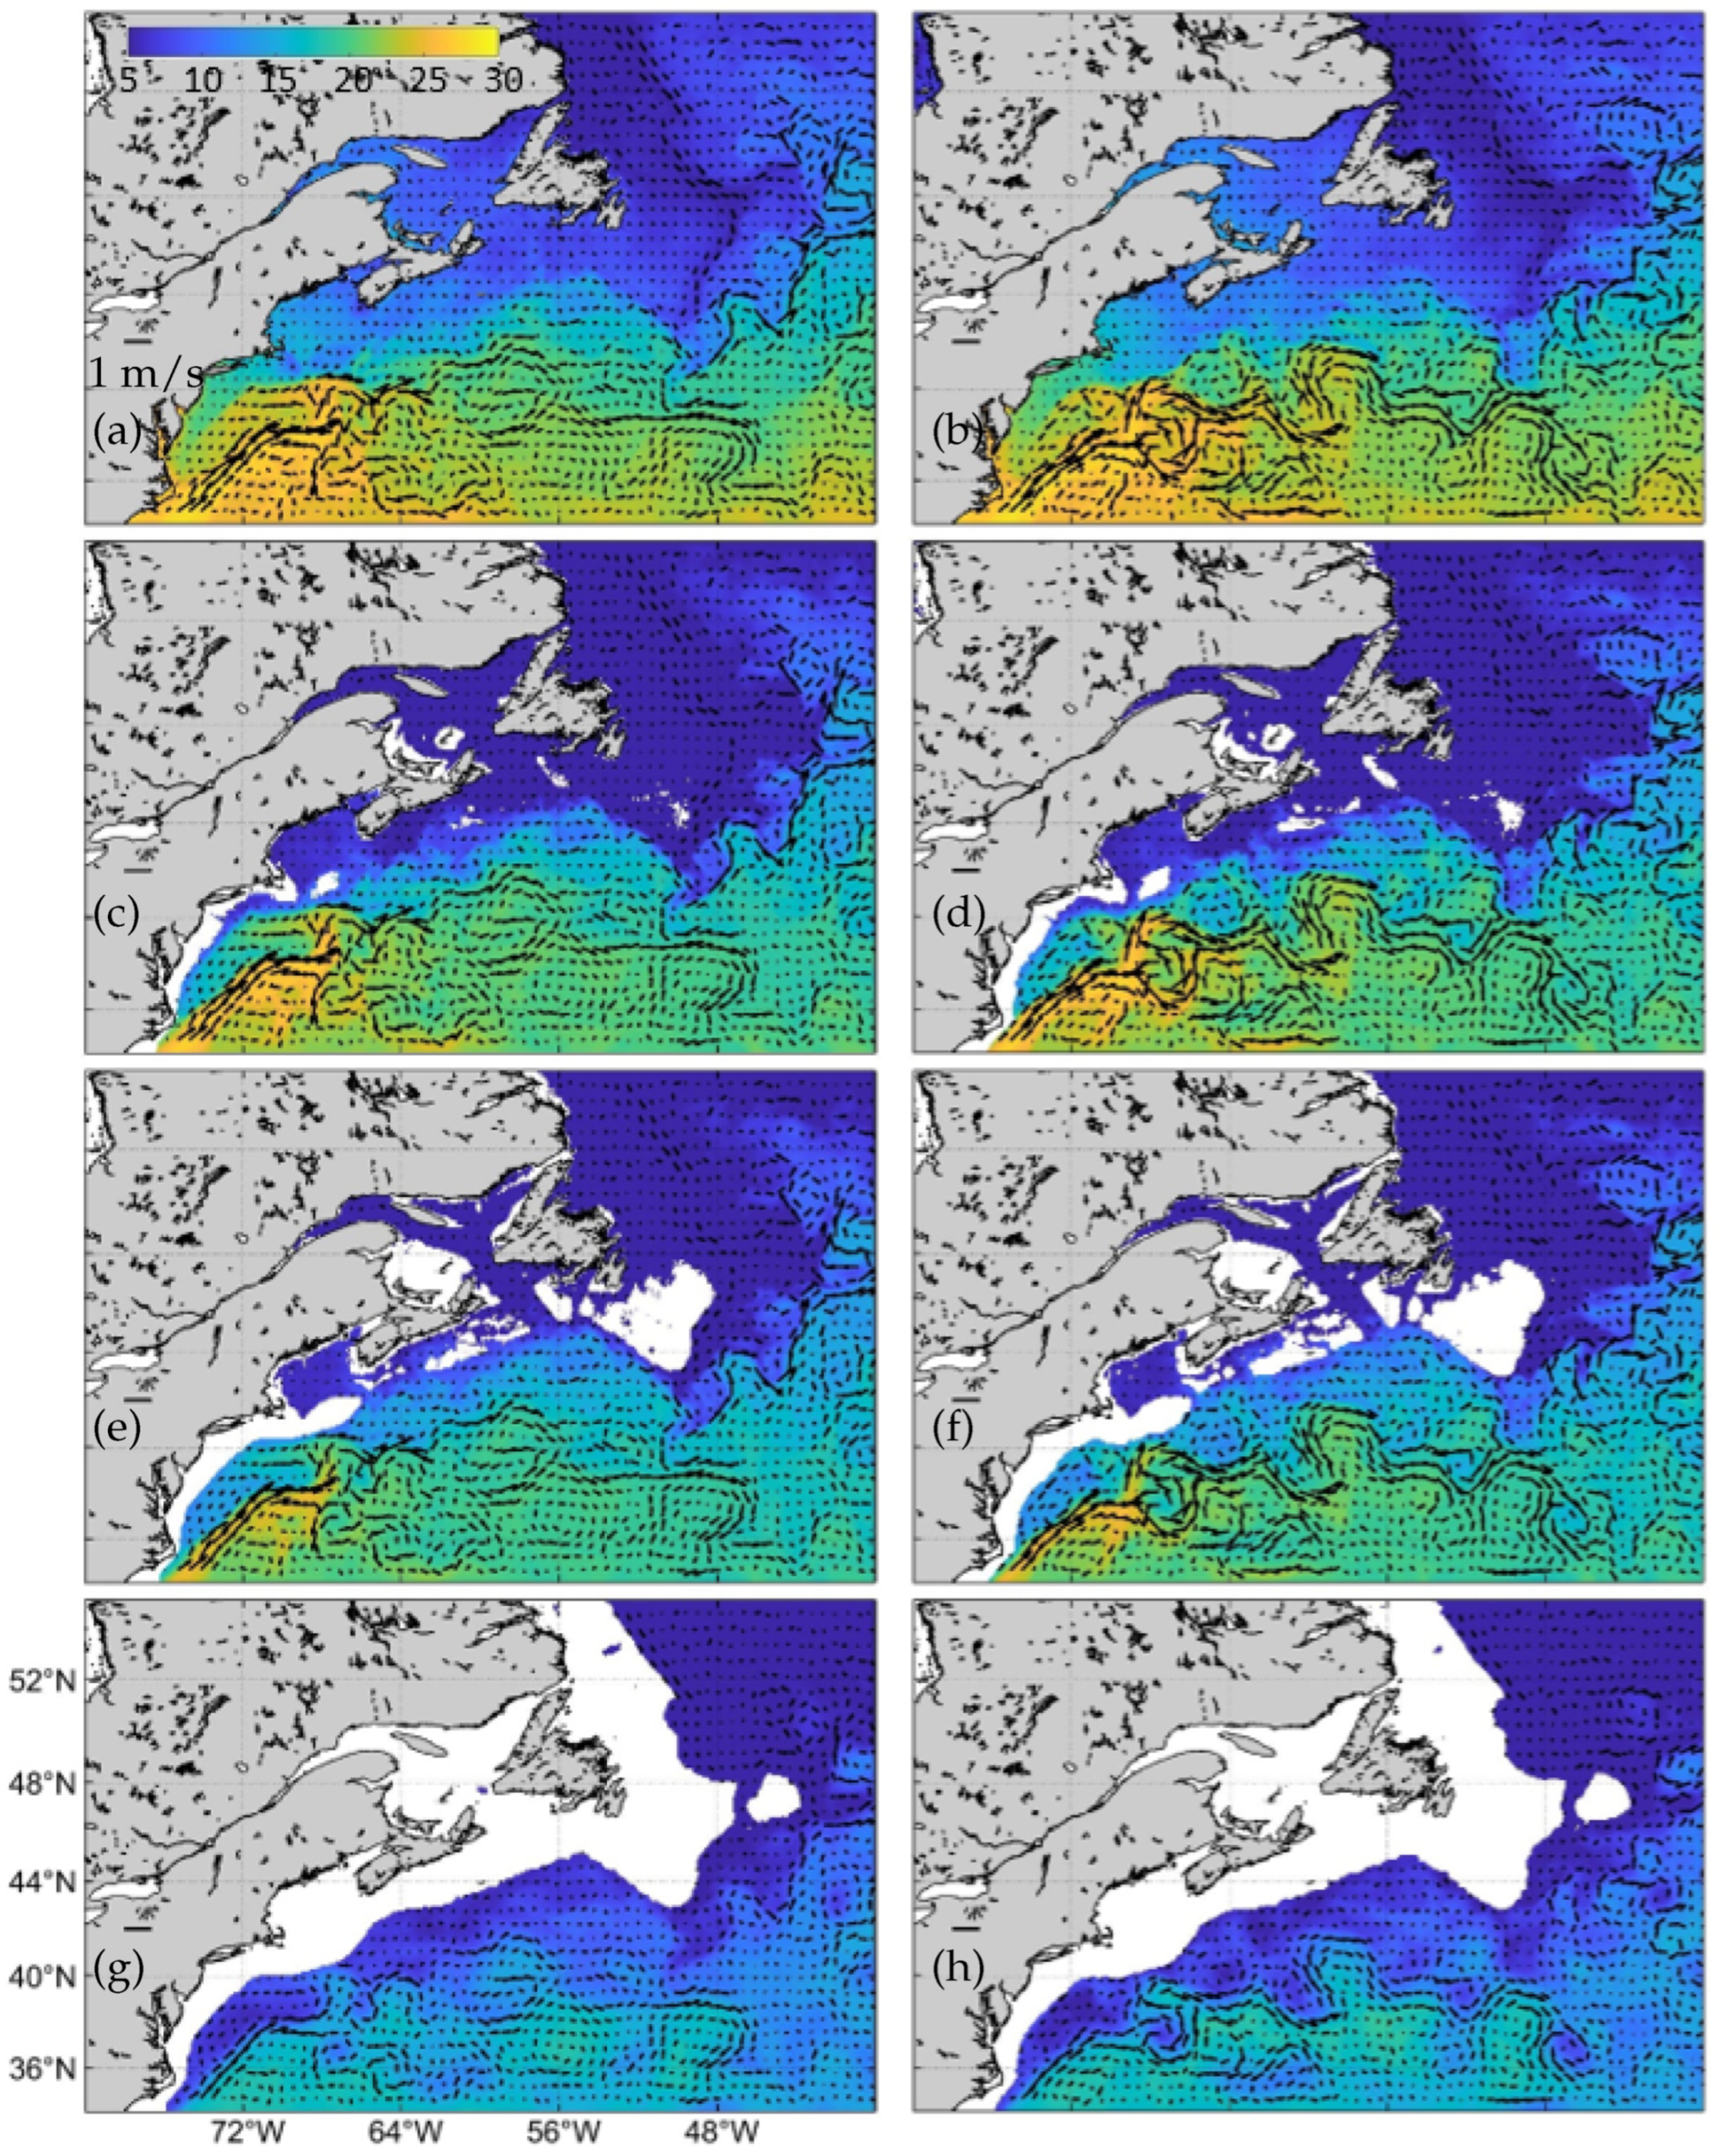
Since current measurements are very limited during this study period, the simulated currents are compared with counterparts in GLORYS to demonstrate the performance of CWMS-NWA. To properly validate the simulated currents, the weekly mean of both the simulated and observational currents during the pre-storm period (20–27 June) at several different depths are calculated from the results produced by CWMS-NWA and GLORYS (
Figure 17). Both CWMS-NWA and GLORYS have a
resolution and can reproduce the general circulation, including the GuS and LaC. It should be mentioned however, that GLORYS includes data assimilation but does not include tides, WECs and high-resolution wind input for Hurricane Arthur.
The weekly-mean pre-storm circulation produced by CWMS-NWA and GLORYS features similar large-scale currents over the NWA, including the GuS and LaC. The GuS is much weaker away from the boundary towards the middle of the domain (between 48° and 64° W) in CWMS-NWA than in GLORYS (
Figure 17a,b). By contrast, the LaC is stronger and much more defined in CWMS-NWA than GLORYS along the Newfoundland and Labrador Shelves and the slope of the Grand Banks. The eddies along the eastern edge of the model domain are different in CWMS-NWA than GLORYS reanalysis, especially over the region between 40° W and 48° W between 44° N and 48° N. Both CWMS-NWA and GLORYS have certain skills in simulating the NSC and SbC over the ScS and coastal currents in the Grand Banks, GSL and GoM. It should be noted, both CWMS-NWA and GLORYS have a 1/12° horizontal resolution and thus cannot resolve the small-scale features of the NSC or SbC. At 50 m depth, the coastal circulation is even weaker than at the surface (
Figure 17c,d). At 50 m, the GuS is very similar in both CWMS-NWA and GLORYS. The LaC at 50 m is weaker that the counterpart at the surface in both CWMS-NWA currents and GLORYS. At 100 m, the LaC produced by CWMS-NWA is significantly weaker than the counterpart at 50 m. The LaC in GLORYS is also weaker at 100 m than the counterpart at 50 m, which is similar to CWMS-NWA. At 500 m, the LaC produced by CWMS-NWA is very similar to the currents in GLORYS (
Figure 17e,f). The GuS is weak at 500 m in both CWMS-NWA and GLORYS. However, consistent with the surface and other depths, the GuS meanders are more defined in the open ocean in GLORYS than in CWMS-NWA.
The correlation is relatively low between the CWMS-NWA results and GLORYS. There is also slightly better agreement in the eastward component of the currents between CWMS-NWA and GLORYS than in the northward component. As mentioned above, the GLORYS reanalysis includes data assimilation while CWMS-NWA is prognostic without data assimilation. Another important difference is that CWMS-NWA includes tides and WCIs, while GLORYS does not. Thus, GLORYS lacks some important tidal-driven processes which are very important over our study region, particularly in the GSL, ScS, GoM and BoF. The wind velocity input in CWMS-NWA includes both background ERA5 wind and the high-resolution Moody’s HWind reanalysis. GLORYS does not use Moody’s HWind. Thus, GLORYS has less skills with large errors in the storm-induced currents. In addition, despite both CWMS-NWA and GLORYS having the same horizontal resolution of 1/12°, the topography is not necessarily the same and should lead to large differences in currents, particularly the directions. The above discussions suggest that GLORYS does not represent the true solution of 3D currents and hydrography over the NWA, particularly over the coastal and shelf waters.


