Abstract
Hybrid hydrogen–energy storage systems play a significant role in the operation of islands microgrid with high renewable energy penetration: maintaining balance between the power supply and load demand. However, improper operation leads to undesirable costs and increases risks to voltage stability. Here, multi-time-scale scheduling is developed to reduce power costs and improve the operation performance of an island microgrid by integrating deep reinforcement learning with discrete wavelet transform to decompose and mitigate power fluctuations. Specifically, in the day-ahead stage, hydrogen production and the hydrogen blending ratio in gas turbines are optimized to minimize operational costs while satisfying the load demands of the island. In the first intraday stage, rolling adjustments are implemented to smooth renewable energy fluctuations and increase system stability by adjusting lithium battery and hydrogen production equipment operations. In the second intraday stage, real-time adjustments are applied to refine the first-stage plan and to compensate for real-time power imbalances. To verify the proposed multi-stage scheduling framework, real-world island data from Shanghai, China, are utilized in the case studies. The numerical simulation results demonstrate that the proposed innovative optimal operation strategy can simultaneously reduce both the costs and emissions of island microgrids.
1. Introduction
Unlike terrestrial microgrids, standalone island microgrids are constrained by geographical isolation, leading to greater challenges in terms of resource integration, operational flexibility, and emergency response [1]. Owing to an underdeveloped infrastructure and their limited integration capacity, these systems, despite having access to an abundance of local renewable resources, remain vulnerable to climate variability and load fluctuations, jeopardizing supply security and stability. The fragility of multi-energy island systems becomes greater with the increasing penetration of renewable energy [2] due to insufficient energy storage and dispatch flexibility. Therefore, a hybrid hydrogen–energy storage system, efficient renewable energy integration, and optimal energy scheduling are essential to maintain power balance and economic benefits for a low-carbon island.
Energy storage is considered an effective solution for addressing the limitations faced by multi-energy island microgrids [3]. Energy efficiency and operational flexibility are increased by integrating renewable sources with energy storage technologies, which also reduces uncertainties and operational complexity. Psarros et al. [4] utilized centralized energy storage to improve renewable integration in non-interconnected grids. Wang et al. [5] indicated that combining storage with diverse energy sources can reduce power fluctuations at a lower power cost. From a planning perspective, Barrera-Santana et al. [6] employed electric vehicles, batteries, and pumped hydro-storage in the Canary Islands to reduce the generation capacity that had previously been required by 50% and to increase noncarbon energy by 40%. Sihvonen et al. [7] used underground pumped hydro-storage and thermal storage to reduce the curtailment of renewables on Åland Island. Keiner et al. [8] outlined a net-zero energy plan for the Maldives by using floating photovoltaics (PVs) and wave energy. Frković et al. [9] used an electric ferry as a mobile battery storage device to achieve the decarbonized operation of island transportation and energy systems. Owing to the rapid development of hydrogen technology, hydrogen storage and production have become promising new solutions for compensating for power imbalance. Through hydrogen storage, reliance on conventional energy was reduced in the Froan Islands [9], and the decarbonization of Favignana Island was achieved through hybrid storage systems [10]. Sadeghi et al. [11] integrated hydrogen and electrical storage with desalination to satisfy demands for energy, water, and heat. Although energy storage technologies play an important role in stabilizing multi-energy island microgrids, optimal strategies are necessary for exploring the potential utilization of hybrid hydrogen–energy storage and improving the performance of low-carbon islands.
Efficient operation is critical for an island microgrid with increasing demand and various types of energy storage systems. Various optimization strategies have been applied to improve capacity allocation, energy management, and system stability. Ma et al. [12] optimized hybrid energy storage capacity using dual-layer variational mode decomposition and energy entropy methods. Ramu et al. [13] increased stability with artificial neural networks and bidirectional converters for energy exchange between batteries and supercapacitors (SCs). Robayo et al. [14] achieved a high- and low-frequency decomposition of power signals using discrete wavelet transform (DWT). As a result, the dynamic response and performance of hybrid energy storage systems were improved. Kim et al. [15] utilized DWT-based non-stationary signal decomposition to enhance the accuracy of detecting the remaining useful life of batteries. Peng et al. [16] proposed an enhanced multi-objective optimization strategy for an integrated energy system with multiple energy storage systems to obtain optimal decisions under different operational objectives. Ji et al. [17] achieved efficient load supply through predictive scheduling strategies for hybrid energy storage systems. Ding et al. [18] improved the economic performance and energy efficiency of a hybrid electric–hydrogen system with two-layer optimization. Emrani et al. [19] applied model predictive control to manage intermittent energy. Guven et al. [20] improved renewable energy integration by optimizing system performance with supercapacitors. Li et al. [21] proposed a solar biogas energy system with storage techniques to achieve cost savings and peak shaving. Kong et al. [22] applied deep deterministic policy gradient (DDPG) to continuously learn user demand response patterns and optimize real-time electricity pricing, enhancing economic efficiency and improving renewable energy integration. André et al. [23] made use of an enhanced DDPG framework with dual replay buffers and safety layers to achieve near-optimal cost optimization while significantly reducing computation time. Pompodakis et al. [24] proposed a discrete coordinate descent algorithm based on sensitivity to effectively reduce fossil fuel consumption and carbon emissions. Maïzi et al. [25] enabled 100% renewable energy on Réunion Island through long-term planning with storage and demand response. Kafetzis et al. [26] developed a hybrid automaton algorithm to manage renewables, lithium batteries (LBs), and hydrogen systems, thereby reducing fossil fuel utilization. Cabrera et al. [27] optimized wind farm layouts and storage strategies, increasing wind utilization and minimizing emissions. Wang et al. [28] employed a multi-stage stochastic method with carbon price uncertainty and offshore wind to support low-carbon transitions. Shahid et al. [29] optimized hydrogen and battery storage for continuous low-carbon operation on small islands. The significant potential for carbon emission reduction via hydrogen energy on island microgrids has also been explored. However, further research on the integration of hydrogen with other storage technologies under complex working conditions is needed.
As summarized in Table 1, existing research often focuses on specific aspects such as hybrid energy storage or hydrogen systems, with limited exploration of multi-stage optimization frameworks for full renewable utilization.

Table 1.
A summary of the literature.
To address this gap, this paper presents a novel algorithm for optimizing the operation of a multi-energy island microgrid, employing deep reinforcement learning and the discrete wavelet transform approach. In contrast to previous works [12,13,14,15,16,17,18,19,20,21,22,23,24,25,26,27,28,29], which focused on individual factors such as energy storage and hydrogen production, this study introduces an optimal multi-stage framework that leverages the impact of hybrid hydrogen–energy storage on island microgrid operation. Within this framework, the outputs of hydrogen production and the hydrogen blending ratio in gas turbines are optimized in the first day-ahead energy scheduling stage to compensate for the power fluctuations caused by renewables and loads in advance. In the second stage, a lithium battery (LB) and hydrogen production devices are utilized to smooth the power imbalance that occurs in the intraday period, and in the third stage, a supercapacitor is used to mitigate fast real-time power fluctuations. The main contributions of this paper are outlined as follows.
(1) A multi-time-scale optimization framework is proposed to optimize energy dispatch and increase renewable energy utilization. Different characteristics of renewable energy sources and storage devices are integrated across different time scales, yielding a novel construction method for island microgrids with high renewable energy penetration.
(2) A deep-learning-based algorithm is introduced for the optimal scheduling of the integrated hybrid energy storage system to reduce the operational cost and emissions of a multi-energy island microgrid. The operational performance is also improved under complex and uncertain working conditions.
(3) The DWT approach is employed to decompose power fluctuations across different frequency levels, increasing the ability of the microgrid to manage wide-ranging load variations and improving the efficiency of energy storage devices and renewable energy absorption. This decomposition and management method can further increase the utilization of the hybrid hydrogen–energy storage system, improving operational efficiency.
The remaining sections of this paper are organized as follows: The model of the multi-energy island microgrid model is described in Section 2. A multi-time-scale optimization framework for the island microgrid is introduced in Section 3. A hybrid deep learning-based solution method is presented in Section 4. Case studies are conducted in Section 5. The conclusions of this work are drawn in Section 6.
2. Problem Statement
2.1. Hybrid Hydrogen–Energy Storage-Based Island Microgrid
The focus of this study is to explore the potential of hybrid energy storage systems, including hydrogen storage systems, lithium batteries and supercapacitors, to compensate for intermittent generation in highly renewable-penetrated island microgrids. The configuration of the island microgrid is illustrated in Figure 1.
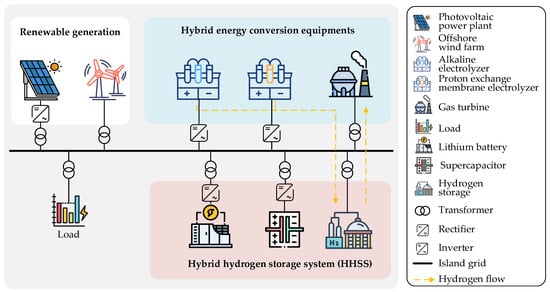
Figure 1.
The configuration of the hybrid hydrogen–energy storage -based island microgrid.
Note that the island system operates in off-grid mode, compensating for renewable fluctuations via electricity–hydrogen conversion to ensure 100% load coverage. Generated PV power is fed into the AC grid through a DC–AC converter, whereas generated power from wind turbines (WTs) undergoes a step-up voltage process before integration. To address prolonged periods of low renewable output and prevent load losses, a gas turbine acts as a last-resort backup. Renewable intermittency across various time scales is managed by a hybrid hydrogen storage system, which includes hydrogen storage, hydrogen production, lithium batteries, and supercapacitors. Long-term fluctuations are addressed by hydrogen storage systems, medium-term imbalances are mitigated by lithium batteries, and real-time fluctuations are compensated by supercapacitors. This integrated approach ensures a balanced and reliable power supply by addressing long-term, medium-term, and real-time power fluctuations.
2.2. Multi-Stage Optimization Framework
In a multi-energy island microgrid, fluctuations in solar and wind energy disrupt the balance of power supply and demand, resulting in instability problems. Moreover, limited storage capacity and dispatch flexibility hinder adaptation to significant load and weather variations. Accordingly, an optimal multi-time-scale operation method for various types of storage devices is proposed in this paper for island microgrid power management, as shown in Figure 2.
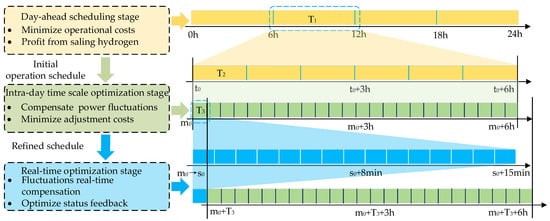
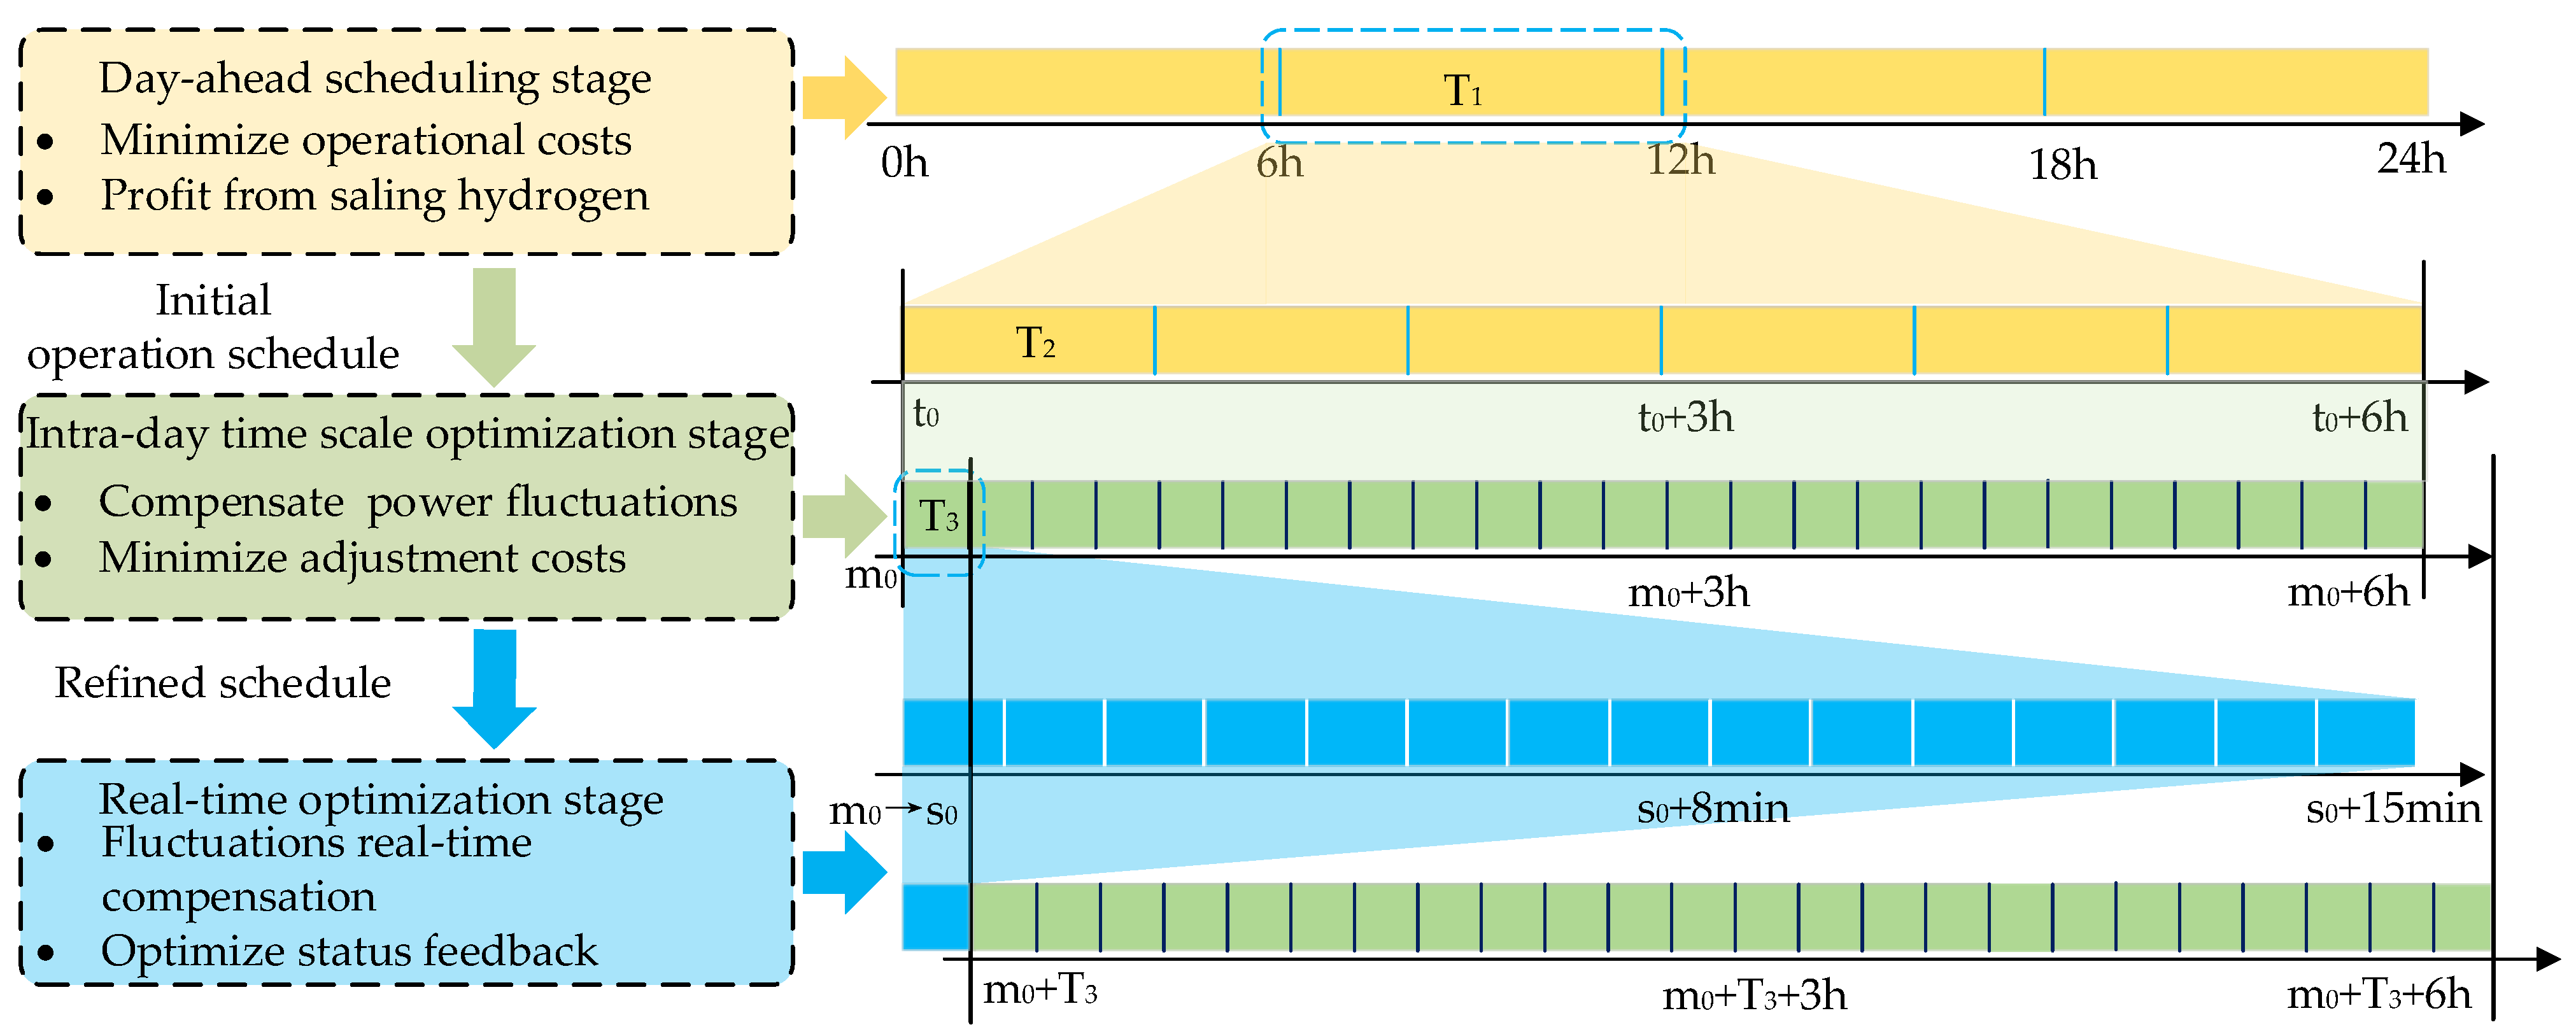
Figure 2.
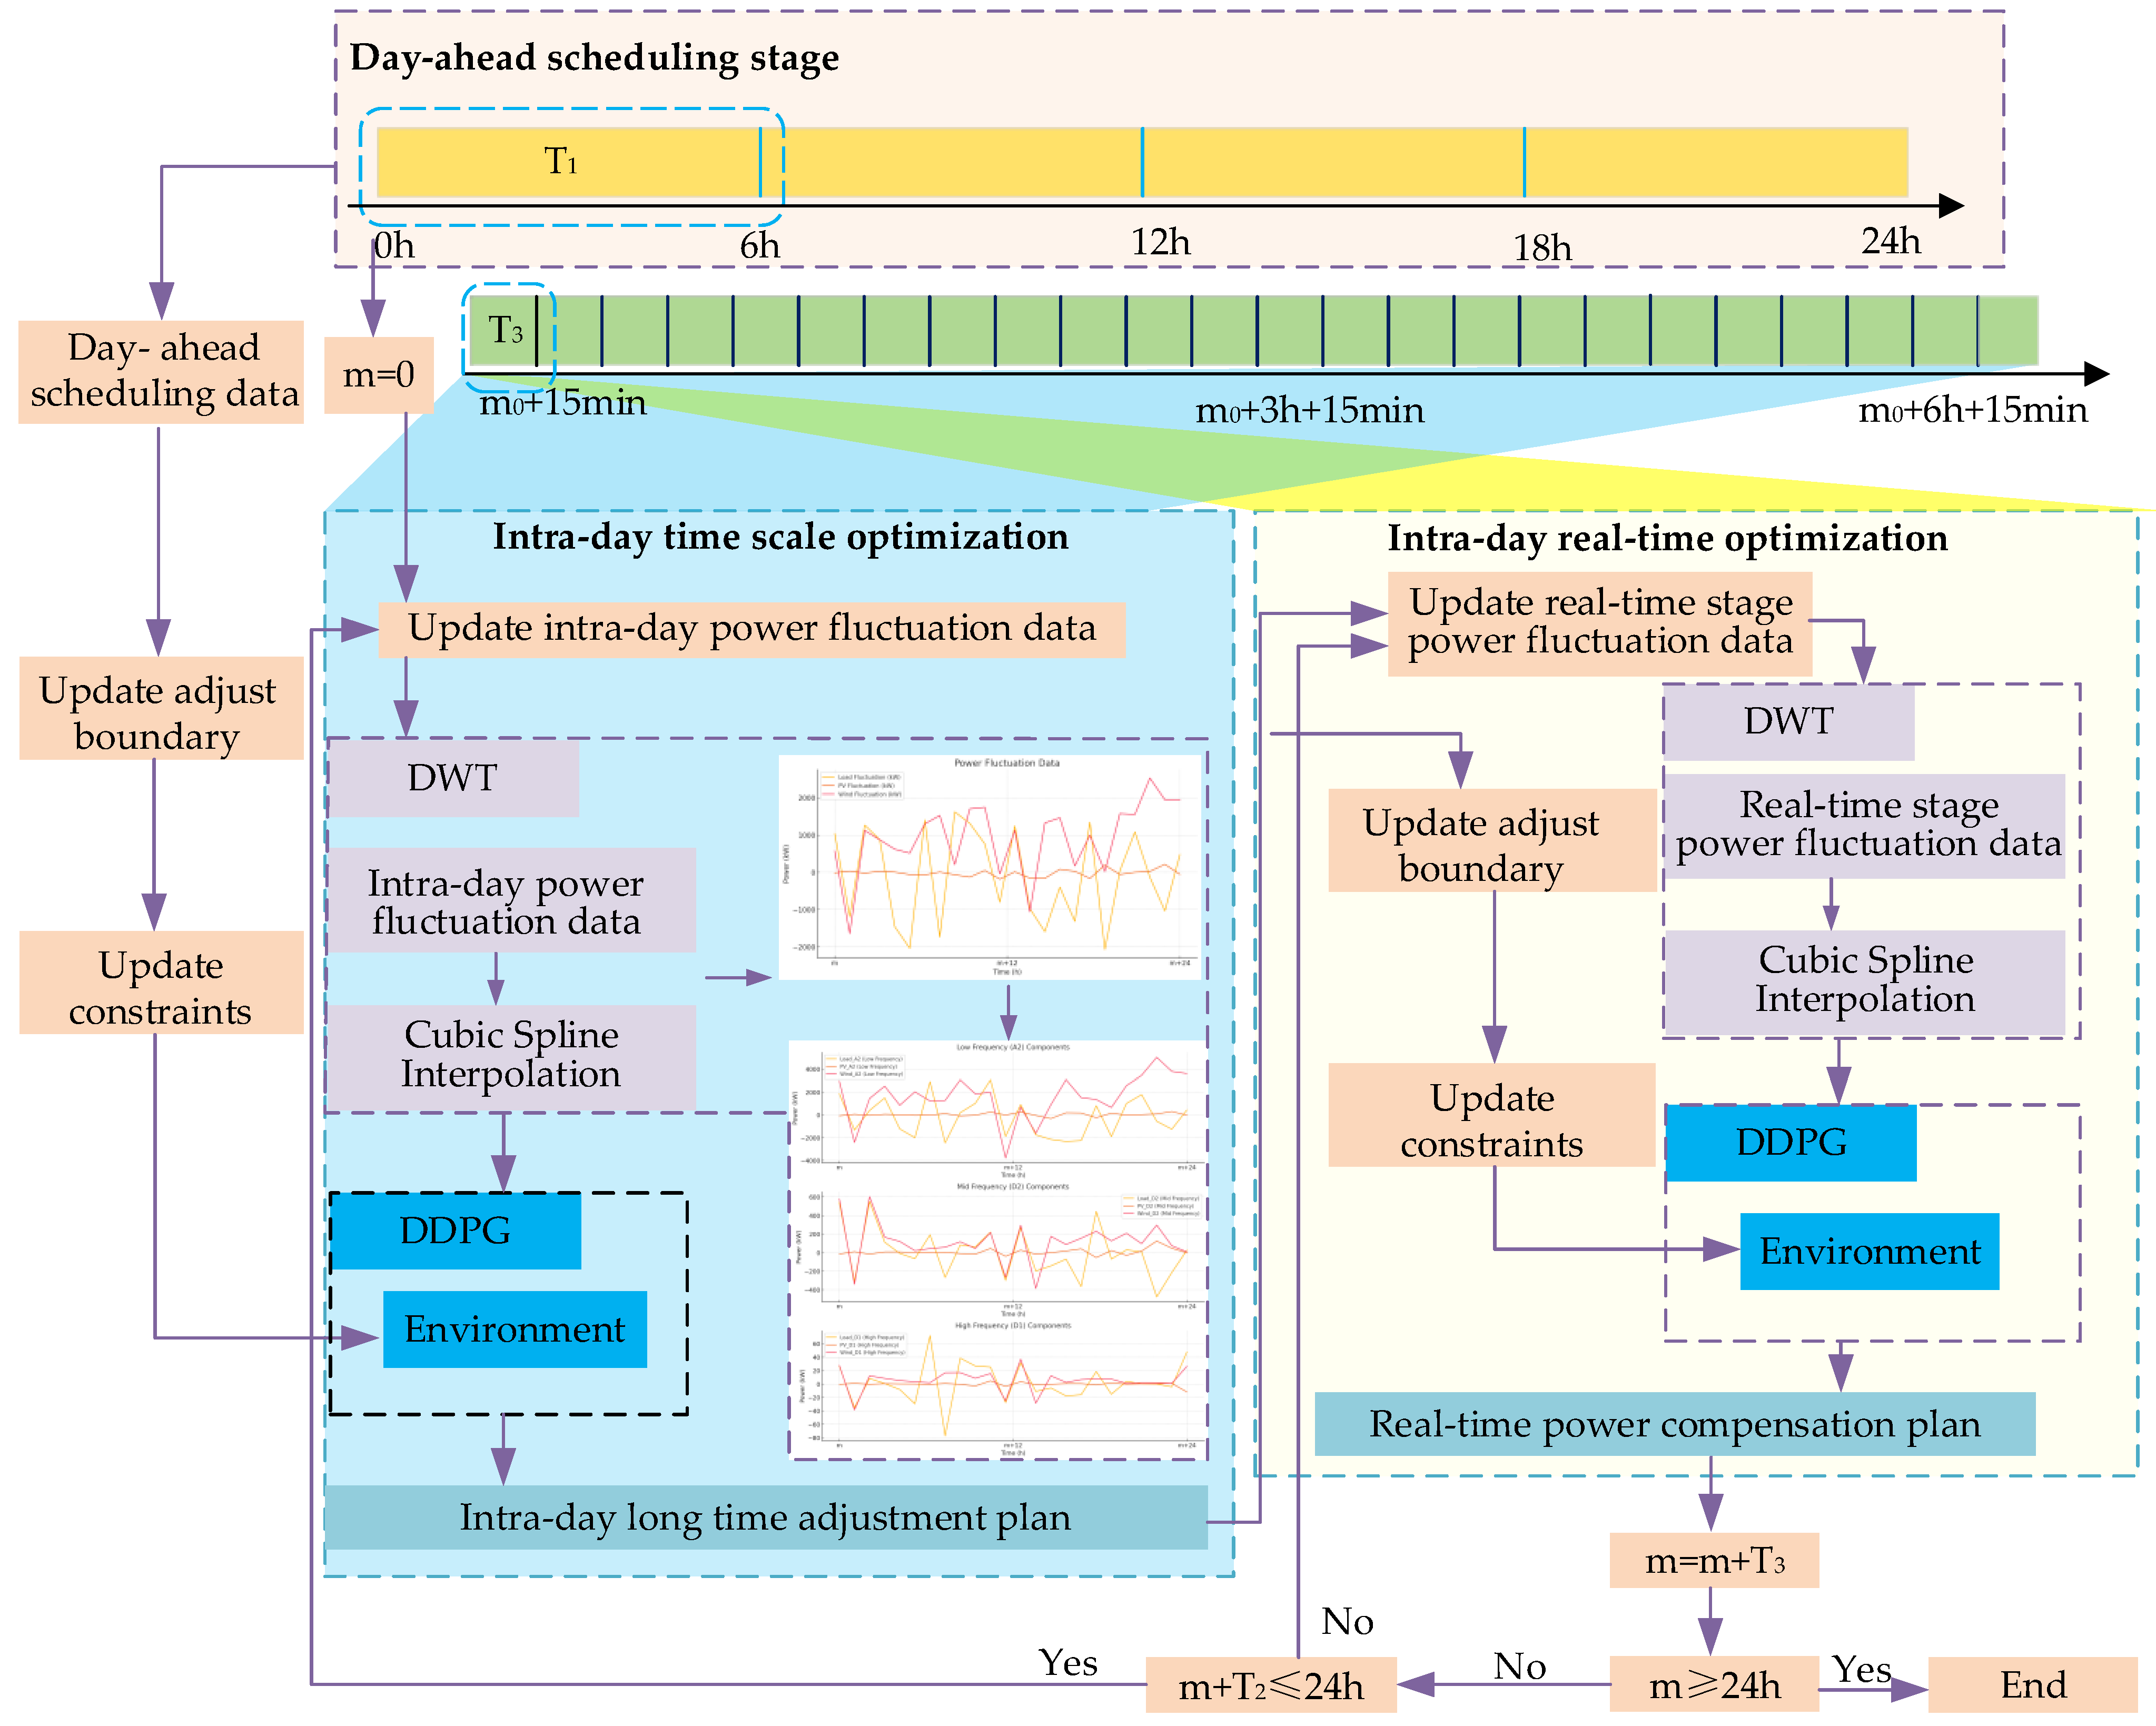
Multi-time-scale optimization framework for island microgrids.
Figure 2 shows that the proposed optimal multi-time-scale operation framework divides power management into three distinct stages, each tailored to address power fluctuations at a specific time scale by leveraging the response characteristics of various energy storage and conversion devices. The day-ahead scheduling stage operates using 1 h scale optimization to minimize operational costs and to optimize hydrogen production for revenue generation. Based on this schedule, the first-stage intraday optimization operates using 15 min scale optimization to mitigate power fluctuations, and using lithium battery and proton exchange membrane electrolyzer devices. The real-time adjustment stage, as part of the rolling optimization process, operates at a 1 min resolution and utilizes supercapacitors and lithium batteries to address fluctuations within the 15 min window. Feedback from the real-time adjustment stage is incorporated into the intraday optimization stage, creating a dynamic two-stage rolling optimization process that enhances system responsiveness and stability.
3. Mathematical Formulation
This study addresses the variability in renewable energy prediction and the different response capabilities of equipment across various time scales in island microgrid operation. A multi-stage optimization model using hybrid hydrogen energy storage is proposed, which consists of a day-ahead scheduling phase and a two-layer intraday rolling adjustment phase. The goal is to ensure timely load response, enabling efficient low-carbon microgrid operation while minimizing operational costs.
3.1. Day-Ahead Scheduling Model
Hydrogen production and the hydrogen blending ratio in gas turbines are optimized in the day-ahead planning stage to ensure the efficient operation of the offshore island microgrid. The aim of the day-ahead planning stage is to minimize the costs of hydrogen production, storage, and gas turbine operation while satisfying the load demand of the island. The day-ahead scheduling problem is formulated as follows.
3.1.1. Objective Function of Day-Ahead Scheduling Model
3.1.2. Constraints
The optimal operation of a multi-energy island system is subject to electrical constraints and limitations that ensure the stability of this standalone microgrid. These constraints and physical rules are described below.
- Power balance:
- Constraints for gas turbines:
A gas turbine is used for hydrogen–natural gas co-combustion, enabling controlled hydrogen blending to reduce carbon emissions. The operational mode of the gas turbine is described by Equation (3), which describes the operational mode of the gas turbine during hydrogen–natural gas co-combustion. It ensures that the mixing ratios of hydrogen and natural gas sum to 1, the total volumetric flow rate equals the sum of the individual fuel flow rates, and the power output is determined by the turbine’s efficiency, the lower heating values of the fuels, and their volumetric contributions.
The operating power of the gas turbine is within the range described in Equation (4) [18], and the output variation of the gas turbine is limited by the ramp rate constraint, which is described in Equation (5). In addition, the startup power of the gas turbine is set according to Equation (6).
- Constraints for alkaline electrolyzers (ALKs) and proton exchange membrane electrolyzers (PEMs):
Since an ALK and a PEM have different response abilities, various types of hydrogen production devices are modeled in this paper to smooth out low-frequency power fluctuations. The hydrogen production model for the ALK and PEM is detailed in Equation (7), which integrates the input power over a given time interval while accounting for the electrolyzers’ efficiency and energy consumption, thereby accurately capturing hydrogen production and reflecting their dynamic operational characteristics.
The startup power limits for the ALK and PEM are defined in Equation (8), and the power ranges for hydrogen production by the ALK and PEM are specified in Equation (9). The start–stop constraints for the ALK and PEM are set in Equation (10), and the ramp rate constraints for the hydrogen production equipment are represented by Equation (11).
- Constraints for hydrogen storage:
The hydrogen storage tank model is used to calculate the input and output flows of hydrogen, accounting for storage losses and flow rate limitations, as illustrated in Equation (12).
The flow of the hydrogen storage tank is limited by Equation (13), and the capacity limit is given by Equation (14).
In summary, the day-ahead scheduling model is expressed by Equation (15).
3.2. Intra-Day Two-Stage Optimal Operation Model
A two-stage intraday optimal operation model is established in this paper to smooth out high-frequency power fluctuations, and it is solved by a hybrid rolling optimization method.
3.2.1. First-Stage Intraday Optimal Operation Model
The key step of first-stage intraday optimization is to adjust the power scheduling plan at the 15 min scale for power compensation on the basis of the day-ahead power scheduling results. In this stage, the decision variables (also referred to as the “here-and-now” variables) include the outputs of the PEM and the lithium battery corresponding to medium-frequency power fluctuations. The intraday first-stage optimization model is presented as follows.
- Objective function
- Constraints
The power balance in the first intraday stage is provided in Equation (17).
For the PEM in the first intraday stage, the frequency response range of the equipment should be considered, as shown in Equation (18).
The charging and discharging dynamics of the lithium battery are modeled in Equation (19) [30].
The operational constraints for the lithium battery are provided in Equations (20) to (22). The charging and discharging power constraints are outlined in Equation (20), the battery capacity constraint is presented in Equation (21), and the frequency response range is presented in Equation (22).
On this basis, the intraday-time scale optimal operation model is formulated in Equation (23).
3.2.2. Intraday Real-Time Optimal Operation Model
The first-stage operation decisions are obtained by solving the spatial scheduling problem. To further decrease the operational cost and emissions, the intraday real-time dispatch problem is formulated to smooth out 1 min interval power fluctuations. In this stage, the “wait-and-see” variables are determined, including the outputs of the lithium battery and supercapacitor. The detailed real-time optimization model is shown below.
- Objective function
- Constraints
The power balance constraint of the real-time dispatch stage is updated via Equation (25).
The supercapacitor provides rapid power compensation for sudden drops in renewable generation or large load connections, and the charging and discharging dynamics are modeled in Equation (26).
The operational constraints for the supercapacitor are provided in Equations (27) to (29). The charging and discharging power constraints are outlined in Equation (27), the battery capacity constraint is presented in Equation (28), and the frequency response range is presented in Equation (29).
On this basis, the real-time optimal operation model is defined in Equation (30).
4. Solution Method
4.1. Discrete Wavelet Transform-Based Power Imbalance Decomposition
DWT is a time–frequency analysis tool that decomposes signals across various frequency proportions, providing both time and frequency information [31]. Owing to its excellent ability to capture nonstationary signal variations, DWT has been applied in many research fields, such as energy forecasting, state estimation, fault detection, and differential protection. In this work, the power fluctuations in the island microgrid are decomposed into low-frequency, medium-frequency, and high-frequency parts for different time-scale optimizations.
More specifically, the Mallat algorithm-based DWT is utilized to decompose renewable energy and loads into various frequency components. To increase energy efficiency and system stability, these different-frequency power fluctuations are compensated by the hybrid hydrogen–energy storage system; the recursive process [32] is shown in Equation (31).
The procedure of the frequency decomposition strategy is detailed as follows:
- Decomposition for first-stage intraday optimization
Following the day-ahead scheduling results, DWT is used in the first intraday stage to decompose 15 min power fluctuations into three frequency proportions. Low-frequency power fluctuations are compensated by the hydrogen production device for long-term management, medium-frequency power fluctuations are mitigated by both hydrogen production devices and the lithium battery, and high-frequency power fluctuations are smoothed out by the lithium battery. The decomposition process is described in Equation (32).
- Decomposition for intraday real-time optimization
Owing to the limited response of PEMs to instantaneous fluctuations, supercapacitors are integrated with lithium batteries to manage rapid variations. DWT extracts three components of various frequencies from the 1 min power fluctuations for the supercapacitor and lithium battery, and the decomposition process is described in Equation (33).
4.2. Reinforcement Learning Method
Deep reinforcement learning algorithms are introduced below as follows: the Markov decision process is described, a concise explanation is given of the deep deterministic policy gradient algorithm, and the modeling approach for the algorithm is detailed.
4.2.1. Markov Decision Process
The Markov decision process (MDP) [33] is a mathematical framework for decision-making under uncertainty that is widely used in reinforcement learning. In discrete time, the MDP satisfies the Markov property, meaning that the next state depends only on the current state and action, not on prior states. The goal is to find an optimal sequence of actions to maximize the expected cumulative reward from a given initial state. The MDP model used in this study is defined as follows:
State (): The state space is composed of 11 features, which represent the current state .
Action (): The action space is denoted as , which represents the control over the ALK, PEM, and hydrogen blending ratio for the gas turbine.
State Transition (): The state transition process follows the dynamic model of the system, determined by , , and the physical constraints of the system, where . The state transition function includes the operational characteristics of each device, the ramp rates, the energy balance, and other physical constraints.
Reward (): is the feedback received by the agent after executing action , which is used to evaluate the quality of the action. In this study, .
Police (): The agent uses the policy function to determine the action to take in state , .
4.2.2. Deep Deterministic Policy Gradient
The DDPG algorithm is a deep reinforcement learning approach based on the actor–critic framework; it uses deep neural networks and deterministic policy gradients to solve continuous-action-space problems and is widely employed for energy management, battery control, and microgrid frequency stability improvement [34].
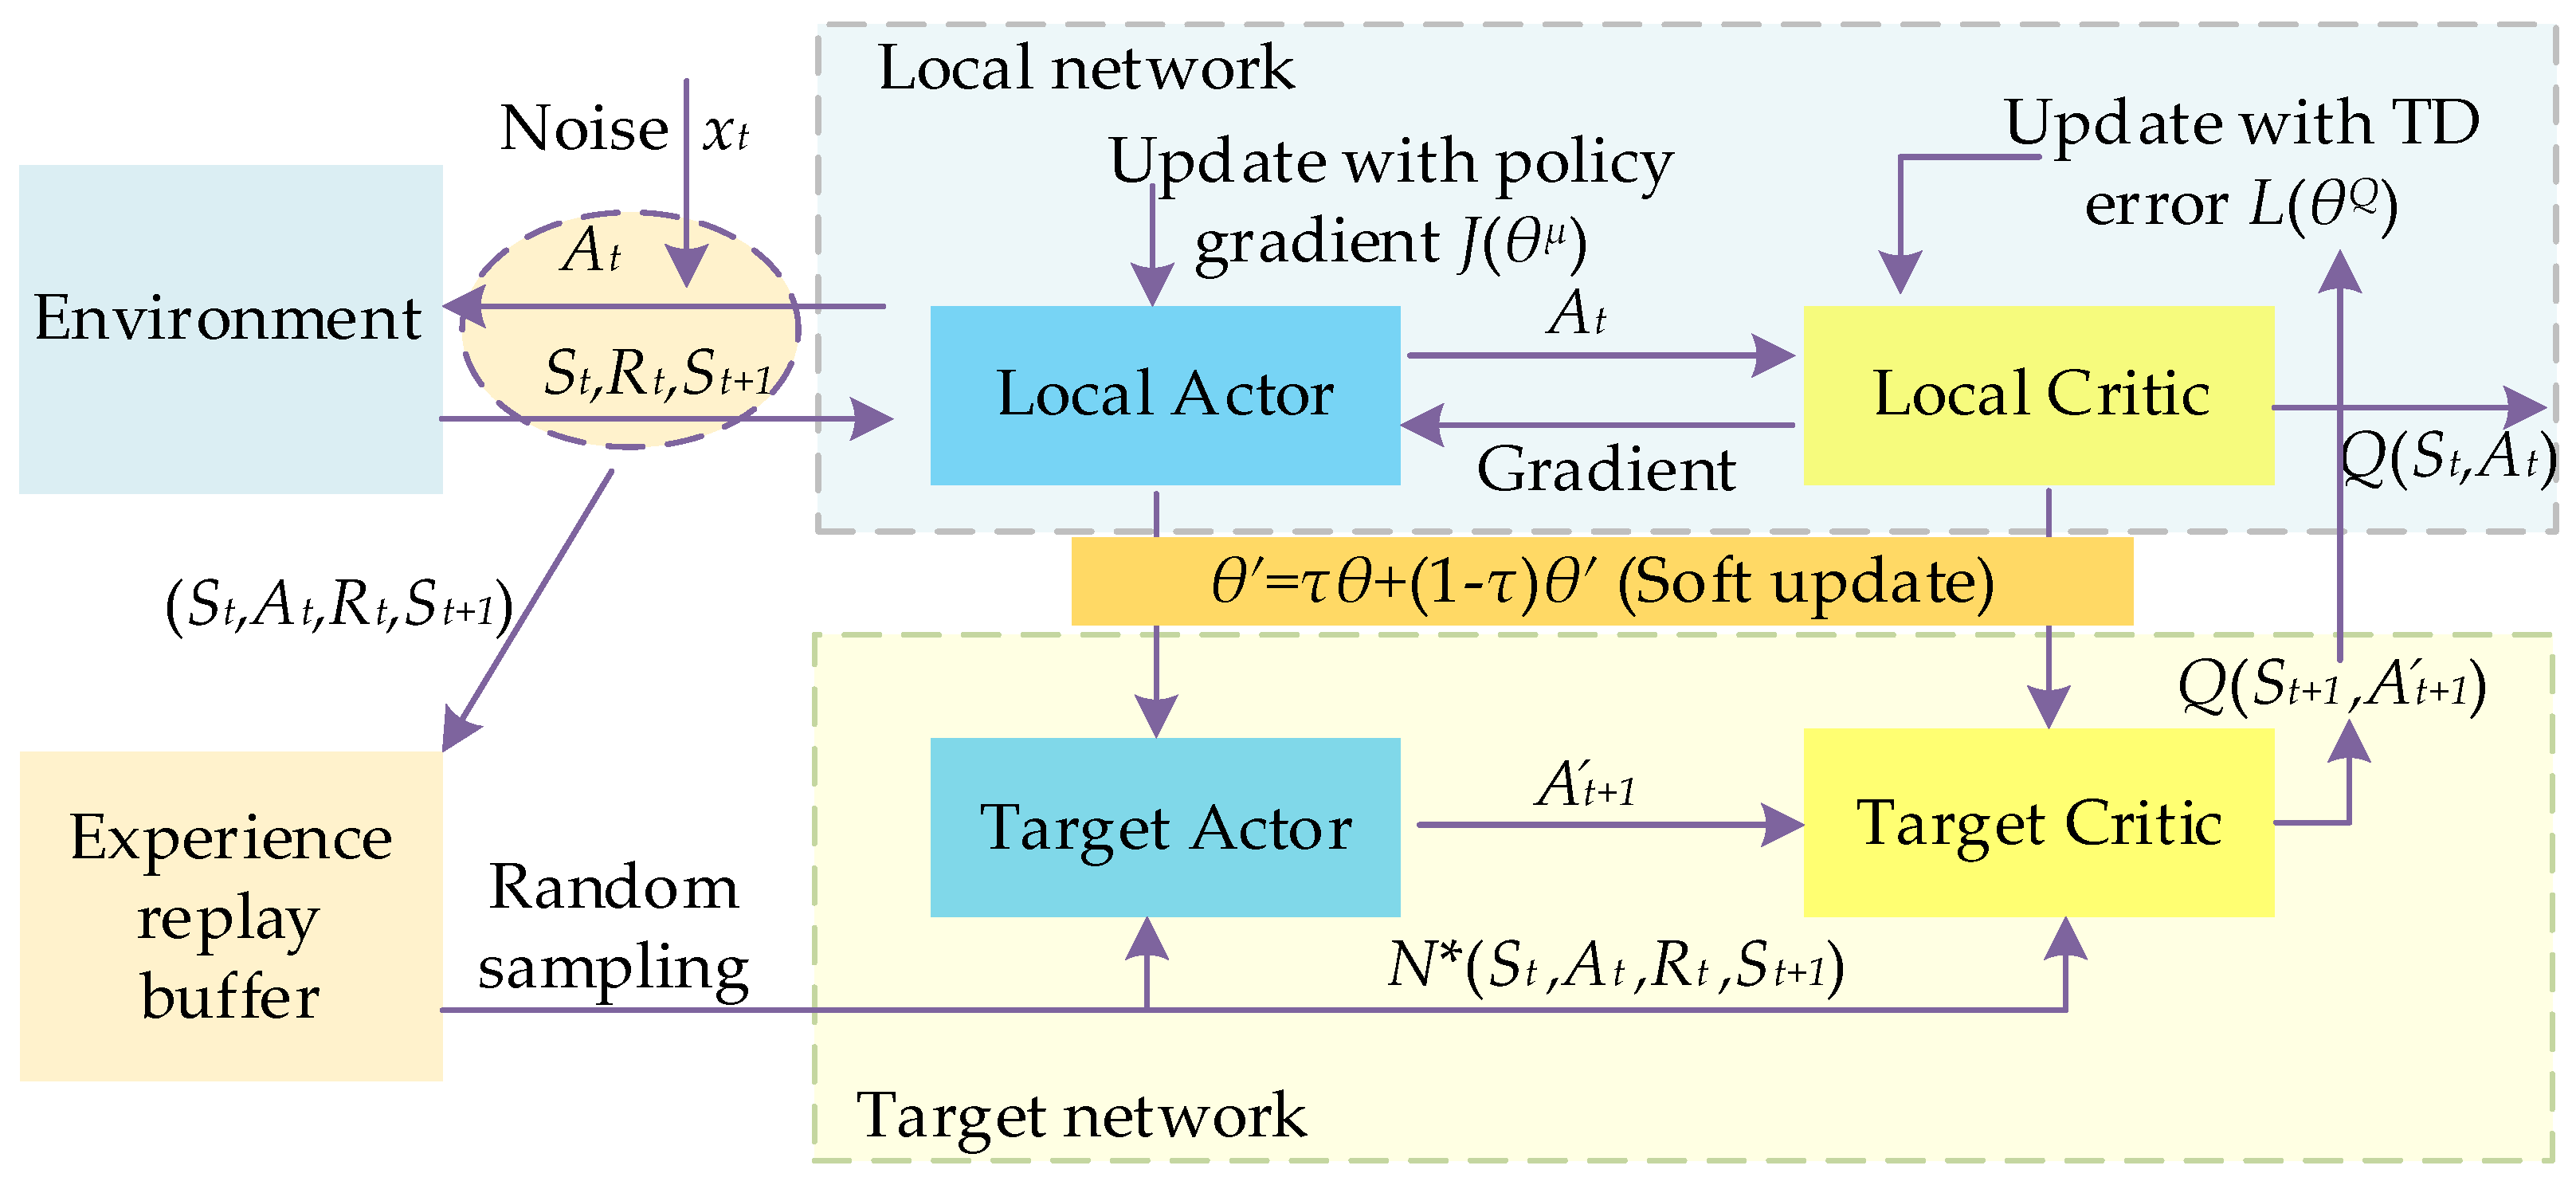
Training stability is improved in the DDPG algorithm by adopting a dual-network architecture, comprising an online network and a target network, with a soft update for the target network to mitigate instability during training. An experience replay buffer is used to store interactions, allowing for mini-batch sampling to reduce correlations and accelerate convergence. A deterministic policy framework is utilized to realize direct continuous action outputs, enhancing the efficiency of DDPG for decision-making in complex, high-dimensional environments. The DDPG architecture [35] is depicted in Figure 3.

Figure 3.
The algorithm architecture of DDPG.
As shown in Figure 3, action is generated by the local actor network. Ornstein–Uhlenbeck (OU) [36] noise is added to enhance exploration. The action is executed in the environment, the system state is updated, and a corresponding reward is returned. The interaction data () are stored in the experience replay buffer. is the target action generated by the target actor network under state . During each training step, a batch of experiences is sampled from the buffer for training. The target critic network is used to approximate the state-action pair at + 1. The local critic network updates on the basis of to minimize the temporal difference (TD) error. The local critic network is optimized by the network loss function defined in Equation (34) [37].
The policy gradient method is applied by the DDPG algorithm for network updates to optimize the actions of the actor network. The value gradient for the action generated by the local actor is calculated by the local critic network and backpropagated using the chain rule, allowing the parameters of the actor to be adjusted to maximize the value. The parameter update process is described in Equation (35).
Target networks are introduced with a soft update mechanism to ensure stability during training, allowing their parameters to gradually align with those of the local networks. This incremental adjustment promotes smoother changes and prevents instability throughout the training process. The parameter update process is described in Equation (36). Smooth adjustments in the target networks are ensured by the soft update mechanism, providing a stable learning target for the critic network and preventing large fluctuations in the value estimation.
4.3. Frequency-Decomposed Reinforcement Learning Method
The multi-stage framework with frequency decomposition is presented in Figure 4.
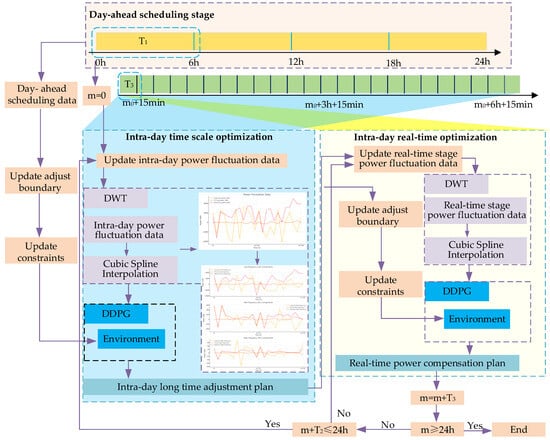
Figure 4.
Flowchart of multi-stage optimization framework with frequency decomposition.
As shown in Figure 4, DWT and DDPG are used to handle power fluctuations and optimize the scheduling strategy, enabling intelligent power allocation in response to renewable variability. The framework operates as follows:
- Initialization
The system initializes the local and target network parameters and the experience replay buffer E. It sets up the PEM, lithium battery, and supercapacitor models and loads the day-ahead plan as the basis for the next 6 h schedule.
- 2.
- First-layer optimization
For each 15 min window, the system receives power fluctuation data, applies DWT for decomposition, and optimizes cutoff frequencies via DDPG to minimize operational costs. Experiences are stored in the replay buffer, and network parameters are updated through soft updates. The optimal power allocation is derived and passed to the second layer for further refinement.
- 3.
- Second-layer optimization
At the 1 min scale, the system decomposes power fluctuations into high- and mid-frequency components managed by supercapacitors and lithium batteries. DDPG minimizes the maintenance costs by deriving optimal power allocations.
- 4.
- Feedback loop
The second-layer results are fed back to the first layer to adjust the upcoming 6 h plan, increasing the accuracy of future 15 min schedules.
- 5.
- Iteration
The process continues for each 15 min step within the 6 h window until the iteration limit is reached. The detailed process is presented in Algorithm 1.
| Algorithm 1 Multi-stage optimization framework with frequency decomposition |
| 1: Initialize the network parameters ,,, experience replay buffer E, model of PEM, LB, SC, day-ahead dispatch plan for next 6 h as state (0) 2: for m = 0 to M do 3: Receive power fluctuation data for the current 15 min period 4: Apply DWT to decompose power fluctuation signal into frequency components, and assign to PEM and LB, minimize cost for hydrogen production and battery operation 5: Pass , to the second layer for real-time optimization 6: for s = m to m+1 do 7: Receive real-time power fluctuation data for the current 1 min period 8: Apply DWT to decompose real-time power fluctuation signal, minimize short-term fluctuation with real-time response from battery and supercapacitor 9: Store the 1 min power adjustment plan 10: Update state 11: end for 12: Feedback results of real-time optimization to the first layer 13: Update state and proceed to the next 15 min window 14: end for |
5. Case Study
5.1. Data Set
To verify the efficiency of the proposed method, data from Hengsha Island in Shanghai, China, were used as a case study. Hengsha Island is one of the three principal islands in the Yangtze River estuary; it spans 158.79 square kilometers and is situated at the river mouth. The unique geographic and climatic conditions of the island, which are characterized by high humidity, wind variability, and tidal influences, significantly contribute to the intermittency of renewable energy. The parameters of the Hengsha microgrid that were used during the simulations and the unit operating costs of the equipment are detailed in Table 2. The system has a maximum load capacity of 35 MW, a rated photovoltaic power of 40 MW, and a rated wind power (WT) capacity of 160 MW. The gas turbine has a rated power output of 35 MW. The energy storage system consists of a supercapacitor with a maximum capacity of 0.5 MWh and a lithium battery with a maximum capacity of 10 MWh. The total installed capacities of the AlK and PEM systems are 20 MW. To be more specific, the ALK system consists of eight electrolyzers, each with a capacity of 2.5 MW [38], and the PEM system comprises sixteen electrolyzers, each with a capacity of 1.25 MW [39].
Table 2.
Island microgrid parameters.
5.2. Fluctuation Power Decomposition Analysis
The power fluctuations in the island microgrid are caused by renewable energy and loads, which were decomposed by the proposed DWT method. The decomposition was performed using the Daubechies wavelet (db4) with two decomposition levels, enabling the extraction of low-frequency, medium-frequency, and high-frequency components. Figure 5, Figure 6 and Figure 7 illustrate the individual analysis of wind power, PV power, and load fluctuations.
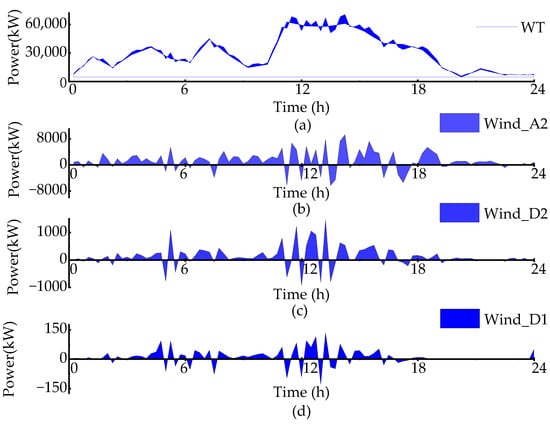
Figure 5.
DWT-based frequency decomposition results for wind power fluctuations. (a) Fluctuation data of wind power generation at 15 min intervals over a 24 h period; (b) low-frequency fluctuations of wind power (Wind_A2); (c) medium-frequency fluctuations of wind power (Wind_D2); and (d) high-frequency fluctuations of wind power (Wind_D1).
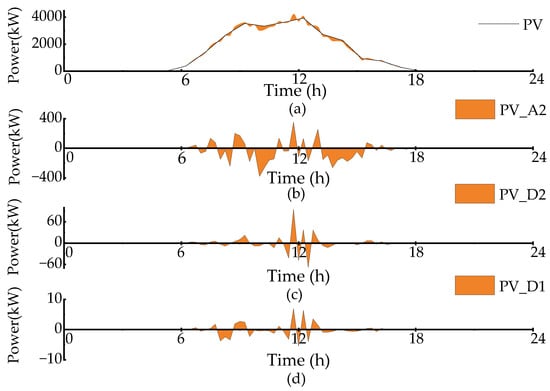
Figure 6.
DWT-based frequency decomposition results for PV power fluctuations. (a) fluctuation data of PV power generation at 15-minute intervals over a 24 h period; (b) low-frequency fluctuations of PV power (PV_A2); (c) medium-frequency fluctuations of PV power (PV_D2); and (d) high-frequency fluctuations of PV power (PV_D1).
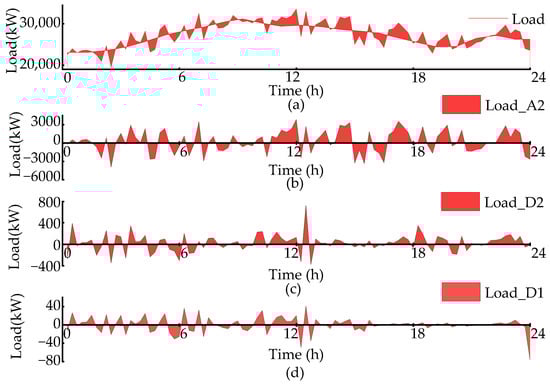
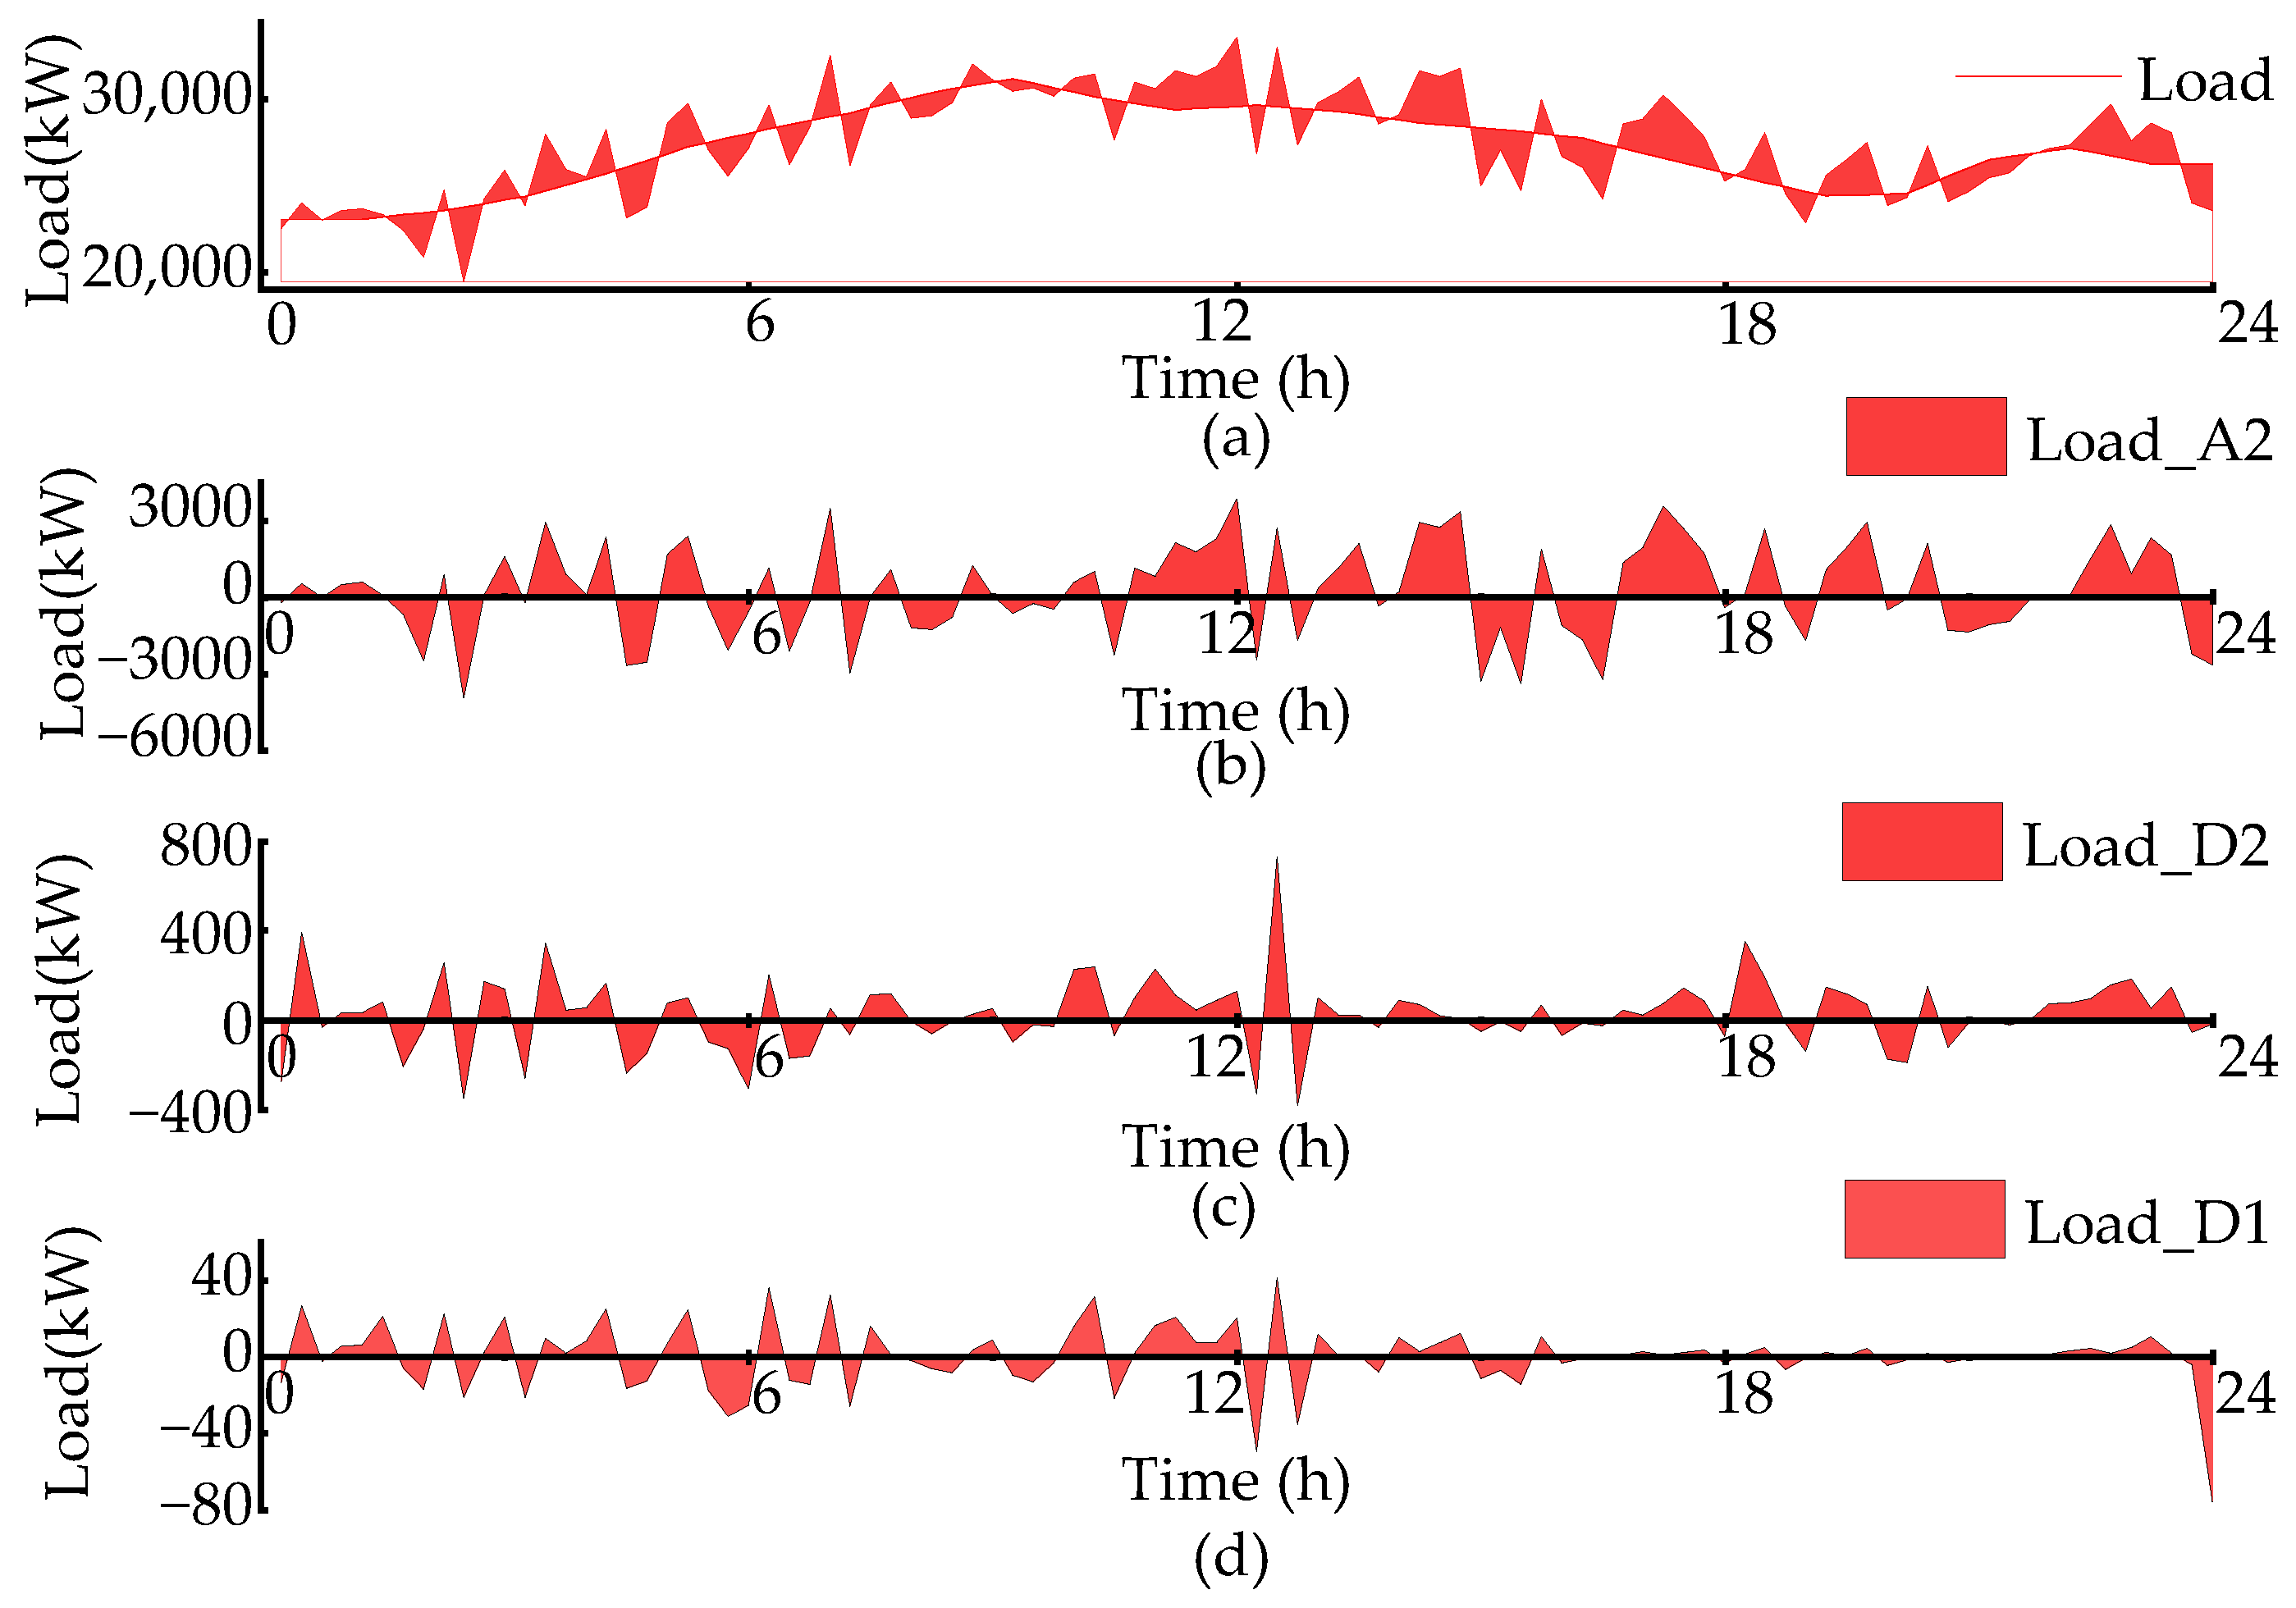
Figure 7.
DWT-based frequency decomposition results for load power fluctuations. (a) Fluctuation data of the load at 15-minute intervals over a 24 h period; (b) low-frequency fluctuations of the load (Load_A2); (c) medium-frequency fluctuations of the load (Load_D2); and (d) high-frequency fluctuations of the load (Load_D1).
As shown in Figure 5, the wind power variations are separated into three parts: low-frequency, medium-frequency and high-frequency bands. Wind power undergoes both periodic and random changes, which are influenced by seasonal patterns and local airflow. Low-frequency fluctuations (Wind_A2), ranging from −8000 kW to +8000 kW, are characterized by smooth and gradual changes, reflecting the overall trend of wind power generation. An increase in wind speed during midday is caused by solar heating, whereas a decrease at night results from cooling. These fluctuations are influenced by the location of Hengsha Island, which is situated in the East Asian monsoon region near the Yangtze River estuary, where sea–land breezes have a significant influence. Medium-frequency fluctuations (Wind_D2), with amplitudes of −1000 kW to +1000 kW, are observed over shorter intervals, particularly between 10:00 and 18:00. These variations are driven by thermal convection and localized gusts resulting from intense solar radiation. High-frequency fluctuations (Wind_D1), with small amplitudes of −150 kW to +150 kW, are rapid and irregular and are most noticeable around midday. This is caused by local turbulence and surface roughness, which are influenced by the flat terrain, proximity to water, and minimal vegetation on the island.
PV power generation follows a diurnal pattern, as shown in Figure 6. A2 captures daily trends, D2 reflects hourly variations due to cloud cover, and D1 highlights short bursts due to fast-moving clouds. The low-frequency fluctuations (PV_A2), with amplitudes up to ±400 kW, are characterized by a smooth trend, rising after sunrise, peaking at noon, and declining in the afternoon. These variations are influenced by the diurnal solar radiation cycle. Medium-frequency fluctuations (PV_D2), with amplitudes of ±60 kW, are observed over shorter intervals, particularly around midday. These fluctuations are caused by localized cloud movement and transient shading, which intermittently reduce solar irradiance. The high-frequency fluctuations (PV_D1), with amplitudes of ±10 kW, are rapid and irregular, occurring over time scales of minutes or seconds. These variations are driven by microscale disturbances, such as turbulence and shifting cloud edges, and are most prominent at midday.
Similarly, the load fluctuation decomposition results are shown in Figure 7. Different decompositions reflect the combined impacts of residential, commercial, and industrial activities across different time scales. The low-frequency fluctuations (Load_A2), with amplitudes reaching up to ±3000 kW, represent smooth and gradual variations throughout the day. These changes are primarily influenced by residential consumption, air conditioning usage, and steady operations such as fishing activities and port logistics. This component captures the baseline load demand variations across residential, commercial, and industrial sectors, rising during peak activity periods and stabilizing overnight. The medium-frequency fluctuations (Load_D2), with amplitudes of ±400 kW, occur over shorter time intervals and are associated with dynamic changes in load patterns. These variations are driven by intermittent operations at fishing ports and industrial facilities, reflecting time-dependent shifts in demand during different periods of the day. The high-frequency fluctuations (Load_D1), with amplitudes up to ±80 kW, are rapid and irregular, occurring on a time scale of minutes. These are caused by frequent switching of refrigeration units, short motor operations, and other small-scale equipment. This component highlights the instantaneous and unpredictable nature of load variations, which are more pronounced during peak operational periods.
5.3. Economic Analysis
On the basis of historical meteorological data from Hengsha Island, the benefits and strategies of the multi-energy island microgrid are analyzed for a specific period. The performance of the proposed method is determined, including power fluctuations of various energy sources, hydrogen storage, hydrogen production, lithium batteries and supercapacitors.
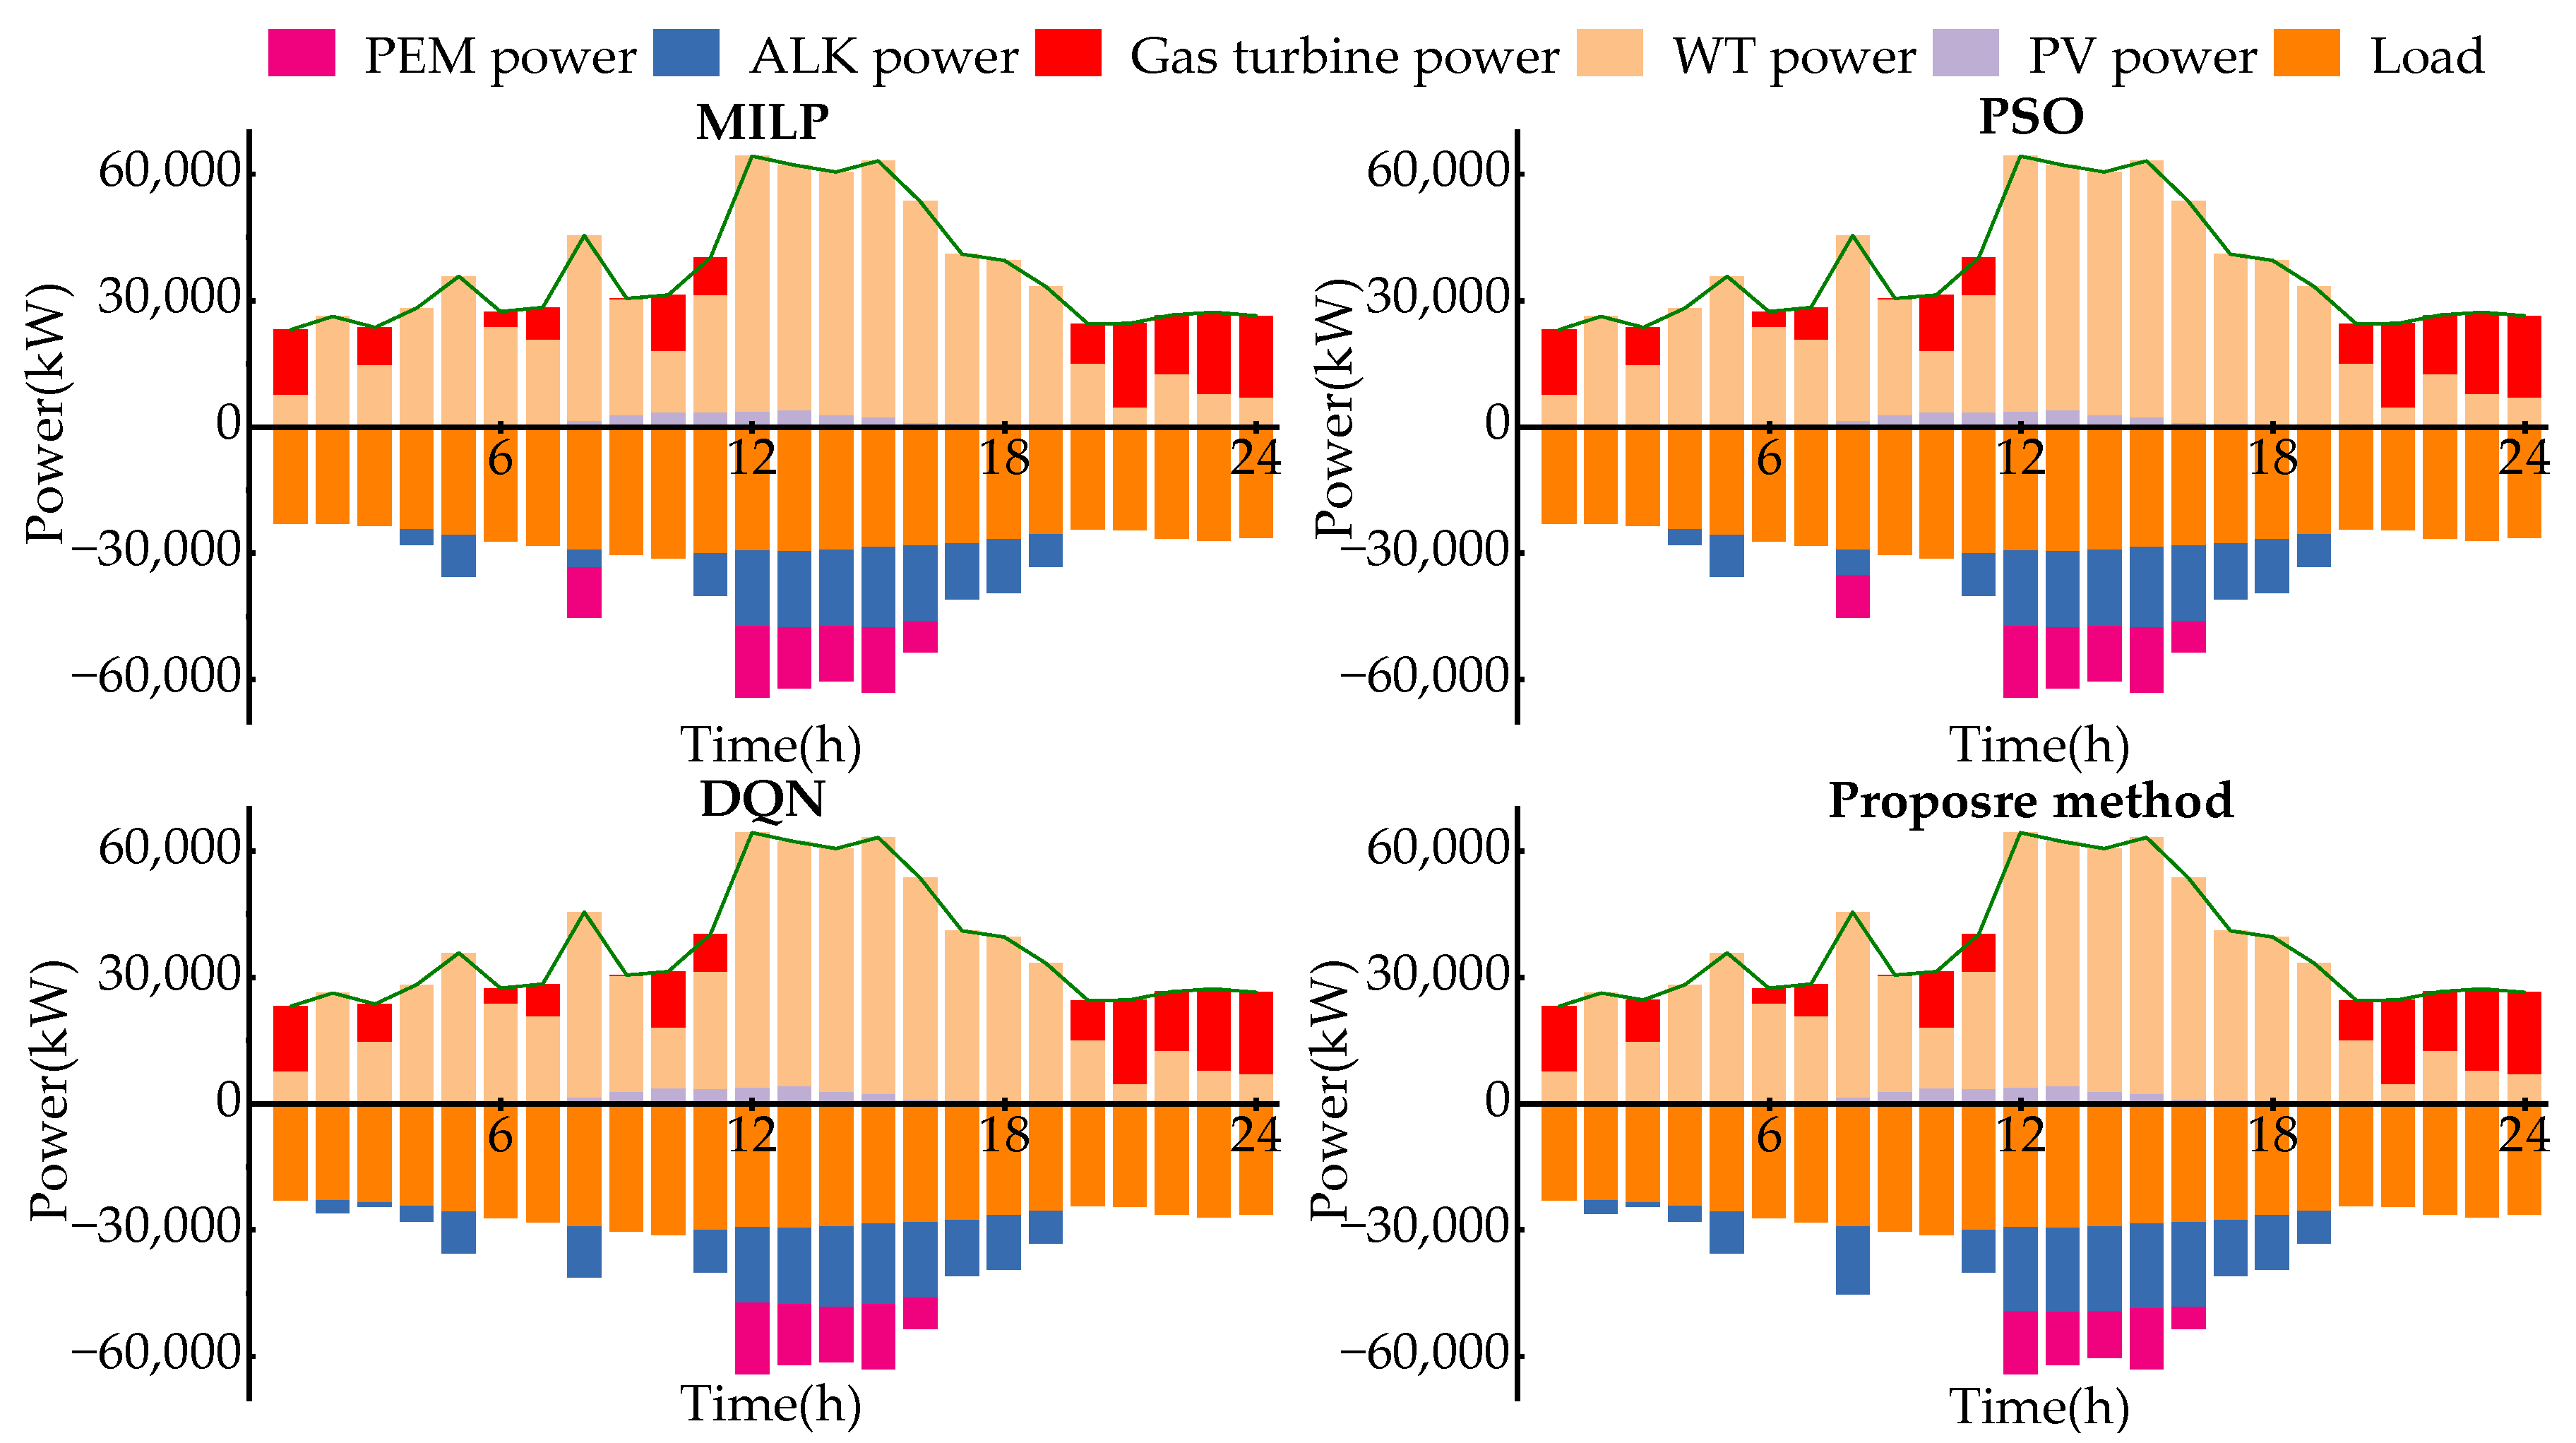
To verify the reliability of the proposed algorithm, the mixed-integer linear programming (MILP), particle swarm optimization (PSO), and deep Q network (DQN) algorithms were used as comparison benchmarks, and the operation results are shown in Figure 8, Figure 9 and Figure 10.
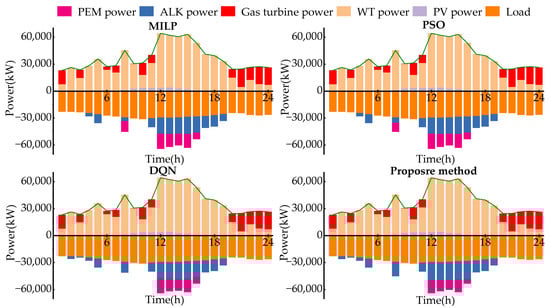
Figure 8.
Day-ahead power dispatch optimization results.
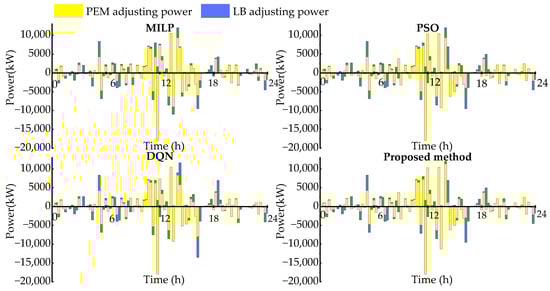
Figure 9.
Intra-day two-stage rolling optimization results–long time scale optimization.
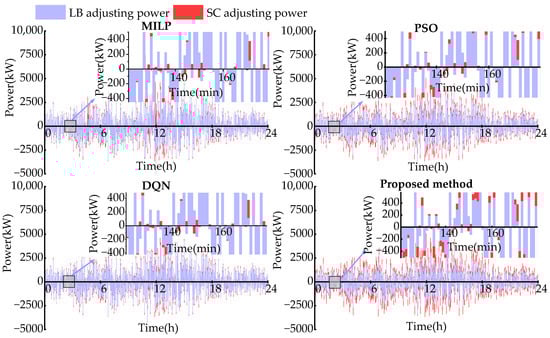
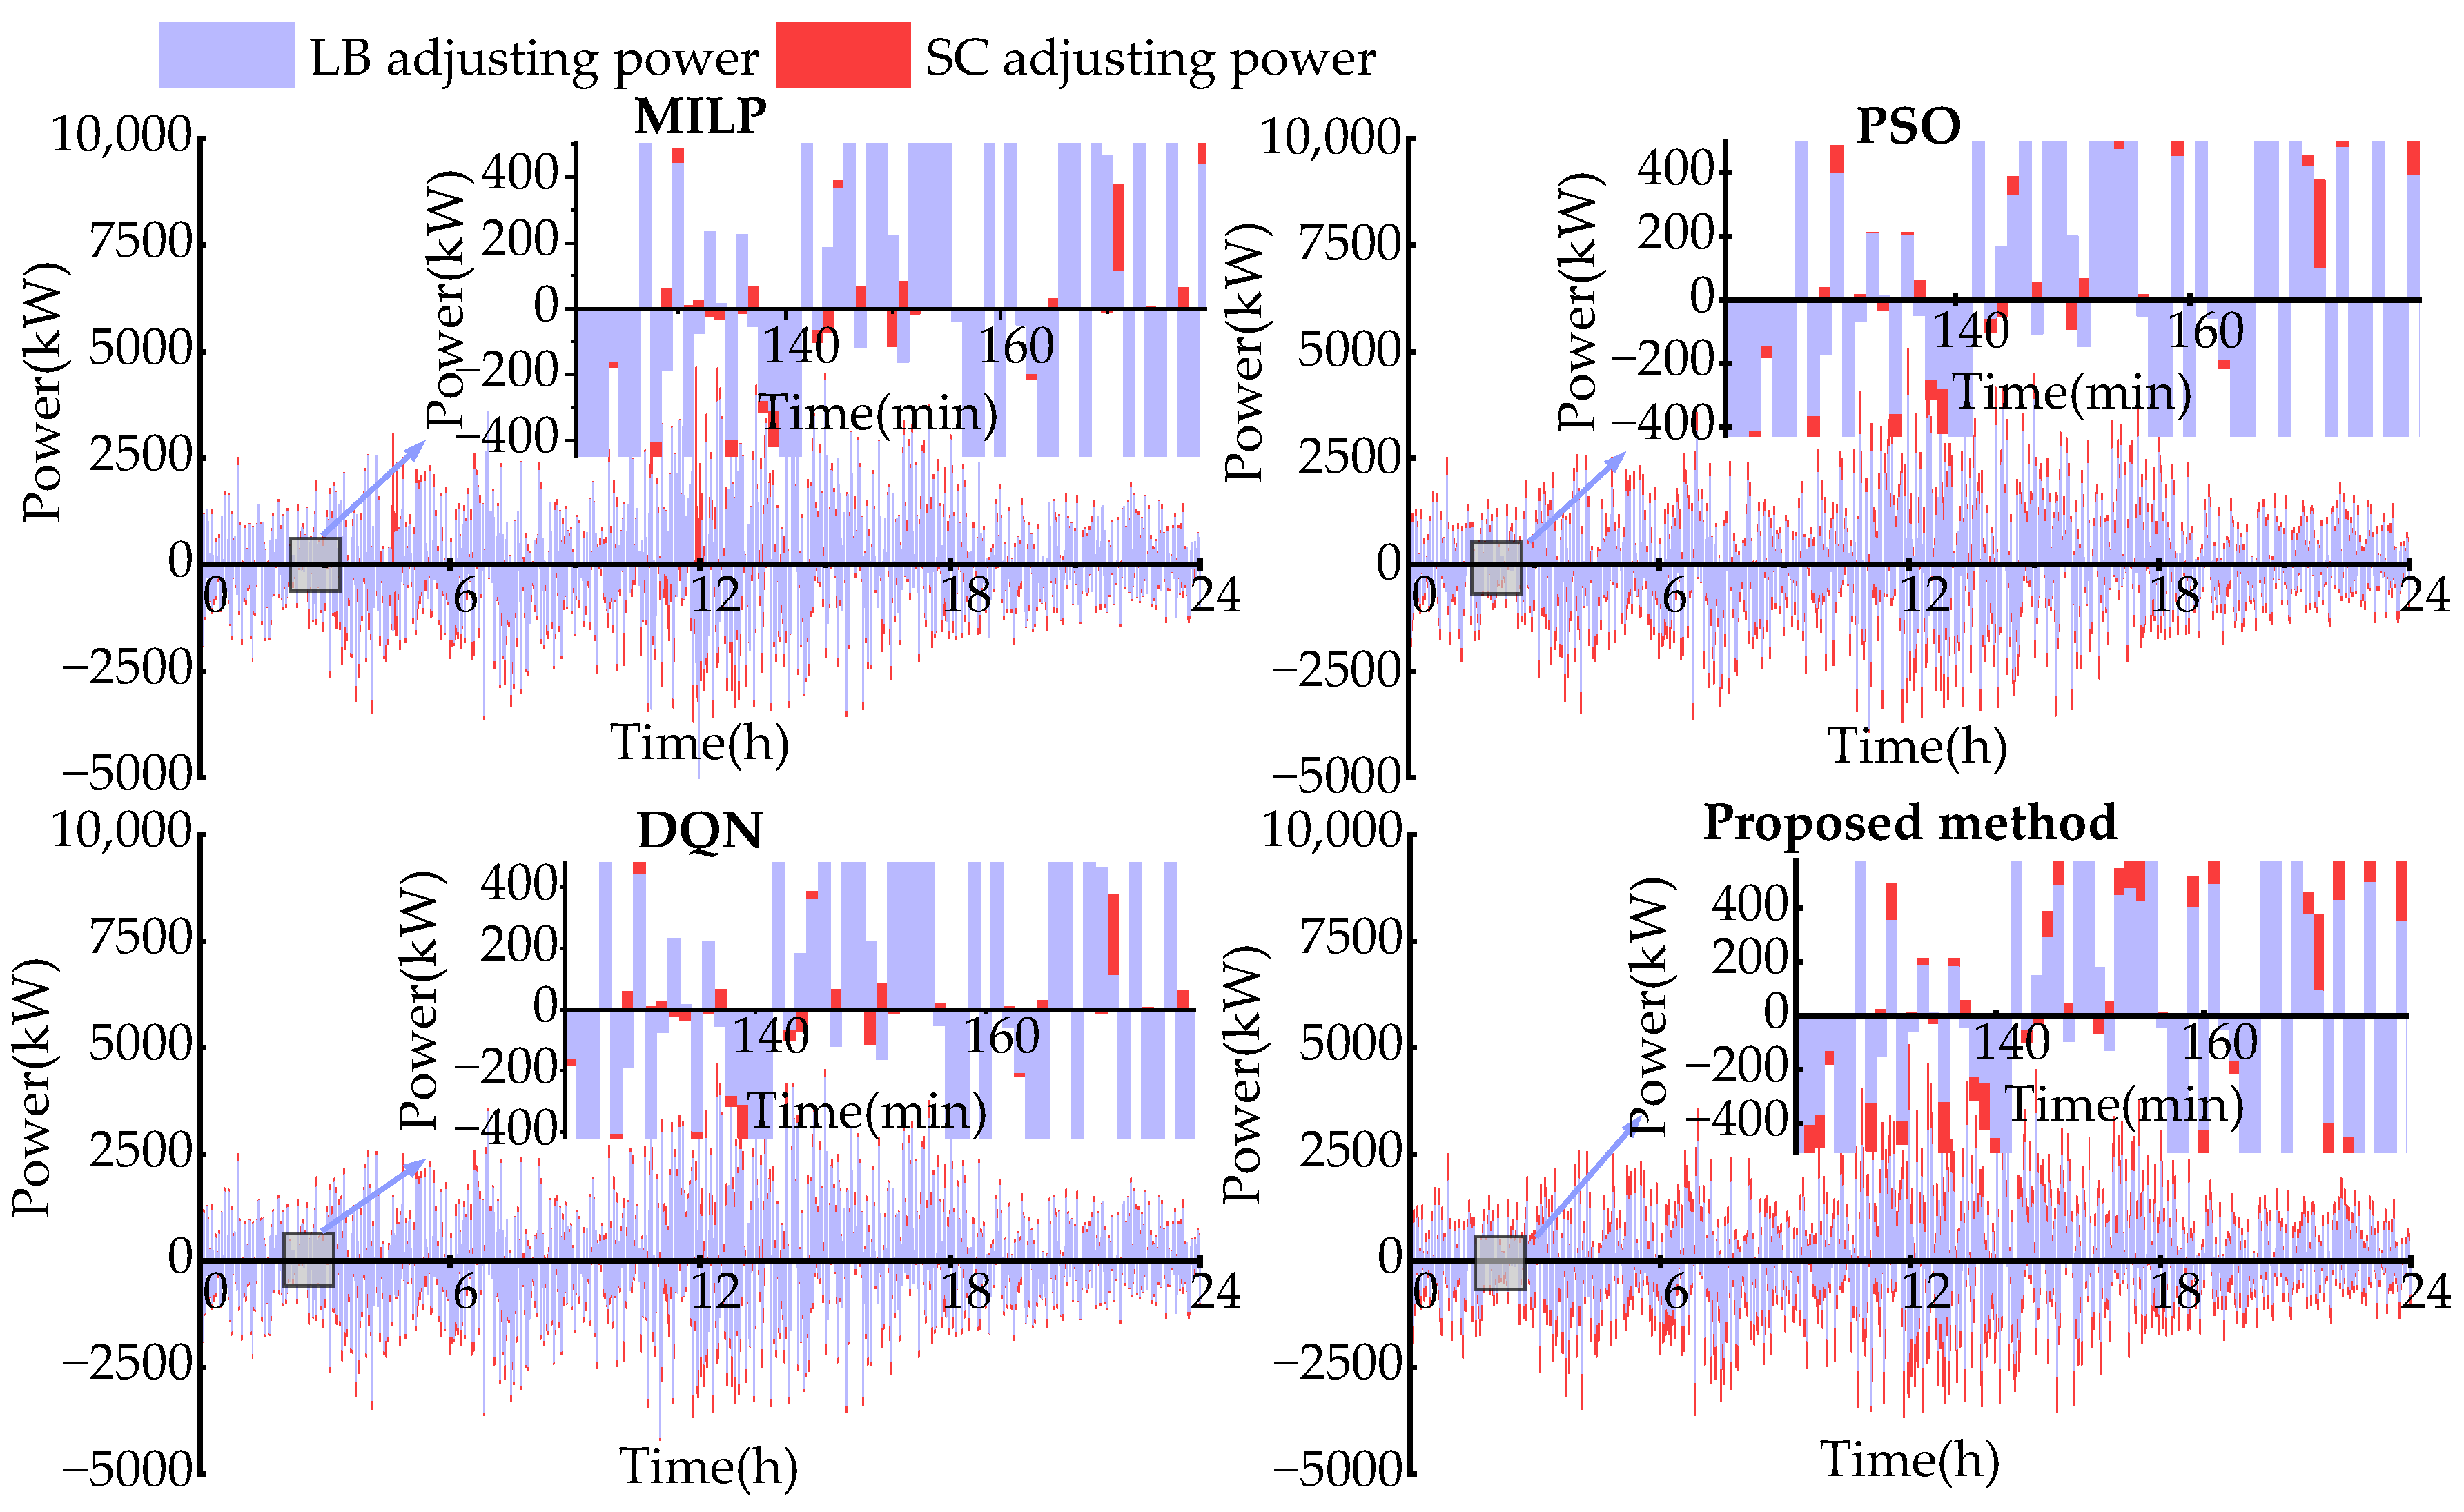
Figure 10.
Intra-day two stage rolling optimization results–real-time optimization.
The day-ahead optimization results are presented in Figure 8. Similar trends are observed in MILP and PSO, characterized by a steady yet significant reliance on gas turbine power and moderate utilization of the ALK and PEM. Increased use of ALK power is indicated in the DQN, although greater variability in balancing is evident. In contrast, smoother power distribution is achieved by the proposed method, with higher and more consistent utilization of the PEM and ALK systems.
The intraday rolling optimization results are shown in Figure 9. Compared with the MILP, PSO, and DQN algorithms, the method proposed in this paper employs fluctuating power decomposition to coordinate the scheduling of lithium batteries and hydrogen production equipment. This effectively smooths power fluctuations, reduces lithium battery power spikes and extreme variations, and contributes to extending the service life of the equipment.
The real-time optimization results are shown in Figure 10. In MILP, frequent power spikes are experienced by the supercapacitor due to the deterministic nature of the algorithm, which limits flexibility under dynamic conditions. In PSO, the utilization rate of lithium batteries is improved, but frequent fluctuations in supercapacitors are still observed as a result of insufficient precision in handling real-time adjustments. In the DQN, the utilization of the lithium battery is further improved, and power spikes in the supercapacitor are reduced compared with those of MILP and PSO; however, variability remains a challenge, as adjustments are learned through approximation, which may not fully capture the optimal responses under dynamic conditions. In contrast, frequency decomposition is employed in the proposed method to optimize the power distribution between the supercapacitor and lithium battery, and the range of the optimization data is narrowed. As a result, power adjustments are made smoother, extreme spikes are minimized, and overall power regulation is improved.
Significant advantages in operational cost control and hydrogen revenue are demonstrated by the proposed method across both the day-ahead and intraday stages, as shown in Table 3. In the day-ahead stage, an operating cost of USD 16,229.33 is reached, approximately 0.27% lower than that of MILP, 0.20% lower than that of PSO, and 2.07% lower than that of the DQN. The hydrogen revenue reaches USD 17,378.33, representing a 4.67% increase over that of MILP, a 4.68% increase over that of PSO, and a 2.39% increase over that of the DQN. These results highlight the effective cost control and improved revenue generation achieved by the proposed method.
Table 3.
Operation results of different methods.
In the intraday stage, an operating cost of USD 16,890.19 is reached, slightly above the USD 16,763.50 cost of MILP but maintaining a relative cost advantage, with reductions of 0.20% and 0.69% compared with those of the PSO and the DQN, respectively. The hydrogen revenue reaches USD 20,588.17, an increase of 8.41% over that of MILP, 3.89% over that of PSO, and 2.79% over that of the DQN. This substantial revenue increase, particularly in response to short-term fluctuations, demonstrates the strong economic performance of the proposed method. The method exhibits a clear advantage in optimizing scheduling on both day-ahead and intraday time scales.
5.4. Carbon Analysis
Unlike in traditional land-based microgrids, high-capacity gas turbines are relied upon in island microgrids to stabilize power because of their limited connection to mainland grids, particularly under extreme weather conditions. Carbon emissions are reduced through the integration of hydrogen-blended gas turbines, whereas coordinated energy conversion allows renewable energy to be fully utilized for hydrogen production. Compared with those of the other methods, a 1.2–1.3% reduction in carbon emissions is achieved by the proposed method, as shown in Table 4. Furthermore, a 44.5% reduction in carbon emissions is achieved compared with that in the nonoptimized scenario; this is a decrease from 25,294.61 kg to 11,258.33 kg, highlighting the potential for large-scale renewable hydrogen production on islands to mitigate greenhouse gas emissions.
Table 4.
Carbon emissions of different methods.
It can be seen from Table 4 that the MILP method requires 30.16 seconds to converge and the time used for the proposed algorithm can be reduced to 6.21 seconds, which is four times shorter than the MILP.
5.5. Sensitivity Analysis
To further investigate the impact of renewable energy penetration, this paper compared the day-ahead scheduling results under different renewable energy penetration levels. The corresponding carbon emissions, under different combinations of WT and PV-rated power values, are presented in Figure 11.
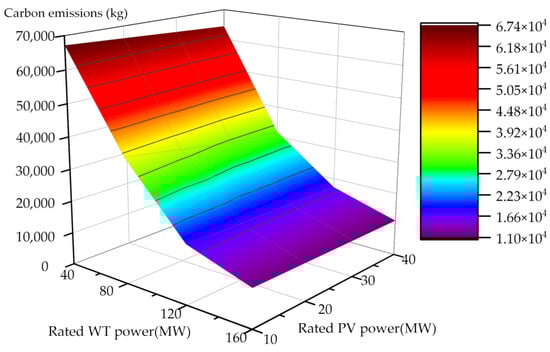
Figure 11.
Carbon emissions under different renewable energy penetration rates.
It can be observed that increasing the rated power of both WT and PV systems leads to a significant reduction in carbon emissions. Higher renewable energy capacity enables wind and solar power to meet a larger share of electricity demand, reducing reliance on fossil fuel generation. As shown in Figure 11, carbon emissions decrease substantially, from 67,210.47 kg to 11,258.33 kg, as the rated power of WT increases from 40 MW to 160 MW and PV from 10 MW to 40 MW. This highlights the potential of renewable energy systems to enhance the environmental performance of island microgrids.
However, the reduction in carbon emissions shows diminishing returns as the rated power of renewable energy systems continues to increase. While the initial expansion of renewable energy capacity leads to a sharp decline in emissions, the marginal benefits gradually decrease as the system approaches higher levels of renewable energy penetration. This aligns with the findings in this study, where the proposed multi-stage scheduling framework not only optimizes the integration of renewable energy but also minimizes the reliance on fossil fuels, thereby achieving significant emission reductions.
6. Conclusions
The increasing penetration of renewable energy poses a critical challenge to the economic and stable operation of island microgrids. On the basis of a hybrid deep learning method, a multi-stage scheduling framework is proposed to reduce the operation cost and emissions of a multi-energy island microgrid. The scheduling optimization problem for island microgrids with high renewable energy penetration is explored in this study. Within this framework, in the first stage, hydrogen production and the hydrogen blending ratio in gas turbines are optimized to minimize operational costs while satisfying the load demands of the island. In the second stage, the outputs of the lithium battery and hydrogen production equipment are optimized to smooth the power fluctuations caused by renewables and loads. In the third stage, the outputs of the supercapacitor and lithium battery are optimally determined to compensate for fast fluctuations. Furthermore, a real-world island—Changsha Island in Shanghai, China—is utilized to verify the proposed optimization algorithm. The following findings can be drawn from the case studies: (i) An 8.43% increase in intraday hydrogen revenue over that of the baseline method is achieved by the proposed method, yielding an operational net profit of USD 3697.98. (ii) Fossil fuel dependency is reduced through coordination of the hydrogen system and hydrogen-blended gas turbines. Carbon emissions decrease from 25,294.61 kg to 11,258.33 kg. (iii) The fluctuations in total power are smoothed out by the multi-time-scale scheduling strategy, effectively reducing wind and solar curtailment. Additionally, hydrogen resale generates extra revenue, further improving the economic performance of the system. In addition, the proposed method can be extended to study other island microgrids with different configurations and constraints.
Author Contributions
Conceptualization, W.Z. and B.Z.; methodology, W.Z. and Q.Z.; validation, W.Z.; formal analysis, S.W. and M.Z.; investigation, Y.H.; resources, Q.Z.; data curation, S.W.; writing—original draft preparation, W.Z.; writing—review and editing, S.W.; supervision, M.Z. and B.Z.; project administration, Y.H.; funding acquisition, S.W. All authors have read and agreed to the published version of the manuscript.
Funding
This research was funded by the National Natural Science Foundation of China under grant 52177101 and the Postgraduate Research & Practice Innovation Program of Jiangsu Province, grant number SJCX24_2609. The authors would like to thank the Shanghai Marine Equipment Research Institute for providing valuable data for the research.
Institutional Review Board Statement
Not applicable.
Informed Consent Statement
Not applicable.
Data Availability Statement
Data are contained within the article.
Conflicts of Interest
The authors declare no personal, academic, or financial conflicts of interest associated with this paper.
Nomenclature
| Indices: | |
| Indices of time periods | |
| Index of devices, | |
| Index of energy storage devices, | |
| Indices of the input signal/output coefficients | |
| Parameters: | |
| Various scheduling time scales | |
| Gas constant and temperature of hydrogen before compression | |
| Real-time/cut-in/rated/cut-out wind speeds at time t | |
| Proportion/lower heating values of hydrogen/natural gas | |
| Efficiencies of the gas turbine/ALK/PEM | |
| Charging and discharging efficiencies of lithium batteries/supercapacitors/hydrogen loss rate | |
| Electricity required per unit of hydrogen produced by the ALK/PEM | |
| Pressures before and after compression | |
| Rated power/ramp rates of the gas turbine/ALK/PEM | |
| Scale factor of the gas turbine/ALK/PEM | |
| Maximum load demand of the island microgrid | |
| Rated power of the photovoltaic/wind power generation | |
| Maximum proportion of hydrogen | |
| Maximum charging/discharging flows of the hydrogen storage tank | |
| Maximum charging/discharging of a supercapacitor/lithium battery | |
| Maximum capacities of the supercapacitor/lithium battery/hydrogen storage tank | |
| Fixed cost/start–stop cost coefficients of the ALK/PEM | |
| Cost factors of the wind turbine/photovoltaic generation/gas turbine/supercapacitor/hydrogen storage tank | |
| Low-pass/high-pass filter coefficients | |
| Discount factor | |
| Learning rate | |
| Parameters of the local/target critic networks | |
| Parameters of the local/target actor networks | |
| Parameters of the local/target networks | |
| Variables: | |
| Power of photovoltaic generation/wind turbine/gas turbine/supercapacitor/lithium battery at time t | |
| Power of the gas turbine/supercapacitor/lithium battery at time t | |
| Curtailed costs of wind turbine/photovoltaic generation at time t | |
| Response frequencies of the PEM/lithium battery/supercapacitor at time t | |
| Actual solar radiation intensity/temperature of photovoltaic generation at time t | |
| Total/hydrogen/natural gas fuel volume flow rates at time t | |
| Energy stored in the supercapacitor/lithium battery/hydrogen storage tank at time t/t − 1 | |
| Binary states of the ALK/PEM/supercapacitor/lithium battery/hydrogen storage tank at time t | |
| Input/output flow of HS at time t | |
| Hydrogen volume produced by the ALK/PEM at time t | |
| Cutoff frequencies of high-pass/low-pass filters under time scale m/s | |
| Costs of three stages | |
| Curtailment cost of renewable energy | |
| Operating costs of hydrogen production/storage/gas turbines/lithium batteries/supercapacitors | |
| Power adjustment costs of the PEM/lithium battery | |
| Proceeds/adjustment in proceeds from hydrogen sales | |
References
- Matthew, G., Jr.; Nuttall, W.J.; Mestel, B.; Dooley, L.S. Low Carbon Futures: Confronting Electricity Challenges on Island Systems. Technol. Forecast. Soc. Change 2019, 147, 36–50. [Google Scholar] [CrossRef]
- Ioannidis, A.; Chalvatzis, K.J.; Li, X.; Notton, G.; Stephanides, P. The Case for Islands’ Energy Vulnerability: Electricity Supply Diversity in 44 Global Islands. Renew. Energy 2019, 143, 440–452. [Google Scholar] [CrossRef]
- Psarros, G.N.; Dratsas, P.A.; Papathanassiou, S.A. A Comprehensive Review of Electricity Storage Applications in Island Systems. J. Energy Storage 2024, 83, 110658. [Google Scholar] [CrossRef]
- Psarros, G.N.; Karamanou, E.G.; Papathanassiou, S.A. Feasibility Analysis of Centralized Storage Facilities in Isolated Grids. IEEE Trans. Sustain. Energy 2018, 9, 1822–1832. [Google Scholar] [CrossRef]
- Wang, W.; Yuan, B.; Sun, Q.; Wennersten, R. Application of Energy Storage in Integrated Energy Systems—A Solution to Fluctuation and Uncertainty of Renewable Energy. J. Energy Storage 2022, 52, 104812. [Google Scholar] [CrossRef]
- Barrera-Santana, J.; Sioshansi, R. An Optimization Framework for Capacity Planning of Island Electricity Systems. Renew. Sustain. Energy Rev. 2023, 171, 112955. [Google Scholar] [CrossRef]
- Sihvonen, V.; Riikonen, J.; Price, A.; Nordlund, E.; Honkapuro, S.; Ylönen, M.; Kivioja, V.; Hedman, Å.; Tullberg, R. Combined Utilization of Electricity and Thermal Storages in a Highly Renewable Energy System within an Island Society. J. Energy Storage 2024, 89, 111864. [Google Scholar] [CrossRef]
- Keiner, D.; Salcedo-Puerto, O.; Immonen, E.; Van Sark, W.G.J.H.M.; Nizam, Y.; Shadiya, F.; Duval, J.; Delahaye, T.; Gulagi, A.; Breyer, C. Powering an Island Energy System by Offshore Floating Technologies towards 100% Renewables: A Case for the Maldives. Appl. Energy 2022, 308, 118360. [Google Scholar] [CrossRef]
- Frković, L.; Ćosić, B.; Pukšec, T.; Vladimir, N. The Synergy between the Photovoltaic Power Systems and Battery-Powered Electric Ferries in the Isolated Energy System of an Island. Energy 2022, 259, 124862. [Google Scholar] [CrossRef]
- Groppi, D.; Astiaso Garcia, D.; Lo Basso, G.; Cumo, F.; De Santoli, L. Analysing Economic and Environmental Sustainability Related to the Use of Battery and Hydrogen Energy Storages for Increasing the Energy Independence of Small Islands. Energy Convers. Manag. 2018, 177, 64–76. [Google Scholar] [CrossRef]
- Sadeghi, S.; Ahmadian, A.; Diabat, A.; Elkamel, A. Modeling Energy Management of an Energy Hub with Hybrid Energy Storage Systems for a Smart Island Considering Water–Electricity Nexus. Int. J. Hydrog. Energy 2024, 71, 600–616. [Google Scholar] [CrossRef]
- Ma, Z.; Han, J.; Chen, H.; Houari, A.; Saim, A. Research on Power Allocation Strategy and Capacity Configuration of Hybrid Energy Storage System Based on Double-Layer Variational Modal Decomposition and Energy Entropy. J. Energy Storage 2024, 95, 112492. [Google Scholar] [CrossRef]
- Ramu, S.K.; Vairavasundaram, I.; Palaniyappan, B.; Bragadeshwaran, A.; Aljafari, B. Enhanced Energy Management of DC Microgrid: Artificial Neural Networks-Driven Hybrid Energy Storage System with Integration of Bidirectional DC-DC Converter. J. Energy Storage 2024, 88, 111562. [Google Scholar] [CrossRef]
- Robayo, M.; Mueller, M.; Sharkh, S.; Abusara, M. Assessment of Supercapacitor Performance in a Hybrid Energy Storage System with an EMS Based on the Discrete Wavelet Transform. J. Energy Storage 2023, 57, 106200. [Google Scholar] [CrossRef]
- Kim, J.; Sin, S.; Kim, J. Early Remaining-Useful-Life Prediction Applying Discrete Wavelet Transform Combined with Improved Semi-Empirical Model for High-Fidelity in Battery Energy Storage System. Energy 2024, 297, 131285. [Google Scholar] [CrossRef]
- Peng, B.; Li, Y.; Liu, H.; Kang, P.; Bai, Y.; Zhao, J.; Nian, H. Design of Energy Management Strategy for Integrated Energy System Including Multi-Component Electric–Thermal–Hydrogen Energy Storage. Energies 2024, 17, 6184. [Google Scholar] [CrossRef]
- Ji, J.; Zhou, M.; Guo, R.; Tang, J.; Su, J.; Huang, H.; Sun, N.; Nazir, M.S.; Wang, Y. A Electric Power Optimal Scheduling Study of Hybrid Energy Storage System Integrated Load Prediction Technology Considering Ageing Mechanism. Renew. Energy 2023, 215, 118985. [Google Scholar] [CrossRef]
- Ding, Y.; Xu, Q.; Hao, L.; Xia, Y.; Li, D.; Chen, J. Day-Ahead Robust Dispatch of Interconnected Multi-Microgrids Considering Two-Stage Model of Hybrid Energy Storage. J. Energy Storage 2024, 92, 112120. [Google Scholar] [CrossRef]
- Emrani, A.; Achour, Y.; Sanjari, M.J.; Berrada, A. Adaptive Energy Management Strategy for Optimal Integration of Wind/PV System with Hybrid Gravity/Battery Energy Storage Using Forecast Models. J. Energy Storage 2024, 96, 112613. [Google Scholar] [CrossRef]
- Fatih Guven, A.; Abdelaziz, A.Y.; Mahmoud Samy, M.; Barakat, S. Optimizing Energy Dynamics: A Comprehensive Analysis of Hybrid Energy Storage Systems Integrating Battery Banks and Supercapacitors. Energy Convers. Manag. 2024, 312, 118560. [Google Scholar] [CrossRef]
- Li, C.; Yang, H.; Shahidehpour, M.; Xu, Z.; Zhou, B.; Cao, Y.; Zeng, L. Optimal Planning of Islanded Integrated Energy System With Solar-Biogas Energy Supply. IEEE Trans. Sustain. Energy 2020, 11, 2437–2448. [Google Scholar] [CrossRef]
- Kong, X.; Lu, W.; Wu, J.; Wang, C.; Zhao, X.; Hu, W.; Shen, Y. Real-Time Pricing Method for VPP Demand Response Based on PER-DDPG Algorithm. Energy 2023, 271, 127036. [Google Scholar] [CrossRef]
- Da Silva André, J.; Stai, E.; Stanojev, O.; Hug, G. Battery Control with Lookahead Constraints in Distribution Grids Using Reinforcement Learning. Electr. Power Syst. Res. 2022, 211, 108551. [Google Scholar] [CrossRef]
- Pompodakis, E.E.; Kryonidis, G.C.; Karapidakis, E.S. Volt/Var Control and Energy Management in Non-Interconnected Insular Networks with Multiple Hybrid Power Plants. Appl. Energy 2023, 331, 120427. [Google Scholar] [CrossRef]
- Maïzi, N.; Mazauric, V.; Assoumou, E.; Bouckaert, S.; Krakowski, V.; Li, X.; Wang, P. Maximizing Intermittency in 100% Renewable and Reliable Power Systems: A Holistic Approach Applied to Reunion Island in 2030. Appl. Energy 2018, 227, 332–341. [Google Scholar] [CrossRef]
- Kafetzis, A.; Ziogou, C.; Panopoulos, K.D.; Papadopoulou, S.; Seferlis, P.; Voutetakis, S. Energy Management Strategies Based on Hybrid Automata for Islanded Microgrids with Renewable Sources, Batteries and Hydrogen. Renew. Sustain. Energy Rev. 2020, 134, 110118. [Google Scholar] [CrossRef]
- Cabrera, P.; Carta, J.A.; Matos, C.; Rosales-Asensio, E.; Lund, H. Reduced Desalination Carbon Footprint on Islands with Weak Electricity Grids. The Case of Gran Canaria. Appl. Energy 2024, 358, 122564. [Google Scholar] [CrossRef]
- Wang, B.; Wang, X.; Wei, F.; Shao, C.; Zhou, J.; Lin, J. Multi-Stage Stochastic Planning for a Long-Term Low-Carbon Transition of Island Power System Considering Carbon Price Uncertainty and Offshore Wind Power. Energy 2023, 282, 128349. [Google Scholar] [CrossRef]
- Shahid, Z.; Santarelli, M.; Marocco, P.; Ferrero, D.; Zahid, U. Techno-Economic Feasibility Analysis of Renewable-Fed Power-to-Power (P2P) Systems for Small French Islands. Energy Convers. Manag. 2022, 255, 115368. [Google Scholar] [CrossRef]
- Abomazid, A.M.; El-Taweel, N.A.; Farag, H.E.Z. Optimal Energy Management of Hydrogen Energy Facility Using Integrated Battery Energy Storage and Solar Photovoltaic Systems. IEEE Trans. Sustain. Energy 2022, 13, 1457–1468. [Google Scholar] [CrossRef]
- Basher, B.G.; Ghanem, A.; Abulanwar, S.; Hassan, M.K.; Rizk, M.E.M. Fault Classification and Localization in Microgrids: Leveraging Discrete Wavelet Transform and Multi-Machine Learning Techniques Considering Single Point Measurements. Electr. Power Syst. Res. 2024, 231, 110362. [Google Scholar] [CrossRef]
- Zhang, W.; Lin, Z.; Liu, X. Short-Term Offshore Wind Power Forecasting-A Hybrid Model Based on Discrete Wavelet Transform (DWT), Seasonal Autoregressive Integrated Moving Average (SARIMA), and Deep-Learning-Based Long Short-Term Memory (LSTM). Renew. Energy 2022, 185, 611–628. [Google Scholar] [CrossRef]
- Ahmed, M.H.; AboHussien, A.; El-Shafei, A.; Darwish, A.M.; Abdel-Gawad, A.H. Active Control of Flexible Rotors Using Deep Reinforcement Learning with Application of Multi-Actor-Critic Deep Deterministic Policy Gradient. Eng. Appl. Artif. Intell. 2023, 124, 106593. [Google Scholar] [CrossRef]
- Benhmidouch, Z.; Moufid, S.; Ait-Omar, A.; Abbou, A.; Laabassi, H.; Kang, M.; Chatri, C.; Hammou Ou Ali, I.; Bouzekri, H.; Baek, J. A Novel Reinforcement Learning Policy Optimization Based Adaptive VSG Control Technique for Improved Frequency Stabilization in AC Microgrids. Electr. Power Syst. Res. 2024, 230, 110269. [Google Scholar] [CrossRef]
- Ye, J.; Wang, X.; Hua, Q.; Sun, L. Deep Reinforcement Learning Based Energy Management of a Hybrid Electricity-Heat-Hydrogen Energy System with Demand Response. Energy 2024, 305, 131874. [Google Scholar] [CrossRef]
- Arenas-López, J.P.; Badaoui, M. The Ornstein-Uhlenbeck Process for Estimating Wind Power under a Memoryless Transformation. Energy 2020, 213, 118842. [Google Scholar] [CrossRef]
- Yu, X.; Gao, Z.; Xiong, Z.; Zhao, C.; Yang, Y. DDPG-AdaptConfig: A Deep Reinforcement Learning Framework for Adaptive Device Selection and Training Configuration in Heterogeneity Federated Learning. Future Gener. Comput. Syst. 2025, 163, 107528. [Google Scholar] [CrossRef]
- World’s First Dynamic Green Ammonia Plant Officially Opened. Available online: https://nelhydrogen.com/articles/in-depth/worlds-first-dynamic-green-ammonia-plant-officially-opened/ (accessed on 11 January 2025).
- PEM Electrolyser-PSM Series. Available online: https://nelhydrogen.com/product/psm-series-electrolyser/ (accessed on 11 January 2025).
- SGT-700 Industrial Gas Turbine. Available online: https://www.siemens-energy.com/global/en/home/products-services/product/sgt-700.html (accessed on 11 January 2025).
- Wu, X.; Huang, B.; Wang, Q.; Wang, Y. Thermally Chargeable Supercapacitor Using a Conjugated Conducting Polymer: Insight into the Mechanism of Charge-Discharge Cycle. Chem. Eng. J. 2019, 373, 493–500. [Google Scholar] [CrossRef]
- Zhao, T.; Qiu, J.; Wen, S.; Zhu, M. Efficient Onboard Energy Storage System Sizing for All-Electric Ship Microgrids Via Optimized Navigation Routing Under Onshore Uncertainties. IEEE Trans. Ind. Appl. 2022, 58, 1664–1674. [Google Scholar] [CrossRef]


Disclaimer/Publisher’s Note: The statements, opinions and data contained in all publications are solely those of the individual author(s) and contributor(s) and not of MDPI and/or the editor(s). MDPI and/or the editor(s) disclaim responsibility for any injury to people or property resulting from any ideas, methods, instructions or products referred to in the content. |
© 2025 by the authors. Licensee MDPI, Basel, Switzerland. This article is an open access article distributed under the terms and conditions of the Creative Commons Attribution (CC BY) license (https://creativecommons.org/licenses/by/4.0/).