Article

Multimodal Underwater Sensing of Octocoral Populations and Anthropogenic Impacts in a Conservation-Priority Area (NE Aegean Sea, Greece)

by
Maria Sini
1,
Jennifer C. A. Pistevos
1,
Angeliki Bosmali
1,
Artemis Manoliou
1,
Athanasios Nikolaou
1,
Giulia Pitarra
1,
Ivan T. Petsimeris
1,
Olympos Andreadis
1,
Thomas Hasiotis
1,
Antonios D. Mazaris
2 and
Stelios Katsanevakis
1,*
1
Department of Marine Sciences, School of the Environment, University of the Aegean, Lofos Panepistimiou, 811 00 Mytilene, Greece
2
Department of Ecology, School of Biology, Aristotle University of Thessaloniki, 541 24 Thessaloniki, Greece
*
Author to whom correspondence should be addressed.
J. Mar. Sci. Eng. 2025, 13(12), 2237; https://doi.org/10.3390/jmse13122237
Submission received: 14 September 2025 / Revised: 28 October 2025 / Accepted: 19 November 2025 / Published: 24 November 2025
(This article belongs to the Section Marine Ecology)

Abstract

Coralligenous assemblages are among the most diverse habitats of the Mediterranean Sea, yet those of the north-eastern basin remain understudied despite their vulnerability to human impacts and climate change. We applied a multimodal underwater sensing approach to map coralligenous formations, assess gorgonian populations and evaluate the effects of marine litter in a conservation-priority area (NE Aegean Sea, Greece). Side-scan sonar enabled seafloor mapping and guided targeted Remotely Operated Vehicle (ROV) surveys. ROV-based distance sampling and imagery provided quantitative data on Eunicella cavolini and Paramuricea clavata, including density, size structure, and injuries, alongside systematic documentation of marine litter. Gorgonians formed monospecific ecological facies, segregated by location—P. clavata occurred deeper than E. cavolini. Densities were low (E. cavolini: 0.35 colonies m−2, P. clavata: 1.46 colonies m−2) and small colonies (<10 cm) were rare, suggesting limited recruitment. However, the presence of large colonies indicates stable environmental conditions that support long-term persistence, as reproductive output increases with colony size. Colony injuries were minor, but marine litter was abundant, dominated by fishing lines and ropes entangled with gorgonians and sponges. These findings highlight the value of acoustic–optical integration for non-destructive monitoring and provide essential baselines for conservation under EU directives.

1. Introduction

Mediterranean coralligenous formations are among the most ecologically valuable and structurally complex benthic ecosystems in the region [1,2]. They develop slowly at depths between 20–150 m, where the gradual accumulation of encrusting coralline algae and the calcareous remains of sessile invertebrates forms multi-layered bioconstructions [1,3]. Coralligenous formations typically occur either as banks on gently sloping detritic substrates or as rims along sublittoral rocky reefs [4,5]. The communities that develop on these formations are collectively termed “coralligenous assemblages”.
Coralligenous assemblages host around 10% of the known Mediterranean marine species, including numerous endemic, and protected taxa [6,7]. Among the most conspicuous and functionally important organisms are gorgonian octocorals. Three species, the yellow gorgonian Eunicella cavolini (Koch, 1887), the white gorgonian E. singularis (Esper, 1791), and the purple gorgonian Paramuricea clavata (Risso, 1827), commonly dominate the assemblages [1]. Their three-dimensional, tree-like colonies often form dense animal forests [8] which, much like terrestrial forests, enhance structural complexity, support biodiversity, and provide key ecological functions such as shelter, spawning grounds, and feeding areas for a wide range of marine species [9,10,11,12]. However, their growth form, along with their life history characteristics [13,14], renders them particularly vulnerable to anthropogenic pressures, emphasizing the need for systematic monitoring and effective protection [15,16].
Coralligenous assemblages are currently classified as Near Threatened in the European Red List of Habitats [17], while key species such as E. cavolini and P. clavata are listed as Near Threatened and Vulnerable, respectively, in the IUCN Red List of Species [18], underscoring the urgency of targeted monitoring and conservation measures. The UNEP-MAP Action Plan [2] and the Marine Strategy Framework Directive (MSFD; 2008/56/EC) both emphasize the importance of systematic mapping and status assessment of coralligenous habitats.
Despite their ecological importance and the multiple ecosystem services they provide—including productive fishing grounds for food provision, attractive seascapes for diving tourism, and raw materials such as bioactive compounds (e.g., [1,19,20,21,22])—coralligenous assemblages and their associated gorgonian populations are increasingly threatened across the Mediterranean by diverse anthropogenic pressures. This is particularly true in the NE Mediterranean Sea, an area that is exposed to climate-driven marine heat waves [23] and unregulated fishing [24], and where coralligenous assemblages remain largely unprotected [25].
Marine litter (ML)—particularly lost or discarded fishing gear—poses a major concern [26], which is acute in areas of intense small-scale fishing [27,28,29]. Lost or abandoned fishing ropes, lines, nets and hooks, often deployed near rocky reefs or transported there by currents, become easily entangled in the complex topography of coralligenous habitats [30,31,32,33]. The presence of erect or branching species with flexible skeletons, such as gorgonians, further increases their susceptibility to entanglement with ML [30,33]. Such entanglement has severe impacts on coralligenous assemblages, through smothering, breakage, and detachment, leading to the loss of key species and degradation of the overall habitat [30,32,34]. In gorgonians, the abrasive action of entangled ML causes tissue loss, heightening susceptibility to infections and epibiotic fouling, and ultimately leading to colony mortality [29,31,35,36].
Combined with additional pressures—including unregulated fishing, diving and boating [37,38,39,40], as well as pollution, eutrophication, sedimentation, and biological invasions [41,42,43,44]—ML promotes the structural and functional homogenization of coralligenous assemblages [13,45,46], leading to simplified communities dominated by opportunistic, short-lived species, such as turf algae, encrusting sponges, tunicates, and boring organisms [42,45,46,47].
Several methodological approaches [48] and various ecological or ecosystem-based indices [49,50] have been developed to support the mapping, assessment, and monitoring of coralligenous habitats. Mapping commonly relies on hydroacoustic technology, such as side-scan sonar (SSS), multibeam sonar, and sub-bottom profilers [51,52,53], while at broader scales it is primarily based on bibliographic data compilations [25,54] and predictive modeling [55].
Ecological assessments typically employ visual methods, either through in situ observations or photographic and video surveys [49], which cause minimal disturbance. Shallow coralligenous habitats are usually surveyed by SCUBA divers, whereas deeper, more extensive, and less accessible areas are primarily explored using Remotely Operated Vehicles (ROVs) [49], or, in recent years, with Autonomous Underwater Vehicles (AUVs) that are often equipped with acoustic or optical technologies [56,57,58]. ROVs are also widely applied in ML assessments, especially in areas hosting sensitive species and habitats, as they allow targeted inspections and real-time decision making [28,34], whereas AUVs generally operate pre-programmed routes with limited capacity for opportunistic observations [56,57,58].
Nevertheless, single-sensor approaches remain insufficient to capture the structural complexity and spatial extent of these habitats. Acoustic mapping alone cannot reliably resolve biotic composition or discriminate substrates with similar acoustic responses, and robust habitat classification therefore requires in situ ground-truthing [59,60]. Conversely, ROV surveys provide high-resolution imagery that enables detailed assessments of benthic organisms and habitat condition, but their spatial coverage is limited and highly dependent on operational constraints [61,62]. Integrating these techniques through multimodal underwater sensing offers a powerful means of overcoming limitations of single-sensor surveys and achieving more holistic ecological monitoring [62].
The present study integrates SSS surveys with ROV-based distance sampling and imagery aiming to (i) map and characterize the coralligenous formations that occur within a marine protected area (MPA) in the NE Aegean Sea that remains largely understudied, (ii) evaluate the population status of the gorgonian species E. cavolini and P. clavata, and (iii) quantify the impact of marine litter on gorgonian colonies and other vulnerable benthic taxa. By combining complementary acoustic and optical datasets, this study demonstrates the value of mulitmodal underwater sensing for habitat mapping and impact assessment in mesophotic ecosystems. Such information is essential to inform conservation planning in line with EU directives, and to develop cost-efficient protocols for long-term ecological monitoring.

2. Materials and Methods

2.1. Study Area

The study site is situated off the northeastern coast of Lesvos Island in the Aegean Sea (Figure 1). It lies within a designated Special Area of Conservation (SAC), “GR4110015—Marine Area of Tokmakia Islets” of the Natura 2000 Network—the largest coordinated network of protected areas globally, established by the European Union (EU) to conserve its most valuable and threatened species and habitats. However, as is the case with most Natura 2000 sites, this area, although legally designated, lacks an operational management plan.
The marine area comprises a coastal plateau (the Tokmakia plateau) interspersed with several small islets and encompassing a mosaic of ecologically valuable habitats, including sand banks, Posidonia oceanica meadows down to 30 m depth, and rocky reefs. A central feature of this study is the rocky drop-off along the Tokmakia plateau, spanning nearly 2 km and descending from 25 to 60 m. This drop-off hosts diverse coralligenous assemblages and dense gorgonian populations [63,64], rendering it a focal site for biodiversity monitoring and ecological assessment. Despite its ecological importance, the area remains largely understudied, with the only known previous investigation being one related to its coralligenous formations conducted approximately 14 years ago [63,64]. Fieldwork for the present study was conducted between early spring and late summer 2025.

2.2. Seabed Mapping

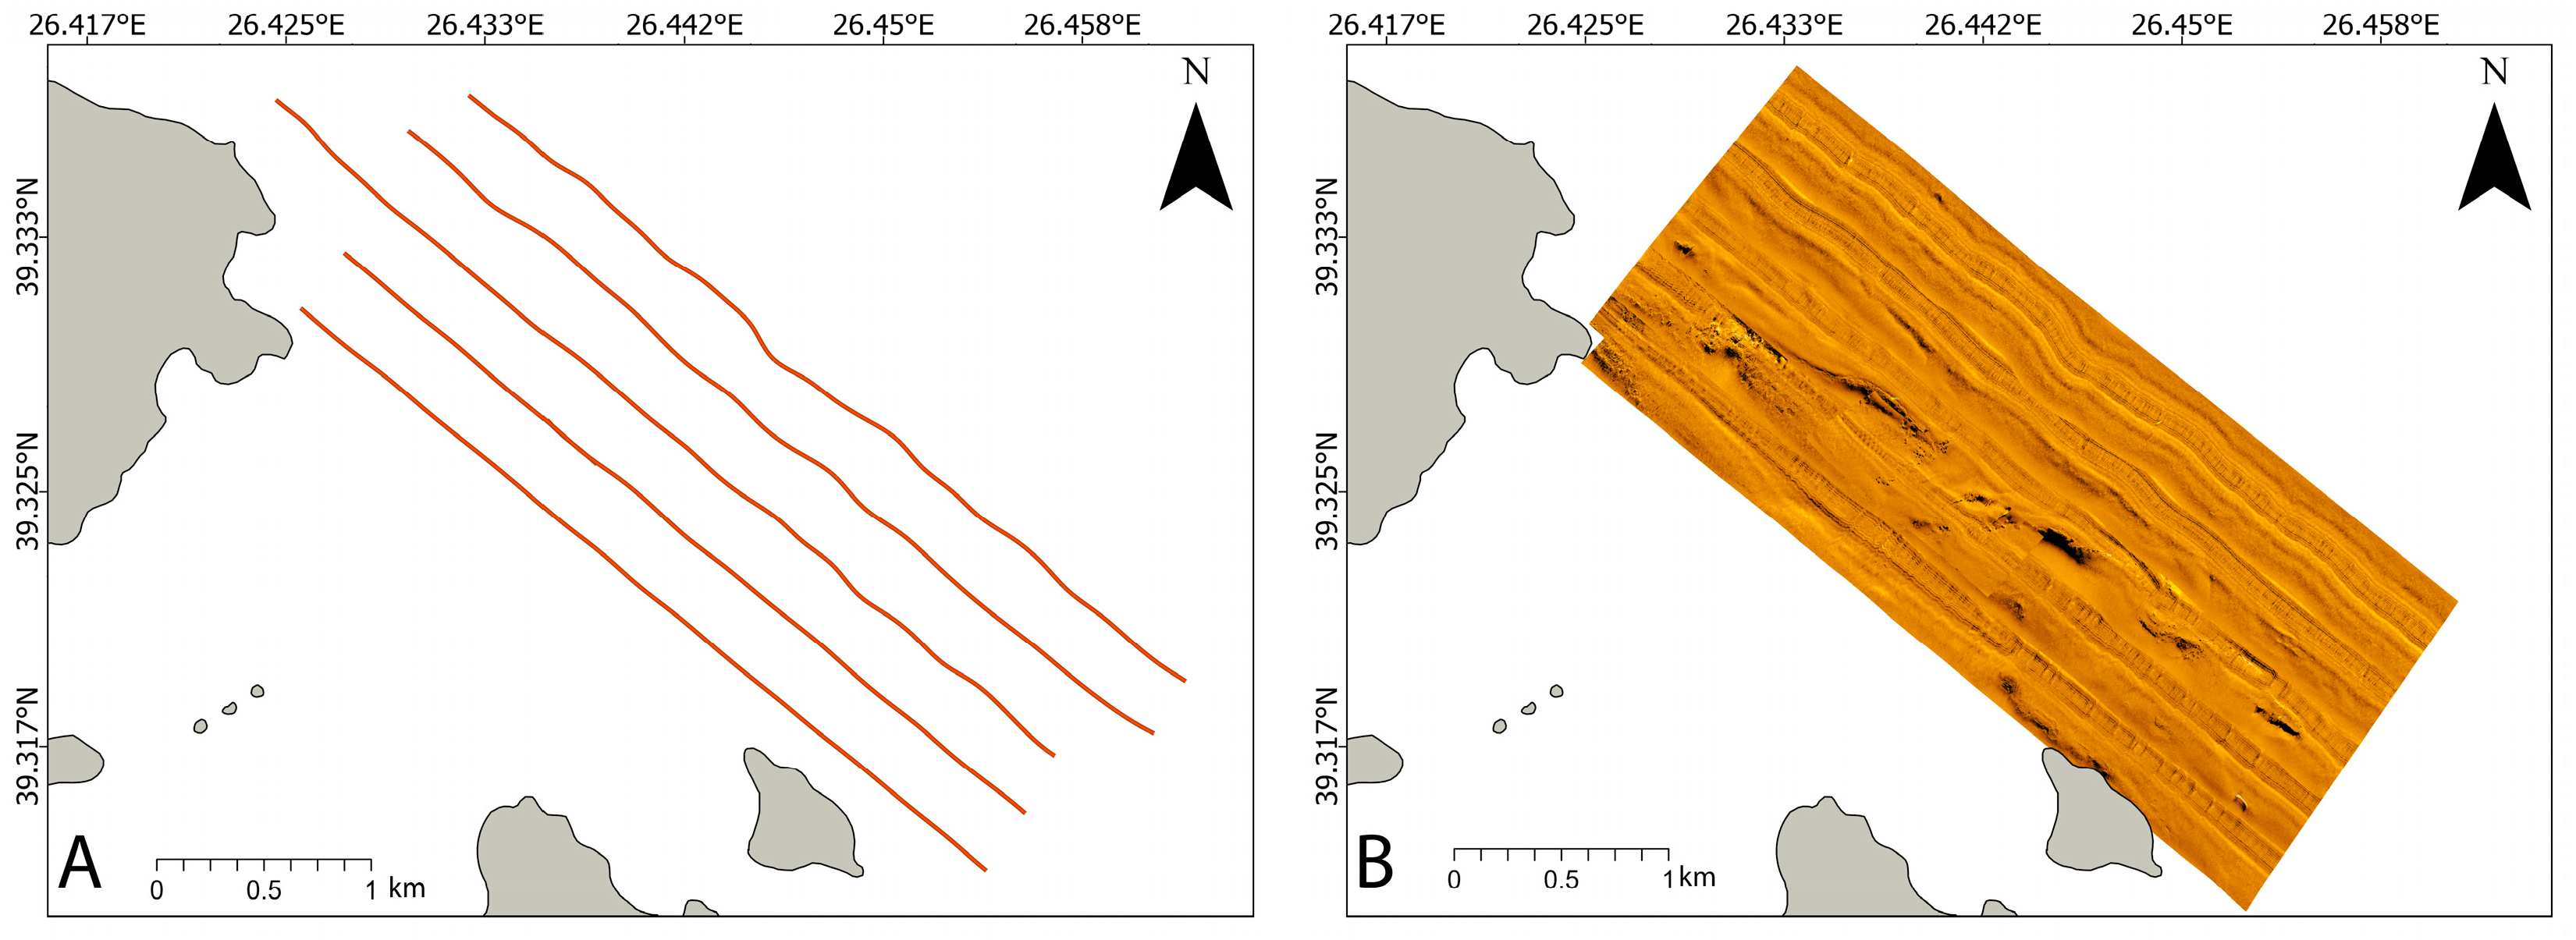
Side-scan sonar (SSS) data acquisition took place in March 2025 to map the seabed morphology in the wider area, and to guide ROV dives. The SSS survey covered approximately 4.2 km2, northeast of the Tokmakia Islets. The SSS system used was a CM2 (C-MAX) operating at 325 kHz, with a towing speed of 3–4 knots and an altitude of 10–25 m, depending on seabed morphology (seabed depth range: 15–65 m). The operating range of each channel was set at 200 m, giving a total swath of 400 m. A total of five parallel lines (~17 km in total) were surveyed with approximately 80% overlap to ensure full seabed coverage and seafloor mosaicking (Figure 2). For navigation and positioning, a TopCon Hiper HR RTK GNSS was used. SonarWiz v.8.0 software was used for SSS data processing and analysis, feature digitization, automated classification of seabed texture, and geo-referenced mosaicking. However, given the morphological complexity of the western SSS lines, the sloping seafloor, the high reflectivity return signal along the SSS nadir and the lack of underwater positioning, automated classification based on the gray level co-occurrence matrix (GLCM) texture analysis technique did not yield reliable results; therefore manual habitat mapping was performed instead (e.g., [65]). The SSS interpretation guided the selection of the ROV dive locations for ground-truth data to validate the observed SSS reflectivity types, and the ROV dives for ML and gorgonian assessment (Figure S1, Table S1).

2.3. Marine Litter and Gorgonian Population Assessment

The marine litter (ML) and gorgonian assessments took place in March, May, and July 2025 (Figure S1, Table S1). Dedicated surveys were conducted using an ROV (FIFISH E-MASTER) with a maximum operating depth of 200 m. Its main camera has a field of view of 120° and supports still images up to 3840 × 2160 px resolution and videos up to 4K UHD at 30 fps, stabilized by electronic image stabilization. A secondary rear-facing camera was employed to monitor the tether and prevent obstructions and tangling. Illumination was provided by dual 5000-lumen lights with a 160° beam angle. The ROV was also equipped with a red laser scaler (660 nm) with a fixed width of 10 cm, used to calibrate measurements in metric units. The vessel’s position was recorded via GPS at the start and end of each ROV dive.

2.3.1. Marine Litter

Information on the presence of ML was obtained from visual analysis of video footage collected during dedicated ROV dives across the rocky drop-off. During each dive, the ROV was kept at a constant distance of ~1.5 m from the seabed and moved at a steady slow speed following a random path. The ROV dive ID, depth range, and total video duration were logged. In the absence of an underwater GPS, dive distances were estimated based on the vessel’s geographic coordinates at deployment and retrieval.
Video footage was then manually analyzed using standard video playback software to characterize and quantify ML occurrence. At each ML encounter, the video was paused and the following information recorded: ML type, abundance (number of items), depth (m), type of impact, level of ML biofouling, interaction with vulnerable taxa, and feasibility of removal. ML type was defined according to the categories adopted for ML monitoring under the Marine Framework Strategy Directive in the Mediterranean [66].
The type of ML impact was classified into four categories of interaction with benthic habitats and organisms [29]: (a) covering/entanglement: ML covering or entangled with substrate and/or organisms; (b) abrasion: visible scars or injuries on substrate or organisms caused by ML; (c) hanging: ML suspended between obstacles but causing no apparent damage, (d) lying: ML resting on the substrate causing no apparent harm on habitats or species.
The biofouling level of each ML item was also recorded as it provides information on putative residence time and potential ecological effects [29,32]. Specifically four biofouling stages were defined (adopted from [32]): Stage 0—no biofouling present, residence time <1 month; Stage 1—mainly characterized by the presence of few small filamentous algae and cambanularid hydrozoans, indicative of residence time of approximately 1–4 months; Stage 2—presence of larger macroalgal and hydrozoan taxa, as well as small carbonatic encrusting organisms (e.g., serpulids and coralline algae), or taxa of limited vertical growth (e.g., bryozoans), indicative of residence time between 4–12 months; and Stage 3—well developed communities of multiple conspicuous taxa, including macroalgae, hydrozoans, encrusting and erect carbonatic taxa (e.g., mollusks, bryozoans, etc.), indicative of a residence time of >1 year.
The feasibility of ML removal was assessed based on the accessibility, degree of entanglement, and the level of biofouling, using a 0–3 scale: (0) 0% removal possibility; (1) <50% removable; (2) ≥50<90% removable; and (3) fully or almost fully removable (>90%). In addition, the number of individuals/colonies of vulnerable, erect species in contact with ML was recorded. To assess the ML density in the absence of an underwater navigation system, the surveyed area per ROV dive was calculated from the estimated ROV dive length (i.e., derived from the vessel GPS coordinates at the ROV entry and exit points) and an estimated field of view of 2.5 m.

2.3.2. Gorgonian Population Density

Using previous knowledge of the area [63,64], and the information collected during the ROV dives for ground-truthing and ML assessment, two gorgonian populations were located and investigated, one population of Eunicella cavolini and one of Paramuricea clavata. ROV-based distance sampling was performed to estimate population density. During the specific assessment, the ROV followed vertical linear transects, placed perpendicular to the bathymetric contours. The ROV was positioned approximately 0.5–1 m above the seabed, and moved at a steady, slow speed. The camera faced downwards, at 90° degrees angle from the substrate, with an offset of no more than 25° degrees at times, to enable avoidance of obstacles (i.e., due to substrate rugosity and the presence of ML). The two points of the laser scaler (calibrated to show a 10 cm distance) were always visible during the video recording to enable estimation of the perpendicular distances between each colony and the transect line (i.e., the theoretical line running along the center of the field of view), the transect length (i.e., the length of the theoretical straight line along the center of the field of view that connects consecutive landmarks on the seafloor), and the maximum visible straight-line segment of each colony (i.e., a surrogate of colony size). Measurements were performed using the image processing ImageJ/Fiji 1.54p software [67], which supports sequential calibrations within the same image stack. The ROV video files (.mp4 format) were imported using the FFMPEG plugin, allowing frame-by-frame analysis. Following calibration of each frame, measurement lines were drawn and labeled accordingly (transect line/perp. distance/colony size) in the ROI Manager (Region of Interest), while measurement data were exported into a spreadsheet using a custom Java macro that preserved the associated labels. Transect lines, in particular, were drawn using stable, distinguishable landmarks on the seafloor visible across frames. The ROV’s forward movement was tracked by advancing to subsequent frames where the end-point landmark of the previous linear segment served as the starting point of the next. Calibration was repeated as necessary to ensure measurement accuracy. The total transect length was calculated as the cumulative sum of all measured linear segments across frames.
Data were divided into two strata representing the two populations. Population density was estimated using distance sampling modeling, which is well suited to account for imperfect detectability in population estimates [68]. This is done by modeling the detection function g ( y ) , which describes the relationship between the probability of detection P a   and the perpendicular distance ( y ) of the colonies from the transect line. The probability of detection P a along the transects can be estimated as:
P ^ a = 0 w g ^ y d y w
Population density is then estimated as:
D ^ = n a P a ^  
where w is the half-width of the transect (defined by the maximum detection distance), n is the number of recorded colonies, a is the surveyed area ( a = 2 w L ) , and L is the total length of the transects.
The detection function was modeled using the DISTANCE 7.5 Release 2 software [69] following [68] with the general form:
g y = k e y y [ 1 + s e r i e s y ] k e y 0 [ 1 + s e r i e s 0 ]
where k e y y   is a key function and a s e r i e s y expansion used to improve the model fit.
In total, 32 models were fitted using a set of combinations among: (i) two key functions, Half-normal k e y y = e x p ( y 2 2 σ 2 ) and Hazard-rate k e y y = 1 e x p [ y σ b ] , where σ is a scale parameter and b a shape parameter, (ii) a series expansion among cosine, simple, and hermite polynomial, and (iii) two covariates: the colony size (i.e., estimated using the maximum visible straight-line segment of each colony), and the species (E. cavolini or P. clavata). The covariates were incorporated into the models using the multiple-covariate distance sampling (MCDS) approach [70].
The Akaike Information Criterion (AIC) was used for model selection [71,72], and a multi-model inference approach was followed, weighting parameter estimates from all models by their Akaike weights [72]. A right truncation was applied to the data, to ensure detectability did not fall below 0.15, as recommended by [68]. The overall goodness-of-fit of the selected models was examined using cosine-weighted and un-weighted Cramér-von Mises tests.

2.3.3. Population Structure and Health Status

Additional ROV dives were conducted to obtain high-resolution video footage of gorgonian colonies. Starting from the deepest sections and moving towards the shallowest areas of each population, the ROV was slowly maneuvered along a non-linear random path to capture close-up video footage of individual colonies. At each gorgonian encounter, particular attention was given to maintaining the camera perpendicular to the colony’s main axis and keeping the ROV laser points visible on each colony targeted for measurement, thereby ensuring proper calibration and measurement accuracy during image analysis.
ROV video footage was analyzed to extract high-quality image frames, targeting a minimum of 100 gorgonian colonies per population [73]. Frame selection followed a stratified semi-random approach (i.e., random images were obtained from different parts of each population) to ensure representative sampling across the entire spatial extent of each population. The ImageJ software (https://imagej.net/ij/index.html, accessed on 20 May 2025) was used to (a) calibrate each image using the fixed 10 cm distance between the two ROV laser points as a scale reference, and (b) to measure the maximum colony height, as the straight-line distance from the base of the colony to the tip of its furthest branch.
Using the same images, the health status of individual colonies was assessed visually according to three key indicators: (i) extent of injury, (ii) type of injury, and (iii) percentage of unaffected colonies (i.e., <10% injured surface area) [74,75]. Joint analysis of injury type and extent provides valuable information about the nature and timing of past disturbances [39,76]. The extent of injury was visually estimated as the proportion of colony surface devoid of coenenchyma tissue or colonized by epibionts, using the following categories: [0–10%), [10–50%), [50–100%), and 100% (dead colonies). Injury type was defined based on the colonization stage of epibionts [76]: Type A—exposed colony axis, indicating a recent injury (≤1 month); Type B—overgrowth by early colonizers such as filamentous algae and hydrozoans, suggesting a disturbance within the past 1–12 months; Type C—dominance of bryozoans, sponges, or well-developed and encrusting algae, indicating injuries >12 months.

3. Results

3.1. Results on Seabed Mapping

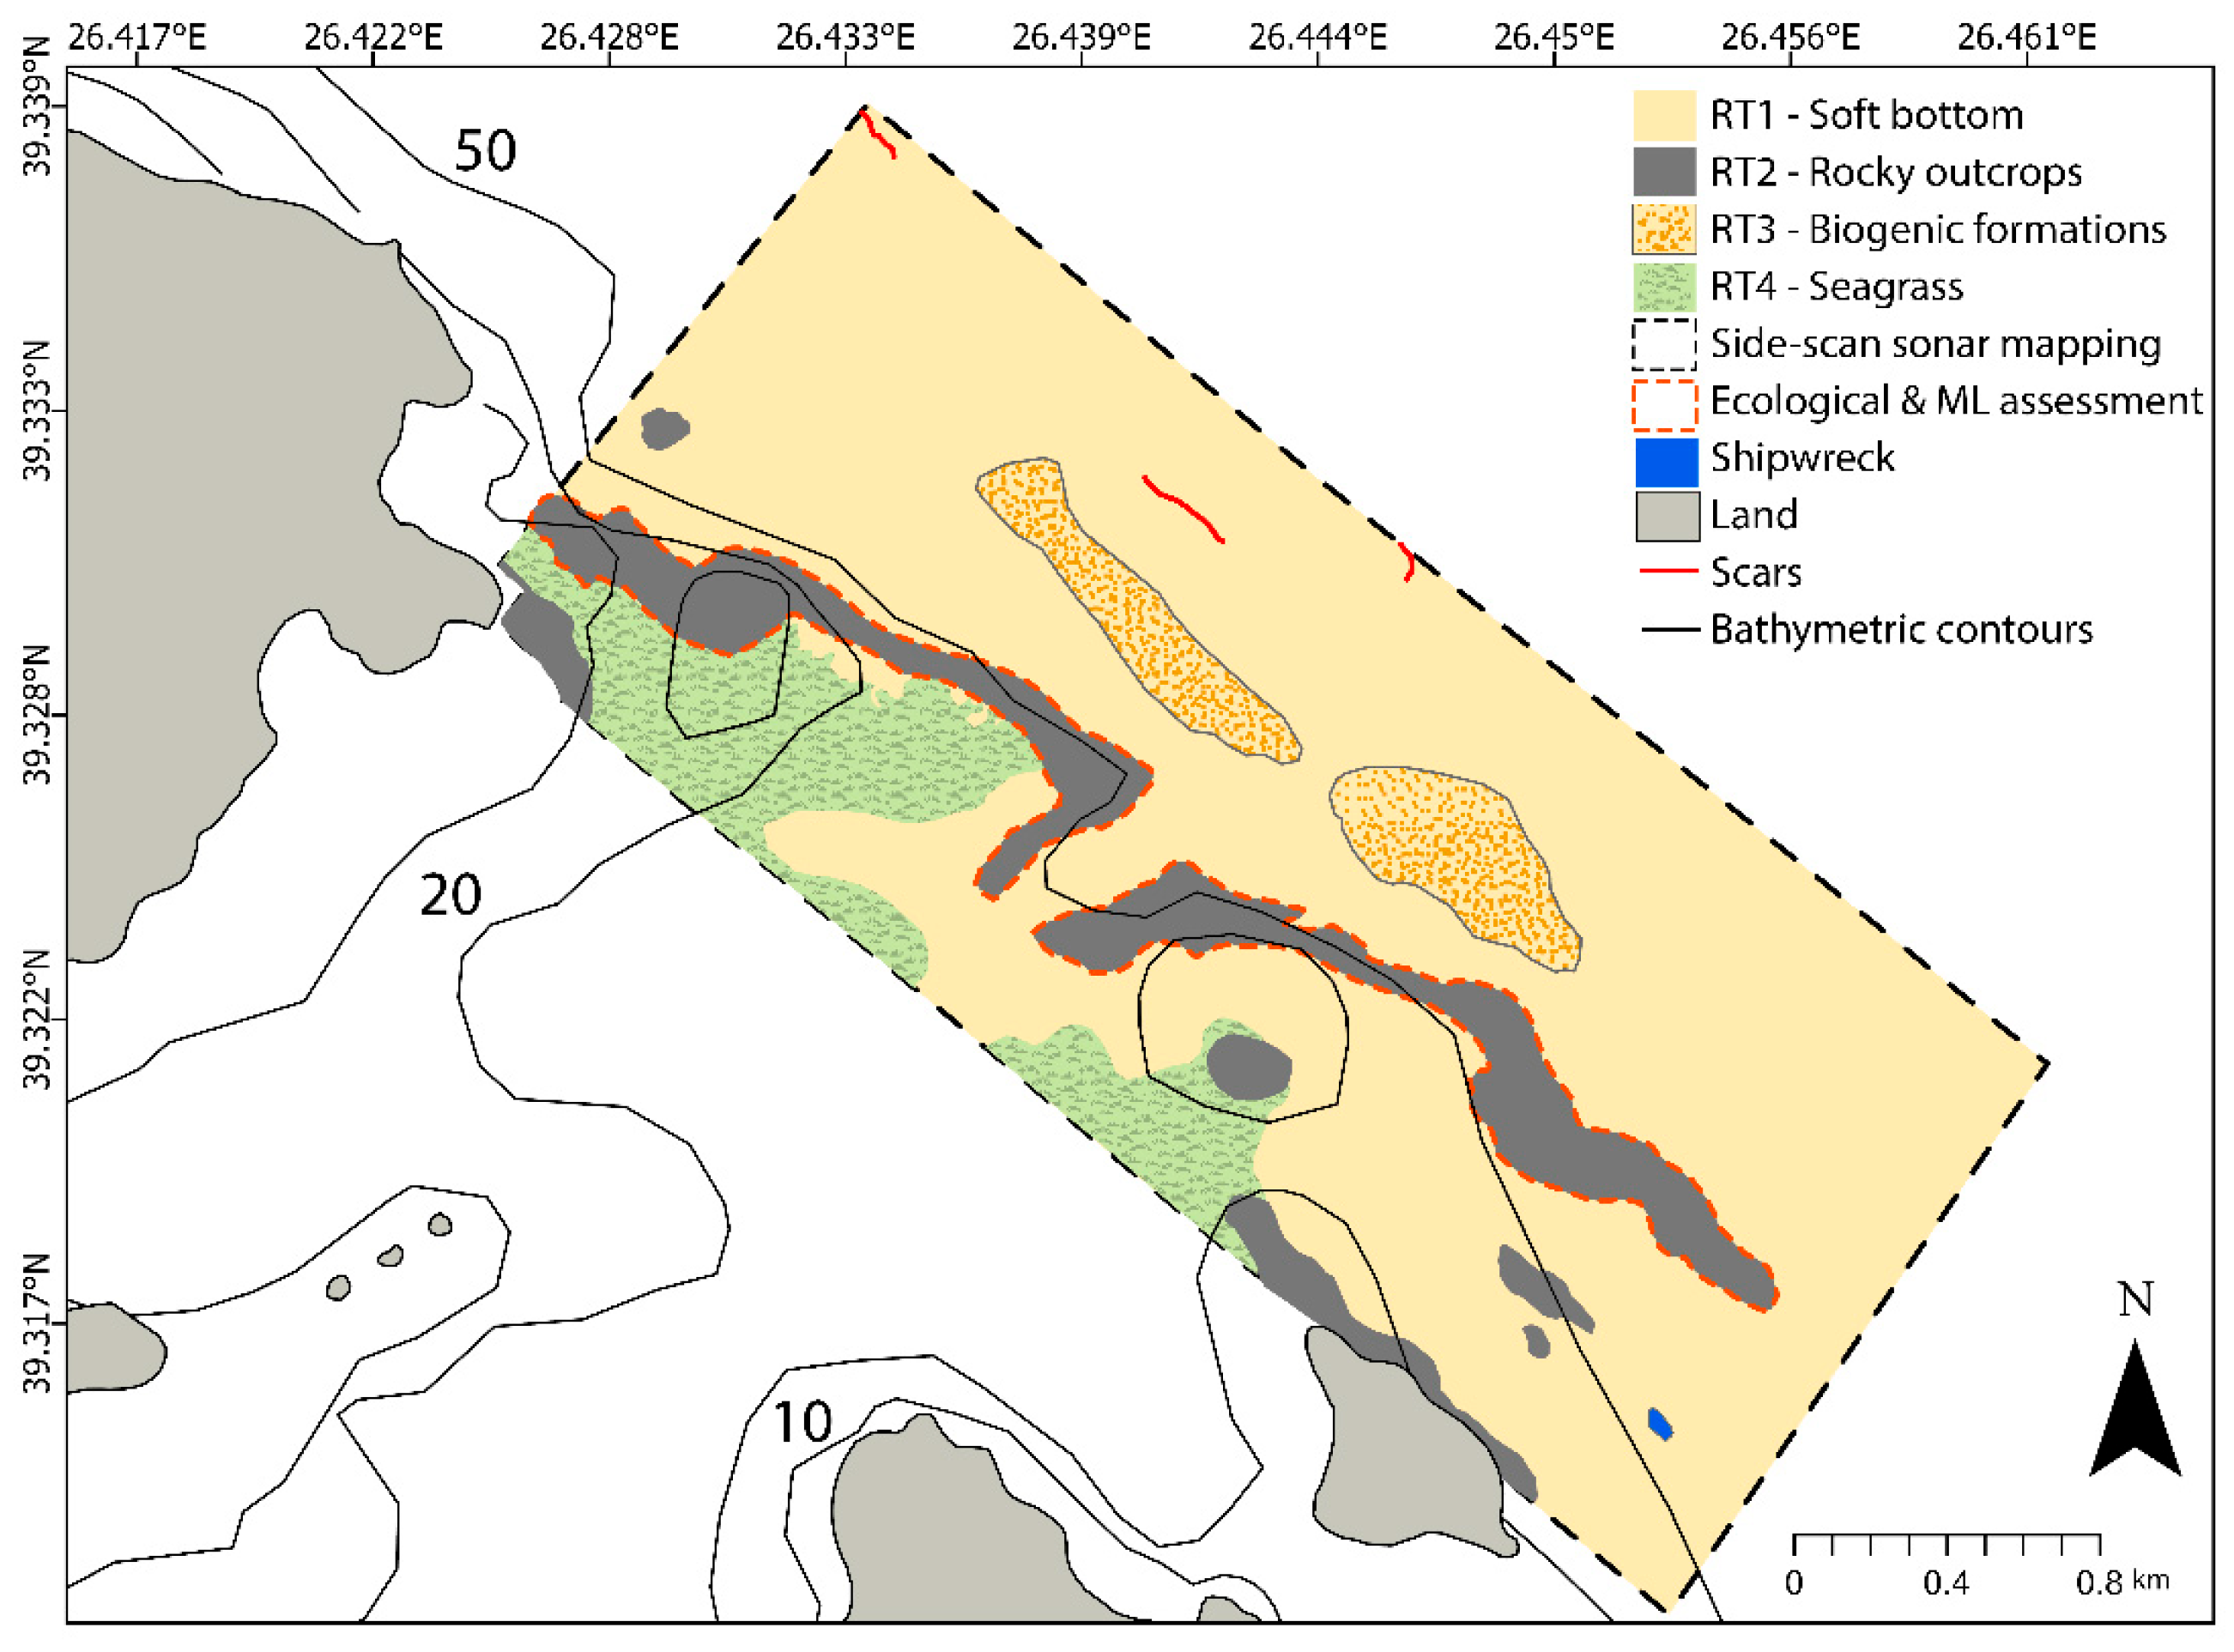
Analysis and interpretation of the individual SSS images and the sonar mosaic identified four reflectivity types (RT; Figure S2) that correspond to different substrates or habitat types (Figure 3), which were ground-truthed by ROV observations. RT1 exhibits relatively uniform medium-toned backscatter intensity, indicating an almost featureless seafloor covered by loose sediments (sands to muddy sands), and covers 72% of the surveyed area. RT2 displays a mixed (high to low) reflectivity pattern with acoustic shadows, indicating a highly uneven relief corresponding to exposed hard substrates (rocky outcrops). It occupies 11% of the study area and was detected in multiple locations, particularly along steeply sloping seafloor sections, where it forms two large, elongated outcrops with a northwestern-southeastern orientation (Figure 3).
The two elongated outcrops are separated by a ~200 m-wide corridor with moderately steep walls up to 10 m in height, resembling a channel-like feature (paleo-river), apparently covered by loose sediments. In the central part of the surveyed area, east of the elongated rocky outcrops, nearly circular patches of higher reflectivity within a medium-toned backscatter (RT3), few tens of centimeters in height, appear on the seabed, likely corresponding to small biogenic build-ups. These occupy approximately 7% of the study area. Similar formations, shaping a mounded relief of ~0.8 m in height, were observed by [77] further south, along the thalweg of a paleo-channel. RT4 exhibits a variable, medium-toned backscatter with small acoustic shadows, attributed to seagrass (P. oceanica meadows). This type occurs in the shallowest parts of the surveyed area and covers around 10% of the seabed.
Anthropogenic features were also detected, mainly within RT1. Specifically, the SSS survey revealed (i) a prominent shipwreck (Figure 3 and Figure S3b), ~60 m long and ~10 m wide, rising more than 8 m above the seabed, with clearly visible crane masts on one side, and (ii) occasional linear scars, up to 250 m long, likely resulting from anchoring or bottom trawling (Figure 3).

3.2. Results on Marine Litter and Gorgonian Population Assessment

3.2.1. Results on Marine Litter

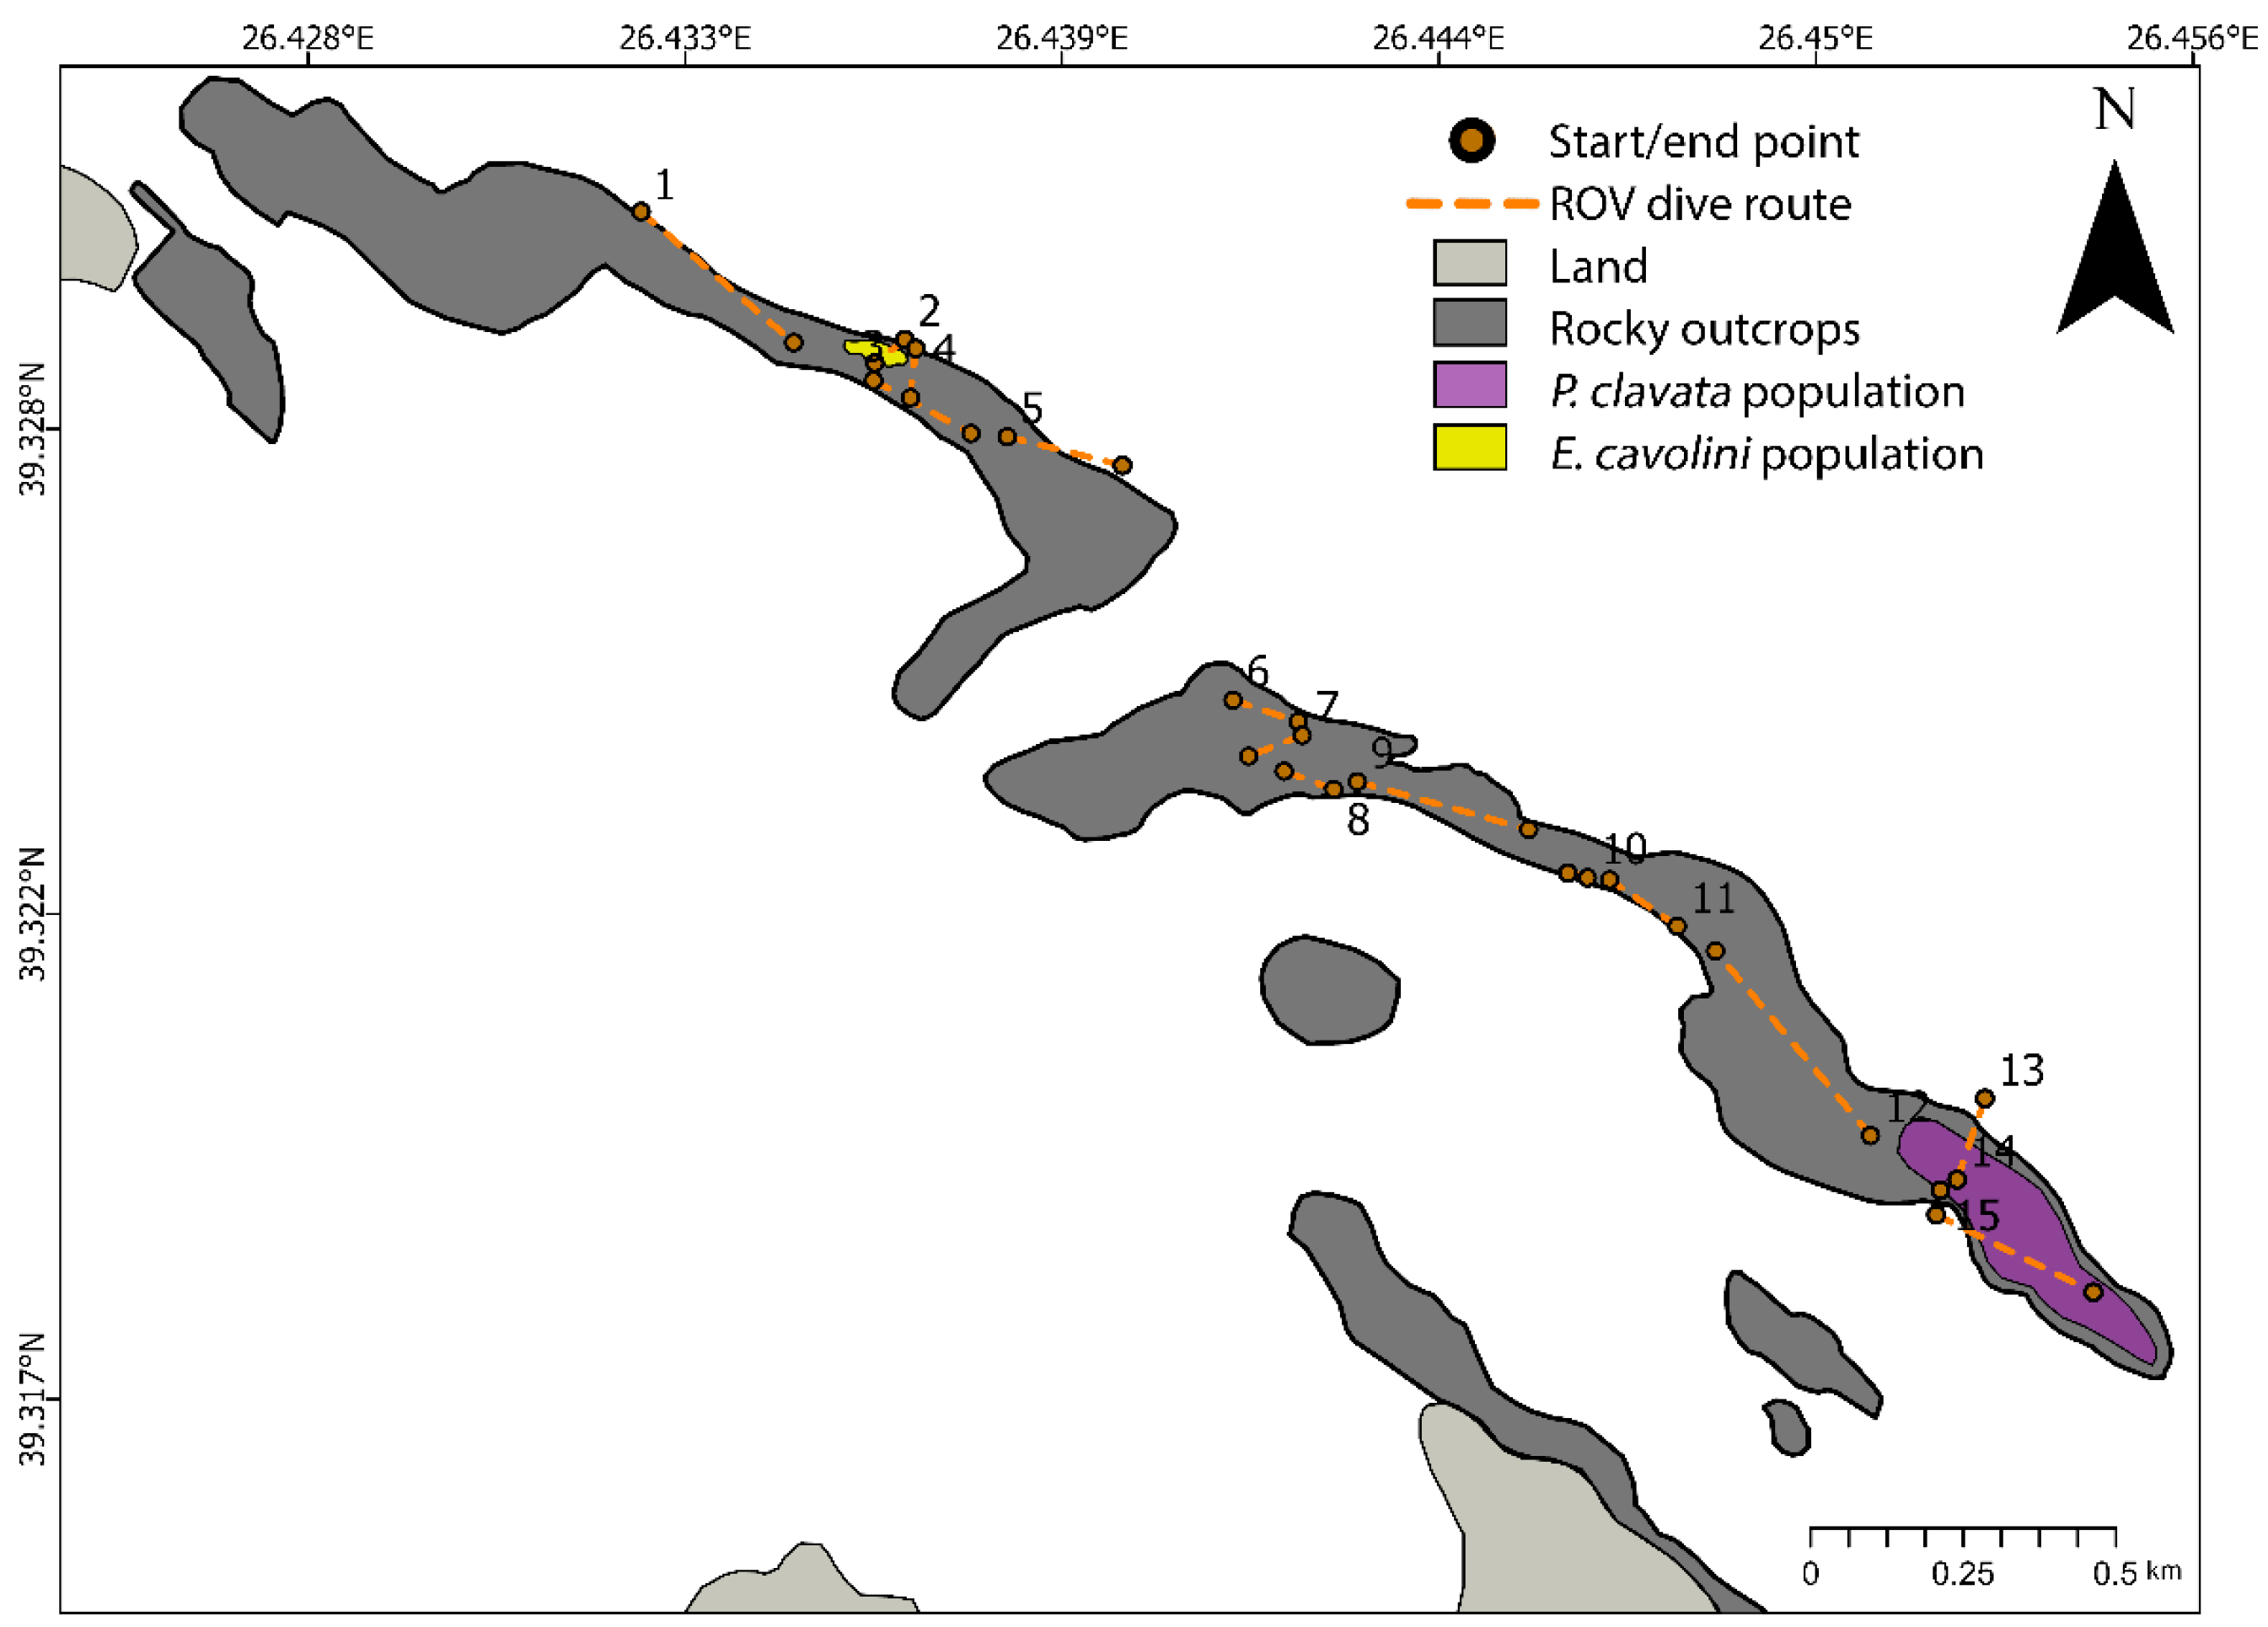
The ML assessment was conducted during 15 ROV dives (Figure 4, Table S2), covering a total area of 4798 m2 (range: 45–777 km2), across a depth range of 20–60 m. In total, 6 hr 53 min (range: 7–60 min) of video footage were analyzed. ML items were recorded between 24 and 59 m depth, with a mean occurrence depth of 43.7 ± 8.0 m (± standard deviation).
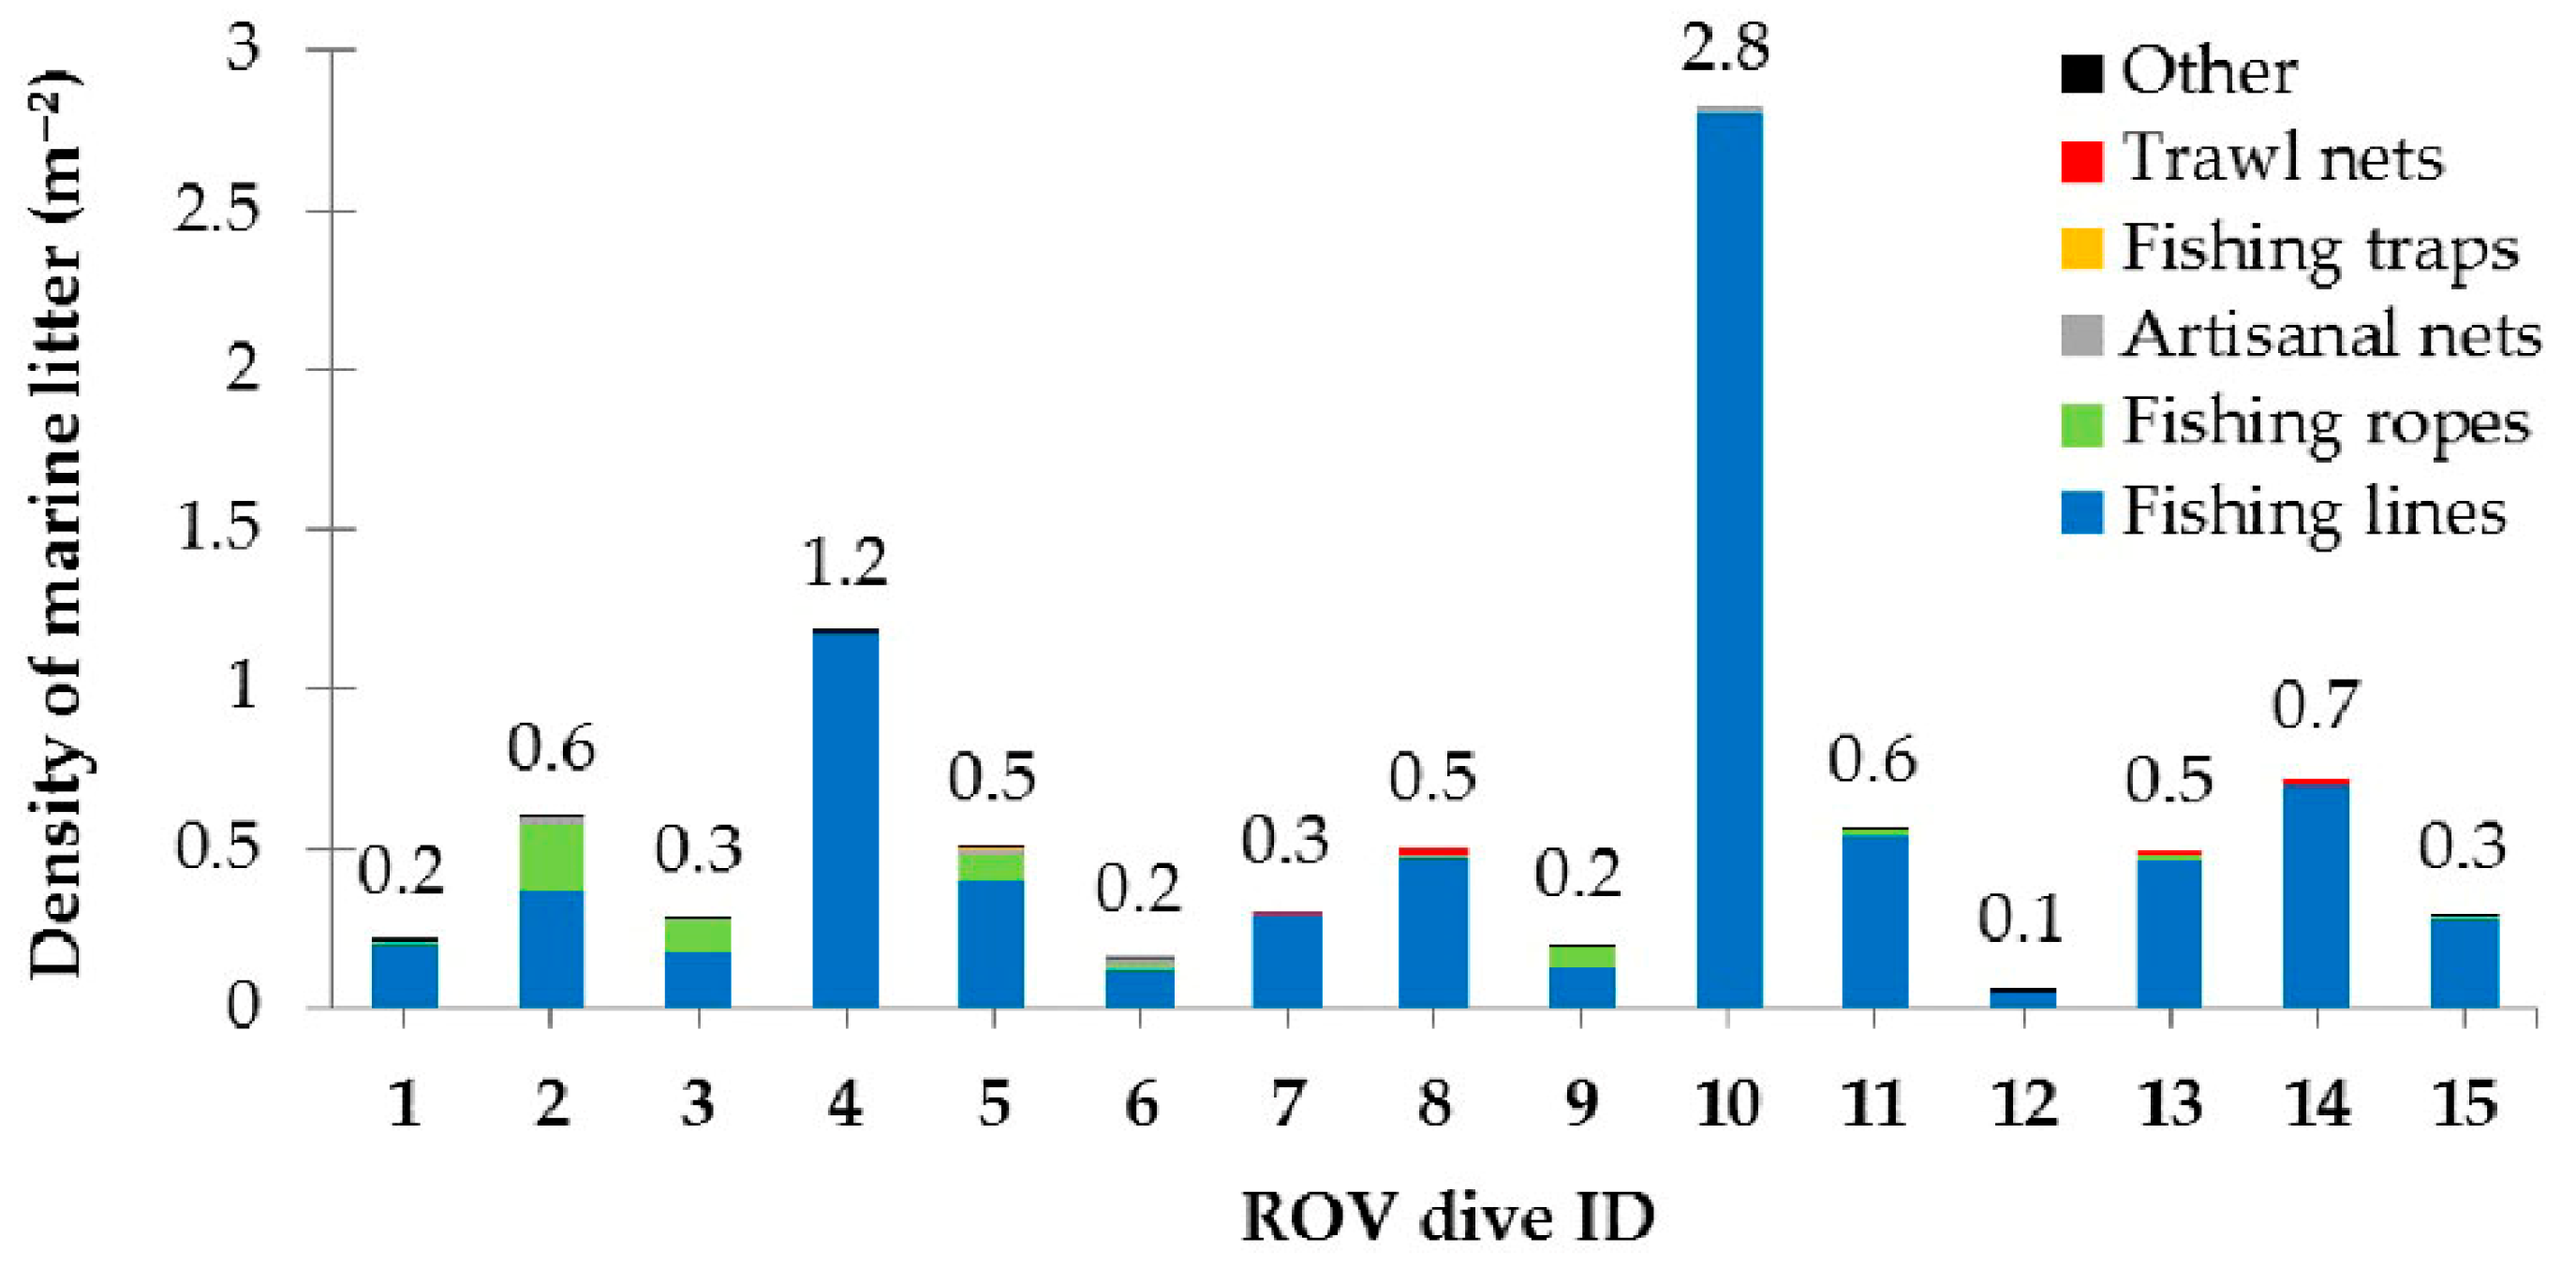
The total number of ML items observed in contact with benthic habitats and associated species was 1626, with an estimated density of 0.6 ± 0.7 items m−2. ML was present in all ROV dives, with the highest observed density during dive 10 (2.8 m−2) (Figure 5). The vast majority were fishing lines (88.3%), followed by fishing ropes (9.3%), other fisheries-related items (nets, traps, and anchors; collectively 2.0%), and miscellaneous other ML (<1%) (Figure 5, Table 1).
Most fishing lines and ropes were hanging (49.3%), covering/entangled (33.6%), or lying passively (15.2%). All ML showed some level of fouling, mostly Stage 3 (60.5%), followed by Stage 2 (32.2%) and Stage 1 (7.1%). Considering ML accessibility, interaction with substrate and associated organisms, and fouling stage, 32.0% of ML items had 50–99% removal potential, 29.4% had <50% removal potential, 26.5% had 100% removal potential, and 13% had 0% removal potential (Table 1).
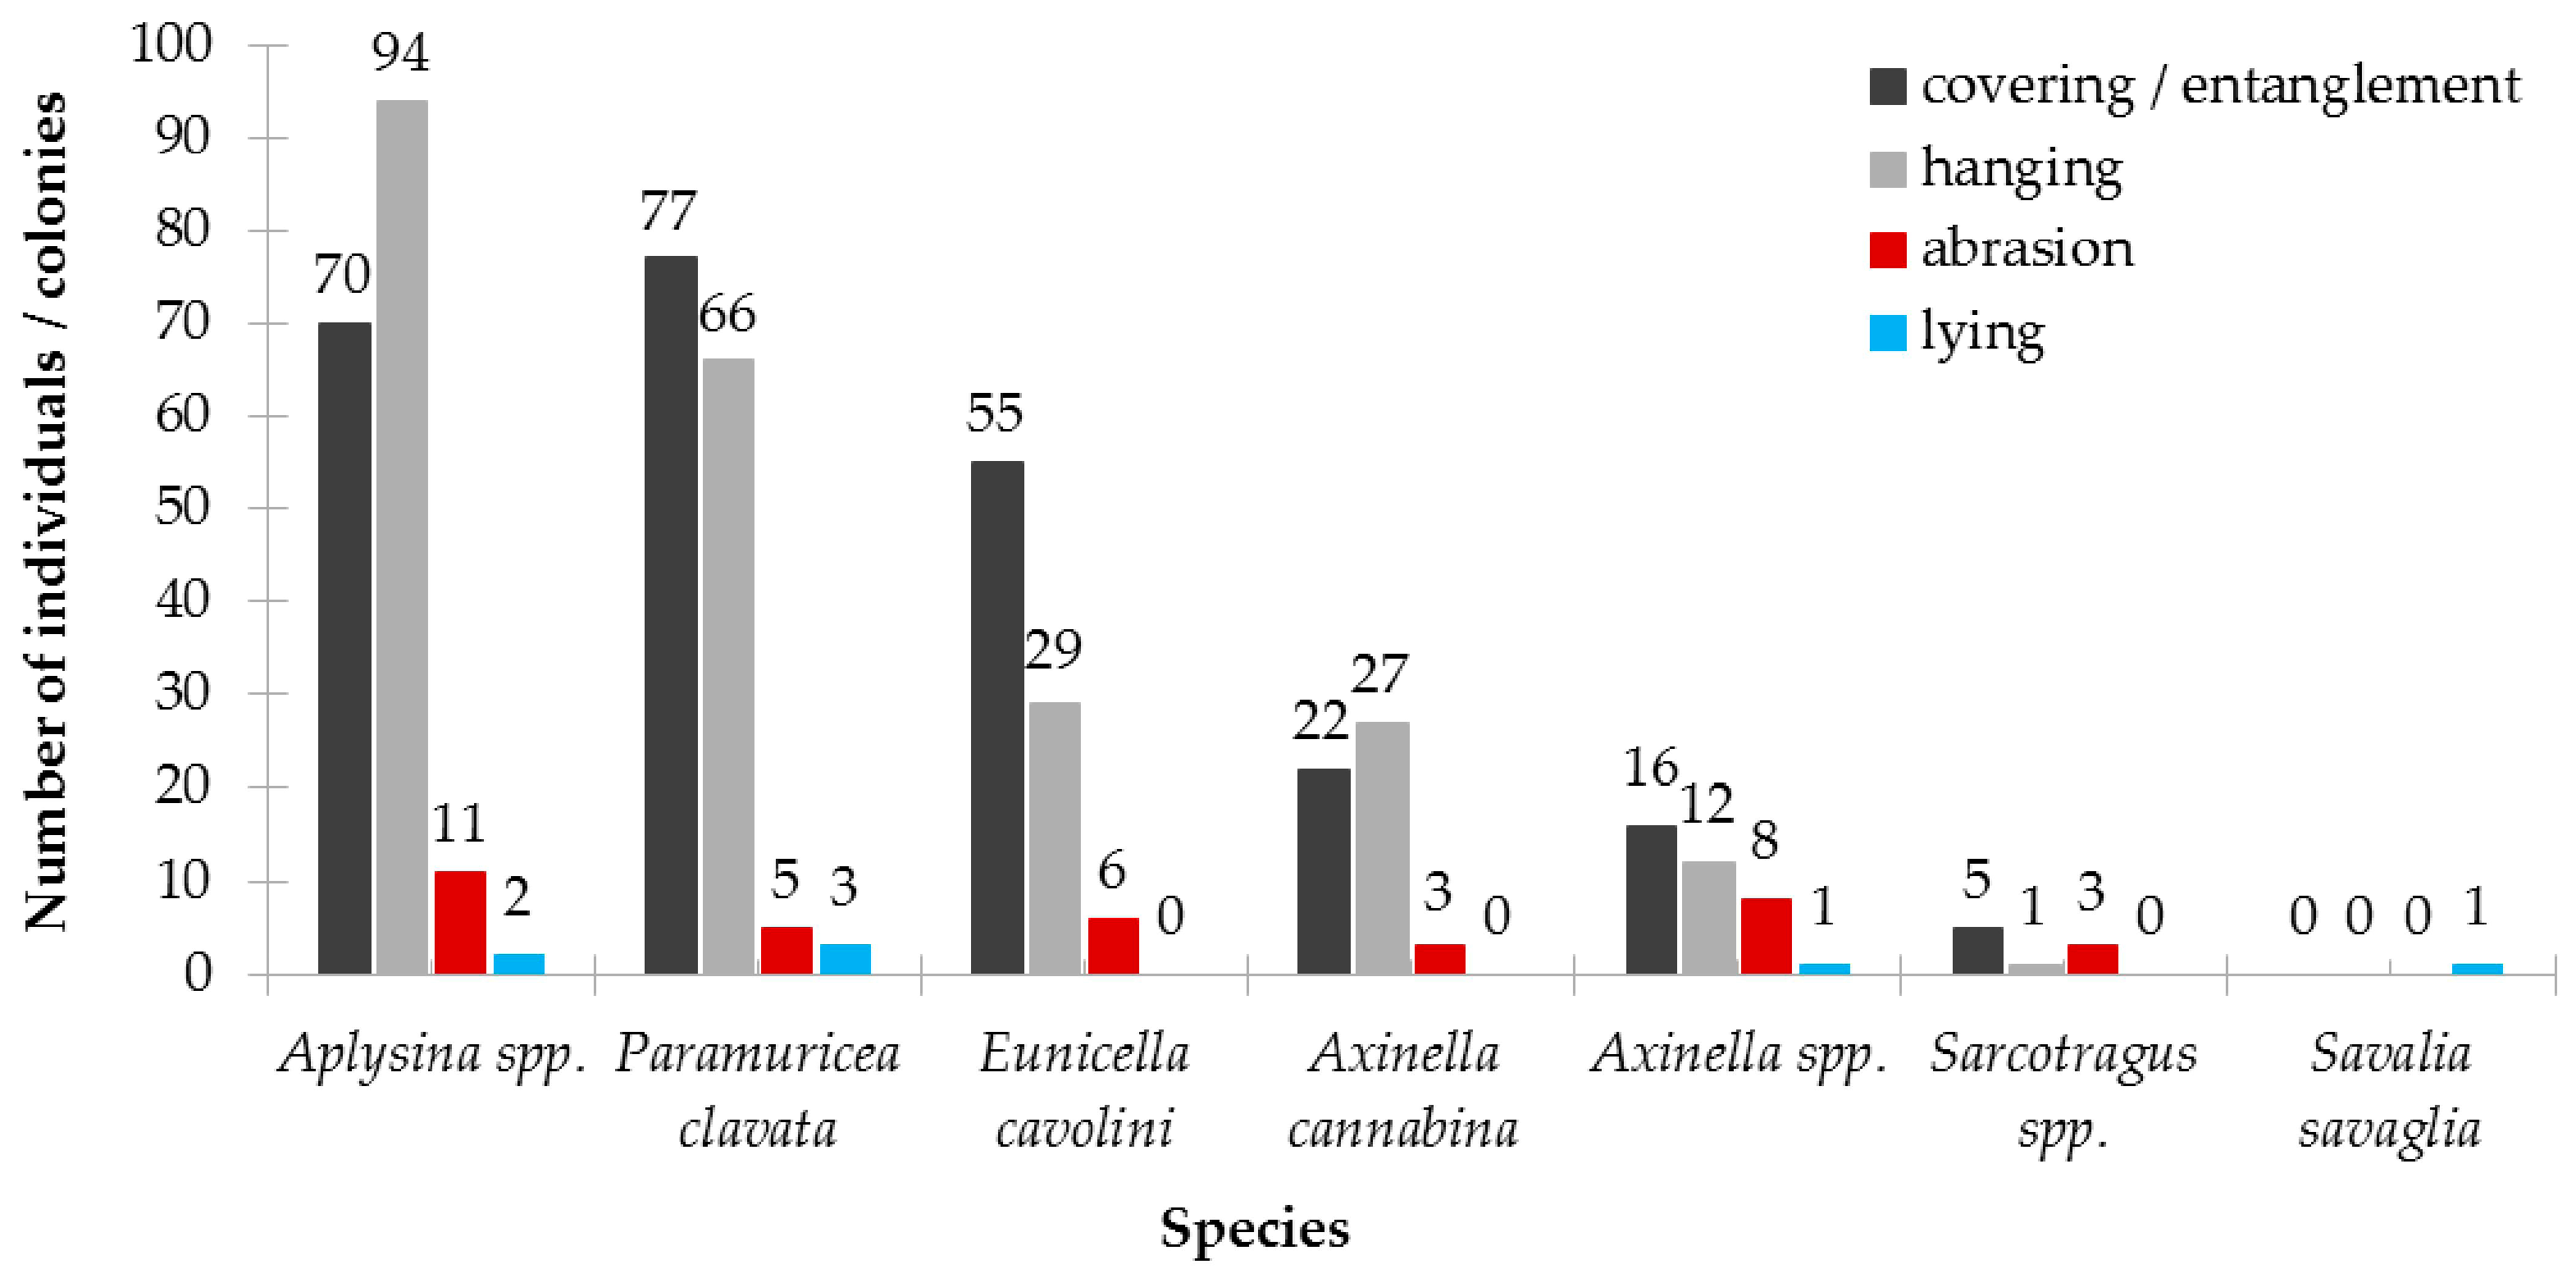
A total of seven vulnerable or protected taxa (Table S3) were recorded in contact with ML: four Porifera—Aplysina spp., Axinella cannabina (Esper, 1794), Axinella spp., and Sarcotragus spp.—and three Cnidaria—Eunicella cavolini (Koch, 1887), Paramuricea clavata (Risso, 1827), and Savalia savaglia (Bertoloni, 1819)—(Figure 6). Out of 517 individual/colony interactions, Aplysina spp. accounted for 34.2%, followed by P. clavata (29.2%), E. cavolini (17.4%), A. cannabina (10.1%), Axinella spp. (including A. polypoides; 7.2%), Sarcotragus spp. (1.7%), and a single interaction with S. savaglia. Interactions were mainly covering/entanglement (47.4%), followed by hanging (44.3%), abrasion (7.0%), and lying (1.4%) (Figure 6).

3.2.2. Results on Gorgonian Population Density

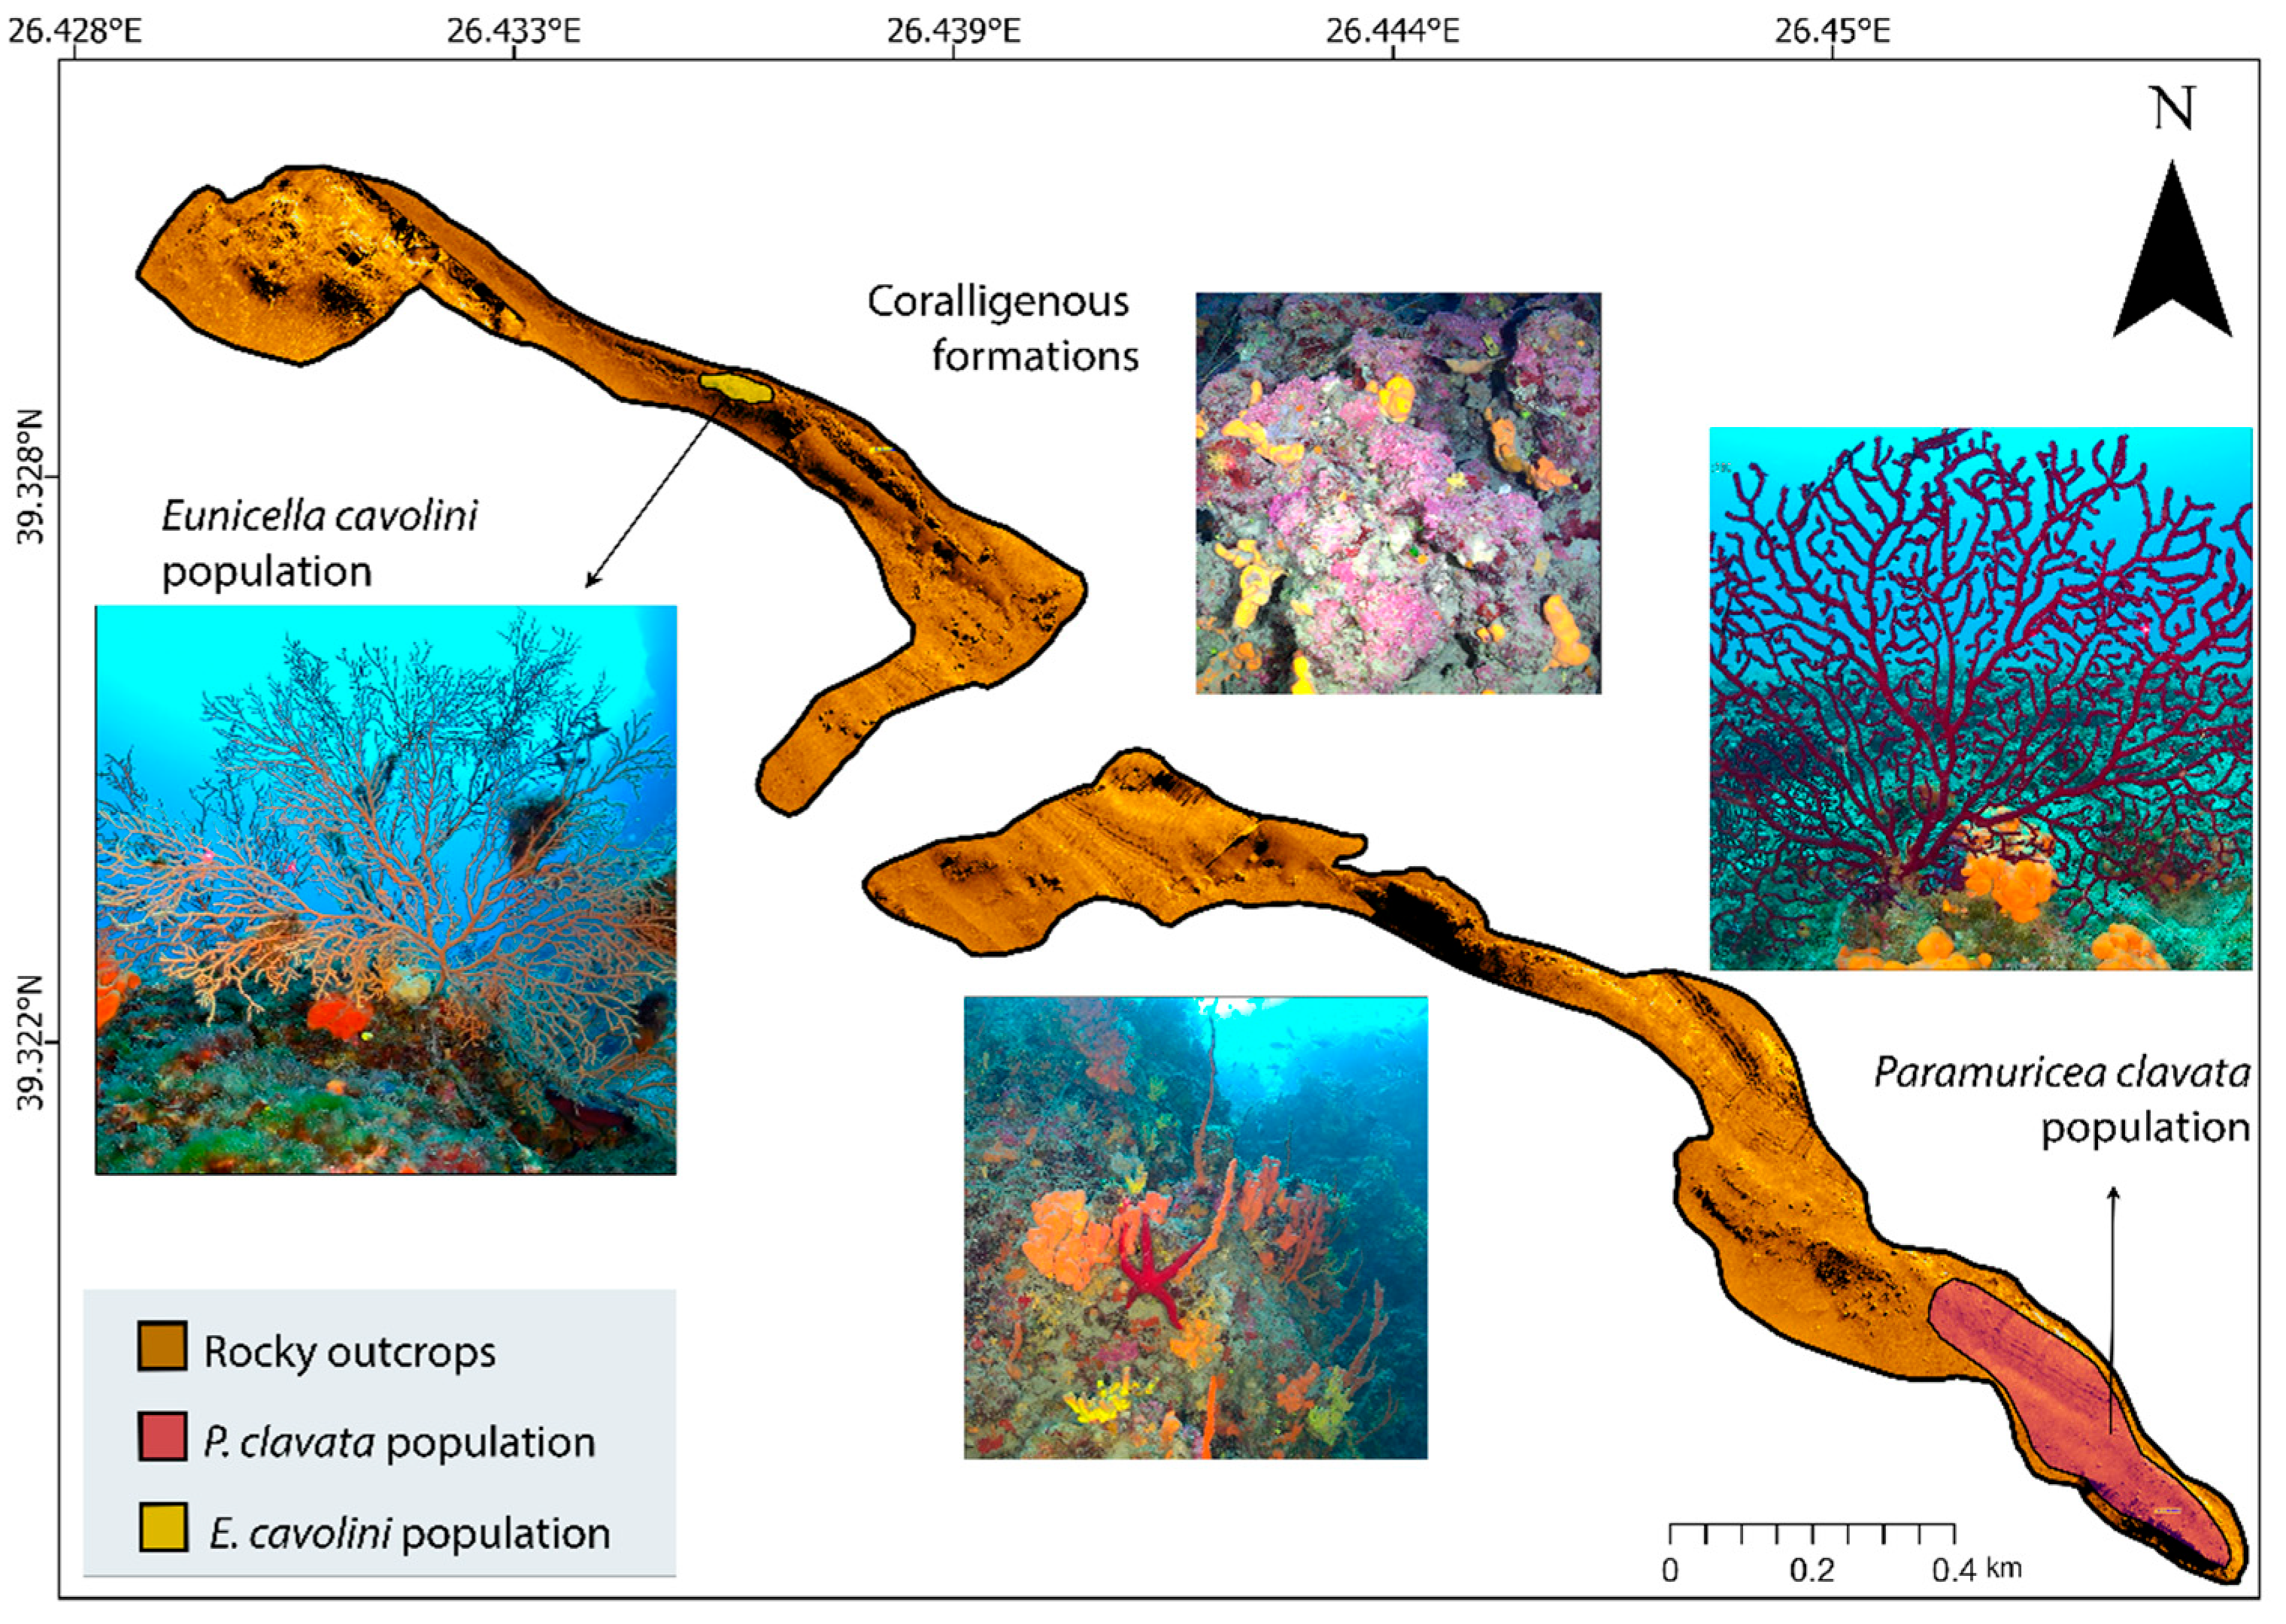
Information obtained from the ROV dives for ground-truthing and ML assessment revealed the presence of two gorgonian populations, located ~1500 m apart (Figure 7 and Figure S4). The core of the E. cavolini population occurs at the northern rocky shoal at 30–45 m depth, although scattered individual colonies were also detected elsewhere on the rocky shoals, whereas the P. clavata is more spatially restricted, occurring at the southernmost end of the southern shoal at 45–56 m depth (Figure 7 and Figure S4).
Distance sampling surveys were carried out along six transects for E. cavolini and ten transects for P. clavata. The surveyed area for E. cavolini covered 731 m2, with transects positioned between 29 and 43 m depth. For P. clavata, a total area of 1038 m2 was surveyed across transects between 47 and 57 m depth. Density estimates were based on 104 detections for E. cavolini and 615 for P. clavata, following right truncation of data. Based on AIC model selection, the best-supported model among the 32 candidate models (Table S4) was the one with a half-normal as key function, no series expansion, and species as a covariate. Four additional models had ΔAIC < 2 and were therefore considered in multi-model inference: (i) half-normal key function with no series expansion and both species and size as covariates (ΔAIC = 1.91); (ii) half-normal with one cosine adjustment term and species as a covariate (ΔAIC = 1.92); (iii) half-normal with one simple polynomial adjustment term and species as covariate (ΔAIC = 1.93); and (iv) half-normal with one hermite polynomial adjustment term and species as a covariate (ΔAIC = 1.96). All supported models showed a good fit to the data, as indicated by both cosine-weighted and unweighted Cramér-von Mises tests (all p values > 0.05).
The estimated density of E. cavolini was 0.35 colonies m−2 (95% confidence interval (CI): 0.14–0.57) and for P. clavata 1.47 colonies m−2 (95% CI: 0.94–1.99). The coefficient of variation (CV) indicated greater relative variability in the density estimate of E. cavolini (31.0%) than in P. clavata (18.4%), suggesting lower precision for the former.

3.2.3. Results on Population Structure and Health Status

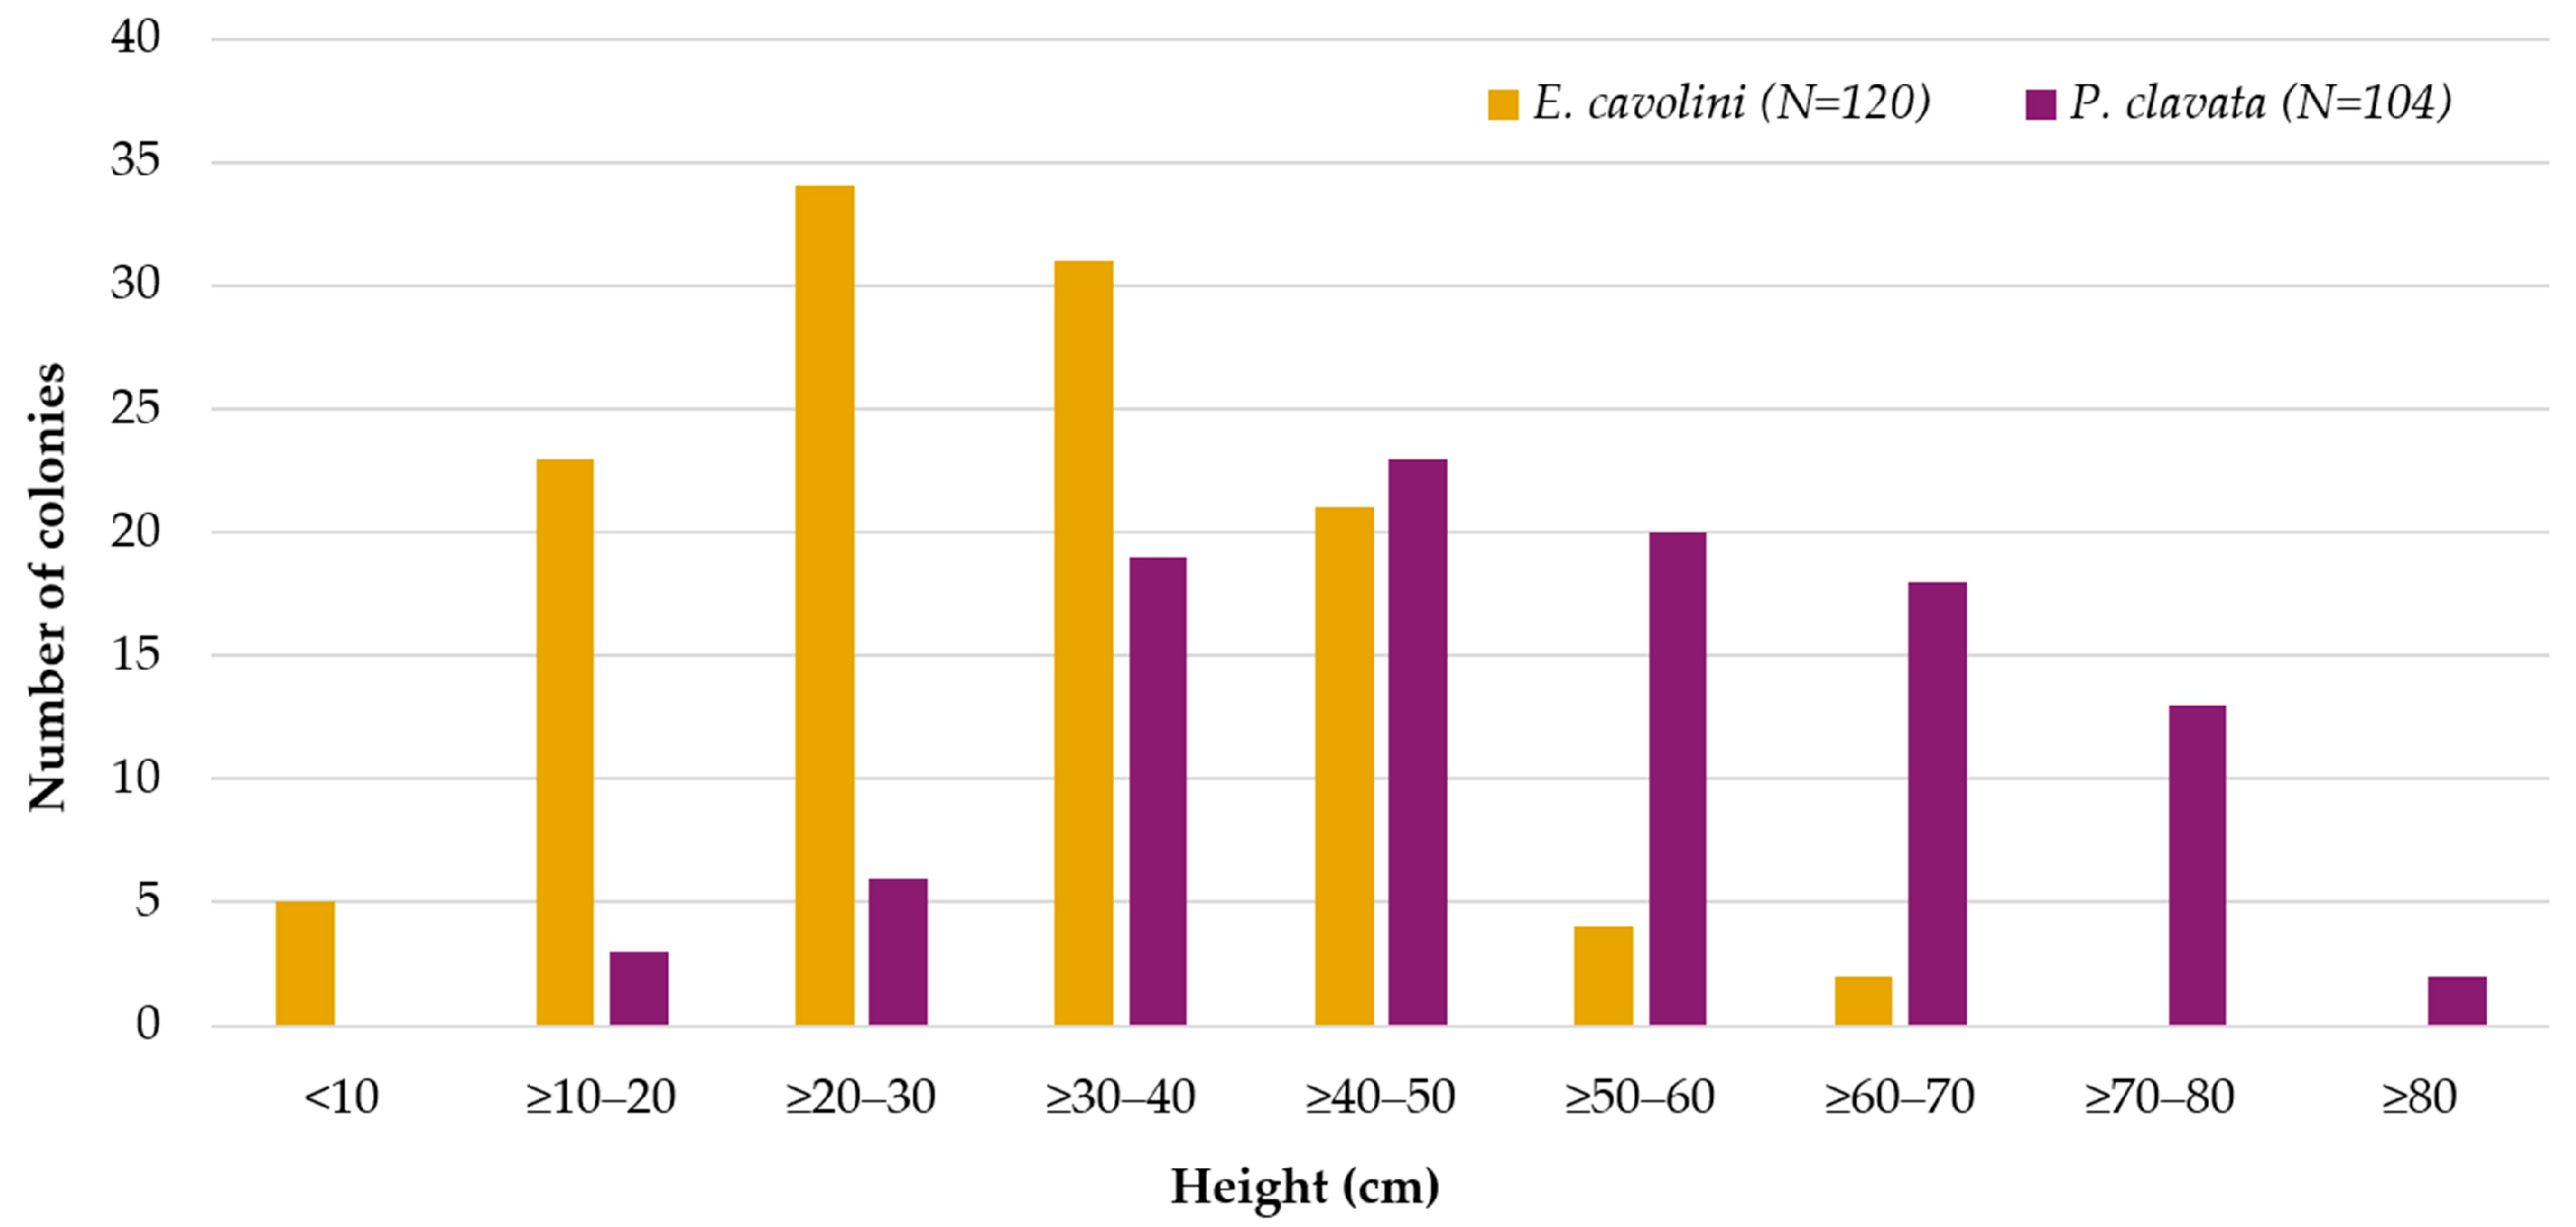
The height frequency distribution for E. cavolini ranged between 4.3 and 65.5 cm, with a mean of 29.7 ± 12.5 cm (SD). Skewness indicated a roughly symmetrical distribution, while kurtosis suggested no prevalent peakedness (Figure 8, Table 2). The height frequency distribution for P. clavata ranged from 10.3 to 86.9 cm, with a mean of 50.6 ± 16.3 cm. It also appeared approximately symmetrical lacking prevalent peakedness (Figure 8, Table 2).
In both populations, most colonies exhibited low injury levels, with 83% of E. cavolini and 84% of P. clavata showing <10% injured surface area. Moderate injury levels (10–50%) were recorded in 17% of E. cavolini and 13% of P. clavata colonies. Complete tissue loss (100%—dead colonies) was rare, occurring in only 1% of E. cavolini and 4% of P. clavata colonies (Table 3). Most injured or dead colonies exhibited type C injuries (E. cavolini: 61.9%; P. clavata: 64.7%), fewer displayed type B injuries (E. cavolini: 38.1%; P. clavata: 35.3%), while none exhibited type A injuries (i.e., <1 month old) (Table 3).

4. Discussion

The combined use of SSS and targeted ROV surveys enabled the collection of quantitative data on the distribution of coralligenous formations and gorgonian populations within a marine area originally designated as a Natura 2000 site (SAC GR4110015) only for Posidonia oceanica beds. This approach facilitated the detailed mapping of the Tokmakia drop-off, a heterogeneous seascape where coralligenous assemblages occur primarily along steep rocky shoals, but also as small patches on adjacent soft bottoms. These findings are consistent with previous studies highlighting the mosaic nature and structural complexity of coralligenous systems both across the Mediterranean [1,2,3] and within the Aegean Sea (e.g., [51,53,64]).
Within this diverse seascape, E. cavolini and P. clavata formed distinct monospecific ecological facies (i.e., areas where gorgonians dominate the assemblages), occurring at different sites along the rocky drop-off and across different depth ranges, with P. clavata occupying slightly deeper zones than E. cavolini. Although co-occurrence of the two species is common (e.g., [78,79]), spatial segregation is also frequently observed [79,80], reflecting differences in ecological preferences and tolerance to environmental and anthropogenic stressors [81,82,83,84].
The two species also displayed clear differences in their density. P. clavata exhibited a significantly higher density (1.46 colonies m−2) than E. cavolini (0.35 colonies m−2). These values are notably lower than those reported for comparable depths in the western Mediterranean, where densities often exceed 20 colonies m−2 [63]. In the northern Aegean, reported mean densities of E. cavolini range from 4.5 to 34.8 colonies m−2 [63,80]. The population documented here has a density about six times lower than that previously reported for the same site (6 colonies m−2 at “Palios” [63]). In contrast, the mean density of P. clavata, though relatively low, falls within the range reported for other northern Aegean sites (1–14.5 colonies m−2; [80]).
The lower density of E. cavolini may reflect local environmental conditions, habitat extent, or disturbance history, but methodological differences must also be considered. Previous studies relied on quadrat or transect sampling by SCUBA diving [63,80], whereas the present estimates were derived from ROV-based distance sampling along extended transects. Quadrat sampling captures fine-scale patchiness, whereas ROV transects integrate broader-scale patterns, potentially smoothing local variation. Comparative studies applying both methods simultaneously would be critical to disentangle ecological variation from methodological effects.
The height structure of E. cavolini is consistent with patterns reported for both shallow [63,80] and deep populations [84], although small colonies (<10 cm) were scarce. P. clavata colonies were generally larger, matching sizes reported elsewhere in the Aegean Sea [80] and the wider Mediterranean [74], and also showed a notable scarcity of juveniles. While smaller colonies may be under-detected by ROV, similar patterns reported in quadrat-based surveys [63] in this area suggest genuinely low recruitment. Nevertheless, the presence of large colonies in both populations indicates stable environmental conditions allowing long-term persistence. Such stability may offset low recruitment, as larger colonies contribute disproportionately to sustain populations, given that gamete production and reproductive output scale exponentially with colony size [13,85,86].
Injury levels were generally low in both populations, with most colonies showing <10% injured surface area. Injuries may result from abrasion, predation, or tissue necrosis under thermal stress, potentially leading to partial necrosis or total colony mortality [87]. Both gorgonian species are highly vulnerable to thermal stress and have suffered repeated mass mortalities linked to marine heatwaves in the northwestern Mediterranean (e.g., [75,88,89]. The relative isolation and rather deep distribution (i.e., >30 m) of the Tokmakia populations [63] may buffer them from anthropogenic pressures such as pollution, sedimentation, eutrophication, and ocean warming [23,42,43]. The low injury levels observed in E. cavolini, along with the prevalence of large colonies, suggest no major mortality events in the past 14 years, in agreement with earlier reports [63]. For P. clavata, the absence of historical data precludes similar conclusions.
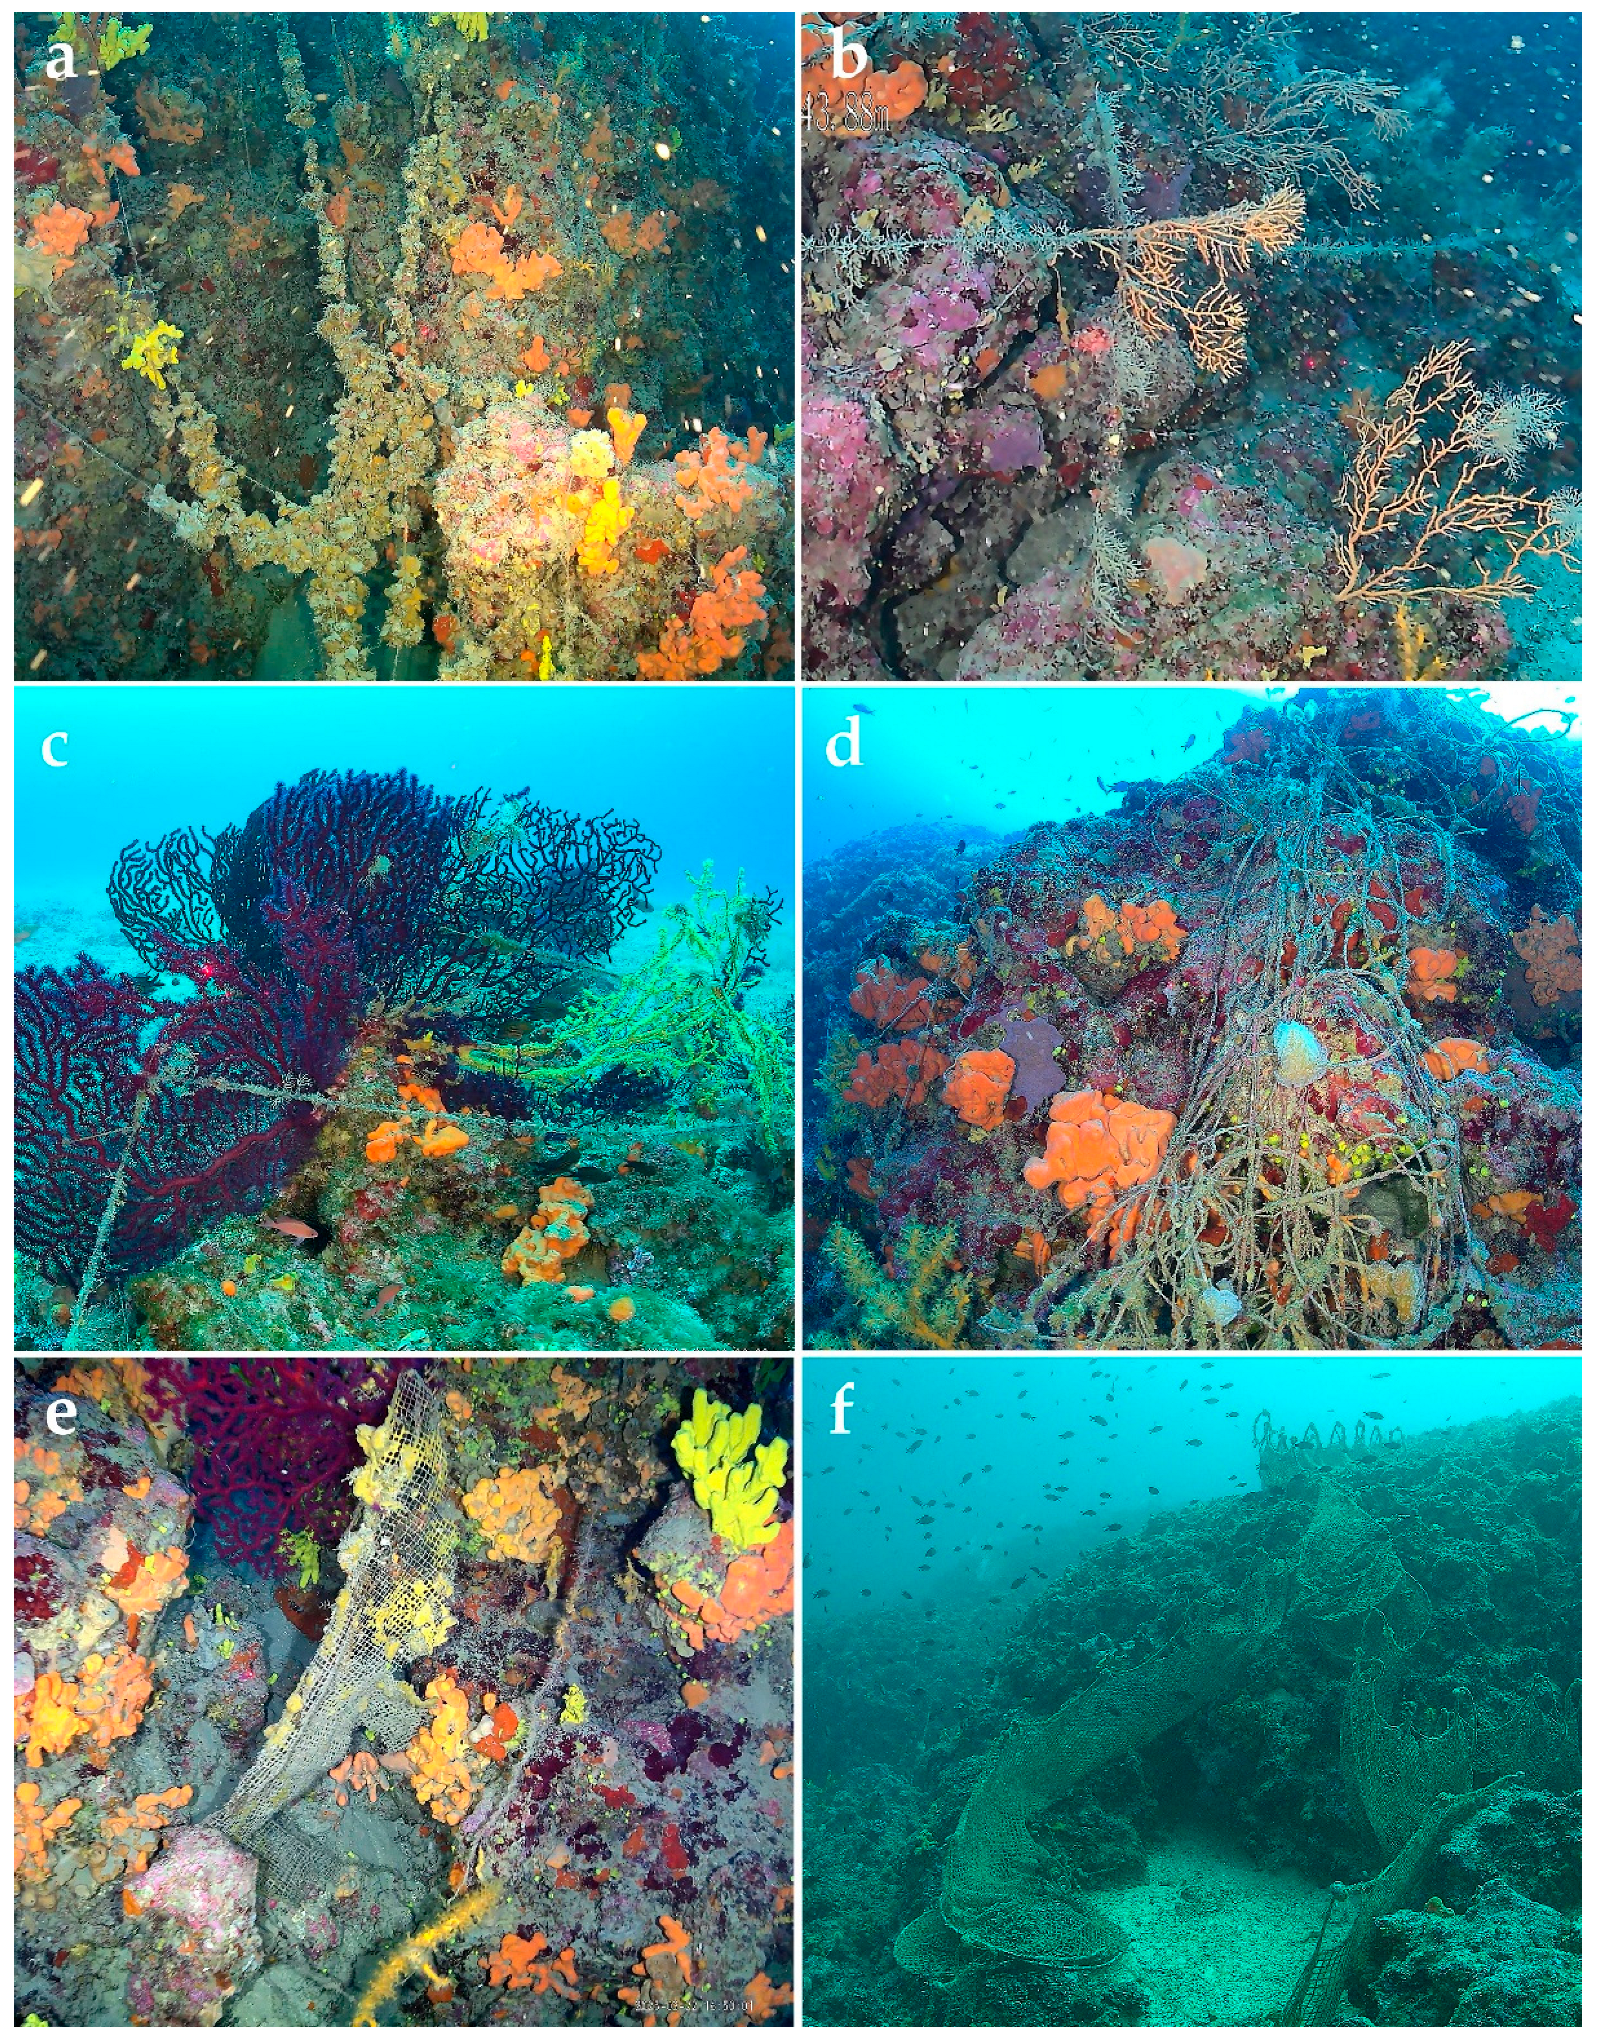
Despite this apparent resilience, fisheries-related marine litter was abundant (Figure 9). Fishing lines and ropes dominated marine litter, consistent with reports from other Mediterranean reefs where small-scale and recreational fishing are widespread (e.g., [29,30,32,90,91,92]). Such litter mainly affects arborescent taxa, like gorgonians [92,93,94]. The destructive potential of such interactions is well documented, with Costa et al. [93] reporting the mortality of over 60 P. clavata colonies entangled in a single abandoned trammel net.
Most litter exhibited advanced fouling, confirming long residence times and persistence impacts [29,32]. Entanglement and hanging were the most frequent interaction types, primarily affecting structural taxa, such as gorgonians and sponges, in agreement with [27,28,32,33]. As fouled gear becomes heavier, it imposes increased mechanical stress on benthic organisms, leading to tissue abrasion, breakage, and detachment [29,30,31,32]. Over time, these chronic impacts reduce the fitness and survival potential of affected organisms, leading to habitat degradation and loss of structural complexity, with cascading effects on the associated biodiversity [36,90,93].
Regarding ML management, removal feasibility varied substantially. A risk-based clean-up strategy, focused on retrieving lightly fouled, hanging fishing gear with minimal entanglement, offers a practical approach to minimize further harm, whereas heavily fouled or tightly entangled items should generally be left in place to avoid collateral damage [32,34,94]. These findings carry important implications for the future management of Marine Protected Areas (MPAs), where conservation efforts must carefully balance litter removal with the protection of sensitive benthic habitats and species. Targeted, low-impact removal strategies, informed by knowledge of litter distribution and persistence, as the information provided herein, are essential for the effective intervention, and long-term preservation of structural complexity and biodiversity within MPAs.
Our methodological approach, which combined acoustic backscatter classification with visual ROV observations, proved effective in overcoming single-sensor limitations. Acoustics offer broad spatial coverage but limited biological resolution, whereas ROVs provide fine-scale ecological detail over restricted areas [59,60,61,62]. Integrating these complementary datasets improved habitat discrimination, as merging large-scale acoustic context with fine-scale imagery enhanced both operational breadth and ecological detail. Our workflow supports UNEP-MAP and MSFD priorities for systematic mapping and status assessment of coralligenous habitats ([2]; MSFD 2008/56/EC), while contributing to advances of multimodal underwater sensing for marine ecology and conservation [49,62].
Interpretation, however, must consider methodological constraints. Automatic SSS classification underperformed in heterogeneous terrain, requiring manual operator-based mapping [51,52,53]. ROV surveys, although non-destructive and high-resolution [34,49], were spatially limited and operationally constrained by currents and navigation uncertainty. Vessel GPS recorded positions only at deployment and retrieval, while cable length and drift introduced positional errors, affecting mapping accuracy. Distance sampling assumptions of perfect detection near the transect line and accurate measurements of perpendicular distances [68,69,70] may be compromised by camera angle and ROV altitude. Laser scaling and standardized survey protocols mitigated, but did not eliminate, these issues.
To enhance the robustness and precision of future assessments, several methodological refinements are recommended. Combining acoustic outputs with video imagery through machine-learning approaches would improve automated habitat mapping in complex seabed environments (e.g., [95]), supporting objective habitat classification in heterogeneous terrains. More advanced platforms—such as multi-beam echo sounders and AUVs equipped with multiple sensors, could further capture high-resolution 3D seafloor morphology (e.g., [96]), thereby increasing the spatial coverage, albeit at higher operational costs. Integrating ROVs with ultra-short baseline (USBL) positioning, inertial navigation systems, or acoustic tracking, and synchronized navigation, attitude, altitude and depth data would improve spatial accuracy and distance-sampling reliability, particularly when coupled with stable vehicle altitude and motion control. Finally, standardizing protocols, increasing temporal replication, and enhancing environmental metadata collection (e.g., temperature, currents, turbidity) would promote more rigorous and comparable management-oriented assessments.
Despite these limitations, our approach demonstrates the value of acoustic–optical integration for monitoring complex benthic systems and provides a cost-effective protocol which, with few improvements in tracking and geo-referencing, could advance systematic coralligenous mapping and monitoring. Most importantly, it provides quantitative baselines critical for MPA management including: (i) refined no-take and no-trawl zones along the drop-off; (ii) evidence-based marine litter mitigation, targeting accumulation corridors and entanglement hotspots, and (iii) population metrics that can be used to establish site-specific thresholds and indicators for MSFD and Habitats Directive reporting [17,18,49,50].

Supplementary Materials

The following supporting information can be downloaded at: https://www.mdpi.com/article/10.3390/jmse13122237/s1, Figure S1. Map of the Tokmakia drop-off based on side-scan sonar data (RT2- rocky outcrops), showing the position of 18 the different ROV dives for ground-truthing, and for marine litter and gorgonian population assessment. Figure S2. Side-scan sonar images showing the reflectivity type (RT) of key habitat types RT1–soft bottoms, RT2–rocky outcrops, RT3–biogenic substrates, RT4–seagrasses. Figure S3. Side-scan sonar images (a) part of an elongated outcropping area and (b) a prominent shipwreck resting on the seafloor. Figure S4. Sample photos of coralligenous assemblages and gorgonian colonies in the Tokmakia area, NE Lesvos Island, Greece. Table S1. Details of all ROV dives (Dive ID, date, geographic coordinates at the start and end of the dive), the different methods applied, and the ecological features of interest observed. Table S2. Details of the ROV dives during the ML assessment. Table S3. List of taxa recorded to be in contact with marine litter at the present study, and their protection status according to the Annexes of international conventions. Table S4. List of the 32 models fitted. Models are listed in order of relative model quality based on Akaike criterion differences (ΔAIC).

Author Contributions

Conceptualization, M.S. and S.K.; Methodology, M.S. and S.K.; Formal Analysis, M.S., A.B., A.M., A.N. and S.K.; Field surveys, J.C.A.P., O.A., G.P., A.B., A.M. and I.T.P.; Data Curation, A.B., A.M., A.N., M.S. and S.K.; Writing—Original Draft Preparation, M.S. and J.C.A.P.; Writing—Review & Editing, M.S., J.C.A.P., S.K., A.N., A.M., A.B., G.P. and I.T.P.; Visualization, M.S., A.N., I.T.P. and A.B.; Supervision, M.S., J.C.A.P., S.K. and T.H.; Project Administration, S.K. and A.D.M.; Funding Acquisition, S.K. and A.D.M. All authors have read and agreed to the published version of the manuscript.

Funding

This study was supported by the project NEMO-Tools (next-generation monitoring and mapping tools to assess marine ecosystems and biodiversity) and carried out within the framework of the National Recovery and Resilience Plan Greece 2.0, funded by the European Union—NextGenerationEU (implementation body: HFRI)—project number: 16035. The views and opinions expressed are, however, those of the beneficiaries only and do not necessarily reflect those of the European Union. Neither the European Union nor the granting authority can be held responsible for them.

Data Availability Statement

The data presented in this study are available upon request from the corresponding author.

Acknowledgments

The authors wish to thank our boat operator Nikos Hatzilias, Panagiotis Karsiotis for assistance in the field, Ioanna Kosma and Efi Irakleous for administrative support.

Conflicts of Interest

The authors declare no conflicts of interest. The funders had no role in the design of the study; in the collection, analyses, or interpretation of data; in the writing of the manuscript; or in the decision to publish the results.

Abbreviations

The following abbreviations are used in this manuscript:
AICAkaike Information Criterion
CIConfidence Interval
CVCoefficient of Variation
HNHSHellenic Navy Hydrographic Service
MCDSMultiple-Covariate Distance Sampling
MLMarine Litter
MSFDMarine Strategy Framework Directive
ROVRemotely Operated Vehicles
RTReflectivity Types
SDStandard Deviation
SEStandard Error
SSSSide-Scan Sonar

References

  1. Ballesteros, E. Mediterranean coralligenous assemblages: A synthesis of present knowledge. Oceanogr. Mar. Biol. Annu. Rev. 2006, 44, 123–195. [Google Scholar] [CrossRef]
  2. UNEP-MAP-RAC/SPA. Action Plan for the Conservation of the Coralligenous and Other Calcareous Bio-Concretions in the Mediterranean Sea; RAC/SPA: Tunis, Tunisia, 2008. [Google Scholar]
  3. Cerrano, C.; Bavestrello, G.; Bianchi, C.N.; Calcinai, B.; Cattaneo-Vietti, R.; Morri, C.; Sarà, M. The role of sponge bioerosion in the Mediterranean coralligenous accretion. In Mediterranean Ecosystems: Structures and Processes; Faranda, F.M., Guglielmo, L., Spezie, G., Eds.; Springer: Milano, Italy, 2001; pp. 235–240. [Google Scholar] [CrossRef]
  4. Laborel, J. Le concrétionnement algal “coralligène” et son importance géomorphologique en Méditerranée. Rec. Trav. Stn. Mar. Endoume Bull. 1961, 23, 37–60. [Google Scholar]
  5. Pérès, J.M.; Picard, J. Nouveau manuel de bionomie benthique de la Méditerranée. Rec. Trav. Stat. Mar. Endoume 1964, 31, 5–137. [Google Scholar]
  6. Boudouresque, C.F. Marine biodiversity in the Mediterranean: Status of species, populations and communities. Sci. Rep. Port-Cros Natl. Park 2004, 20, 97–146. [Google Scholar]
  7. Coll, M.; Piroddi, C.; Steenbeek, J.; Kaschner, K.; Ben Rais Lasram, F.; Aguzzi, J.; Ballesteros, E.; Bianchi, C.N.; Corbera, J.; Dailianis, T.; et al. The biodiversity of the Mediterranean Sea: Estimates, patterns, and threats. PLoS ONE 2010, 5, e11842. [Google Scholar] [CrossRef]
  8. Orejas, C.; Carreiro-Silva, M.; Mohn, C.; Reimer, J.D.; Samaai, T.; Allcock, A.L.; Rossi, S. Marine Animal Forests of the World: Definition and characteristics. Res. Ideas Outcomes 2022, 8, e96274. [Google Scholar] [CrossRef]
  9. Cerrano, C.; Danovaro, R.; Gambi, C.; Pusceddu, A.; Riva, A.; Schiaparelli, S. Gold coral (Savalia savaglia) and gorgonian forests enhance benthic biodiversity and ecosystem functioning in the mesophotic zone. Biodivers. Conserv. 2010, 19, 153–167. [Google Scholar] [CrossRef]
  10. Carvalho, S.; Cúrdia, J.; Pereira, F.; Guerra-García, J.M.; Santos, M.N.; Cunha, M.R. Biodiversity patterns of epifaunal assemblages associated with the gorgonians Eunicella gazella and Leptogorgia lusitanica in response to host, space and time. J. Sea Res. 2014, 85, 37–47. [Google Scholar] [CrossRef]
  11. Cúrdia, J.; Carvalho, S.; Pereira, F.; Guerra-García, J.M.; Santos, M.N.; Cunha, M.R. Diversity and abundance of invertebrate epifaunal assemblages associated with gorgonians are driven by colony attributes. Coral Reefs 2015, 34, 611–624. [Google Scholar] [CrossRef]
  12. Corbera, G.; Dominguez-Carrió, C.; Grange, L.; Ambroso, S.; Corbera, J.; Gili, J.-M. The role of arborescent octocorals as ecosystem engineers in shaping the diversity and composition of shelf-dwelling benthic assemblages. Mar. Biol. 2025, 172, 162. [Google Scholar] [CrossRef]
  13. Rossi, S.; Bramanti, L.; Gori, A.; Orejas, C. (Eds.) Marine Animal Forests: The Ecology of Benthic Biodiversity Hotspots; Springer International Publishing AG: Cham, Switzerland, 2017. [Google Scholar] [CrossRef]
  14. Linares, C.; Doak, D.F.; Coma, R.; Dıáz, D.; Zabala, M. Life history and viability of a long-lived marine invertebrate: The octocoral Paramuricea clavate. Ecology 2007, 88, 918–928. [Google Scholar] [CrossRef]
  15. Rossi, S.; Bramanti, L.; Horta, P.; Allcock, L.; Carreiro-Silva, M.; Coppari, M.; Denis, V.; Hadjioannou, L.; Isla, E.; Jimenez, C.; et al. Protecting global marine animal forests. Science 2022, 376, 929. [Google Scholar] [CrossRef]
  16. Rizzo, L.; Vega Fernández, T.; Necci, F.; Grelaud, M.; Ziveri, P.; Gerovasileiou, V.; Rossi, S. Can Marine Animal Forests benefit from existing conservation measures? A systematic approach towards the identification of protected sessile benthic species in the Mediterranean Sea. Mediterr. Mar. Sci. 2025, 26, 327–340. [Google Scholar] [CrossRef]
  17. Directorate-General for Environment (European Commission); Rodwell, J.R.; García Criado, M.; Gubbay, S.; Borg, J.; Otero, M.; Janssen, J.A.M.; Haynes, T.; Beal, S.; Nieto, A.; et al. European Red List of Habitats. Part 1, Marine Habitats; Publications Office of the European Union: Luxembourg, 2016; ISBN 978-92-79-61586-3. [Google Scholar]
  18. Otero, M.M.; Numa, C.; Bo, M.; Orejas, C.; Garrabou, J.; Cerrano, C.; Kružic, P.; Antoniadou, C.; Aguilar, R.; Kipson, S.; et al. Overview of the Conservation Status of Mediterranean Anthozoans; IUCN: Malaga, Spain, 2017; 73p. [Google Scholar] [CrossRef]
  19. Lloret, J. Human health benefits supplied by Mediterranean marine biodiversity. Mar. Pollut. Bull. 2010, 60, 1640–1646. [Google Scholar] [CrossRef] [PubMed]
  20. Salomidi, M.; Katsanevakis, S.; Borja, A.; Braeckman, U.; Damalas, D.; Galparsoro, I.; Mifsud, R.; Mirto, S.; Pascual, M.; Pipitone, C.; et al. Assessment of goods and services, vulnerability, and conservation status of European seabed biotopes: A stepping stone towards ecosystem-based marine spatial management. Mediterr. Mar. Sci. 2012, 13, 49–88. [Google Scholar] [CrossRef]
  21. Tribot, A.S.; Mouquet, N.; Villéger, S.; Raymond, M.; Hoff, F.; Boissery, P.; Holon, F.; Deter, J. Taxonomic and functional diversity increase the aesthetic value of coralligenous reefs. Sci. Rep. 2016, 6, 34229. [Google Scholar] [CrossRef] [PubMed]
  22. Thierry de Ville d’Avray, L.; Ami, D.; Chenuil, A.; David, R.; Féral, J.-P. Application of the ecosystem service concept at a small-scale: The cases of coralligenous habitats in the North-western Mediterranean Sea. Mar. Pollut. Bull. 2019, 138, 160–170. [Google Scholar] [CrossRef]
  23. Garrabou, J.; Gómez-Gras, D.; Medrano, A.; Cerrano, C.; Ponti, M.; Schlegel, R.; Bensoussan, N.; Turicchia, E.; Sini, M.; Gerovasileiou, V.; et al. Marine heatwaves drive recurrent mass mortalities in the Mediterranean Sea. Glob. Change Biol. 2022, 28, 5708–5725. [Google Scholar] [CrossRef]
  24. Karachle, P.K.; Dimarchopoulou, D.; Tsikliras, A.C. Is shore-based recreational fishing in Greece an unregulated activity that increases catch uncertainty? Reg. Stud. Mar. Sci. 2020, 36, 101273. [Google Scholar] [CrossRef]
  25. Sini, M.; Katsanevakis, S.; Koukourouvli, N.; Gerovasileiou, V.; Dailianis, T.; Buhl Mortensen, L.; Damalas, D.; Dendrinos, P.; Dimas, X.; Frantzis, A.; et al. Assembling ecological pieces to reconstruct the conservation puzzle of the Aegean Sea. Front. Mar. Sci. 2017, 4, 347. [Google Scholar] [CrossRef]
  26. Gilman, E.; Musyl, M.; Suuronen, P.; Chaloupka, M.; Gorgin, S.; Wilson, J.; Kuczenski, B. Highest risk abandoned, lost and discarded fishing gear. Sci. Rep. 2021, 11, 7195. [Google Scholar] [CrossRef]
  27. Macfadyen, G.; Huntington, T.; Cappell, R. Abandoned, Lost or Otherwise Discarded Fishing Gear; UNEP Regional Seas Reports and Studies No. 185; FAO Fisheries and Aquaculture Technical Paper No. 523; UNEP/FAO: Rome, Italy, 2009; 115p, Available online: https://www.fao.org/4/i0620e/i0620e00.htm (accessed on 1 September 2025).
  28. Galgani, F.; Hanke, G.; Werner, S.; De Vrees, L. Marine litter within the European Marine Strategy Framework Directive. ICES J. Mar. Sci. 2013, 70, 1055–1064. [Google Scholar] [CrossRef]
  29. Angiolillo, M.; di Lorenzo, B.; Farcomeni, A.; Bo, M.; Bavestrello, G.; Santangelo, G.; Cau, A.; Mastascusa, V.; Sacco, F.; Canese, S. Distribution and assessment of marine debris in the deep Tyrrhenian Sea (NW Mediterranean Sea, Italy). Mar. Pollut. Bull. 2015, 92, 149–159. [Google Scholar] [CrossRef] [PubMed]
  30. Enrichetti, F.; Bava, S.; Bavestrello, G.; Betti, F.; Lanteri, L.; Bo, M. Artisanal fishing impact on deep coralligenous animal forests: A Mediterranean case study of marine vulnerability. Ocean Coast. Manag. 2019, 177, 112–126. [Google Scholar] [CrossRef]
  31. Bo, M.; Bava, S.; Canese, S.; Angiolillo, M.; Cattaneo-Vietti, R.; Bavestrello, G. Fishing impact on deep Mediterranean rocky habitats as revealed by ROV investigation. Biol. Conserv. 2014, 171, 167–176. [Google Scholar] [CrossRef]
  32. Enrichetti, F.; Bavestrello, G.; Betti, F.; Findi, F.; Tregrosso, A.; Bo, M. Fate of lost fishing gears: Experimental evidence of biofouling colonization patterns from the northwestern Mediterranean Sea. Environ. Pollut. 2021, 268, 115746. [Google Scholar] [CrossRef]
  33. Betti, F.; Bavestrello, G.; Bo, M.; Ravanetti, G.; Enrichetti, F.; Coppari, M.; Cappanera, V.; Venturini, S.; Cattaneo-Vietti, R. Evidences of fishing impact on the coastal gorgonian forests inside the Portofino MPA (NW Mediterranean Sea). Ocean Coast. Manag. 2020, 187, 105105. [Google Scholar] [CrossRef]
  34. Angiolillo, M.; Fortibuoni, T. Impacts of marine litter on Mediterranean reef systems: From shallow to deep waters. Front. Mar. Sci. 2020, 7, 581966. [Google Scholar] [CrossRef]
  35. Bavestrello, G.; Cerrano, C.; Zanzi, D.; Cattaneo-Vietti, R. Damage by fishing activities to the gorgonian coral Paramuricea clavata in the Ligurian Sea. Aquat. Conserv. Mar. Freshw. Ecosyst. 1997, 7, 253–262. [Google Scholar] [CrossRef]
  36. Chiappone, M.; Dienes, H.; Swanson, D.W.; Miller, S.L. Impacts of lost fishing gear on coral reef sessile invertebrates in the Florida Keys National Marine Sanctuary. Biol. Conserv. 2005, 121, 221–230. [Google Scholar] [CrossRef]
  37. Garrabou, J.; Sala, E.; Arcas, A.; Zabala, M. The impact of diving on rocky sublittoral communities: A case study of a bryozoan population. Conserv. Biol. 1998, 12, 302–312. [Google Scholar] [CrossRef]
  38. Coma, R.; Pola, E.; Ribes, M.; Zabala, M. Long-term assessment of the patterns of mortality of a temperate octocoral in protected and unprotected areas: A contribution to conservation and management needs. Ecol. Appl. 2004, 14, 1466–1478. [Google Scholar] [CrossRef]
  39. Linares, C.; Zabala, M.; Garrabou, J.; Coma, R.; Diaz, D.; Hereu, B.; Dantart, L. Assessing the impact of diving in coralligenous communities: The usefulness of demographic studies of red gorgonian populations. Sci. Rep. Port-Cros Natl. Park 2010, 24, 161–184. [Google Scholar]
  40. Linares, C.; Bianchimani, O.; Torrents, O.; Marschal, C.; Drap, P.; Garrabou, J. Marine protected areas and the conservation of long-lived invertebrates: The Mediterranean red coral. Mar. Ecol. Prog. Ser. 2010, 402, 69–79. [Google Scholar] [CrossRef]
  41. Cebrian, E.; Linares, C.; Marschal, C.; Garrabou, J. Exploring the effects of invasive algae on the persistence of gorgonian populations. Biol. Invasions 2012, 14, 2647–2656. [Google Scholar] [CrossRef]
  42. Piazzi, L.; Gennaro, P.; Balata, D. Threats to macroalgal coralligenous assemblages in the Mediterranean Sea. Mar. Pollut. Bull. 2012, 64, 2623–2629. [Google Scholar] [CrossRef]
  43. UNEP/MAP. Action Plan for the Conservation of the Coralligenous and Other Calcareous Bio-Concretions in the Mediterranean Sea; UNEP/MAP: Athens, Greece, 2017. [Google Scholar]
  44. Tsirintanis, K.; Azzurro, E.; Crocetta, F.; Dimiza, M.; Froglia, C.; Gerovasileiou, V.; Langeneck, J.; Mancinelli, G.; Rosso, A.; Stern, N.; et al. Bioinvasion impacts on biodiversity, ecosystem services, and human health in the Mediterranean Sea. Aquat. Invasions 2022, 17, 308–352. [Google Scholar] [CrossRef]
  45. Gómez-Gras, D.; Linares, C.; Dornelas, M.; Madin, J.S.; Brambilla, V.; Ledoux, J.-B.; López-Sendino, P.; Bensoussan, N.; Garrabou, J. Climate change transforms the functional identity of Mediterranean coralligenous assemblages. Ecol. Lett. 2021, 24, 1038–1051. [Google Scholar] [CrossRef]
  46. Carlot, J.; Galobart, C.; Gómez-Gras, D.; Santamaría, J.; Golo, R.; Sini, M.; Cebrian, E.; Gerovasileiou, V.; Ponti, M.; Turicchia, E.; et al. Vulnerability of benthic trait diversity across the Mediterranean Sea following mass mortality events. Nat. Commun. 2025, 16, 1571. [Google Scholar] [CrossRef]
  47. Rossi, S. The destruction of the ‘animal forests’ in the oceans: Towards an oversimplification of the benthic ecosystems. Ocean Coast. Manag. 2013, 84, 77–85. [Google Scholar] [CrossRef]
  48. Zapata-Ramírez, P.A.; Scaradozzi, D.; Sorbi, L.; Palma, M.; Pantaleo, U.; Ponti, M.; Cerrano, C. Innovative study methods for the Mediterranean coralligenous habitats. Adv. Oceanogr. Limnol. 2013, 4, 102–119. [Google Scholar] [CrossRef]
  49. Di Camillo, C.G.; Ponti, M.; Storari, A.; Scarpa, C.; Roveta, C.; Pulido Mantas, T.; Coppari, M.; Cerrano, C. Review of the indexes to assess the ecological quality of coralligenous reefs: Towards a unified approach. Front. Mar. Sci. 2023, 10, 1252969. [Google Scholar] [CrossRef]
  50. Astruch, P.; Boudouresque, C.F.; Cabral, M.; Schohn, T.; Ballesteros, E.; Bellan-Santini, D.; Belloni, B.; Bianchi, C.N.; Cassetti, O.; Chevaldonné, P.; et al. An ecosystem-based index for Mediterranean coralligenous reefs: A protocol to assess the quality of a complex key habitat. Mar. Pollut. Bull. 2025, 220, 118375. [Google Scholar] [CrossRef] [PubMed]
  51. Georgiadis, M.; Papatheodorou, G.; Tzanatos, E.; Geraga, M.; Ramfos, A.; Koutsikopoulos, C.; Ferentinos, G. Coralligène formations in the eastern Mediterranean Sea: Morphology, distribution, mapping and relation to fisheries in the southern Aegean Sea (Greece) based on high-resolution acoustics. J. Exp. Mar. Biol. Ecol. 2009, 368, 44–58. [Google Scholar] [CrossRef]
  52. Bracchi, V.; Basso, D.; Marchese, F.; Corselli, C.; Savini, A. Coralligenous morphotypes on subhorizontal substrate: A new categorization. Cont. Shelf Res. 2017, 144, 10–20. [Google Scholar] [CrossRef]
  53. Dimas, X.; Fakiris, E.; Christodoulou, D.; Georgiou, N.; Geraga, M.; Papathanasiou, V.; Orfanidis, S.; Kotomatas, S.; Papatheodorou, G. Marine priority habitat mapping in a Mediterranean conservation area (Gyaros, South Aegean) through multi-platform marine remote sensing techniques. Front. Mar. Sci. 2022, 9, 953462. [Google Scholar] [CrossRef]
  54. Giakoumi, S.; Sini, M.; Gerovasileiou, V.; Mazor, T.; Beher, J.; Possingham, H.P.; Abdulla, A.; Çinar, M.E.; Dendrinos, P.; Gucu, A.C.; et al. Ecoregion-based conservation planning in the Mediterranean: Dealing with large-scale heterogeneity. PLoS ONE 2013, 8, e76449. [Google Scholar] [CrossRef]
  55. Martin, C.S.; Giannoulaki, M.; De Leo, F.; Scardi, M.; Salomidi, M.; Knittweis, L.; Pace, M.L.; Garofalo, G.; Gristina, M.; Ballesteros, E.; et al. Coralligenous and maërl habitats: Predictive modelling to identify their spatial distributions across the Mediterranean Sea. Sci. Rep. 2014, 4, 5073. [Google Scholar] [CrossRef]
  56. Williams, S.B.; Pizarro, O.R.; Jakuba, M.V.; Johnson, C.R.; Barrett, N.S.; Babcock, R.C.; Kendrick, G.A.; Steinberg, P.D.; Heyward, A.J.; Doherty, P.J.; et al. Monitoring of benthic reference sites: Using an autonomous underwater vehicle. IEEE Robot. Autom. Mag. 2012, 19, 73–84. [Google Scholar] [CrossRef]
  57. Ling, S.D.; Mahon, I.; Marzloff, M.P.; Pizarro, O.; Johnson, C.R.; Williams, S.B. Stereo-imaging AUV detects trends in sea urchin abundance on deep overgrazed reefs. Adv. Oceanogr. Limnol. Methods 2016, 14, 293–305. [Google Scholar] [CrossRef]
  58. Benoist, N.M.A.; Morris, K.J.; Bett, B.J.; Durden, J.M.; Huvenne, V.A.I.; Le Bas, T.P.; Wynn, R.B.; Ware, S.J.; Ruhl, H.A. Monitoring mosaic biotopes in a marine conservation zone by autonomous underwater vehicle. Conserv. Biol. 2016, 33, 1178–1185. [Google Scholar] [CrossRef]
  59. Brown, C.J.; Smith, S.J.; Lawton, P.; Anderson, J.T. Benthic habitat mapping: A review of progress towards improved understanding of the spatial ecology of the seafloor using acoustic techniques. Estuar. Coast. Shelf Sci. 2011, 92, 502–520. [Google Scholar] [CrossRef]
  60. Cochrane, G.R.; Lafferty, K.D. Use of acoustic classification of sidescan sonar data for mapping benthic habitat in the Northern Channel Islands, California. Cont. Shelf Res. 2002, 22, 683–690. [Google Scholar] [CrossRef]
  61. Sward, D.; Monk, J.; Barrett, N. A systematic review of remotely operated vehicle surveys for visually assessing fish assemblages. Front. Mar. Sci. 2019, 6, 134. [Google Scholar] [CrossRef]
  62. Pierdomenico, M.; Bonifazi, A.; Argenti, L.; Ingrassia, M.; Casalbore, D.; Aguzzi, L.; Viaggiu, E.; Le Foche, M.; Chiocci, F.L. Geomorphological characterization, spatial distribution and environmental status assessment of coralligenous reefs along the Latium continental shelf. Ecol. Indic. 2021, 131, 108219. [Google Scholar] [CrossRef]
  63. Sini, M.; Kipson, S.; Linares, C.; Koutsoubas, D.; Garrabou, J. The yellow gorgonian Eunicella cavolini: Demography and disturbance levels across the Mediterranean Sea. PLoS ONE 2015, 10, e0126253. [Google Scholar] [CrossRef] [PubMed]
  64. Sini, M.; Garrabou, J.; Trygonis, V.; Koutsoubas, D. Coralligenous formations dominated by Eunicella cavolini (Koch, 1887) in the NE Mediterranean: Biodiversity and structure. Mediterr. Mar. Sci. 2019, 20, 174–188. [Google Scholar] [CrossRef]
  65. Manoutsoglou, E.; Hasiotis, T.; Kyriakoudi, D.; Velegrakis, A.; Lowag, J. Puzzling micro-relief (mounds) of a soft-bottomed, semi-enclosed shallow marine environment. Geo-Mar. Lett. 2018, 38, 359–370. [Google Scholar] [CrossRef]
  66. Hanke, G.; Galgani, F.; Werner, S.; Oosterbaan, L.; Nilsson, P.; Fleet, D.; Kinsey, S.; Thompson, R.C.; Van Franeker, J.A.; Vlachogianni, T.; et al. Guidance on Monitoring of Marine Litter in European Seas; EUR 26113; JRC83985; Publications Office of the European Union: Luxembourg, 2013. [Google Scholar] [CrossRef]
  67. Schindelin, J.; Arganda-Carreras, I.; Frise, E.; Kaynig, V.; Longair, M.; Pietzsch, T.; Preibisch, S.; Rueden, C.; Saalfeld, S.; Schmid, B.; et al. Fiji: An Open-Source Platform for Biological-Image Analysis. Nat. Methods 2012, 9, 676–682. [Google Scholar] [CrossRef]
  68. Buckland, S.; Anderson, D.; Burnham, K.; Laake, J.; Borchers, D.; Thomas, L. Introduction to Distance Sampling: Estimating Abundance of Biological Populations; Oxford University Press: Oxford, UK, 2001. [Google Scholar] [CrossRef]
  69. Thomas, L.; Buckland, S.T.; Rexstad, E.A.; Laake, J.L.; Strindberg, S.; Hedley, S.L.; Bishop, J.R.; Marques, T.A.; Burnham, K.P. Distance software: Design and analysis of distance sampling surveys for estimating population size. J. Appl. Ecol. 2010, 47, 5–14. [Google Scholar] [CrossRef]
  70. Marques, T.A.; Thomas, L.; Fancy, S.G.; Buckland, S.T. Improving estimates of bird density using multiple-covariate distance sampling. Auk 2007, 124, 1229–1243. [Google Scholar] [CrossRef]
  71. Akaike, H. Information theory as an extension of the maximum likelihood principle. In Proceedings of the Second International Symposium on Information Theory; Petrov, B.N., Csaki, F., Eds.; Akademiai Kiado: Budapest, Hungary, 1973; pp. 267–281. [Google Scholar]
  72. Burnham, K.P.; Anderson, D.R. Model Selection and Inference: A Practical Information-Theoretic Approach, 2nd ed.; Springer: New York, NY, USA, 2002. [Google Scholar] [CrossRef]
  73. Garrabou, J.; Kipson, S.; Kaleb, S.; Kruzic, P.; Jaklin, A.; Ante, Z.; Rajkovic, Z.; Rodic, P.; Jelic, K.; Zupan, D. (Eds.) UNEP-MAP-RAC/SPA. Monitoring Protocol for Reefs—Coralligenous Community; RAC/SPA—MedMPAnet Project: Tunis, Tunisia, 2014. [Google Scholar]
  74. Linares, C.; Coma, R.; Garrabou, J.; Díaz, D.; Zabala, M. Size Distribution, Density and Disturbance in Two Mediterranean Gorgonians: Paramuricea clavata and Eunicella singularis. J. Appl. Ecol. 2008, 45, 688–699. [Google Scholar] [CrossRef]
  75. Garrabou, J.; Coma, R.; Benssoussan, N.; Bally, M.; Chevaldonné, P.; Cigliano, M.; Diaz, D.; Harmelin, J.G.; Gambi, M.C.; Kersting, D.K.; et al. Mass mortality in NW Mediterranean rocky benthic communities: Effects of the 2003 heat wave. Glob. Change Biol. 2009, 15, 1090–1103. [Google Scholar] [CrossRef]
  76. Linares, C.; Coma, R.; Diaz, D.; Zabala, M.; Hereu, B.; Dantart, L. Immediate and delayed effects of a mass mortality event on gorgonian population dynamics and benthic community structure in the NW Mediterranean Sea. Mar. Ecol. Prog. Ser. 2005, 305, 127–137. [Google Scholar] [CrossRef]
  77. Lioupa, V.; Petsimeris, I.; Karsiotis, P.; Papavasileiou, F.; Poulos, A.; Andreadis, O.; Manoutsoglou, E.; Hasiotis, T. Sensing underwater landscape off coastal cities: Implications for better management strategies. In Proceedings of the Eleventh International Conference on Remote Sensing and Geoinformation of the Environment (RSCy2025), Paphos, Cyprus, 17–19 March 2025; SPIE: Bellingham, WA, USA, 2025. [Google Scholar]
  78. Turicchia, E.; Abbiati, M.; Ponti, M. Mediterranean Gorgonians Fighting. Mar. Biodivers. 2020, 50, 33. [Google Scholar] [CrossRef]
  79. Iborra, L.; Leduc, M.; Fullgrabe, L.; Cuny, P.; Gobert, S. Temporal Trends of Two Iconic Mediterranean Gorgonians (Paramuricea clavata and Eunicella cavolini) in the Climate Change Context. J. Sea Res. 2022, 186, 102241. [Google Scholar] [CrossRef]
  80. Chimienti, G.; Maiorca, M.; Digenis, M.; Poursanidis, D. Conservation status of upper-mesophotic octocoral habitats at Sporades Archipelago (Aegean Sea). Mar. Pollut. Bull. 2023, 190, 114868. [Google Scholar] [CrossRef]
  81. Tignat-Perrier, R.; van de Water, J.A.J.M.; Guillemain, D.; Aurelle, D.; Allemand, D.; Ferrier-Pagès, C. The effect of thermal stress on the physiology and bacterial communities of two key Mediterranean gorgonians. Appl. Environ. Microbiol. 2022, 88, e02340-21. [Google Scholar] [CrossRef]
  82. Blouet, S.; Bramanti, L.; Guizien, K. Ecological niche modelling of five gorgonian species within the shallow rocky habitat of the French Mediterranean coast. Vie Milieu/Life Environ. 2024, 7, 1–43. [Google Scholar] [CrossRef]
  83. Figuerola-Ferrando, L.; Amblas, D.; Matos, F.L.; Zentner, Y.; Garrabou, J.; Linares, C. Modelling the distribution of key Mediterranean gorgonians: An ensemble approach to unravel broad-scale patterns and guide conservation efforts. J. Biogeogr. 2025, 52, 392–407. [Google Scholar] [CrossRef]
  84. Bo, M.; Canese, S.; Spaggiari, C.; Pusceddu, A.; Bertolino, M.; Angiolillo, M.; Giusti, M.; Loreto, M.F.; Salvati, E.; Greco, S.; et al. Deep coral oases in the south Tyrrhenian Sea. PLoS ONE 2012, 7, e49870. [Google Scholar] [CrossRef]
  85. Yoshioka, P.M. Size-specific life history pattern of a shallow-water gorgonian. J. Exp. Mar. Biol. Ecol. 1994, 184, 111–122. [Google Scholar] [CrossRef]
  86. Cupido, R.; Cocito, S.; Barsanti, M.; Sgorbini, S.; Peirano, A.; Santangelo, G. Unexpected long-term population dynamics in a canopy-forming gorgonian coral following mass mortality. Mar. Ecol. Prog. Ser. 2009, 394, 195–200. [Google Scholar] [CrossRef]
  87. Previati, M.; Scinto, A.; Cerrano, C.; Osinga, R. Oxygen consumption in Mediterranean octocorals under different temperatures. J. Exp. Mar. Biol. Ecol. 2010, 390, 39–48. [Google Scholar] [CrossRef]
  88. Cerrano, C.; Bavestrello, G.; Bianchi, C.N.; Cattaneo-Vietti, R.; Bava, S.; Morganti, C.; Morri, C.; Picco, P.; Sara, G.; Schiaparelli, S.; et al. A catastrophic mass-mortality episode of gorgonians and other organisms in the Ligurian Sea (North-Western Mediterranean), summer 1999. Ecol. Lett. 2000, 3, 284–293. [Google Scholar] [CrossRef]
  89. Gambi, M.C.; Barbieri, F.; Singorelli, S.; Saggiomo, V. Mortality events along the Campania coast (Tyrrhenian Sea) in summers 2008 and 2009 and relation to thermal conditions. Biol. Mar. Mediterr. 2010, 17, 126–127. [Google Scholar]
  90. Consoli, P.; Romeo, T.; Angiolillo, M.; Canese, S.; Esposito, V.; Salvati, E.; Scotti, G.; Andaloro, F.; Tunesi, L. Marine litter from fishery activities in the Western Mediterranean Sea: The impact of entanglement on marine animal forests. Environ. Pollut. 2019, 249, 472–481. [Google Scholar] [CrossRef] [PubMed]
  91. Jacobsen, N.; Roveta, C.; Pulido Mantas, T.; Coppari, M.; Di Camillo, C.; Calcinai, B.; Cerrano, C. Assessment of octocoral-dominated benthic assemblages along a mesophotic gradient, with a focus on the impact of lost fishing gears. Aquat. Conserv. Mar. Freshw. Ecosyst. 2024, 34, e4248. [Google Scholar] [CrossRef]
  92. Martínez-Dios, A.; De la Torriente, A.; González-Irusta, R.; Aguilar, R.; Serrano, A.; Foglini, F.; Lo Iacono, C. Assessing marine litter on the VMEs of el Seco de los Olivos (W Mediterranean Sea). Mar. Pollut. Bull. 2025, 215, 117802. [Google Scholar] [CrossRef]
  93. Costa, G.; Sanna, G.; Arrostuto, N.; Fois, N.; Sechi, C.; Tomassetti, P.; Lomiri, S. The grim fate of a Paramuricea clavata (Risso, 1827) forest off Asinara Island (northwest Sardinia, Italy). Mar. Biodivers. 2024, 54, 69. [Google Scholar] [CrossRef]
  94. Jimenez, C.; Resaikos, V. Chasing Ghosts: Evidence-Based Management of Abandoned Fishing Gear in the Eastern Mediterranean. J. Mar. Sci. Eng. 2025, 13, 1574. [Google Scholar] [CrossRef]
  95. Gaida, T.C.; Binnerts, B.; Bos, O. Semi-automated classification of Side-Scan Sonar data for mapping Sabellaria spinulosa reefs in the Brown Bank, Dutch Continental Shelf. J. Mar. Sci. Eng. 2025, 13, 74. [Google Scholar] [CrossRef]
  96. Zhao, J.; Meng, J.; Zhang, H.; Yan, J. A new method for acquisition of high-resolution seabed topography by matching seabed classification images. Remote Sens. 2017, 9, 1214. [Google Scholar] [CrossRef]
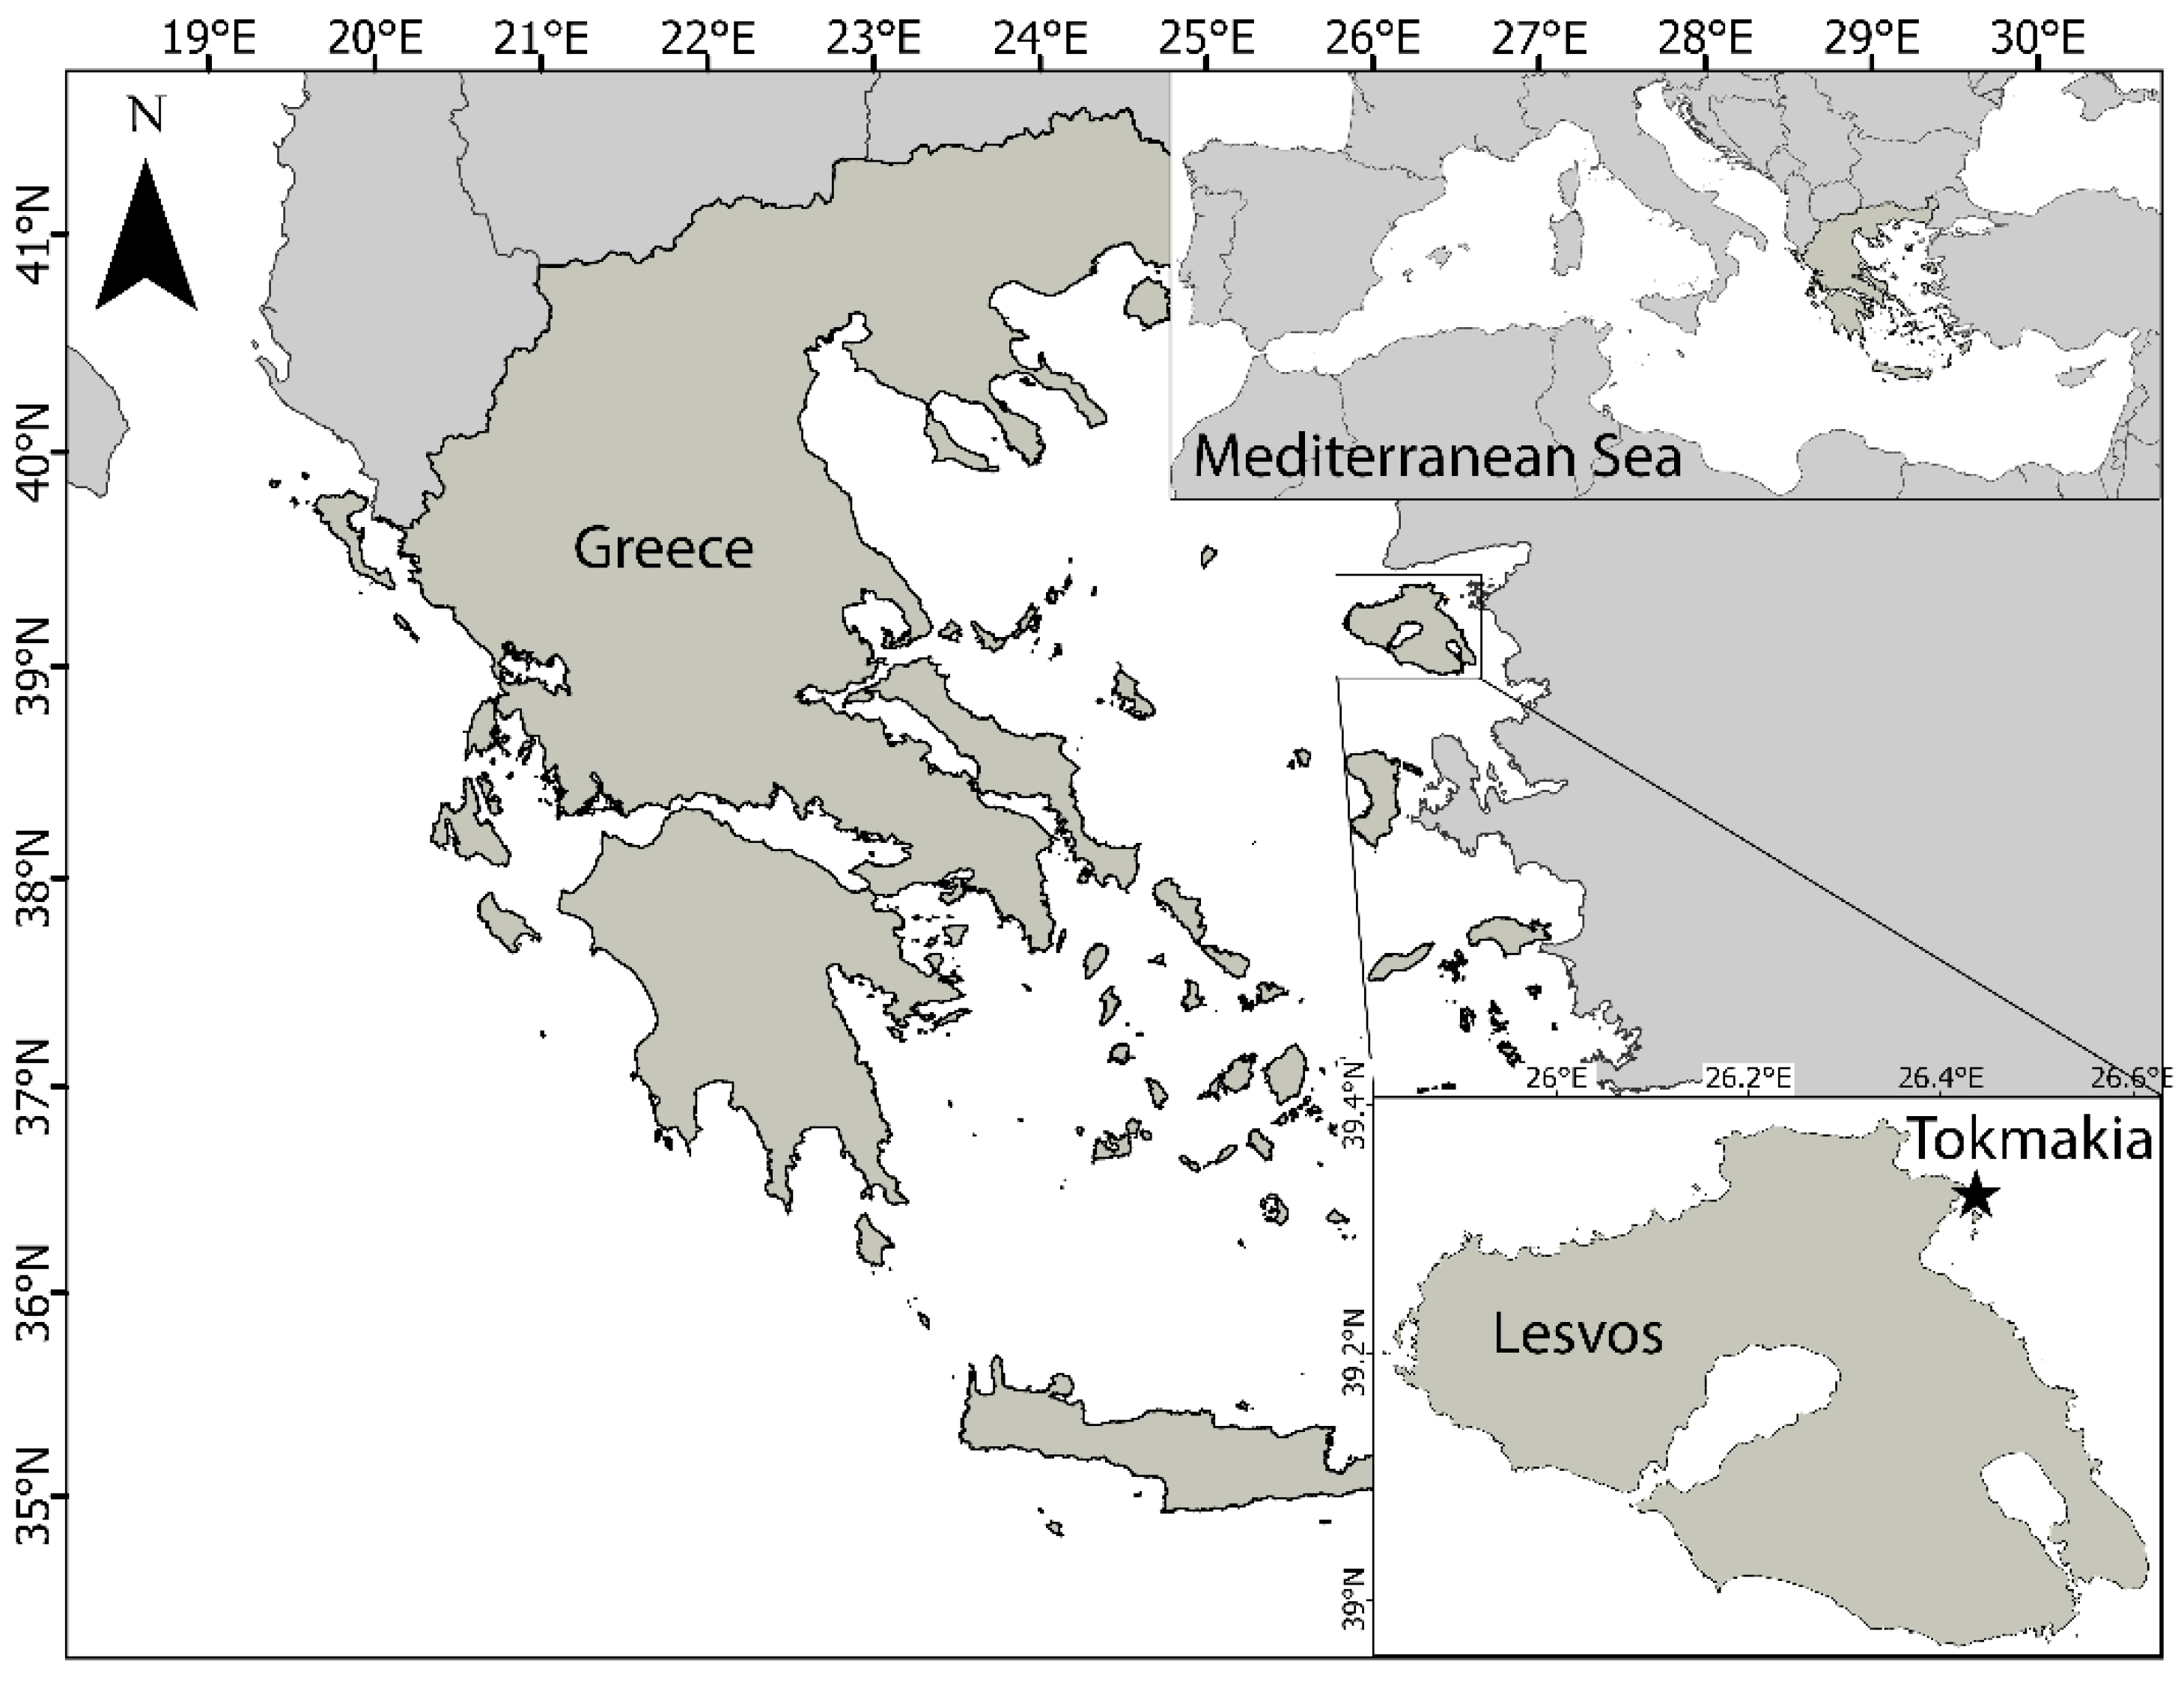
Figure 1. Map of Greece located in the NE Mediterranean Sea, and map of Lesvos Island located in the NE Aegean Sea (Greece). Star indicates the location of the study site.
Jmse 13 02237 g001
Figure 2. Side scan sonar survey lines (A) and the resulting geo-referenced sonar mosaic (B).
Jmse 13 02237 g002
Figure 3. Habitat map and anthropogenic features over the studied area based on data obtained through side-scan sonar. Bathymetric contours are from the Hellenic Navy Hydrographic Service-HNHS. RT stands for reflectivity type—refer to Figure S2 for representative sonographs of each RT.
Jmse 13 02237 g003
Figure 4. Map of the Tokmakia drop-off, based on side-scan sonar data (RT2- rocky outcrops), showing the position of the different ROV dives for marine litter. Bullets represent the start/end of each ROV dive, numbers indicate the ROV dive ID at the start of each dive, and dashed orange lines depict the approximate route of each ROV dive. Yellow area: population of Eunicella cavolini, purple area: population of Paramuricea clavata.
Jmse 13 02237 g004
Figure 5. Marine litter density per ROV dive; different colors denote type of marine litter.
Jmse 13 02237 g005
Figure 6. Number and type of interactions between individuals/colonies of different taxa and ML.
Jmse 13 02237 g006
Figure 7. Side-scan sonar image of the two main rocky shoals of the study area. Coralligenous formations were found in most parts of the rocky reef shoals areas. The locations of the Eunicella cavolini and the Paramuricea clavata populations are depicted in yellow and red color, respectively.
Jmse 13 02237 g007
Figure 8. Height frequency distribution of Eunicella cavolini and Paramuricea clavata.
Jmse 13 02237 g008
Figure 9. Marine litter in contact with several vulnerable taxa of the coralligenous at the Tokmakia drop-off (NE Aegean Sea, Greece): (a) heavily bio-fouled fishing lines hanging from coralligenous assemblages, and covering a large part of the assemblage, (b,c) entanglement and abrasion of E. cavolini, P. clavata, and S. savaglia colonies caused by fishing lines, (d) fishing lines hanging over and covering coralligenous assemblages, (e) a bio-fouled fishing net hanging and covering several benthic taxa, including the protected sponge species Aplysina spp., (f) fishing net lying and covering the coralligenous assemblages.
Jmse 13 02237 g009
Table 1. Data summary of marine litter (ML) type, depth range, number of items (N), type of interaction (based on [29]), ML fouling stage (based on [32]), and removal feasibility.
TypeDepth Range (m)NML Interaction with SubstrateML Fouling StageRemoval Feasibility (%)
Covering/EntangledAbrasionHangingLying01230<50>50–90100
Fishing lines20–59143550730736162386424922190422485338
Fishing ropes20–591512604679022864311532562
Artisanal nets41–5712305405345205
Fishing traps31–479200700450009
Trawl nets39–528413000350026
Anchors38–483200101020123
Plastic bottle44–533000300120003
Plastic bag581000100100001
Ceramic jar331000100010001
Glove561000101000001
Metal ring48.51000101000001
Tube351000100100001
Total 1626
Table 2. Characteristics of the studied Eunicella cavolini and Paramuricea clavata populations, including depth range (D), number of gorgonians (N), density, minimum (Min) and maximum (Max) height, mean height, and standard deviation (SD). Skewness (g1) and kurtosis (g2) are considered significant if the absolute value of coefficient/standard error (SEg1 and SEg2) is greater than 2.
SpeciesNDepth Range (m)Height
MinMaxMeanSDg1SEg1Sig g1g2SEg2Sig g2
E. cavolini12030–454.365.529.712.50.30.21.4−0.00.4−0.0
P. clavata10445–56 10.386.950.616.3−0.10.3−0.5−0.40.5−0.8
Table 3. Summary of data on the injury characteristics of the studied Eunicella cavolini and Paramuricea clavata populations. Only colonies presenting ≥10% injuries were used to assess the type of injury following [76]. Type A—exposed colony axis, indicating a recent injury (≤1 month); Type B—overgrowth by early colonizers such as filamentous algae and hydrozoans, suggesting a disturbance within the past 1–12 months; Type C—dominance of bryozoans, sponges, or well-developed and encrusting algae, indicating injuries >12 months.
SpeciesNProportion of Uninjured, Injured and Dead Colonies According to the Proportion of Injured Surface Area (%)Proportion of Colonies per Type of Injury (%)
[0–10%)[10–99%)100%ABC
E. cavolini12083171038.161.9
P. clavata10484134035.364.7
Disclaimer/Publisher’s Note: The statements, opinions and data contained in all publications are solely those of the individual author(s) and contributor(s) and not of MDPI and/or the editor(s). MDPI and/or the editor(s) disclaim responsibility for any injury to people or property resulting from any ideas, methods, instructions or products referred to in the content.