Article

Assessing Grain-Size and Sedimentological Variations in Human-Modified Beaches: Insights from the Northern Adriatic Coast (Italy)

Dipartimento di Scienze Fisiche, della Terra e dell’Ambiente, Università di Siena, Via Laterina 8, 53100 Siena, Italy
*
Author to whom correspondence should be addressed.
J. Mar. Sci. Eng. 2025, 13(12), 2230; https://doi.org/10.3390/jmse13122230 (registering DOI)
Submission received: 13 October 2025 / Revised: 17 November 2025 / Accepted: 20 November 2025 / Published: 22 November 2025
(This article belongs to the Section Coastal Engineering)

Abstract

Human interventions have profoundly altered the depositional settings and morphodynamic evolution of beaches. Such environmental alterations also affect the execution of scientific studies because natural sedimentary and morphological signals are often masked by anthropogenic signatures. This paper focuses on two beaches in Northern Italy that are heavily impacted by human activities. Through seasonal field observations and standardized sediment sampling combined with grain-size sediment analyses, this work aims to: (i) identify the sub-environments that are least affected by human disturbances and thus most suitable for geological monitoring and (ii) assess how different beach zones are influenced by seasonal variability and the presence of shore-parallel defense structures. The results indicate that the fair-weather berm is the most suitable area to record natural processes and seasonal changes, while step deposits reveal differences between protected and partially protected environments. These findings support standardized and reliable monitoring of human-modified beaches, providing practical guidance on where and how to conduct sediment sampling.

1. Introduction

Beaches attract billions of tourists annually and play a key role in supporting economies and enhancing the welfare of coastal populations. The preservation and suitable management of sandy beaches, especially in the face of increasing coastal erosion risks, require a range of geologically informed interventions, including monitoring programs, grain-size characterization, and artificial beach nourishment. Local stakeholders are strongly interested in understanding the sedimentary and morphodynamic processes that govern these environments because this knowledge is crucial for land management and natural risk mitigation. Recently, numerous studies have dealt with multidisciplinary techniques of beach monitoring, providing solid bases and detailed workflows for the characterization of beaches in terms of sediment origin, sediment dispersal patterns, and active hydrodynamic settings, with the latter narrowly connected with erosional/depositional behavior of beach depositional systems [1,2,3,4,5]. The main part of these scientific contributions has been focused on unaltered natural settings or only minimally altered by human intervention. However, from a geological perspective, many beaches are far from natural systems and deeply affected by human pressures and modifications [6,7,8]. These human-modified beaches function as novel systems where human activities (e.g., nourishment, cleaning) are now dominant daily processes, continuously reshaping the natural physical framework. Consequently, new studies have been required to identify monitoring techniques that can consider human efforts and identify sub-environments less influenced by human perturbations and, consequently, more prone to geological-oriented investigation.
These considerations are particularly true for Emilia-Romagna, a region in Northern Italy, where, since the aftermath of World War II, seaside tourism has become the cornerstone of regional economic development. These beaches are affected by several human-induced pressures, the most significant of which is coastal erosion. This process threatens coastal tourism and the socio-economic activities associated with it. For this reason, understanding sediment characteristics and dispersal pathways is essential for designing nourishment projects, implementing shoreline defense structures, and assessing their long-term effectiveness [9].
This study focuses on sedimentological and grain-size variability of two sandy beaches along the Adriatic coast of Emilia-Romagna (Italy). These beaches are subject to intensive tourist use and frequent human interventions, such as beach cleaning, sand redistribution, and coastal protection measures. In this context, the beach system must be understood and managed as a geo-resource, with monitoring and sampling activities conducted according to standardized and repeatable methodologies in order to ensure data comparability across institutional and professional stakeholders.
This work aims to: (i) provide practical guidance on how and where to conduct geological monitoring and sediment sampling in such heavily modified beach systems and (ii) distinguish the grain-size and sedimentological signals that may be attributed to seasonal variability versus those influenced by coastal defense structures. It is important to note that, in this study, seasonality is not defined solely in terms of hydrodynamic variation (i.e., the simplified “winter/storm-dominated” vs. “summer/fair-weather” dichotomy), but also includes the intensity and frequency of human activities, which tend to increase significantly during the tourist season.

2. Selected Sites

Two locations along the Adriatic coast of Italy (Figure 1a,b) were selected for this study: the Cesenatico Ponente beach (Figure 1c) and Igea Marina beach (Figure 1d). Both sites are characterized by fine-grained sandy beaches [9], a characteristic shared by many other beaches in the region [10]. Tidal excursions range from approximately 0.3 m during neap tides to 0.8 m during spring tides, and therefore, according to [11] tidal classification, these beaches fall within a microtidal regime.
Historically, until the mid-19th century, these areas were characterized by prominent beaches, which were progressively eroded due to a significant decline in sediment supply from the Po River and the Apennine Rivers [9]. Since then, both these areas have been affected by coastal erosion and have undergone various mitigation interventions, including beach nourishment and the construction of coastal defense structures.
The most recent nourishment activities were conducted in late spring 2022, some months before the summer data collection presented in this study. The same sediment source was used, i.e., Holocene beaches quarried offshore [9,12].
Importantly, the Igea Marina Beach is fully protected by shore-parallel detached breakwaters, while the Cesenatico Ponente Beach is only partially protected, with hard structures concentrated in the southern sector (Figure 1c,d). These contrasting configurations provide an opportunity to assess the effects of shore-parallel coastal defenses on sediment dynamics and natural morphosedimentary processes.

3. Materials and Methods

The observations and data presented in this study derive from two fieldwork campaigns performed during the summer 2022 (September) and winter 2023 (March). For each beach, four sites have been investigated (geographic coordinates are reported in Figure 1b).
Prominent geomorphological and sedimentological observations were directly documented in the field and measured with a Leica Disto X4 (Leica Geosystems AG—Part of Hexagon, Heerbrugg, Swiss). These features are briefly described here to provide the reader an overview of the general characteristics of the investigated beaches.
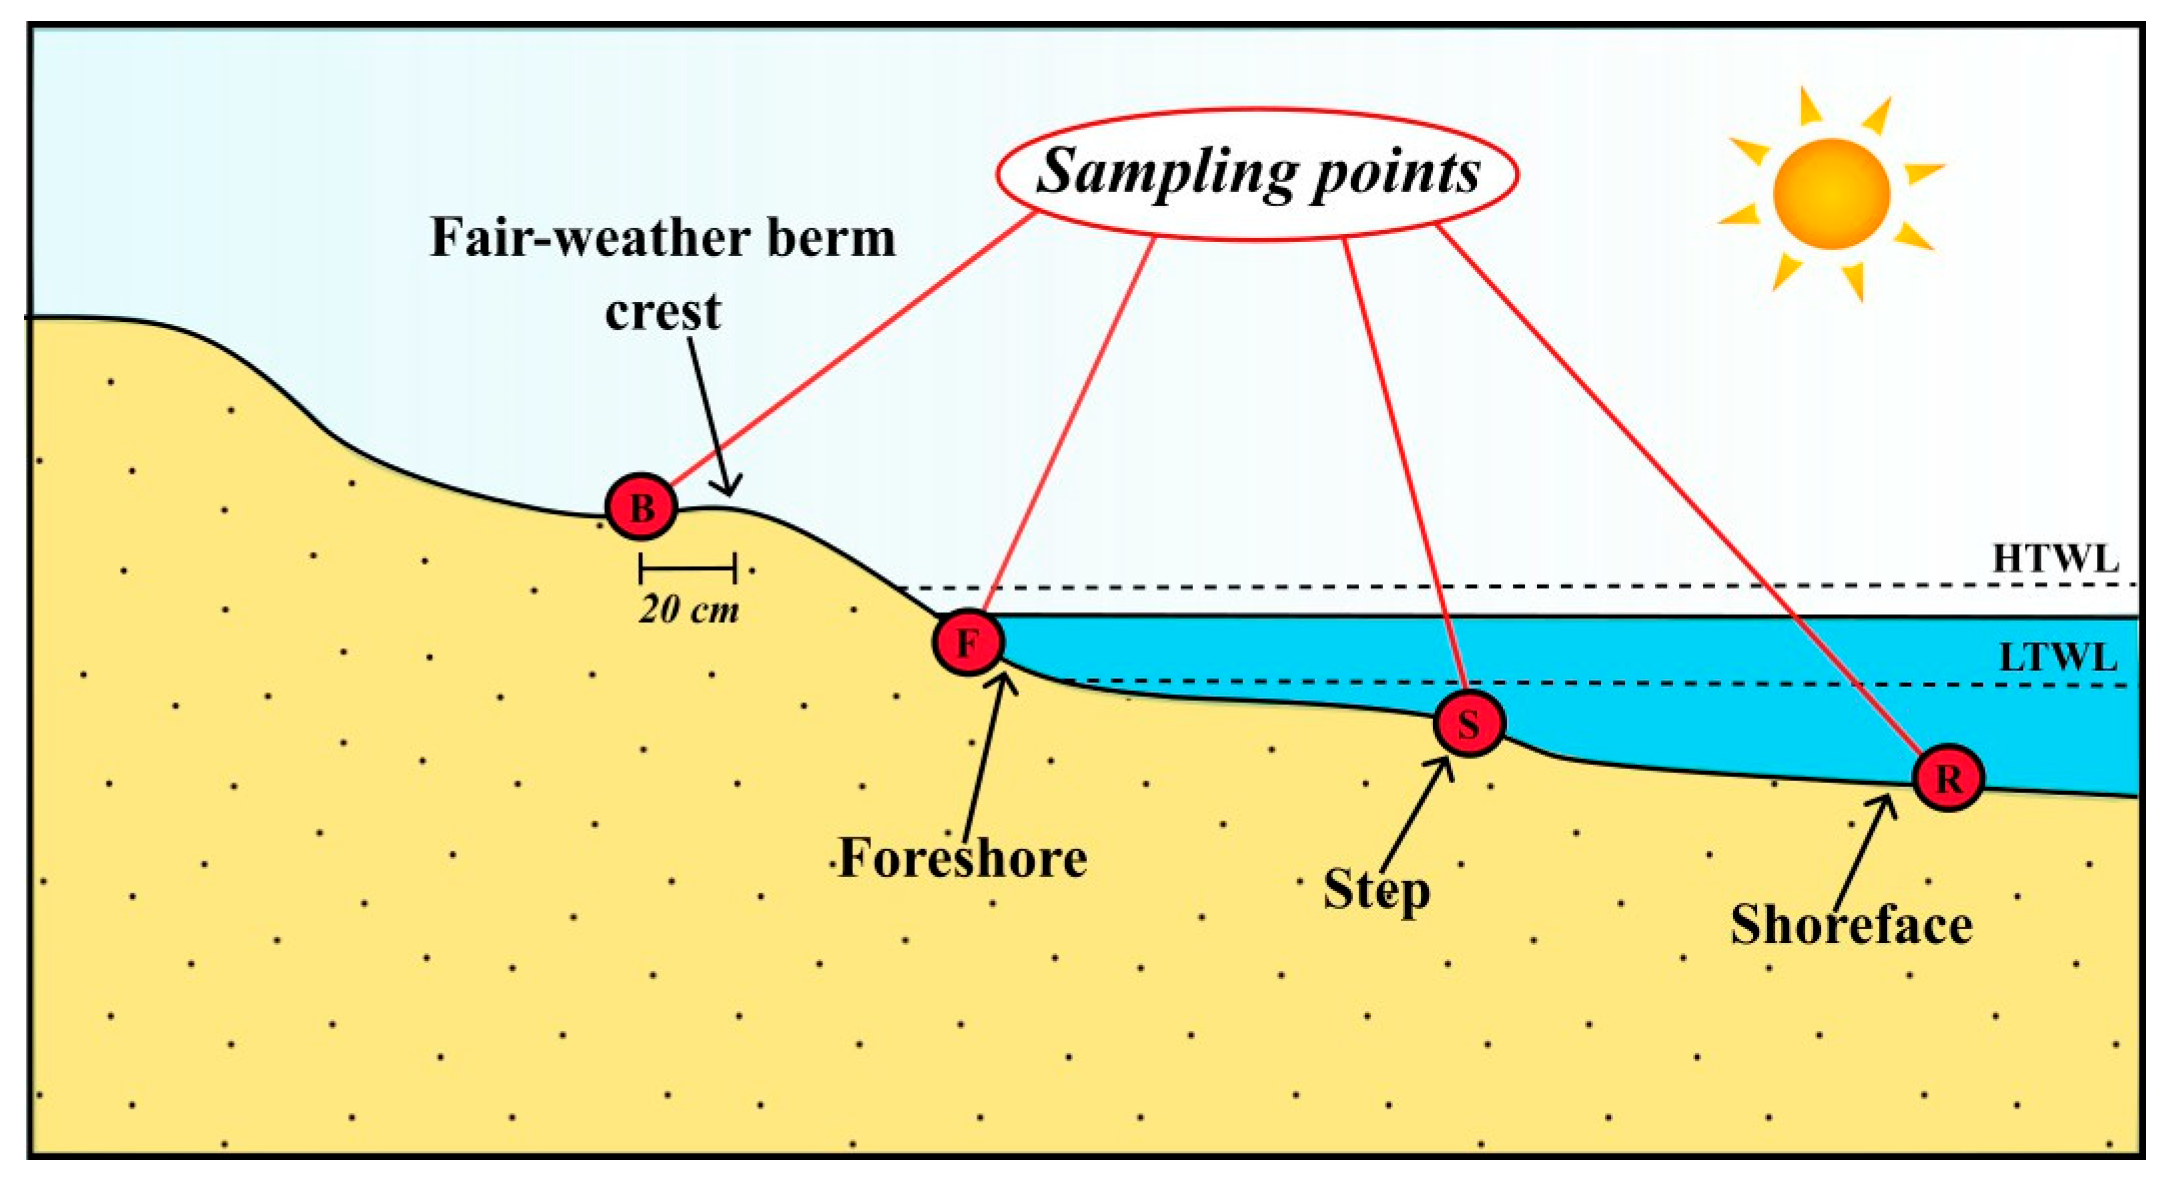
The most relevant sub-environments and less altered by direct human reworking (i.e., fair-weather berm, step, foreshore, and shoreface at 0.5 m of depth) were sampled to better characterize the sedimentological features of beach sediments (see Figure 2 for the sampling scheme). Sediment samples (N = 63) were collected twice (at the end of the summer and winter) to evaluate seasonal grain-size variability. All samplings were performed during fair-weather conditions and at least five days after storms. For the fair-weather berm, sampling was performed 20 cm landward from the berm crest, and the uppermost 5 cm of sediment was removed to avoid surficial eolian modification (i.e., eolian ripples). In the lab, the sediments were air-dried and quartered. Approximately 100 g of sediment (one quarter of the bulk sample) was then wet-sieved through a 63 μm sieve to remove mud and salt. The weight difference before and after washing was recorded and in all cases was less of 0.5% by weight. The treated sample was dried under infrared lamps and sieved for 15 min at a ¼ phi interval using a RETSCH AS200 CONTROL sieve shaker (Retsch GmbH, Haan, Germany) with 20 cm diameter sieves, following the recommendations of [13,14]. Sieving was performed in the range 63–2000 μm, while the >2000 μm fraction consisted exclusively of uncommon shell fragments and was excluded from analysis because it could bias the results, especially those sensitive to the distribution tails, such as sorting and skewness.
Sediment fractions were weighed using a Mettler-Toledo balance (resolution 0.01 g), and results were processed using GRADISTAT software (version 9.1) [15]. Grain-size parameters were derived using two approaches: the D50 (Median) was determined by interpolation of the cumulative frequency curve while the Mean, Standard Deviation (Sorting), and Skewness were calculated using the Moment Method [16,17]. Complete grain-size data for all analyzed samples are provided in Supplementary Table S1. Given the adopted ¼ phi (0.25Φ) sieve interval, the associated confidence interval for interpolated percentile values (i.e., the D50) is ±0.125Φ.
Given the number of samples per hydrodynamic zone and the difficulty of testing the normality of the investigated datasets, the median was selected as the central tendency indicator, instead of the mean. For the same reason, the Median Absolute Deviation (MAD) was used to measure population dispersion instead of standard deviation. The MAD was calculated as follows:
M A D = 1 n i = 1 n | x i m X |
where m(X) is the median of the dataset, n is the number of data points, and xi is the data values in the set. Outliers have less influence on the MAD than the standard deviation and can also be applied to non-normally distributed populations.
To assess statistical differences between data populations, the Mann–Whitney–Wilcoxon test (hereafter called the U-test, [18,19]) was used due to its robustness with small sample sizes (N ≥ 7). Additionally, all tables report minimum, maximum, and range values to help in understanding the intra-population variability better.

4. Results

4.1. Morpho-Sedimentological Features of the Investigated Beaches

This section provides a general overview of the beaches under investigation, highlighting their main characteristics and offering the reader a better contextual understanding of the study area. The primary features identified during field surveys include:
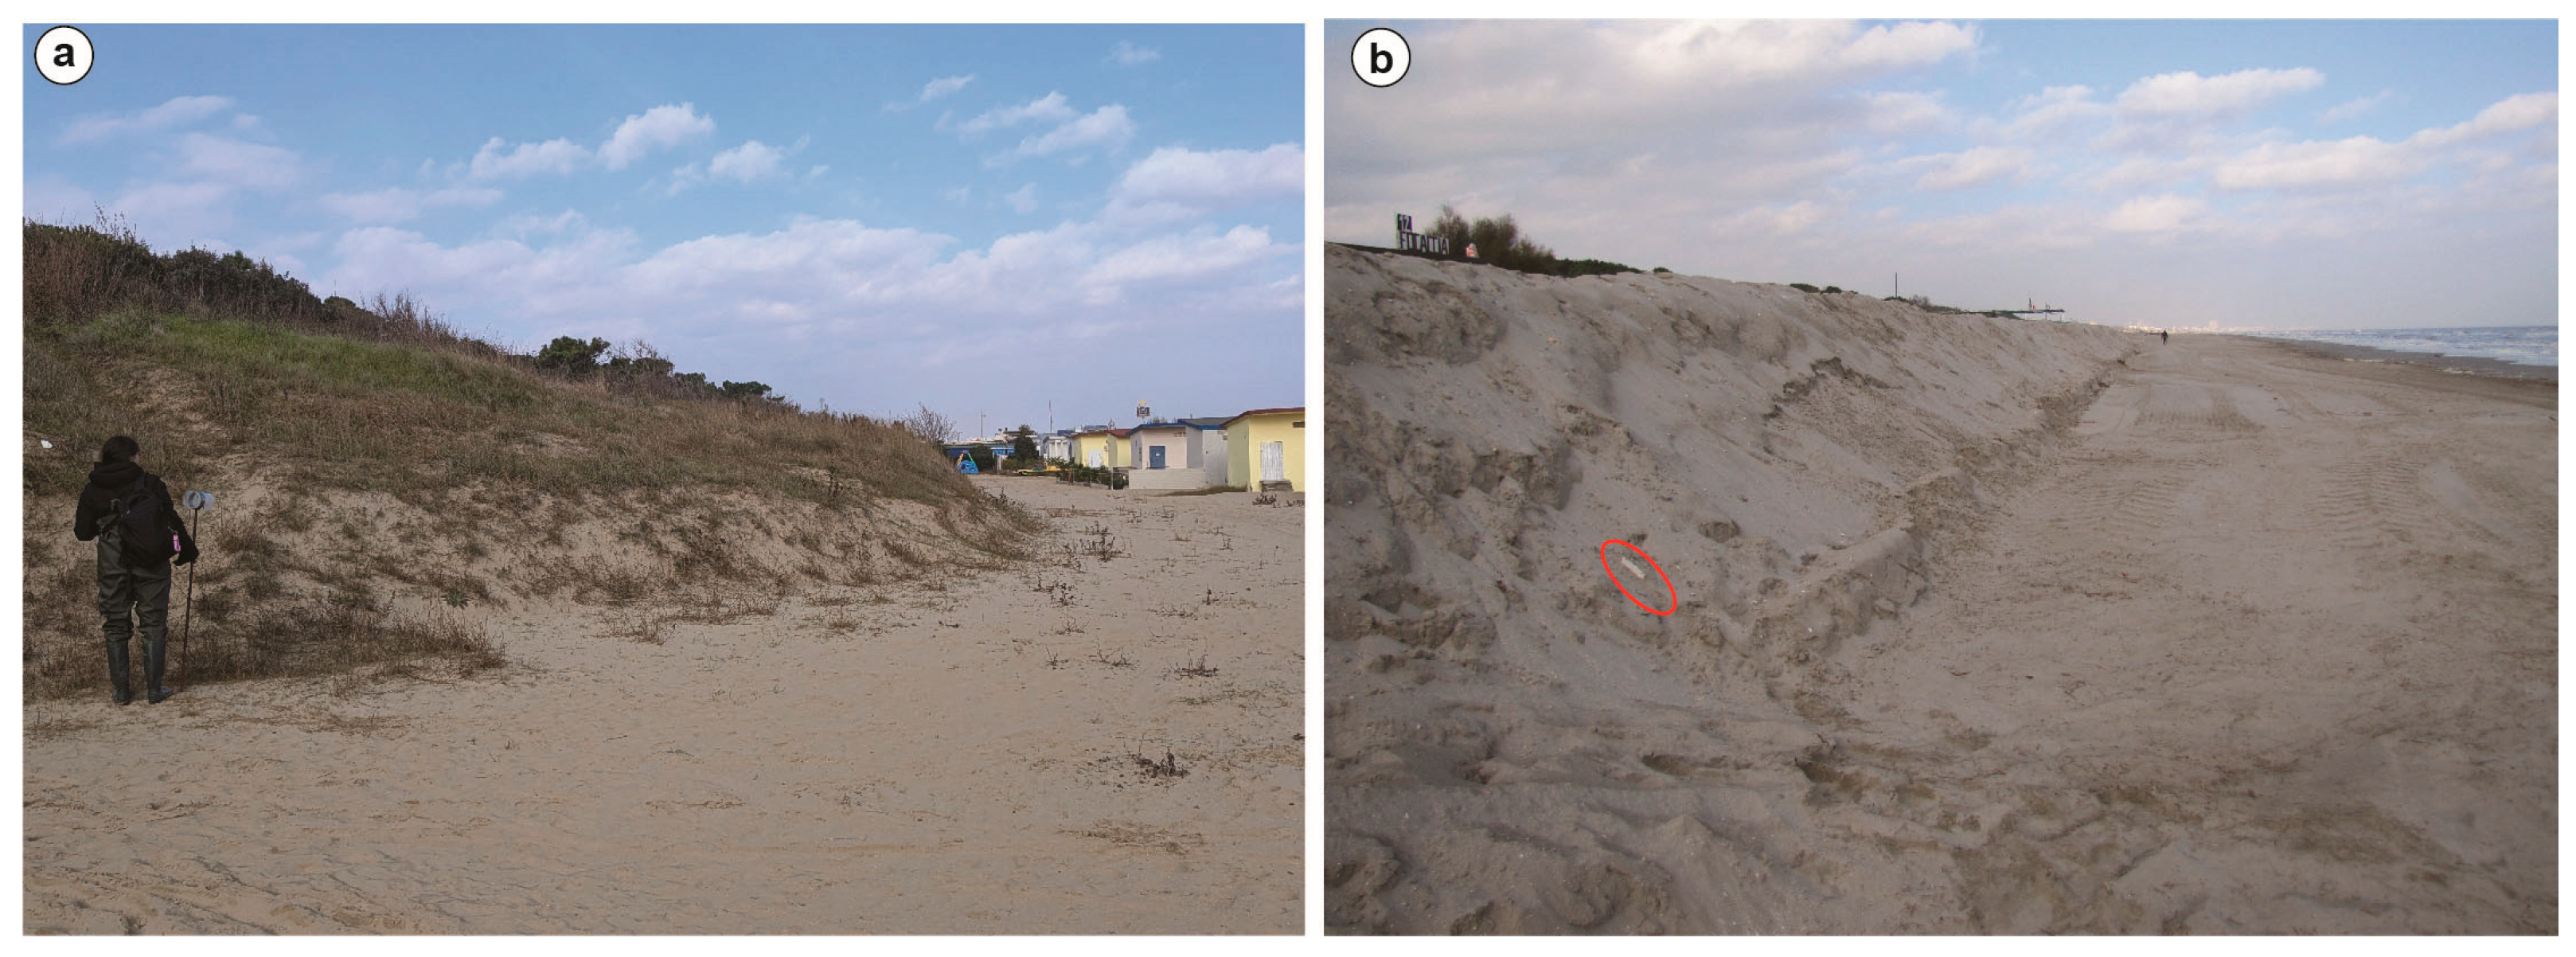
  • Coastal dunes: In this area (as in many other heavily anthropized areas), coastal dunes were almost completely dismantled after the Second World War to make space for tourist infrastructure [20]. Today, remnants of these dunes are limited to a few areas, and they are substantially stabilized by vegetation (Figure 3a). Due to the presence of artificial structures (e.g., bathing facilities), landward aeolian sediment transport is obstructed, preventing the natural replenishment of dunes. These obstacles promote the formation of new aeolian accumulations during the winter months, which are subsequently removed at the beginning of the spring season.
  • Artificial dunes/barriers: During autumn, artificial dunes or sand barriers are constructed parallel to the shoreline to protect inland areas from storm-induced marine inundation (Figure 3b). These structures are created by bulldozers pushing and accumulating beach sand in tight areas. Barriers have a trapezoid shape, and are approximately 2 m high and 6 m wide. The top of the barriers is flat and the landward side is generally close to the repose angle (i.e., 17–27°) while the seaward side is generally less inclined (i.e., 8–20°). Similarly to those that happen in natural dunes, the sides are characterized by en-masse processes triggered by gravitational instability, resulting in the accumulation of grain-flow deposits at the toe of the barrier. During major storms, waves can partially erode these structures that are dismantled in the spring, i.e., before the tourist season.
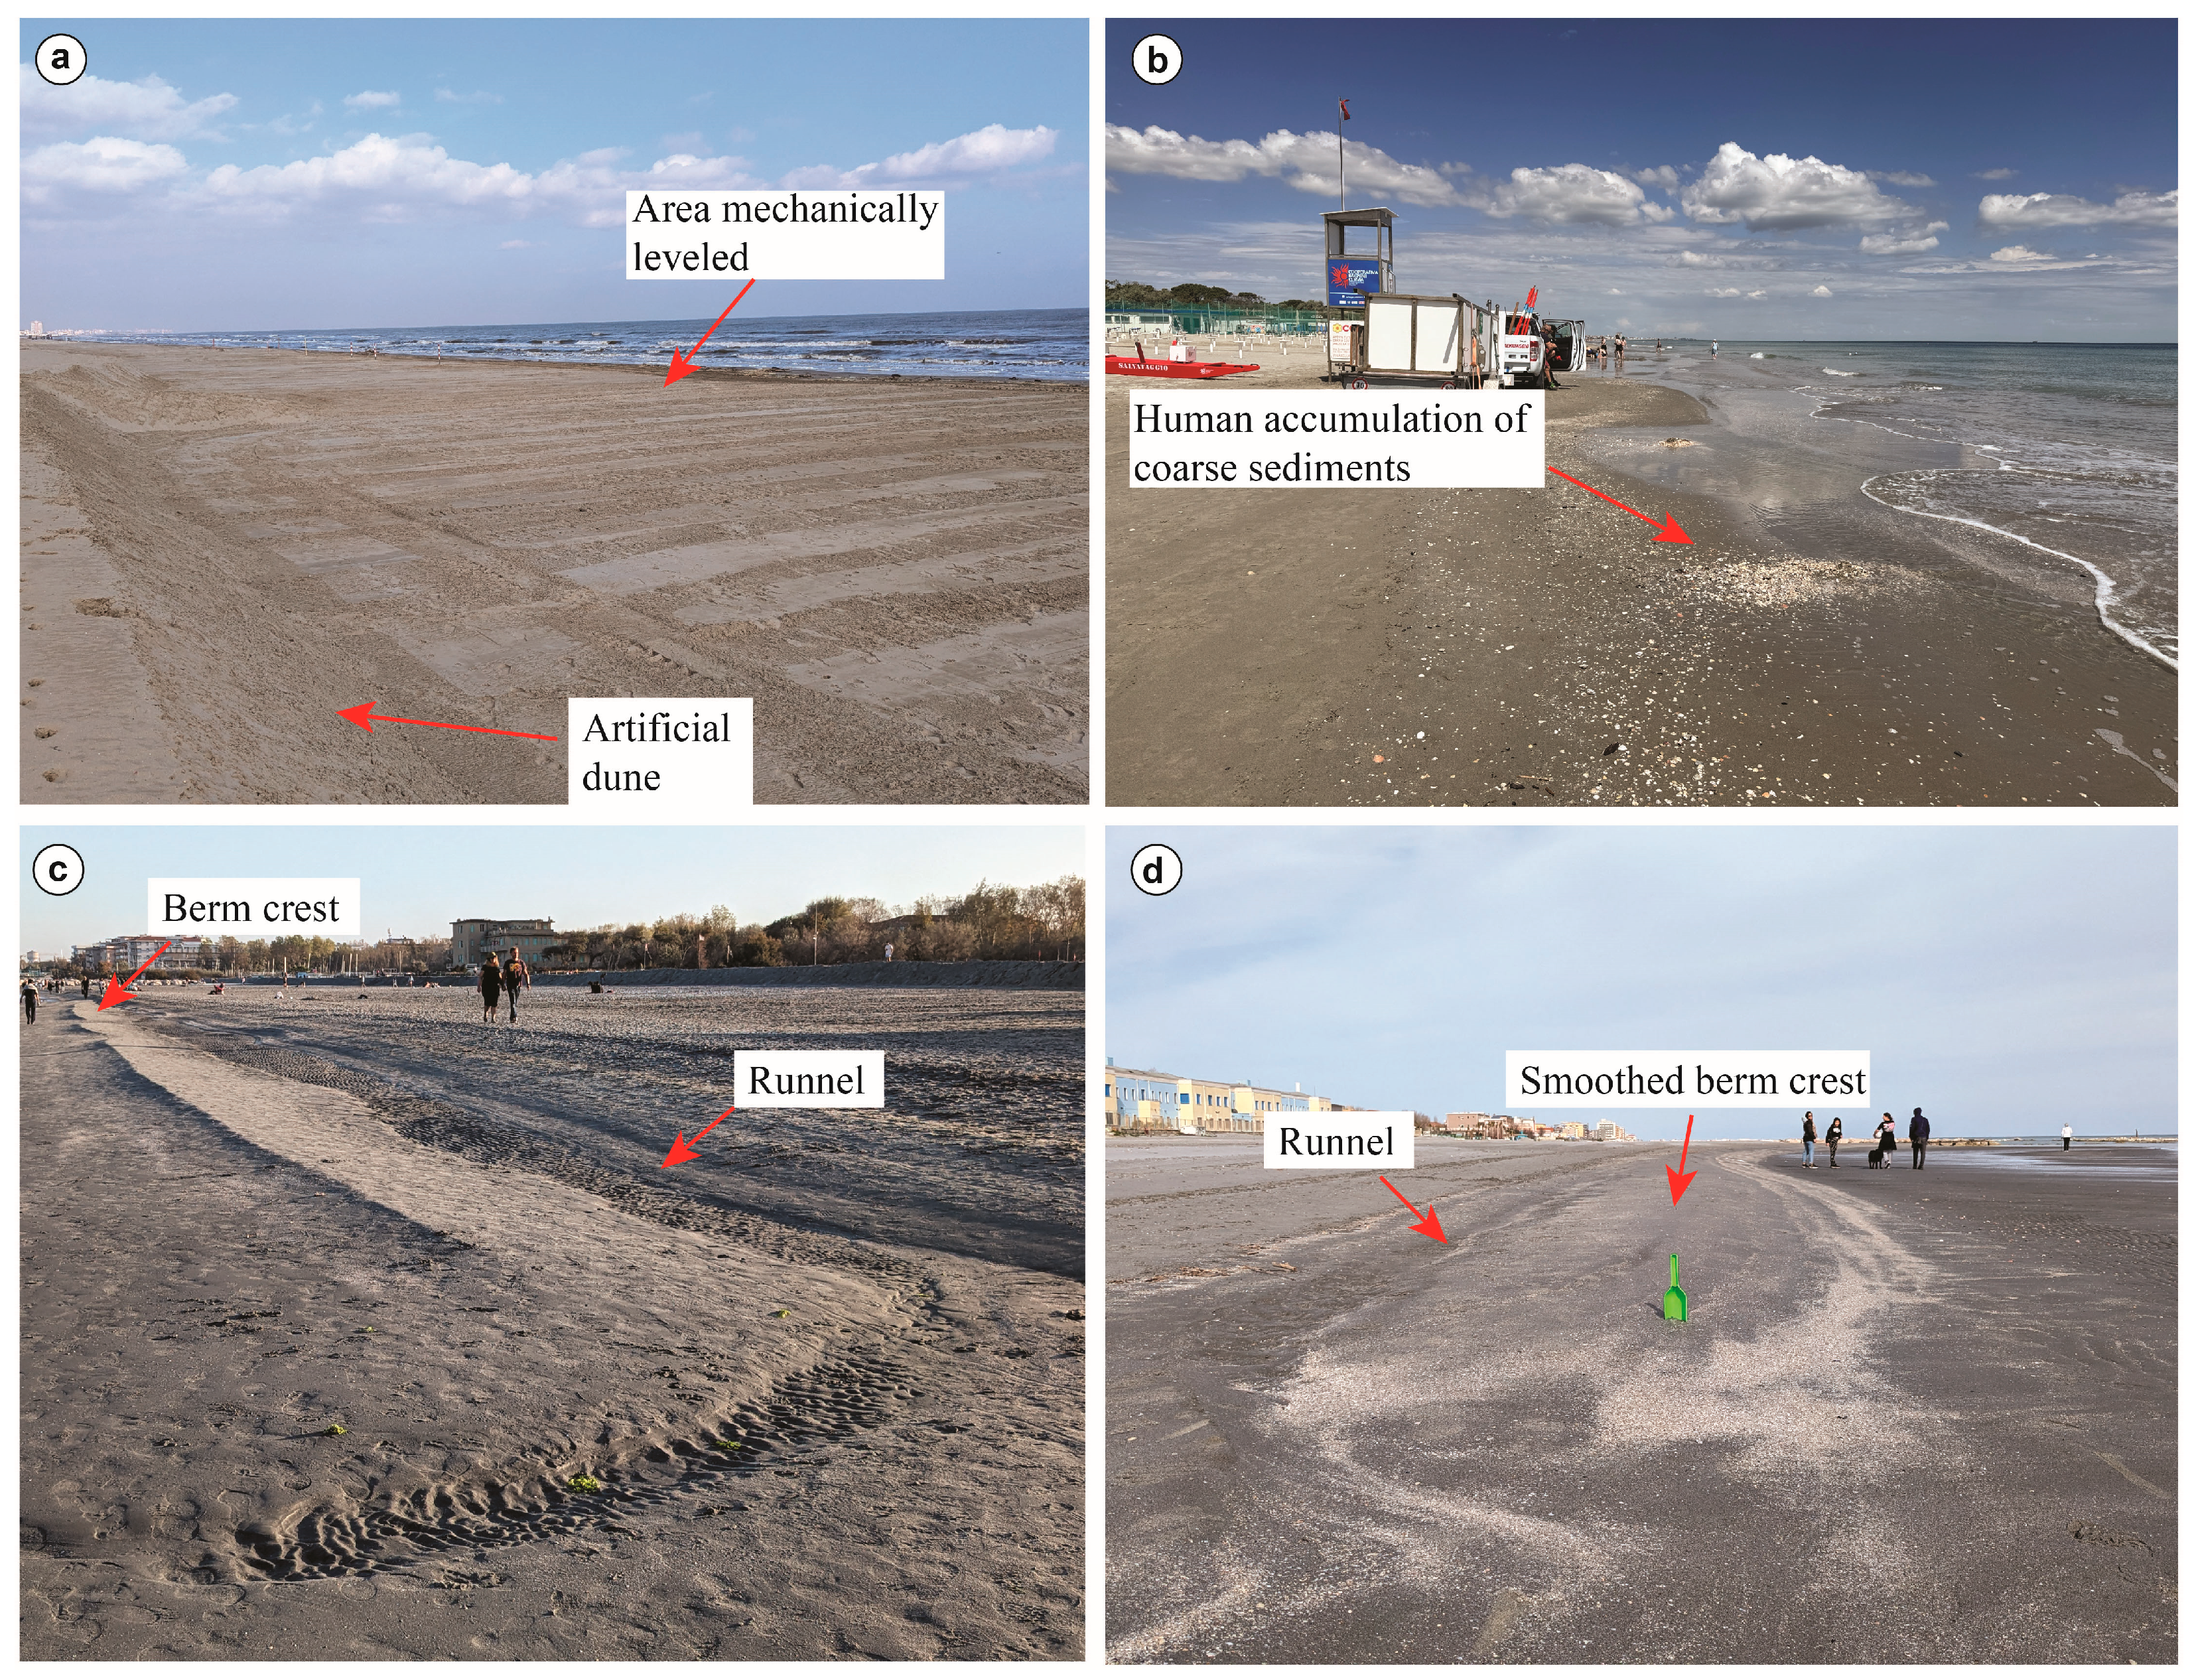
  • Backshore: This area is the most devoted to tourism activities and this is, probably, the zone more modified by human activity: it is mechanically leveled at the beginning of the tourist season, and again at the end of summer for the construction of artificial dunes (Figure 4a). Moreover, during the tourist season, every morning this zone is sieved with operating machines to remove rubbish and shell fragments. The sieved materials are firstly cleaned from rubbish, and then the inorganic coarse-grained fractions (shells, granules, and uncommon pebbles) are thrown close to the shoreline, in the berm zone, or directly in the foreshore (Figure 4b). While this practice is sustainable in terms of sediment budget since it does not result in sediment loss from the beach system, it can lead to granulometric overestimations if samples are taken in these anthropogenically altered zones or closely spaced areas.
  • Storm berm: The storm berm can be observed only occasionally (once in our fieldwork) and only during the winter season because, during spring and summer, this morphological feature is destroyed by human actions. Also, during the winter, storm berms can be recognized only on shorelines not protected by parallel shore barriers.
  • Fair-weather berm and runnel: In partially protected areas, fair-weather berms (hereafter “berm”) commonly occur even if these structures have a low relief (max 20–30 cm). A runnel typically occurs just landward of the berm crest (Figure 4c). In contrast, in areas that are fully protected by hard shore-parallel structures, berms are usually absent or, when present in winter, display minimal relief (max. 10 cm; Figure 4d). In such cases, the backshore connects directly to the foreshore via a flat, gently sloping surface. During spring and summer, berms are regularly cleaned using sieving machines that remove rubbish sensu lato, including Posidonia oceanica leaves and remains of algae. These materials are removed from the beach and from a sediment budget point of view, this practice is problematic because sand grains tend to adhere to Posidonia oceanica leaves and, consequently, these sediments are removed from the system. Considering the substantial quantities of Posidonia oceanica removed during the summer and these beaches’ erosive dynamics, this sediment depletion may aggravate existing sediment budget issues.
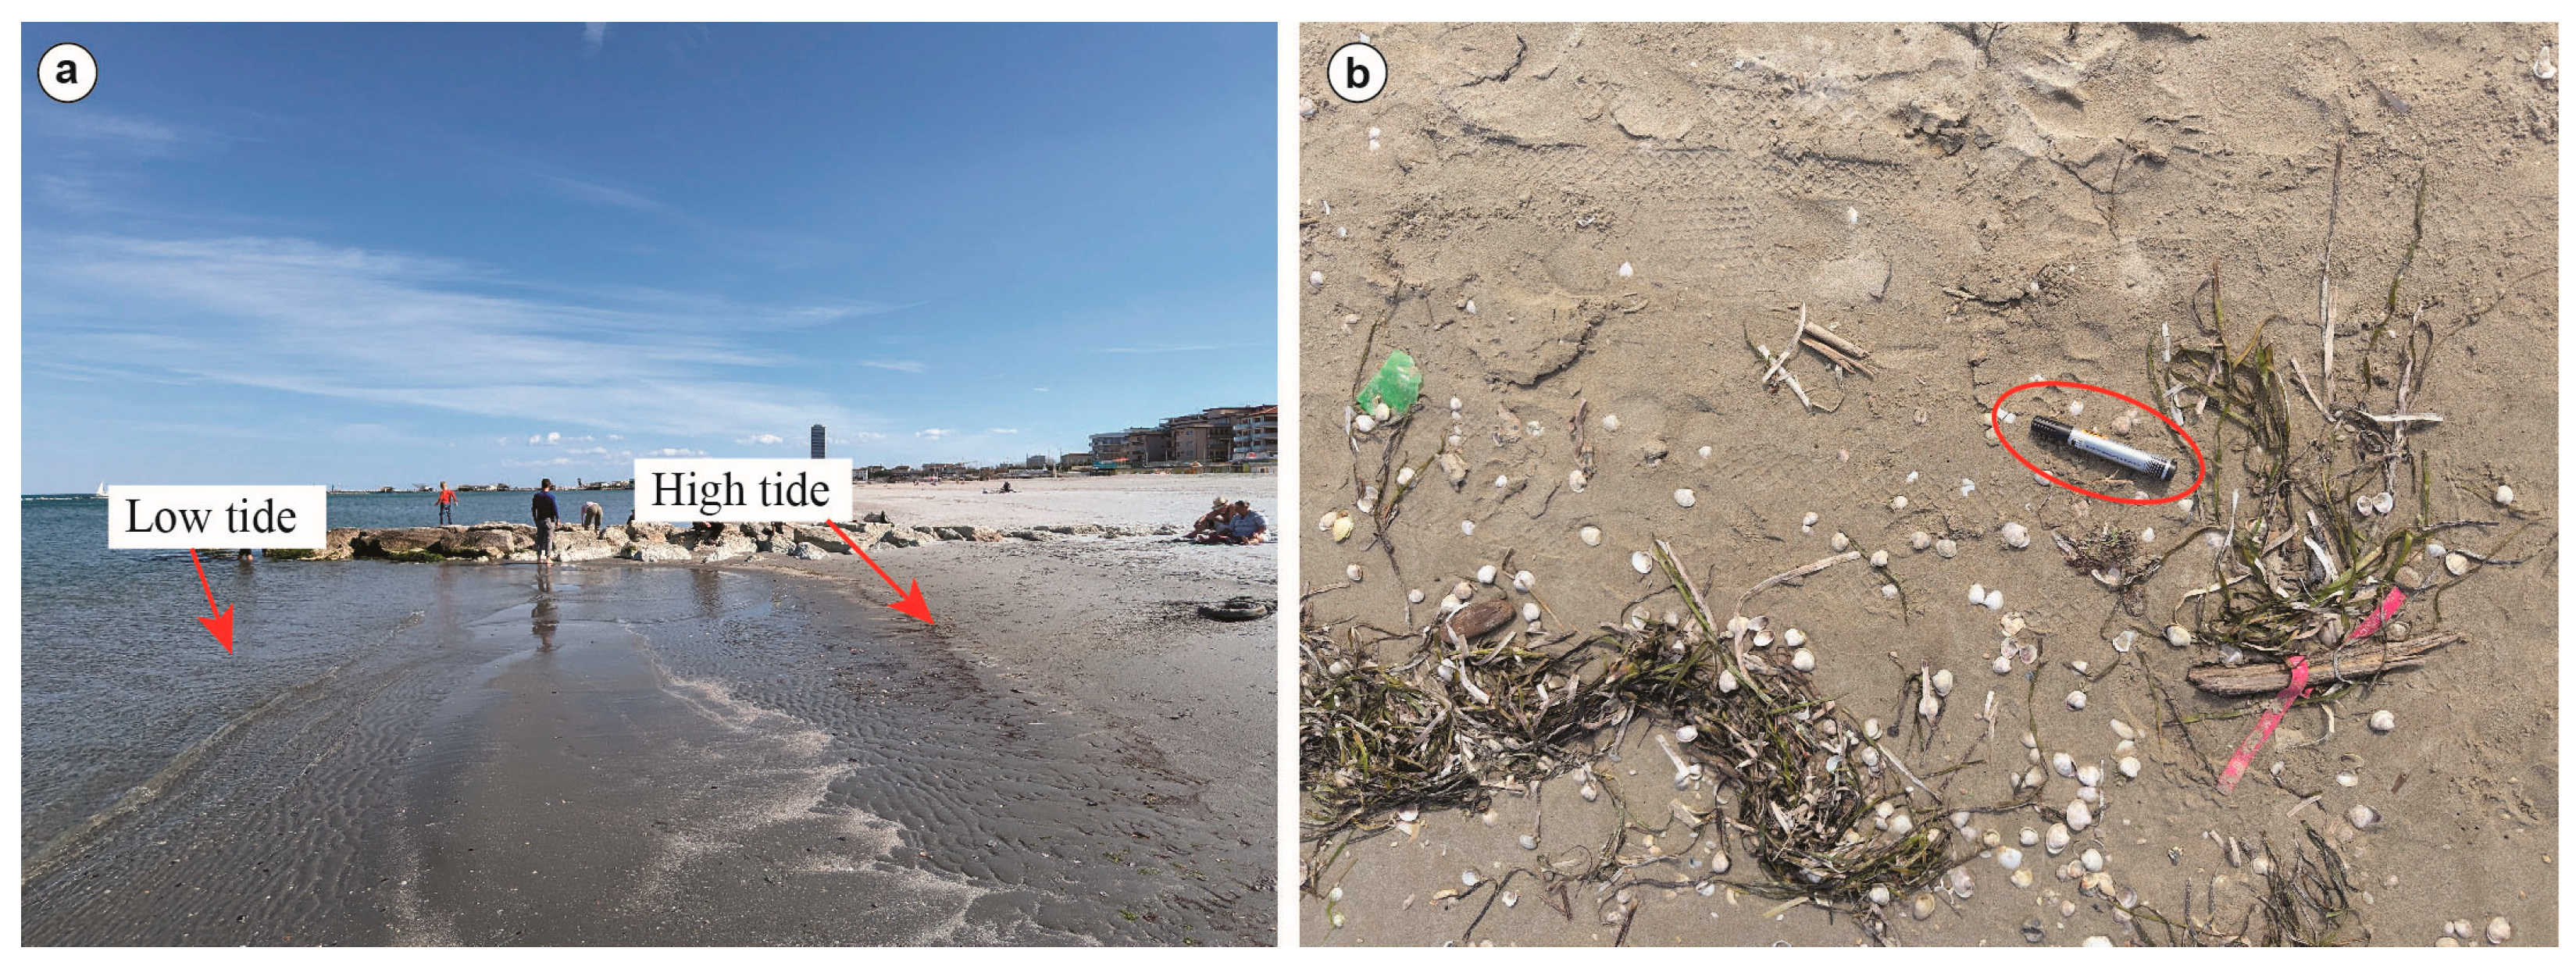
  • Foreshore: The foreshore (Figure 5a) is generally defined as the area between high and low tide [21,22,23,24]. This definition is the most applicable in the investigated area, even if other foreshore classifications have been proposed over time (see [25] for a comprehensive review). It is probably the easiest zone to detect and the less disturbed by human activities, primarily because the constant wave action rapidly erases signs of human activity, allowing natural processes to dominate. The foreshore slope ranges from 1° to 5°. Recognizing the high-tide boundary in the field is relatively easy thanks to concentrations of Posidonia oceanica leaves, algae, shells and macroplastic fragments that highlight it (Figure 5b). In fair-weather conditions, this zone tends to host the greatest concentration of macroplastics along the beach profile. The low-tide boundary is more difficult to identify when observations are conducted in a moment different from the low-tide minimum. In such cases, accurate identification requires tidal correction and the use of a measuring rod to determine the corresponding water depth.
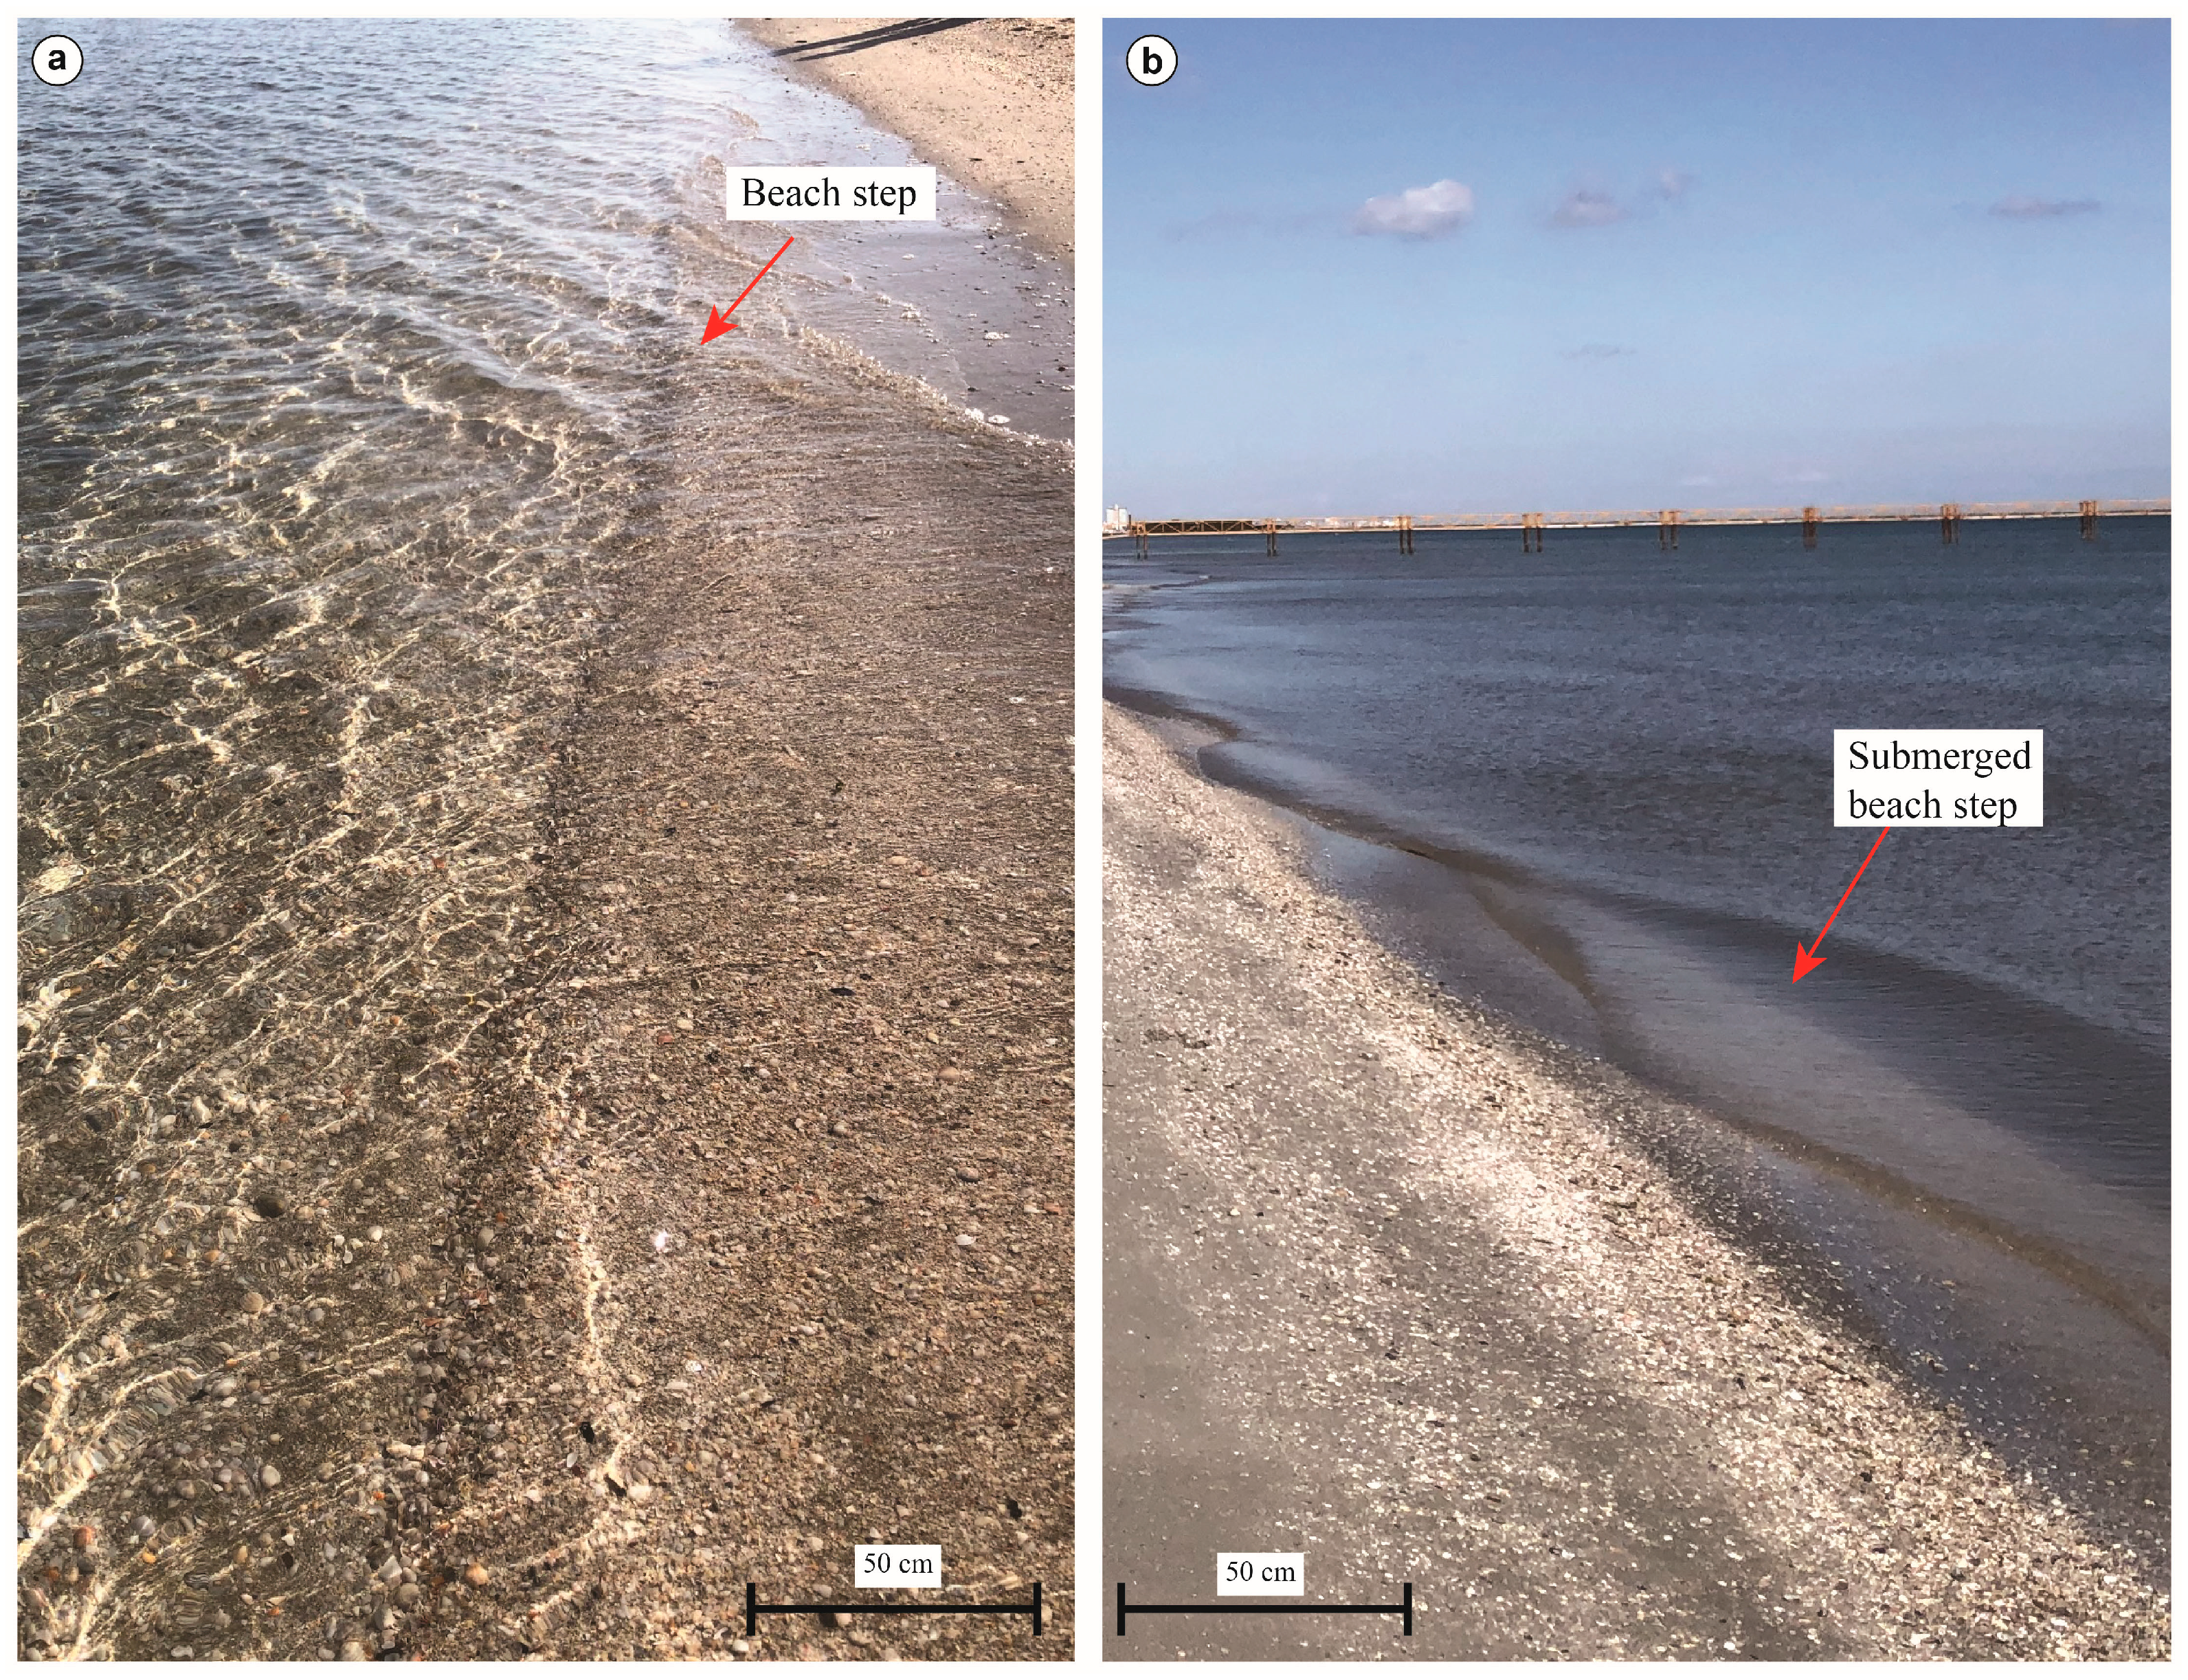
  • Step: Beach steps are morpho/sedimentological features typically found on steep, coarse-grained sand or gravelly beaches, but they can also occur on gently sloping, fine-grained sand beaches [23,24,25]. According to [26], the beach step is a submerged scarp located at the base of the foreshore. As with other features, its occurrence differs depending on the presence of protective structures. On fully protected beaches, steps are often absent or appear as subtle scarps, sometimes identifiable by alongshore alignments of coarse sediment or thin (≤1 cm) shell fragment layers. However, distinguishing these features from similar sedimentary alignments in the foreshore can be challenging. In partially protected sectors, steps are more pronounced, although their relief typically does not exceed 10 cm (Figure 6a,b).
  • Shallow shoreface: The shoreface was surveyed only to a depth of approximately 0.5 m. Within this range, it consistently exhibited symmetrical ripples formed by wave action. These wave ripples are generally absent only in narrow zones landward of coastal protection structures where the seabed is flat.

4.2. Grain-Size Data

Sediment samples for grain-size analysis were collected exclusively from sub-environments where direct anthropogenic sediment reworking is limited throughout the year (i.e., fair-weather berm, foreshore, step, and shallow shoreface). Sampling in areas heavily modified by human activities was deliberately avoided as it could compromise the reliability of the results and lead to interpretations that are not meaningful from a scientific or statistical perspective.
The overall grain-size parameters obtained are reported in Supplementary Table S1. In the text, the data presentation is restricted to describing observed variations related to seasonal dynamics or the presence of coastal defence infrastructures.
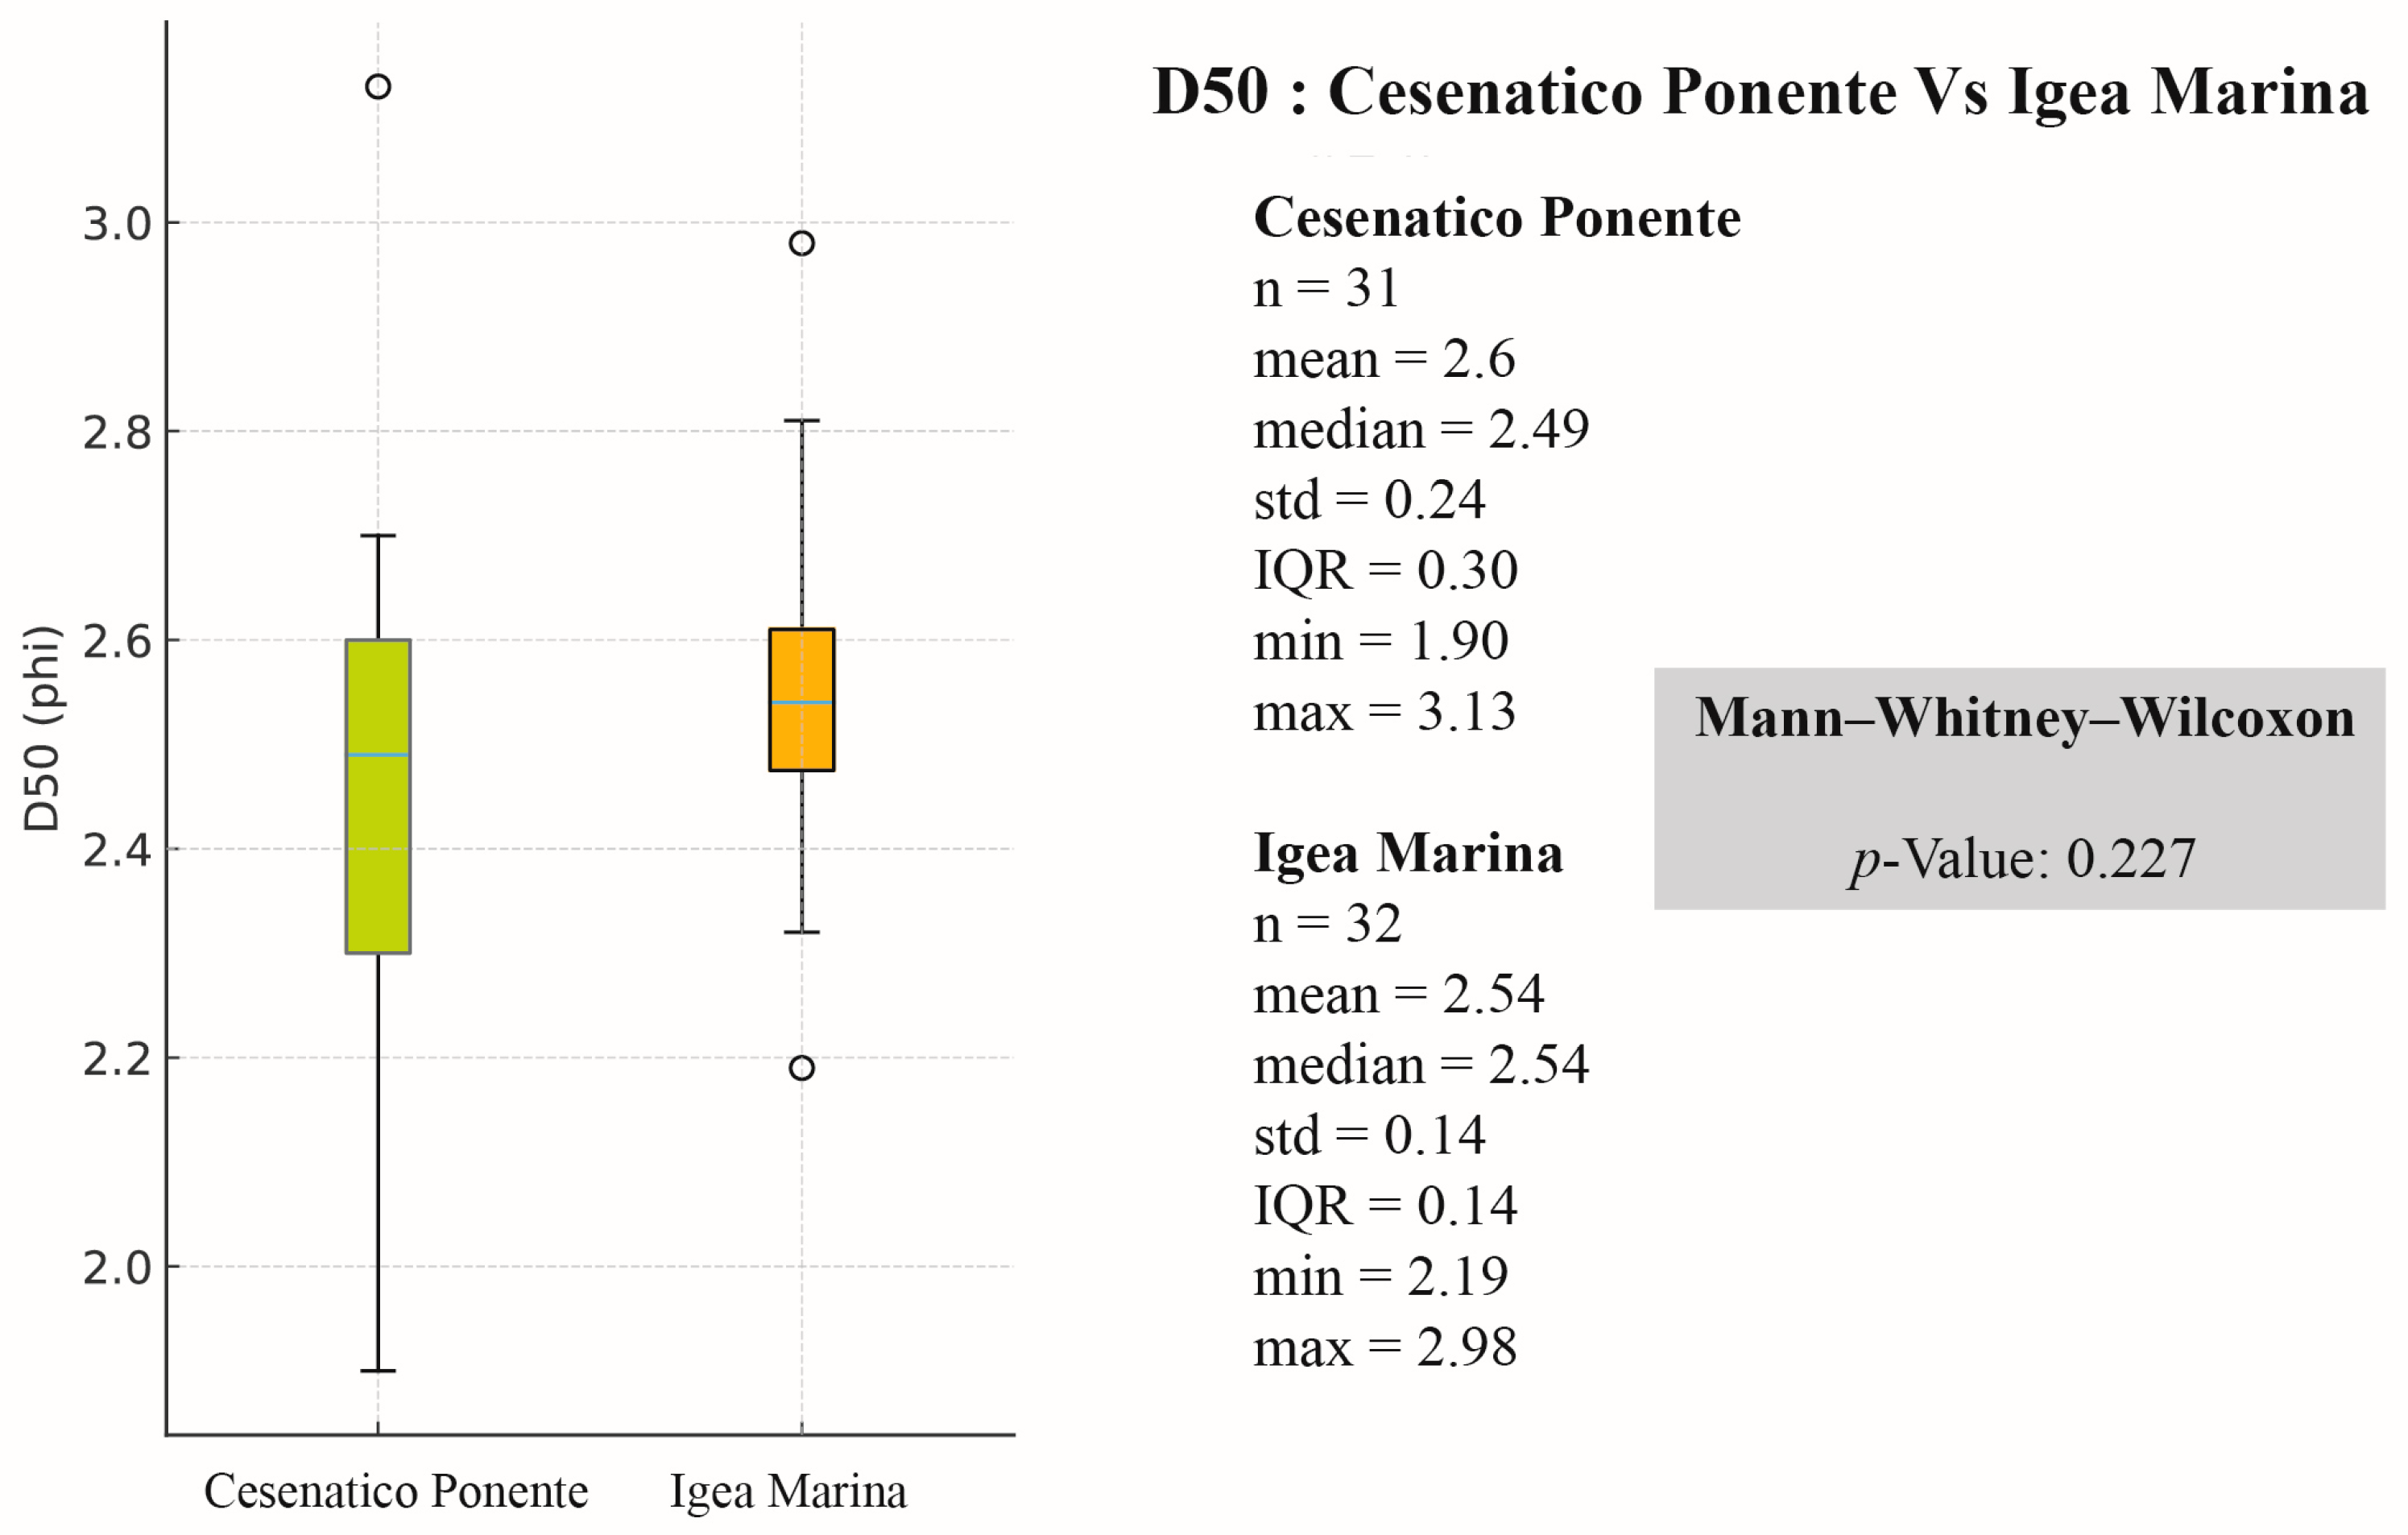
A preliminary statistical analysis (U-test) was conducted on D50 values of the overall samples collected in Cesenatico Ponente (N = 31) and the Igea Marina area (N = 32) to assess whether the two locations could be considered comparable in terms of grain-size distribution (Figure 7). The U-test returned a p-value of 0.227, indicating no statistically significant difference in median grain size between the two areas. Thus, the sediments in both areas can be considered similar from a statistical standpoint.

4.2.1. Median Grain Size (D50)

D50 (median sediment diameter) is the most used parameter for sediment characterization in sedimentological-oriented studies [27]. This choice is because D50, when interpreted alongside sedimentary structures, can offer insights into the energy conditions of the depositional environment, as illustrated by the Hjulström diagram [28].
In the present dataset, D50 values display a uniform distribution across different sub-environments and seasons (Table 1). Among the sampled zones, the step is characterized by the coarsest sediments, whereas the shoreface consistently shows the finest grain sizes.
A statistically significant seasonal variation was detected only in berm sediments, where winter samples are coarser than those collected in summer (p-value = 0.041; see Table 1). This pattern is consistent with the well-documented seasonal dynamics of berm formation and erosion [29]. Along the Northern Adriatic coast, the wave climate is generally low energy but punctuated by episodic high-energy storms, especially during winter. These short-lived events induce rapid berm erosion and selective winnowing of fine sediment, exposing a coarser lag and promoting the incorporation of abundant bioclastic fragments. During summer, by contrast, prolonged fair-weather conditions and low-energy swash promote landward onshore transport of finer fractions, progressively smoothing the berm surface [30]. The coarsening observed during winter, when the beach is not subject to mechanical intervention, indicates that natural hydrodynamic sorting is the primary control on berm grain-size variability. Anthropogenic activities may superimpose minor local mixing during summer but they do not account for the observed winter coarsening signal.
MAD values indicate generally low dispersion across the dataset. However, comparison with the MIN–MAX range reveals the presence of outliers that the MAD does not effectively capture, such as the summer foreshore value (see Table 1).
These results suggest that no significant seasonal shifts in D50 occurred within each sub-environment between summer and winter. Nevertheless, intra-site variability (i.e., variability among similar sub-environments along the same stretch of coastline) is substantial in the foreshore, reaching up to 0.80 Φ during summer. This higher variability is interpreted as a direct expression of the dynamic and rapidly reworked nature of the swash zone, where short-lived changes in wave runup, episodic winnowing and short-term deposition can alternately expose coarse lag layers or fine-grained sediments. In this context, “outliers” are not an analytical anomaly, but a real sedimentary state reflecting transient hydrodynamic conditions rather than noise. Conversely, the berm shows more uniform grain-size distributions (MAD = 0.21 Φ in summer), consistent with lower short-term reworking and longer residence times of surface sediment.
Comparing the D50 of beaches protected by shore-parallel structures and those partially protected, the data highlight no statistically significant differences except for step sediments (u-test p-value = 0.005, Table 2), which result in finer-grained sediments in protected settings. This difference likely reflects the energy-dampening effect of coastal barriers, which reduce wave energy reaching the shoreline. Also in this case, the MAD values highlight general low-value dispersions.

4.2.2. Mean Grain Size (Mz)

Mean sediment diameter (Mz) is widely used in marine geology for sediment characterization [2,31,32]. Similarly to D50, the Mz values show a general uniformity across different sub-environments and seasons. Once again, the step represents the coarsest-grained sub-environment, while the shoreface exhibits the finest-grained sediments. A statistically significant seasonal difference in Mz is observed only in berm sediments, where winter samples are coarser than those collected in summer (p-value = 0.007, see Table 3).
The Mz MAD values also display a similar attitude with D50’s MAD, pointing to general low-value dispersions, even if the comparison of MIN-MAX values highlights the occurrence of some outliers underestimated by MAD (see, for example, winter Foreshore value in Table 3). As with D50, the foreshore shows the most significant variability of Mz, reaching up to 1.00 Φ during the winter, while the berm remains the most stable, particularly in the summer season (0.21 Φ).
As observed for D50, the median Mz values show no statistically significant differences between beaches fully protected by shore-parallel structures and those only partially protected, except for the step sub-environment. In this case, sediments are significantly finer in protected settings (U-test p-value = 0.009; see Table 4), likely due to the reduced wave energy caused by protective structures. The MAD values highlight general low-value dispersions.

4.2.3. Sorting (σ)

Sorting is a key parameter that describes the degree of dispersion of a grain-size distribution around its central tendency [33]. Among the analyzed sub-environments, step sediments exhibit the poorest sorting (values between 0.72 and 0.78), while the shoreface consistently returns the best-sorted sediments (values between 0.42 and 0.44).
The berm is the only sub-environment that shows a statistically significant seasonal difference in sorting (p-value = 0.005, see Table 5). In winter, berm sediments are better sorted, accompanied by a very low MAD value, whereas in summer they are less well sorted, with a higher MAD.
Sorting values generally show low MADs, suggesting generally low dispersion within each sub-environment. However, comparison of minimum and maximum values reveals the presence of outliers underestimated by the MAD. The foreshore shows the highest variability, with sorting values reaching up to 0.82 during the summer, while the berm is again the most stable, particularly during the summer (MAD = 0.12).
A comparison of sorting median values between beaches protected by shore-parallel structures and those partially protected reveals no statistically significant differences across sub-environments. However, the step shows a p-value of 0.093 for the U-test (see Table 6), which is close to the conventional threshold for statistical significance (p = 0.05).
This result suggests that a larger sample size may potentially reveal a significant difference, with steps in protected settings exhibiting better sorting than those in partially protected areas.

4.2.4. Skewness (Sk)

Skewness is a statistical parameter that quantifies the asymmetry of grain-size distribution in sediment samples, indicating whether the distribution is skewed towards finer or coarser particles. This parameter can provide valuable insights into the sedimentary environment and the transport mechanisms [34].
In the present study, all sub-environments exhibit coarsely to very coarsely skewed distributions, except for winter berm deposits, which occasionally display symmetrical distributions (Table 7). Among the environments analyzed, the step shows the most coarse skewness, whereas the berm appears to be the least skewed (Table 7). This is consistent with hydrodynamic conditions with the more energetic step characterized by an enrichment in the coarse-grained tail, while fine sediments are easily removed.
No statistically significant seasonal differences in skewness were observed across any of the investigated sub-environments. However, both MAD and range values are generally high in absolute terms, suggesting that skewness can vary substantially along different shoreline segments, even within the same sub-environment.
Comparing Sk values in protected vs. partially protected environments, one statistically significant variation can be recognized in step deposits (p-value = 0.013, Table 8), with median values more coarsely skewed in protected settings (−1.94 vs. −1.30).

5. Discussion

Geological and morphological monitoring of beach evolution is crucial for effectively managing and preserving coastal systems [1,2,3,4,5,35,36]. However, modern beaches are often heavily impacted by human activities, almost destroying the original beach profile. The objective of this discussion is twofold: (i) to identify the beach zones least affected by anthropogenic alterations, where monitoring can presumably be carried out without significant interference from high-frequency human activities and (ii) to evaluate the influence of seasonal wave energy variability [37] and shore-parallel protective structures on grain-size parameters in order to understand how these factors may affect the granulometric outcomes of monitoring efforts.
Although focused on specific sites, the insights gained here may apply to other sandy beaches along the Italian peninsula and across the Mediterranean region, where similar beach management practices are commonly employed.

5.1. Identifying Suitable Areas for Beach Monitoring

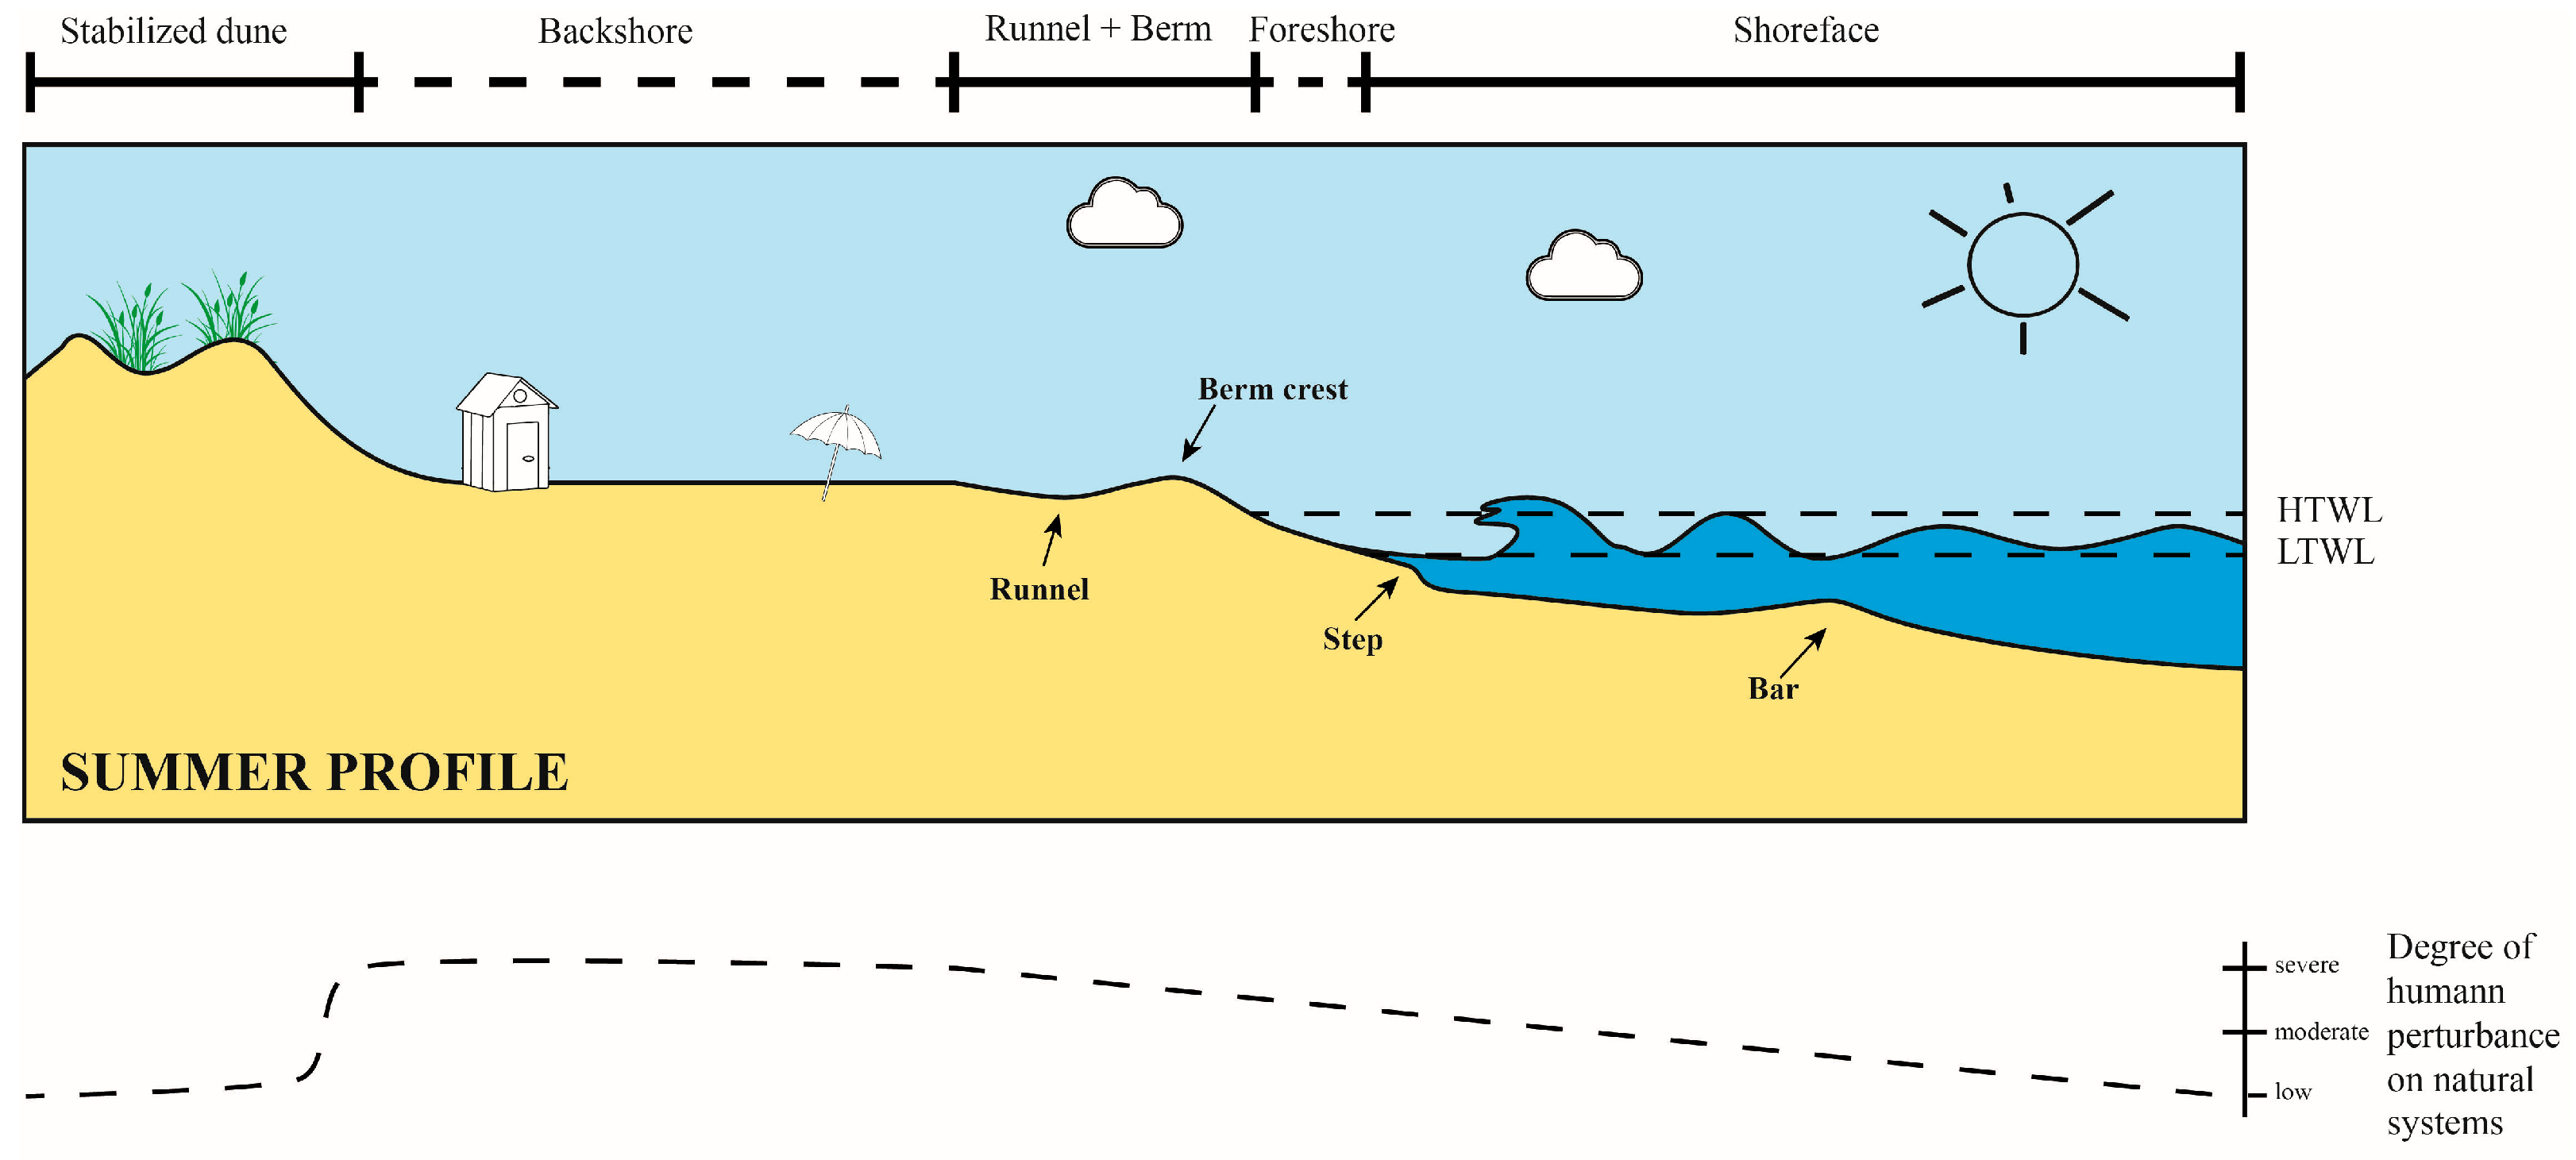
In the investigated beaches, only the zones closest to the shoreline, and specifically those seaward of the fair-weather berm, can be considered little altered by human activities and are therefore suitable for geology-oriented studies (Figure 8). The fair-weather berm is generally easily recognizable even if it is smoothed in protected settings (Figure 8). While some anthropogenic activities may degrade or even temporarily remove this morpho-sedimentological feature, the rate at which wave action rebuilds the berm is typically sufficient to counterbalance such disturbances.
This is a critical aspect for geological investigations, as the fair-weather berm is one of the most frequently studied zones in coastal sedimentology [38,39,40,41,42]. The scientific interest in this area is largely due to its clearly identifiable crest [29], which facilitates reproducible measurements over time.
Seaward of the berm, wave-winnowing processes incessantly reshape the area between the berm and the shoreface, producing morphologies that closely resemble those of natural, unaltered beaches. Different sub-environments can also be correctly distinguished using some natural or pollutant markers, as in the case of the high-tide zone (i.e., the boundary between the berm and the foreshore) that is typically marked by alignments of Posidonia oceanica leaves, shells, and macroplastic debris.

5.2. Grain-Size Characterization: Which Areas Are Most Suitable for Geological Investigation?

Grain-size characterization is one of the most fundamental components of shoreline studies [1,43,44]. It serves academic purposes and plays a critical role in the practical management of coastal environments. A prominent example is beach nourishment, often the only viable intervention for mitigating coastal erosion. In such cases, a precise grain-size assessment of the native beach sands and the sediment used for nourishment is crucial to the operation’s success [45,46].
However, it is important to highlight human activities’ potential impact on beach sediments’ grain-size features. Failing to account for anthropogenic alterations can lead to sampling errors and misleading granulometric interpretations, resulting in scientifically ambiguous data that cannot be reliably compared across studies or used for long-term monitoring. This variability has direct analytical implications, as landward sub-environments are often affected by beach cleaning, seasonal reprofiling, nourishment and general sediment reworking. These processes may artificially alter the grain-size distribution, producing values that do not reflect natural depositional dynamics and hindering the comparability of granulometric datasets across different studies. Ensuring consistent sampling procedures is therefore essential to maintain methodological reliability (e.g., [47]). This issue becomes even more critical because many scientific papers and technical reports refer vaguely to “beach sediments” without specifying the sub-environment from which the samples were collected, thereby increasing the difficulty of accurately analyzing and comparing different depositional environments.
As previously highlighted, only sub-environments located seaward of the berm are suitable for grain-size characterization (Figure 8). In these areas, sediments and sedimentary structures can reliably reflect the dominant depositional processes and provide insights into the medium-term evolution of the coastal system. Conversely, sub-environments landward of the berm are heavily reworked by human activities, making it highly likely that their grain-size properties do not reflect natural dynamics (Figure 8).
However, sampling sub-environments seaward to the fair-weather berm also requires attention to avoid localized accumulations of coarse materials from beach-cleaning operations in tourist areas. Therefore, a precise and detailed characterization of each sampled sub-environment is essential, as they can differ markedly in their grain-size signatures due to contrasting depositional settings.
The presented data highlight that D50 and Mz values are closely aligned, and that the berm is the only sub-environment to show statistically significant seasonal variation in both parameters. Specifically, berm sediments are coarser in winter and finer in summer, likely reflecting seasonal differences in wave energy.
The step is the only sub-environment showing a statistically significant difference between protected and partially protected beaches, with finer-grained sediments (i.e., those with higher logarithmic D50 and Mz values) occurring in areas protected by shore-parallel hard structure.
A similar seasonal trend is observed for sorting, with the berm again being the only sub-environment exhibiting significant differences between summer and winter. Berm sediments are better sorted in winter and less sorted in summer. No statistically significant differences in sorting were found between protected and partially protected beaches.
Skewness values do not exhibit significant seasonal variation across the sub-environment analyzed. However, step sediments in protected beaches are statistically more negatively skewed (i.e., coarser-skewed), finer grained, and slightly better sorted than in unprotected settings. This result is somewhat unexpected, given that shore-parallel protection structures typically reduce wave energy, which intuitively would not favor the accumulation of coarse particles. Two explanations are proposed to account for this pattern: (i) the reduced wave energy in protected settings may be sufficient to mobilize and remove the finest sediment fraction, improving sorting while depositing fine sand and (ii) in these low-energy environments, coarse-grained bioclastic material is preserved rather than pulverized as occurs in higher-energy settings. Regarding the second hypothesis, this interpretation is strongly supported by visual analysis of the samples, which revealed a significantly higher proportion of coarse, poorly abraded bioclastic fragments in the protected step environments compared to high-energy unprotected settings. It is important to note that although bioclastic fragments >2000 μm were removed prior to analysis to adhere to the sand-fraction protocols, abundant fragments within the coarse sand range (e.g., 1000–2000 μm) remained in the sample. These fragments play a crucial role in shifting the grain-size curve tail towards the coarse fraction, thereby producing the observed negative skewness, even while the bulk of the sediment (D50) remains fine. The first hypothesis is consistent with the statistically significant differences in D50 documented for step sediments: protected steps contain finer and slightly better-sorted sediments compared to unprotected ones. This reinforces the hypothesis of a hydrodynamic regime that allows the settling of fine sand while preserving coarse bioclasts that would otherwise be broken down in higher-energy settings. Realistically, a combination of both processes likely explains the observed trends.
In conclusion, this study emphasizes the need for rigorous discrimination among sub-environments when conducting grain-size characterizations. These zones represent distinct hydrodynamic and depositional regimes, which are reflected in their sedimentological properties. Using generic terms such as “beach sediments” without specifying the hydrodynamic context of sampling renders the data unsuitable for meaningful comparisons, particularly in studies addressing geological processes, plastic and pollutant dispersion, or coastal management. A precise definition of the sampling context is thus critical for both scientific and applied research.

6. Conclusions

The data presented in this study indicate that, in the two investigated beaches, the fair-weather berm and the seaward sub-environments can record traces of present geological processes despite the pervasive influence of human activities. In contrast, areas landward of the berm are heavily anthropogenically altered, often to the extent that natural sedimentary signatures are nearly obliterated. These findings are likely transferable to other sandy beaches managed similarly, particularly in the Mediterranean.
Shore-parallel defense structures influence the morphological features of some sub-environments, especially the fair-weather berm, leading to smoothed geometries. In protected settings, a concentration of Posidonia oceanica leaves (when not removed during beach-cleaning operations), algae, shells, and (unfortunately) macroplastic fragments may serve as a useful indicator of the upper foreshore boundary, particularly where a clear slope break with the berm is absent. These insights provide practical guidance for coastal management, helping identify where sediment should be sampled to reliably track natural dynamics and where human interventions should be limited to avoid masking environmental signals.
From a grain-size analysis perspective, different sub-environments show distinct responses to seasonal variability and the presence or absence of coastal protection structures. Specifically:
  • The berm is sensitive to seasonal changes, showing statistically significant differences in D50, Mz, and sorting between summer and winter conditions—variations likely influenced by both natural wave energy regimes and the intensity of human beach maintenance;
  • The step sub-environment, on the other hand, reflects differences between protected and partially protected settings, particularly in D50, Mz, and skewness values.
These results underscore the importance of distinguishing among sub-environments during sediment sampling and of reporting the hydrodynamic and anthropogenic context of each sampling location. This approach ensures that granulometric data can be correctly interpreted and meaningfully compared across studies and coastal settings.

Supplementary Materials

The following supporting information can be downloaded at: https://www.mdpi.com/article/10.3390/jmse13122230/s1, Table S1. Grain-size parameters of the analyzed samples.

Author Contributions

I.M.: Conceptualization, Investigation, Data curation, Writing—original draft, Visualization, Methodology, Formal analysis, Validation, Writing—review & editing. L.C.: Investigation, Data curation, Writing—review & editing. L.T.: Investigation, Data curation, Writing—review & editing. A.B.: Investigation, Data Curation, Formal analysis, Writing—review & editing. All authors have read and agreed to the published version of the manuscript.

Funding

This research received no external funding.

Data Availability Statement

The data discussed in this paper have been uploaded into the Mendeley Database: https://dx.doi.org/10.17632/vxf6jywwfv.1.

Acknowledgments

The presented dataset is part of the PhD research of AB, and has been integrated with data from the theses of L.C. and L.T. The authors gratefully acknowledge the Municipality of Cesenatico for logistical support during the field activities. We thank the two anonymous reviewers for their constructive comments and helpful suggestions, which improved the clarity and quality of the manuscript, and Massimo Moretti (University of Bari) for his careful review of an earlier version of the paper.

Conflicts of Interest

The authors declare that they have no known competing financial interests or personal relationships that could have appeared to influence the work reported in this paper.

References

  1. Gao, S.; Collins, M.B. Analysis of Grain Size Trends, for Defining Sediment Transport Pathways in Marine Environments. J. Coast. Res. 1994, 10, 70–78. [Google Scholar]
  2. Guillén, J.; Palanques, A. Short- and Medium-Term Grain Size Changes in Deltaic Beaches (Ebro Delta, NW Mediterranean). Sediment. Geol. 1996, 101, 55–67. [Google Scholar] [CrossRef]
  3. Lapietra, I.; Lisco, S.; Capozzoli, L.; De Giosa, F.; Mastronuzzi, G.; Mele, D.; Milli, S.; Romano, G.; Sabatier, F.; Scardino, G.; et al. A Potential Beach Monitoring Based on Integrated Methods. J. Mar. Sci. Eng. 2022, 10, 1949. [Google Scholar] [CrossRef]
  4. Lapietra, I.; Lisco, S.N.; Milli, S.; Rossini, B.; Moretti, M. Sediment Provenance of a Carbonate Bioclastic Pocket Beach—Le Dune (Ionian Sea, South Italy). J. Palaeogeogr. 2022, 11, 238–255. [Google Scholar] [CrossRef]
  5. Lapietra, I.; Lisco, S.; Mastronuzzi, G.; Milli, S.; Pierri, C.; Sabatier, F.; Scardino, G.; Moretti, M. Morpho-Sedimentary Dynamics of Torre Guaceto Beach (Southern Adriatic Sea, Italy). J. Earth Syst. Sci 2022, 131, 64. [Google Scholar] [CrossRef]
  6. Dean, R.G.; Galvin, C.J. Beach Erosion: Causes, Processes, and Remedial Measures. CRC Crit. Rev. Environ. Control 1976, 6, 259–296. [Google Scholar] [CrossRef]
  7. Willis, C.M.; Griggs, G.B. Reductions in Fluvial Sediment Discharge by Coastal Dams in California and Implications for Beach Sustainability. J. Geol. 2003, 111, 167–182. [Google Scholar] [CrossRef]
  8. Graffin, M.; Regard, V.; Carretier, S.; Maffre, P.; Almar, R. On the Overlooked Impact of River Dams on Beach Erosion Worldwide. 2021. Available online: https://eartharxiv.org/repository/view/2594/ (accessed on 1 October 2025).
  9. ARPAE Emilia-Romagna. Stato Del Litorale Emiliano-Romagnolo: Erosione e Interventi Di Difesa. 2018. Available online: https://ambiente.regione.emilia-romagna.it/it/suolo-bacino/argomenti/difesa-della-costa/stato-del-litorale-emiliano-romagnolo-allanno-2007-e-piano-decennale-di-gestione (accessed on 1 October 2025).
  10. Sytnik, O.; Del Río, L.; Greggio, N.; Bonetti, J. Historical Shoreline Trend Analysis and Drivers of Coastal Change along the Ravenna Coast, NE Adriatic. Environ. Earth Sci. 2018, 77, 779. [Google Scholar] [CrossRef]
  11. Davies, J. A Morphogenic Approach to World Shorelines; a Morphogenic Approach to World Shorelines. Z. Geomorphol. 1964, 8, 127–142. [Google Scholar] [CrossRef]
  12. ARPAE Emilia-Romagna Caratterizzazione Dei Sedimenti Delle Spiagge Oggetto Di Ripascimento (Area Romagna) e Dell’area off-Shore: Relazione Finale. 2021. Available online: https://ambiente.regione.emilia-romagna.it/it/suolo-bacino/documentazione/gare-e-appalti-pubblici/progettone-4/doc-progetto-4/p4_l1e_allegato-tecnico_c-caratterizzazione-sedimenti.pdf (accessed on 1 October 2025).
  13. Poullet, P.; Muñoz-Perez, J.J.; Poortvliet, G.; Mera, J.; Contreras, A.; Lopez, P. Influence of Different Sieving Methods on Estimation of Sand Size Parameters. Water 2019, 11, 879. [Google Scholar] [CrossRef]
  14. Román-Sierra, J.; Muñoz-perez, J.J.; Navarro-Pons, M. Influence of Sieving Time on the Efficiency and Accuracy of Grain-size Analysis of Beach and Dune Sands. Sedimentology 2013, 60, 1484–1497. [Google Scholar] [CrossRef]
  15. Blott, S.J.; Pye, K. GRADISTAT: A Grain Size Distribution and Statistics Package for the Analysis of Unconsolidated Sediments. Earth Surf. Process. Landf. 2001, 26, 1237–1248. [Google Scholar] [CrossRef]
  16. Gerald, M. Friedman Comparison of Moment Measures for Sieving and Thin-Section Data in Sedimentary Petrological Studies. SEPM JSR 1962, 32, 15–25. [Google Scholar] [CrossRef]
  17. McManus, J. Grain Size Determination and Interpretation. Tech. Sedimentol. 1988, 51, 63–85. [Google Scholar]
  18. Wilcoxon, F. Individual Comparisons by Ranking Methods. Biom. Bull. 1945, 1, 80. [Google Scholar] [CrossRef]
  19. Mann, H.B.; Whitney, D.R. On a Test of Whether One of Two Random Variables Is Stochastically Larger than the Other. Ann. Math. Statist. 1947, 18, 50–60. [Google Scholar] [CrossRef]
  20. Nordstrom, K.F. Coastal Dunes. In Coastal Environments and Global Change; Masselink, G., Gehrels, R., Eds.; Wiley: Hoboken, NJ, USA, 2015; pp. 178–193. ISBN 978-0-470-65660-0. [Google Scholar]
  21. Johnson, D.W. Shore Processes and Shoreline Development; John Wiley & Sons, Incorporated: Hoboken, NJ, USA, 1919; ISBN 0-7222-2628-4. [Google Scholar]
  22. Gresswell, R.K. The Physical Geography of Beaches and Coastlines; Hulton Educational Publication: London, UK, 1957; ISBN 0-7175-0398-4. [Google Scholar]
  23. Bird, E.C.F. Coastal Geomorphology: An Introduction, 2nd ed.; John Wiley & Sons: Chichester, UK, 2008; ISBN 978-0-470-51729-1. [Google Scholar]
  24. Haslett, S. Coastal Systems; Routledge: London, UK, 2008; ISBN 978-0-203-89320-3. [Google Scholar]
  25. McGlashan, D.J.; Duck, R.W.; Reid, C.T. Defining the Foreshore: Coastal Geomorphology and British Laws. Estuar. Coast. Shelf Sci. 2005, 62, 183–192. [Google Scholar] [CrossRef]
  26. Bauer, B.O.; Allen, J.R. Beach Steps: An Evolutionary Perspective. Mar. Geol. 1995, 123, 143–166. [Google Scholar] [CrossRef]
  27. Robert, T.G.; Orrin, H. Pilke Atlantic Beach and Dune Sediments of the Southern United States. SEPM JSR 1965, 35, 900–910. [Google Scholar] [CrossRef]
  28. Hjulström, F. Studies of the Morphological Activity of Rivers as Illustrated by the River Fyris. Ph.D. Thesis, The Geological Institution of the University of Upsala, Uppsala, Sweden, 1935. [Google Scholar]
  29. Hine, A.C. Mechanisms of Berm Development and Resulting Beach Growth along a Barrier Spit Complex. Sedimentology 1979, 26, 333–351. [Google Scholar] [CrossRef]
  30. David, B. Significance Of Skewness In Recent Sediments, Western Pamlico Sound, North Carolina. SEPM JSR 1964, 34, 864–874. [Google Scholar] [CrossRef]
  31. Carranza-Edwards, A.; Kasper-Zubillaga, J.J.; Rosales-Hoz, L.; Morales-de la Garza, E.A.; Lozano-Santa Cruz, R. Beach Sand Composition and Provenance in a Sector of the Southwestern Mexican Pacific. Rev. Mex. Cienc. Geol. 2009, 26, 433–447. [Google Scholar]
  32. Houghton, J.E.; Behnsen, J.; Duller, R.A.; Nichols, T.E.; Worden, R.H. Particle Size Analysis: A Comparison of Laboratory-Based Techniques and Their Application to Geoscience. Sediment. Geol. 2024, 464, 106607. [Google Scholar] [CrossRef]
  33. Pettijohn, F.J.; Potter, P.E.; Siever, R. Sand and Sandstone; Springer Science & Business Media: Berlin/Heidelberg, Germany, 2012; ISBN 1-4612-1066-6. [Google Scholar]
  34. Folk, R.L.; Ward, W.C. Brazos River Bar [Texas]; a Study in the Significance of Grain Size Parameters. J. Sediment. Res. 1957, 27, 3–26. [Google Scholar] [CrossRef]
  35. Borzì, L.; Marino, M.; Stagnitti, M.; Stefano, A.D.; Sciandrello, S.; Cavallaro, L.; Foti, E.; Musumeci, R.E. Impact of Coastal Land Use on Long-Term Shoreline Change. Ocean Coast. Manag. 2025, 262, 107583. [Google Scholar] [CrossRef]
  36. Buttò, S.; Faraci, C.L.; Corradino, M.; Iuppa, C.; Colica, E.; Pepe, F. Evaluating Longshore Sediment Transport: A Comparison between Empirical Formulas and XBeach 2DH Numerical Model. Mar. Geol. 2025, 480, 107471. [Google Scholar] [CrossRef]
  37. Reguero, B.G.; Losada, I.J.; Méndez, F.J. A Global Wave Power Resource and Its Seasonal, Interannual and Long-Term Variability. Appl. Energy 2015, 148, 366–380. [Google Scholar] [CrossRef]
  38. Katoh, K.; Yanagishima, S. Berm Formation and Berm Erosion. In Proceedings of the Coastal Engineering, Venice, Italy, 4–9 October 1992; American Society of Civil Engineers: Venice, Italy, 1993; pp. 2136–2149. [Google Scholar]
  39. OKAZAIU, S.; SUNAMURA, T. Quantitative Predictions for the Position and Height of Berms. Geogr. Rev. Jpn. Ser. B 1994, 67, 101–116. [Google Scholar] [CrossRef]
  40. Jensen, S.G.; Aagaard, T.; Baldock, T.E.; Kroon, A.; Hughes, M. Berm Formation and Dynamics on a Gently Sloping Beach; the Effect of Water Level and Swash Overtopping. Earth Surf. Process. Landf. 2009, 34, 1533–1546. [Google Scholar] [CrossRef]
  41. Bendixen, M.; Clemmensen, L.B.; Kroon, A. Sandy Berm and Beach-Ridge Formation in Relation to Extreme Sea-Levels: A Danish Example in a Micro-Tidal Environment. Mar. Geol. 2013, 344, 53–64. [Google Scholar] [CrossRef]
  42. Suzuki, T.; Takeuchi, M.; Tomoda, N.; Yamaguchi, S.; Kuriyama, Y. Spatial Distribution of Cross-Shore Sediment Transport Rate for Berm Formation and Erosion. In Proceedings of the Coastal Sediments ’07, New Orleans, LO, USA, 13–17 May 2007; American Society of Civil Engineers: New Orleans, LO, USA, 2007; pp. 2037–2048. [Google Scholar]
  43. Orton, G.J.; Reading, H.G. Variability of Deltaic Processes in Terms of Sediment Supply, with Particular Emphasis on Grain Size. Sedimentology 1993, 40, 475–512. [Google Scholar] [CrossRef]
  44. Nordstrom, K.F. The Use of Grain Size Statistics to Distinguish between High-and Moderate-Energy Beach Environments. J. Sediment. Res. 1977, 47, 1287–1294. [Google Scholar]
  45. Stauble, D.K.; Hansen, M.; Blake, W. An Assessment of Beach Nourishment Sediment Characteristics. In Coastal Engineering; American Society of Civil Engineers: Houston, TX, USA, 1985; pp. 1471–1487. [Google Scholar]
  46. Davison, A.T.; Nicholls, R.J.; Leatherman, S.P. Beach Nourishment as a Coastal Management Tool: An Annotated Bibliography on Developments Associated with the Artificial Nourishment of Beaches. J. Coast. Res. 1992, 8, 984–1022. [Google Scholar]
  47. Jackson, N.L.; Nordstrom, K.F. Aeolian Sediment Transport and Landforms in Managed Coastal Systems: A Review. Aeolian Res. 2011, 3, 181–196. [Google Scholar] [CrossRef]
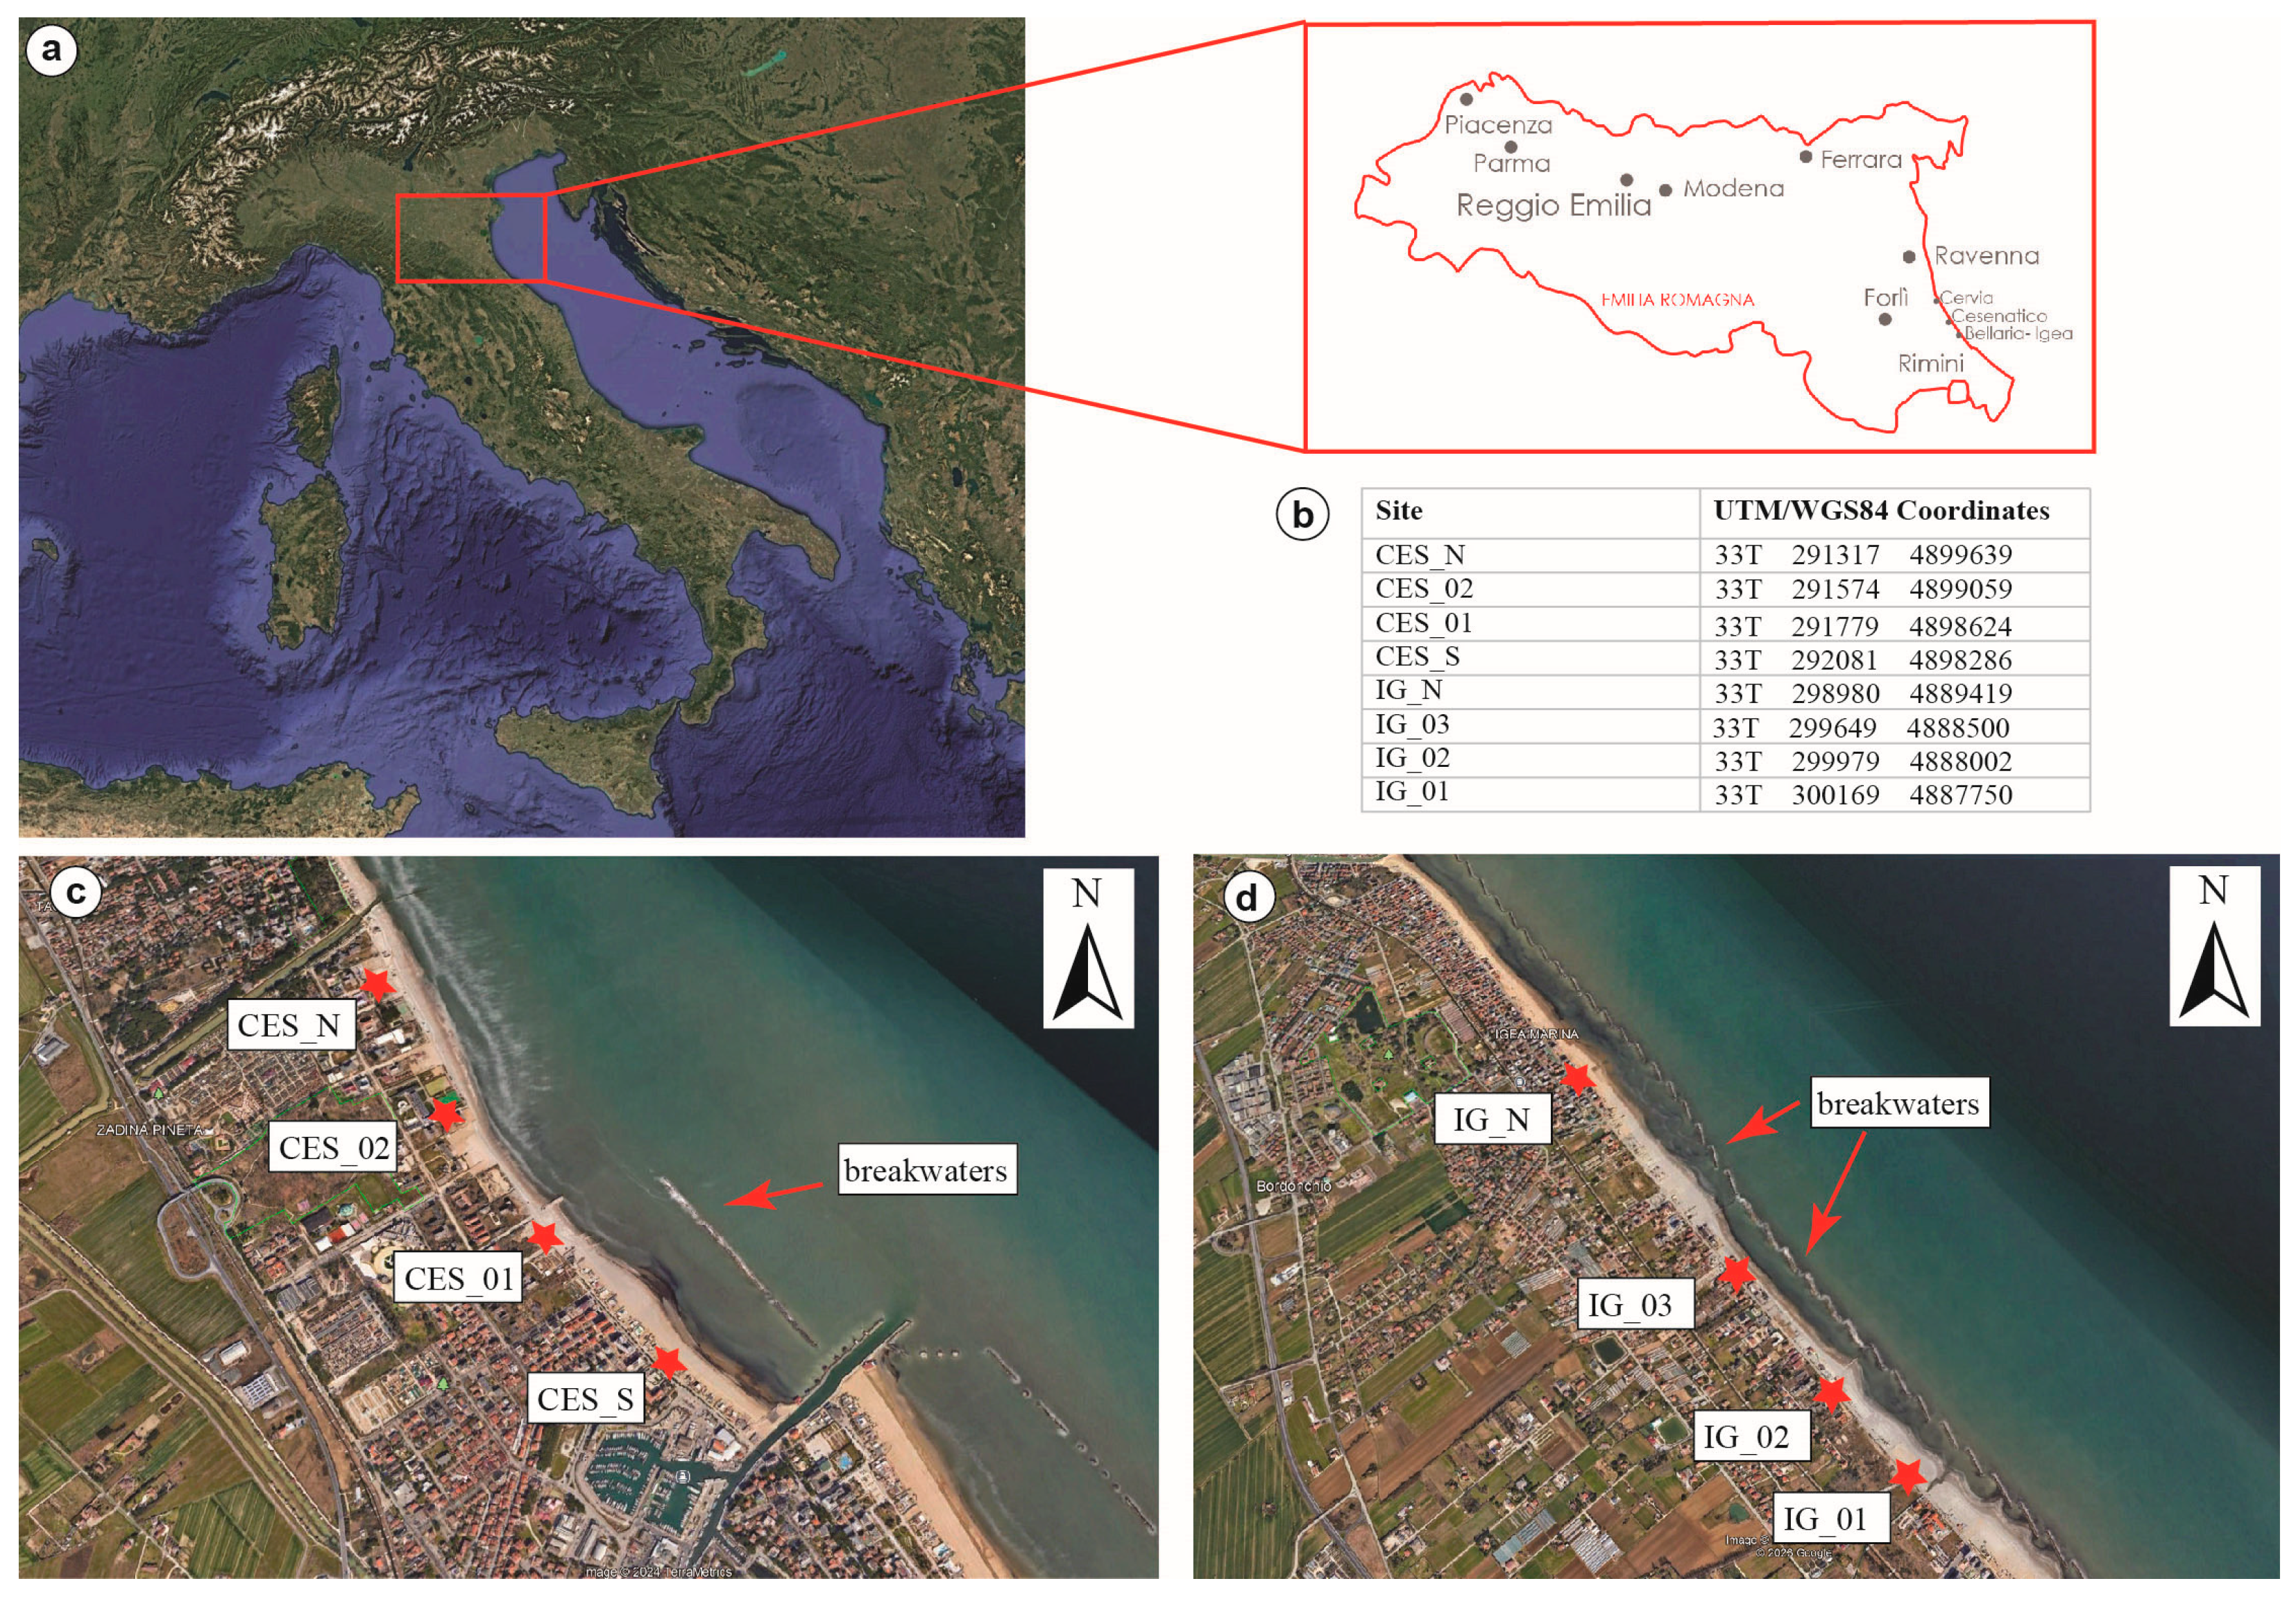
Figure 1. (a) Geographic location of the investigated area. (b) Geographic coordinates (UTM, WGS84) of the investigated sites. (c) Satellite image of the Cesenatico Ponente area showing the location of the analyzed sites. Note that shore-parallel breakwaters are present only in the southern sector of the studied beach. (d) Satellite image of the Igea Marina area showing the analyzed sites’ locations. Note that shore-parallel breakwaters fully protect the beach.
Jmse 13 02230 g001
Figure 2. Sampling scheme adopted during fieldwork. The fair-weather berm was sampled 20 cm landward of the berm crest, and the uppermost 5 cm of sediment was removed to avoid surficial eolian modification (i.e., eolian ripples).
Jmse 13 02230 g002
Figure 3. (a) Remnants of aeolian dunes, now almost totally vegetated. (b) Artificial shore-parallel dune (the encircled meter stick for scale is 10 cm long). These structures are built to protect the hinterland from marine ingression during the winter.
Jmse 13 02230 g003
Figure 4. (a) Backshore leveled by mechanical means at the end of the summer to construct artificial dunes. (b) Localized human accumulation of coarse-grained sediments resulting from daily sieving of the backshore during the summer season. (c) Berm and runnel in a partially protected setting (Cesenatico Ponente). (d) Berm and runnel in a protected setting (Igea Marina). The shovel for scale is 15 cm high.
Jmse 13 02230 g004
Figure 5. (a) Exposed foreshore during low tide (person in background for scale). (b) Concentrations of Posidonia oceanica remnants, shells, and macroplastic debris marking the high tide area (the encircled marker for scale is 12 cm long).
Jmse 13 02230 g005
Figure 6. (a) Step as visible in partially protected areas during low tide and clear water settings. (b) At high tide, the step can be completely submerged, and it can be highlighted by a change in water color, reflecting a rapid increase in depth.
Jmse 13 02230 g006
Figure 7. Boxplot comparison of median grain size (D50, phi units) and main statistical indices for beach sediments from Cesenatico Ponente and Igea Marina. The two sites exhibit comparable granulometric characteristics, as indicated by the Mann–Whitney–Wilcoxon test results.
Jmse 13 02230 g007
Figure 8. Schematic beach profile in settings highly perturbed by human action, synthesizing the magnitude of human perturbation (dashed line) on each sub-environment and highlighting the areas more prone to perform sedimentological and grain-size characterization of beach deposits.
Jmse 13 02230 g008
Table 1. Seasonal D50 variations recorded in beach sub-environments during different seasons.
EnvironmentSeasonNMedian (Φ)U-Test (p-Value)MAD (Φ)Min-Max (Φ)Range (Φ)
Bermwinter82.370.0410.122.05/2.530.48
Bermsummer82.520.062.40/2.610.21
Foreshorewinter82.560.8750.052.09/2.650.56
Foreshoresummer82.510.111.90/2.700.80
Stepwinter82.420.1480.072.37/2.690.32
Stepsummer72.320.092.11/2.550.44
Shorefacewinter82.600.3720.072.49/3.130.64
Shorefacesummer82.630.042.58/2.810.48
Table 2. D50 variations recorded in beach sub-environments in protected vs. partially protected (by shore-parallel defense hard structures) settings.
EnvironmentProtectionNMedian (Φ)U-Test (p-Value)MAD (Φ)Min-Max (Φ)Range (Φ)
Bermpartial82.460.7930.112.05/2.570.52
Bermtotal82.480.032.19/2.610.42
Foreshorepartial82.550.8750.061.90/2.700.80
Foreshoretotal82.540.082.37/2.630.26
Steppartial72.320.0050.062.11/2.370.26
Steptotal82.530.062.32/2.690.37
Shorefacepartial82.630.7130.042.49/3.130.64
Shorefacetotal82.610.042.50/2.980.48
Table 3. Seasonal Mz variations recorded in beach sub-environments during different seasons.
EnvironmentSeasonNMedian (Φ)U-Test (p-Value)MAD (Φ)Min-Max (Φ)Range (Φ)
Bermwinter82.180.0070.191.93/2.480.55
Bermsummer82.490.062.58/2.370.21
Foreshorewinter82.470.6370.061.59/2.591.00
Foreshoresummer82.410.131.77/2.610.84
Stepwinter82.320.1650.151.96/2.510.55
Stepsummer72.110.201.67/2.370.70
Shorefacewinter82.550.4950.102.38/3.110.74
Shorefacesummer82.600.062.53/2.760.23
Table 4. Mz variations recorded in beach sub-environments in protected vs. non-protected (by shore-parallel defense hard structures) settings.
EnvironmentProtectionNMedian (Φ)U-Test (p-Value)MAD (Φ)Min-Max (Φ)Range (Φ)
Bermpartial82.410.8750.151.93/2.580.64
Bermtotal82.410.082.06/2.570.51
Foreshorepartial82.460.7930.091.59/2.591.00
Foreshoretotal82.460.092.23/2.610.38
Steppartial72.070.0090.101.67/2.310.64
Steptotal82.340.082.02/2.510.49
Shorefacepartial82.580.8750.062.38/3.110.74
Shorefacetotal82.590.062.42/2.940.53
Table 5. Seasonal sorting variations recorded in beach sub-environments during different seasons.
EnvironmentSeasonNMedianU-Test (p-Value)MADMin-MaxRange
Bermwinter80.360.0050.010.37/0.960.59
Bermsummer80.710.130.33/0.450.12
Foreshorewinter80.520.6370.080.41/1.080.68
Foreshoresummer80.660.140.35/1.170.82
Stepwinter80.720.3850.190.46/1.090.59
Stepsummer70.780.140.61/1.290.68
Shorefacewinter80.440.4950.050.32/0.640.33
Shorefacesummer80.420.030.36/0.580.22
Table 6. Sorting variations recorded in beach sub-environments in protected vs. partially protected (by shore-parallel defense hard structures) settings.
EnvironmentProtectionNMedianU-Test (p-Value)MADMin-MaxRange
Bermpartial80.420.4950.090.33/0.960.63
Bermtotal80.370.010.36/0.740.38
Foreshorepartial80.590.2700.130.35/1.170.82
Foreshoretotal80.480.080.38/0.760.38
Steppartial70.900.0930.140.46/1.290.83
Steptotal80.680.090.52/0.960.43
Shorefacepartial80.440.4310.030.32/0.640.33
Shorefacetotal80.420.040.36/0.530.17
Table 7. Seasonal skewness variations recorded in beach sub-environments during different seasons.
EnvironmentSeasonNMedianU-Test (p-Value)MADMin-MaxRange
Bermwinter8−1.471.0000.53−2.16/0.042.20
Bermsummer8−1.440.26−1.96/−0.801.15
Foreshorewinter8−1.440.4310.20−2.66/−0.781.88
Foreshoresummer8−1.910.45−2.33/−0.821.51
Stepwinter8−2.050.0930.29−2.43/−1.231.20
Stepsummer7−1.570.20−1.84/−0.651.19
Shorefacewinter8−1.910.6370.34−2.98/−1.461.53
Shorefacesummer8−1.670.66−2.82/−0.512.31
Table 8. Sk variations recorded in beach sub-environments in protected vs. partially protected (by shore-parallel defense hard structures) settings.
EnvironmentProtectionNMedianU-Test (p-Value)MADMin-MaxRange
Bermpartial8−1.160.1280.447−2.13/0.042.17
Bermtotal8−1.620.275−2.16/−1.081.09
Foreshorepartial8−1.720.5640.28−2.66/−0.781.88
Foreshoretotal8−1.910.45−2.39/−1.001.40
Steppartial7−1.300.0130.28−2.07/−0.651.41
Steptotal8−1.940.28−2.43/−1.570.86
Shorefacepartial8−1.740.4950.27−2.49/−0.511.99
Shorefacetotal8−2.090.63−2.98/−1.181.80
Disclaimer/Publisher’s Note: The statements, opinions and data contained in all publications are solely those of the individual author(s) and contributor(s) and not of MDPI and/or the editor(s). MDPI and/or the editor(s) disclaim responsibility for any injury to people or property resulting from any ideas, methods, instructions or products referred to in the content.