Article

Influence of Layout on Offshore Wind Farm Efficiency and Wake Characteristics in Turbulent Environments

1
College of Civil Engineering, Xiangtan University, Xiangtan 411105, China
2
School of Hydraulic and Ocean Engineering, Changsha University of Science & Technology, Changsha 410114, China
3
Changsha Xintian Surveying and Designing Co., Ltd., Changsha 410114, China
4
School of Mechanical Engineering and Mechanics, Xiangtan University, Xiangtan 411105, China
5
College of Transportation and Civil Engineering, Foshan University, Foshan 528225, China
6
School of Ocean and Civil Engineering, Shanghai Jiao Tong University, Shanghai 200240, China
*
Authors to whom correspondence should be addressed.
J. Mar. Sci. Eng. 2025, 13(11), 2137; https://doi.org/10.3390/jmse13112137
Submission received: 13 October 2025 / Revised: 4 November 2025 / Accepted: 8 November 2025 / Published: 12 November 2025
(This article belongs to the Section Coastal Engineering)

Abstract

Mitigating wake effects between wind turbines is crucial for enhancing the overall output power of offshore wind farms. Therefore, optimizing turbine spacing and layout under turbulent conditions is essential. This study employs the NREL-5 MW wind turbine model to investigate the efficiency of a 3 × 3 wind farm. This research focuses on the influence of turbine spacing and layout on wake field distribution and output power characteristics under different turbulence intensities. A key innovation is the application of entropy production theory to quantify energy dissipation and wake recovery, providing a deeper understanding of the underlying mechanisms in energy losses. This research also introduces fatigue analysis based on the Damage Equivalent Load (DEL) method, revealing that staggered layouts significantly reduce cyclic loads and extend turbine lifespan. The results indicate that modifying the layout is a more effective strategy for enhancing the total power output of the wind farm, which proves to be more effective than altering the turbulence intensity. Specifically, staggered layout I (with a downstream stagger of 1.0 rotor diameter (D)) increases total output power by 28.76% (to 36.84 MW) and causes a 16.38% surge in power when the spacing increases to 5D. Expanding the wind turbine spacing mitigates wake interaction, resulting in a dramatic 59.84% power recovery for downstream wind turbines. The wind turbine’s lifespan is extended as a result of fatigue loads on the root bending moment being substantially reduced by the staggered layout, which alters the wake structure and stress distribution. The entropy production analysis shows that regions with high entropy production are primarily concentrated near the rotor and within the wake shear layer. The energy dissipation is substantially reduced in the case of staggered layout. These findings provide valuable guidance for the aerodynamic optimization and long-term operation design of large-scale wind farms, contributing to improved energy efficiency and reduced maintenance costs.

1. Introduction

Declining global fossil fuel reserves are accelerating the development of new energy sources [1]. The ongoing energy transition depends heavily on advancements in renewable energy technologies [2,3]. Among these, wind power has attracted increasing attention because of its cleanliness, abundant resources, and high level of technological maturity [4]. However, the aerodynamic interaction between upstream and downstream wind turbines, known as the wake effect, can lead to substantial power losses and increased structural loads on downstream units. As the number of wind turbines increases and the overall layout becomes denser, wake flows tend to overlap and accumulate, intensifying flow disturbances across the wind farm. Consequently, as wind farms continue to expand in scale and turbine spacing becomes more complex, wake interference has emerged as a critical factor limiting overall energy efficiency and operational reliability. Under turbulent wind cases, the wake characteristics become even more complicated, making it essential to optimize turbine spacing and layout in a scientific and rational manner to enhance the overall performance of the wind farm.
Altering the positions of wind turbines within a farm can allow downstream turbines to potentially avoid the wake regions of upstream turbines. This reduces the wind farm’s overall wake effect and improves its wind energy utilization efficiency. Sun et al. [5] compared the wake characteristics of two typical turbine layout schemes under complex terrain conditions using radar measurement technology. They found substantial wind velocity attenuation in the downstream region of the turbines and a positive correlation between terrain complexity and the nonlinear characteristics of the wake structure. Based on wind tunnel experiments, Su et al. [6] detailed the power performance of vertical-axis wind turbines under various transverse and longitudinal arrangements. Their results indicated that optimizing the turbine array configuration could enhance the average power coefficient even further. Daaou et al. [7] proposed and simulated the relationship between unit spacing and the wake effect between wind turbine units. Gonzalez-Rodriguez et al. [8] presented a global optimization method for wind farms to increase annual energy production, optimizing farm siting and layout considering factors like seabed characteristics, depth, and cable costs, assuming unlimited farm size and turbine number. Sahebzadeh et al. [9] used high-precision simulation software to study the aerodynamic effects between adjacent wind turbines. They quantitatively analyzed how installation locations influence the overall power output of the array. Zhang et al. [10] developing a novel wake control strategy that effectively mitigates wake effects through intelligent rotor coordination. Their study demonstrated that by optimizing the operational parameters of dual rotors, substantial wake steering can be achieved, reducing velocity deficits in the downstream region by up to 23% compared to conventional single-rotor configurations. Fu et al. [11] used large eddy simulation with an actuator line model (LES-ALM) to study the wake effects and aerodynamic performance of three NREL-5 MW offshore wind turbines. They analyzed different layouts and spacings, finding that spacing substantially impacts downstream turbines more than middle ones, and that bilateral turbulent inflow leads to more stable performance. The study provides insights for optimizing wind farm layouts to minimize wake losses. Wang et al. [12] used LES coupled with the actuator disk model to study the effects of three turbine array layouts-aligned, laterally staggered, and vertically staggered with 40 turbines arranged in 10 rows-on a wind farm’s power output and wake effects. The study analyzed flow field characteristics, turbulence intensity, and wake recovery distance under the different layouts. It highlighted the critical role of the hub height difference in enhancing performance within the vertically staggered layout.
The turbulence intensity significantly impacts the dynamic characteristics and aerodynamic loads of wind farm units. The higher turbulence intensity can reduce power deficit caused by wakes, which allows for more compact turbine layouts that save space and resources. Liu et al. [13] employed a LES coupling method to NREL-5 MW wind turbine model in different turbulent environments with varying wind turbine spacings. The results showed that, when the spacing is less than 5.1D, an increase in inflow turbulence intensity led to a steady rise in output power density. However, when the spacing exceeded 5.1D, the output power density first increased and then decreased. Yue et al. [14] proposed an active, narrow-band, synthetic, random flow generation method using large eddy simulation to generate inflow turbulence in real time at the turbine inlet. The results showed that turbulence significantly affects the aerodynamic characteristics of wind turbines by altering the wake velocity distribution and enhancing fluctuating wind energy at specific frequencies. Cao et al. [15] developed a multi-objective optimization framework based on NSGA-II that integrates a 3D turbulence intensity model and a 2D Gaussian wake model. This framework optimizes wind farm layouts by considering both power output and turbulence intensity. Evaluations across three distinct scenarios demonstrated its effectiveness: under single direction wind, the maximum turbulence intensity was reduced by 20.4%; under multi-directional winds, it was reduced by 2% compared to a prior single objective benchmark; and when applied to a real-world wind farm, a reduction of 8.1% was achieved alongside a 0.8% increase in total power. Furthermore, the method significantly reduced the operational time under high-turbulence conditions by up to 71%, without compromising power generation. Thus, the method effectively mitigates fatigue loads and extends turbine service life. Wang et al. [16] conducted a case study of the Hexi Corridor in Gansu province. Using a combination of experimental and numerical methods, they predicted the impact of the corridor’s long topography on wind power generation. They found that the atmospheric boundary layer in this terrain exhibits very large-scale motions (VLSMs) and large-scale motions (LSMs), which the standard IEC Kaimal spectrum cannot describe. Consequently, they proposed a new wind spectrum model tailored for corridor topography, called the IECK-HX model. This model more accurately describes wind patterns in the Gansu province.
The layout of wind turbines affects the distribution of turbulence intensity within a wind farm. Turbulence intensity is one of the most critical factors that exacerbate fatigue loads on wind turbines. An unreasonable layout can substantially increase turbulence intensity, substantially shortening the design life of turbines and increasing operational and maintenance costs. Liu et al. [17] used a computational fluid dynamics coupling method to simulate a 4.5 MW wind turbine with different yaw angles, turbulence intensities, and inter-turbine distances. Their results suggest that the wake recovery effect is optimal when the yaw angle is between 30° and 40°, effectively reducing the equivalent fatigue load on downstream turbines. Increased turbulence intensity significantly elevates fatigue loads, and turbine spacing exerts a complex, nonlinear influence on load distribution. In addition to the aforementioned research on static yaw strategies, dynamic yaw control has also received significant attention in recent years due to its ability to actively regulate wake turbulence. Zhang et al. [18] further investigated the complex aerodynamic behavior of twin-rotor floating wind turbines, analyzing the effects of combined platform rotation and pitch motions on aerodynamic loading and wake recovery characteristics, providing valuable insights for floating wind farm design. Lin et al. [19] used a LES coupled with an aeroelastic solver to study the dynamic yaw control of an array of eight NREL-5 MW wind turbines. The study revealed that periodically yawing the leading turbine at 0.01 Hz (the resonant frequency) maximized wake oscillation and increased the array’s total power output by 5%. However, increasing the yaw frequency also resulted in a substantial increase in root flutter and fatigue loads on the yaw bearings.
Traditional wake analysis can effectively quantify total energy deficit in a wake. However, this method has limitations when it comes to revealing the internal mechanisms of energy dissipation and the spatial distribution characteristics. Entropy generation analysis is a thermodynamic approach used to quantify irreversibilities and energy losses within a flow field. In the context of wind farms, it evaluates how kinetic energy from the wind is degraded into less useful forms such as viscous dissipation, turbulence mixing, and thermal diffusion. In wake assessment, this method provides a deeper physical understanding of how and where energy degradation occurs behind wind turbines. Unlike traditional momentum, entropy generation analysis directly measures the thermodynamic inefficiency of wake interactions, turbulence, and flow recovery. Therefore, it helps identify regions of high energy loss, optimize turbine spacing and arrangement, and improve the overall aerodynamic and energetic efficiency of wind farms. Wang et al. [20] used computational fluid dynamics (CFD) methods to simulate the aerodynamic performance and wake characteristics of offshore wind turbines at different pitch angles and frequencies. The study investigated the periodic fluctuations in aerodynamic loads induced by pitch motion, the distribution of entropy production, and the evolution patterns of horseshoe vortices. Song et al. [21] used numerical simulations and entropy production theory to study the hydrodynamic performance and energy deficit characteristics of the Archimedes screw turbine with nine different blade angles. The study examined the manner in which blade angle influences power, thrust, self-starting capability, and wake entropy production distribution under both axial and yaw flow conditions.
Despite significant progress in various areas, there are still notable research gaps. Firstly, many studies focus on the analysis of single factors, such as those that examine only the impact of turbine layout on output power or the effects of turbulence intensity on wake recovery. Few studies systematically analyze how the interaction between layout and turbulence intensity affects the overall performance of wind farms and turbine lifespan. This is particularly true in conditions of higher turbulence intensity, where the optimization of wind farm layouts has not received sufficient attention, and existing research has failed to adequately reveal the complexity of the interaction between turbulence intensity and turbine layout. Secondly, traditional research methods mainly rely on classical approaches such as momentum and energy conservation to analyze wake effects and output power. However, entropy production theory, an emerging fluid dynamics method, remains underutilized in wind energy research, especially in wake effect analysis. The application of entropy production theory to quantify energy loss under different layouts has not been sufficiently explored.
This study addresses a gap in the existing literature by proposing a novel analytical approach that combines entropy production theory with the DEL method to systematically investigate the coupled effects of turbine layout, turbulence intensity, and wake effects. By analyzing the output power and wake characteristics of square, diamond, and staggered layouts under varying turbulence intensities, this study not only uncover the mechanisms through which layout optimization and turbulence intensity influence wind farm output power, but also provide a deeper analysis of energy loss and wake recovery under different layouts using entropy production theory. Specifically, Section 2 introduces the numerical methods, including momentum theory, the Dynamic Wake Meandering (DWM) wake model, and FAST.Farm framework, along with validation of the turbulent wind field and grid independence. Section 3 details the case setup, including wind farm models and simulation parameters for square, diamond, and staggered layouts under various spacing and turbulence conditions. Section 4 presents a comprehensive analysis of power output and wake characteristics under different layouts, and employs entropy production theory to elucidate the underlying mechanisms of irreversible energy dissipation. Finally, the conclusion summarizes the key findings and their implications for wind farm optimization. This study demonstrates that staggered layouts can significantly reduce turbine fatigue damage and improve overall wind farm efficiency, thereby filling the gap in the systematic analysis of the interaction between layout and turbulence intensity in existing research.

2. Numerical Methods and Validation

2.1. Numerical Method

2.1.1. Momentum Theory and the Betz Limit

Momentum theory [22] is a commonly applied approach for estimating the induced velocity in wind turbine rotors. According to aerodynamic principles, the aerodynamic loads acting on the rotor are proportional to the square of the incoming wind velocity. Meanwhile, energy conversion efficiency is reflected by the degree to which the wind velocity is attenuated downstream. This energy conversion mechanism, which is based on the conservation of momentum and energy, provides the theoretical foundation for designing and analyzing the performance of wind turbines. In this idealization, the wind turbine is represented as a stationary actuator disk that exerts a uniform thrust on the flow, reducing its velocity downstream. The following assumptions are made: (1) the flow is steady, uniform, and incompressible; (2) the rotor is modeled as an ideal actuator disk with negligible frictional losses; and (3) the thrust is uniformly distributed over the disk surface, with a finite static pressure jump across the disk and equal static pressures in the far upstream and far downstream regions.
The ideal output power P of the wind turbine is as follows:
P = T U d = 2 ρ A d U 3 α ( 1 α ) 2
The dimensionless thrust coefficient CT is as follows:
C T = T 1 2 ρ A d U 2 = 4 α ( 1 α )
The dimensionless power coefficient CP is as follows:
C p = P 1 2 ρ A d U 3 = 4 α ( 1 α ) 2
where α is the wind turbine axial induction factor. T is the thrust provided by the rotor. ρ is the air density(kg/m3). A, Ad, and Aw represent the rotor areas (m2) at the upstream, rotor disk, and downstream planes, respectively, while U, Ud, and Uw represent the corresponding wind velocities (m/s).
When α = 1/3, the wind energy utilization coefficient is maximized, yielding the highest conversion rate, Cp,max, also known as the Bates limit [23].

2.1.2. Dynamic Wake Meandering Wake Model

To model the evolution of wakes in the wind farm, this study employs the DWM model, which accounts for the lateral deflection and recovery of wind turbine wakes due to atmospheric turbulence and shear. This model is essential for understanding how wake effects change over time and space within a wind farm. The key assumptions of the model include the wake’s initial alignment with the wind direction, the lateral meandering caused by turbulence, and the wake’s recovery due to shear effects in the atmospheric boundary layer.
The DWM model considers four aspects of the wake: deflection, meandering, deficit evolution, and merging. When the wind turbine is not yawing, the wake exhibits good symmetry in expansion. The wake centerline does not oscillate randomly, maintaining a stable axis. The central wake wind velocity substantially decreases and gradually recovers downstream. The velocity deficit profile usually follows a Gaussian distribution or a similar model. Assuming that the radial gradient of wind velocity deficit is substantially greater than the axial gradient and that the wake is approximately symmetric about the centerline, the pressure term in the Navier–Stokes (N-S) equations [24] can be neglected. Using thin shear layer theory, the N-S equations can be approximated, yielding the axial momentum equation:
r V x V x x + r V r V x r = v t V x r + r v t 2 V x r 2 + r v t r V x r
V r + r V r r + r V x x = 0
The wake model is simplified into Equations (4) and (5), which represent the lateral displacement and recovery due to turbulence and shear, respectively. The DWM model is solved iteratively within FAST.Farm, where the wake dynamics influence the turbine loads and the resulting output power. The wake meandering and recovery are calculated over time using the numerical methods provided by the FAST.Farm framework, incorporating turbulence and shear layer effects. These interactions allow for accurate predictions of turbine performance in a wind farm setting.

2.1.3. Damage Equivalent Load Method

Fatigue damage accumulation is a critical consideration in wind turbine design, particularly for blade root bending moments, which endure complex cyclic loading patterns due to turbulent wind effects. The DEL methodology provides an efficient approach to condense variable amplitude loading spectra into a single constant amplitude load value that produces equivalent fatigue damage over a specified reference period [25]. DEL primarily employs Palmgren-Miner’s linear cumulative damage theory, processing time-series load data from FAST.Farm simulations through rainflow counting to extract full load cycles from the irregular loading history. This algorithm identifies closed hysteresis loops in the load-time series, effectively decomposing variable amplitude loading into discrete stress ranges and corresponding cycle counts [26]. According to Miner’s rule, the total damage G for a load spectrum is calculated as [27]:
G = i = 1 k n i N i
where ni is the number of cycles at stress range Si, and Ni is the number of cycles to failure at Si based on the S-N curve of the material.
The DEL is derived by equating the damage from the variable amplitude spectrum to that of a constant amplitude load over a reference number of cycles Nref:
DEL = n i S i m N r e f 1 / m
where reference cycles Nref = 107, representing approximately 20 years of operational life. m is the material-dependent Wöhler exponent. For composite turbine blades, it is typically assumed that m = 10 [28].
In this analysis, the primary load components are Flapwise (torque and bending moments), which significantly influence fatigue at the blade root. The sampling frequency for time series data from FAST.Farm simulations is set at 80 Hz, corresponding to a sampling interval of 0.0125 s, ensuring that the loading history is accurately captured. The S-N curve used for fatigue life estimation is based on the standard data for Glass Fiber Reinforced Polymer and Carbon Fiber Reinforced Polymer materials, as defined in IEC 61400-13 [29]. Additionally, the fatigue index m = 10 is chosen, reflecting typical values for composite materials used in wind turbine blades.

2.1.4. Entropy Generation Theory

Entropy generation is a metric used to quantify the irreversibility of a thermos-fluid process. This irreversibility is primarily attributed to two processes: fluid viscosity effects and heat transfer. The balance equation for a single-phase incompressible fluid is as follows [30]:
ρ s t + u s x + ν s y + w s z = d i ν q T + Φ T + Φ Θ T 2
where u, v and w are instantaneous velocities, s is entropy per unit mass (J/kg K), T is local thermodynamic temperature (K), and q is the heat flux (W/m2). Φ and Φ Θ represent the dissipation functions of the fluid.
According to the RANS approach for turbulent flows, prior to time averaging the equation all quantities (s, u, v, w) are split into time-mean ( s ¯ , u ¯ , v ¯ , w ¯ ) and fluctuating parts ( s , u , v , w ). The time-averaged equation is as follows:
ρ s ¯ t + u ¯ s ¯ x + v ¯ s ¯ y + w ¯ s ¯ z + u s ¯ x + v s ¯ y + w s ¯ z = d i v q T ¯ + Φ ¯ T + Φ Θ ¯ T 2
where Φ / T ¯ represents the time average entropy production rate (EPR) induced by fluid viscosity effects. Φ Θ / T 2 ¯ represents the entropy production rate caused by heat transfer.
Assuming the ambient temperature around the wind turbine remains constant, the entropy production caused by heat transfer and temperature gradients can be neglected. Therefore, this study sets Φ Θ / T 2 ¯ = 0. Φ / T ¯ consists of two components: entropy production rate by direct dissipation S PRO , D ¯ [W/(m3 K)] and entropy production rate by indirect dissipation S PRO , D [W/(m3 K)].
s PRO , D ¯ = μ T 2 u ¯ x 2 + v ¯ y 2 + w ¯ z 2 + u ¯ y + v ¯ x 2 + u ¯ z + w ¯ x 2 + v ¯ z + w ¯ y 2
s PRO , D = μ T 2 u x 2 ¯ + v y 2 ¯ + w z 2 ¯ + u y + v x 2 ¯ + u z + w x 2 ¯ + v z + w y 2 ¯
where μ is the effective viscosity [kg/(m s)].
The SST k-ω model was selected for its ability to balance computational efficiency and accuracy, making it ideal for simulating wind turbine flows. Unlike LES, which resolves large eddies at a high computational cost, SST k-ω provides accurate boundary layer predictions while maintaining computational feasibility. It combines the strengths of the k-ω model near walls and the k-ε model in the free-stream, offering superior performance in turbulent boundary layers compared to other RANS models like k-ε, which struggle in near-wall regions. This makes SST k-ω an optimal choice for large-scale wind farm simulations. According to the SST k-ω turbulence model and the empirical formula, S PRO , D can be calculated as follows:
S PRO , D = ρ ε T = 0.09 ρ ω k T
where ɛ is turbulent dissipation rate (m2/s3), ω is the turbulent eddy frequency (1/s), 0.09 is the constant, k is the turbulent kinetic energy (m2/s2).

2.2. Numerical Validation

2.2.1. Introduction to FAST.Farm

FAST.Farm is simulation software designed to predict the power performance and structural loads of wind turbines within wind farms [31]. Its primary applications are optimizing power generation and reducing load uncertainty in wind farms. FAST.Farm employs a unique computational model. This model substantially reduces computational costs through parallel processing strategies while maintaining sufficient simulation accuracy. Thus, it can support the demands of the engineering design process [32].
Since the aerodynamic load calculation for wind turbines is performed in AeroDyn (module within FAST.Farm v3.2.1) in FAST.Farm, a coupled simulation between the two programs is required to conduct the dynamic analysis of the wind turbine shown in Figure 1. Wind data generated in TurbSim(from v4.0.2) are input into AeroDyn for calculation. The computed loads are then imported into FAST.Farm. At the same time, the structural dynamic characteristic data calculated by FAST.Farm is imported back into AeroDyn to recalculate the loads [33].

2.2.2. Validation of Turbulent Wind Field

TurbSim is a code that generates random full-field turbulent wind. Dedicated to atmospheric flow field simulation, it controls the time series of wind velocity vectors (u, v, w) at points on a two-dimensional, vertical, rectangular grid [34]. To meet the simulation requirements for the subsequent wind farm size, a turbulent wind field with a grid height of 175 m, a width of 2500 m, and a turbulence intensity (I) of 15% is generated by using TurbSim. Spatio-temporal distribution characteristics of this turbulent wind fields is observed in Figure 2. Compared with the Kaimal spectrum, the wind velocity spectrum at a height of 90 m is shown in Figure 3. The two wind velocity spectra have similar energy distributions across most frequencies. This indicates that the wind velocity time history generated by the TurbSim meets the result of the Kaimal spectrum.

2.2.3. Grid Sensitivity Analysis

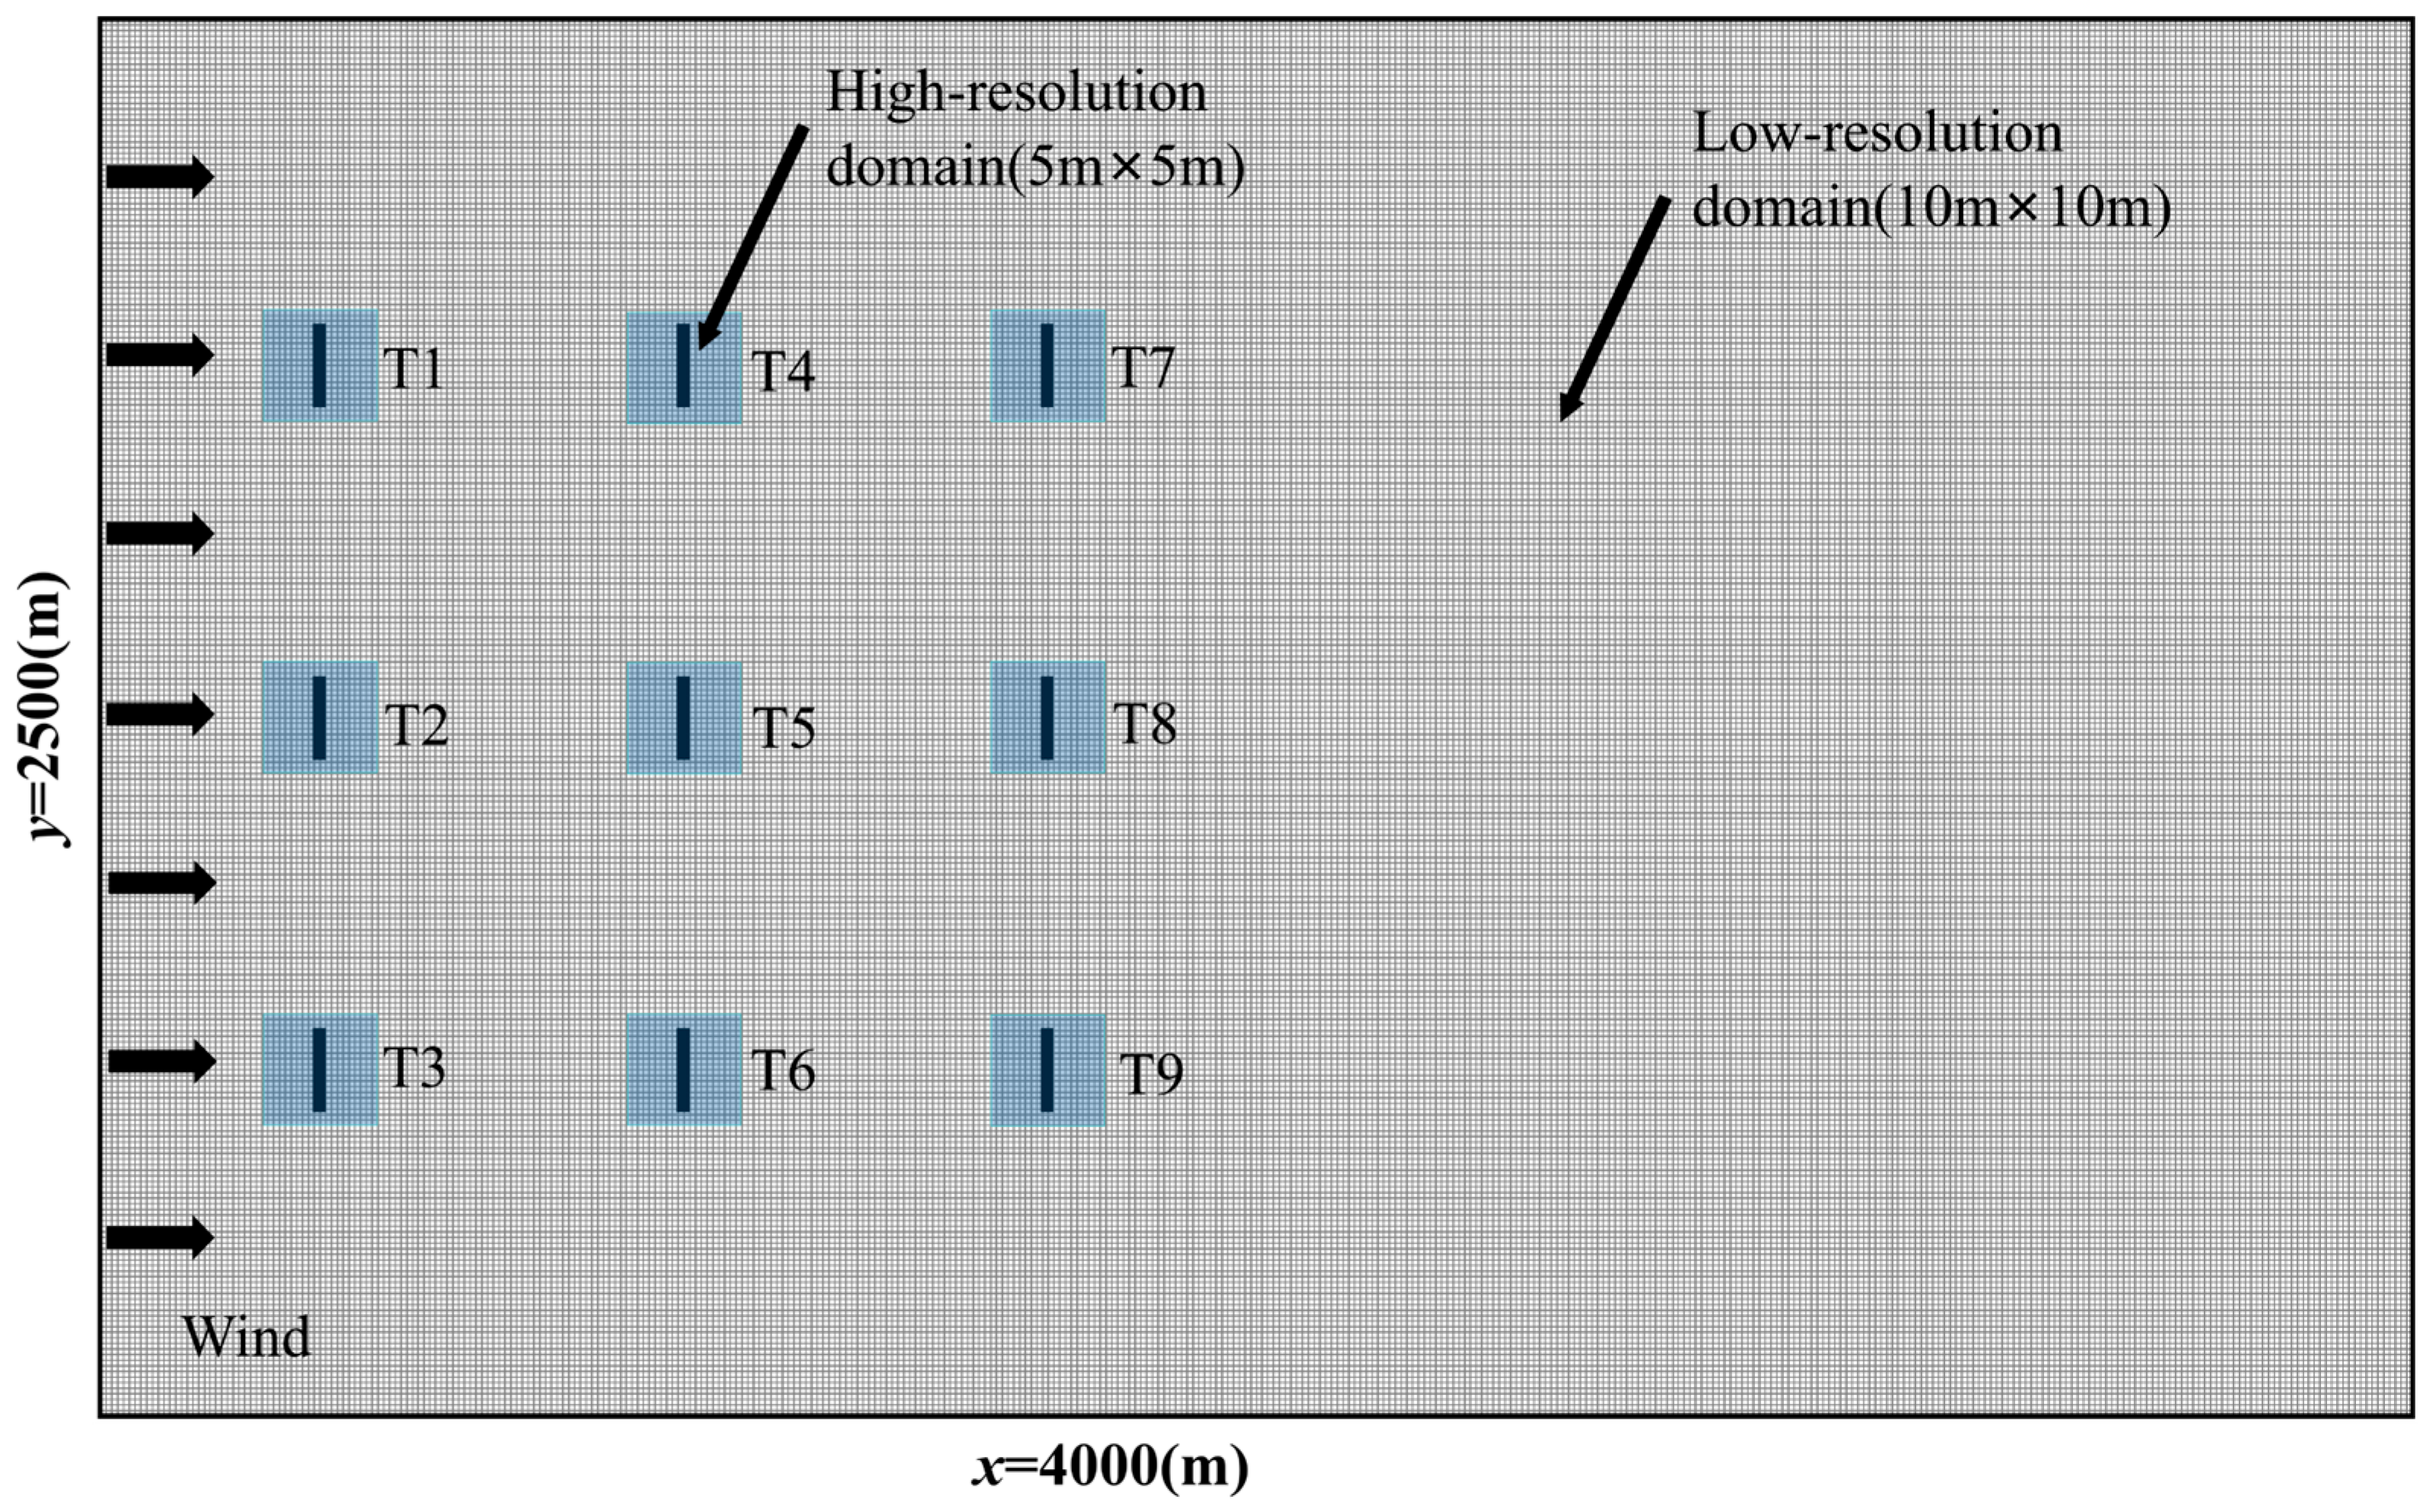
To balance computational accuracy and efficiency, the computational domain in this study is divided into a high-resolution domain and a low-resolution domain [35], the specific grid division is shown in Figure 3. The high-resolution domain uses mesh refinement for each wind turbine to accurately simulate the flow field and wake around it. The low-resolution domain encompasses the entire wind farm and focuses on the wake’s overall evolution and bending phenomena.
Table 1 shows the output power of a single NREL-5 MW wind turbine under uniform wind cases and the wind velocity of 11.4 m/s for three different grid sizes, and the rated power of the wind turbine is 5.29 MW. The output power comparison ratio represents the ratio of the calculated results in this study to the rated power of the wind turbine. The comparison results indicate that the calculation errors for all three mesh sizes fall within the permissible range. Given the precision of the computational results, subsequent research in this study will use the Mesh1 as the computational parameter.

2.2.4. Validation of Single and Multiple Wind Turbines Power Performance

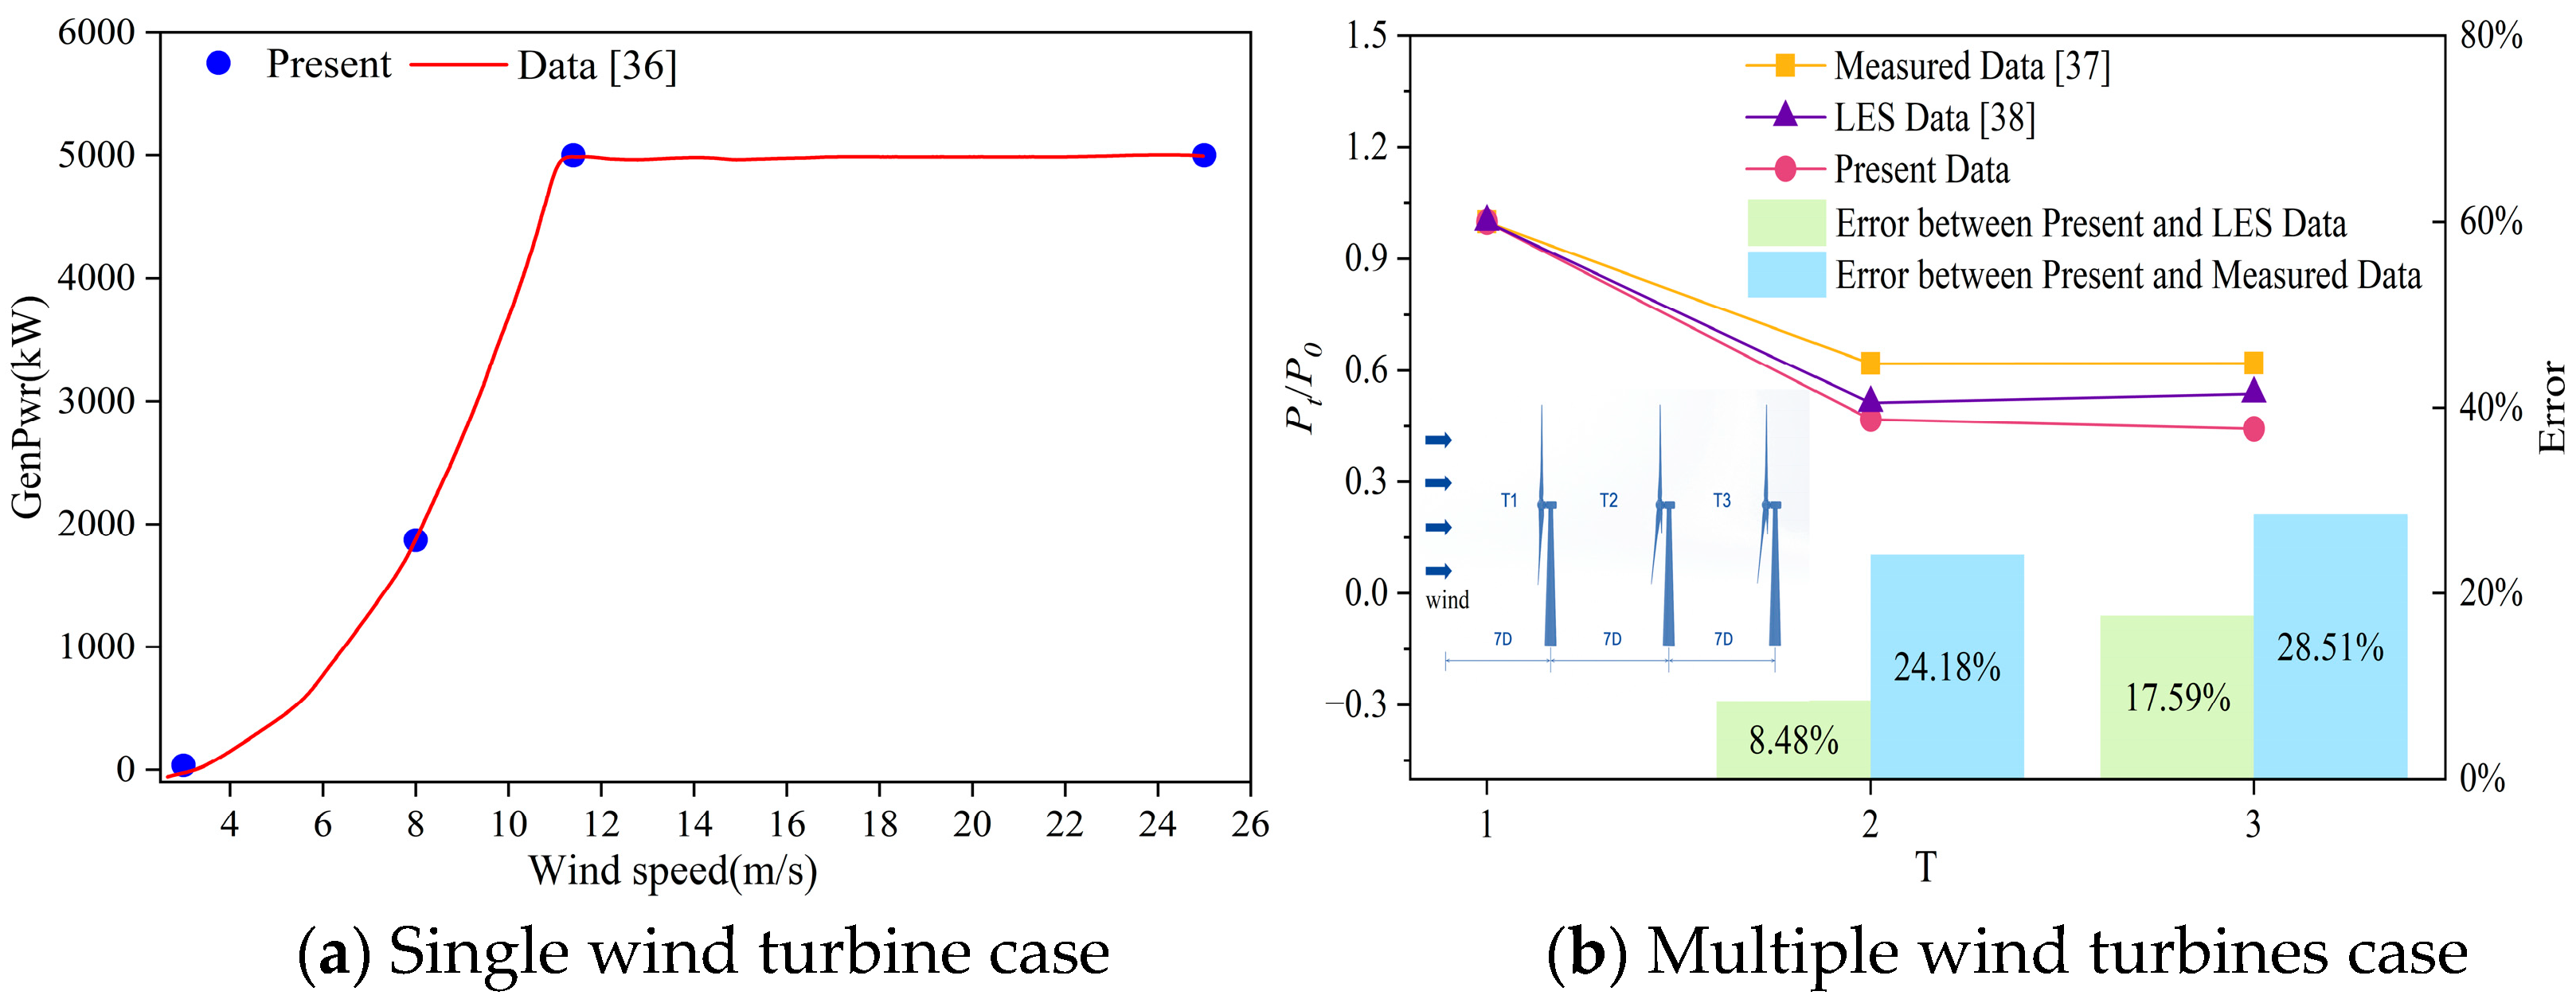
This study performs numerical simulations of the NREL-5 MW wind turbine under the following four cases: a cut-in wind velocity of 3 m/s, a cut-out wind velocity of 25 m/s, an inflow wind velocity of 8 m/s (which corresponds to a maximum tip velocity ratio), and a rated wind velocity of 11.4 m/s. It can be found form Figure 4a that the results of this study are in good agreement with the design values in Reference [36], both before and after reaching the rated cases. This study uses measured data [37] from the Horns Rev wind farm alongside its high-fidelity simulation results [38] to validate the accuracy of predicting the output power of multiple wind turbines within a wind farm. The comparison results are shown in Figure 4b. It is found that the output power prediction results for the wind turbines in this study are slightly lower than those of LES, and the LES results are lower than those of measured data. Specifically, at T3, these deviations increase to 17.59% and 28.51%, representing the largest observed error. The relatively large deviation at Turbine 3 is mainly attributed to intensified wake interactions and turbulence dissipation in the downstream region, where the accumulated wake deficits from upstream turbines cause significant reductions in local inflow velocity and turbulence intensity that are difficult to reproduce precisely in numerical simulations. It is also evident that this discrepancy can be attributed to the differences between the software and wind farm utilized in this study and those referenced in the literature. In addition, this phenomenon emerges due to the influence of numerous factors on the measured data from the wind farm, including ambient temperature, humidity, and terrain complexity. It is possible that these factors are not accurately accounted for in the numerical simulations, resulting in prediction values that are lower than expected one. Overall, the magnitude and trend of the percentage errors confirm that the model provides a reliable estimation of multi-turbine power output within a physically reasonable uncertainty range.

3. Optimization of Wind Farm Layout Design

3.1. Numerical Model

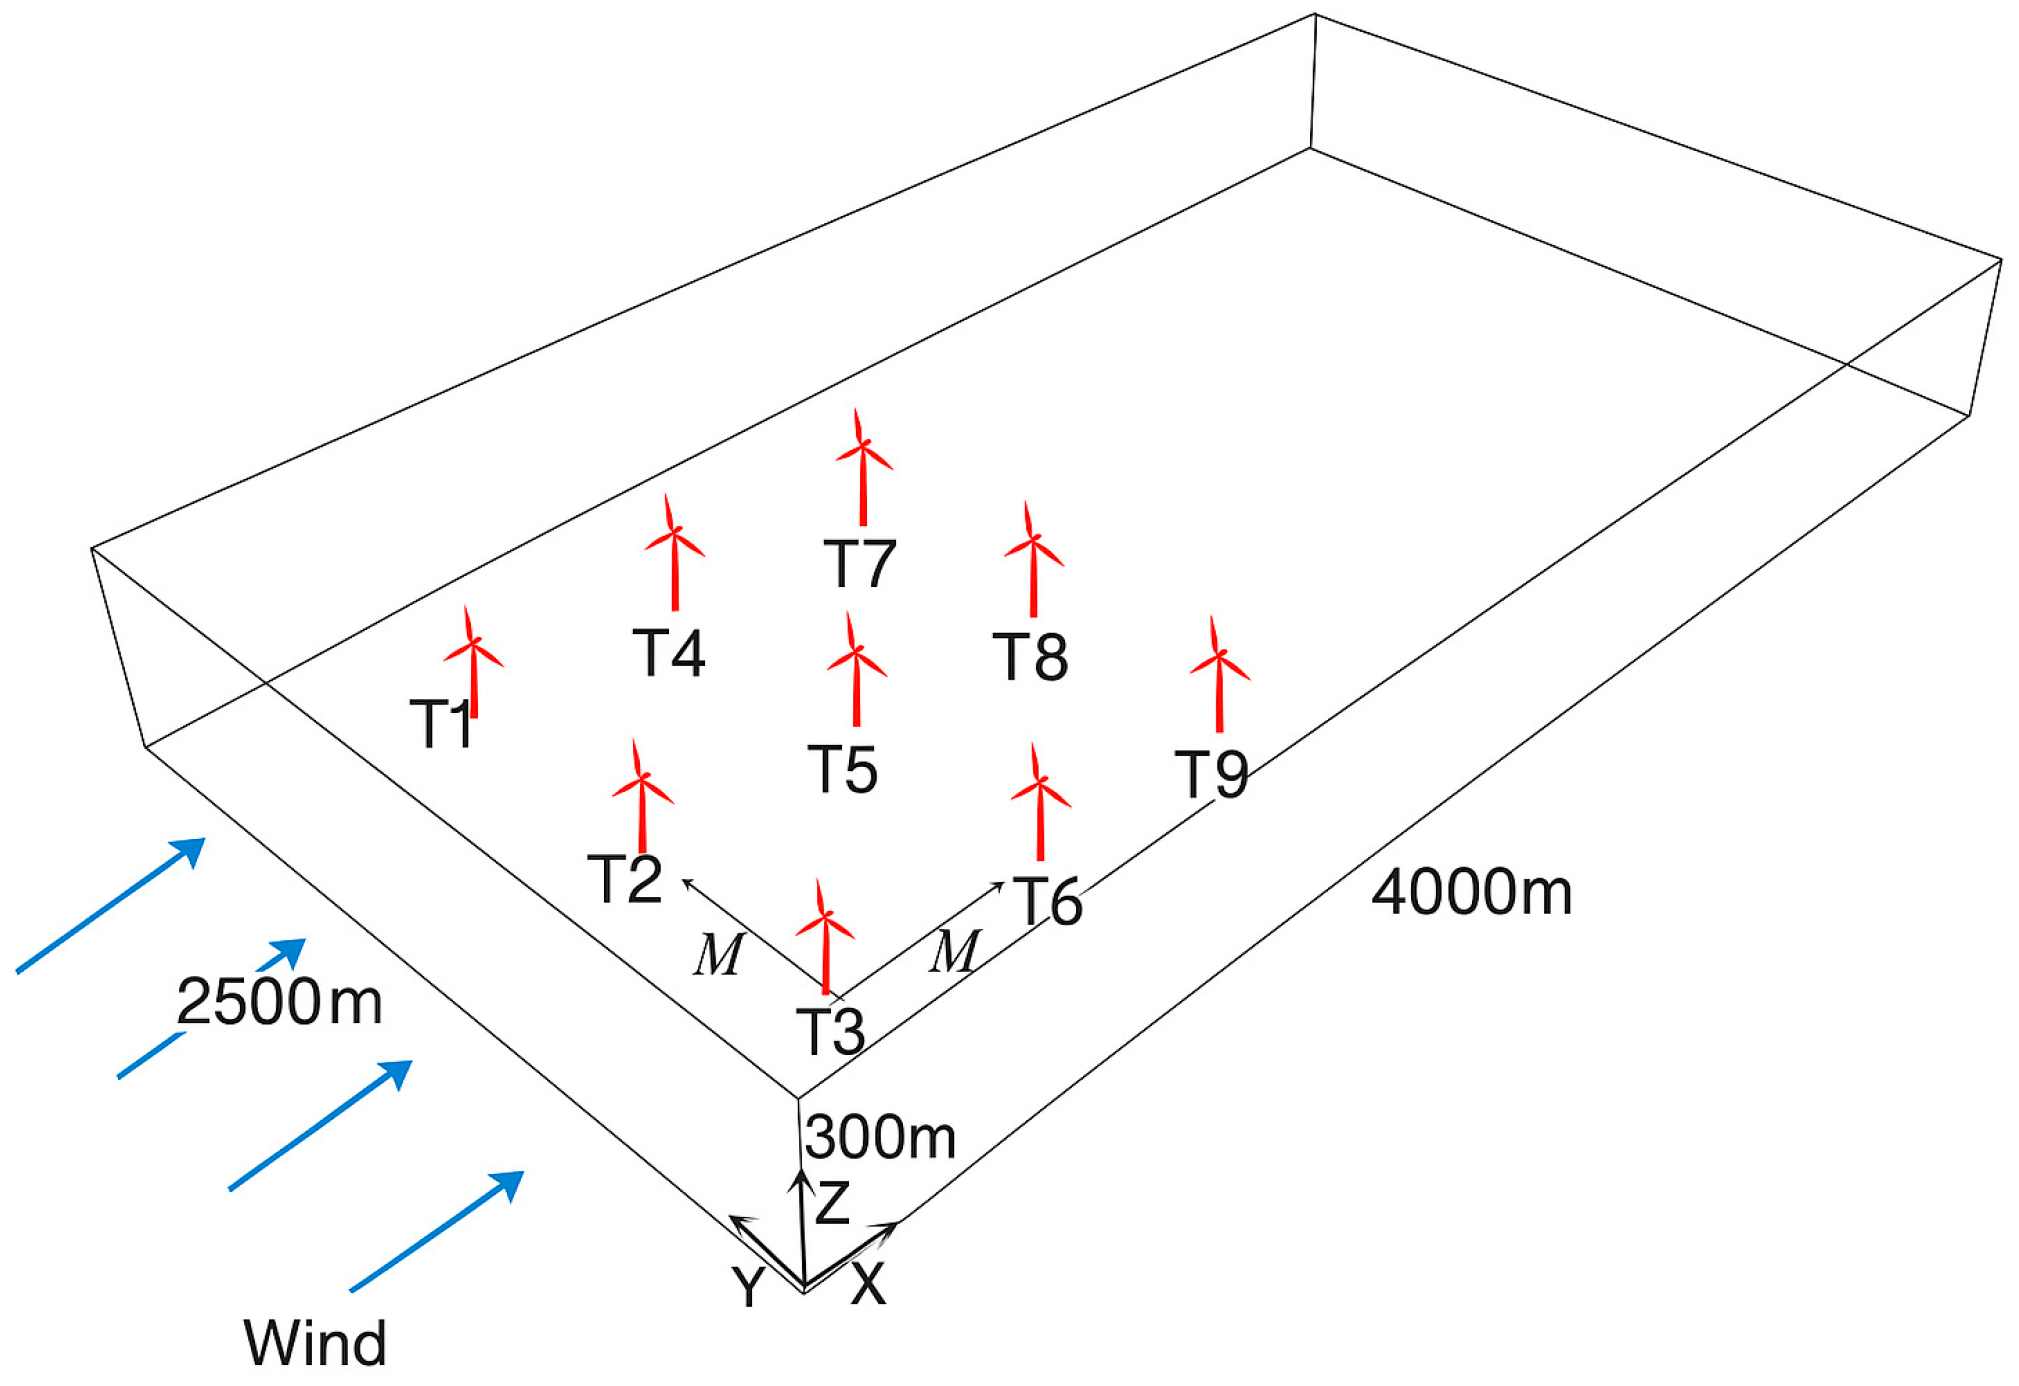
The NREL-5 MW wind turbine model, developed by the NREL, is selected for all turbines within the wind farm [39]. For ease of writing, the upstream wind turbine, midstream wind turbine and downstream wind turbine are abbreviated as UWT, MWT and DWT, respectively. This study details the parameter settings for the wind farm using the square layout shown in Figure 5. The 3 × 3 wind farm layout was chosen to systematically analyze the coupling effects of layout, turbulence intensity, and spacing on wake interactions. This configuration allows for the study of typical wake behavior between rows and columns, capturing upstream and downstream effects while maintaining manageable computational costs. The 3 × 3 array serves as a representative unit for examining wake propagation and recovery dynamics across different turbine configurations. This layout configuration established three distinct cases based on the inter-turbine spacing parameter. The spacing between wind turbines in the x and y directions is set to M (M = 3/4/5D, where D = 126 m, the turbine diameter). The low-resolution computational domain for the entire wind farm is 4000 m × 2500 m × 300 m. A high-resolution computational domain of 200 m × 200 m × 120 m is defined for each wind turbine. Each wind turbine is enclosed within its respective high-resolution domain and positioned within the low-resolution domain to obtain more precise simulation data. The simulation duration for all cases at this wind farm is 4000 s. Due to the initial operational instability of the wind turbines, the first 3000 s of data are excluded to ensure the accuracy of the analysis. The turbulent inflow wind direction is aligned uniformly along the positive x-axis, which is perpendicular to the wind turbine rotor plane. To investigate the impact of turbulence intensity on the power output and wake effects of wind farm, four turbulence intensity (I = 0%, 5%, 10% and 15%) are set for a comparative analysis.

3.2. Wind Farm Layout

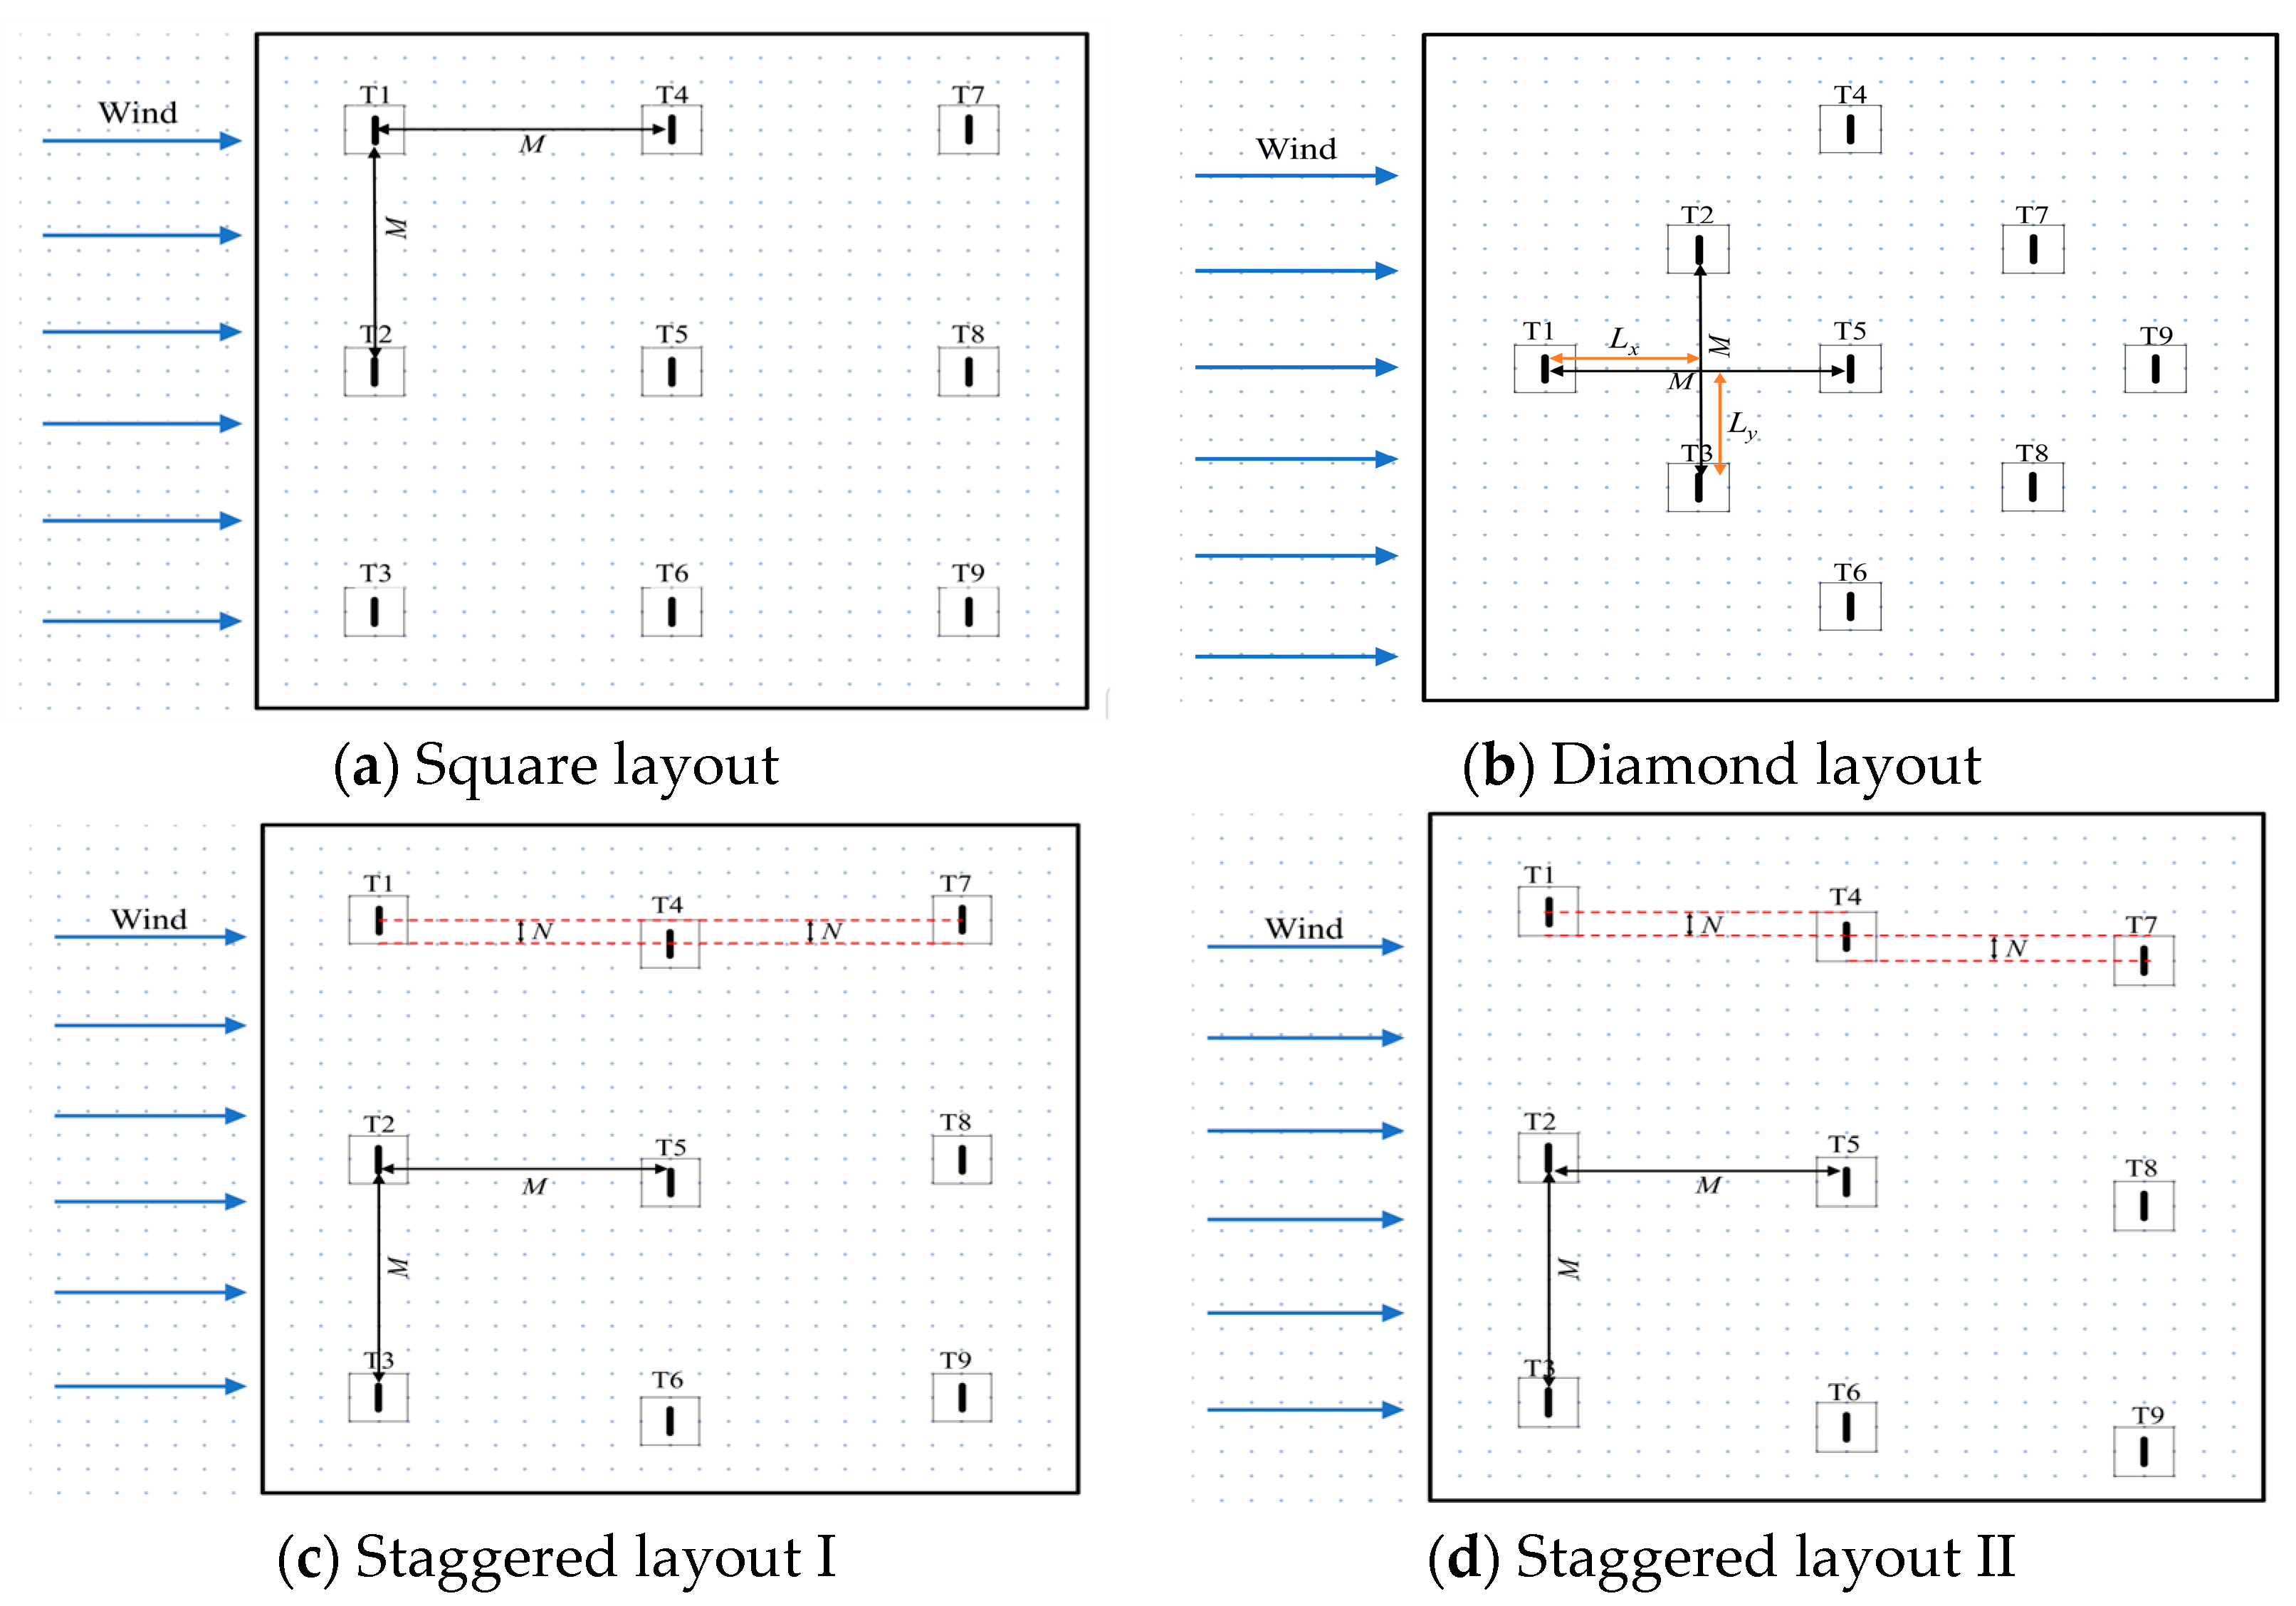
To investigate the impact of different layouts on the wind farm’s overall power generation efficiency and wake effects, square, diamond and staggered layouts are set up, as shown in Figure 6. The diamond layout uses the first wind turbine (T1) as the reference point. The wind turbines are spaced at 1.5D, 2D, and 2.5D in both the longitudinal (Lx) and lateral (Ly) directions (Lx = Ly = 1.5D, 2D, and 2.5D). The square root of 2 times this reference distance ( L x 2   + L y 2 = 2.12D, 2.83D, 3.54D) defines the actual diagonal spacing between T1 and the side-rear wind turbines (T2, T3). Building upon the square layout, two staggered layouts are derived by translating M-DWT laterally in the negative direction: staggered layout I shifts the second row by N = 0.1D, 0.5D, and 1.0D; staggered layout II simultaneously shifts the second and third rows by N = 0.1D (0.2D), 0.3D (0.6D), and 0.5D (1.0D) to systematically investigate the impact of staggered layouts on wind farm output power. The present study utilizes twenty-four spacing cases and four turbulence intensity cases, yielding a total of ninety-six cases.

4. Results and Discussion

4.1. Square Layout Case

4.1.1. Power Performance

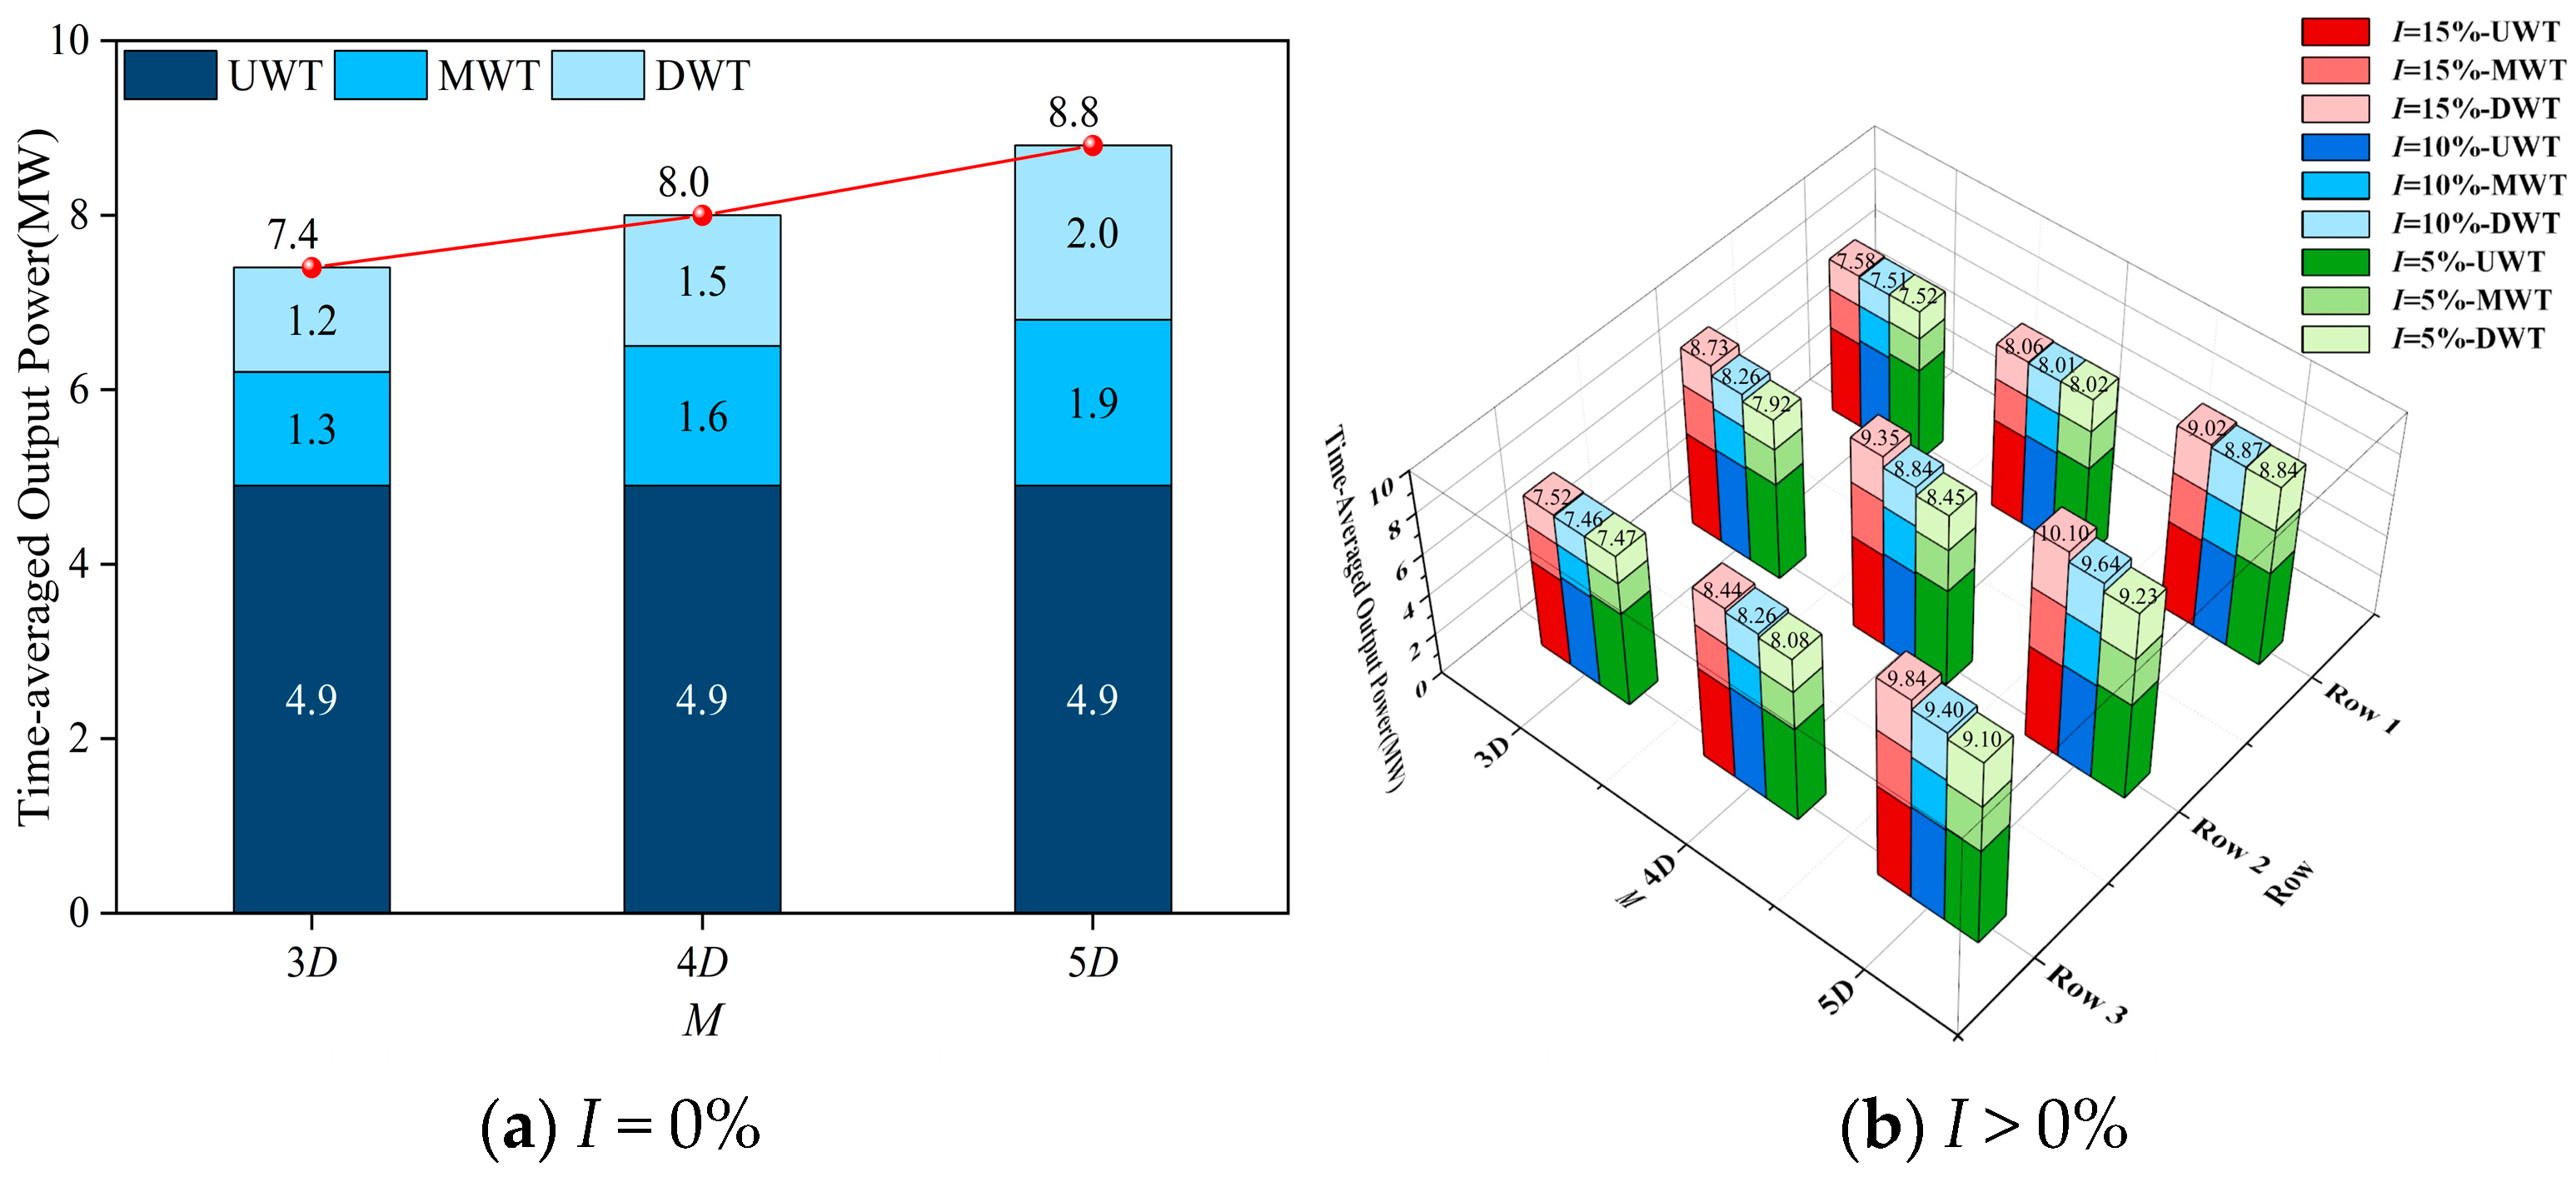
The variation in the time-averaged output power of wind turbines in the square layout with turbulence intensity I and turbine spacing M is shown in Figure 7. When I = 0% (uniform wind), the time-averaged output power is shown in Figure 7a. UWTs are on the front row facing the wind and are unaffected by the wake. The time-averaged output power varies minimally across different spacing configurations. In contrast, M-DWTs are impacted by the wake generated by UWTs. The inflow wind velocity is substantially reduced, resulting in markedly lower time-averaged output power compared to UWT. The difference increases with larger wind turbine spacing. As M increases from 3D to 5D, the time-averaged output power of MWTs increases by 40.91%, while the output power of DWTs increases by 59.84%. These results suggest that increasing M can effectively enhance a wind farm’s output power, with the most significant improvement observed for DWTs. When M = 5D, the time-averaged output power of the DWTs exceeds that of the MWTs. As the spacing between the wind turbines increases, the wake merging effects from the U-MWTs diminish. At the same time, energy replenishment from the free-flowing wind allows the wake velocity to approach the ambient wind velocity.
The variation in the time-averaged output power of each wind turbine with turbulence intensity I changes is shown in Figure 7b. The total output power of the wind farm gradually increases as turbulence intensifies when I > 0%. The total output power of each row of three wind turbines also follows the same trend. The wind turbines are affected by the random characteristics of turbulent wind velocities, resulting in differing power outputs among the three turbines in the same column.
As shown in Table 2, the time-averaged output power of UWTs is negatively correlated with I, while total wind farm output power is positively correlated. The higher turbulence intensity causes greater wind velocity fluctuations within the field, which affects the normal operation of the UWTs and reduces their output efficiency. The time-averaged output power of M-DWTs is influenced by natural turbulent wind flow and additional turbulence caused by the wake of UWTs. The turbulence intensity within the wake zone and accelerates wake recovery. As turbulence intensity increases, the time-averaged output power of M-DWTs rises gradually, thereby boosting the total power output of the wind farm. The total output power of the wind farm reaches its maximum when M = 5D. At this spacing, an increase in turbulence intensity only yields a limited improvement in total output power. The total output power of the wind farm only rises by 6.55% when turbulence intensity increases from 0% to 15%.

4.1.2. Wake Characteristic

Wind turbine wakes are complex due to the dynamic interactions between turbine-induced flow disturbances, turbulence, and wake recovery processes [40]. The main physical mechanisms contributing to these complex wakes include turbulent mixing, vortex shedding, shear effects, and wake recovery. As wind passes through the rotor, it induces turbulence, leading to the formation of turbulent eddies and vortex shedding, which causes significant energy dissipation near the wind turbine. This turbulence extends downstream, contributing to the energy deficit within the wake. Additionally, vortex shedding creates disturbances in the flow field, resulting in fluctuating wind velocities that reduce the energy available to DWTs. The wake shear layer, formed between the high velocity external flow and the low velocity wake, plays a crucial role in energy dissipation. The intense mixing within this shear layer leads to increased entropy production, while facilitating energy exchange between the wake and surrounding air, which accelerates wake recovery [41]. The efficiency of wake recovery is influenced by turbine spacing and turbulence intensity. Larger turbine spacing helps reduce the merging of wakes, allowing for faster recovery, while higher turbulence intensity enhances the energy exchange between the wake and external flow, speeding up recovery. Finally, when turbines are placed closer together, their wakes merge, intensifying turbulence and slowing down wake recovery. Using a staggered layout reduces this effect by shifting turbines laterally, thus mitigating wake merging and improving recovery efficiency.
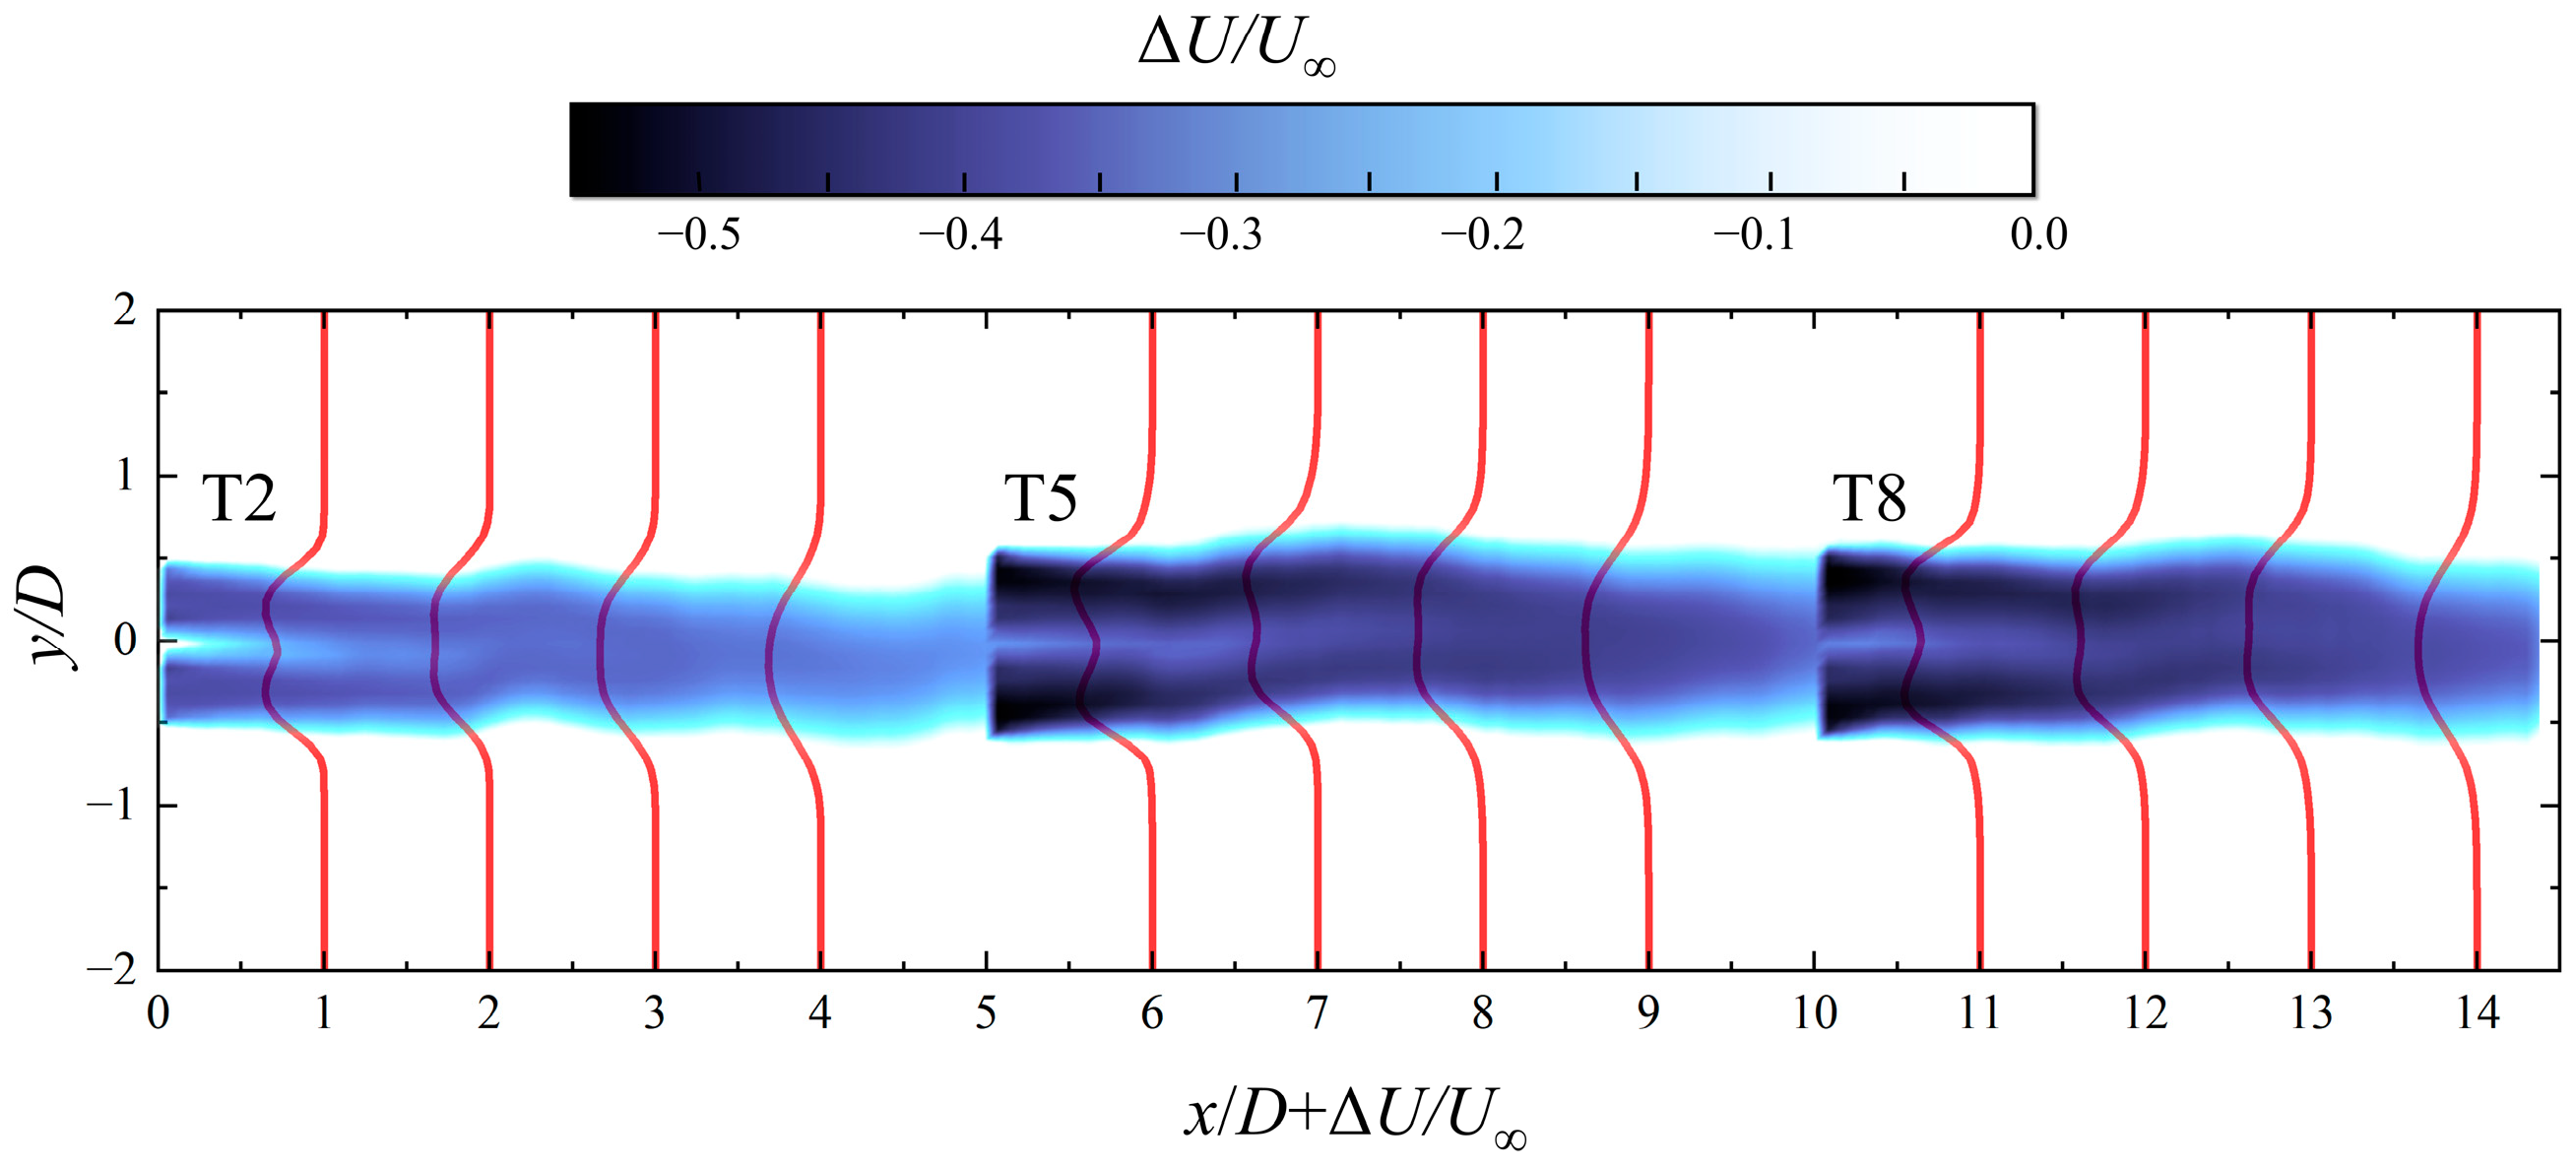
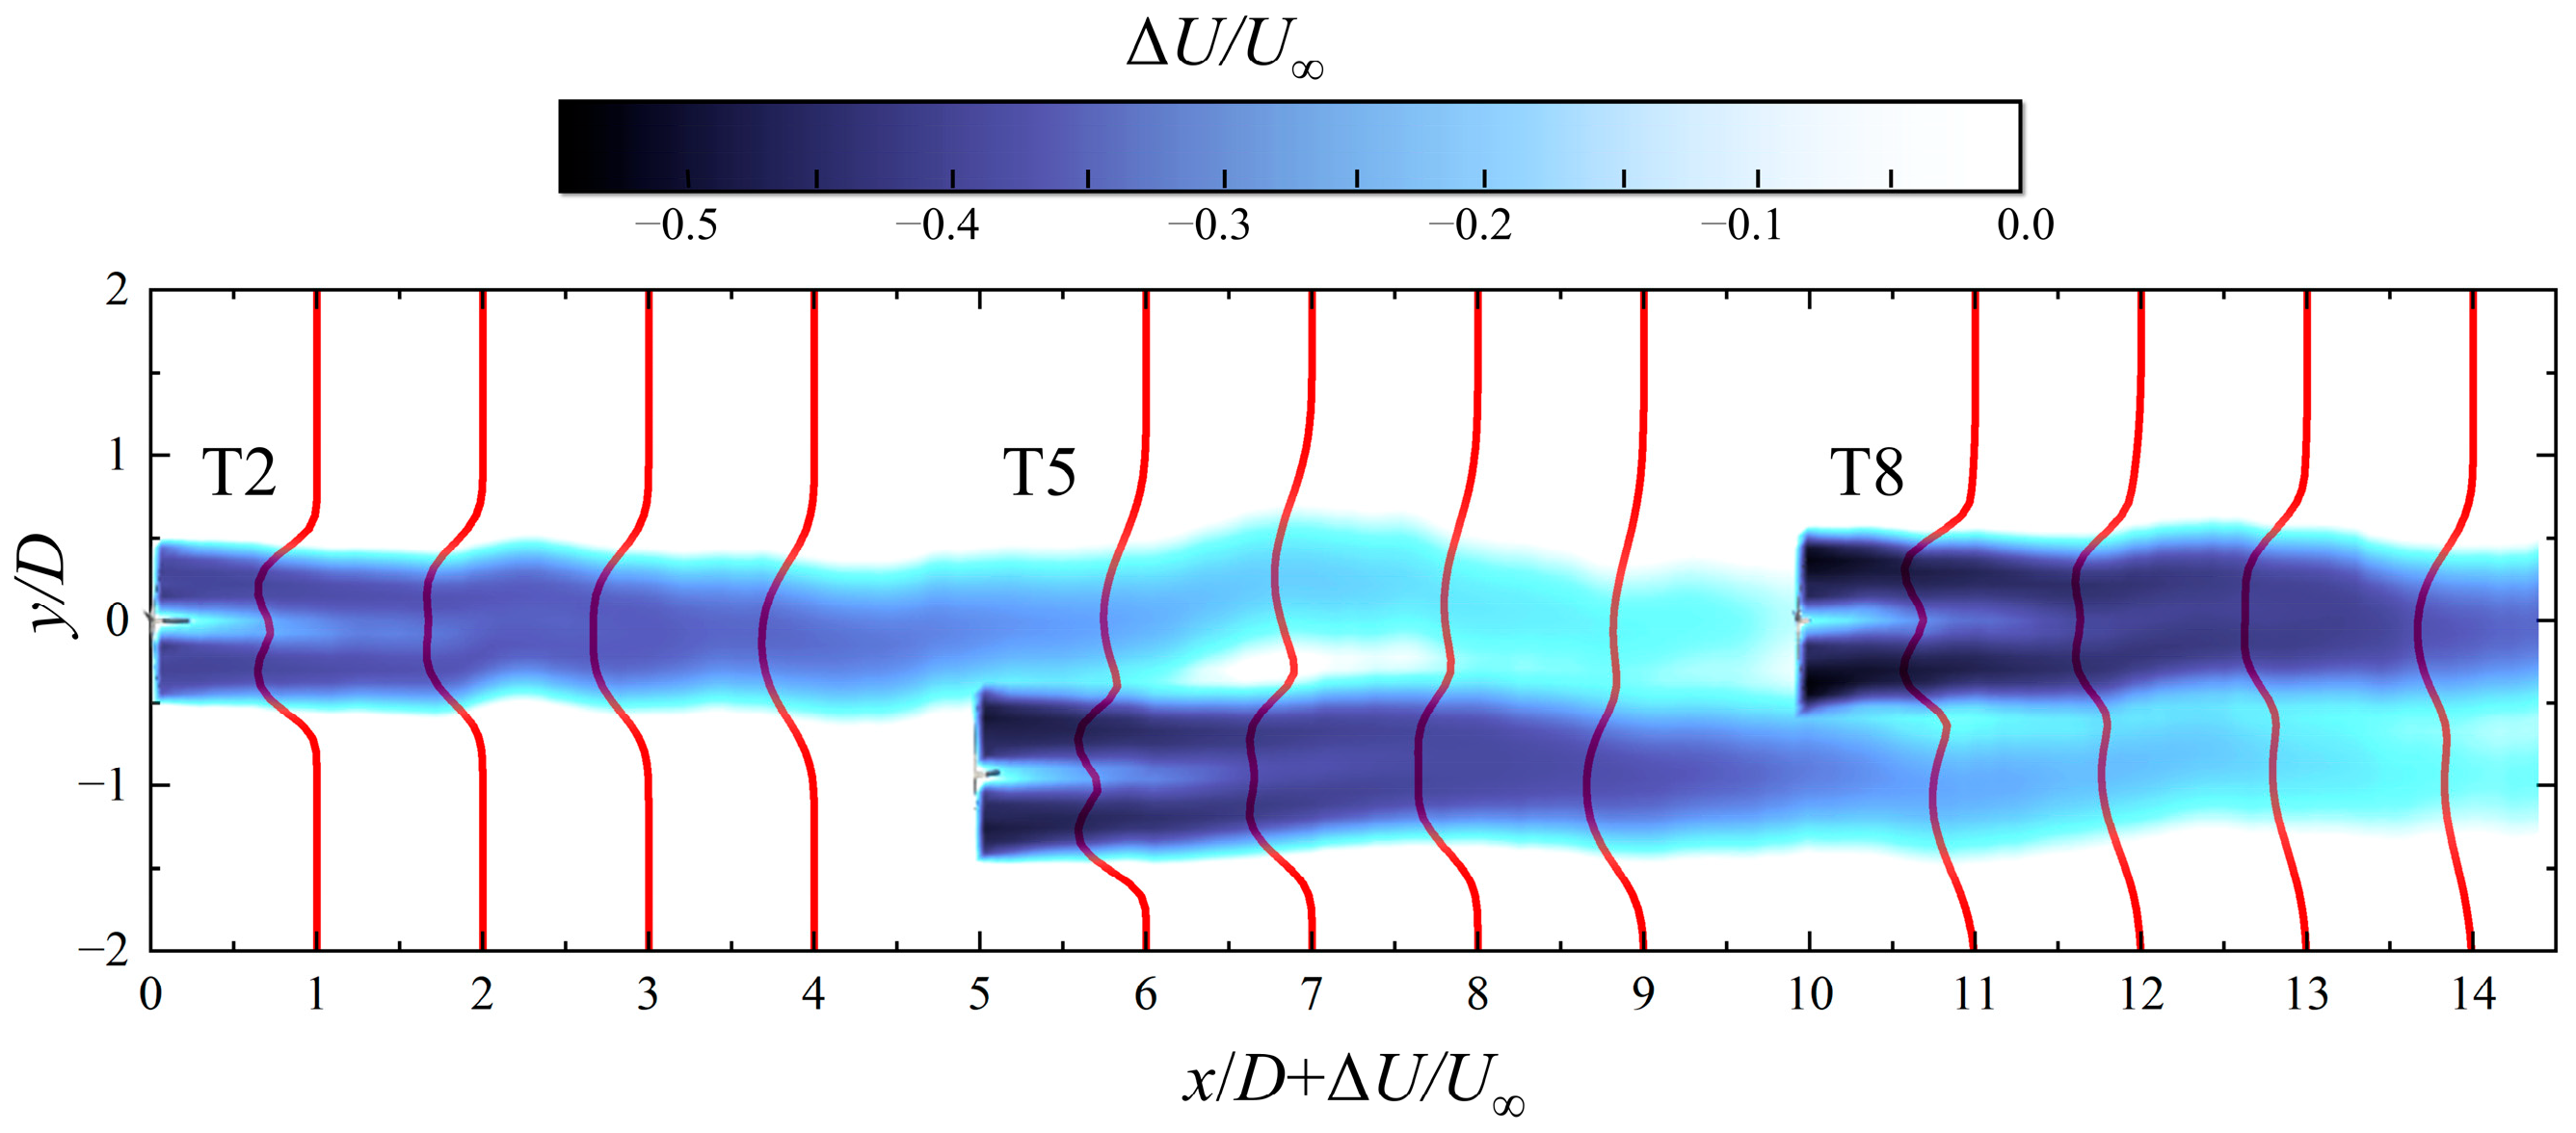
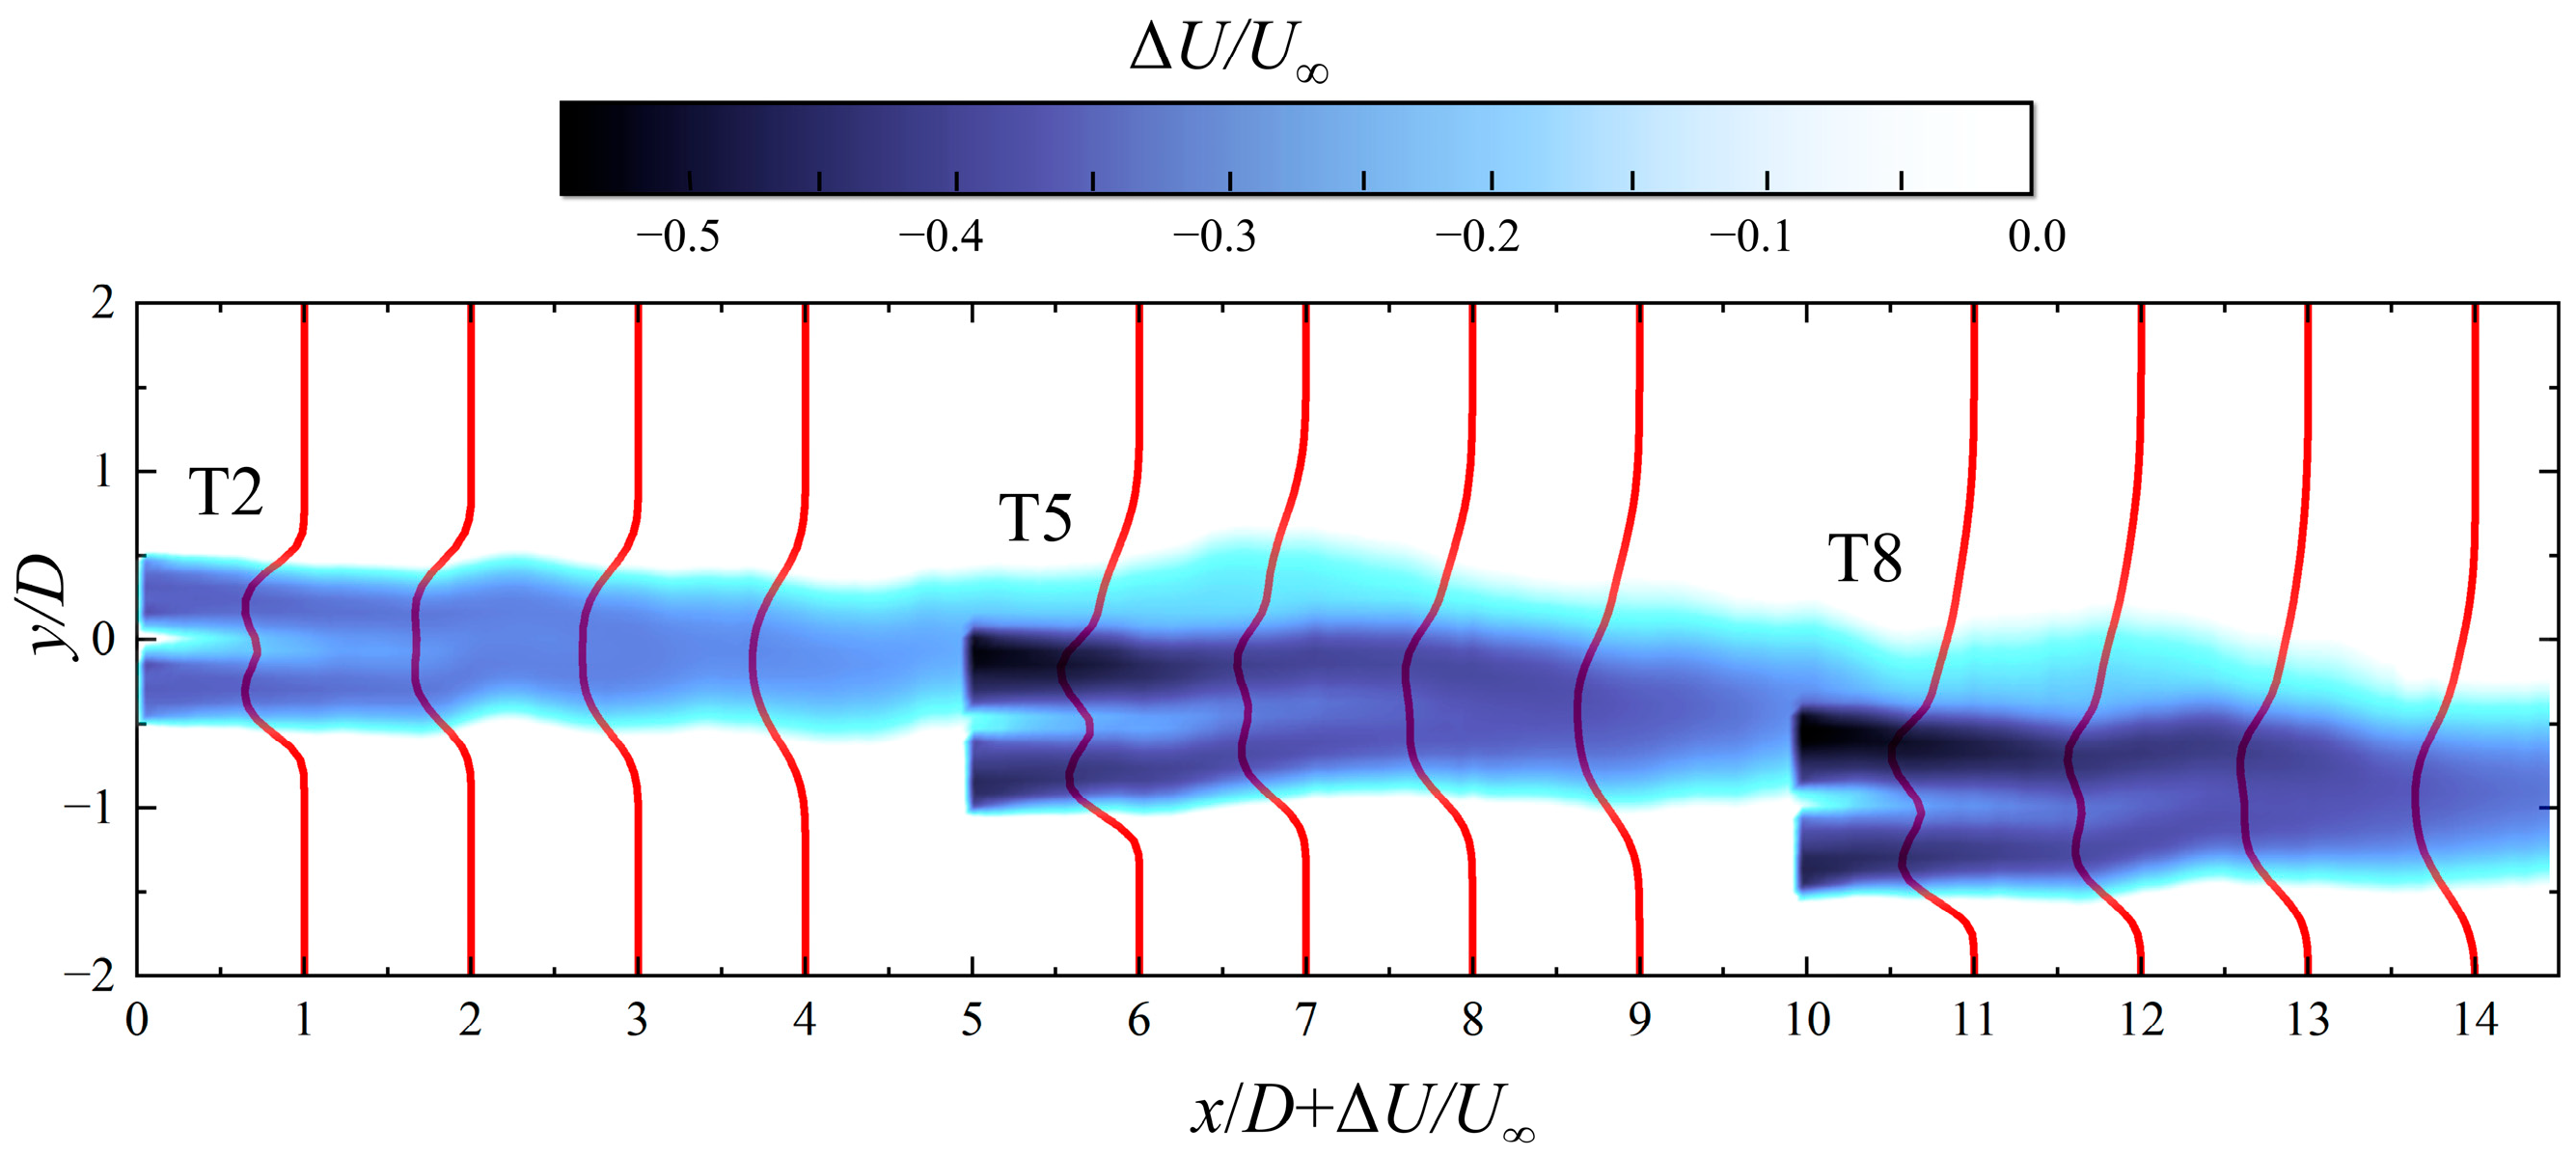
Taking the case M = 5D and I = 15% as an example, since the longitudinal spacing is large enough to avoid the influence of the wake from different rows, the three wind turbines in the middle row (T2, T5 and T8) are selected for studying their wake deficit and recovery. To better analyze the changes in the wake, the wake deficit velocity is normalized using ∆U = UxU, as shown in Figure 8. Where Ux is the wake wind velocity at distance xD, U is the inflow wind velocity (U = 11.4 m/s) and ∆U is the velocity deficit. The red line depicts the wake velocity profile along the y-axis.
All wind turbines in the row are arranged in series in the case of square layout. The wake of the UWTs exhibits displacement in the 2D plane under the influence of a turbulent wind field, demonstrating meandering characteristics. The MWTs are still affected by the upstream wakes in this spacing, while the DWTs experience severe wake deficits due to the wake merging effects of the upstream and midstream wakes. Observing the wake velocity profile reveals a transition from a double Gaussian distribution to a single Gaussian distribution in the wake deficit distribution of the three wind turbines. A double Gaussian pattern is evident at 1D, while a single Gaussian pattern is observed at 4D. As the spacing increases, the measured differences in wake deficit at 4D spacings for different wind turbines are as follows: ∆U4/U − ∆U1/U = 0.039, ∆U9/U − ∆U6/U = 0.090 and ∆U14/U − ∆U11/U = 0.103, respectively. These values indicate that, for a given spacing, wake deficit gradually decreases as the distance to the DWT increases. This indicates that, for wind turbines located farther downstream, the velocity deficit decreases over the same spacing interval. This means that wake recovery is more pronounced with increased longitudinal spacing. This is because the UWT absorbs part of the wind energy, strengthening the turbulence intensity in the wake region, accelerating energy exchange with the external flow, and promoting the recovery of wake velocity towards the free stream.
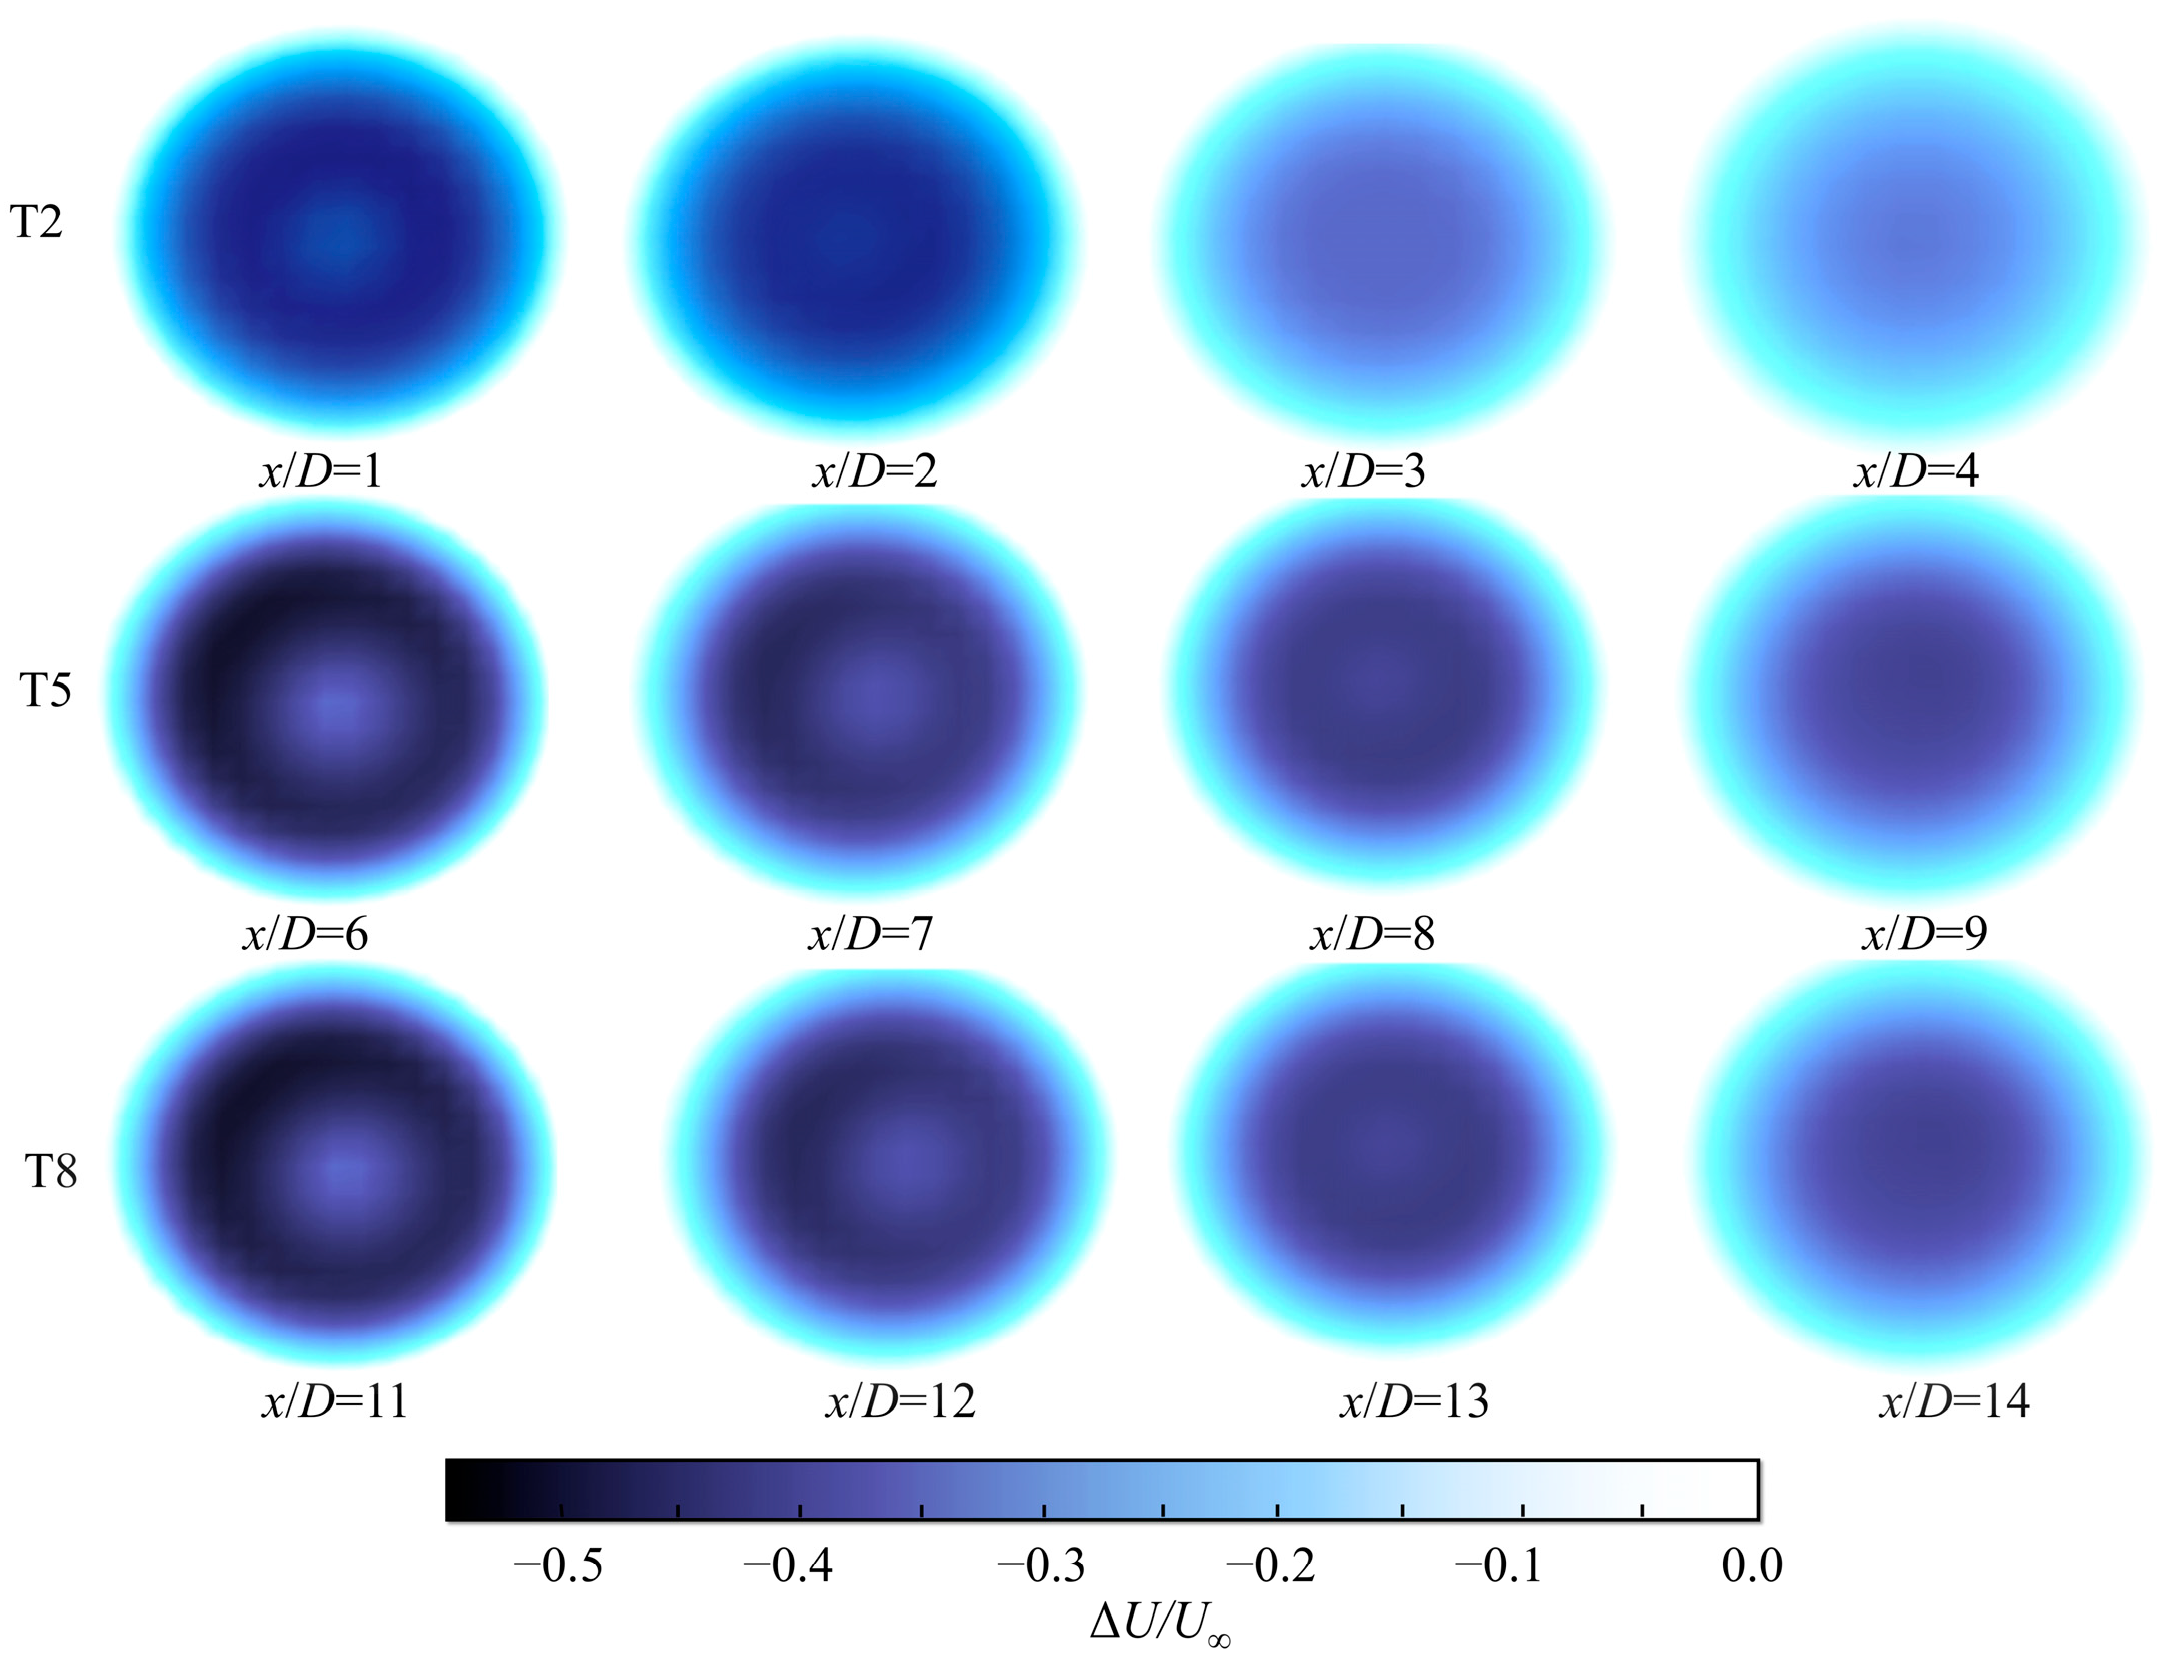
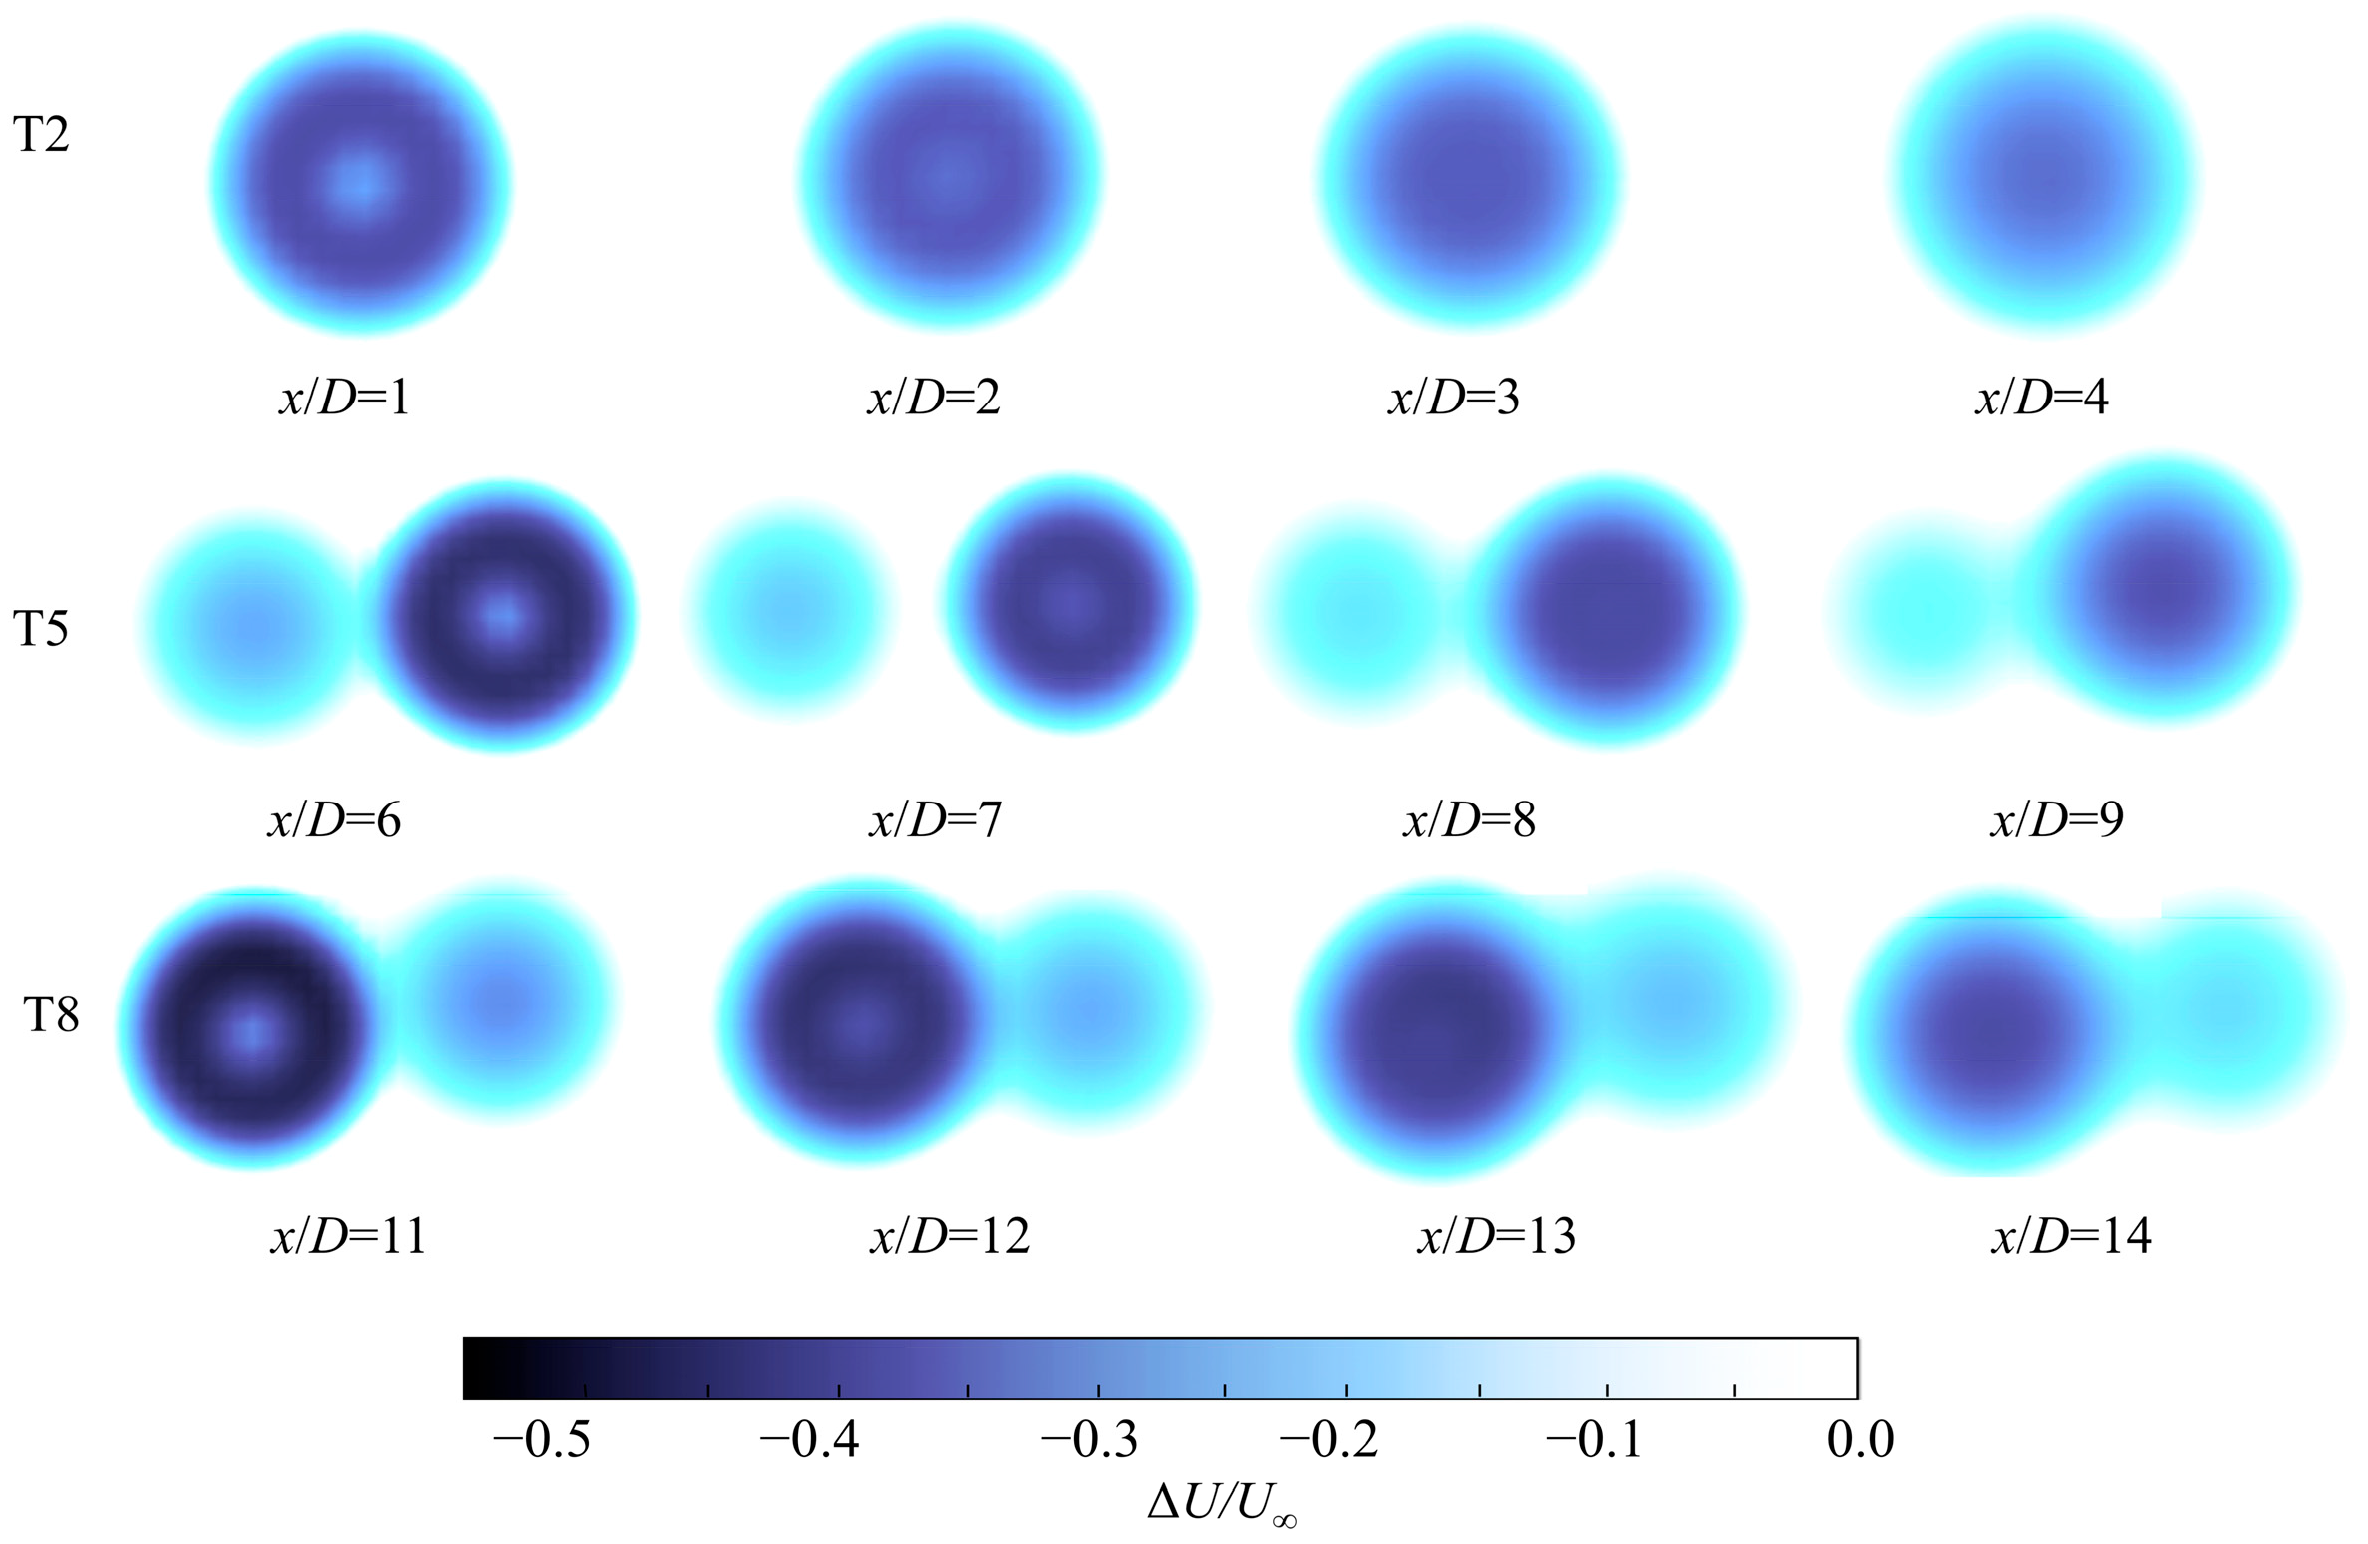
Furthermore, to comprehensively investigate the characteristics of wind turbine wake, longitudinal profiles of wake velocity deficit at different wake locations are sliced, as shown in Figure 9. As the incoming flow is compressed into a high-pressure zone when passing through the center of the wind turbine hub, the hub center experiences minimal wind velocity deficit. The wake velocity deficit is primarily concentrated at the blades. Consequently, at x/D = 1, 6 and 11, the hub center of the longitudinal profile appears light in color, while the surrounding areas gradually darken. Subsequently, as the wake develops, the pressure difference drives high-velocity air from the free stream into the wake region, then it mixes with the low-velocity wake air. This process restores the wake velocity and reduces velocity deficit. In longitudinal profile views, the lighter color at the center gradually blends with the surrounding hues, while the surrounding colors progressively lighten.

4.2. Power and Wake Analysis for Diamond Layout Case

4.2.1. Power Performance

In the diamond layout, the middle-row wind turbines (T1, T5, and T9) occupy the same positions as the middle-row wind turbines (T2, T5, and T8) in the square one. However, according to the performance data presented in Table 2 and Table 3, the time-averaged output power of these six turbines is nearly identical. This suggests that, with larger longitudinal spacing, the change in the wind farm layout does not affect the output power of wind turbines in the same position.
In the diamond layout, five wind turbines (T1–T4, T6) operate on the windward side are unaffected by wake effects, and their output power approaching rated capacity. Only four wind turbines (T5, T7–T9) are affected by wake effects. Compared to the square layout, the T4 and T6 wind turbines are positioned on the windward side, which reducing the number of turbines affected by wake by two units. Overall, the total power output results (Table 2 and Table 3) demonstrate that the minimum total output power of the diamond layout wind farm exceeds the maximum total output power of the square layout. In the case of I = 0% and M = 3D, the total output power of the diamond layout wind farm increases from 22.32 MW to 29.42 MW. The increase in total output power is the largest at 31.75%, with the increase mainly concentrated in the T4 and T6 wind turbines. This indicates that the change in the layout to reduce the number of wind turbines affected by wake can substantially increase the total output power of the wind farm.

4.2.2. Wake Characteristic

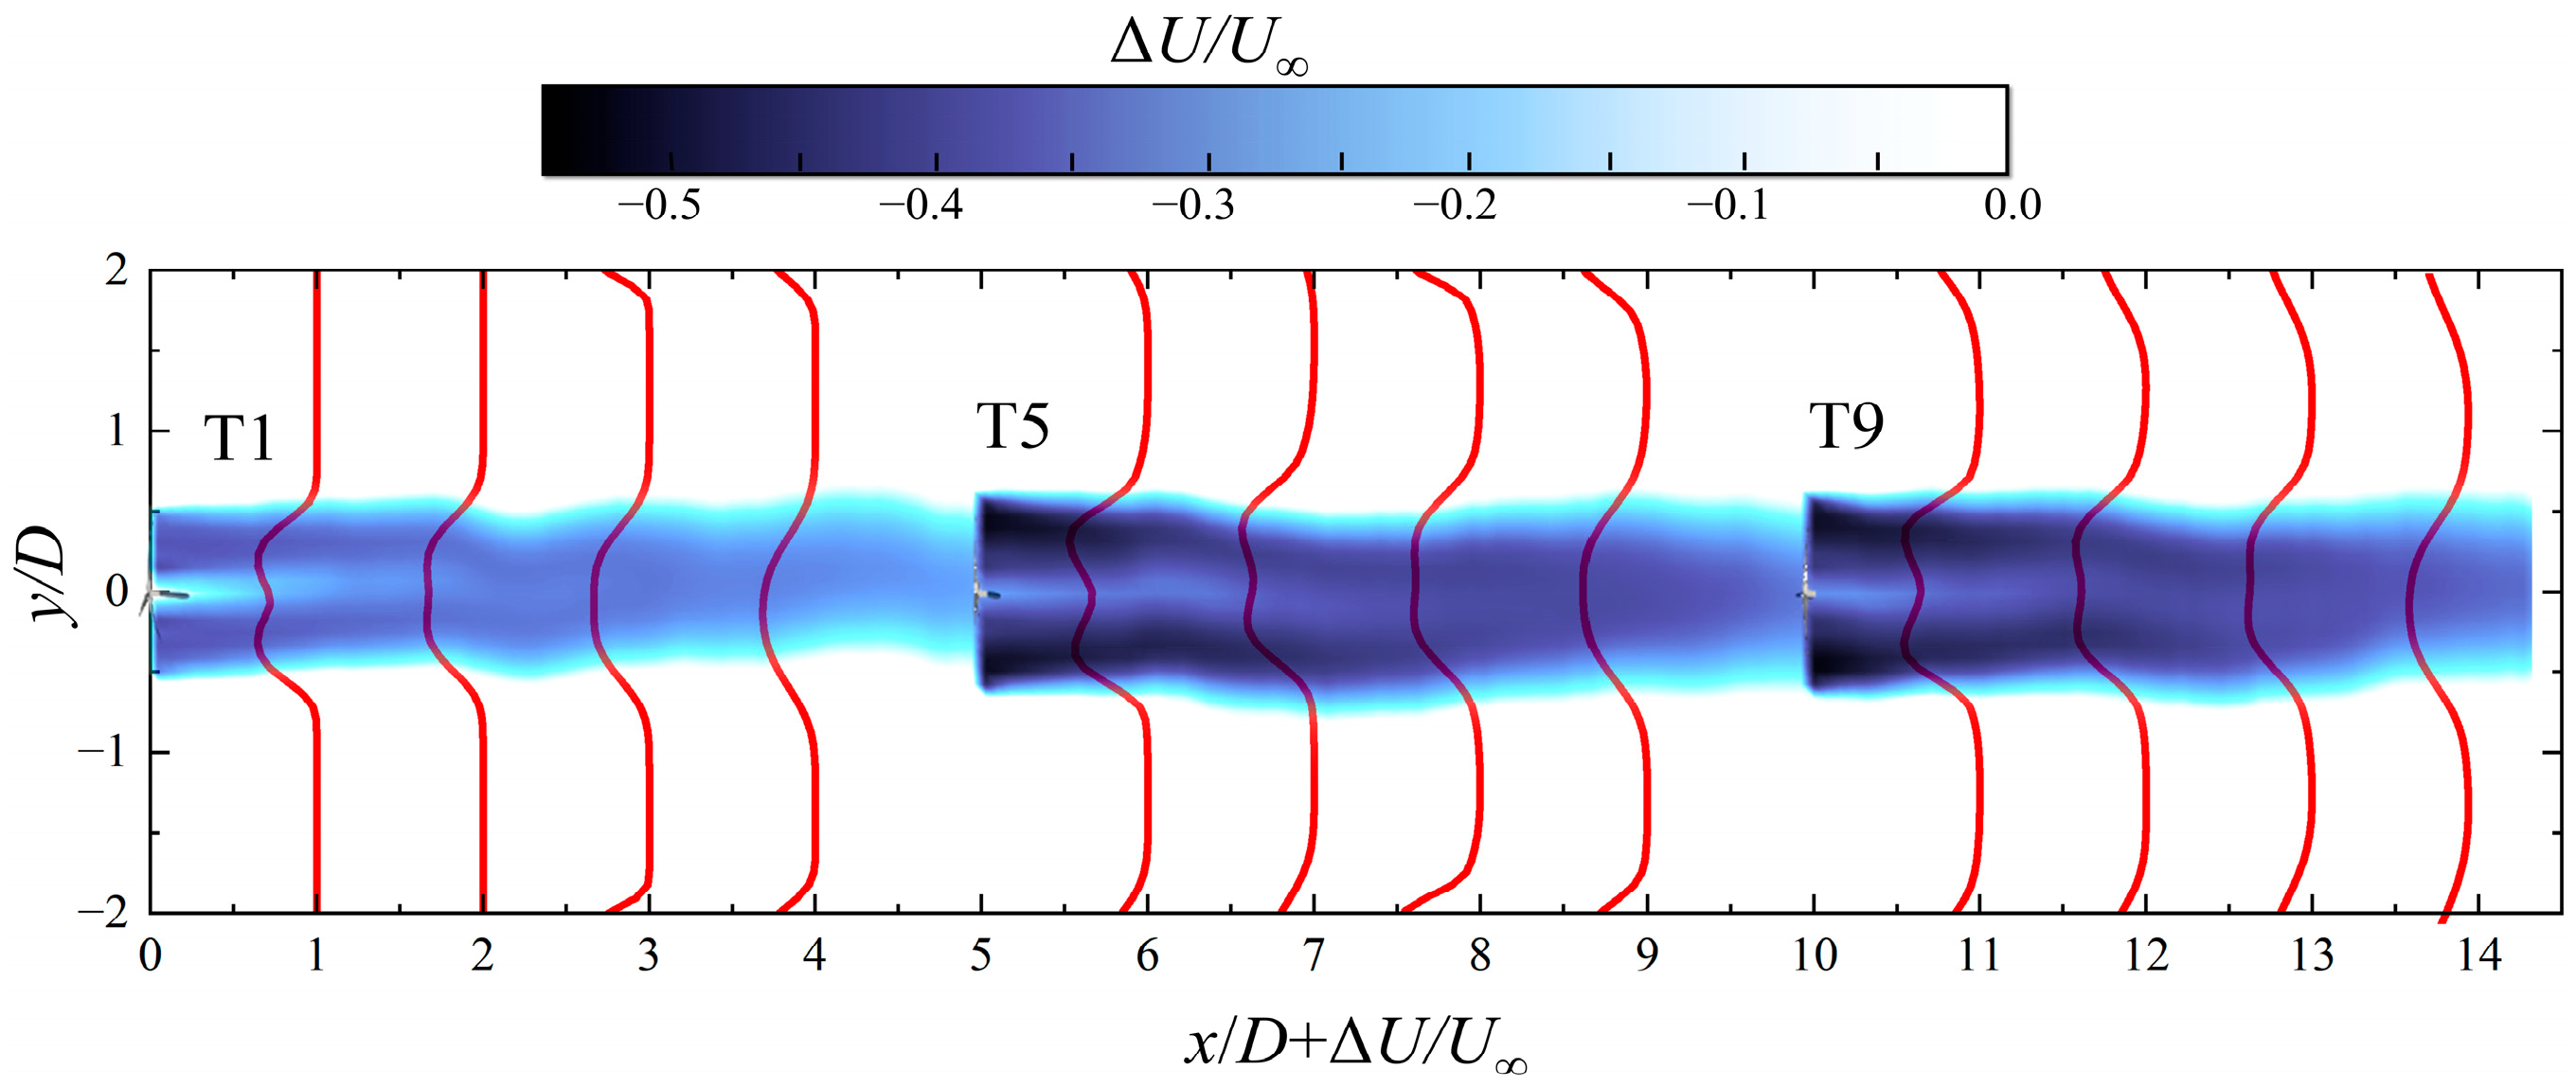
To compare with the square layout data, the three wind turbines (T1, T5, and T9) in the middle row in the case of M = 5D and I = 15% is also selected to investigate the wake deficit and recovery under the diamond one. The longitudinal profile of the wind turbine wake velocity deficit is shown in Figure 10. The comparison of the time-averaged output power in Table 2 and Table 3 with the longitudinal profiles of wake velocity deficit in Figure 8 and Figure 10 reveals consistent trends. Specifically, the three wind turbines in both the diamond and square layouts exhibit identical time-averaged output power. They also show the same wake velocity deficit under identical cases and positions. This indicates that the wind turbines in different rows do not interfere with each other at this longitudinal spacing.
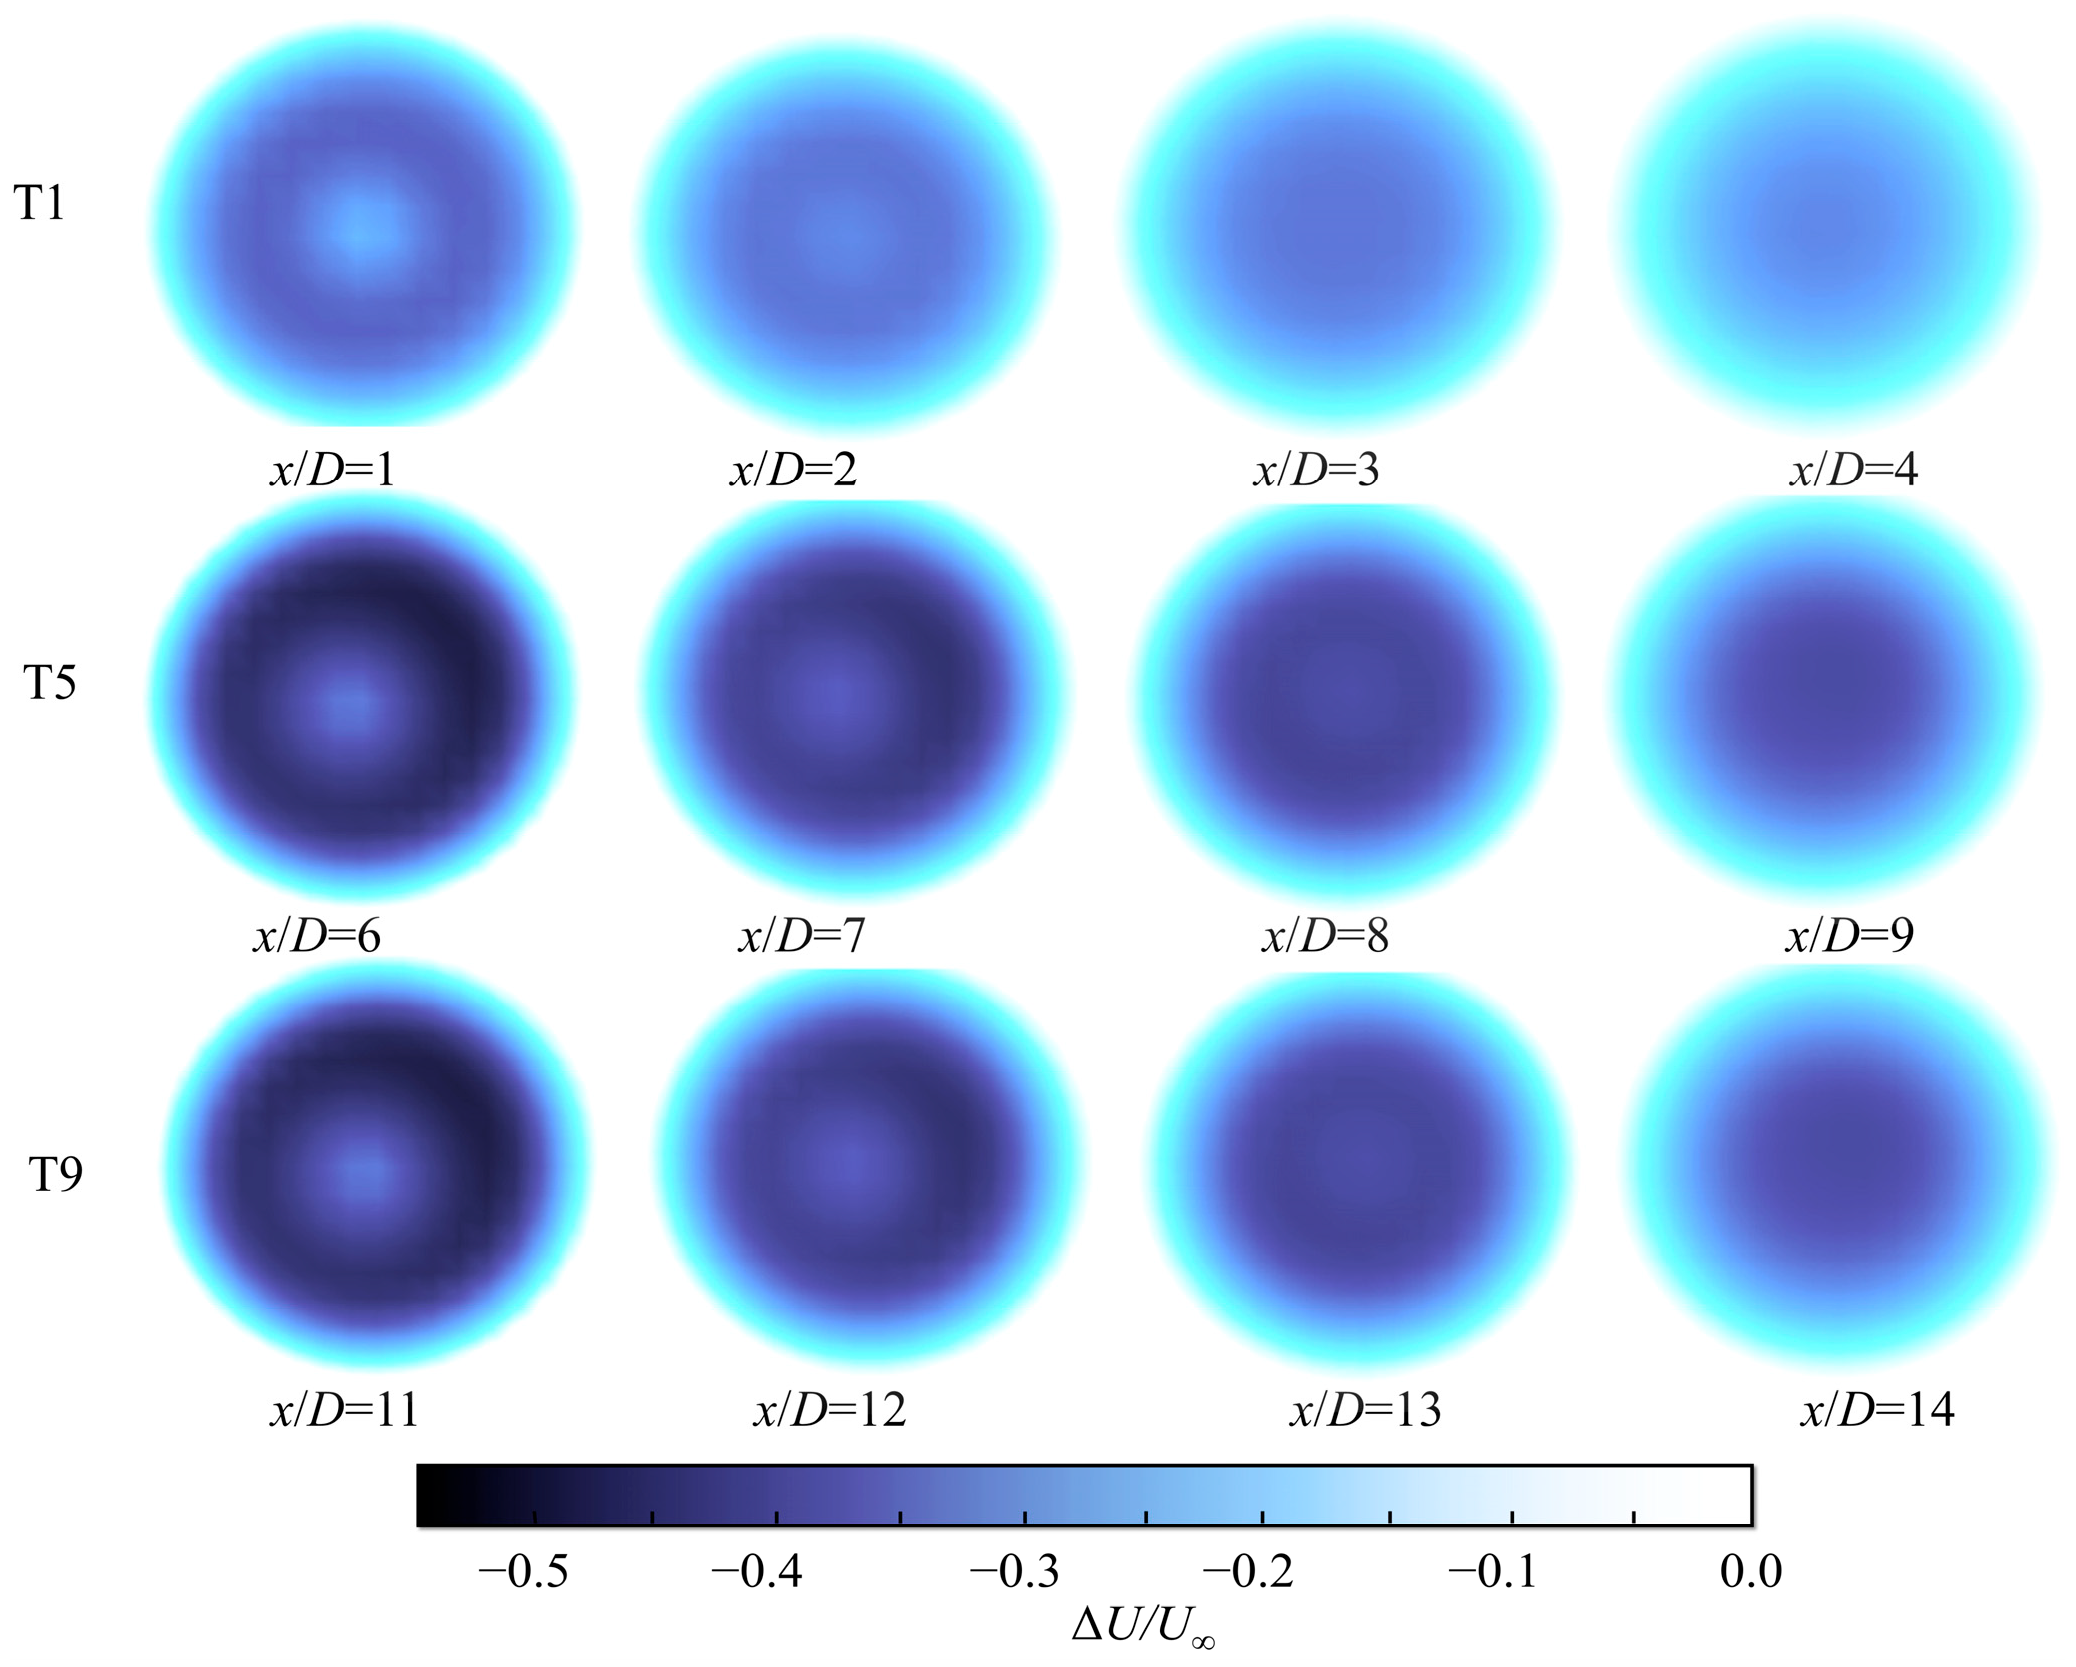
The spacing between rows in the diamond layout is 2.5D, which is less than the 5D spacing in the square one. As the wake of wind turbines in adjacent rows develops and propagates to x/D = 3, the middle row of wind turbines at y/D = ±2 will be affected by the wake of the adjacent rows. The wind velocity profile ∆U/U will change, as shown in Figure 10. Comparing the wind velocity profile after x/D = 3 shown in Figure 8, the wind velocity profile ∆U/U remains unchanged at y/D = ±2 with a longitudinal spacing of 5D. This indicates that mutual interference may occur between wind turbines in different rows when the longitudinal spacing between wind turbines is less than 2.5D. To further investigate the wake characteristics of wind turbines in the diamond layout, wake velocity deficit at different wake locations is similarly sliced, as shown in Figure 11. Comparing with the square one, the distribution of wake velocity deficit across the longitudinal of the wake velocity profile remains consistent in both layouts. This confirms that wind turbines in different rows do not interfere with each other at x/D = 3.

4.3. Staggered Layout Case

4.3.1. Power Performance

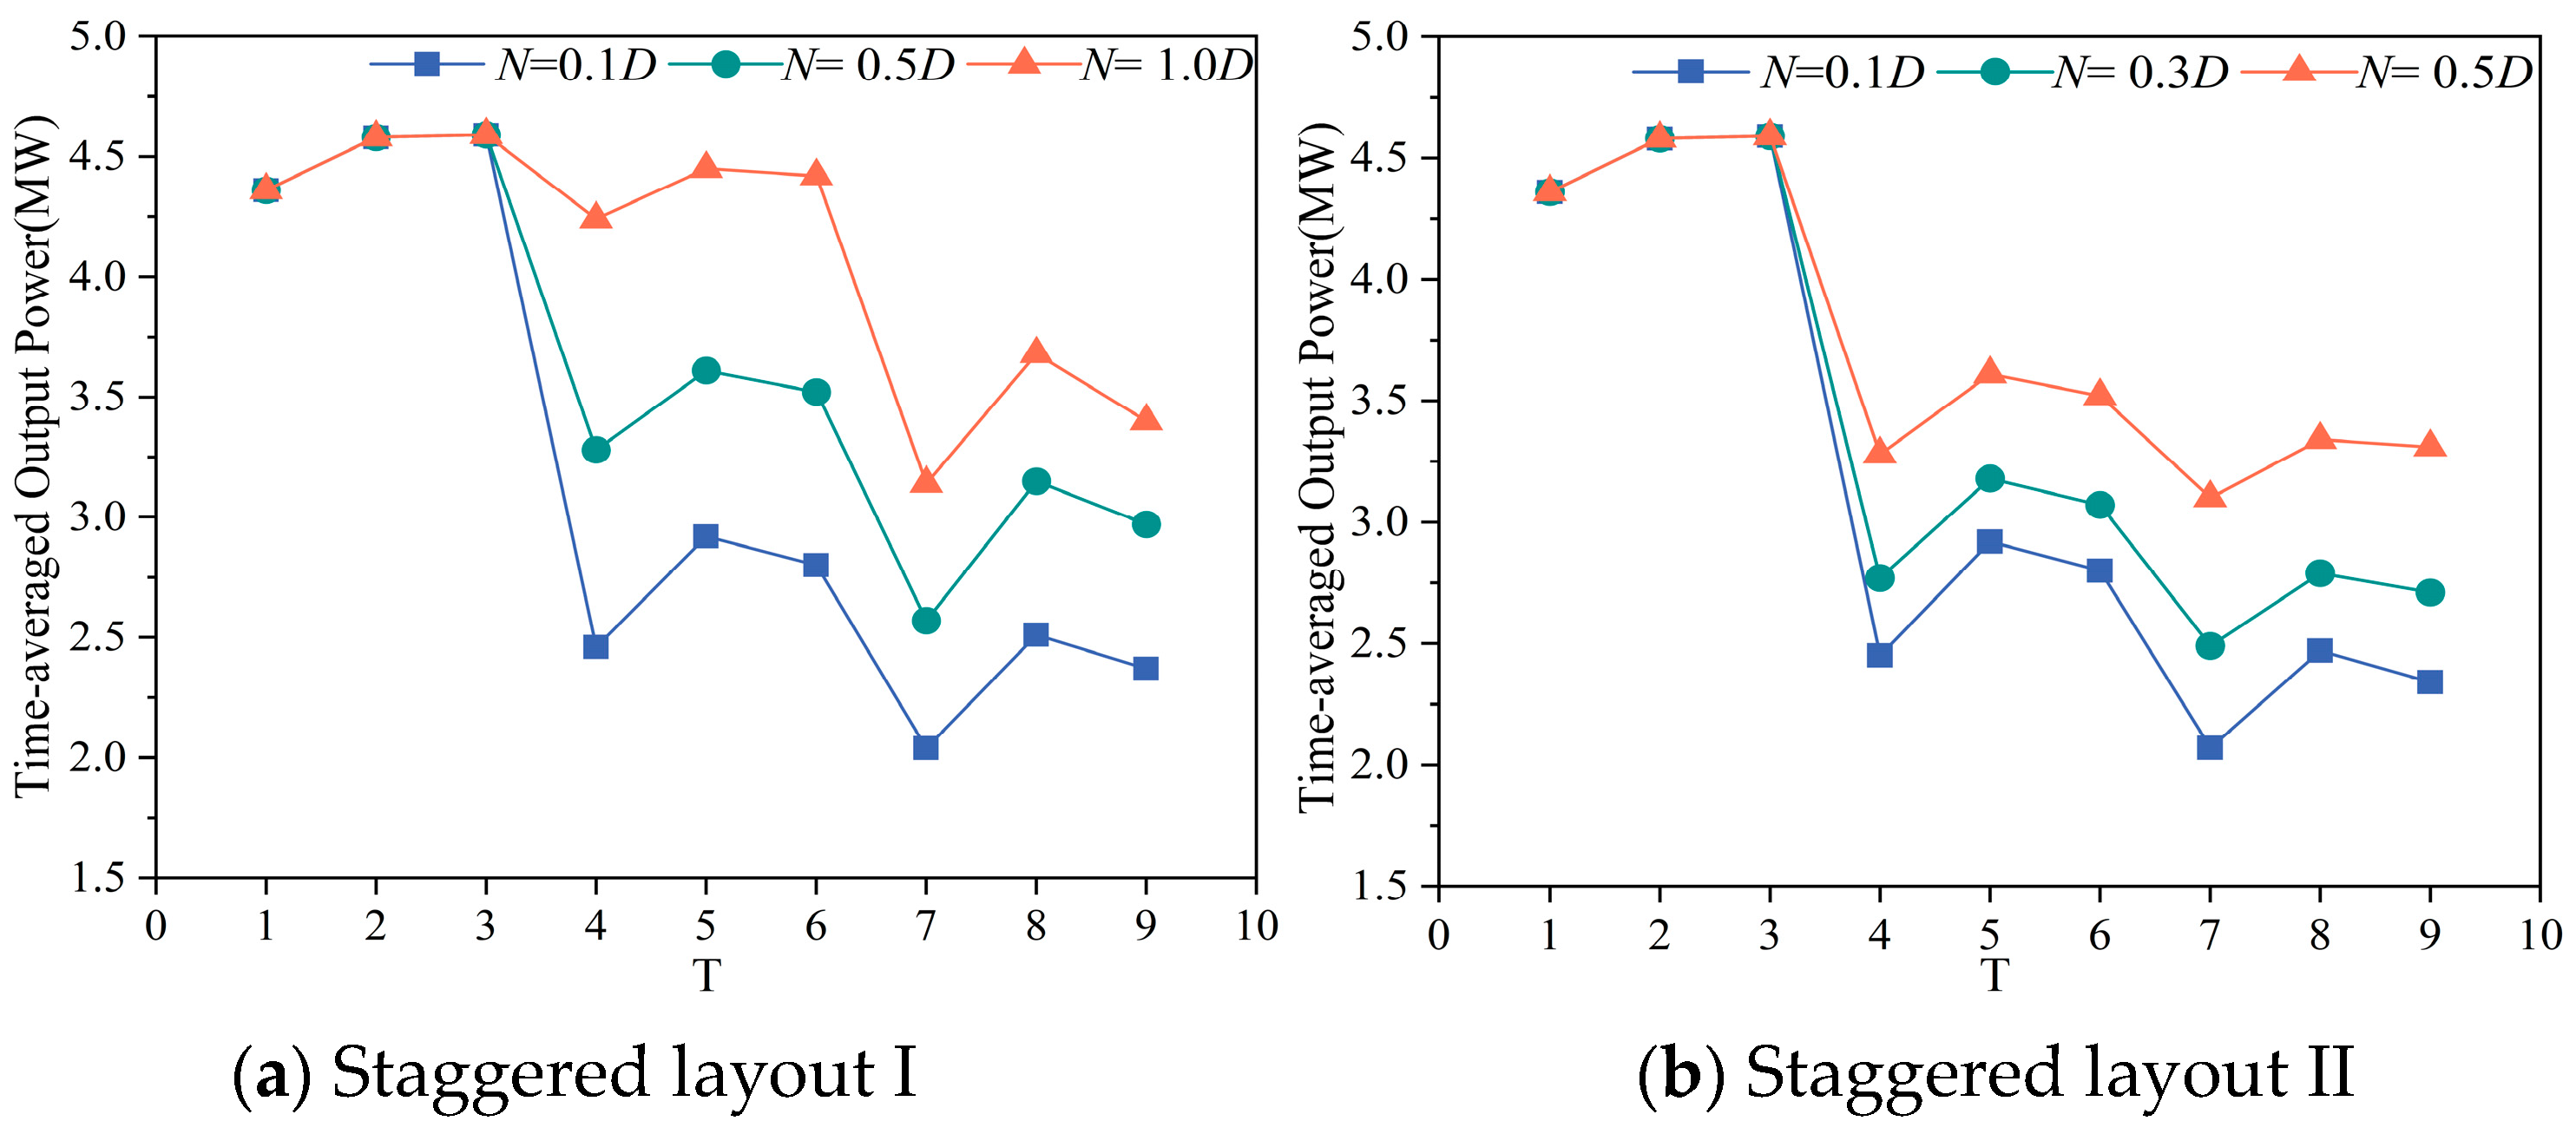
This subsection modifies the square layout described earlier by implementing staggered layout for the nine wind turbines within the wind farm, categorized as staggered layout I and II. The specific layouts are illustrated in Figure 6c,d. The comparison shows that the UWTs in both staggered layouts are identical to those of the square one. The difference lies in the layout of the mid-downstream turbines. Furthermore, when staggered spacing is set to N = 0.1D for both staggered layouts, the MWT arrangements are identical, differing only in the DWTs. When N = 0.1D, the DWTs in staggered layout I are not staggered. In contrast, those in staggered layout II are staggered with 0.2D spacing. This reduces the wake effects of the U-MWTs on the DWTs. However, in the case of small N, the increase in the time-averaged output power of the downstream turbines is insignificant. Comparing the total output power data of the wind farm under staggered layouts in Table 4, the total output power under staggered layout II is slightly greater than I. Additionally, there is an initial increase followed by a decrease as I and M increase. Specifically, with M = 5D and I = 15%, the total output power of the wind farm with staggered layout I is slightly greater than that of staggered layout II. This occurs because as I and M increase, the UWT wake influence on DWTs progressively diminishes. The output power of the DWTs is primarily influenced by the wake of the MWTs. N = 0.2D in the staggered layout I is greater than N = 0.1D in the staggered layout II. Therefore, the DWTs in the staggered layout II have a good influence on the MWTs.
As N increases, the total output power of the wind farm exhibits a substantial rise. When M = 5D and I = 15%, under staggered layout I, increasing N from 0.1D to 1.0D raises the total output power from 28.61 MW to 36.84 MW, representing a 28.76% increase. For staggered layout II, increasing N from 0.1D to 0.5D resulted in the total output power rising from 28.56 MW to 33.68 MW representing a 17.93% increase. A comparison of Figure 12a,b reveals that the two staggered layouts differ only in time-averaged output power of the M-DWTs. It has been demonstrated that time-averaged output power increases with the increase in N, and the rate of increase also grows accordingly. The observed increase in total output power of wind farm with the increasing of N can be attributed primarily to the reduction in wake effects on M-DWTs that results from a larger N. In turn, this leads to an enhancement in their time-averaged output power. As demonstrated in Figure 12a, when N = 1.0D, the time-averaged output power of the MWT approaches that of the UWT. This phenomenon signifies that the MWT has migrated beyond the core influence zone of the UWT wake, thereby enabling its time-averaged output power to undergo a recovery phase. Concurrently, the DWT continues to be influenced by the UWT wake. However, due to the substantial spacing between the two wind turbines (10D), the wake undergoes a protracted recovery evolution before reaching the DWT. By this time, wind velocity has significantly recovered, leading to an increase in the time-averaged output power of the DWT. As demonstrated in Figure 12b, when the staggered row spacing is 0.5D, the time-averaged output power of the DWT approaches that of the MWT. This phenomenon occurs because, at smaller staggered row spacing, the DWT is subjected to the effects of the wake merging from the U-MWTs. The wake core region demonstrates a substantial decrease in velocity, resulting in a notable decline in the time-averaged output power of the DWT. As N increases, the wake trajectory of the MWT gradually deviates from the center position of the DWT. This phenomenon leads to the DWT gradual departure from the primary influence zone of the MWT wake, resulting in a steady augmentation in the time-averaged output power of DWT.
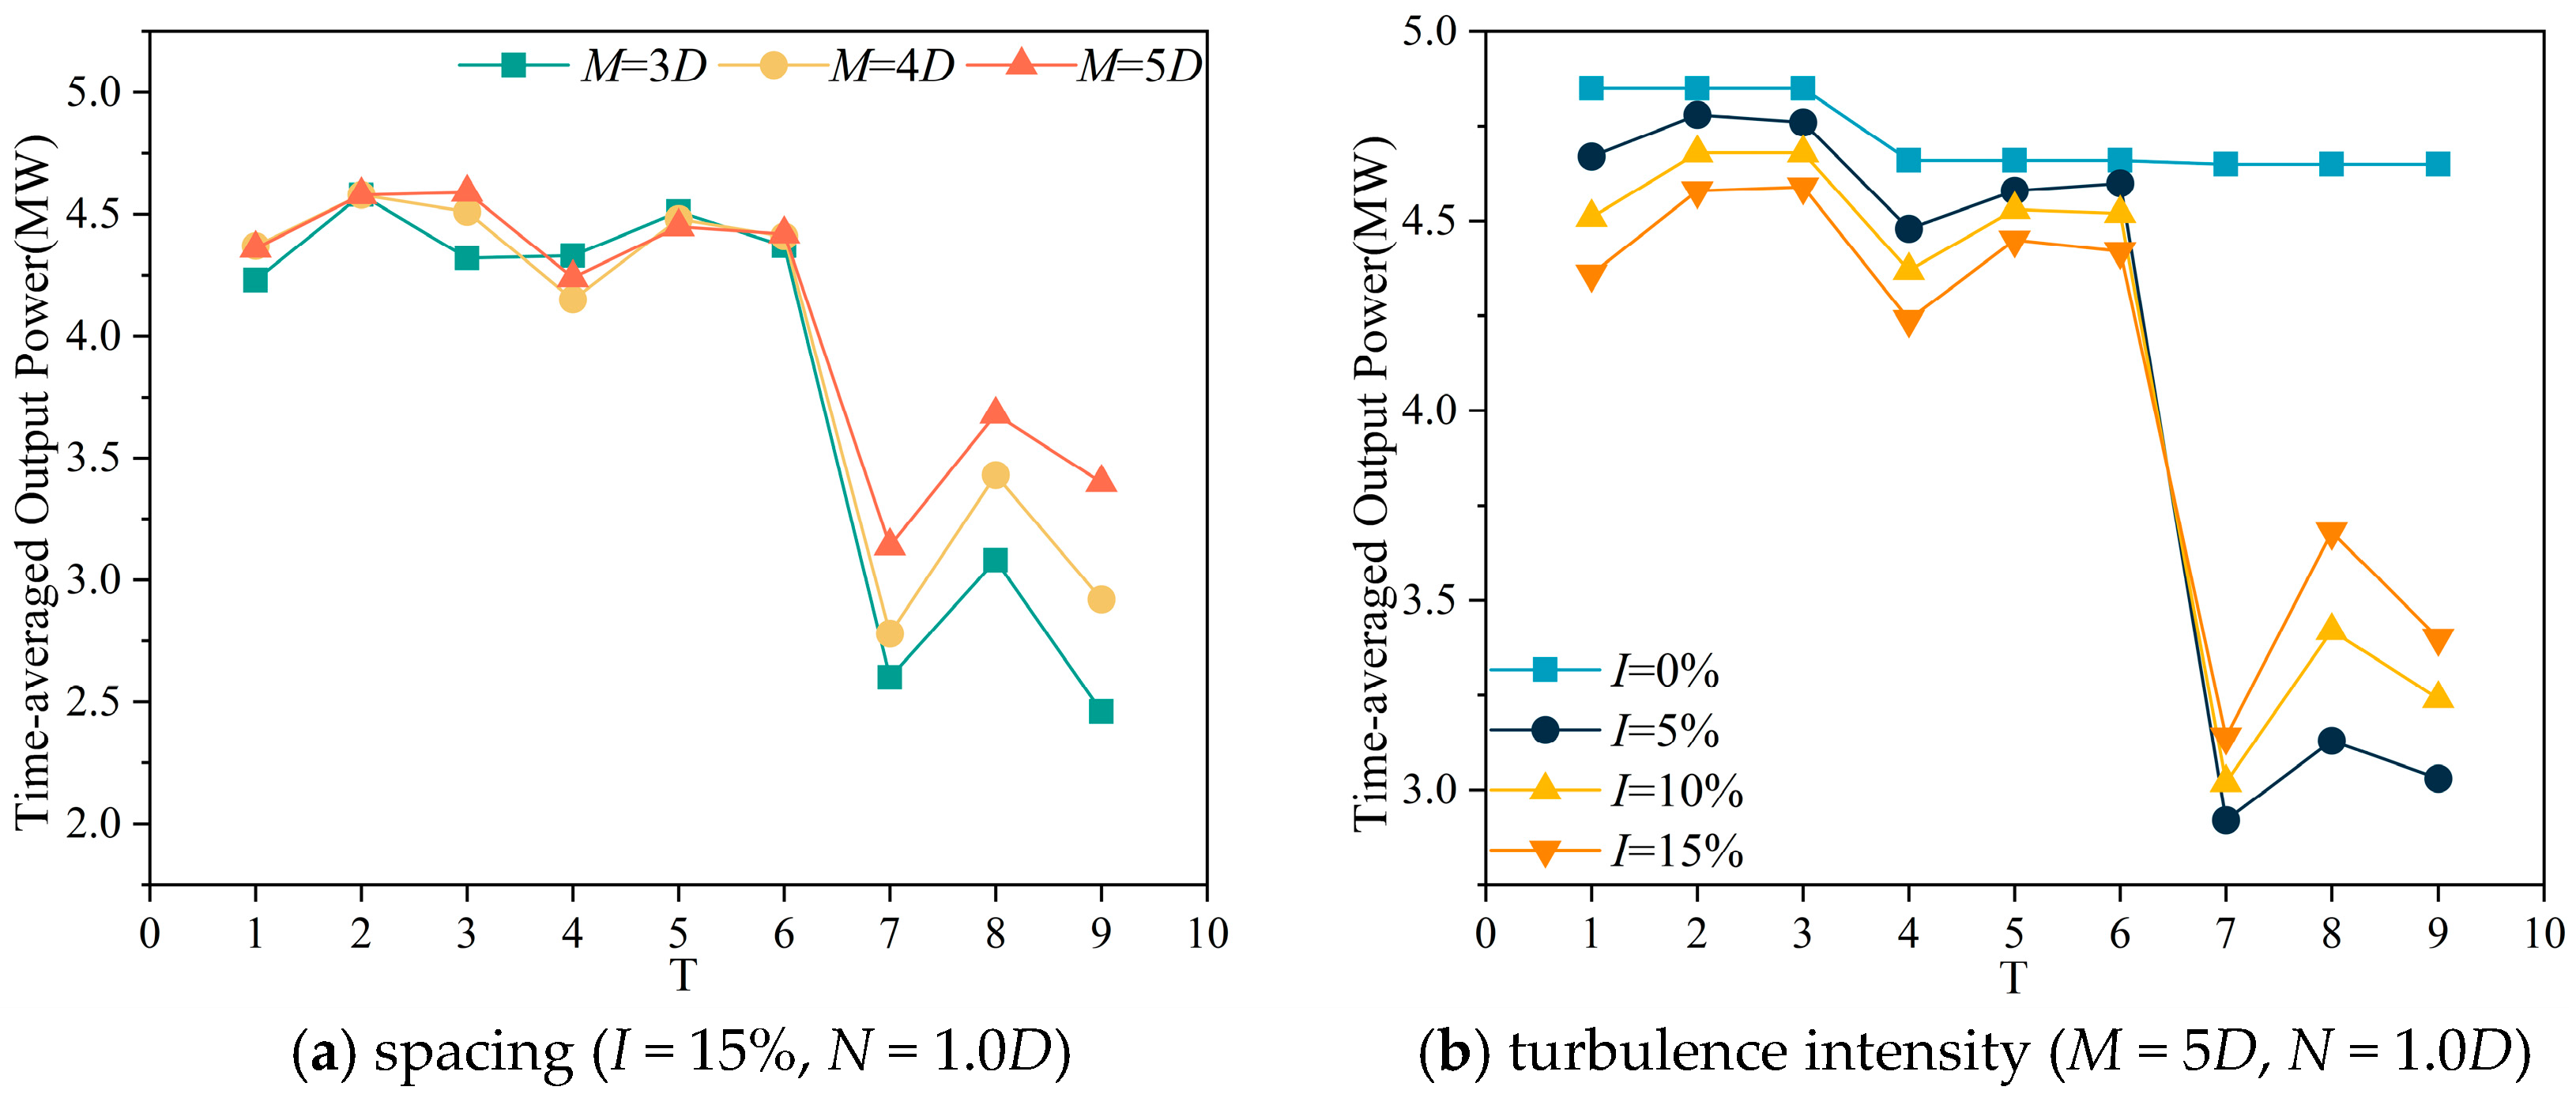
As demonstrated in Table 4, M increases cause a corresponding rise in the total output power of wind farm in the cases of both staggered layouts. However, this increase is not statistically substantial. The unique aspect is that when the wind farm adopts staggered layout I with N = 1.0D and I = 0%, increasing the M from 3D to 4D lead to the total output power from 35.40 MW to 36.50 MW, only increase of 3.11%. However, as M increases from 4D to 5D, the total output power of the wind farm exhibits a substantial increase, rising from 36.50 MW to 42.48 MW, an increase of 16.38%.
As M increases, the difference in time-averaged output power between the U-MWTs gradually decreases. The primary variation is observed in the time-averaged output power of the DWTs, which are affected by the wakes of the U-MWTs. As shows in Figure 13a, an increase in total wind farm output power occurs when M increases from 4D to 5D, primarily due to a rise in the time-averaged power output of DWTs. Furthermore, a comparison of the time-averaged output power of wind turbines under different turbulence intensities in Figure 13b shows that the time-averaged power output of the DWTs is nearly equal to that of the MWTs and slightly lower than that of the UWTs at I = 0%. This indicates that, under these cases, the DWTs are nearly unaffected by the wakes of the U-MWTs. Consequently, the change in M from 4D to 5D substantially increases the total output power of the wind farm.
Similar to the increase in M, the total output power of wind farms under both staggered layouts shows an improvement as I increases, though the increase is limited. The total output power of the wind farm increases as I increases in most cases. However, when N is large, it is observed that the total output power of the wind farm at I = 0% exceeds that achieved at higher I cases. Figure 13b shows that comparing the time-averaged output power of wind turbines under different turbulence intensities at M = 5D and N = 1.0D reveals the following, when I = 0%, the time-averaged output power of each wind turbine exceeds that in the case of higher I. The enhanced time-averaged output power of DWTs is the primary contributor to the increase in the wind farm total output power. When I ≠ 0%, the difference in time-averaged output power between the U-MWTs is negligible indicating that the MWTs are nearly unaffected by the upstream wake. Conversely, the wake from U-MWTs continues to impact DWTs, causing a sharp drop in their time-averaged output power. This aligns with the pattern observed in the previous analysis, the time-averaged output power of the DWTs increases as I increases.

4.3.2. Wake Characteristic

Similar to the square layout I, the three middle wind turbines (T2, T5 and T8) in the case of M = 5D and I = 15% are selected to investigate the wake evolution under two staggered layouts. Normalized velocity deficit of the wind turbine wake is shown in Figure 14. In staggered layout I, the MWT experiences only minor influence from the UWT wake. After traveling a long distance (10D), the UWT wake recovers to 83.81% of the free-stream velocity by the time it reaches the DWT. Additionally, the time-averaged power output of the DWT shows a slight decrease due to the influence of the MWT wake.
Comparing the wake velocity profile in staggered layout I and square layout, the UWT wake evolves to the same profile prior to the MWT position. However, in the staggered layout I, the MWT is offset by 1D. The UWT wake fully evolves before reaching the DWT. The MWT displays a double-Gaussian distribution in its wake velocity profile, while the UWT wake generates a single-Gaussian distribution between x/D = 6 and x/D = 9. The aforementioned assertion is applicable to the DWT as well. Consequently, in scenarios where x/D > 5, the wake velocity profile manifests a “triple-Gaussian” distribution state. To investigate the recovery of wind turbine wakes, the wake velocity deficit differences measured at 4D spacing for different wind turbines are found to be: ∆U4/U − ∆U1/U = 0.039, ∆U9/U − ∆U6/U = 0.067 and ∆U14/U − ∆U11/U = 0.099, respectively. A comparison of the square layout with the UWT wake recovery rate reveals that there is no alteration in the wake recovery rate. However, the MWT experiences substantially reduced wake influence from the UWT. This reduced influence leads to diminished turbulence intensity in its wake zone and consequently slowed wake recovery. Conversely, the DWT encounters diminished wake influence from both U-MWTs, leading to a modest deceleration of its wake recovery.
A more thorough examination of the wake velocity deficit slices is depicted in Figure 15, and the wake velocity deficit slices from the U-MWTs coalesce at x/D = 6, thus indicating that the MWT remains influenced by the UWT wake. Figure 14 indicates that the separation of the two slices is attributable to the meandering behavior of the UWT wake at x/D = 7. Subsequently, as the UWT wake evolves, the slices return to a coalesced state. Comparing the wake velocity deficit slices at x/D = 6 reveals that the MWT wake velocity deficit difference is 0.064. This indicates that the MWT wake velocity deficit is reduced by 13.47% in staggered layout I compared to the square layout, while the DWT wake velocity deficit is only reduced by 5.02%. Consequently, the MWT in staggered layout I contributes the primary portion to the increase in the wind farm total output power.
The M-DWTs are more strongly affected by the wake effect in the staggered layout II than that of the staggered layout I, as illustrated in Figure 14 and Figure 16. This phenomenon occurs because the UWT wake mixes with the boundary of the MWT wake, creating a more complex wake region that enlarges the midstream wake zone. DWTs exhibit a similar trend. The wake velocity profile demonstrates the normal transition from the double-Gaussian distribution to the single-Gaussian distribution beyond x/D = 5, in contrast to the staggered layout I, as shown in Figure 16. But the examination of the wake velocity profile at x/D = 6 indicates that the double-Gaussian distribution is asymmetrical, with a greater tendency to lean toward the UWT wake direction. With a higher peak value on this direction than the opposite direction. This phenomenon occurs because the UWT wake, which has substantially recovered by the time it reaches the MWT, mixes with the MWT wake. This results in an increase in wake velocity deficit on the MWT direction, consistent with the result of LES [12]. To investigate the recovery of wind turbine wakes, the wake velocity deficit differences measured within the 4D spacing for different wind turbines are found to be: ∆U4/U − ∆U1/U = 0.039, ∆U9U − ∆U6/U = 0.101 and ∆U14/U − ∆U11/U = 0.133, respectively. The findings indicate that the staggered layout II demonstrates the most rapid wake recovery rate. This phenomenon is attributed to the UWT wake, which has been observed to enhance the turbulence intensity within the MWT wake zone. Concurrently, the wake’s influence range is found to be expanded, thus accelerating the recovery process.
By examining the longitudinal profile of the MWT wake velocity deficit in Figure 17, it can be observed that the wake from the UWT gradually merges with that of the MWT as the wake evolves. The wake slice of the MWT undergoes a gradual transition from circular shape to elliptical shape one, indicative of a shift in its wake toward the positive y-axis direction. Simultaneously, comparing the longitudinal profile of the DWT wake velocity deficit reveals that the MWT wake exhibits a meandering trend along the positive y-axis direction. As the DWT wake evolves, the final wake gradually develops toward the direction of the UWT and DWT.

4.4. Rotor Thrust and Fatigue Load Analysis

Fatigue damage accumulation is a critical consideration in wind turbine design, particularly for blade root bending moments, which endure complex cyclic loading patterns due to turbulent wind effects.
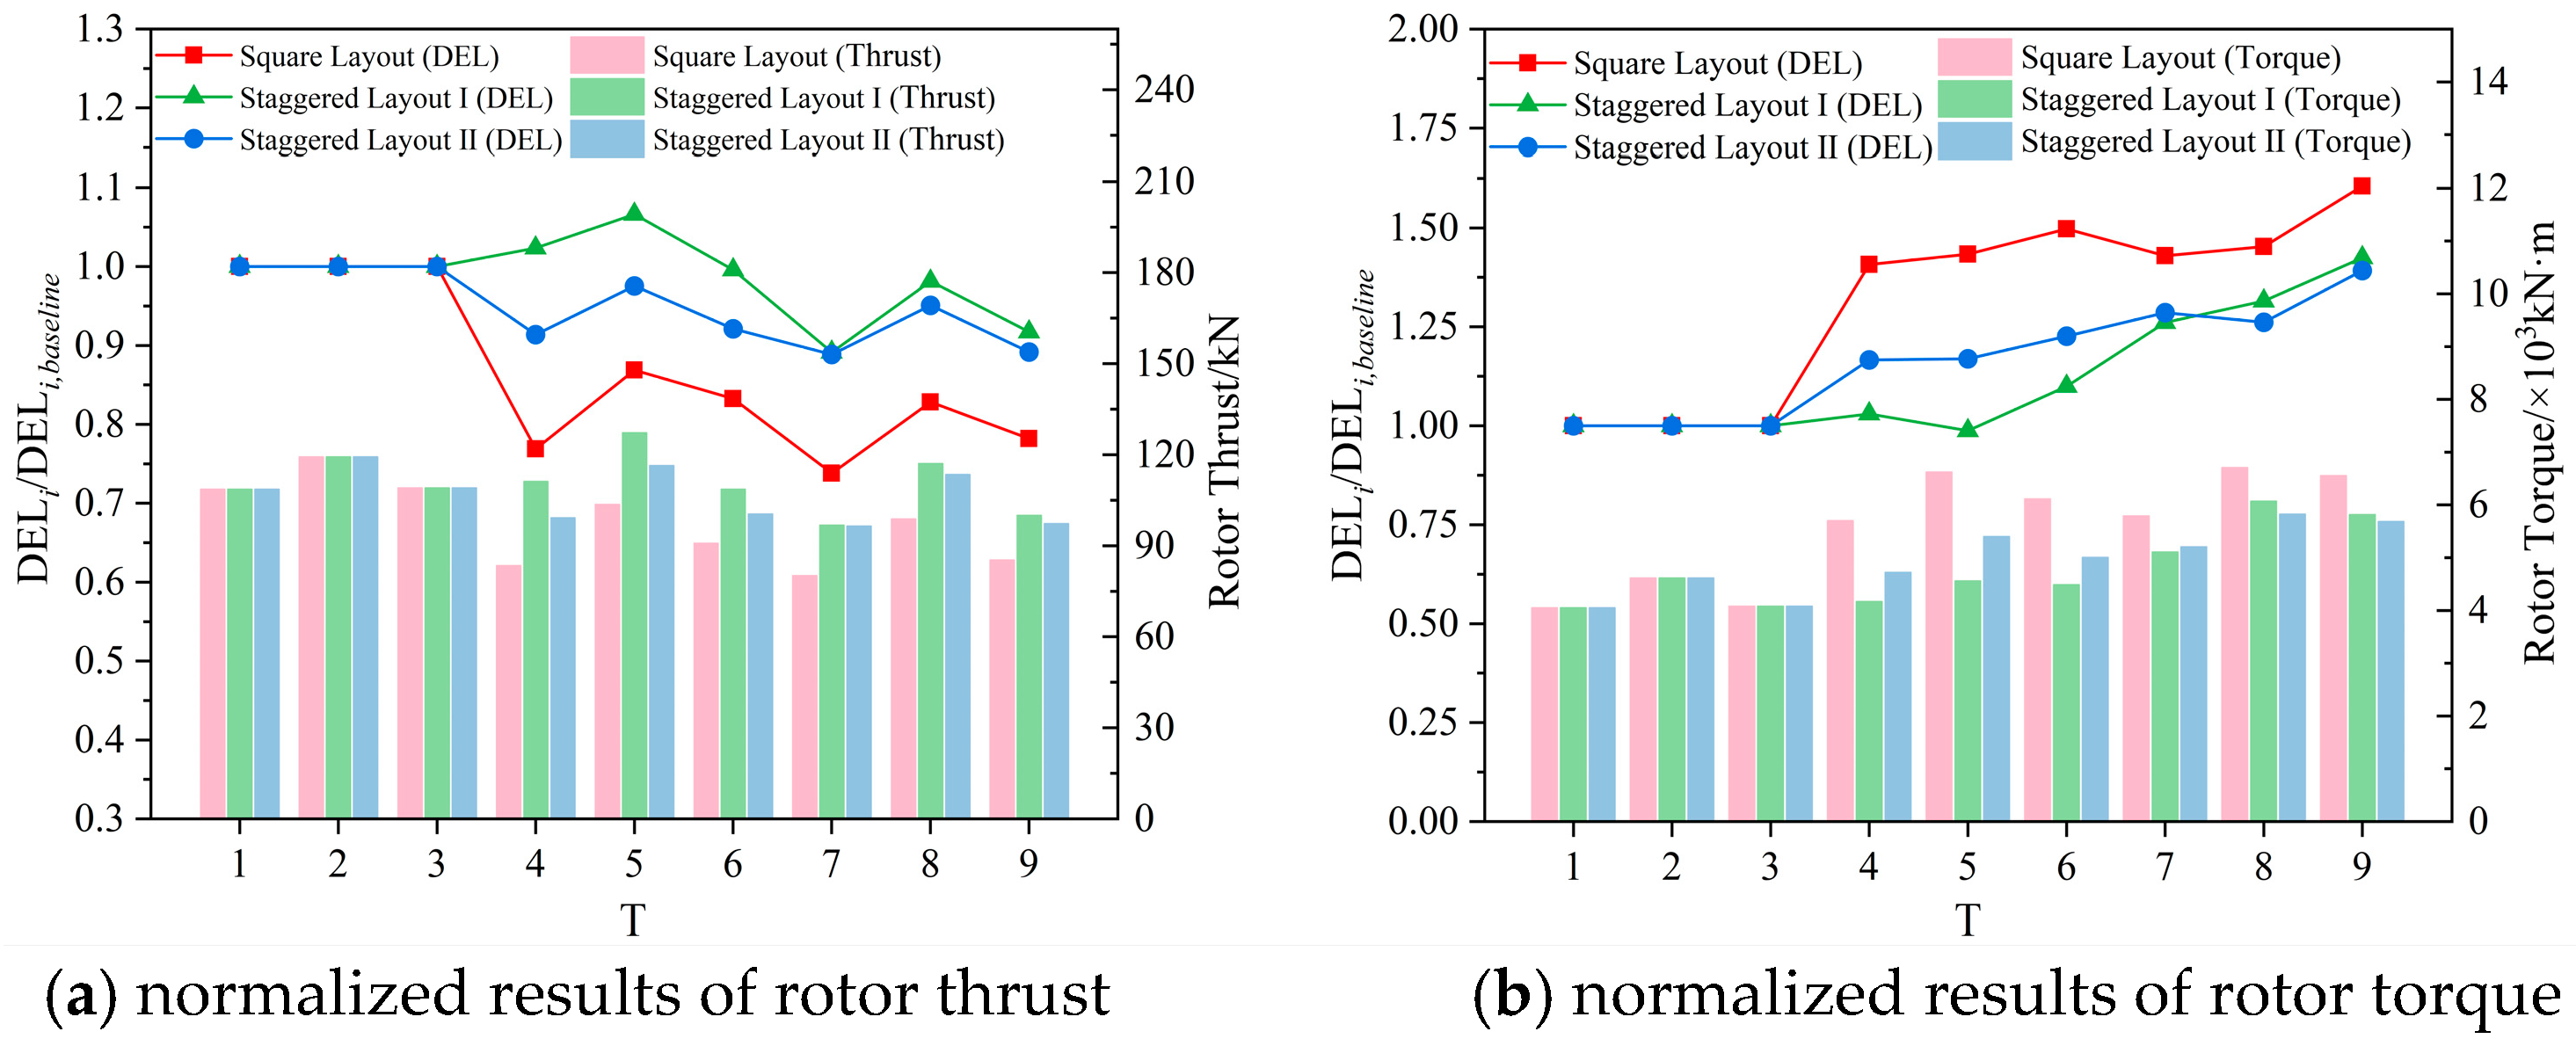
Figure 18a presents the normalized results of the time-averaged rotor thrust for three different layouts in the case of M = 5D and I = 15%, with the thrust of the first wind turbine in each row used as the baseline value. The trends observed are consistent with the conclusions drawn from the power and wake analysis. Due to 1D stagger of the MWTs in staggered layout I, the MWT experiences substantially reduced wake interference from the UWT, resulting in a substantial increase in its time-averaged rotor thrust (up to 33.53% higher than in the square layout). Notably, in staggered layout I, the MWT exhibits a higher time-averaged thrust than the UWT, yet the time-averaged output power is slightly lower. This occurs because the MWT is not fully situated within the core low-velocity region of the UWT’s wake, but rather within the high-velocity shear layer at the edge of the upstream wake. The complex turbulent flow field in this region causes a substantial rise in the effective angle of attack across portions of the blade, leading to enhanced lift and corresponding thrust. Additionally, the wake from the UWT greatly enhances turbulence intensity within the farm. High turbulence intensity causes the inflow wind to the rotor plane of MWTs to exhibit not only velocity irregularities but also rapid directional shifts toward high turbulence intensity. This causes the airflow to adhere to the blade surface earlier, delaying and suppressing flow separation. Consequently, the blades maintain efficient lift at higher angles of attack, which improves rotor thrust.
Additionally, the normalized DEL at the blade root for wind turbines in the three different layouts under M = 5D and I = 15% is presented in Figure 18b, normalized against the DEL of the first wind turbine in each row. Due to the wake effects, the DEL values increase from upstream to DWTs in all layouts, consistent with findings in the literature [19]. The staggered layouts substantially reduce the DEL, suggesting longer wind turbine lifespan and lower maintenance costs, with staggered layout I being more effective. Under normal uniform flow, time-averaged thrust and DEL are typically positively correlated. However, in this work, a negative correlation is observed. This is primarily due to the stress stiffening effect from high mean thrust, a substantial increase in thrust implies high average axial loads on the blades, tensioning them like a taut string and increasing their stiffness. This effect suppresses the blade’s low-frequency flap-wise motion. Research has shown that higher mean thrust stiffens the turbine blade and leads to lower low-frequency oscillations and consequently reduces DEL [42,43]. Although gravity-induced bending fluctuations are superimposed on this mean load, the alternating stress amplitude (key to DEL calculation) may not increase proportionally, and its relative value might even decrease. Furthermore, the coherence structures in the incoming flow are disrupted by the UWT wake, which breaks up the inflow wind into small-scale, anisotropic turbulence. This reduces large-amplitude, low-frequency fluctuations, replacing them with numerous small-amplitude, high-frequency fluctuations, leading to a reduction in DEL.

4.5. Wake Entropy Analysis

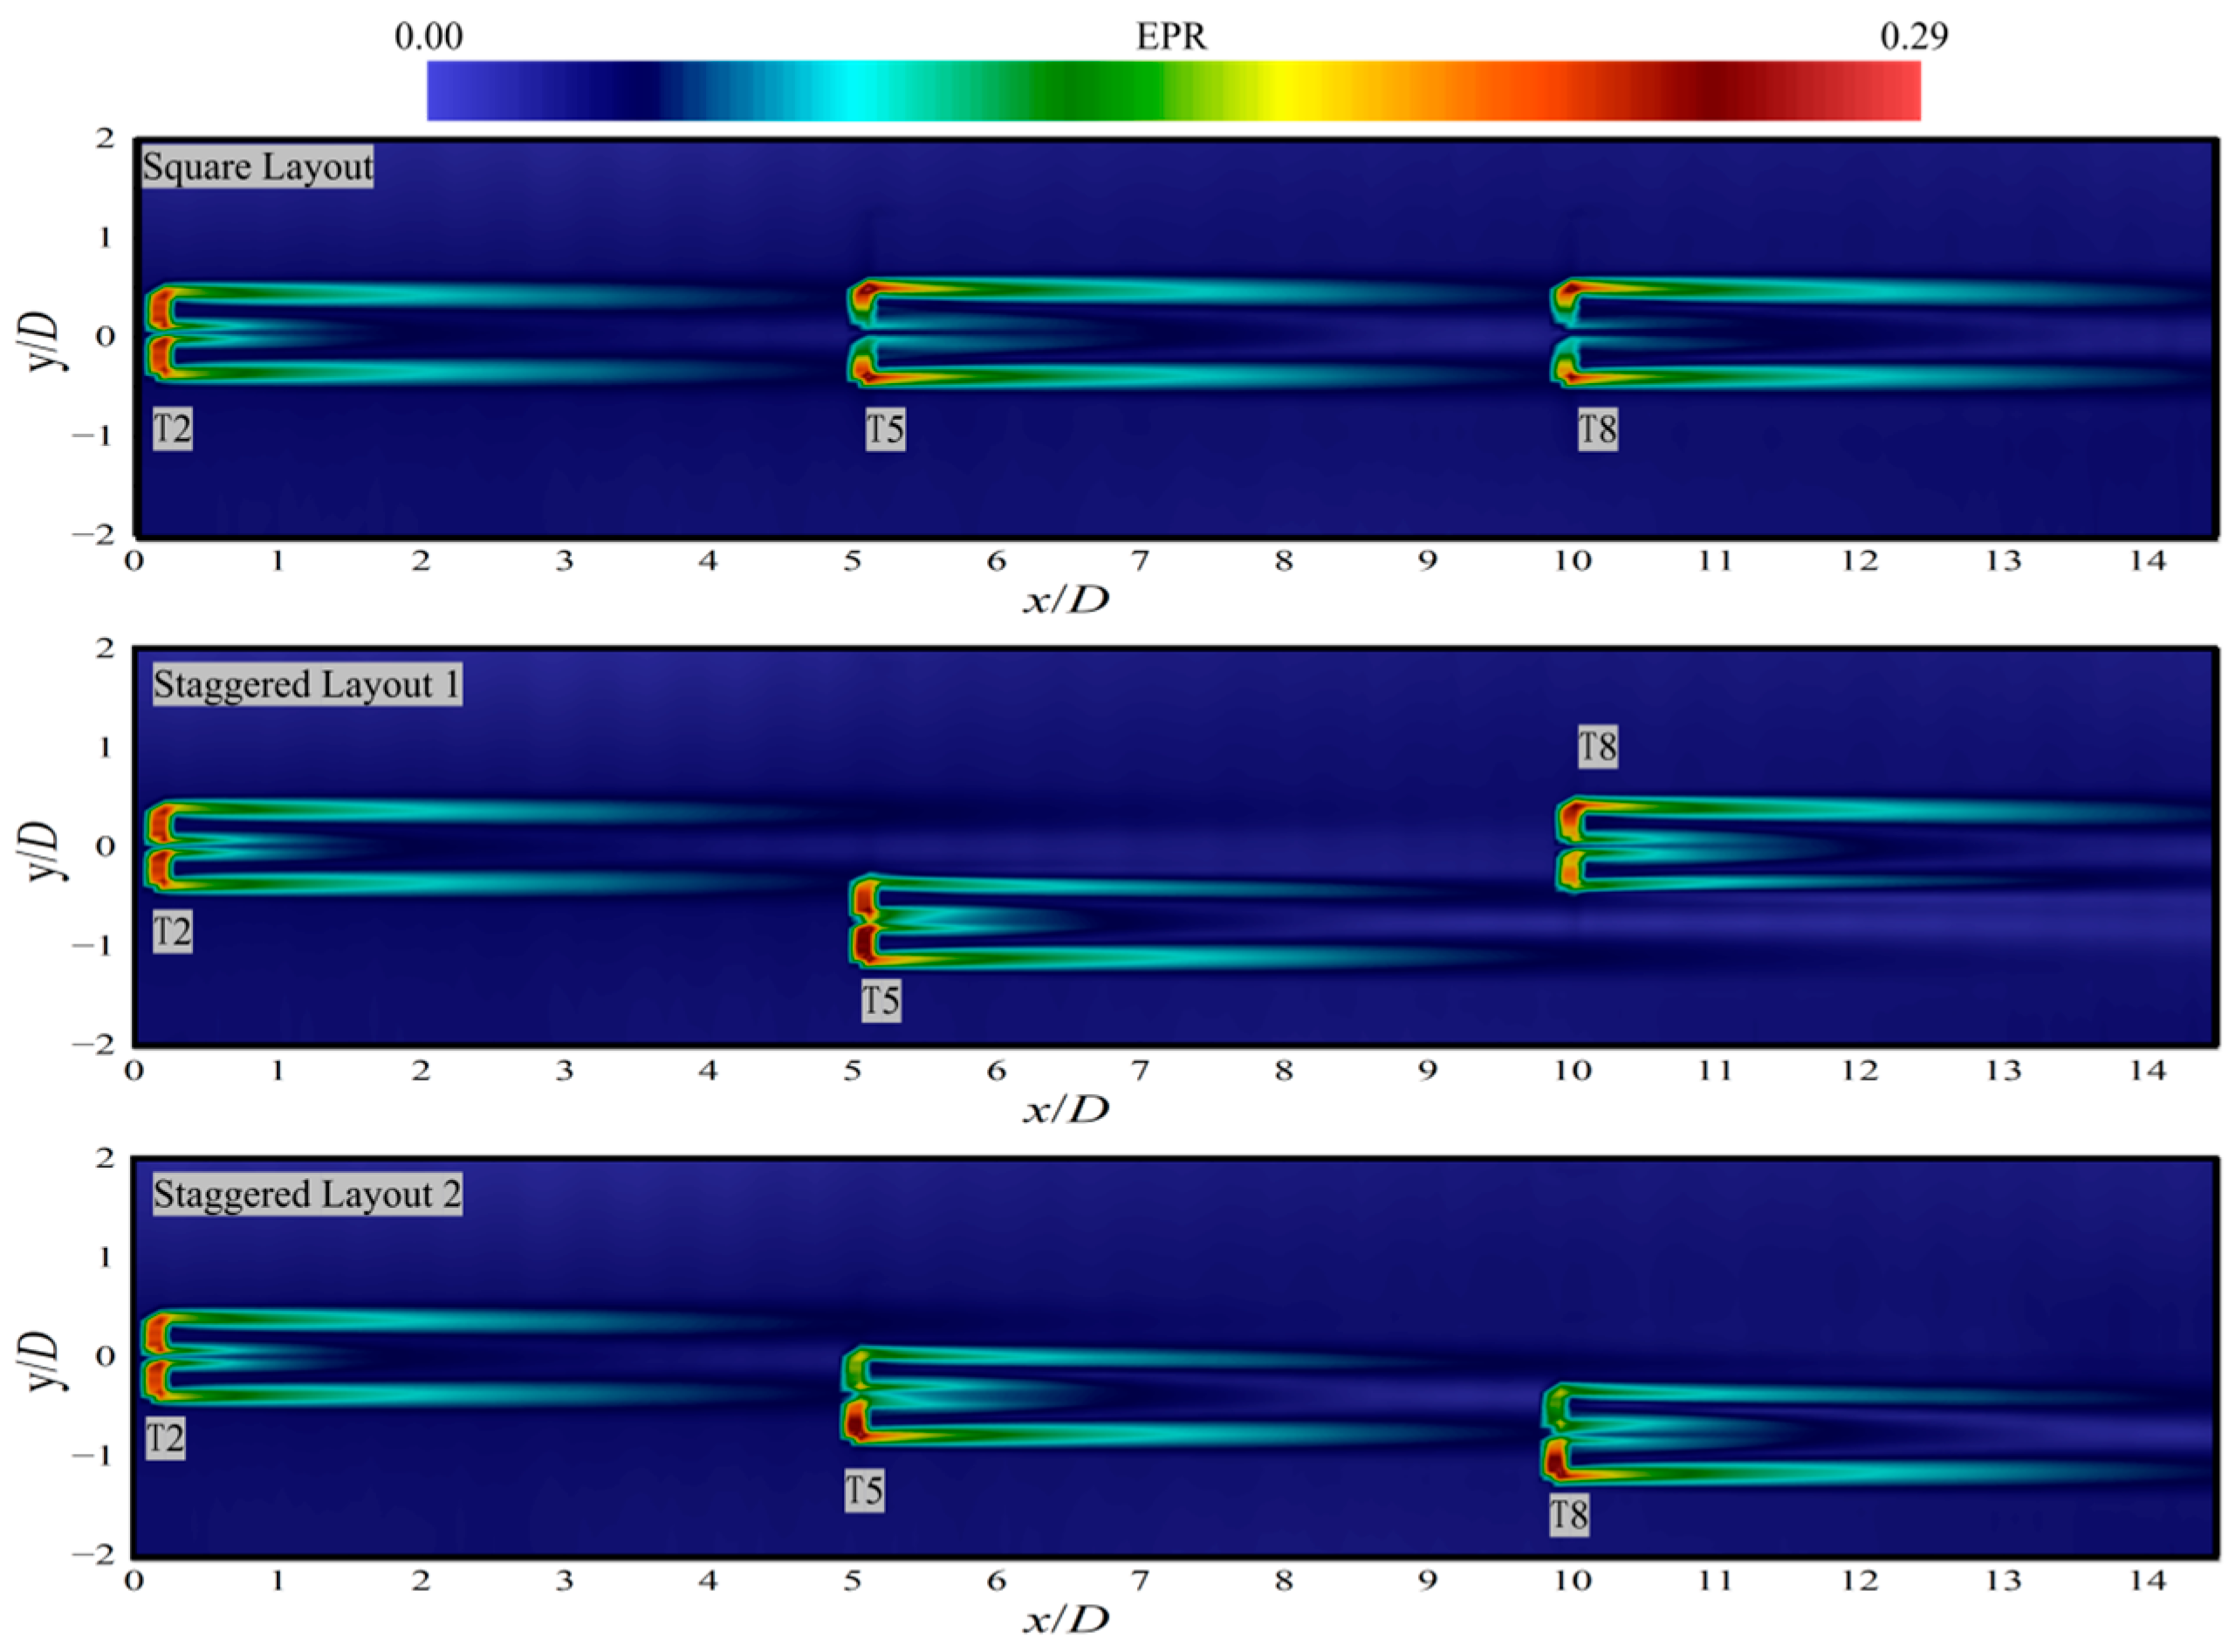
In addition, the present study employs entropy production theory to analyze wind turbine wakes, with the objective of investigating energy deficit and recovery. In comparison with conventional analytical methodologies, entropy production analysis offers a more intuitive depiction of the specific locations where energy dissipation occurs within the flow field of wind farms. Similar to the aforementioned analysis, the three wind turbines in the middle row (T2, T5, T8) in the cases of M = 5D and I = 15% are selected to conduct entropy production rate analysis on the wakes of the wind turbines under three layout configurations. The entropy production rate results ranging from 3000 to 4000 are subjected to time-averaging processing, with the time-averaged results displayed in Figure 19. Through the distribution of EPR, it is evident that there is a close spatial relationship between the high-EPR regions and the wake dissipation areas in the square, staggered layout I, and staggered layout II.
In the square layout, the high-EPR regions are primarily concentrated around the turbine rotors and the core wake region, where the greatest energy loss and entropy production occur. The energy dissipation in the wake expansion zone is more concentrated, leading to slower wake recovery in this layout. The high-EPR region extends almost along the entire wake zone behind the wind turbine. Specifically, for the UWT (T2), the entropy production exhibits a symmetric distribution, which decreases as the wake propagates downstream. Due to the mixing of the wake with the external flow, the velocity deficit decreases and shear weakens, with the entropy production rate dropping from 22.36% to 8.21% from x = 0D to x = 5D. At x = 5D, the wake is influenced by T5, where the entropy production rate sharply increases to 26.48%, and as the wake propagates to x = 10D, the entropy production rate decreases to 7.56%. In the downstream wake zone, the entropy production distribution is similar to the midstream, with a sharp increase to 24.79% at x = 10D due to the influence of T8, and it decreases to 7.87% as the wake evolves to x = 15D. These results show a similar trend to the wake deficit analysis, indicating that the mixing of high velocity external flow with low velocity wake flow and the diffusion effect of turbulence accelerate the energy exchange between the wake region and the external flow, leading to a faster reduction in entropy production.
Compared with the square layout, both staggered layout I and staggered layout II show more dispersed high-EPR regions, suggesting that through proper wind turbine arrangement, the high energy dissipation zones in the wake core can be reduced, thus improving energy recovery efficiency. In these layouts, the energy loss in the wake area gradually decreases, and the wake recovery speed increases. Specifically, compared to T5, the overall entropy production rate in the wake area is lower than in the square layout, and the entropy production distribution loses its symmetry. The side affected more by the UWT wake shows a significantly larger rate of entropy decay. In staggered layout I, from x = 5D to x = 10D, the entropy production rate drops from 28.57% to 2.04%. Due to the smaller N = 0.5D in staggered layout II, the wake recovery is more significantly affected by wake merging, and the recovery speed is slower. From x = 5D to x = 10D, the average entropy production rate drops from 26.14% to 2.16%. The decay rate of entropy production rate under staggered layout I is greater than that of staggered layout II, consistent with the conclusion reported in Section 4.3.2. In comparison to T8, the wake region in staggered layout II is similar to that of T5. The difference lies in staggered layout I, where T8, located downstream in the wind farm and with a larger distance from UWT (10D), experiences lower turbulence intensity in the wake zone, resulting in relatively less energy loss. Since the wake has partially recovered in the T5 region, T8’s wake recovery is faster, with lower EPR values, indicating reduced energy loss. The energy in the wake region is recovered more rapidly through the mixing of high external flow speed with low-velocity wake fluid, thereby reducing irreversible energy losses.

5. Conclusions

As the development of wind farms continues to accelerate, there is an increasing need to optimize wind farm layouts to mitigate wake losses and improve overall energy efficiency. In this study, a 3 × 3 wind farm model is established to investigate the effects of layout configuration, turbulence intensity, and turbine spacing on wake evolution and power performance. To achieve this, numerical simulations are conducted for square, diamond, and staggered layouts based on the NREL-5 MW wind turbine, using the SST k-ω turbulence model to capture wake dynamics with high fidelity. In addition, entropy generation analysis is introduced to reveal the mechanisms of irreversible energy loss from a thermodynamic perspective, while the evaluation of DEL provides valuable insights into structural fatigue and load mitigation. The analysis focuses on elucidating the coupled mechanisms through which layout configurations and wind flow conditions interact to influence output power and fatigue loading. The key findings and conclusions of this research are summarized below:
Staggered layout I manifests the most salient optimization effect. In staggered layout I, with M = 5D, N = 1.0D, I = 15%, the total output power achieves 36.84 MW, marking a 28.76% increase in comparison to the square layout. This enhancement is attributed to the effective mitigation of the impact of wake merging. Staggered layout I can also substantially reduce DEL at the blade root by altering load mechanisms, thereby enhancing efficiency while extending turbine lifespan.
Turbulence intensity exerts a dual influence on wind farm performance. While higher turbulence intensity (I = 15%) reduces the output power of UWTs by up to 14.65% compared to uniform flow, it simultaneously enhances wake recovery by promotes energy exchange between the wake region and the external flow. The wake recovery velocity within 4D increasing by 20~30%, leading to a 40.2% power increase in M-DWTs. The total output power rises with increasing I, reaching a maximum of 6.55% above the baseline.
Increasing the wind turbine spacing from 3D to 5D significantly enhances the output power of the wind farm. In the square layout, the output power of M-DWTs rises by 46.15% and 66.67%, respectively. In the staggered layout, enlarging M from 3D to 5D results in a 16.38% total power increase, primarily due to the displacement of DWT from the core wake region. Additionally, wake effect between wind turbine rows becomes negligible when M ≥ 2.5D, and the wake velocity deficit is reduced by 13.47% when staggered spacing is set to N = 0.1D, because the MWTs are separated from the upstream wake core zone.
High entropy production rate regions have been observed to be concentrated in the vicinity of the rotor and in the wake shear layer. These areas exhibit the most significant irreversible energy dissipation due to intense turbulent mixing and shear action. The staggered layout I effectively accelerates the reduction in local entropy production rate, thereby decreasing overall irreversible energy deficit. This further validates the advantage of this layout from the perspective of entropy production theory.
The findings offer practical guidance for turbine placement, wake mitigation, and fatigue load reduction in large-scale wind farms, providing a robust thermodynamic basis for future optimization.

Author Contributions

Conceptualization, G.W. and J.T.; Methodology, G.W., Z.Z. and J.T.; Software, G.W.; Validation, G.W., J.H., Z.Z. and Z.H.; Formal analysis, G.W. and Z.Z.; Investigation, G.W., Z.Z., K.C. and Z.S.; Resources, Z.H.; Data curation, G.W. and J.H.; Writing—original draft, G.W.; Writing—review & editing, G.W., J.H., J.T. and Z.H.; Visualization, G.W. and J.H.; Supervision, K.C. and J.T.; Project administration, Z.S., J.T. and Z.H.; Funding acquisition, J.T. and Z.H. All authors have read and agreed to the published version of the manuscript.

Funding

The financial support from the National Key R&D Program of China (No. 2024YFE0101200), National Natural Science Foundation of China (Nos. 52371285, 52271284, 52088102), Hunan Provincial Natural Science Foundation Project (Nos. 2025JJ50306, 2022JJ50038), and Guangdong Basic and Applied Basic Research Foundation (No. 2022A1515240077) are gratefully acknowledged.

Data Availability Statement

The original contributions presented in this study are included in the article material. Further inquiries can be directed to the corresponding author.

Conflicts of Interest

Author Kang Chen was employed by the company Changsha Xintian Surveying and Designing Co., Ltd. The remaining authors declare that the research was conducted in the absence of any commercial or financial relationships that could be construed as a potential conflict of interest.

References

  1. Steen, M.; Mäkitie, T.; Hanson, J.; Normann, H.E. Developing the industrial capacity for energy transitions: Resource formation for offshore wind in Europe. Environ. Innov. Soc. Transit. 2024, 53, 2210–4224. [Google Scholar] [CrossRef]
  2. Bai, H.; Zhang, J.H.; Ma, G.; Sun, K.; Kang, W.H.; Lai, Y.; Chen, Y.; Zhu, R.H. Structural modeling and optimization design of 15MW semi-submersible floating wind turbine platform based on intelligent algorithms. Energy 2025, 335, 137947. [Google Scholar] [CrossRef]
  3. Zhang, J.H.; Liu, Z.C.; Sun, K.; Chea, C.P.; Wei, M.Y.; Zhang, Y.W.; Lin, Z.B.; Geng, Y. Vibration control and parametric optimization of tuned liquid column damper for offshore wind turbines during shutdown. Energy 2025, 338, 138831. [Google Scholar] [CrossRef]
  4. Xu, X.; Wang, F.; Gaidai, O.; Næss, A.; Xing, Y.; Wang, J.L. Bivariate statistics of floating offshore wind turbine dynamic response under operational conditions. Ocean Eng. 2022, 257, 111657. [Google Scholar] [CrossRef]
  5. Sun, H.; Gao, X.; Yang, H. Experimental study on wind speeds in a complex-terrain wind farm and analysis of wake effects. Appl. Energy 2020, 272, 115215. [Google Scholar] [CrossRef]
  6. Su, H.; Meng, H.; Qu, T.; Lei, L. Wind tunnel experiment on the influence of array configuration on the power performance of vertical axis wind turbines. Energy Convers. Manag. 2021, 241, 114299. [Google Scholar] [CrossRef]
  7. Daaou Nedjari, H.; Guerri, O.; Saighi, M. CFD wind turbines wake assessment in complex topography. Energy Convers. Manag. 2017, 138, 224–236. [Google Scholar] [CrossRef]
  8. Gonzalez-Rodriguez, Á.G.; Serrano-González, J.; Burgos-Payán, M.; Riquelme-Santos, J.M. Multi-objective optimization of a uniformly distributed offshore wind farm considering both economic factors and visual impact. Sustain. Energy Technol. Assess. 2022, 52, 102148. [Google Scholar] [CrossRef]
  9. Sahebzadeh, S.; Rezaeiha, A.; Montazeri, H. Impact of relative spacing of two adjacent vertical axis wind turbines on their aerodynamics. J. Phys. Conf. Ser. 2020, 1618, 042002. [Google Scholar] [CrossRef]
  10. Zhang, Z.H.; Yang, H.R.; Zhao, Y.S.; Han, Z.L.; Zhou, D.; Zhang, J.H.; Tu, J.H.; Chen, M.S. A novel wake control strategy for a twin-rotor floating wind turbine: Mitigating wake effect. Energy 2024, 287, 129619. [Google Scholar] [CrossRef]
  11. Chen, F.; Zhang, Z.H.; Yu, M.X.; Zhou, D.; Zhu, H.B.; Duan, L.; Tu, J.H.; Han, Z.L. Research on aerodynamic characteristics of three offshore wind turbines based on large eddy simulation and actuator line model. J. Mar. Sci. Eng. 2024, 12, 1341. [Google Scholar] [CrossRef]
  12. Wang, Y.; Lu, P.; Zhou, Y.Z.; Guan, R.H.; Li, R.N. Insight into the impact of turbine-array configurations on the power output and wake effects of a finite-size wind farm. Renew. Energy 2025, 255, 123745. [Google Scholar] [CrossRef]
  13. Liu, S.Y.; Li, Q.S.; Lu, B.; He, J. Impact of incoming turbulence intensity and turbine spacing on output power density: A study with two 5 MW offshore wind turbines. Appl. Energy 2024, 371, 123648. [Google Scholar] [CrossRef]
  14. Yue, H.; Zhang, H.F.; Zhu, Q.C.; Ai, Y.F.; Tang, H.; Zhou, L. Wake dynamics of a wind turbine under real-time varying inflow turbulence: A coherence mode perspective. Energy Convers. Manag. 2025, 332, 119729. [Google Scholar] [CrossRef]
  15. Cao, L.C.; Ge, M.W.; Gao, X.X.; Du, B.; Li, B.; Huang, Z.; Liu, Y. Wind farm layout optimization to minimize the wake induced turbulence effect on wind turbines. Appl. Energy 2022, 323, 119599. [Google Scholar] [CrossRef]
  16. Wang, Y.; Chai, Y.F.; Gao, Z.T.; Zheng, X.B.; Hu, R.F.; Zheng, J.; Liu, H.Y.; Huang, H.J.; Gou, T. Effects of inflow turbulent coherent structures on a small-scale wind turbine in the atmospheric boundary layer of long corridor terrains: An example study in the Hexi corridor. PRX Energy 2024, 3, 043001. [Google Scholar] [CrossRef]
  17. Liu, Z.Q.; Hu, Y.L.; Li, T.; Pan, J.; Yu, Z.Z.; Yang, Q.S. Numerical investigation of yaw-controlled wake effects on fatigue load distribution in downstream wind turbines. Ocean Eng. 2025, 341, 122455. [Google Scholar] [CrossRef]
  18. Zhang, Z.H.; Yang, H.R.; Wang, R.Z.; Zhang, K.; Zhou, D.; Zhu, H.B.; Zhang, P.Y.; Han, Z.L.; Cao, Y.; Tu, J.H. Effects of combined platform rotation and pitch motions on aerodynamic loading and wake recovery of a single-point moored twin-rotor floating wind turbine. Energy 2025, 320, 135137. [Google Scholar] [CrossRef]
  19. Lin, M.; Porté-Agel, F. Wake meandering of wind turbines under dynamic yaw control and impacts on power and fatigue. Renew. Energy 2024, 223, 120003. [Google Scholar] [CrossRef]
  20. Wang, K.; Zhao, M.S.; Tang, Q.H.; Zha, R.S. Investigating effects of pitch motions on aerodynamics and wake characteristics of a floating offshore wind turbine. Energy Convers. Manag. 2025, 326, 119402. [Google Scholar] [CrossRef]
  21. Song, K.; Huan, H.T.; Wei, L.C.; Liu, C.X. Investigation of the effect of blade angle of Archimedes spiral hydrokinetic turbine based on hydrodynamic performance and entropy production theory. Ocean Eng. 2025, 324, 120731. [Google Scholar] [CrossRef]
  22. He, G.F.; Sun, H.Y.; He, R.Y. A novel analytical wake model for floating offshore wind turbines with pitch motion effects. Renew. Energy 2026, 256, 124090. [Google Scholar] [CrossRef]
  23. Betz, A. Wind-Energie und ihre Ausnutzung durch Windmühlen; Vandenhoeck & Ruprecht: Göttingen, Germany, 1926. [Google Scholar]
  24. Yu, J.H. Wind Farm Wake Modeling and Analysis of Wind Impacts in a Wind Farm. Ph.D. Thesis, University of Massachusetts Amherst, Amherst, MA, USA, 2016. [Google Scholar]
  25. Sutherland, H.J. On the Fatigue Analysis of Wind Turbines; Sandia National Laboratories Report SAND99-0089; Sandia National Laboratories: Albuquerque, NM, USA, 1999. [Google Scholar]
  26. Downing, S.D.; Socie, D.F. Simple rainflow counting algorithms. Int. J. Fatigue 1982, 4, 31–40. [Google Scholar] [CrossRef]
  27. McEvily, A.J.; Ishihara, S.; Endo, M. On the causes of deviation from the Palmgren-Miner rule. J. ASTM Int. 2004, 1, JAI19025. [Google Scholar] [CrossRef]
  28. Stanley, A.P.; King, J.; Bay, C.; Ning, A. A model to calculate fatigue damage caused by partial waking during wind farm optimization. Wind Energy Sci. 2022, 7, 433–454. [Google Scholar] [CrossRef]
  29. IEC 61400-13:2015; Wind Turbines—Part 13: Measurement of Mechanical Loads. International Electrotechnical Commission: Geneva, Switzerland, 2015.
  30. Herwig, H.; Köck, F. Direct and indirect methods of calculating entropy generation rates in turbulent convective heat transfer problems. Heat Mass Transf. 2007, 43, 207–215. [Google Scholar] [CrossRef]
  31. Jonkman, J.; Shaler, K. FAST.Farm User’s Guide and Theory Manual; Technical Report NREL/TP-5000-78485; National Renewable Energy Laboratory: Golden, CO, USA, 2013. [Google Scholar]
  32. Doubrawa, P.; Annoni, J.R.; Jonkman, J.M. Optimization-Based calibration of FAST.Farm parameters against large-eddy simulations. In Proceedings of the Wind Energy Symposium (AIAA), Kissimmee, FL, USA, 8–12 January 2018. [Google Scholar] [CrossRef]
  33. Shaler, K.; Jonkman, J.; Hamilton, N. Effects of inflow spatiotemporal discretization on wake meandering and turbine structural response using FAST.Farm. J. Phys. Conf. Ser. 2019, 1256, 012023. [Google Scholar] [CrossRef]
  34. Shaler, K.; Jonkman, J.M. FAST.Farm response to varying wind inflow and discretization. In Proceedings of the AIAA SciTech Forum, San Diego, CA, USA, 7–11 January 2019. [Google Scholar] [CrossRef]
  35. Zhang, T.; Xu, X.S.; Wang, S.S.; Xing, Y.H.; Dou, P.; Ji, R.W.; Zhang, P.; Yang, P.Y. Investigating the influence of yaw control on wind farm dynamic characteristics for three conceptual floating offshore wind turbines. Ocean Eng. 2025, 342, 113597. [Google Scholar] [CrossRef]
  36. Jonkman, J.; Butterfield, S.; Musial, W.; Scott, G. Definition of a 5-MW Reference Wind Turbine for Offshore System Development; National Renewable Energy Laboratory: Golden, CO, USA, 2009. [Google Scholar]
  37. Barthelmie, R.J.; Hansen, K.; Frandsen, S.T.; Rathmann, O.; Schepers, J.G.; Schlez, W.; Phillips, J.; Rados, K.; Zervos, A.; Politis, E.S. Modelling and measuring flow and wind turbine wakes in large wind farms offshore. Wind Energy 2010, 12, 431–444. [Google Scholar] [CrossRef]
  38. Mou, L.; Fernando, P.A. Large-eddy simulation of a wind-turbine array subjected to active yaw control. Wind Energy Sci. 2022, 7, 2215–2230. [Google Scholar] [CrossRef]
  39. Liu, S.Y.; Li, Q.S.; Lu, B.; He, J.Y. Analysis of NREL-5MW wind turbine wake under varied turbulence conditions. Renew. Energy 2024, 224, 131148. [Google Scholar] [CrossRef]
  40. Cañadillas, B.; Foreman, R.; Steinfeld, G.; Robinson, N. Cumulative interactions between the global blockage and wake effects as observed by an engineering model and Large-Eddy Simulations. Energies 2023, 16, 2949. [Google Scholar] [CrossRef]
  41. Ning, X.; Wan, D. LES study of wake meandering in different atmospheric stabilities and its effects on wind turbine aerodynamics. Sustainability 2019, 11, 6939. [Google Scholar] [CrossRef]
  42. Meng, H.; Zhang, X.; Zhang, L.; Wang, L.; Zhang, Y. Analytical and numerical study on centrifugal stiffening effect of wind turbine blades. Renew. Energy 2022, 186, 1078–1094. [Google Scholar] [CrossRef]
  43. Zhao, Y.; Li, Y.; Zhang, X.; Li, H.; Zhang, L. Stress characteristics of horizontal-axis wind turbine blades under yaw fluctuations. Appl. Sci. 2023, 13, 8418. [Google Scholar] [CrossRef]
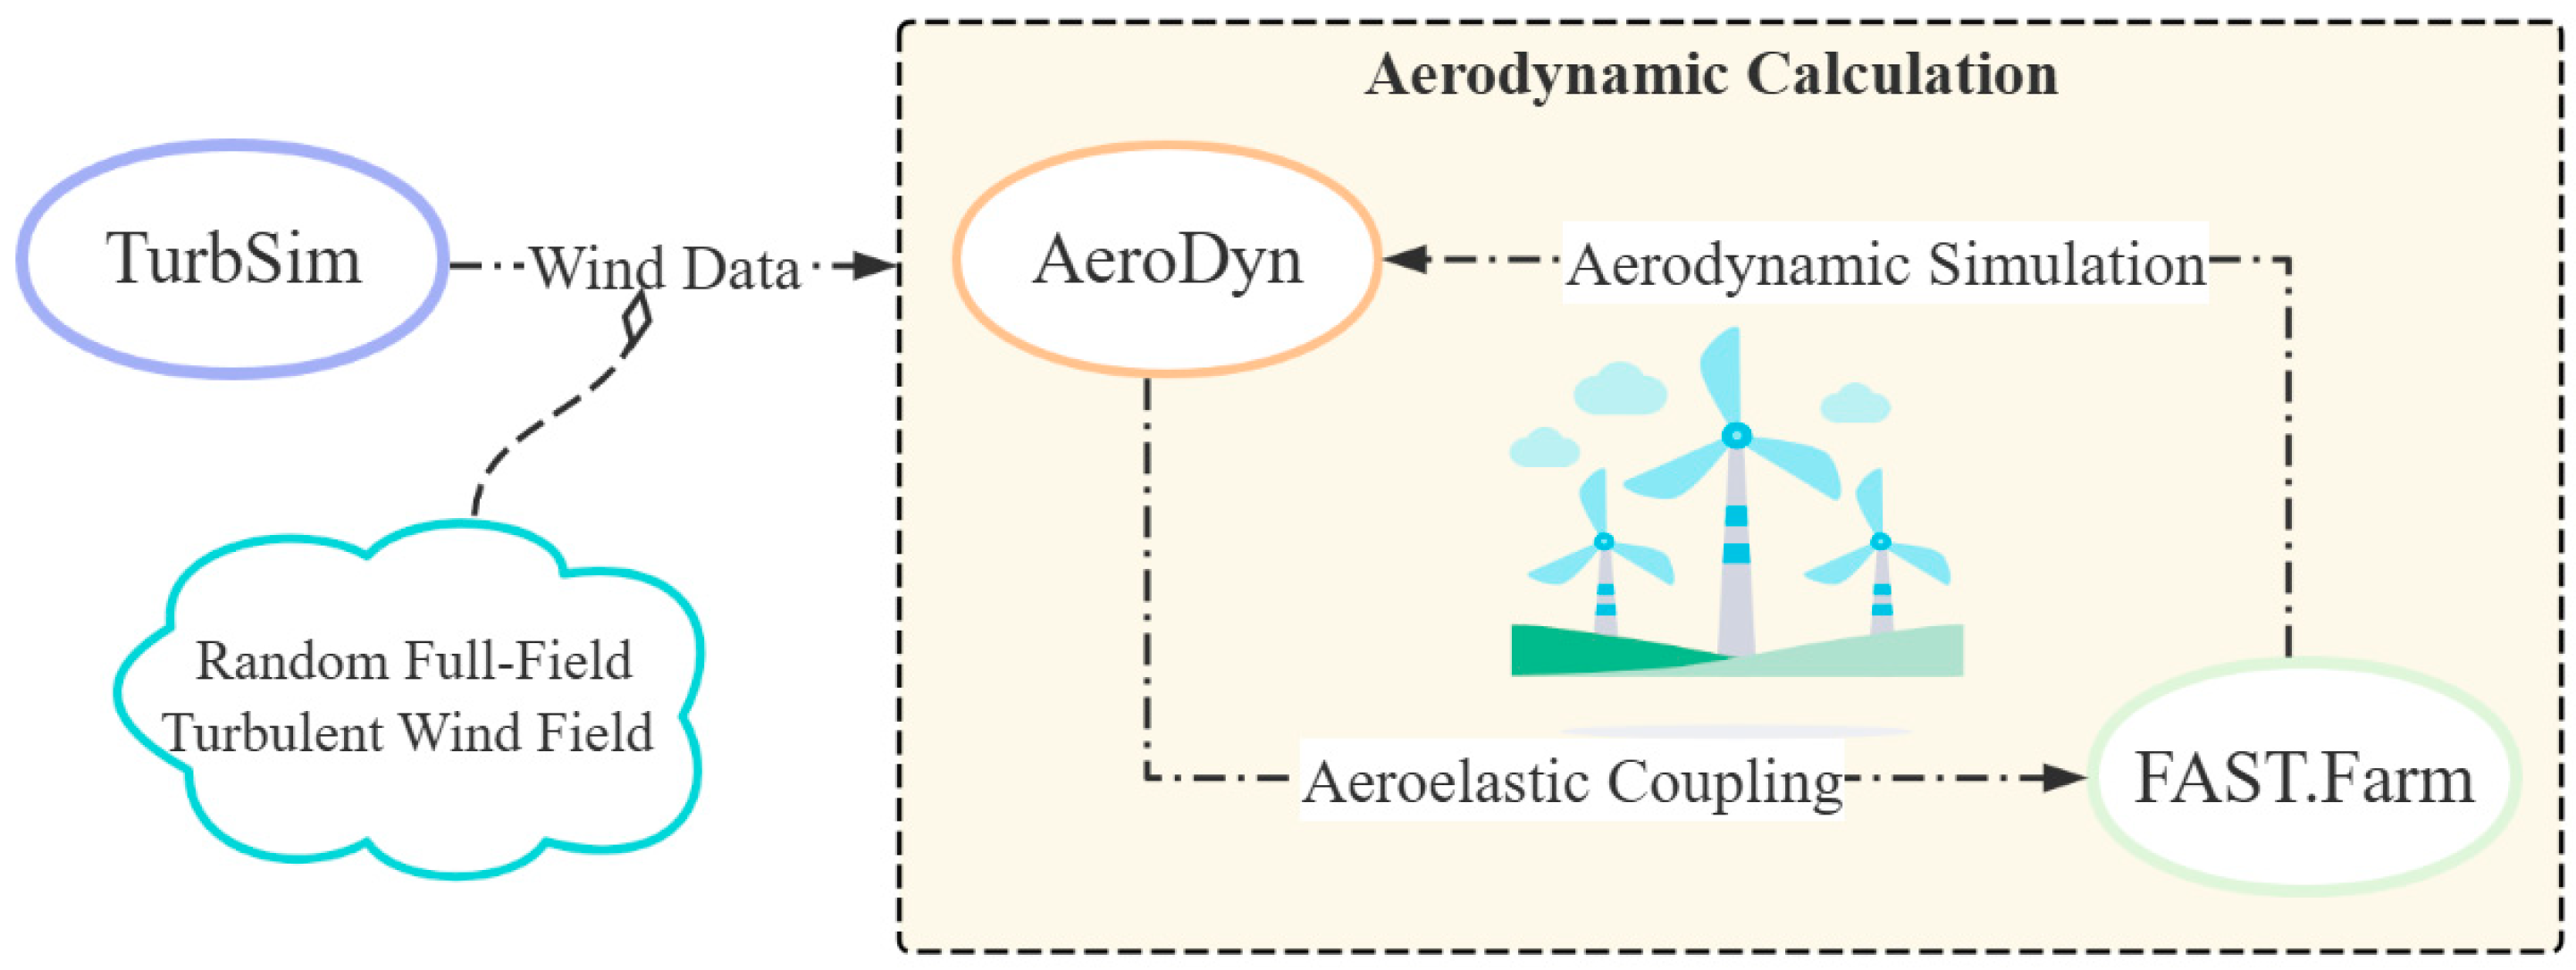
Figure 1. Workflow of the coupled simulation between TurbSim, AeroDyn, and FAST.Farm.
Jmse 13 02137 g001
Figure 2. Validation of the turbulent wind field generated by TurbSim: (a) Spatio-temporal distribution characteristics of turbulent wind fields; (b) Comparison of wind velocity spectrum between TurbSim data and the Kaimal spectrum in the case of U = 11.4 m/s and I = 15%.
Jmse 13 02137 g002
Figure 3. Description of the computational domain at the square layout.
Jmse 13 02137 g003
Figure 4. Verification of output power for single and multiple wind turbines [36,37,38].
Jmse 13 02137 g004
Figure 5. Three-dimensional schematic diagram of a square layout wind farm.
Jmse 13 02137 g005
Figure 6. Two-dimensional schematic diagrams of wind farms with various layout.
Jmse 13 02137 g006
Figure 7. The time-averaged output power of wind turbines in the square layout.
Jmse 13 02137 g007
Figure 8. Normalized velocity deficit of the wind turbine wake in the square layout.
Jmse 13 02137 g008
Figure 9. Longitudinal profile of the wind turbine wake velocity deficit in the square layout.
Jmse 13 02137 g009
Figure 10. Normalized velocity deficit of the wind turbine wake in the diamond layout.
Jmse 13 02137 g010
Figure 11. Longitudinal profile of the wind turbine wake velocity deficit in the diamond layout.
Jmse 13 02137 g011
Figure 12. The time-averaged output power of wind turbines under different staggered layouts in the cases of M = 5D and I = 15%.
Jmse 13 02137 g012
Figure 13. The time-averaged output power of wind turbines for different cases.
Jmse 13 02137 g013
Figure 14. Normalized velocity deficit of the wind turbine wake in the staggered layout I.
Jmse 13 02137 g014
Figure 15. Longitudinal profile of the wind turbine wake velocity deficit in the staggered layout I.
Jmse 13 02137 g015
Figure 16. Normalized velocity deficit of the wind turbine wake in the staggered layout II.
Jmse 13 02137 g016
Figure 17. Longitudinal profile of the wind turbine wake velocity deficit in the staggered layout II.
Jmse 13 02137 g017
Figure 18. Normalized results of rotor thrust and torque.
Jmse 13 02137 g018
Figure 19. The distribution of the time-averaged entropy production rate of the wind farm.
Jmse 13 02137 g019
Table 1. Comparison of the output power of the single wind turbine at the different grid sizes.
Low-Resolution Domain Mesh Size(m)High-Resolution Domain Mesh Size(m)Output Power (MW)Output Power Comparison Ratio (%)
Mesh11055.2899.81
Mesh210105.2398.87
Mesh320105.2298.68
Table 2. Time-averaged output power for wind turbines in the square layout (MW).
MIT1T2T3T4T5T6T7T8T9Total
3D0%4.854.854.851.321.321.321.271.271.2722.32
5%4.634.784.651.571.721.511.321.421.3122.89
10%4.424.674.491.732.031.631.361.561.3423.23
15%4.234.584.321.912.381.791.441.771.4123.83
4D0%4.854.854.851.611.611.611.491.491.4923.85
5%4.664.784.661.812.001.841.551.671.5824.56
10%4.524.684.621.912.321.991.581.841.6525.10
15%4.374.584.512.042.652.161.652.121.7725.84
5D0%4.854.854.851.861.861.862.032.032.0326.22
5%4.674.784.762.082.252.212.092.202.1327.17
10%4.514.684.682.232.572.462.132.392.2627.91
15%4.364.584.592.412.892.772.232.632.4828.94
Table 3. Time-averaged output power for wind turbines in the diamond layout (MW).
MIT1T2T3T4T5T6T7T8T9Total
3D0%4.854.854.854.851.314.851.311.311.2629.42
5%4.784.744.744.631.714.641.591.551.4029.78
10%4.684.634.654.432.034.481.791.691.5529.91
15%4.584.534.564.252.384.312.011.841.7630.20
4D0%4.854.854.854.851.604.851.591.591.4730.49
5%4.784.704.704.721.994.661.801.851.6630.85
10%4.684.554.584.522.314.602.031.921.8331.02
15%4.584.424.464.382.654.482.252.062.1131.37
5D0%4.854.854.854.851.864.851.861.862.0331.84
5%4.784.654.654.662.254.742.102.032.1932.05
10%4.684.464.514.502.574.642.272.132.3932.14
15%4.584.294.344.342.894.542.482.272.6332.36
Table 4. Time-averaged output power for wind turbines in the staggered layout (MW).
NM = 3DM = 4DM = 5D
I = 0%I = 5%I = 10%I = 15%I = 0%I = 5%I = 10%I = 15%I = 0%I = 5%I = 10%I = 15%
Staggered Layout I0.1D22.5023.1323.4924.0924.1024.8825.3726.0826.5026.6227.4728.61
0.5D28.1028.4628.7829.2029.6030.0030.4230.8933.2031.4232.0532.61
1.0D35.4034.8434.6434.4636.5035.9735.8035.6242.4836.9436.9636.84
Staggered Layout II0.1D22.8023.3023.6324.2024.3025.0025.4426.1226.5026.6927.4828.56
0.3D26.1026.4326.6527.1027.4027.8728.2328.7328.9029.3329.8830.53
0.5D31.9031.7731.7731.8432.7032.5632.6832.7933.3033.3633.5733.68
Disclaimer/Publisher’s Note: The statements, opinions and data contained in all publications are solely those of the individual author(s) and contributor(s) and not of MDPI and/or the editor(s). MDPI and/or the editor(s) disclaim responsibility for any injury to people or property resulting from any ideas, methods, instructions or products referred to in the content.