Article

OWTDNet: A Novel CNN-Mamba Fusion Network for Offshore Wind Turbine Detection in High-Resolution Remote Sensing Images

1
Longyuan Qidong Wind Power Generation Co., Ltd., Nantong 226236, China
2
Shanghai Enshu Data Technology Co., Ltd., Shanghai 200335, China
3
College of Information Technology, Shanghai Ocean University, Shanghai 201306, China
*
Author to whom correspondence should be addressed.
J. Mar. Sci. Eng. 2025, 13(11), 2124; https://doi.org/10.3390/jmse13112124
Submission received: 23 September 2025 / Revised: 10 October 2025 / Accepted: 11 October 2025 / Published: 10 November 2025
(This article belongs to the Section Ocean Engineering)

Abstract

Real-time monitoring of offshore wind turbines (OWTs) through satellite remote sensing imagery is considered an essential process for large-scale infrastructure surveillance in ocean engineering. Current detection systems, however, are constrained by persistent technical limitations, including prohibitive deployment costs, insufficient discriminative power for learned features, and susceptibility to environmental interference. To address these challenges, a dual-branch architecture named OWTDNet is proposed, which integrates global contextual modeling via State Space Models (SSMs) with CNN-based local feature extraction for high-resolution OWTs detection. The primary branch utilizes a Mamba-structured encoder with linear computational complexity to establish long-range spatial dependencies, while an auxiliary Blurring-MobileNetv3 (B-Mv3) branch is designed to compensate for the local feature extraction deficiencies inherent in SSMs. Additionally, a novel Feature Alignment Module (FAM) is introduced to systematically coordinate cross-modal feature fusion between Mamba and CNN branches through channel-wise recalibration and position-aware alignment mechanisms. This module not only enables complementary feature integration but also enhances turbine-specific responses through attention-driven feature modulation. Comprehensive experimental validation demonstrated the superiority of the proposed framework, achieving a mean average precision (AP) of 47.1% on 40,000 × 40,000-pixel satellite imagery, while maintaining practical computational efficiency (127.7 s per image processing time).

1. Introduction

Real-time detection and monitoring of offshore wind turbines are crucial for identifying damage to marine infrastructure, enabling timely maintenance, and minimizing economic losses. Additionally, such monitoring systems allow regulatory personnel to maintain real-time control of offshore engineering layouts, providing a solid foundation for enforcing laws against illegal activities such as overbuilding, unauthorized construction, and disorderly development.
Satellite remote sensing technology offers significant advantages in marine monitoring systems, including extensive coverage, real-time capabilities, and strong objectivity, enabling the rapid acquisition of high-precision ocean monitoring data in critical sea areas, especially for wind turbines. In recent years, the marine community has increasingly emphasized the importance of marine resource supervision through satellite remote sensing [1,2,3]. However, the complex and variable nature of ocean environments poses significant challenges to the expertise required of supervisory personnel. Additionally, the immense resolution of remote sensing images, often exceeding 40,000 × 40,000 pixels, significantly increases the workload of staff compared to surveillance cameras.
With the successful application of deep learning methods across various domains, researchers have focused on utilizing object detection techniques in marine surveillance. A survey of recent deep-learning-driven object detection methods is provided in [4,5]. These methods can be categorized into Oriented Bounding Box (OBB) [6,7,8] and Horizontal Bounding Box (HBB) [9,10,11] techniques, based on the necessity to distinguish the target’s direction, such as for ships and planes. HBB methods focus on predicting the center point, length, and width of objects, while OBB methods require an additional rotation angle. In our detection task, the shape feature of OWTs equipment negates the necessity for angle information, as illustrated in Figure 1a,b. Therefore, this article focuses on discussing the application value of HBB methods in our OWTs monitoring task.
In the realm of ocean engineering applications, HBB techniques can be categorized into Convolutional Neural Network (CNN)-based and Transformer-based methodologies [12,13,14]. CNN-based methods offer advantages in terms of a higher inference speed and lower deployment costs, which are crucial for detection tasks in actual application processes. However, these methods are prone to complex marine environmental interference, as evidenced in Figure 1c,d, posing challenges in achieving optimal performance in applications. In contrast, Transformer-based approaches excel in modeling long-range dependencies, exhibit strong feature learning, and possess robust anti-interference capabilities, achieving superior performance. However, the computational complexity of Transformers increases quadratically with the image size, due to the self-attention mechanism. This significant computational workload hinders their widespread application in marine monitoring systems that require speed and cost efficiency. In the context of the OWTs detection task, we encounter the following challenges: (1) achieving an optimal trade-off between speed, performance, and deployment costs that satisfies the demands of monitoring applications; (2) enhancing the network’s anti-interference ability against complex marine environmental conditions; and (3) strengthening the feature modeling capabilities for OWTs under small and weak features. In this paper, a novel object detection network called OWTDNet is proposed, specifically designed for OWTs detection, which simultaneously integrates Mamba and CNN structures in the encoding stage.
To address the first challenge, the Mamba [15] architecture is adopted as the backbone network of our framework. Through integration of SSMs and an optimized GPU hardware implementation, long-range dependency modeling is achieved with linear computational complexity, effectively balancing operational efficiency and detection performance. For the second and third challenges, a CNN-based auxiliary feature encoding branch is introduced to enhance multi-scale representation learning in marine remote sensing imagery. A lightweight Blurring-MobileNetv3 (B-Mv3) network is proposed to strengthen local feature discriminability, while maintaining translation invariance during sliding window operations over large-scale satellite images. To reconcile the complementary information between Mamba-based global modeling and CNN-based local processing, a novel Feature Alignment Module (FAM) is developed. This module systematically resolves feature discrepancies through dual-path processing of channel-wise and spatial-wise alignment. Channel dimension harmonization is accomplished through global context aggregation and attention-based feature recalibration, while spatial alignment is achieved via multi-scale context aggregation using dilated convolutional operators with varying receptive fields. Subsequently, position-aware attention weighting is applied to amplify region-specific responses corresponding to marine infrastructure targets. Further enhancement is implemented through a dedicated feature refinement stage, where max pooling operations are employed to extract channel-position joint saliency maps, prioritizing discriminative patterns of OWTs, while suppressing background interference. Our proposed framework demonstrated superior detection capability, achieving a mean average precision (AP) of 47.1% on 40,000 × 40,000-pixel marine remote sensing imagery with a practical computational efficiency of 127.7 s per image processing time when implemented in an NVIDIA RTX 3090 GPU workstation configuration.
In summary, the main contributions of our OWTDNet for OWTs surveillance in remote sensing images are as follows:
(1)
We propose a novel offshore wind turbine detection network called OWTDNet, which synergistically integrates Mamba and CNNs as feature encoding backbones.
(2)
An auxiliary lightweight encoding branch termed B-Mv3 is introduced to enrich the local feature information related to wind turbine targets.
(3)
We introduce a feature alignment module to mitigate disparities between Mamba and CNN features, focusing on both channel and position dimensions.
(4)
A feature enhancement approach is proposed to amplify the response weights of small-sized OWTs targets against backgrounds and interferences.
(5)
Extensive experimental results demonstrate that our OWTDNet achieves an optimal balance between performance and cost, and the proposed algorithm has been successfully applied in a real-world ocean monitoring system.

2. Related Works

2.1. CNN-Based Object Detection

In CNN architectures, detectors can be classified into single-stage and two-stage approaches. Single-stage approaches excel in achieving higher speeds, while two-stage approaches prioritize performance. R-CNN [16], the pioneer of two-stage detectors, introduced selective search [17] to extract region proposals from input images. Subsequently, Fast R-CNN [18] and Faster R-CNN [19] were proposed to enhance selection speed, achieving simultaneous improvements in both speed and performance by replacing selective search with a region proposal network (RPN). More recently, a novel detector backbone named ConvNeXt [20] has garnered significant attention. This method is purely based on a convolutional structure and has achieved remarkable results by optimizing the design space of ResNet [21] and introducing diverse training techniques.
The YOLO series, a notable exemplar of a single-stage detector framework, has achieved remarkable success across diverse fields. Unlike two-stage detectors, single-stage detectors directly predict the object location from the input image without the RPN process, reducing computational overhead. The YOLO approach initially involves partitioning the input image into numerous overlapping anchor boxes with different predefined sizes. It then predicts the probability and location offset within these anchor regions. Redundant detection boxes are subsequently eliminated using the Non-Maximum Suppression (NMS) method. Building upon these design principles, YOLOv1 [22] was introduced, achieving the fastest inference speed of its time. To enhance prediction accuracy, YOLOv2 [23] incorporated batch normalization, a high-resolution classifier, and an anchor box generation method based on k-means clustering. YOLOv3 [24] further built upon this foundation by introducing concepts such as data augmentation, multi-scale training, and independent classification heads. With the integration of attention mechanisms and multi-scale features, the YOLO series has evolved into diverse versions, including YOLOv5 [25], YOLOF [26], YOLOX [27], YOLOv7 [28], and YOLOv8 [29]. In [30], Park introduced YOLOv3 and YOLOv5s for ship detection, proving that YOLOv5s can achieve better performance than YOLOv3.
In contrast to the improvements in the YOLO series, RetinaNet [31] emphasized optimizing the detector’s loss function. Specifically, it introduced a focal loss function designed to differentiate between difficult and easy samples during the training stage. The focal loss enhances the model’s learning capability for challenging samples through a penalty mechanism, ultimately improving the network’s robustness. Concurrently, numerous approaches have been proposed to refine the box regression loss, such as SIoU [32], WIoU [33], GIoU [34], DIoU [35], and CIoU [35]. Additionally, EfficientDet [36] introduced the Bidirectional Feature Pyramid Network (BiFPN) as an alternative to the conventional FPN structure, aiming to efficiently fuse multi-scale features with learned weights.
In practical applications, CNN-based models can achieve faster running speeds and lower deployment costs. However, in the face of complex marine environments, CNN-based models are prone to serious false detection problems, such as objects with highly similar features to OWTs. This is mainly because the CNN structure only focuses on the responses of the local region and ignores the global information of the surrounding background, resulting in the problem of high recall and low precision in CNN-based models.

2.2. Transformer-Based Object Detection

The Transformer method, initially introduced in the realm of natural language processing (NLP), has demonstrated state-of-the-art performance compared to other methods. Like the encoding–decoding structure of CNNs, the Transformer approach can replace the CNN encoding stage with a self-attention mechanism. However, the complexity of attention computation scales quadratically with the image size, posing a limitation in computer vision applications. To mitigate this challenge, researchers partition the input image into non-overlapping patches and independently compute the correlation within each patch image.
The Detection Transformer (DETR) [37] pioneered the application of the Transformer approach in computer vision by modeling features derived from a CNN backbone. However, the original DETR structure faced challenges such as slow convergence and limited feature spatial resolution. To address these issues, deformable DETR [38] was proposed, which focuses on a small set of key sampling points around reference points. This approach significantly improves performance, requiring only 10% of the training epochs compared to DETR. Subsequent works, such as conditional DETR [39] and DAB-DETR [40], were introduced to further address the slow training convergence observed in DETR. More recently, a novel end-to-end object detector named DETR with improved denoising anchor boxes (DINO) [41] was presented. This method enhances the performance and efficiency of previous DETR-like models through a contrastive denoising training approach, a mixed query selection method for anchor initialization, and a look-forward-twice scheme for box prediction. Consequently, DINO has achieved the current best detection performance, demonstrating the effectiveness of the Transformer approach in different object detection tasks.
Transformer-based architectures exhibit superior spatial feature extraction capabilities compared to conventional CNN structures, enabling enhanced detection performance through their ability to capture long-range dependencies. However, this advantage comes at the cost of quadratic computational complexity relative to input image dimensions, resulting in two critical implementation challenges. The inference speed limitations cause significant latency when processing high-resolution remote-sensing imagery. The resource-intensive computation demands prohibitively high hardware requirements. These constraints collectively impede the practical deployment of transformer models in the OWTs detection task.

2.3. Mamba-Based Object Detection

The inherent locality of convolution operations in CNN architectures limits their ability to model long-distance features, necessitating the employment of self-attention methods. However, the immense computational complexity of Transformer methods poses challenges for practical applications. To address this gap, Gu et al. [15] introduced the Mamba method, which leverages SSMs to reduce the computational complexity of capturing long dependencies from quadratic to linear. The Mamba model has emerged as a strong competitor to the Transformer method due to its superior performance and faster speed.
Building on this foundation, Wang et al. [42] proposed an object detection model based on Mamba and YOLO structures, named Mamba-YOLO. Mamba-YOLO introduces an LSBlock and RGBlock, enabling more precise capture of local image dependencies and significantly enhancing the robustness of the model. Zhou et al. [43] nested multiple Mamba structures and achieved state-of-the-art results in image classification tasks. Dong et al. [44] extended the application of Mamba to different types of infrared images by introducing a Fusion Mamba block, which reduces differences between cross-modal features and enhances the representation consistency of the fused features. Meanwhile, Zhu et al. [45] presented the VMamba framework, which outperformed Transformer methods in various tasks such as image classification, object detection, and semantic segmentation.
In the field of remote sensing, Xie et al. [46] introduced RSWDet, a neural network-based detector for wind turbines in remote sensing imagery under complex distribution scenarios. RS-Mamba [47] has demonstrated superior performance compared to both CNNs and Transformers in dense prediction tasks. Additionally, the integration of Mamba with UNet [48] structures, named CM-UNet [49], has shown superiority in remote sensing semantic segmentation tasks.

3. Materials and Methods

The OWTs detection pipeline comprises the following sequential processing stages: (1) Image Input: Acquisition of remote sensing imagery for subsequent analysis. (2) Image Splitting: Partitioning of the large-scale image into multiple independent detection windows. (3) Window-level Detection: Application of an object detection model (OWTDNet) to identify OWTs within each window. (4) Result Integration: Aggregation of individual detection outputs with coordinate regression for bounding box localization. (5) Final Output: Generation of comprehensive OWTs detection results, including precise bounding box coordinates.
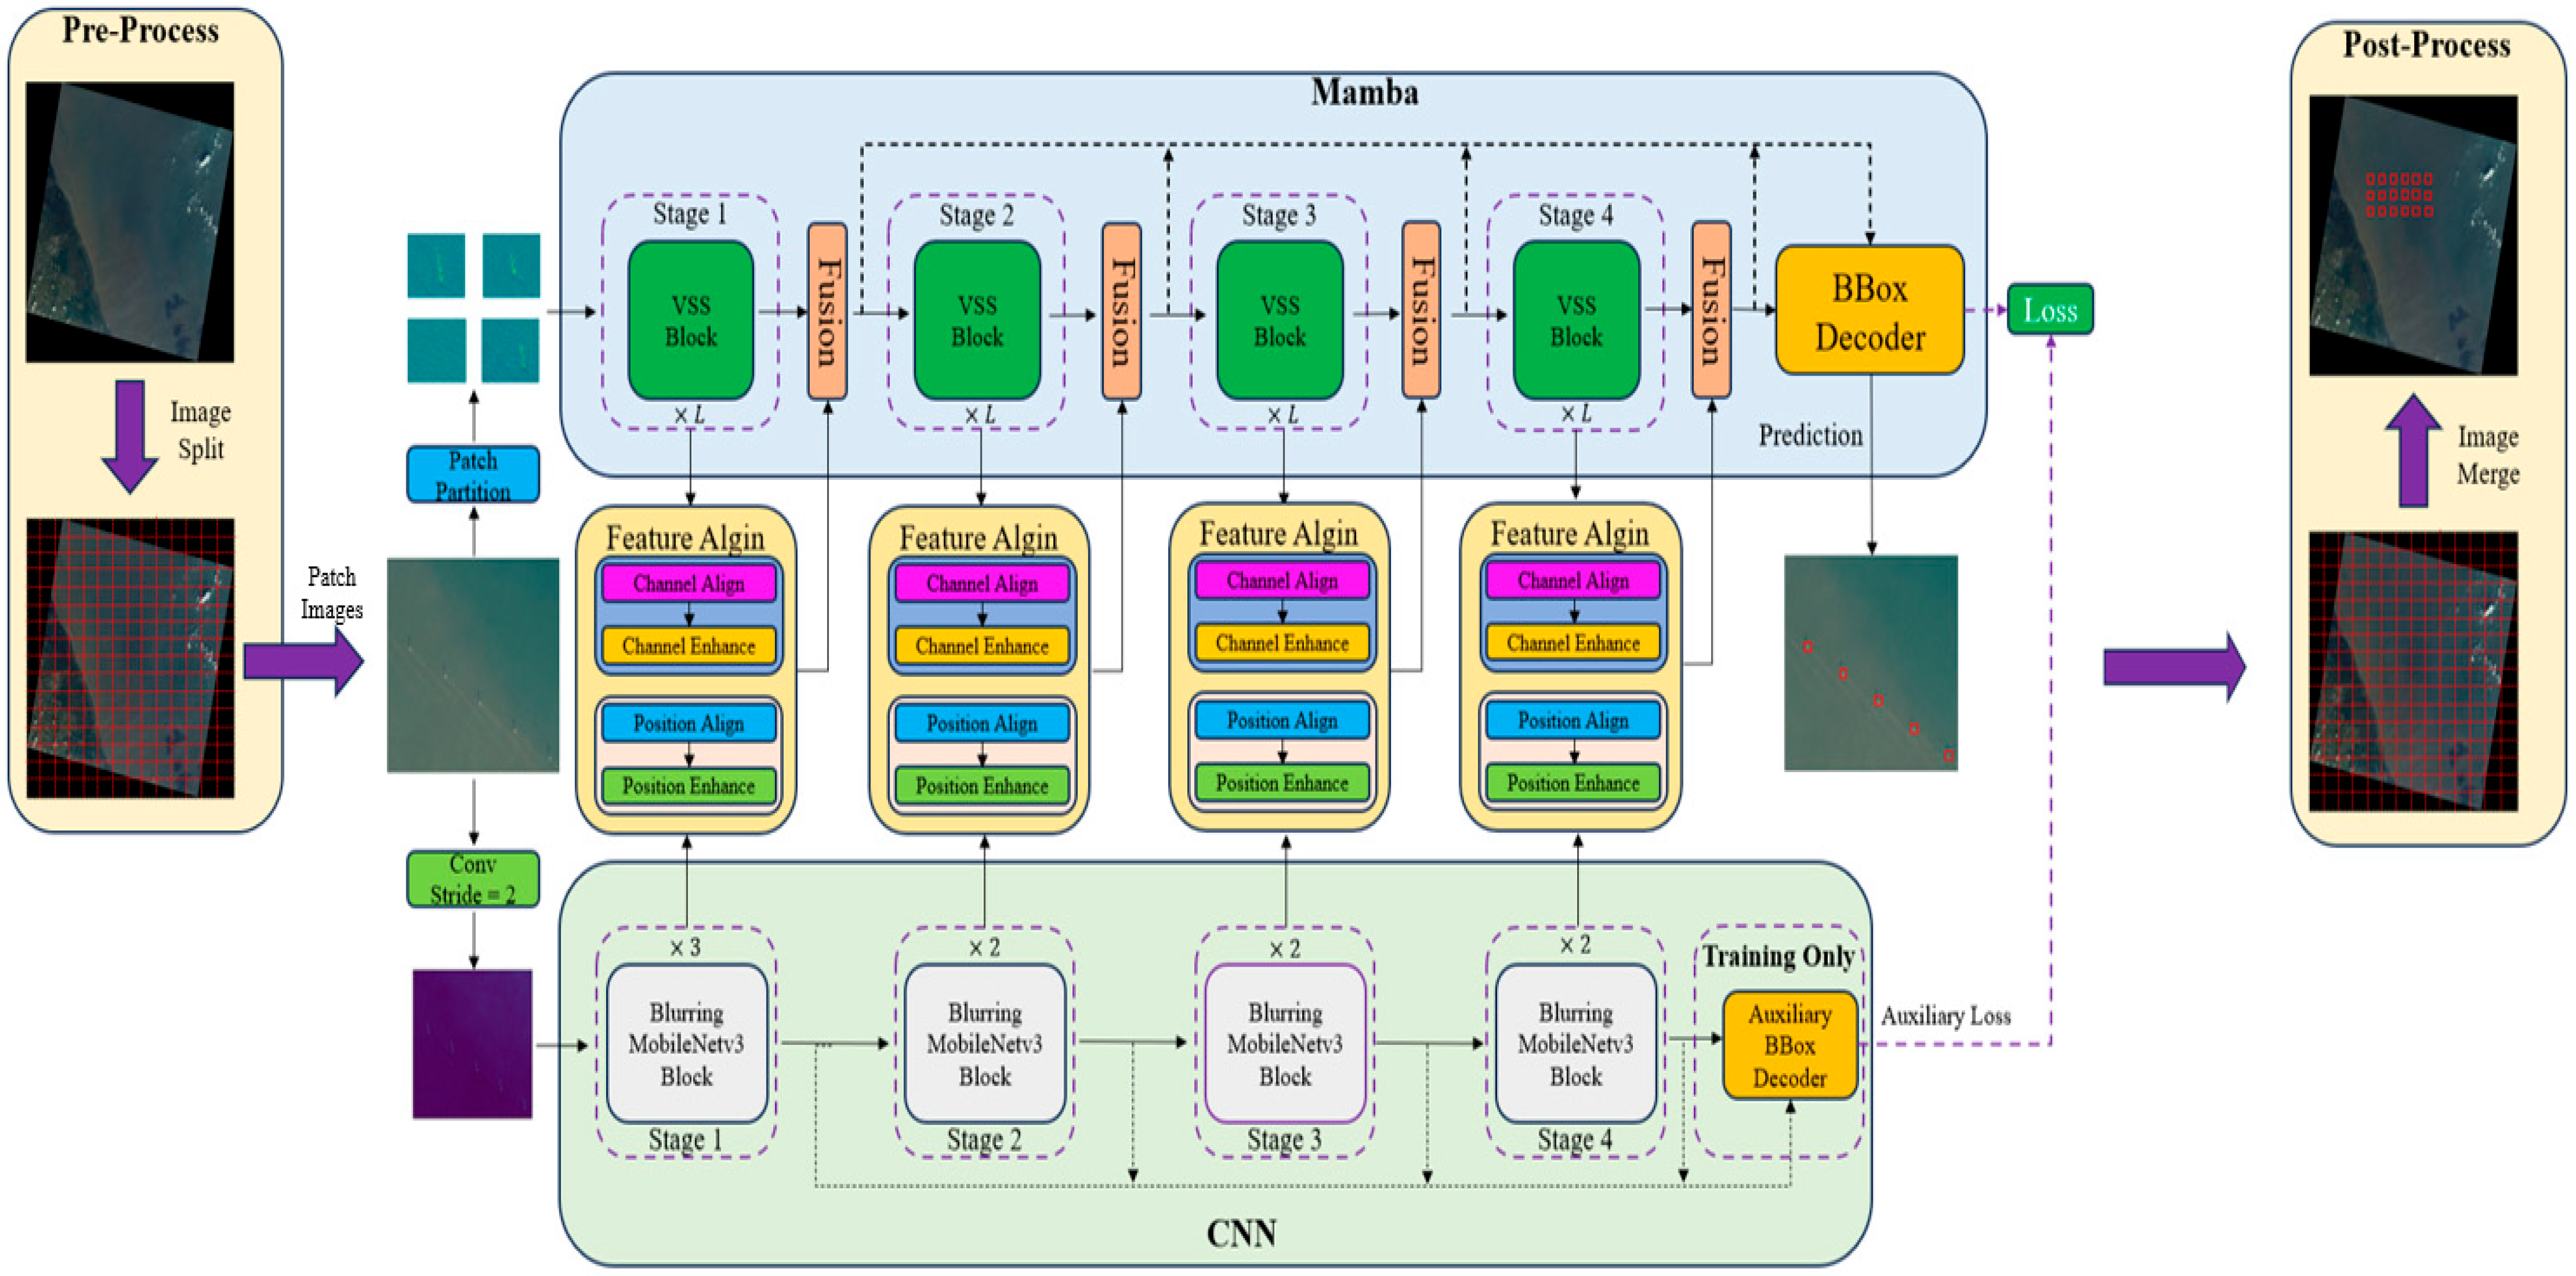
The proposed OWTDNet architecture, as illustrated in Figure 2, consists of three sequentially connected components: an image preprocessing module, a core detection network, and a result aggregation module. Due to the extreme spatial dimensions of satellite-acquired marine imagery, direct processing of raw input data through the detection network is rendered computationally infeasible. In the developed offshore wind turbine monitoring framework, a preprocessing module is implemented to systematically tile the input imagery into standardized 1024 × 1024 pixel patches using an optimized grid-based partitioning protocol. These spatially normalized patches are subsequently processed through the detection network in batch mode to ensure hardware resource optimization. Following detection, a post-processing module is employed to aggregate localized predictions through coordinate remapping and non-maximum suppression (NMS) operations, ultimately generating the final detection results under the original input resolution.

3.1. Pre-Processing of High-Resolution Remote Images

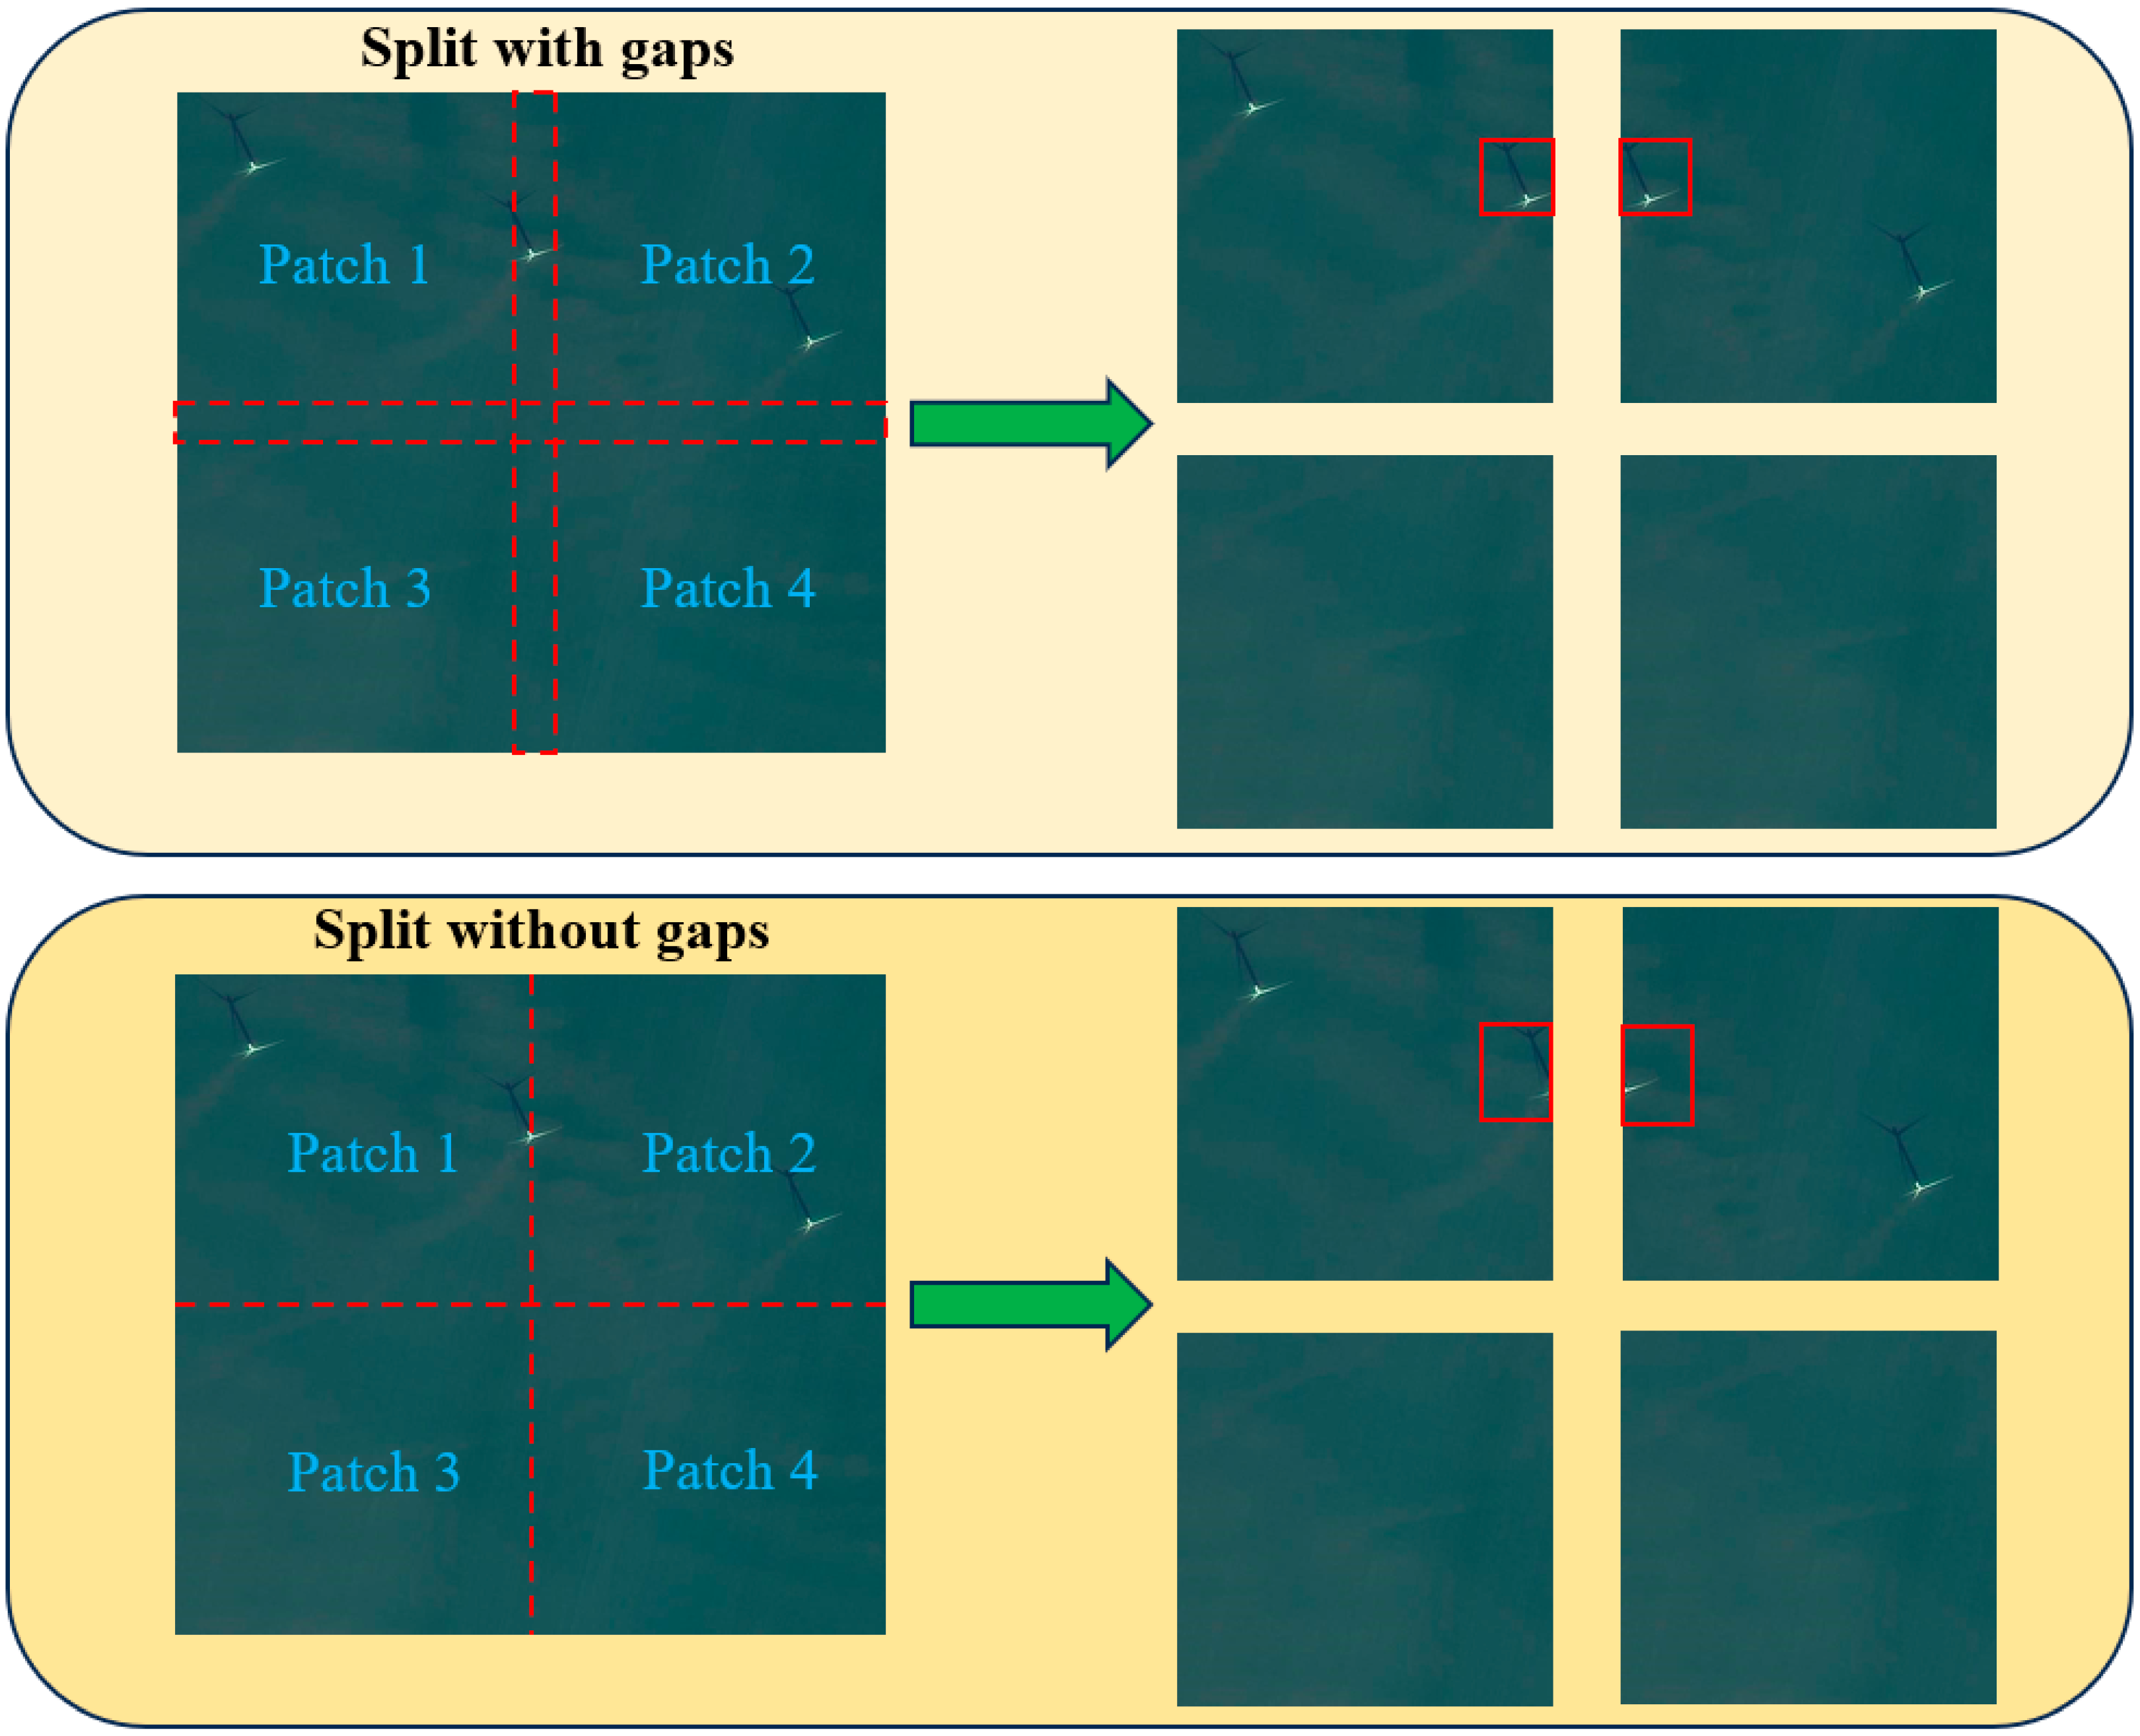
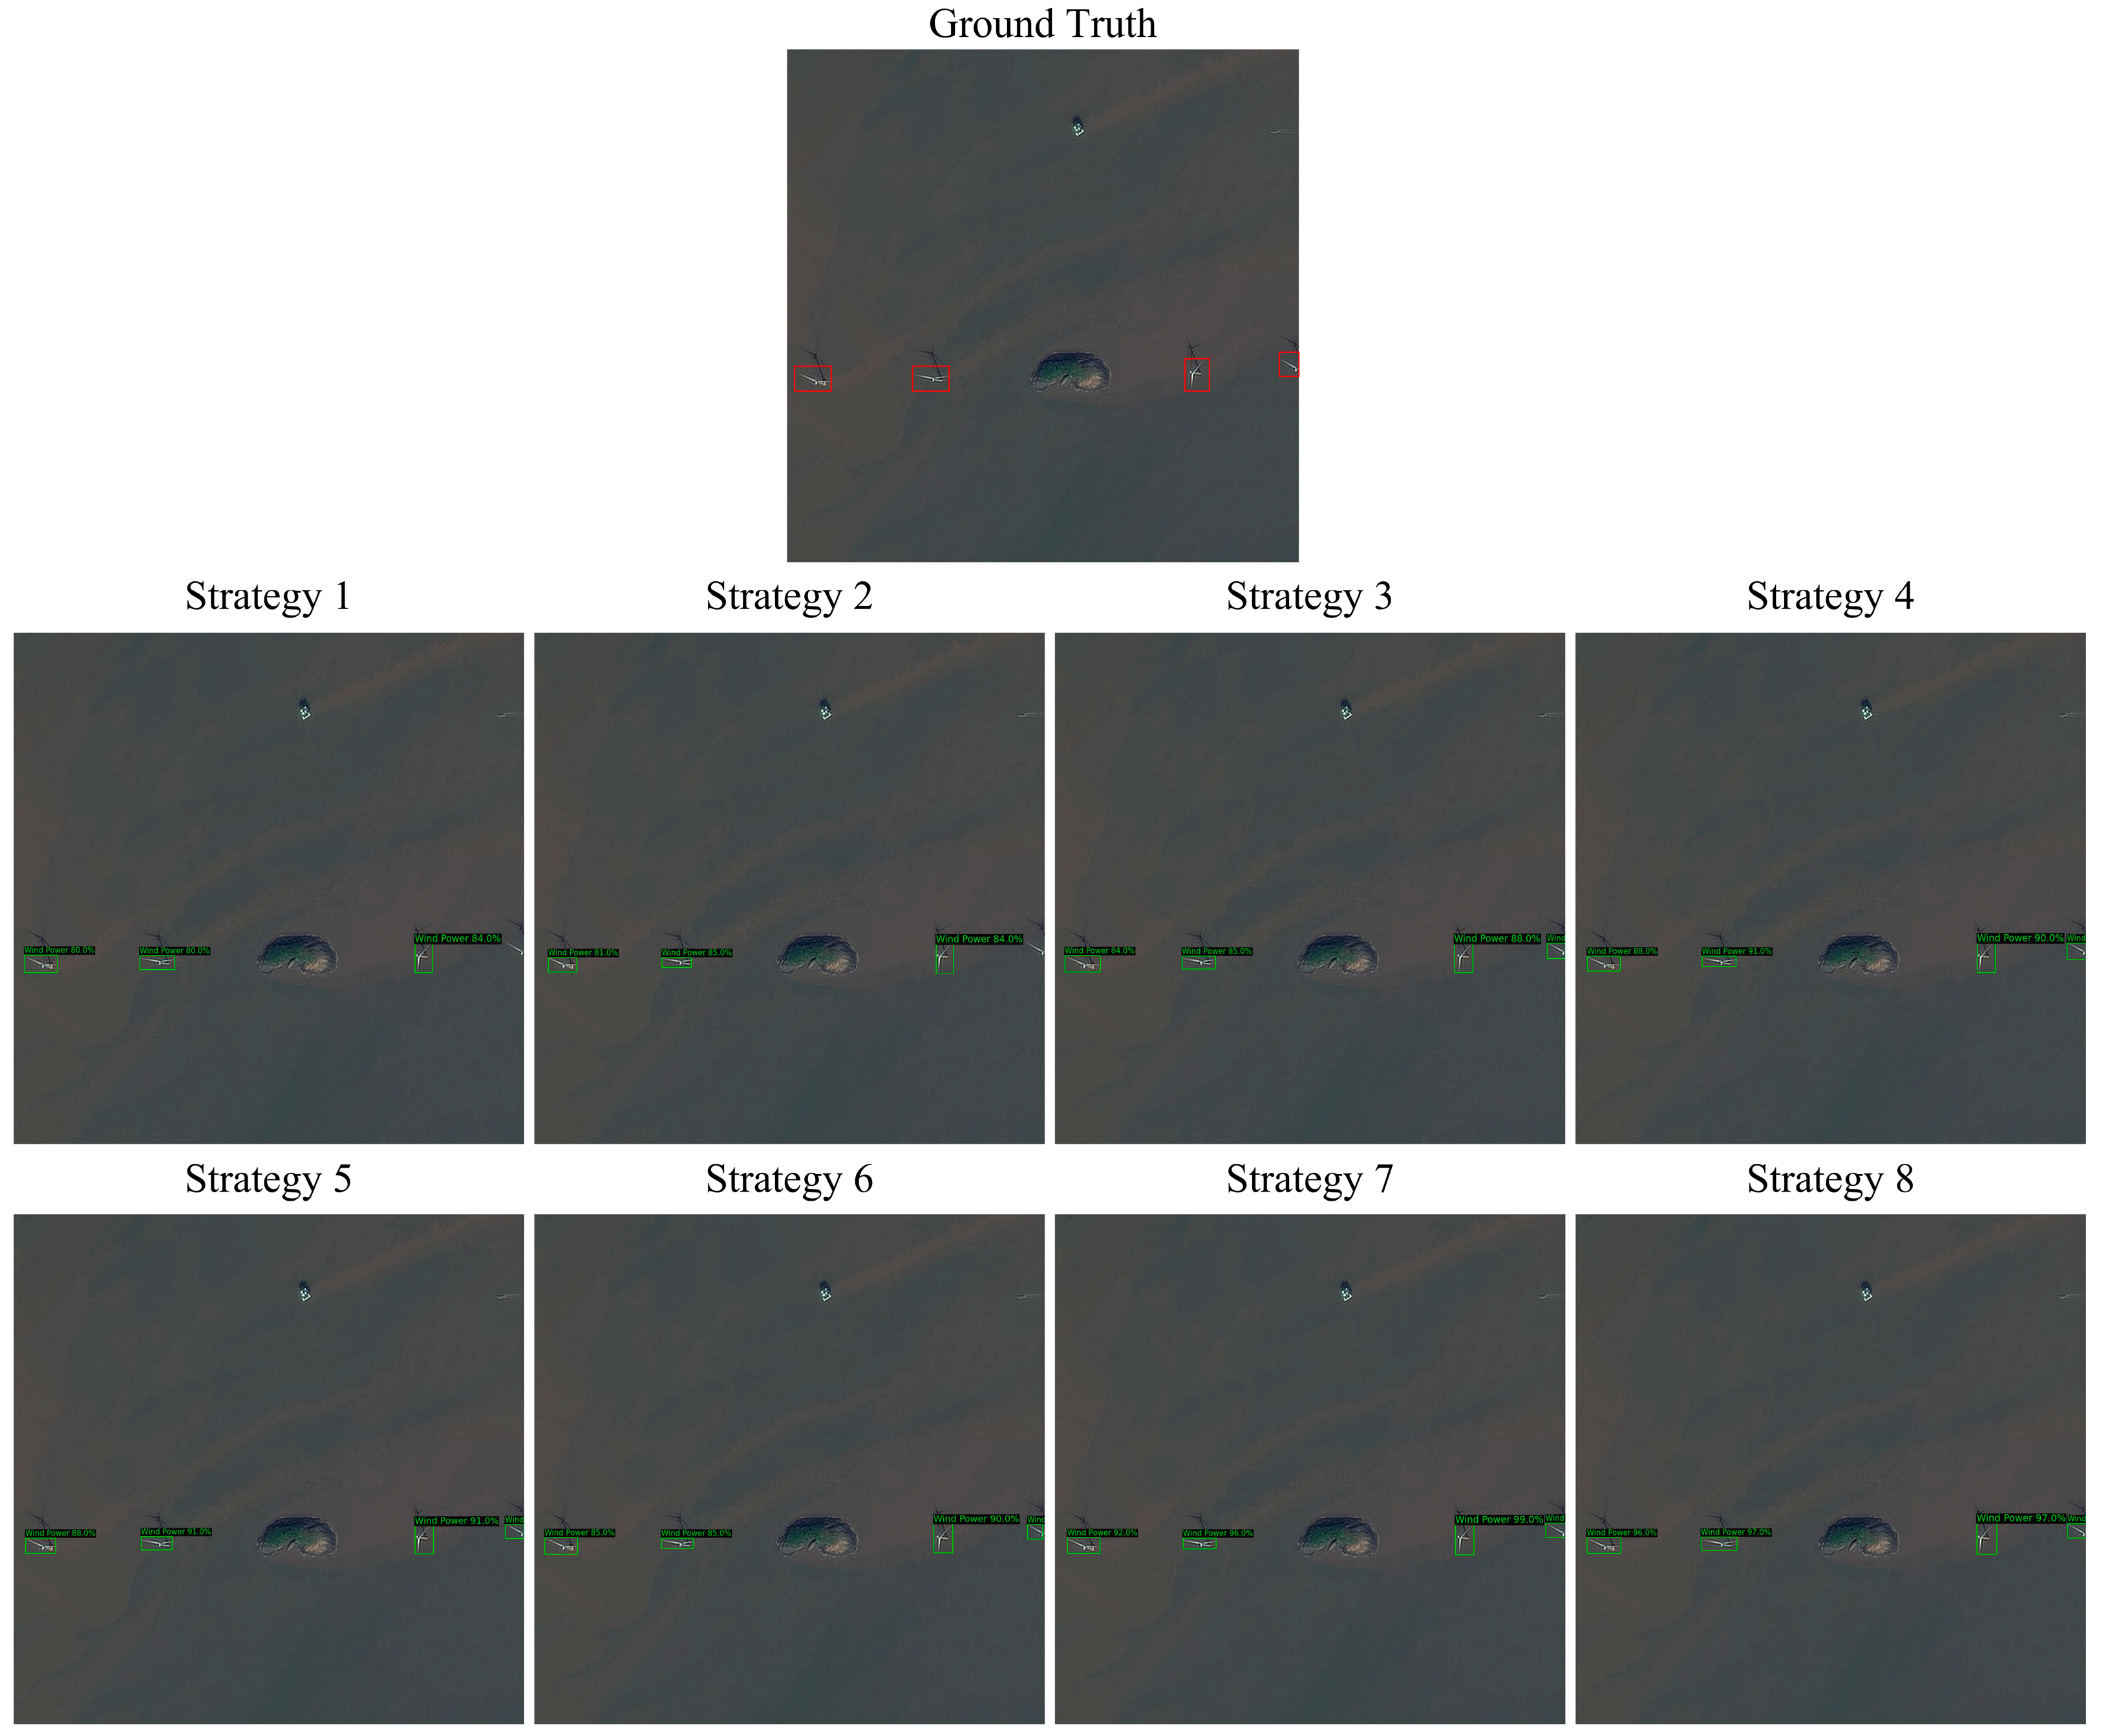
In the realm of ocean engineering, processing satellite remote sensing images often poses challenges due to their immense size, often exceeding 40,000 × 40,000 pixels. To facilitate efficient analysis, it is essential to partition these images into smaller, fixed-sized patches. As depicted in Figure 3, two strategies for image splitting are available: (1) splitting with a gap, and (2) splitting without a gap. Table 1 offers an overview of the advantages and disadvantages of these strategies. For our OWTs detection system, we have chosen Strategy 2 as the pre-processing approach. A more detailed discussion of this choice will be presented in Section 4.4.1.

3.2. Review of Mamba

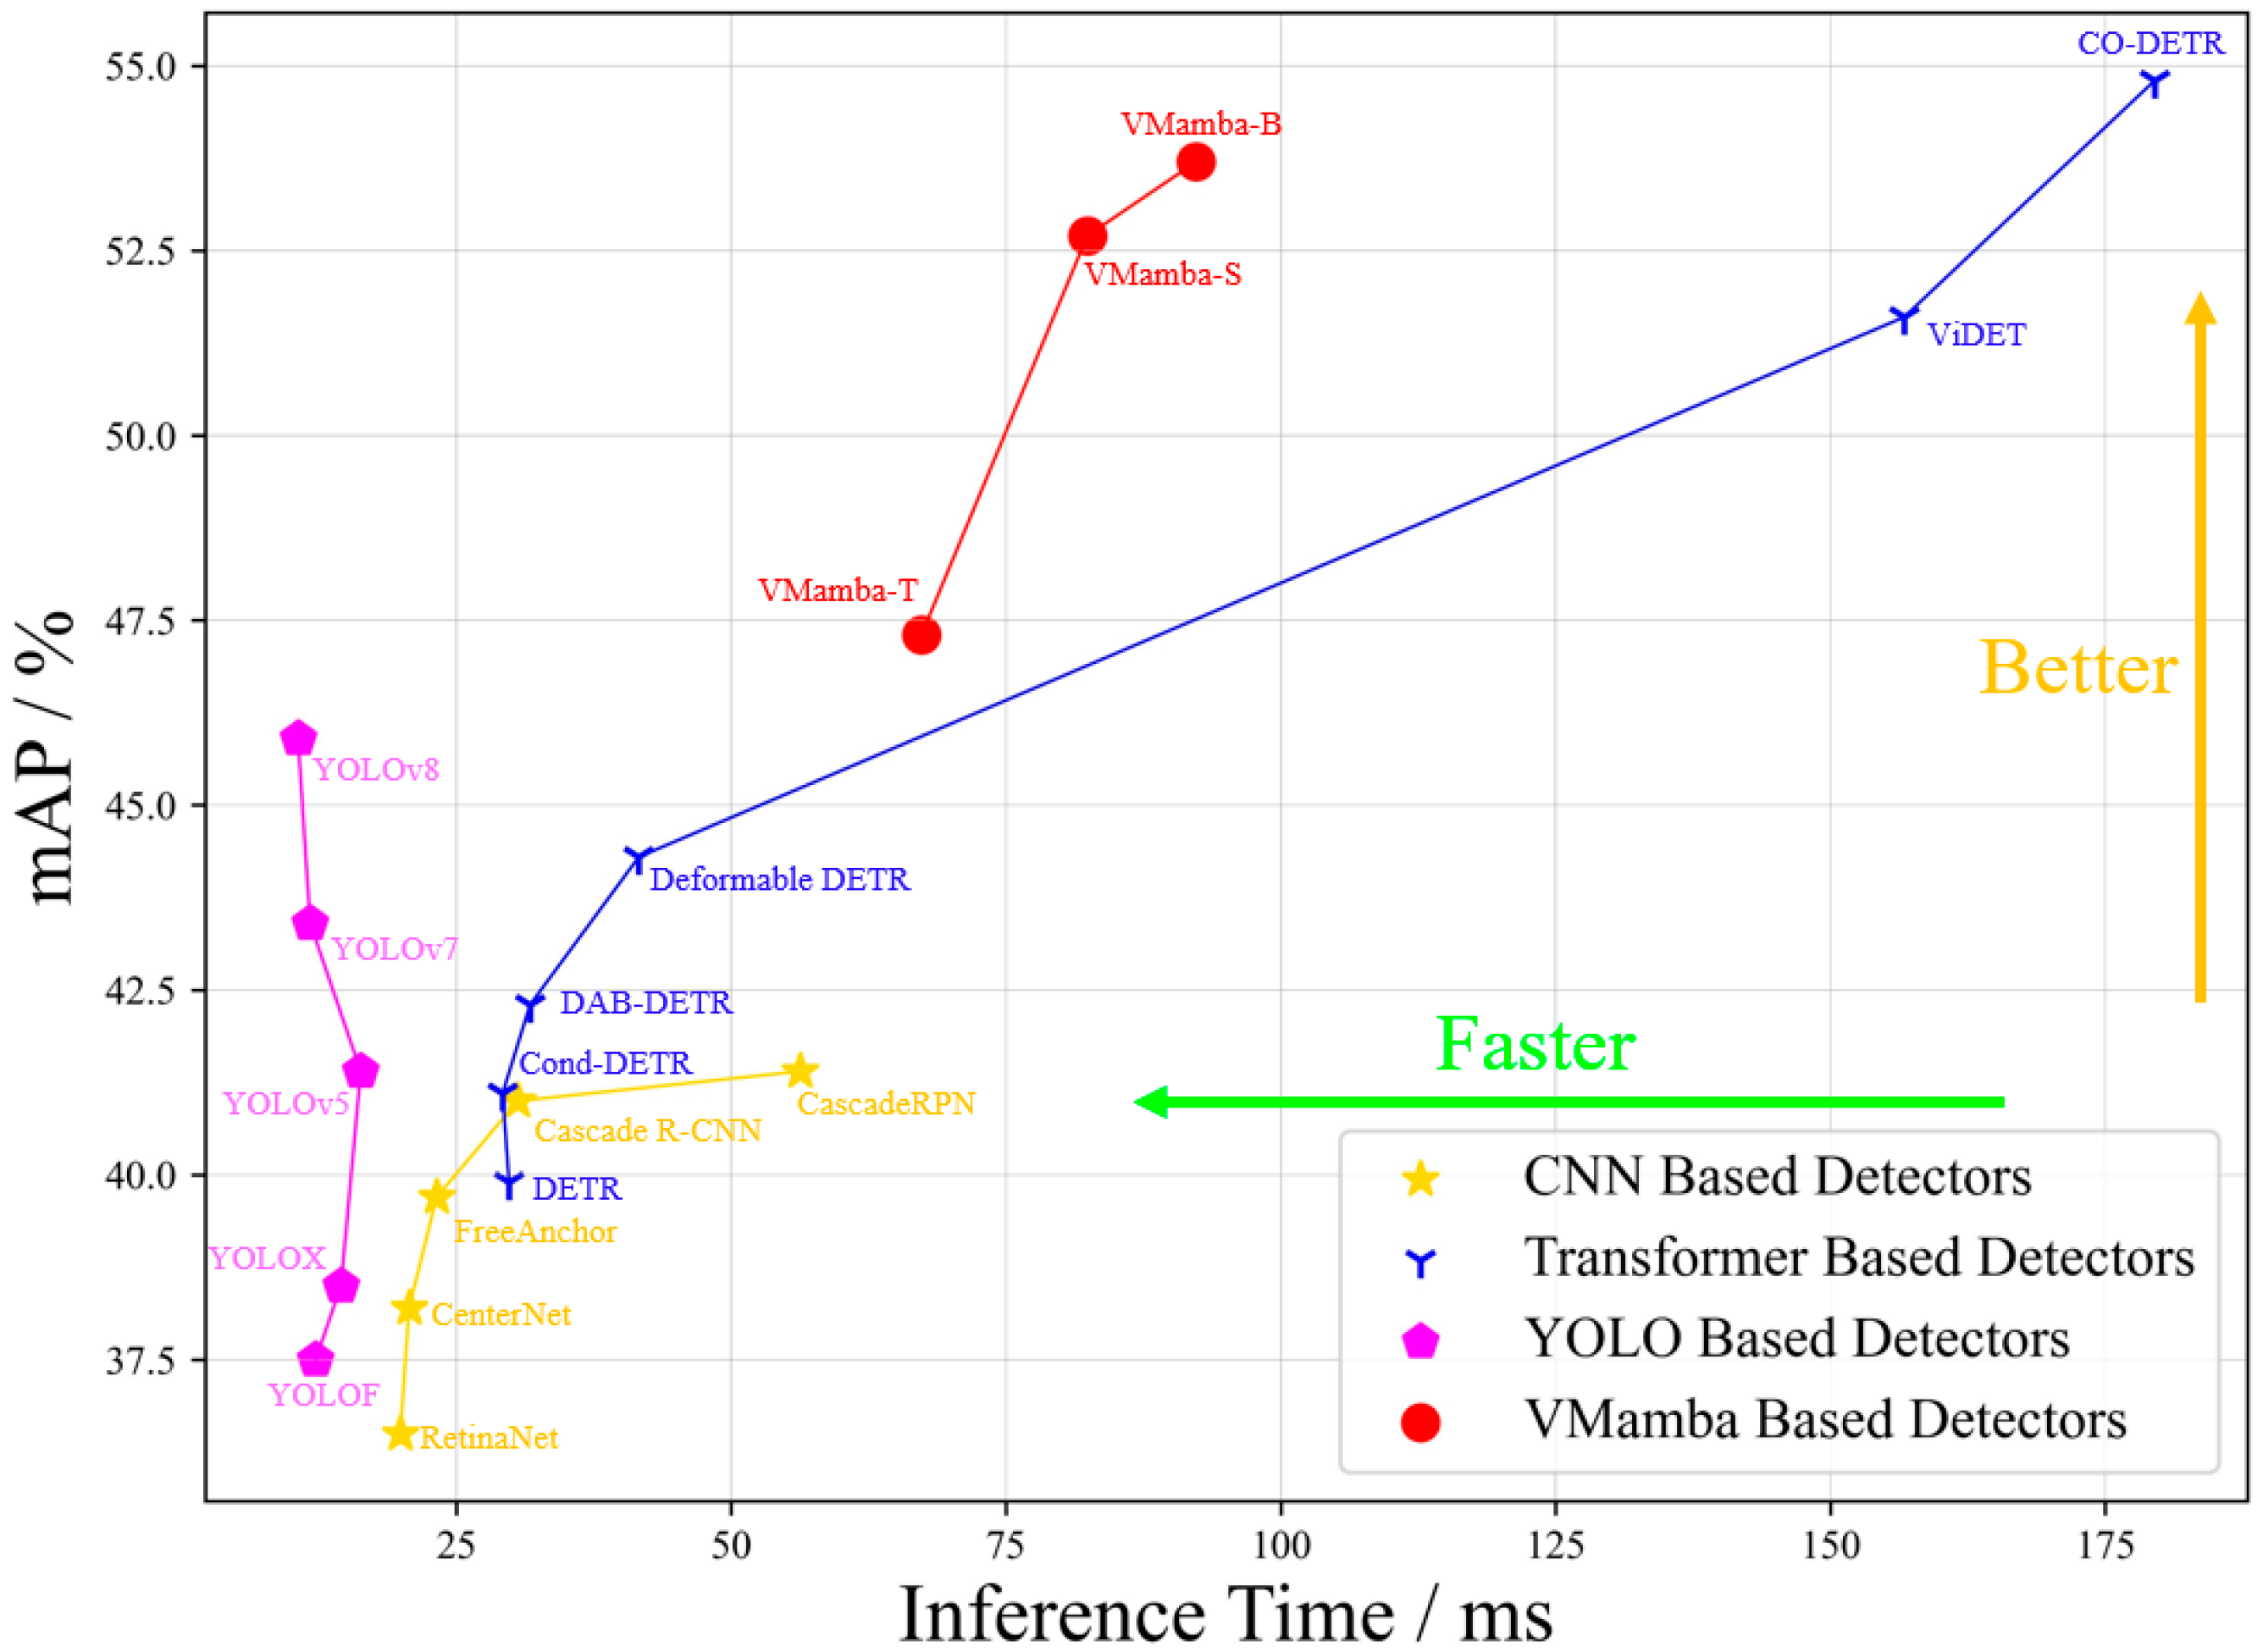
A comparative analysis of object detection methodologies is presented in Figure 4 using the COCO benchmark dataset, where YOLO-series and CNN-based detectors are observed to demonstrate superior inference speeds, while Transformer-based methods achieve enhanced detection accuracy. The computational overhead arises from fundamental architectural differences: global contextual relationships are captured by Transformers through pairwise pixel interactions, whereas localized receptive field processing is exclusively employed in convolutional neural networks. Despite achieving state-of-the-art detection performance (55.3% AP on COCO val2017), Transformer-based approaches are constrained by quadratic computational complexity and memory-intensive operations, rendering them suboptimal for real-time marine monitoring scenarios requiring processing of 40,000 × 40,000-pixel satellite imagery.
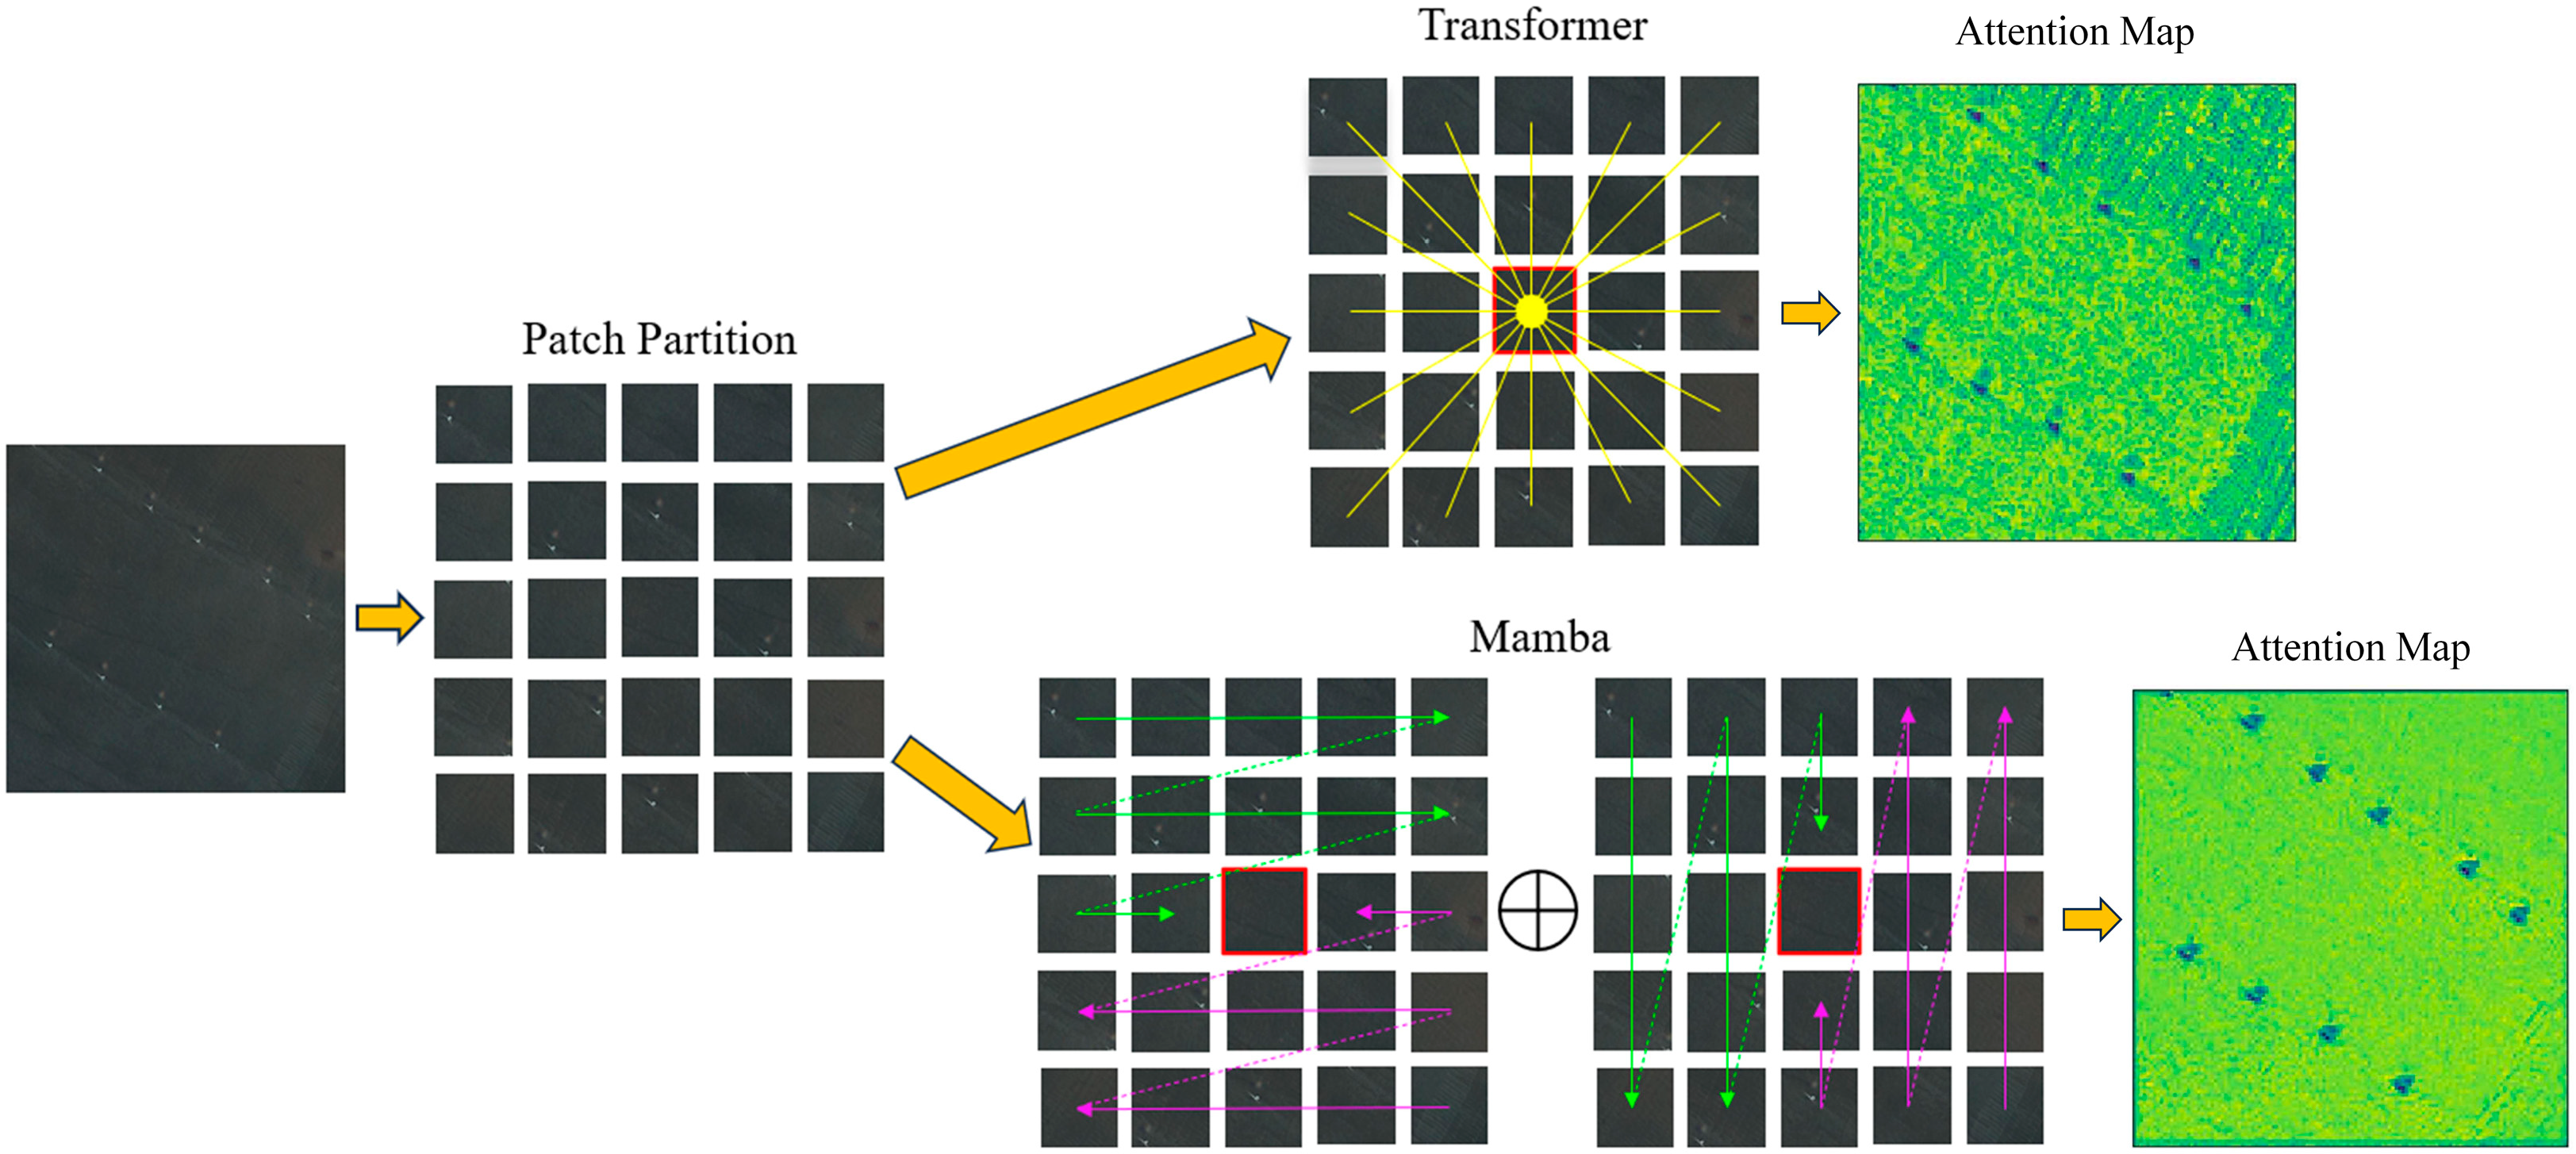
To reconcile this efficiency–performance trade-off while preserving global modeling capabilities, the Vision Mamba architecture (VMamba) [50] has been introduced by researchers, leveraging SSMs with linear time complexity for long-range dependency capture. The divergent architectural approaches of Mamba and Transformer-based global information modeling are visually contrasted in Figure 5 through feature activation maps and computational graph representations.
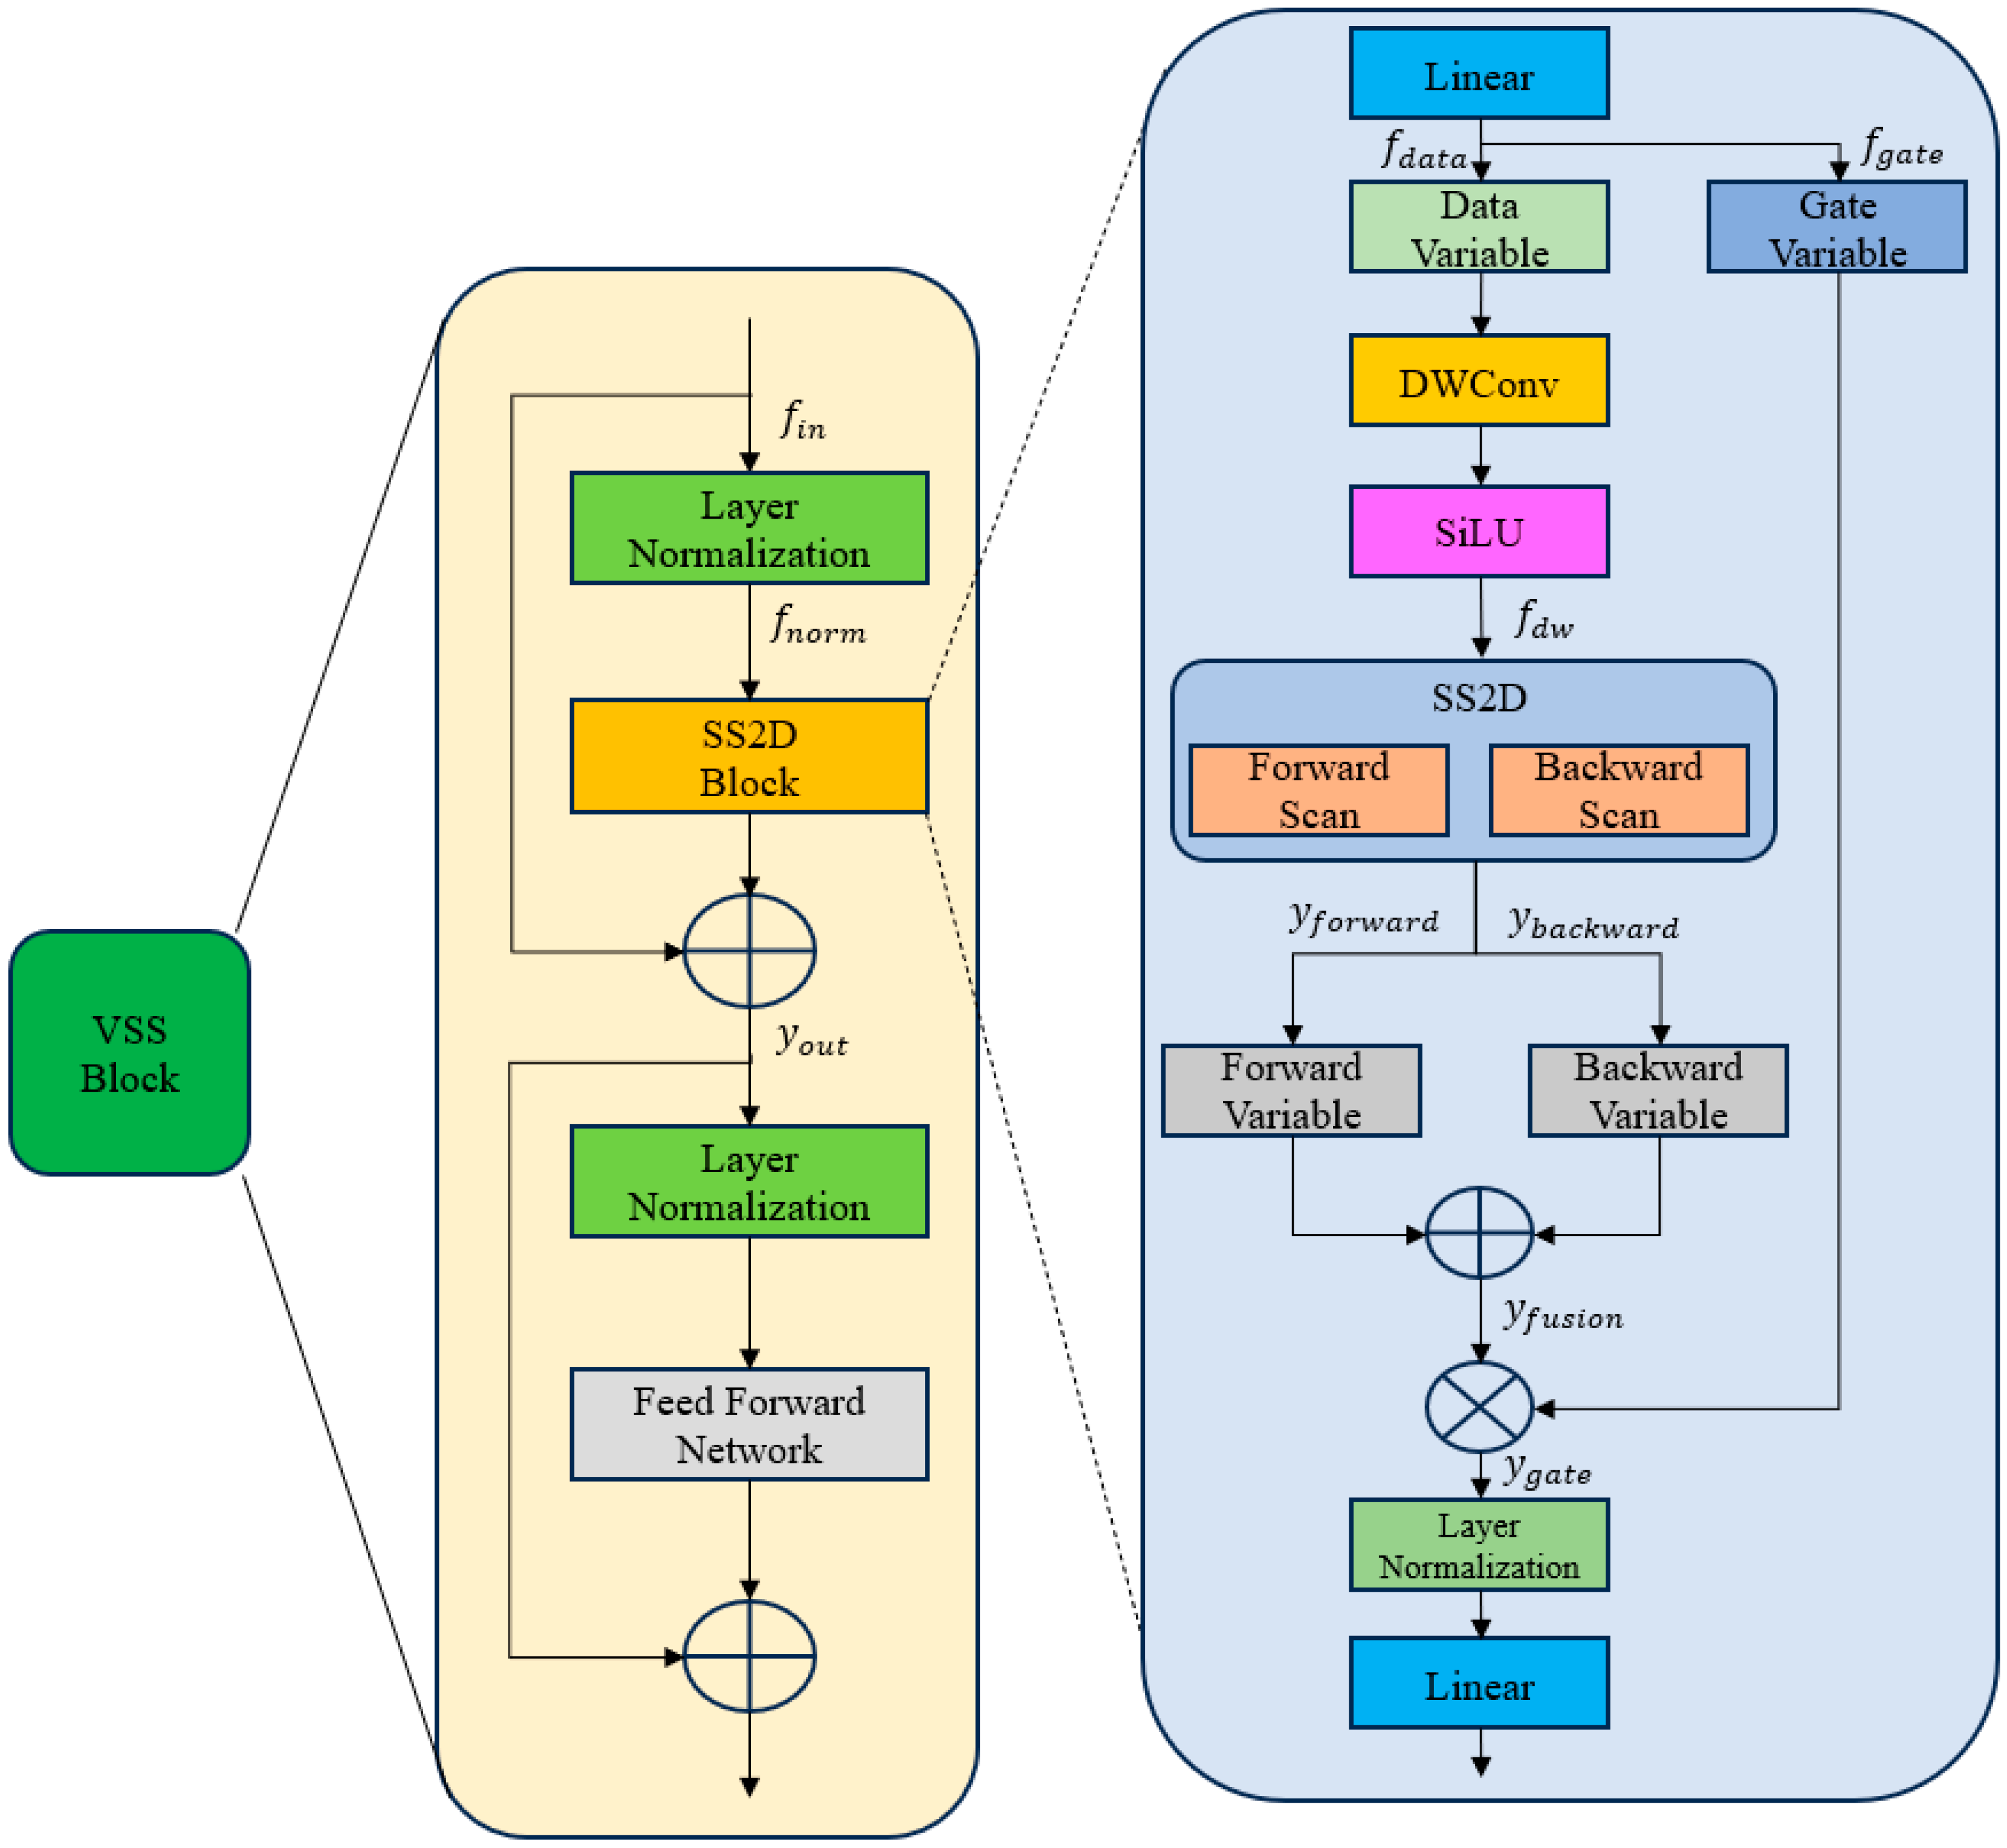
Mamba employs a distinct approach to Transformers for calculating the correlation between different patch partitions. Transformers compute the correlation between the current patch and all other patches, resulting in a computational complexity of O ( N 2 ). In contrast, Mamba uses a combination of forward and backward scanning techniques to achieve this process with a complexity of O(N). Specifically, Mamba utilizes the VSS block to achieve this process, and its structure is illustrated in Figure 6.
Assuming an input feature tensor f i n R B , H , W , C , where B represents the batch size, C is the number of channels, and H and W are the height and width, respectively, VMamba initially employs Layer Normalization (LN) to normalize the information before forwarding it to the 2D Selective Scan module (SS2D). Within the SS2D block, the input feature is initially separated into a gate variable f g a t e R B , H , W , C and a data variable f d a t a R B , H , W , C through a linear operation. This separation is executed as follows:
f n o r m = L N ( f i n )
f d a t a = L i n e a r ( f n o r m )
f g a t e = L i n e a r ( f n o r m )
Subsequently, a depth-wise convolution with SiLU activation is applied on f d a t a , before conducting forward and backward scanning. Specifically,
f d w = S i L U ( D W f d a t a )
where DW represents the depth-wise convolution operation. f d w is then fed into the SS2D block for correlation calculation and feature fusion y f u s i o n between different patches, considering both forward and backward dimensions. The SS2D block can obtain the corresponding outputs y f o r w a r d R B , H , W , C and y b a c k w a r d R B , H , W , C , respectively.
y f o r w a r d = S S 2 D f o r w a r d ( f d w )
y b a c k w a r d = S S 2 D b a c k w a r d ( f d w )
y f u s i o n = y f o r w a r d + y b a c k w a r d
Afterwards, the gating variables f g a t e are multiplied with y f u s i o n to modulate the impact of the input variables on the current state y g a t e . The resulting state is then fused with the input information f i n through a linear layer, yielding the output of the SS2D module, y o u t :
y g a t e = y f u s i o n × f g a t e
y o u t = L i n e a r L N y g a t e + f i n
Through the SS2D module, the correlation between different patches can be effectively modeled. Finally, the VSS block utilizes a Feed Forward Network (FFN) to perform non-linear mapping and feature extraction. As shown in Figure 4, VMamba achieves synchronous improvements in performance and speed.

3.3. CNN Encoding Network

By splitting the image into fixed-sized patches, Mamba-based methods achieve global feature modeling on the image dimension, enhancing the model’s learning capabilities. However, these approaches exhibit two limitations in OWTs detection tasks. Firstly, the patch division approach can cause targets to span multiple patches, resulting in the dissociation of object features and local information. Additionally, since the current detected image is already a segment of the original remote sensing image, further patch division may increase the likelihood of feature fragmentation, leading to missed detections. As exemplified in Figure 7, a comparison between the CNN method and the Mamba approach can illustrate these issues. While Transformer or Mamba detectors can partially address this problem through patch merging operations, the lack of local feature modeling ability remains a hindrance to their application in remote sensing detection tasks.
To enable comprehensive feature representation in marine infrastructure monitoring systems, a parallel CNN encoding branch is integrated with the Mamba-based processing pathway. While conventional convolutional neural networks employ localized filter operations for feature extraction, spatial resolution reduction is typically achieved through stride-based downsampling or max pooling layers. This architectural characteristic has been observed to degrade translational invariance in sliding window detection frameworks, particularly when analyzing satellite imagery with multi-scale OWTs. The inherent inductive bias of convolutional operations, though effective for local pattern recognition, introduces sensitivity to minor spatial displacements in marine infrastructure targets. Such translational variance becomes especially problematic when processing tiled image patches through conventional CNN architectures, where positional discrepancies as small as 5–10 pixels between adjacent patches have been shown to cause huge reductions in detection performance in controlled experiments [51].
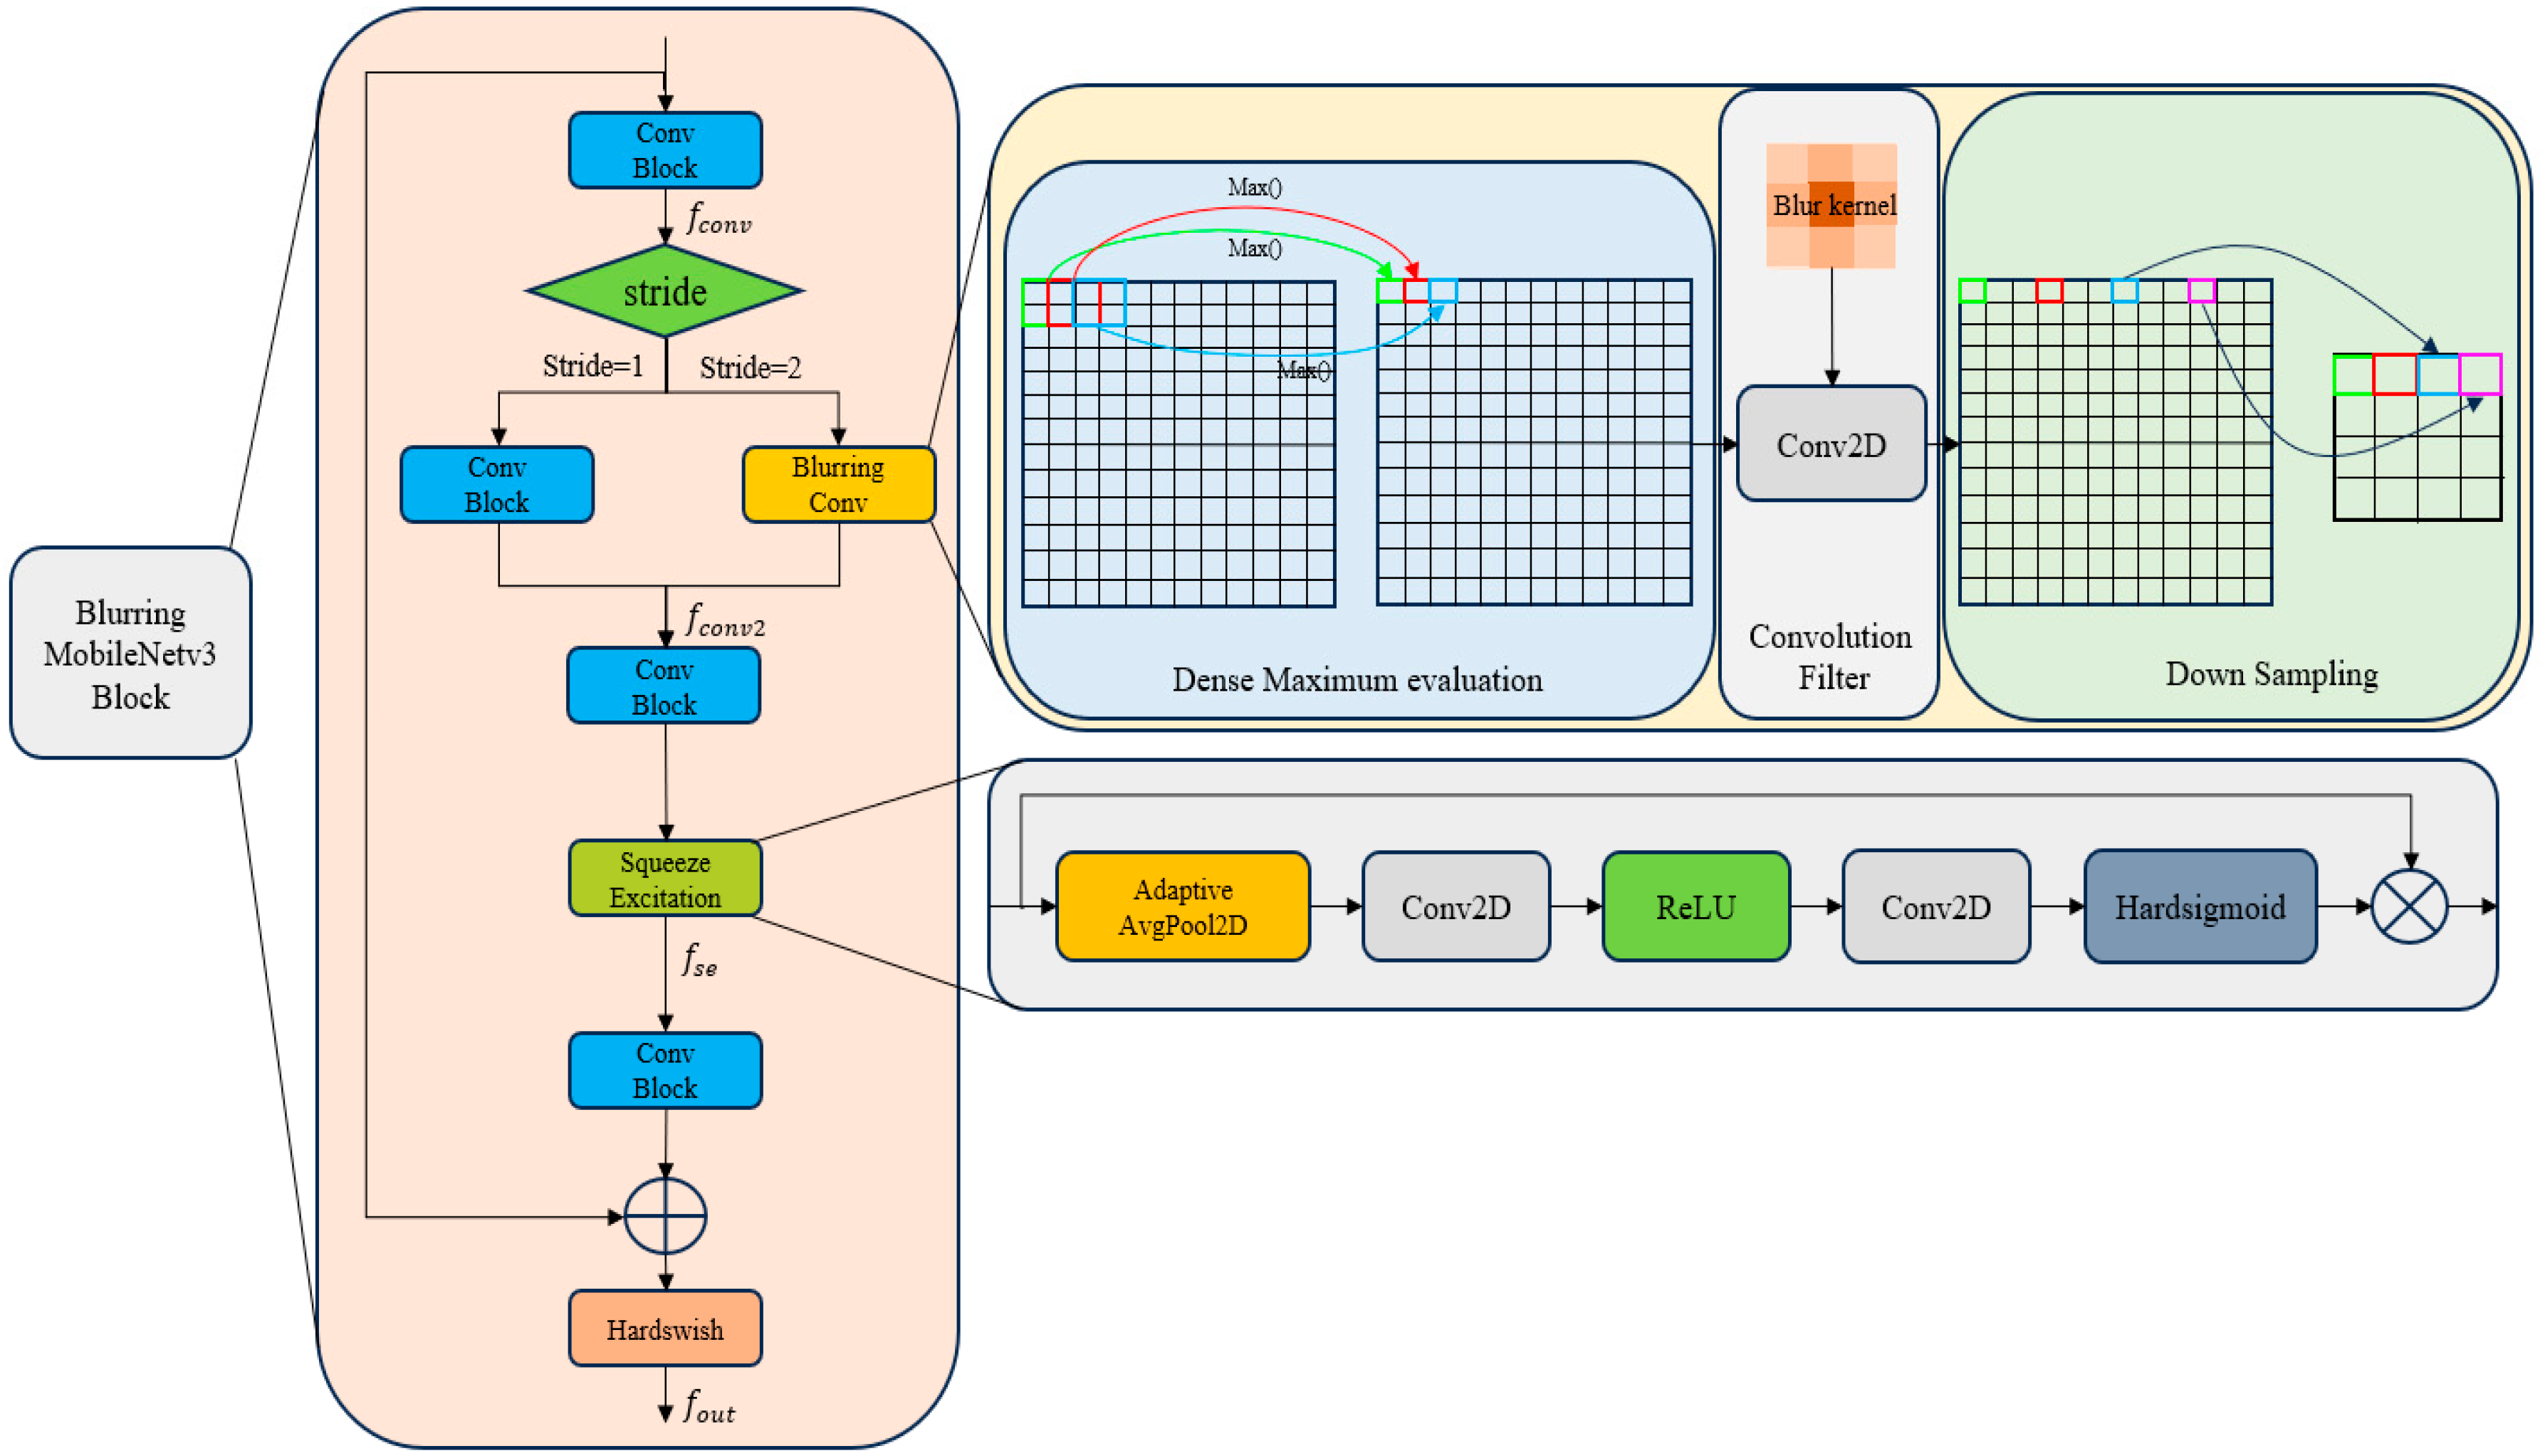
In the context of OWTs training and prediction stages, the sliding window splitting method causes significant left-right shifts for the same target, exacerbating the inherent uncertainty of the original CNN structure and leading to fluctuations in detection scores during the prediction phase. Although data augmentation can mitigate this issue, it does not address the inherent limitations of the CNN structure. In this paper, we propose a new lightweight encoding network, termed B-Mv3, to enhance the robustness of the CNN structure for translational transformations with minimal computation overhead. Its structure is presented in Figure 8.
B-Mv3 is composed of convolutional blocks, blurring convolution modules, and Squeeze-and-Excitation (SE) [52] modules. Given an input feature map denoted as f R B , C , H , W , B-Mv3 initially employs a convolutional operation with a kernel size of one and a stride size of one to perform channel information fusion. Subsequently, B-Mv3 incorporates two selective branches, contingent on whether downsampling is necessary during this stage. If the stride is two, the network utilizes blur convolution modules to facilitate shift-equivariance and invariance learning. This process can be summarized as follows:
f c o n v = R e L U ( B N ( C o n v 2 d ( f ) ) ) R B , C , H , W
f c o n v 2 = R e L U B N C o n v 2 d f c o n v ,   i f   s t r i d e = 1 B l u r i n g   C o n v f c o n v ,   i f   s t r i d e = 2
R e L U x = m a x ( 0 , x )
In the blurring convolution block, we start by using ReflectionPad2d and MaxPooling with a stride of one to determine the maximum response of the input feature, ensuring that the resulting feature map maintains the same dimensions as the input feature. Next, we compute the input weights for the subsequent convolution operation using Formula (13). Finally, we apply group convolution with a stride of two to calculate the responses across different channel groups. These processes can be summarized as follows:
f m a x = M a x P o o l i n g ( R e f l e c t i o n P a d 2 d ( f c o n v ) )
f k e r n e l = f i , j i = 0 H j = 0 W f i , j , i H ,   j W
f c o n v 2 = C o n d 2 d ( f m a x ,   w e i g h t = f k e r n e l ,   s t r i d e = 2 ,   g r o u p s = C )
The downsampled feature map generated from the blur pooling block can achieve shift invariance by employing dynamic kernel convolution with cross steps. Furthermore, we integrate a lightweight channel attention mechanism using the SE module to enhance the model’s feature representation and anti-interference capabilities. The SE module enables the CNN network to prioritize salient channels, while suppressing irrelevant information.

3.4. Feature Alignment Module

3.4.1. Channel Alignment Process

In our OWTs detection system, global contextual relationships are modeled by the Mamba processing branch, while localized structural patterns are extracted through the parallel CNN pathway. To address the inherent divergence between these different feature representations, a dual-stage feature alignment module is proposed for cross-model integration, and its structure is presented in Figure 9.
The channel alignment module consists of two key submodules: channel alignment and channel enhancement. The channel alignment submodule is designed to merge information from Mamba and CNN features, while the channel enhancement submodule amplifies the responses of weaker features across all channels, thereby enhancing the model’s capturing ability.
Given input features f m a m b a R B , C , H , W and f c n n R B , C , H , W , the feature alignment process proceeds as follows: Initially, AdaptiveAvgPooling is applied to both f m a m b a and f c n n , transforming them into a 1 × 1 × C format to remove positional influence on the channel alignment process. Subsequently, point-wise convolution independently integrates channel information, and the results are combined through an addition operation to produce f f u s e c h . To dynamically adjust the contributions of the Mamba and CNN branches, a sigmoid function is introduced to compute response weight for f f u s e c h . Finally, these weights are multiplied with the Mamba input feature, yielding the channel alignment output f a l i g n c h .
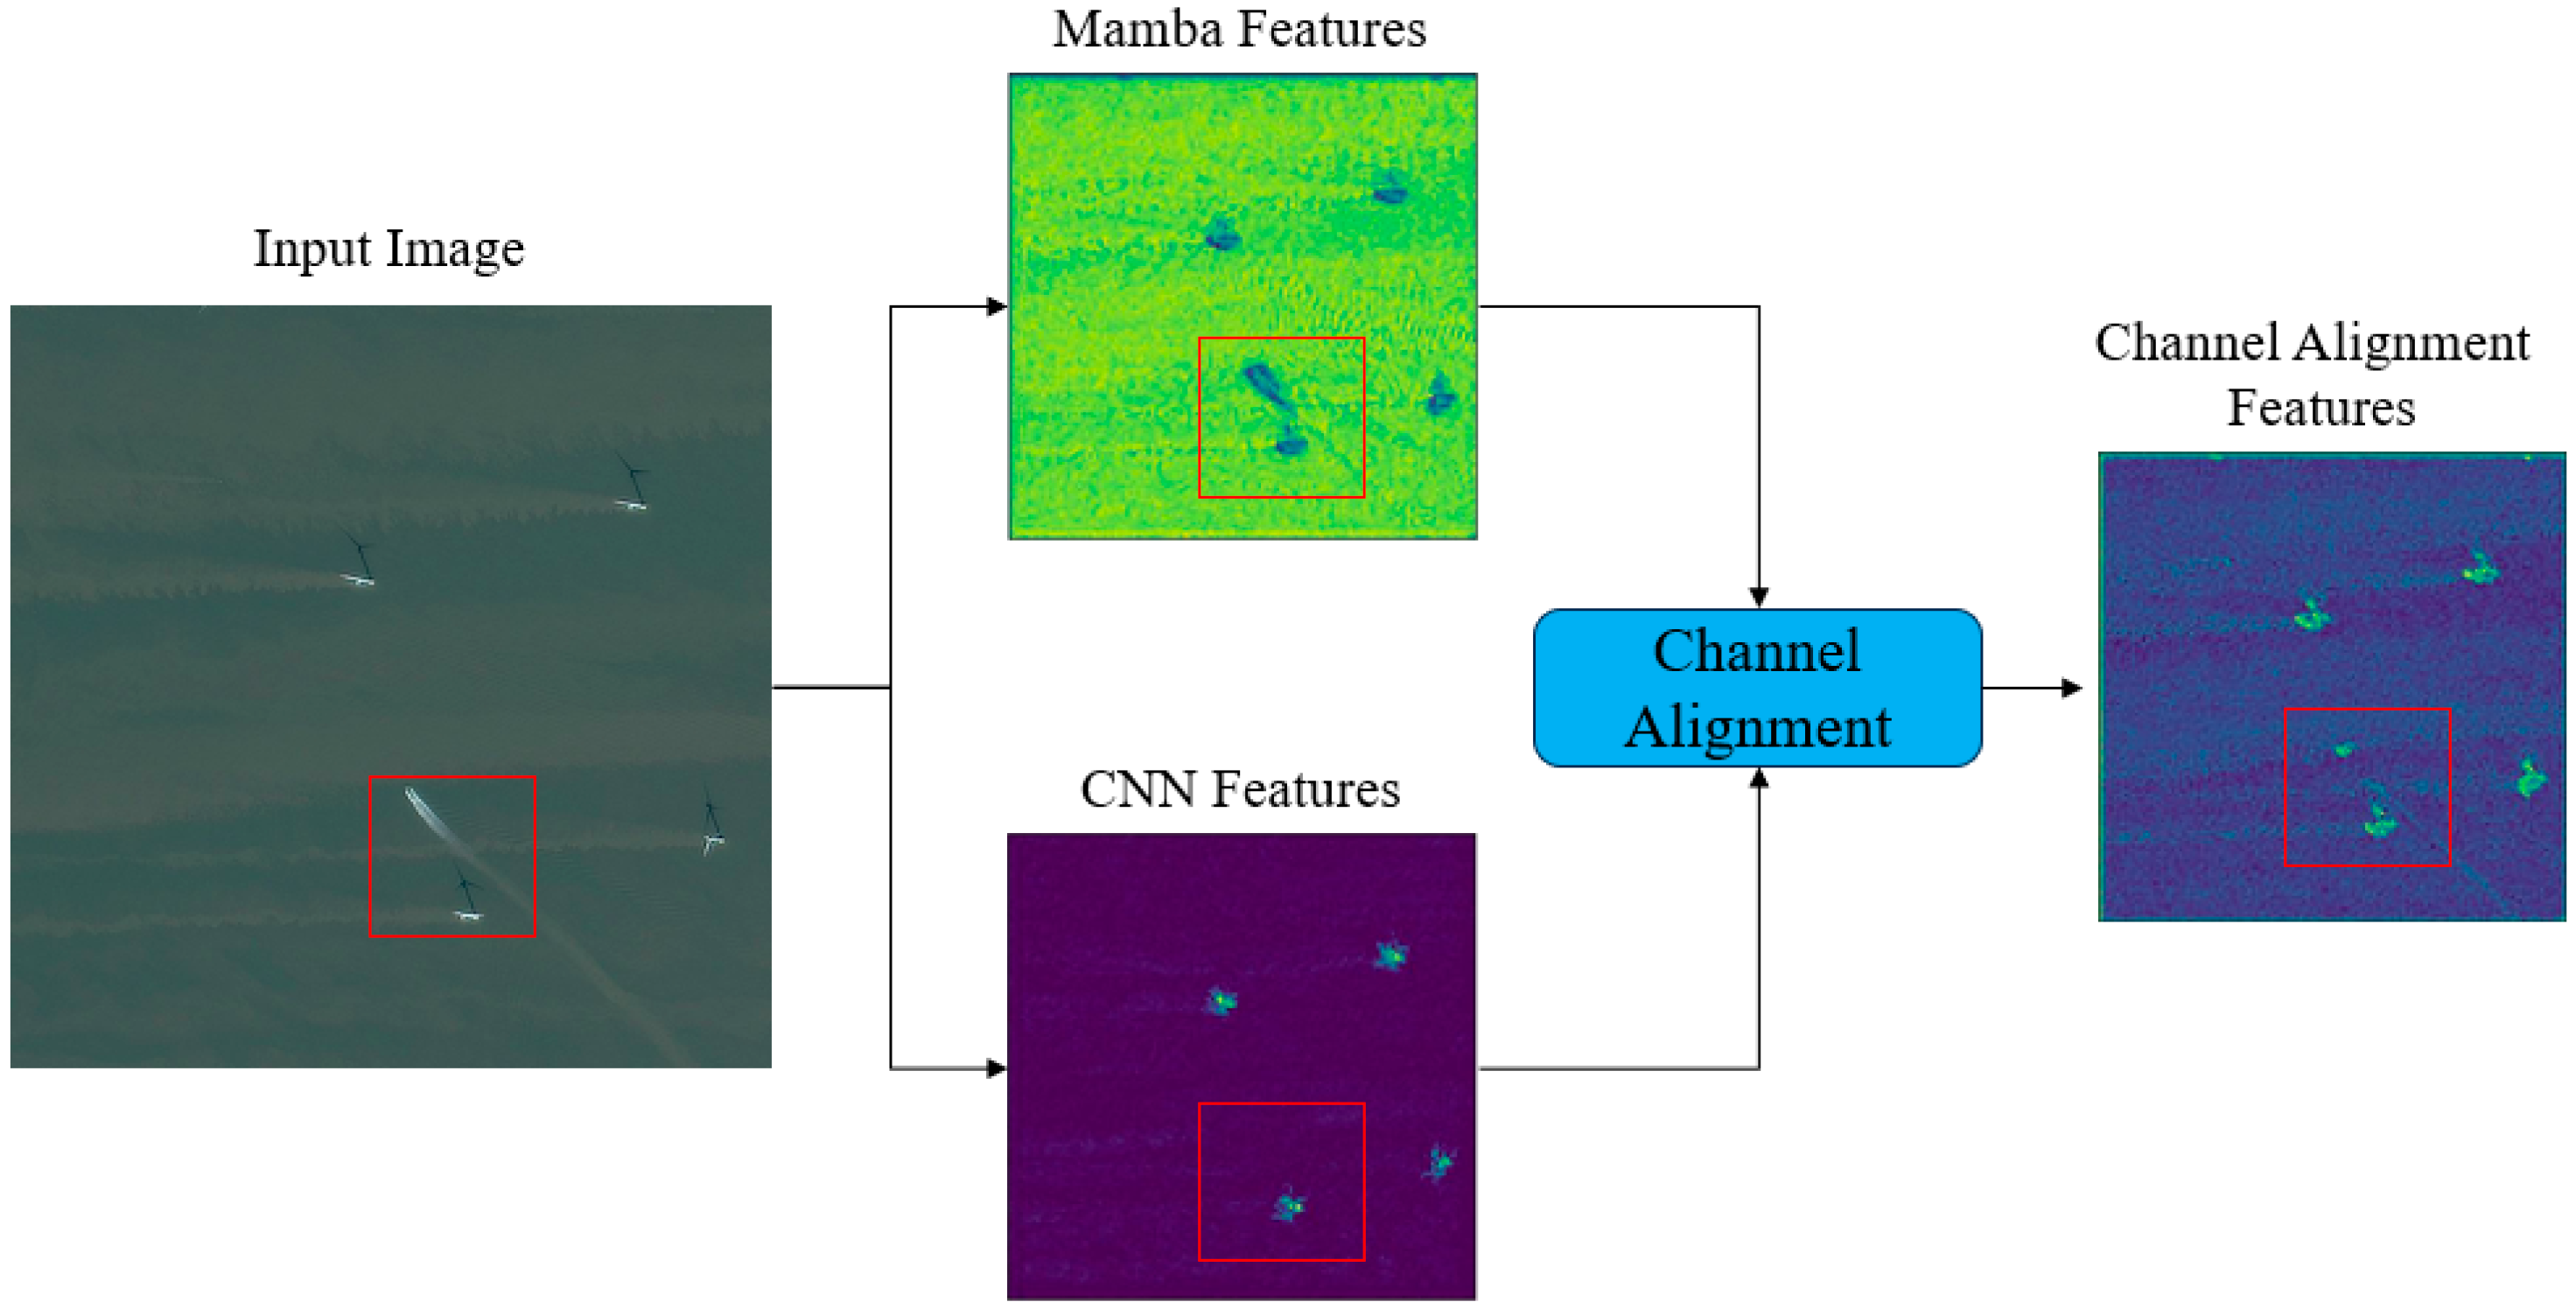
As illustrated in Figure 10, water surface turbulence features in marine environments were misclassified as wind turbine components by the Mamba processing branch due to excessive reliance on global contextual dependencies. This phenomenon is attributed to the Mamba architecture’s inherent bias toward modeling long-range spatial correlations at the expense of local discriminative features, particularly when wind energy infrastructure appears in adjacent maritime regions. The misidentification challenge was effectively mitigated through synergistic integration with CNN-derived local pattern representations, which leverage convolutional operations to capture local texture distinctions between transient water splashes and OWTs.
To address the low signal-to-noise characteristics of OWTs in marine environments, a channel enhancement submodule was developed for amplifying weakly responsive features in remote sensing data. The module architecture begins with adaptive max pooling operations applied along the channel dimension to extract peak activation patterns corresponding to OWTs. These extremal features are subsequently normalized through sigmoidal attention weighting, where channel-wise importance coefficients are computed via a parametric softmax function to suppress noise from interferences. The derived attention map is then element-wise multiplied with the channel-aligned feature tensor f a l i g n c h to produce recalibrated representations.

3.4.2. Positional Alignment Process

Due to the limited receptive field of convolutional operations, CNNs struggle to model long-distance correlations. Consequently, directly fusing CNN features with Mamba features from the perspective of the positional dimension can create competition between these two branches, resulting in degraded performance. To address this issue, we introduce dilated convolutions to enlarge the receptive field of the CNN branch before fusion, enabling it to capture more long-distance features and reducing the discrepancy with Mamba features from the positional dimension.
Initially, we apply multi-scale modeling to the input CNN features using convolutions with dilations of 1, 3, and 5, generating f c n n 1 , f c n n 3 , and f c n n 5 . These features are then aggregated through point-wise addition. Subsequently, we perform channel compression on both the Mamba and CNN features using 1 × 1 convolutional kernels, obtaining feature maps of size H × W × 1 , denoted as f m a m b a p o s and f c n n p o s . By spatially adding these features together, we obtain the position alignment feature map f f u s e p o s . To determine the importance of each position, we employ a sigmoid function to compute weights at each pixel position, which are then multiplied with the Mamba features to yield the final position alignment output f a l i g n p o s . Like the channel alignment module, we incorporate a position enhancement submodule to emphasize the positional relevance of OWTs in remote sensing images. Finally, we fuse the outputs of the channel and position alignment modules using a 1 × 1 convolution, generating an enhanced feature representation that incorporates both channel and positional cues.
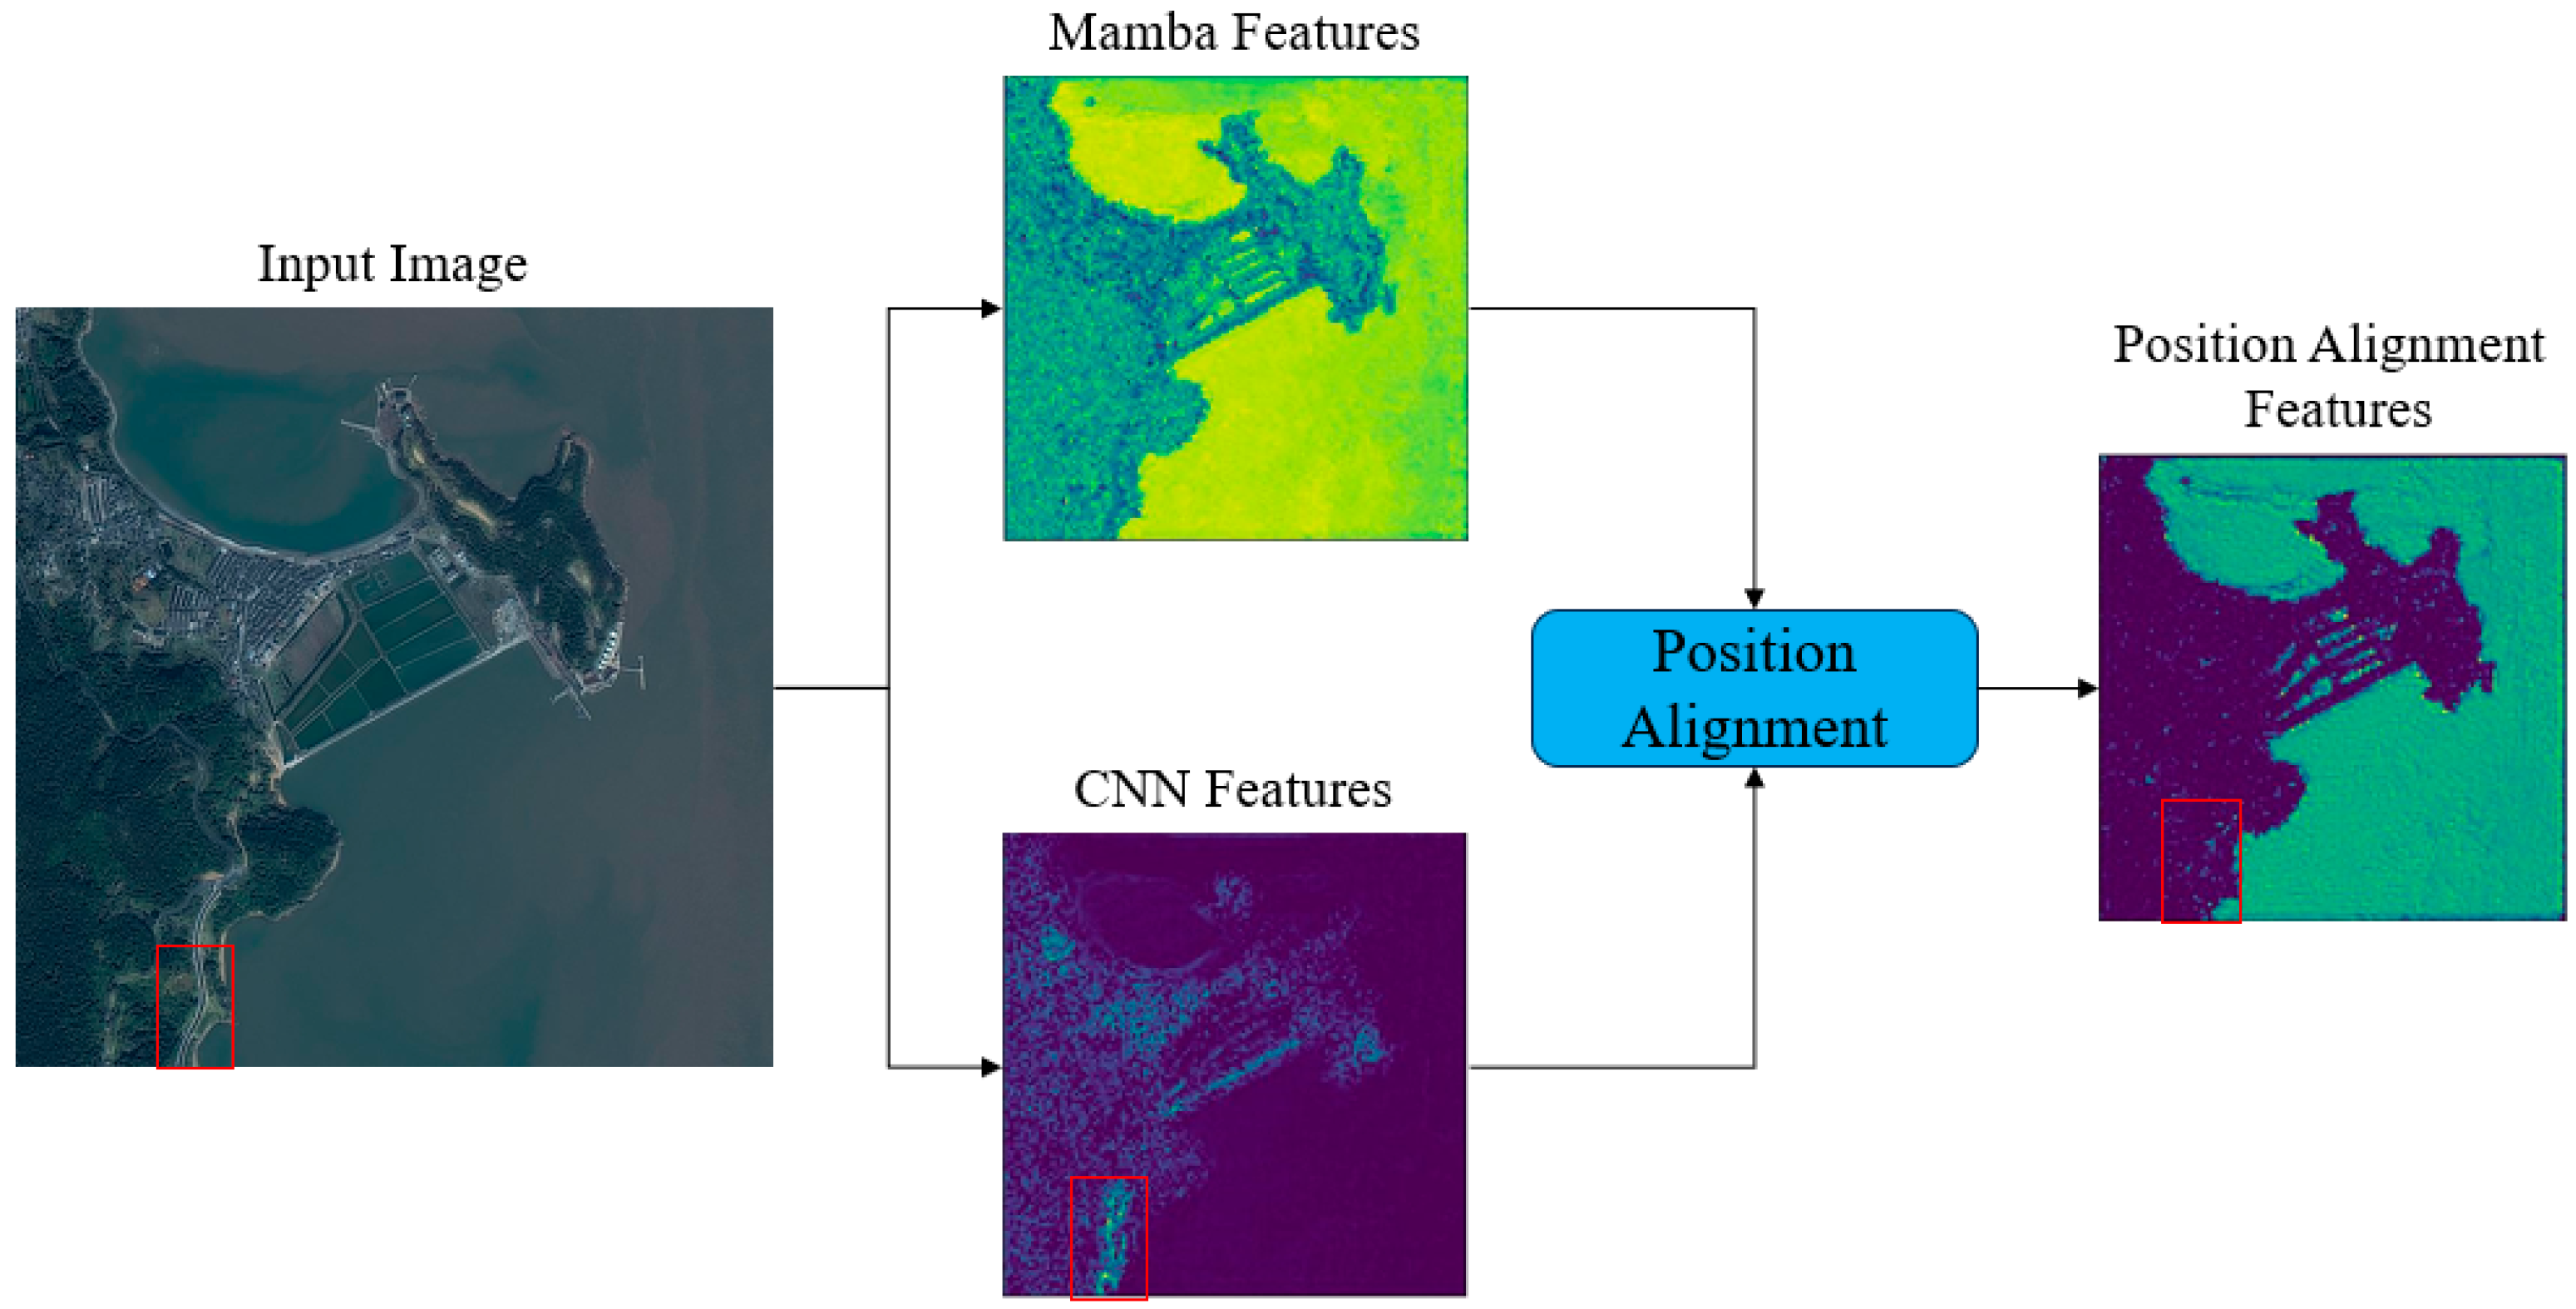
As demonstrated in Figure 11, convolutional neural networks are observed to exhibit localized attention biases, misclassifying terrestrial linear features such as pale infrastructure corridors as potential OWTs due to their textural similarity to turbine arrays. Conversely, the Mamba architecture is engineered to prioritize global geospatial relationships, enabling robust differentiation between oceanic regions and coastal zones through large-scale pattern analysis of synthetic aperture radar (SAR) imagery. This global contextual awareness is leveraged to enhance maritime-specific target discrimination by hierarchically integrating Mamba-derived positional priors with CNN-extracted local texture descriptors.

3.5. Loss Functions

A multi-task loss l o s s t o t a l is introduced into our OWTDNet, formed as follows:
l o s s t o t a l = w m l o s s m a m b a + w c l o s s C N N
Here, l o s s m a m b a represents the loss values in the Mamba branch, and the CNN branch’s loss is denoted as l o s s C N N . w m and w c are hyper-parameters used to balance the different loss weights, set to 1.0 and 0.2, respectively. The loss function for the Mamba and CNN branches comprises a box loss and a classification loss, defined by the following formula:
l o s s m a m b a / C N N = l o s s b o x + l o s s c l s
l o s s c l s = α 1 y p r e d β log y p r e d , y G T = 1   ( 1 α ) y p r e d β log ( 1 y p r e d ) , y G T = 0
I o U A , B = | A B | | A B |
l o s s b o x = 1 I o U y p r e d , y G T + ρ 2 y c e n t e r p r e d , y c e n t e r G T c 2 + γ v
Here, l o s s b o x refers to the box regression loss, and l o s s c l s is the box classification loss. In this paper, we employ the CIoU loss for box regression and the focal loss for box classification. A detailed discussion regarding the loss functions is provided in Section 4.4.5. α and β indicate the penalty factors of focal loss, with values of 0.25 and 5, respectively. c represents the diagonal distance between the smallest box that encloses the predicted box and the ground truth box. y p r e d and y G T represent the network predictions and the ground truths, respectively. y c e n t e r p r e d and y c e n t e r G T denote the center points of the predictions and the ground truths, respectively. The calculation formula for CIoU loss are as follows:
ρ 2 y c e n t e r p r e d = x 1 , y 1 , y c e n t e r G T = ( x 2 , y 2 ) = ( x 2 x 1 ) 2 + ( y 2 y 1 ) 2
γ = v 1 I o U y p r e d , y G T + v
v = 4 π 2 ( arctan w G T h G T a r c t a n ( w p r e d h p r e d ) )
Here, w G T and h G T represent the width and height of the ground truth box, while w p r e d and h p r e d indicate the width and height of the prediction box. Additionally, the detection head of the CNN branch is only active during the training phase and is used to guide the gradient descent of the CNN network.

4. Results

4.1. Satellite Datasets

For our OWTs monitoring system, we collected 276 satellite remote sensing images of ocean engineering construction near Shanghai, Zhejiang, and Fujian provinces in China from November 2022 to March 2024. These images were obtained using satellites named GaoFen-1 (GF1), GaoFen-2 (GF2), GaoFen-7 (GF7), ZiYuan-1 (ZY1), and ZiYuan-3 (ZY3).
To ensure the robustness and generalization of our analysis, we meticulously partitioned the dataset into the following subsets: A total of 180 images, corresponding to 294,300 patch images, were utilized as the training set. The remaining 96 remote sensing images, comprising 97,776 patches, were reserved for validation and testing purposes. The collection parameters and the corresponding latitude and longitude ranges of these satellites are shown in Table 2.

4.2. Experimental Setups

The hardware and software configurations used in this study are detailed in Table 3. To validate the efficacy of our method, we incorporated various object detection approaches for comparative analysis. The training configurations specific to these methods are presented in Table 4. All models used consistent training and test data to ensure the fairness of the comparison. In addition, the optimizer used in all models was SGD, and the weight decay value was 0.0005.

4.3. Main Results

In this section, we will discuss the performance comparison across the different detection models, focusing on the following metrics: AP, speed, FLOPs, and GPU memory usage. For the AP metric, we employed three specific indicators: A P 50 95 , A P 50 , and A P 75 .
Specifically, A P 50 and A P 75 represent the precision at IoU thresholds exceeding 0.5 and 0.75, respectively.
A P 50 = T P T P + F P , T P ,   I o U P r e d b o x , G T b o x 0.5 F P ,   I o U P r e d b o x , G T b o x < 0.5
A P 75 = T P T P + F P , T P ,   I o U P r e d b o x , G T b o x 0.75 F P ,   I o U P r e d b o x , G T b o x < 0.75
A P 50 95 = A P 50 + A P 55 + + A P 95 10
where TP indicates true positives, and FP indicates false positives. Similarly, A P 50 95 calculates the average precision from 0.5 to 0.95 with an increment of 0.05 in IoU threshold. For the speed evaluation, we measured the inference time for both the individual patch image ( S p a t c h ) and the entire remote sensing image ( S r s ):
S p a t c h = i = 0 K p a t c h S p a t c h i K p a t c h
S r s = j = 0 K r s S p a t c h j K r s
where K p a t c h is the number of patch images that need to be calculated (set to 100 in this study), and S p a t c h i represents the prediction time for the i-th patch image. K r s is the number of remote sensing images counted (set to 10 in this study), and S p a t c h j represents the cumulative prediction time for all patch images within the j-th remote sensing data.
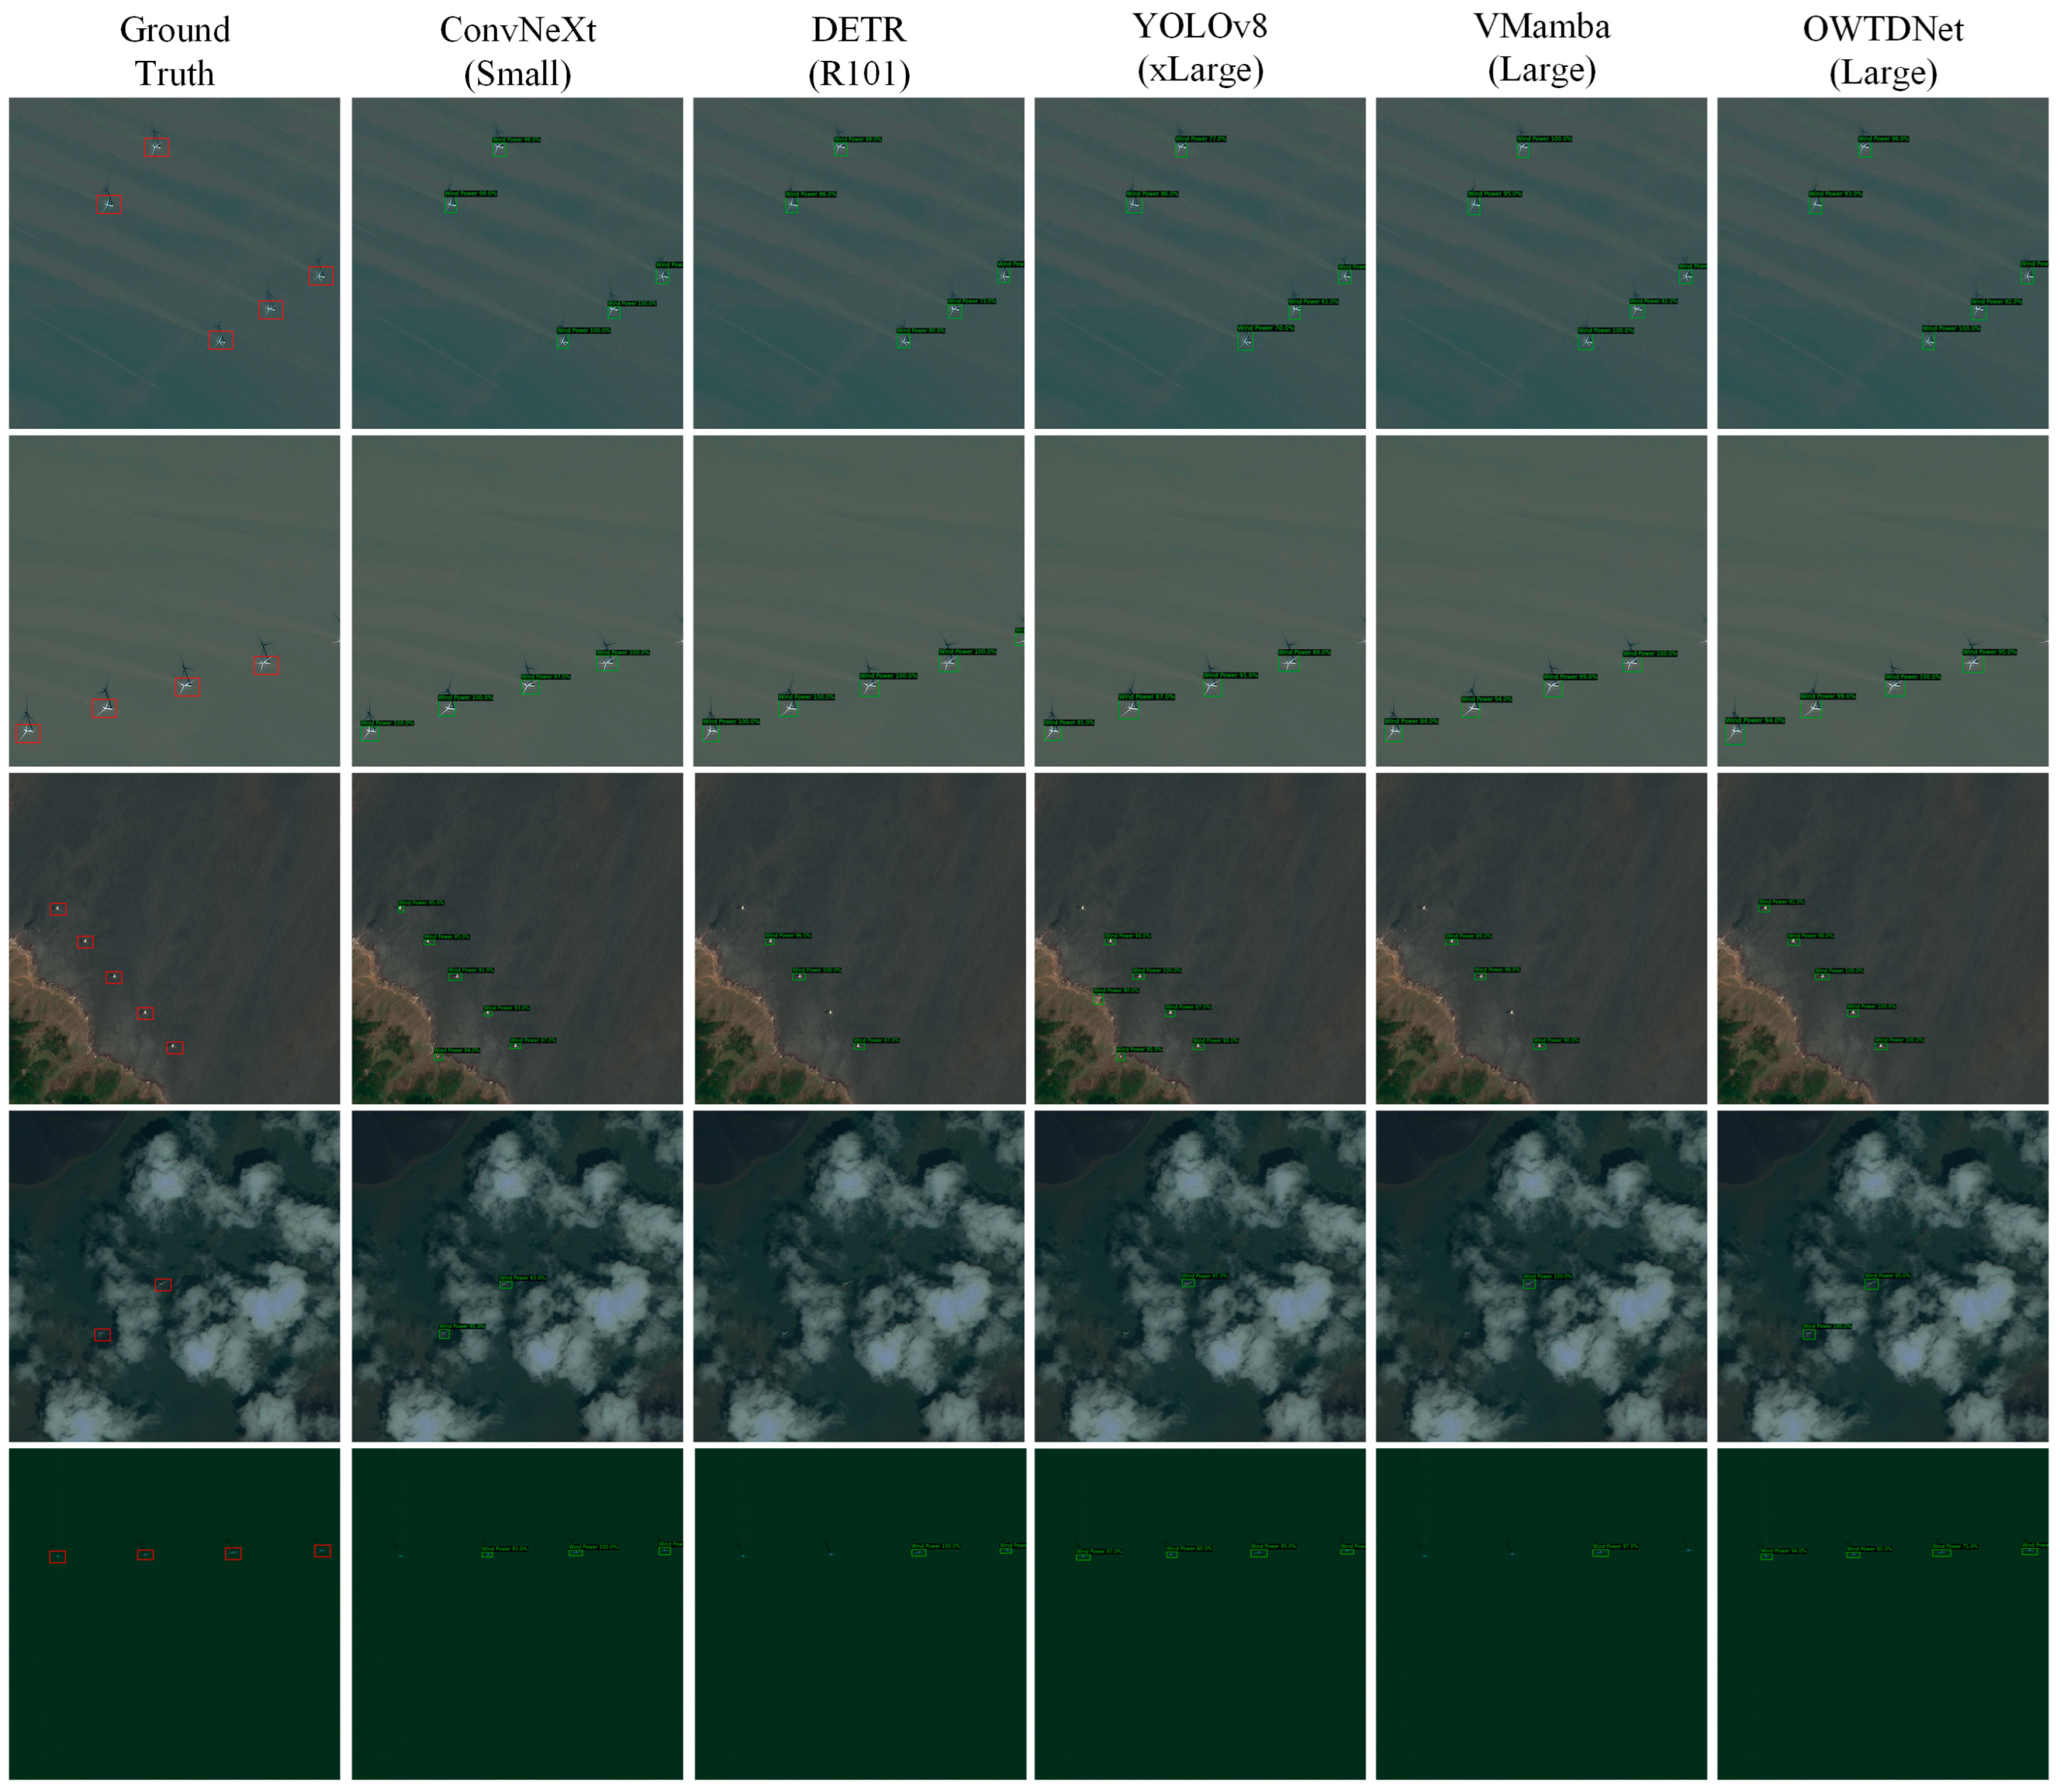
By introducing these metrics, we aimed to provide a comprehensive understanding of the advantages and disadvantages of the different detection models in the OWT detection task. Meanwhile, visualized comparison results are shown in Figure 12. Additionally, Figure 13 shows PR curves of our model at small, medium, and large scales.
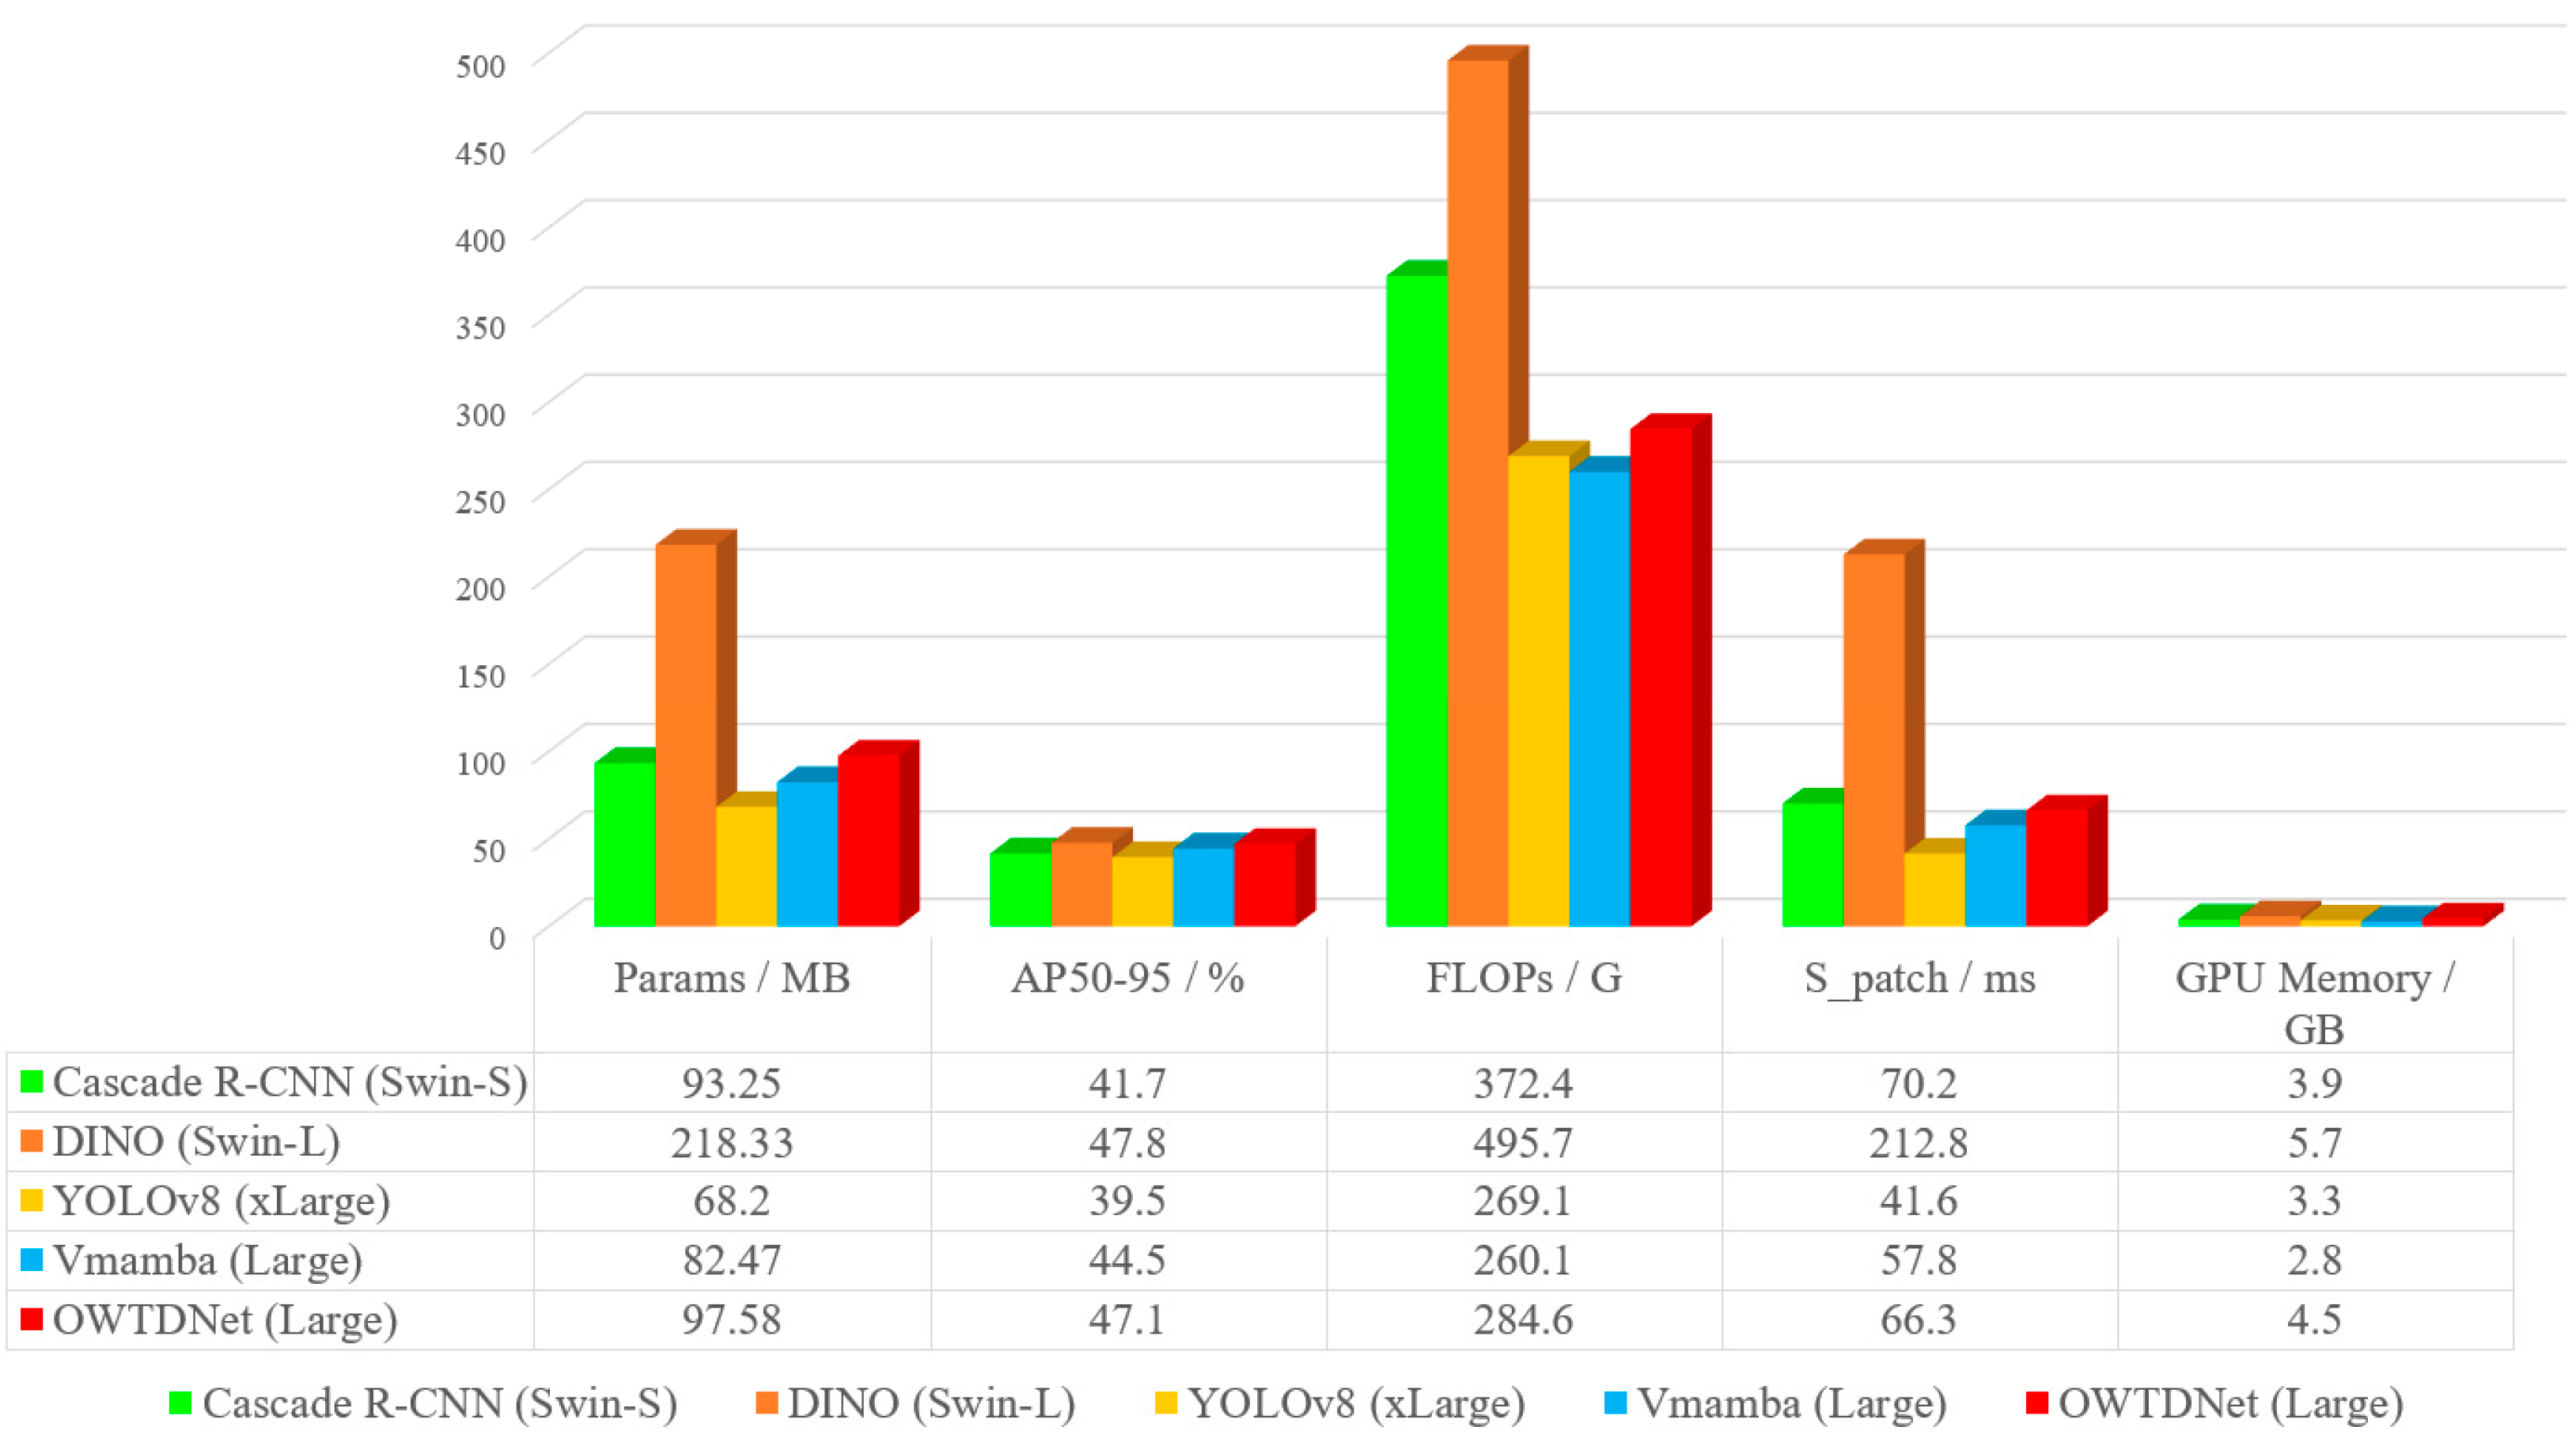
Based on the comparison results presented in Table 5, DINO with the Swin-L backbone emerged as the top performer in terms of AP indicators, achieving 47.8%, closely followed by our proposed method at 47.1%. Regarding speed metrics, the YOLO series demonstrated the fastest performance, particularly YOLOv8 with the small backbone, which achieved an inference speed of 8.7 ms and 115 frames per second (FPS) at a resolution of 1024 × 1024. From the perspective of GPU memory usage, methods employing the Mamba approach exhibited advantages over those based on the Transformer architecture, with VMamba-Large only requiring 2.8 GB of GPU memory in the prediction phase.
Among CNN-based methods, the combination of the Cascade structure with the Swin backbone achieved the optimal performance, albeit with a decrease in speed metrics. The ConvNext model, a pure CNN method introduced in 2022, did not attain the highest AP but offered the best balance between performance and speed among all CNN-based detectors, achieving 33.6 FPS and 37.7% AP. Through the integration of various training techniques with attention mechanisms, YOLOv8 significantly improved its ability in OWTs detection. For instance, YOLOv8-xLarge achieved an AP of 39.5% and an FPS of 24. However, the YOLO models still struggled to achieve satisfactory detection performance for remote sensing images, limiting their widespread applicability in practical systems.
Exemplified by DINO and Cascade under the R50 and Swin-L configurations, the integration of Transformer methods in both encoding and decoding stages significantly improved the AP metric for DINO, achieving a 14.6% increase. However, it is worth noting that incorporating a Transformer, such as DINO with the Swin-L backbone, significantly reduced the prediction speed. Meanwhile, the Mamba method achieved long-dependency feature capture, while maintaining lower computational costs. Compared to DINO with Swin-L, VMamba-Large offered a fourfold increase in speed. Furthermore, our proposed OWTDNet lagged behind the DINO network by only 0.7% in AP, while being three times faster, achieving 15 FPS.
In comparison to the original VMamba method, OWTDNet demonstrated improvements across all precision metrics with small, medium, and large backbones, without incurring substantial speed costs. Specifically, using the Large backbone as an example, OWTDNet achieved a 2.6% improvement in AP metrics compared to the original VMamba, while experiencing only an 8.5 ms reduction in speed. This underscores the efficacy of our lightweight encoding and alignment structure, which facilitated local feature modeling and feature fusion with minimal computational overhead. A more intuitive comparison of results across the different methods is shown in Figure 14.
In Figure 12, red boxes represent the manually labeled OWTs in the original image. In scenario 3, both ConvNeXt and YOLOv8 exhibited notable false positives, incorrectly identifying the coastline as a OWTs. This observation underscores the limitations of CNN architectures in capturing global feature relationships in remote sensing images. In contrast, DETR and VMamba enhanced feature learning robustness by effectively extracting long-dependency relations, thereby mitigating interference caused by similarities on land. However, scenarios 4 and 5 presented challenges for the Transformer and VMamba methods due to the sparse nature of the OWTs features, leading to missed detections. In contrast, the CNN-based methods demonstrated strong performance in these scenarios. This demonstrates that while Transformer methods excel in considering the impact of long-dependency features on detection performance, they may overlook the contribution of local features in detecting weak and small targets. Therefore, effectively integrating these two feature modeling approaches is crucial for enhancing the detection performance in remote sensing monitoring tasks.

4.4. Ablation Study

4.4.1. Discussion of Splitting Strategy

In Section 3, we discussed the theoretical merits and drawbacks of two image splitting strategies. Here, our objective is to analyze the practical implications of these strategies on detection performance, drawing insights and conclusions from the experimental results presented in Table 6.
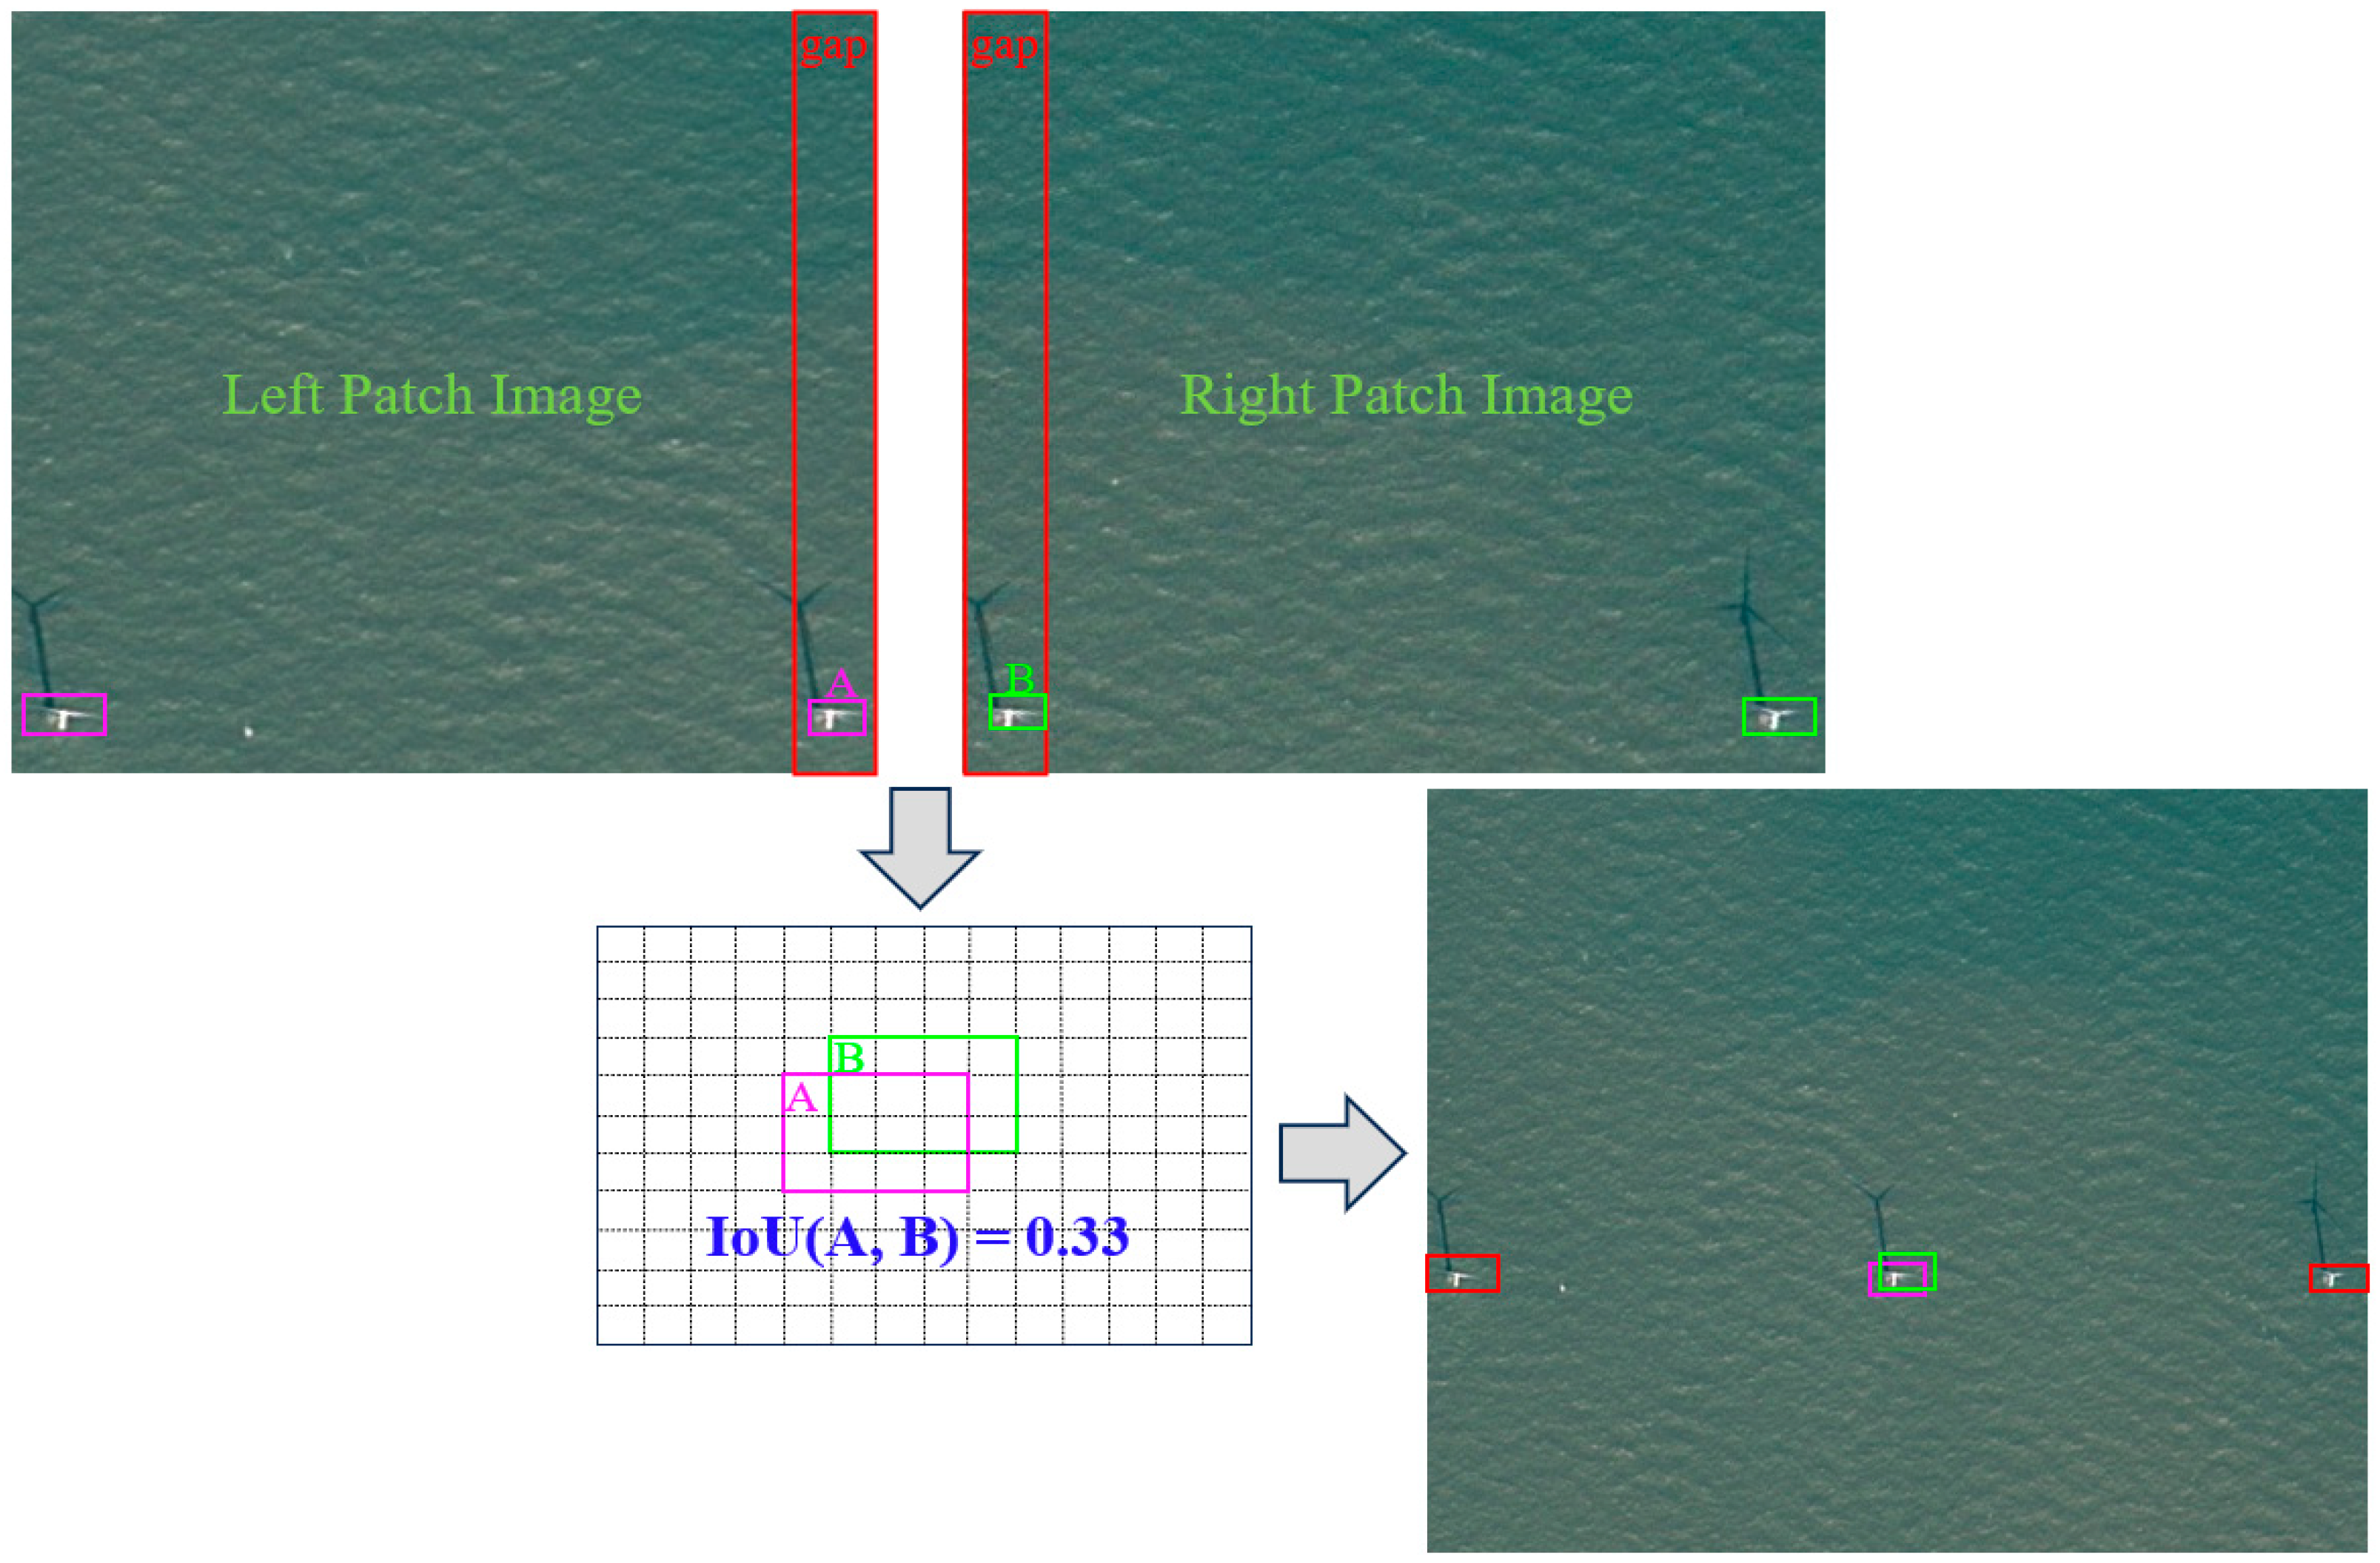
In Table 6, several discoveries and conclusions can be drawn. Firstly, the results do not fully align with the theoretical analysis presented in Section 3.1, as most models exhibited a decline in the AP indicator when applying Strategy 1. Notably, the YOLOv8 model showed the most significant drop, decreasing by 1.3%, from 39.5% to 38.2%. The visualization results presented in Figure 15 reveal that the NMS method struggled with the box merging process for small targets, demonstrating poor robustness. Specifically, two prediction boxes (refer to A and B) differing by only one pixel had an IoU value of only 0.33. Since this IoU value did not exceed the NMS threshold of 0.6, the two target boxes could not be merged and eliminated, leading to redundant detections in results. The experimental results demonstrated an improvement in AR metrics across all evaluated models when employing Strategy 1. This systematic enhancement confirms that the overlapping sampling methodology effectively boosts model recall rates through redundant boundary region detection. However, this performance gain comes at the expense of increased false positive instances and subsequent post-processing requirements.

4.4.2. Discussion of Feature Alignment

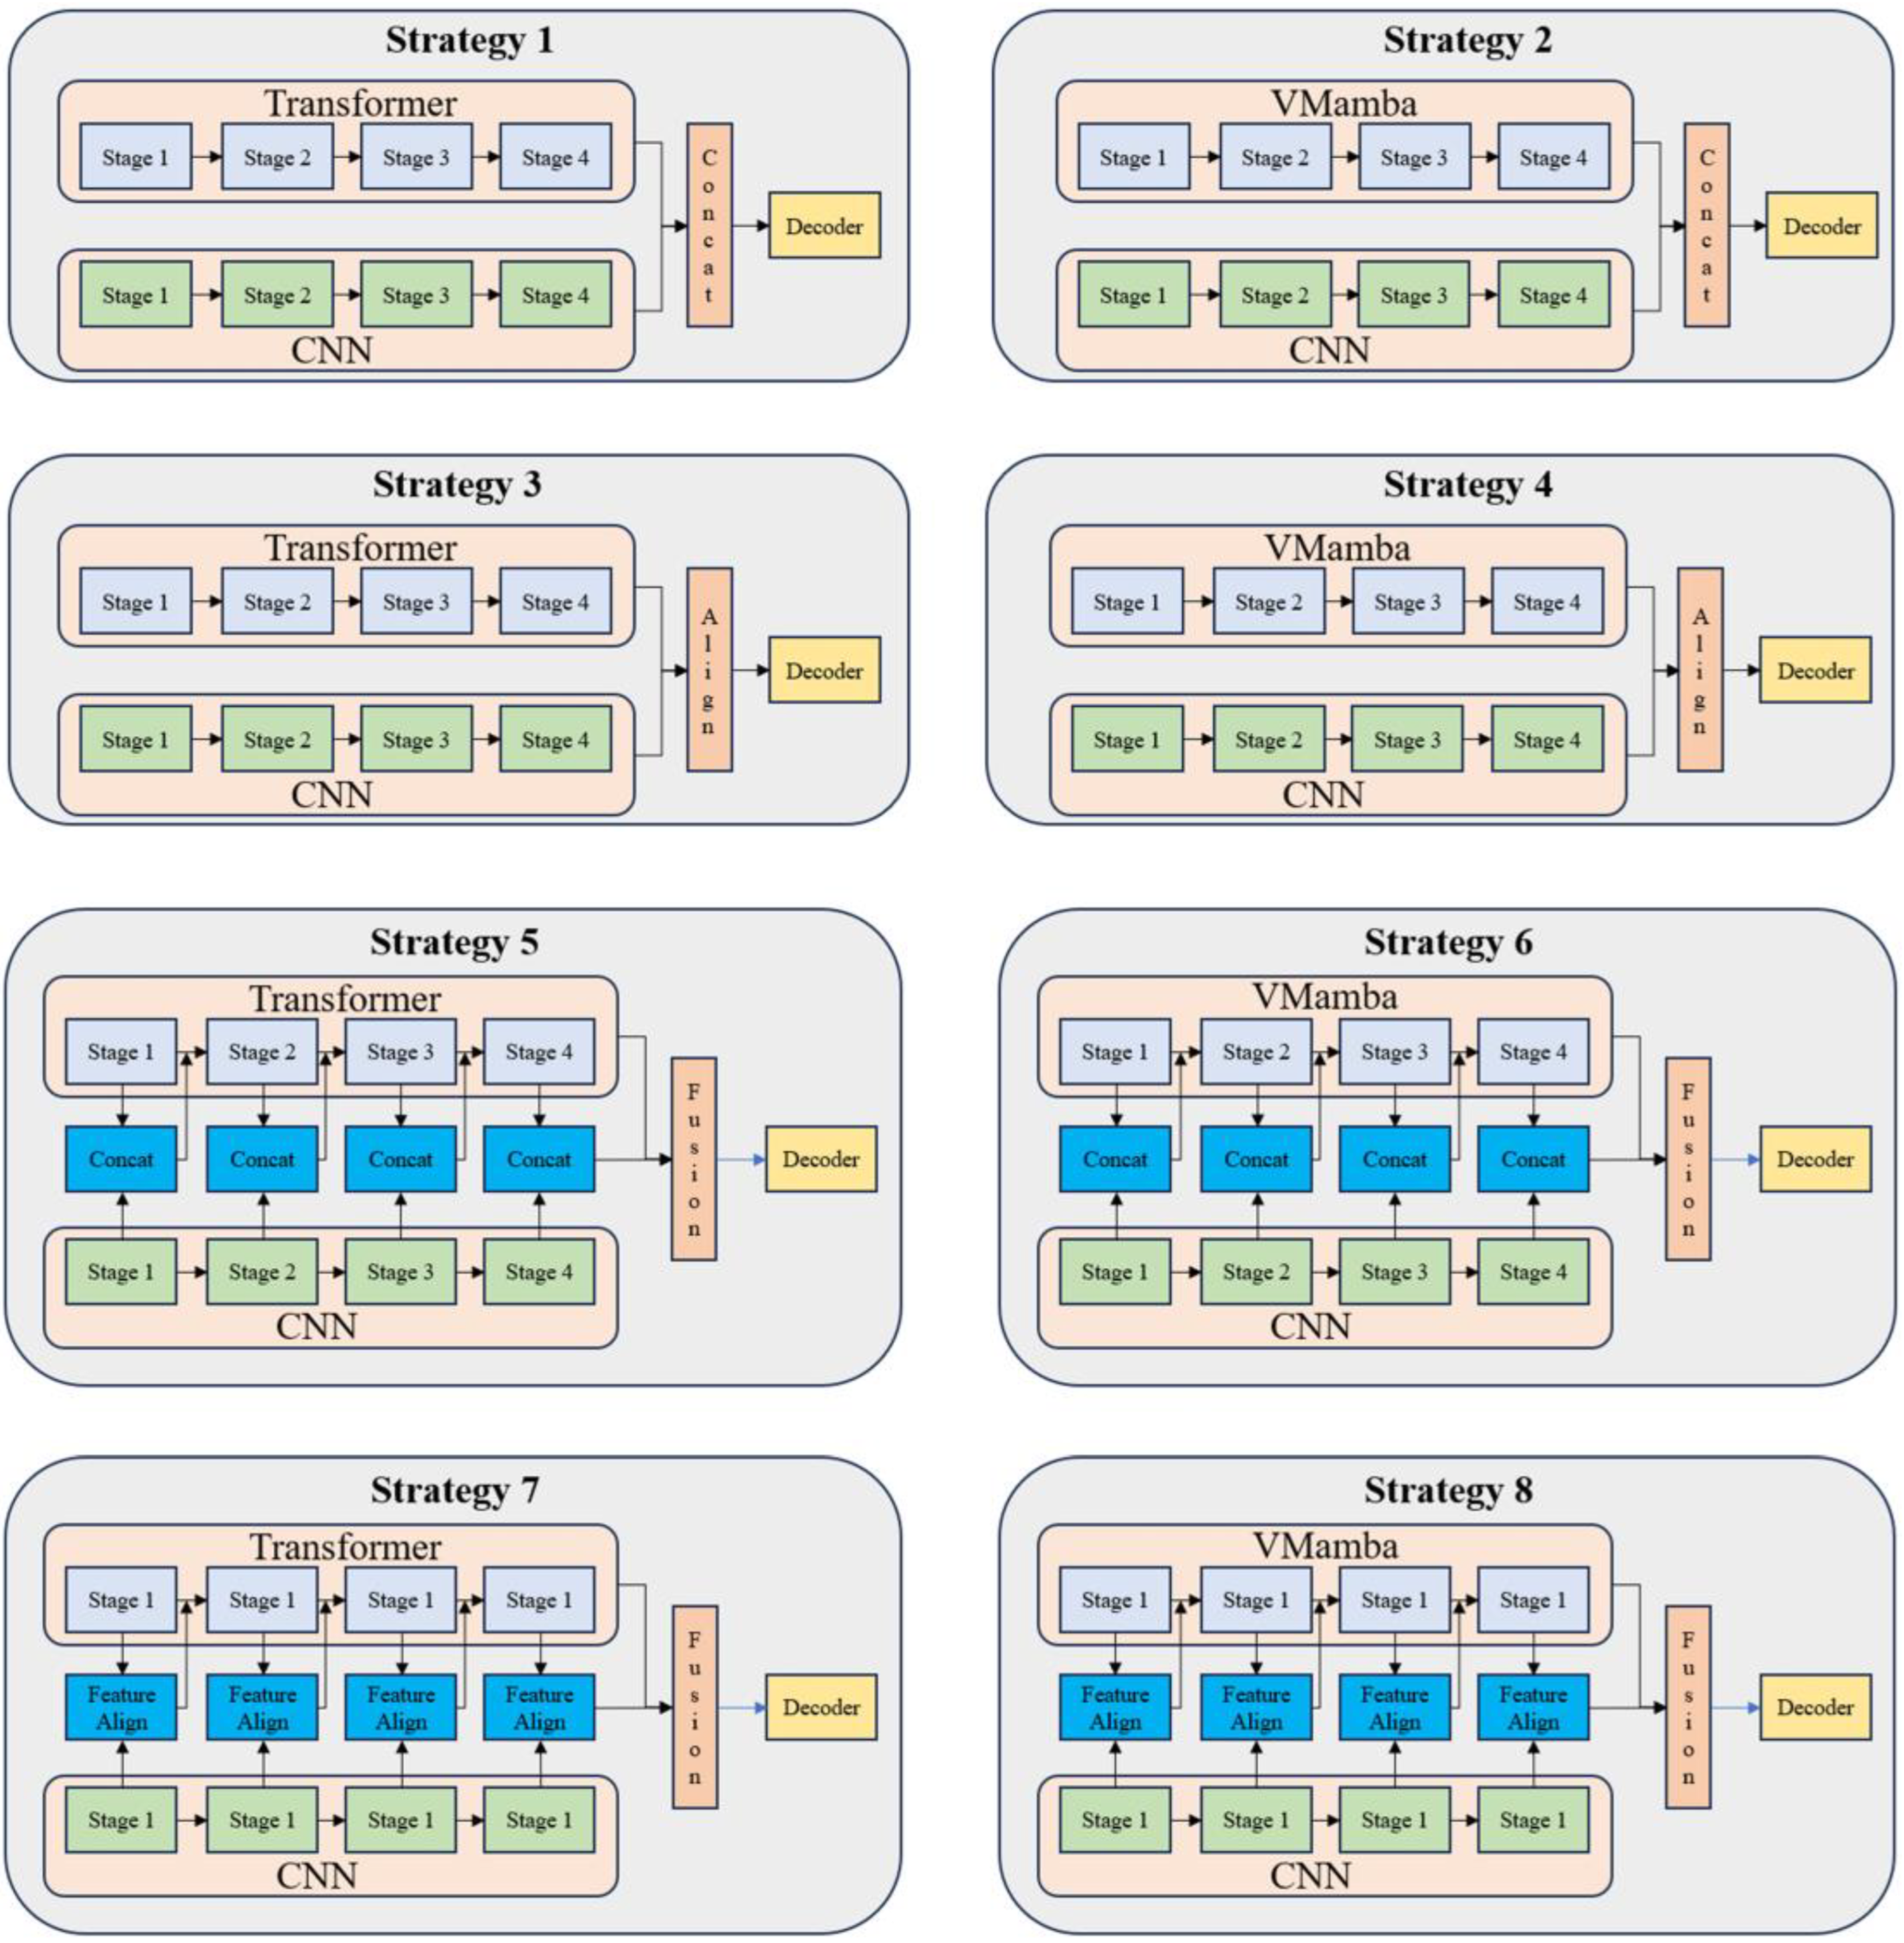
Multi-branch architectures have been widely used in various fields, such as CNNs and Transformers or Mamba and CNNs. These techniques exhibit higher performance than a single encoding structure. However, a common approach adopted by these methods involves directly fusing features, which overlooks the huge differences between CNN, Transformer, and Mamba features. In this section, we delve into the significance of feature alignment modules in bridging the gap between these different methodologies. To this end, we have designed several distinct encoding structures, as depicted in Figure 16, that aim to illustrate this issue.
In Figure 16, the design strategies for different encoding structures can be categorized into two scenarios: the integration of CNNs and Transformer, and the integration of CNNs and VMamba. Focusing on the VMamba integration, we devised four architectures. Specifically, strategies 2 and 4 abstain from any form of feature fusion during the encoding phase, only integrating CNN and Mamba features in the final encoding layer through a concatenate operation or our alignment module. Conversely, strategies 6 and 8 employ concatenation or alignment for feature fusion between different branches at each encoding stage. The comparative results derived from these strategies are presented in Table 7.
Firstly, feature fusion during the encoding stage in a multi-branch structure can significantly enhance OWTs detection performance. Taking VMamba as an example, strategy 8 demonstrated a 1.9% improvement in AP metrics compared to strategy 4. Additionally, the Align module proposed in this paper outperformed the direct concatenation of different types of features, obtaining higher AP metrics. By comparing Strategy 1 and Strategy 3, as well as Strategy 5 and Strategy 7, within the same model structure, the network utilizing the Align structure achieved AP improvements of 1.1% and 1.3%, respectively. This indicates that the feature disparities existing in different methods damage the model’s ability under a direct fusion approach.
The feature alignment module introduced in this paper addresses these differences from both channel and position dimensions, thereby enhancing the effectiveness of the feature fusion process. Furthermore, when comparing the performance of VMamba and Transformer models in the OWTs detection task, it is evident that the proposed Align module can work effectively in both approaches. Specifically, comparing strategies 6 and 8, the algorithm achieved a 1.4% improvement in the AP metric.
Among various CNN-based methods, the B-Mv3 proposed in this paper exhibited performance comparable to R50. In strategy 8, the R50 method only marginally improved the AP metric by 0.4% compared to B-Mv3, while sacrificing a speed of 11.6 ms per patch image. Figure 17 clearly demonstrates that regardless of using concatenation or alignment methods, information fusion during the encoding stage effectively enhanced the confidence score of OWTs in the detection results.
Finally, from the perspective of efficiency, the VMamba-based upper branch demonstrated superior cost–benefit performance. Comparative analysis between Strategy 7 and 8 reveals that, when integrated with the R50 backbone architecture, VMamba not only enhanced AP metrics but also reduced the patch processing time from 114.9 ms to 77.9 ms, representing a 32.2% acceleration. Meanwhile, the proposed B-MV3 architecture further improved the processing efficiency by reducing the patch time by 11.6 ms compared to the R50 structure. For large-scale remote sensing images (40,000 × 40,000 pixels), processing 1520 patch images monthly, the detection time decreased from 118.4 s (R50) to 100 s (B-MV3), achieving a 15.5% speed improvement. Notably, the Swin-R50 combination under Strategy 7 required 174.6 s for equivalent processing. These results demonstrate that our proposed framework achieves dual optimization of detection performance and computational efficiency, particularly benefiting resource-intensive remote sensing applications.

4.4.3. Discussion of Blurring Convolution

In the preceding section, we examined the influence of different CNN methods on the model’s performance. In this section, we will discuss the role of Blurring Convolution in various CNN architectures and its effect on the OWTs detection task. To achieve this, we conducted the following comparative experiments: (1) integrating the Blurring Convolution module into the R50 architecture; (2) removing the Blurring Convolution module from the MobileNetv3 (Mv3) structure; (3) applying these two modified structures to different object detection frameworks; (4) omitting the data augmentation technique of random shift during the training phase; and (5) randomly introducing up, down, left, and right shifts to the testing image during the prediction stage. The comparative results of Experiments 1 to 4 are presented in Table 8, while the results of Experiment 5 are visualized in Figure 18.
As depicted in Table 8, the incorporation of Blurring Convolution significantly enhanced the performance of OWTs detection in both Mv3 and R50 architectures. Specifically, under the Cascade R-CNN framework, this approach resulted in an average improvement of 3.3% in the AP metric. Compared to traditional data augmentation techniques, the performance gains achieved by Blurring Convolution were more substantial and consistent. For instance, in the context of Cascade R-CNN utilizing the Mv3 backbone, Blurring Convolution improved the AP metric by 4.3% compared to solely utilizing image shift augmentation.
However, it is noteworthy that this approach did not yield performance gains within the DINO framework. Specifically, the presence or absence of Blurring Convolution only marginally influenced the AP indicator, with a mere 0.1% difference observed in DINO with R50. This suggests that the transformer encoding method within the DINO framework can achieve a similar effect to Blurring Convolution, imparting translational robustness to CNN features. Additionally, when comparing Mv3 and R50, while R50 with Blurring Convolution achieved higher AP metrics, it did so at the cost of compromised speed. In summary, this article proposes a novel encoding branch that combines Blurring Convolution with the Mv3 structure to enhance the stability of OWTs detection under sliding windows, addressing both performance and cost perspectives.

4.4.4. Discussion of Feature Enhance in Alignment Module

In the alignment module, we have designed two distinct processes: alignment and enhancement. The alignment process aims to facilitate the interaction of feature fusion between different branches. Meanwhile, the enhancement process focuses on amplifying the feature responses related to OWTs. In this section, we will discuss the effect of feature enhancement in the context of the detection task.
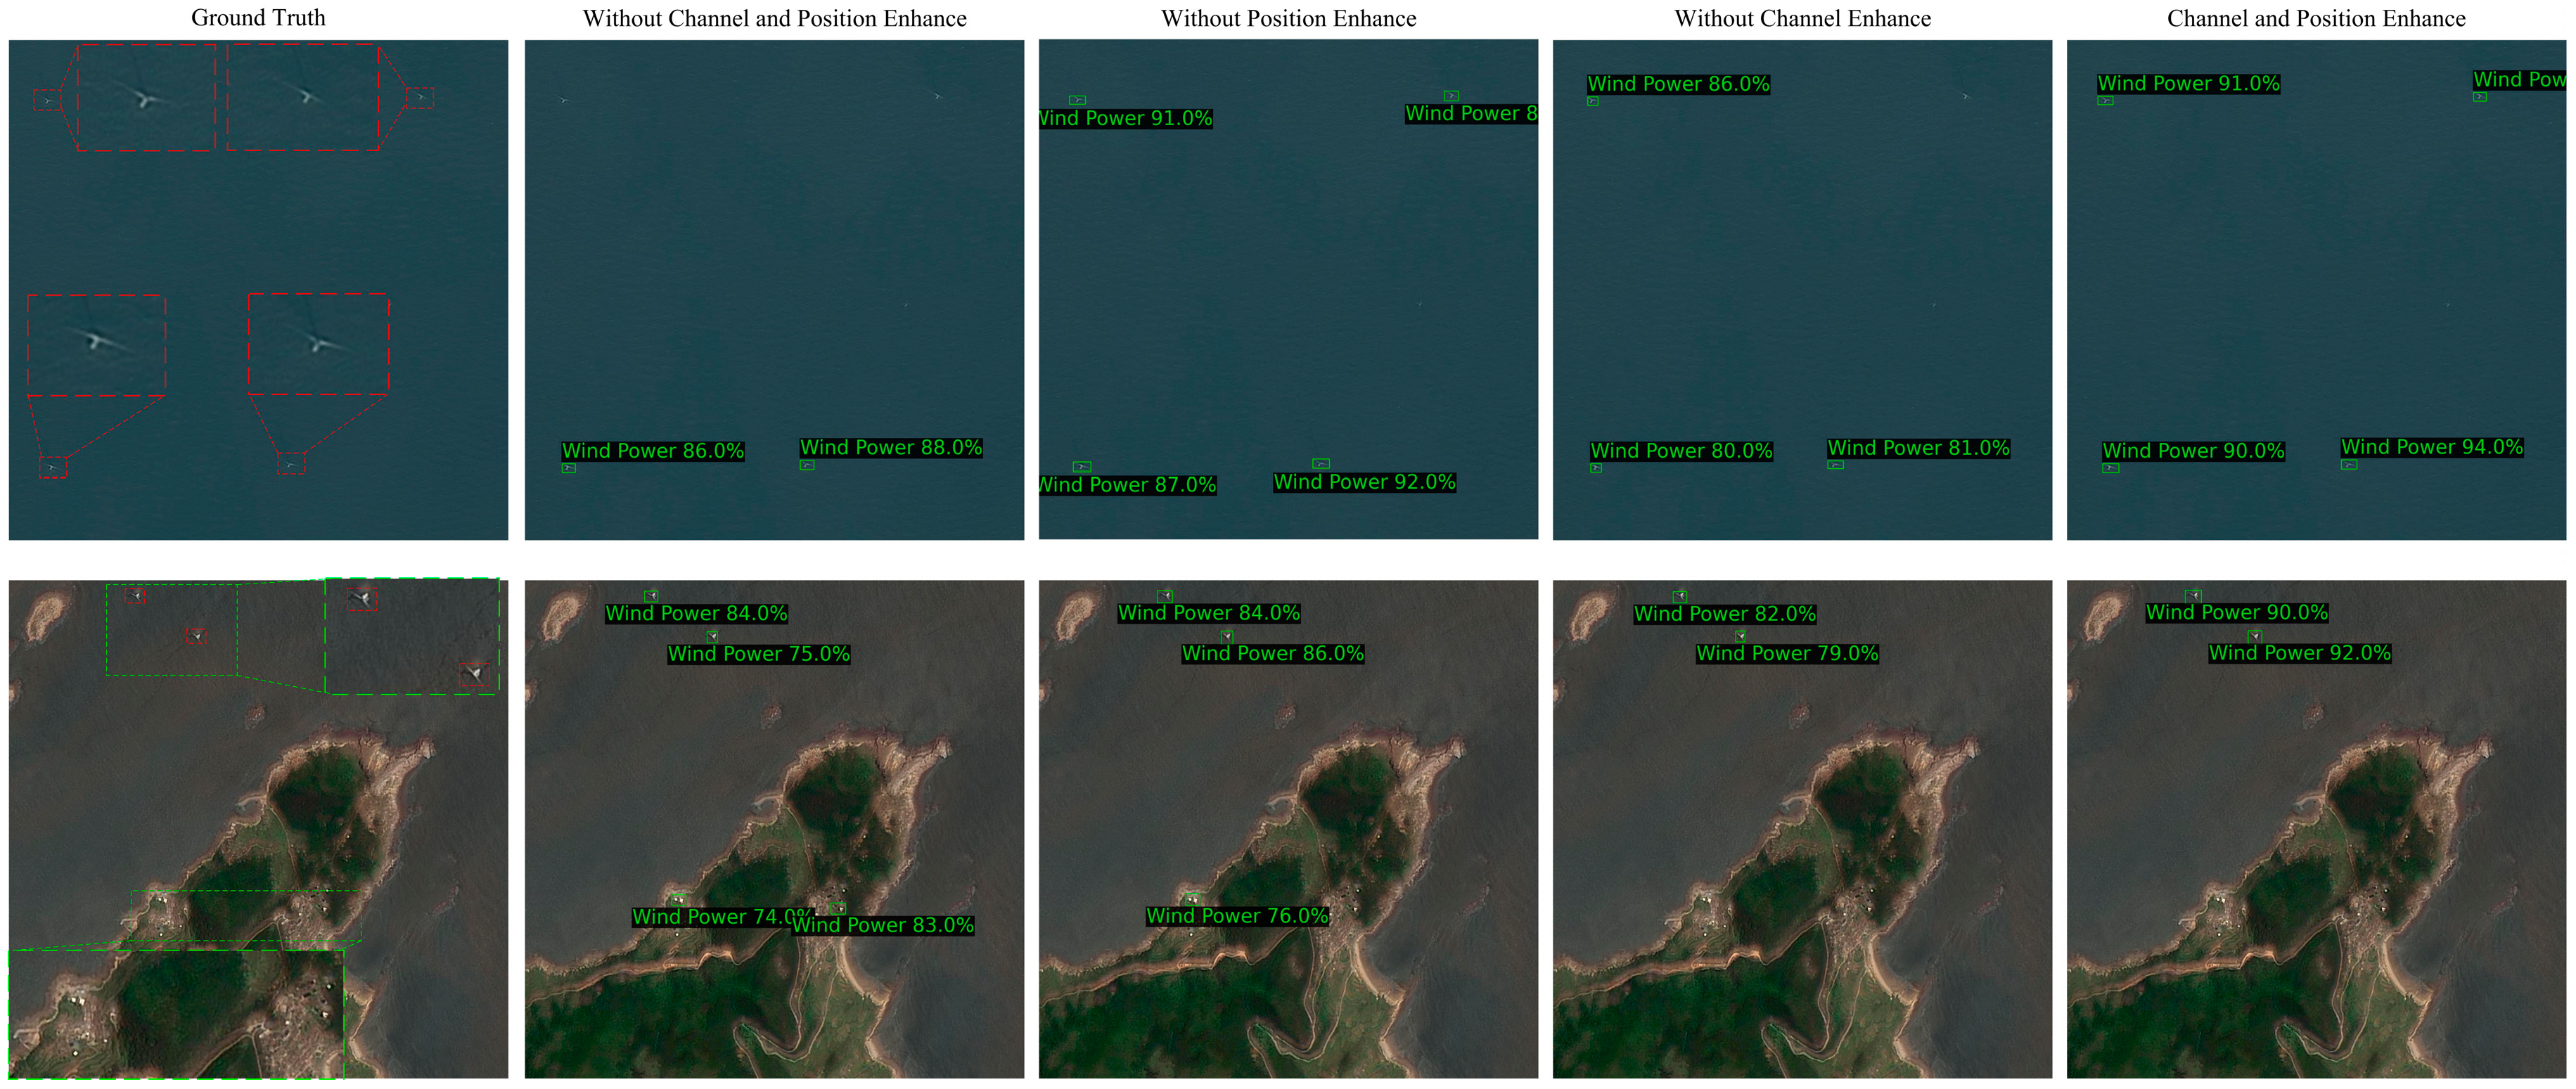
From the results presented in Table 9, we can see that both channel enhancement and position enhancement are crucial in the OWTs detection task. Eliminating either of these two processes results in a significant reduction in performance. Specifically, channel enhancement had a more profound impact on the AP indicators compared to position enhancement. This can be attributed to the fact that channel enhancement primarily aims to boost the response of OWTs in the channel dimension, which has a more pronounced effect on targets with weaker features. In contrast, position enhancement focuses on the spatial information of OWTs, crucial for improving resilience against interference from similar objects on non-sea surfaces.
In Figure 19, we have enlarged the area of interest using a dashed box to facilitate reading and the red dashed box represents the OWTs. In scenarios where OWTs features are weak, methods that incorporate channel enhancement demonstrated an improved detection and achieved higher scores. On the other hand, in scenarios involving interference from similar targets, methods utilizing position information effectively distinguished OWTs from white contour objects on land, thereby reducing false detections.

4.4.5. Discussion of Loss Functions

In the domain of object detection tasks, numerous variations of loss functions have been proposed, each designed to address specific challenges. Drawing upon insights from the introductory chapter, this section aims to conduct a comparative analysis of these various loss functions within the context of the OWTs detection task. This analysis seeks to identify the most suitable loss function tailored to the marine monitoring application domain.
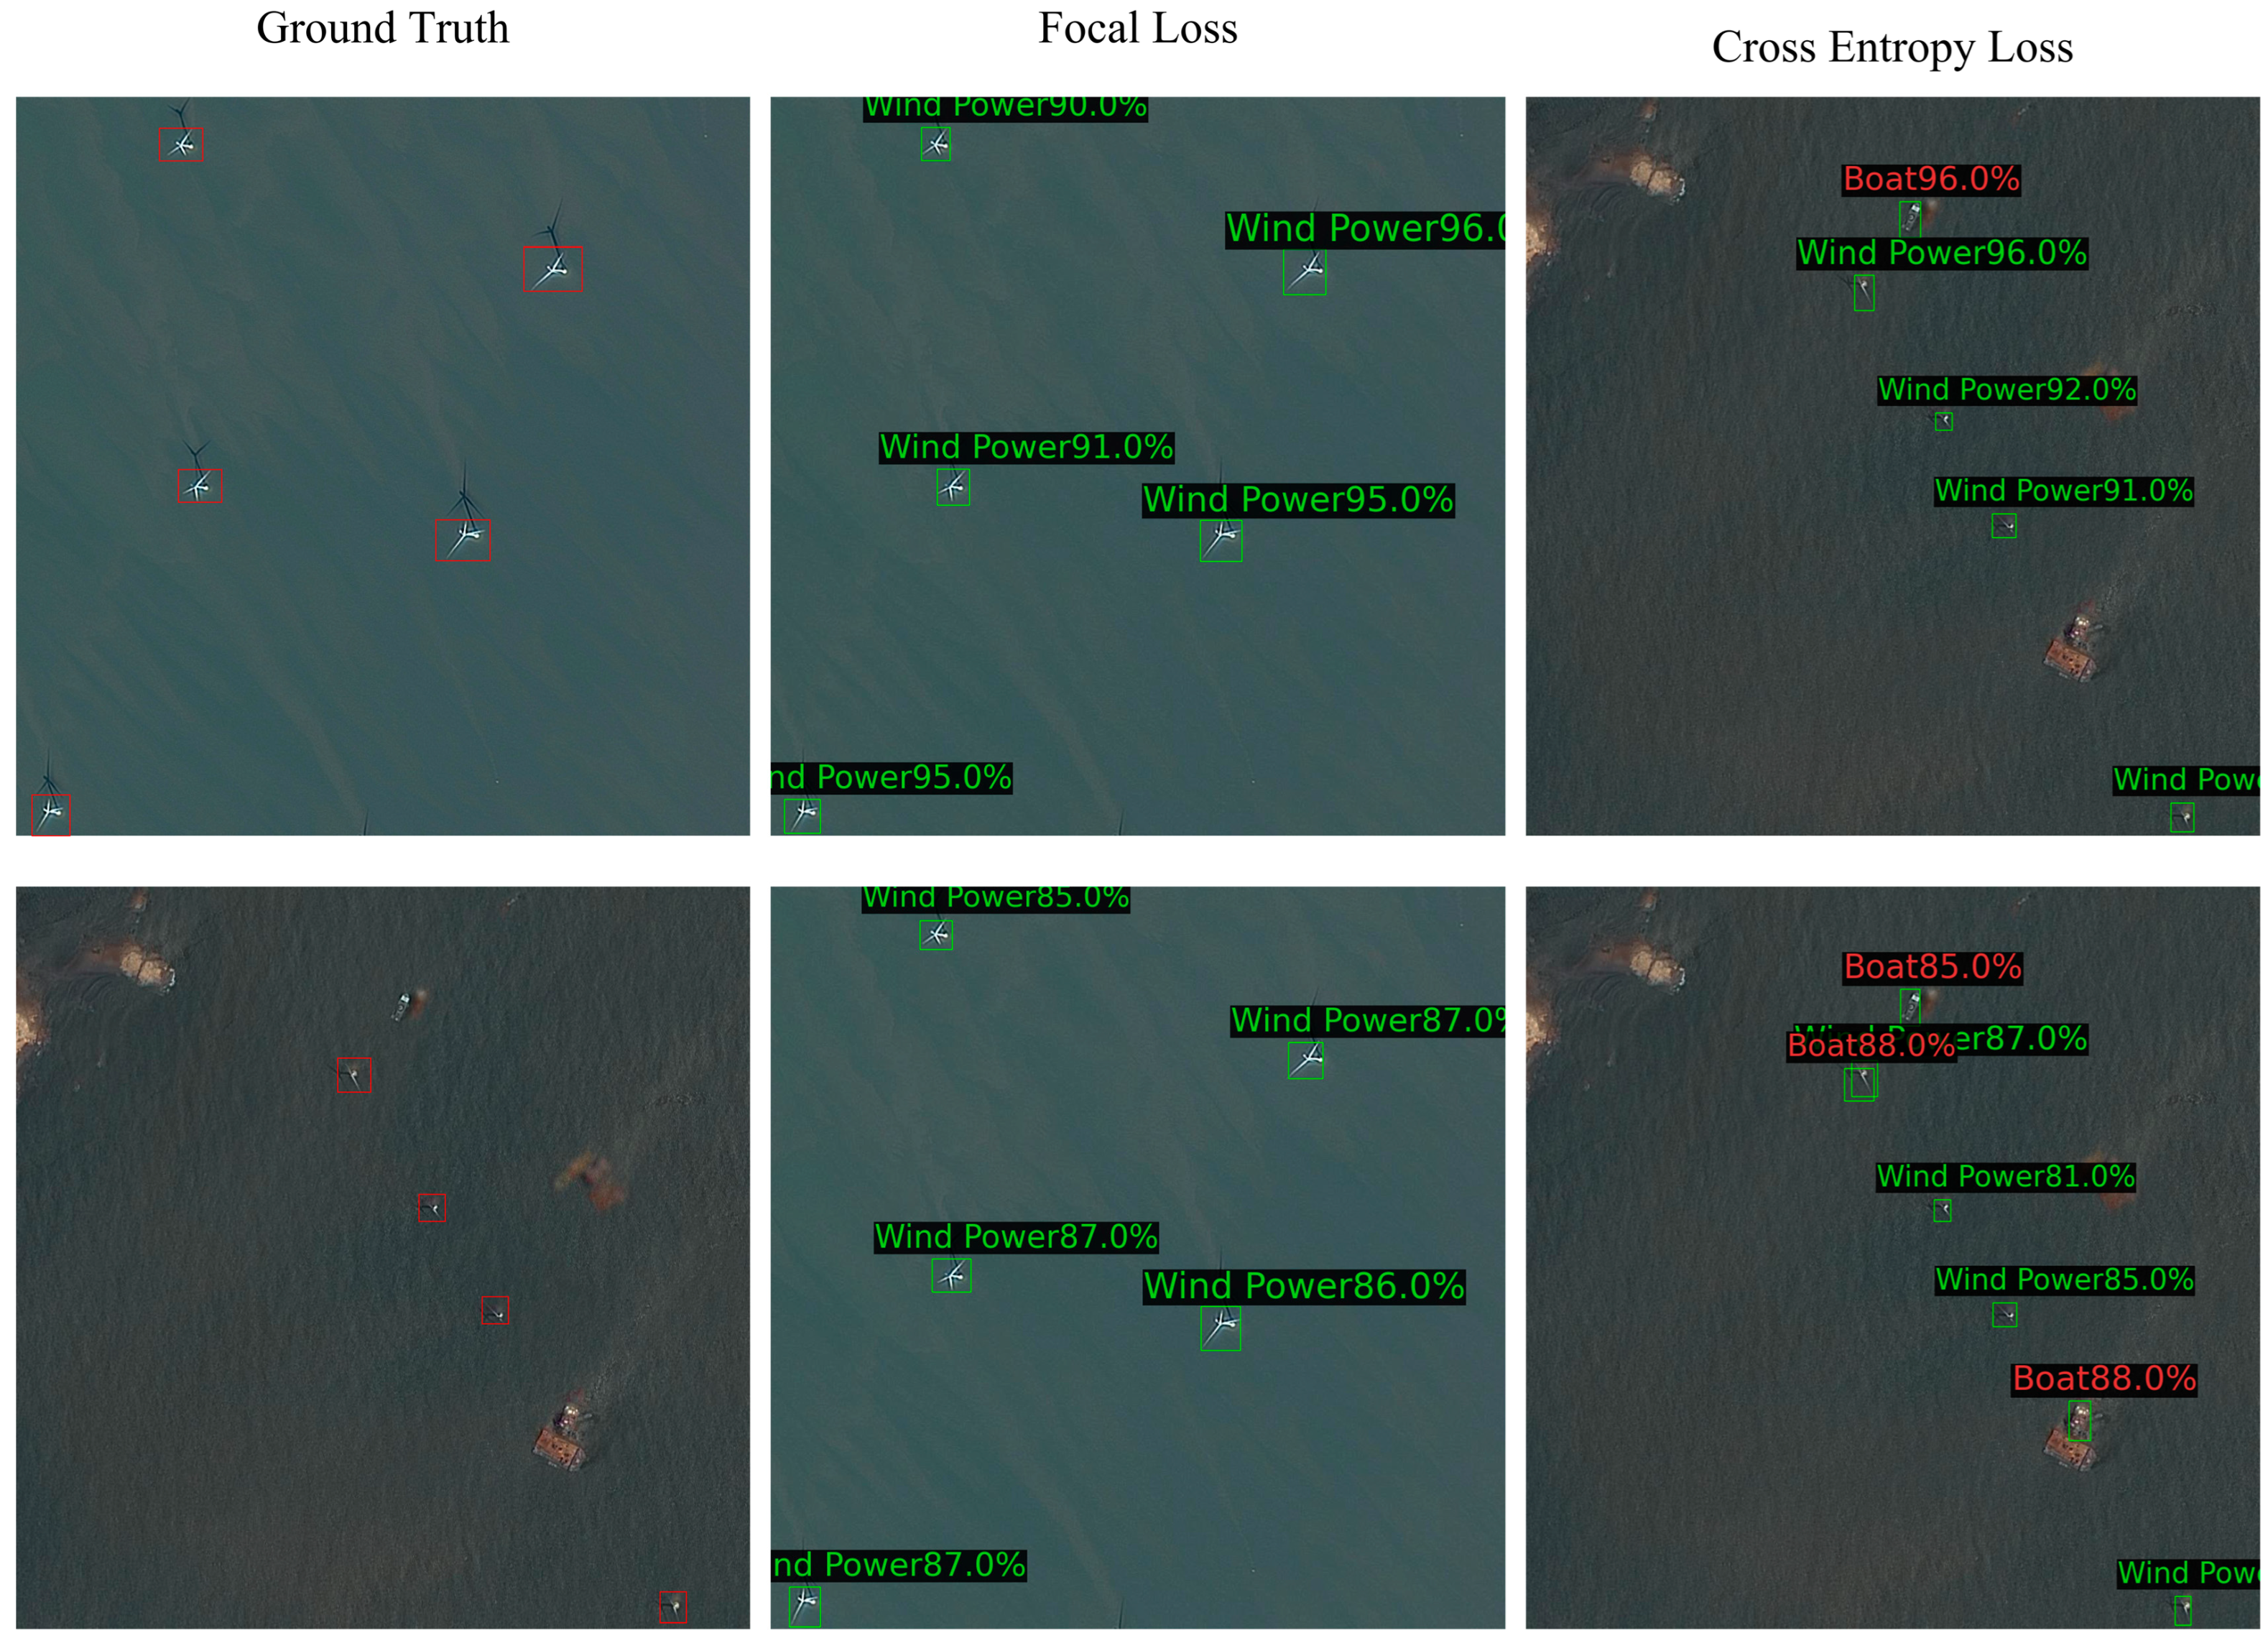
As shown in Table 10, the focal loss approach outperformed cross-entropy across all methods from the perspective of box classification loss. In the Cascade network, focal loss enhanced the AP metric by an average of 2.32%. This enhancement was achieved through a penalty factor that intensified the network’s focus on challenging samples, thereby improving performance on difficult instances during training, without disproportionately favoring easier examples.
As shown in Figure 20, the remote sensing images presented varying levels of difficulty in detecting OWTs. In scenarios where the OWTs exhibited clear features and minimal interference, detection is straightforward. However, in complex scenarios influenced by similar objects, OWTs may exhibit weaker characteristics, leading to misclassification or confusion with other categories. The original cross-entropy classification method treats all samples equally during training, which can result in unsatisfactory prediction outcomes, despite decreasing classification loss. For example, as depicted in Figure 20, the Cascade method misidentified an interfering target as a boat and incorrectly classified a OWTs target as a boat as well. In contrast, integrating focal loss significantly enhanced the model’s robustness in handling complex scenarios. This comparison underscores the critical role of focal loss in improving classification accuracy in remote sensing detection tasks.
In contrast to classification loss functions, box regression loss functions exhibit notable variations, particularly between IoU-based methods and coordinate-based methods like smooth L1. Initially popular in box regression tasks, smooth L1’s poor robustness with bounding boxes has led to its gradual replacement by IoU-based methods. As detailed in Table 10, IoU-based methods consistently outperform smooth L1. Among IoU-based methods, CIoU stands out as the most effective, while the original IoU method demonstrates lower performance. In the context of OWTs detection tasks, focal loss significantly enhances classification accuracy, while the differences among IoU methods in the box regression task are relatively minor. Figure 21 provides a visual comparison of various IoU methods, highlighting their respective strengths. Based on the experimental results and discussions, focal loss was selected for classification tasks, while CIoU was chosen as the regression loss function for our detection model.

5. Conclusions

In this paper, we addressed the challenges encountered in detecting OWTs in remote sensing images by proposing a novel OWTs detection framework called OWTDNet. OWTDNet integrates Mamba’s ability to capture long-range relations with a CNN’s proficiency in learning local features, enhancing both the detection performance and speed.
Firstly, to mitigate the sensitivity of CNN structures to translation variations under sliding windows, we introduced a novel encoding network named B-Mv3. B-Mv3 replaces the standard convolution operation with blurring convolution, effectively enhancing the robustness of CNN features to translation changes, and improving the stability of predictions. Given the significant differences in modeling between Mamba and CNN features, we proposed a novel feature alignment module. This module addresses these disparities from both channel and positional dimensions. In the channel dimension, discrepancies are mitigated through average pooling and a channel attention mechanism. For positional alignment, we initially enhanced the receptive field of CNN features using multi-scale dilated convolution. Subsequently, a positional attention mechanism is introduced to fuse responses at the same position. Additionally, to tackle the challenge of missed detections caused by the weak features of OWTs, we incorporate a feature enhancement process grounded in the alignment module. Specifically, we employ max pooling to determine the maximum response across both channel and positional dimensions. We then use sigmoid activation to amplify the weight of this response, thereby enhancing the network’s sensitivity to the targets of interest. These combined advancements yielded compelling results, showcasing that our proposed OWTDNet achieved a 2.6% increase in AP compared to the original VMamba approach. Furthermore, OWTDNet demonstrated a threefold improvement in running speed over Transformer models (DINO). These performance enhancements validated the successful application of OWTDNet in a real-world offshore engineering monitoring system.
Certainly, our OWTDNet still exhibits limitations in its current iteration. Primarily, training OWTDNet requires a substantial number of labeled samples, which presents challenges in the sample collection and labeling stage. Additionally, while OWTDNet surpasses Transformers in terms of speed, it obviously falls behind CNN-based detection methods. Recently, researchers [54,55] have proposed using distillation techniques to transfer the capabilities of Transformers to CNN architectures. These approaches have shown significant improvements in both performance and speed, reducing the model’s dependence on extensive training samples. In future research, we intend to explore the application of distillation technology to facilitate knowledge transfer between the Mamba method and CNN structures.

Author Contributions

Methodology, P.S. and Y.Z.; software, Y.Z. and L.Z.; validation, Z.X. and J.Y.; formal analysis, P.S. and L.L.; data curation, S.L.; writing—original draft preparation, L.Z.; writing—review and editing, P.S.; project administration, P.S. and Y.Z. All authors have read and agreed to the published version of the manuscript.

Funding

This paper was supported by the Longyuan Electric Power Technology Innovation Project of China under Grant LYX-2025-07.

Data Availability Statement

The original contributions presented in this study are included in the article. Further inquiries can be directed to the corresponding author.

Acknowledgments

The authors would like to thank the editors and the reviewers for their valuable suggestions.

Conflicts of Interest

Authors Pengcheng Sha, Sujie Lu, Zongjie Xu, Jianhai Yu were employed by the company Longyuan Qidong Wind Power Generation Co., Ltd. Author Lei Li was employed by the company Shanghai Enshu Data Technology Co., Ltd. The remaining authors declare that the research was conducted in the absence of any commercial or financial relationships that could be construed as a potential conflict of interest.

References

  1. Zhang, J.; Jia, X.; Hu, J.; Tan, K. Moving vehicle detection for remote sensing video surveillance with nonstationary satellite platform. IEEE Trans. Pattern Anal. Mach. Intell. 2021, 44, 5185–5198. [Google Scholar] [CrossRef]
  2. Melillos, G.; Themistocleous, K.; Danezis, C.; Michaelides, S.; Hadjimitsis, D.G.; Jacobsen, S.; Tings, B. The use of remote sensing for maritime surveillance for security and safety in Cyprus. In Detection and Sensing of Mines, Explosive Objects, and Obscured Targets XXV; SPIE: Washington, DC, USA, 2020; Volume 11418, pp. 141–152. [Google Scholar]
  3. Zhou, H.; Yuan, X.; Zhou, H.; Shen, H.; Ma, L.; Sun, L.; Sun, H. Surveillance of pine wilt disease by high resolution satellite. J. For. Res. 2022, 33, 1401–1408. [Google Scholar] [CrossRef]
  4. Li, K.; Wan, G.; Cheng, G.; Meng, L.; Han, J. Object detection in optical remote sensing images: A survey and a new benchmark. ISPRS J. Photogramm. Remote Sens. 2020, 159, 296–307. [Google Scholar] [CrossRef]
  5. Wang, Y.; Bashir, S.M.A.; Khan, M.; Ullah, Q.; Wang, R.; Song, Y.; Niu, Y. Remote sensing image super-resolution and object detection: Benchmark and state of the art. Expert Syst. Appl. 2022, 197, 116793. [Google Scholar] [CrossRef]
  6. Yang, Z.; Liu, S.; Hu, H.; Wang, L.; Lin, S. Reppoints: Point set representation for object detection. In Proceedings of the IEEE/CVF International Conference on Computer Vision, Seoul, Republic of Korea, 27 October–2 November 2019; pp. 9657–9666. [Google Scholar]
  7. Xie, X.; Cheng, G.; Wang, J.; Yao, X.; Han, J. Oriented R-CNN for object detection. In Proceedings of the IEEE/CVF International Conference on Computer Vision, Online, 10–17 October 2021; pp. 3520–3529. [Google Scholar]
  8. Li, W.; Chen, Y.; Hu, K.; Zhu, J. Oriented reppoints for aerial object detection. In Proceedings of the IEEE/CVF Conference on Computer Vision and Pattern Recognition, New Orleans, LA, USA, 21–24 June 2022; pp. 1829–1838. [Google Scholar]
  9. Li, X.; Deng, J.; Fang, Y. Few-shot object detection on remote sensing images. IEEE Trans. Geosci. Remote Sens. 2021, 60, 5601614. [Google Scholar] [CrossRef]
  10. Lu, X.; Ji, J.; Xing, Z.; Miao, Q. Attention and feature fusion SSD for remote sensing object detection. IEEE Trans. Instrum. Meas. 2021, 70, 1010309. [Google Scholar] [CrossRef]
  11. Shivappriya, S.N.; Priyadarsini, M.J.P.; Stateczny, A.; Puttamadappa, C.; Parameshachari, B.D. Cascade object detection and remote sensing object detection method based on trainable activation function. Remote Sens. 2021, 13, 200. [Google Scholar] [CrossRef]
  12. Zou, Z.; Chen, K.; Shi, Z.; Guo, Y.; Ye, J. Object detection in 20 years: A survey. Proc. IEEE 2023, 111, 257–276. [Google Scholar] [CrossRef]
  13. Kaur, R.; Singh, S. A comprehensive review of object detection with deep learning. Digit. Signal Process. 2023, 132, 103812. [Google Scholar] [CrossRef]
  14. Amjoud, A.B.; Amrouch, M. Object detection using deep learning, CNNs and vision Transformers: A review. IEEE Access 2023, 11, 35479–35516. [Google Scholar] [CrossRef]
  15. Gu, A.; Dao, T. Mamba: Linear-time sequence modeling with selective state spaces. arXiv 2023, arXiv:2312.00752. [Google Scholar] [CrossRef]
  16. Girshick, R.; Donahue, J.; Darrell, T.; Malik, J. Rich feature hierarchies for accurate object detection and semantic segmentation. In Proceedings of the IEEE Conference on Computer Vision and Pattern Recognition, Columbus, OH, USA, 24–27 June 2014; pp. 580–587. [Google Scholar]
  17. Uijlings, J.R.; Van De Sande, K.E.; Gevers, T.; Smeulders, A.W. Selective search for object recognition. Int. J. Comput. Vis. 2013, 104, 154–171. [Google Scholar] [CrossRef]
  18. Girshick, R. Fast R-CNN. In Proceedings of the 2015 IEEE International Conference on Computer Vision, ICCV, Santiago, Chile, 7–13 December 2015; pp. 1440–1448. [Google Scholar] [CrossRef]
  19. Ren, S.; He, K.; Girshick, R.; Sun, J. Faster R-CNN: Towards real-time object detection with region proposal networks. IEEE Trans. Pattern Anal. Mach. Intell. 2017, 39, 1137–1149. [Google Scholar] [CrossRef] [PubMed]
  20. Liu, Z.; Mao, H.; Wu, C.Y.; Feichtenhofer, C.; Darrell, T.; Xie, S. A convnet for the 2020s. In Proceedings of the IEEE/CVF Conference on Computer Vision and Pattern Recognition, New Orleans, LA, USA, 21–24 June 2022; pp. 11976–11986. [Google Scholar]
  21. He, K.; Zhang, X.; Ren, S.; Sun, J. Deep residual learning for image recognition. In Proceedings of the IEEE Conference on Computer Vision and Pattern Recognition, Las Vegas, NV, USA, 27–30 June 2016; pp. 770–778. [Google Scholar]
  22. Redmon, J.; Divvala, S.; Girshick, R.; Farhadi, A. You only look once: Unified, real-time object detection. In Proceedings of the IEEE Conference on Computer Vision and Pattern Recognition, Las Vegas, NV, USA, 27–30 June 2016; pp. 779–788. [Google Scholar]
  23. Redmon, J.; Farhadi, A. YOLO9000: Better, faster, stronger. In Proceedings of the IEEE Conference on Computer Vision and Pattern Recognition, Honolulu, HI, USA, 21–26 July 2017; pp. 7263–7271. [Google Scholar]
  24. Redmon, J.; Farhadi, A. Yolov3: An incremental improvement. arXiv 2018, arXiv:1804.02767. [Google Scholar] [CrossRef]
  25. Jocher, G.; Chaurasia, A.; Stoken, A.; Borovec, J.; Kwon, Y.; Xie, T.; Fang, J.; Michael, K.; Lorna; Abhiram, V.; et al. ultralytics/yolov5: v6.1—TensorRT, TensorFlow Edge TPU and OpenVINO Export and Inference; Zenodo: Geneva, Switzerland, 2022. [Google Scholar] [CrossRef]
  26. Chen, Q.; Wang, Y.; Yang, T.; Zhang, X.; Cheng, J.; Sun, J. You only look one-level feature. In Proceedings of the IEEE/CVF Conference on Computer Vision and Pattern Recognition, Online, 19–25 June 2021; pp. 13039–13048. [Google Scholar]
  27. Ge, Z.; Liu, S.; Wang, F.; Li, Z.; Sun, J. Yolox: Exceeding yolo series in 2021. arXiv 2021, arXiv:2107.08430. [Google Scholar] [CrossRef]
  28. Wang, C.Y.; Bochkovskiy, A.; Liao, H.Y.M. YOLOv7: Trainable bag-of-freebies sets new state-of-the-art for real-time object detectors. In Proceedings of the IEEE/CVF Conference on Computer Vision and Pattern Recognition, Vancouver, BC, Canada, 18–22 June 2023; pp. 7464–7475. [Google Scholar]
  29. Wu, T.; Dong, Y. YOLO-SE: Improved YOLOv8 for remote sensing object detection and recognition. Appl. Sci. 2023, 13, 12977. [Google Scholar] [CrossRef]
  30. Park, M.H.; Choi, J.H.; Lee, W.J. Object detection for various types of vessels using the YOLO algorithm. J. Adv. Mar. Eng. Technol. 2024, 48, 81–88. [Google Scholar] [CrossRef]
  31. Lin, T.Y.; Goyal, P.; Girshick, R.; He, K.; Dollár, P. Focal loss for dense object detection. In Proceedings of the IEEE International Conference on Computer Vision, Venice, Italy, 22–29 October 2017; pp. 2980–2988. [Google Scholar]
  32. Gevorgyan, Z. SIoU loss: More powerful learning for bounding box regression. arXiv 2022, arXiv:2205.12740. [Google Scholar] [CrossRef]
  33. Tong, Z.; Chen, Y.; Xu, Z.; Yu, R. Wise-IoU: Bounding box regression loss with dynamic focusing mechanism. arXiv 2023, arXiv:2301.10051. [Google Scholar]
  34. Rezatofighi, H.; Tsoi, N.; Gwak, J.; Sadeghian, A.; Reid, I.; Savarese, S. Generalized intersection over union: A metric and a loss for bounding box regression. In Proceedings of the IEEE/CVF Conference on Computer Vision and Pattern Recognition, Long Beach, CA, USA, 15–20 June 2019; pp. 658–666. [Google Scholar]
  35. Zheng, Z.; Wang, P.; Liu, W.; Li, J.; Ye, R.; Ren, D. Distance-IoU loss: Faster and better learning for bounding box regression. In Proceedings of the AAAI Conference on Artificial Intelligence, New York, NY, USA, 7–12 February 2020; Volume 34, pp. 12993–13000. [Google Scholar]
  36. Tan, M.; Pang, R.; Le, Q.V. Efficientdet: Scalable and efficient object detection. In Proceedings of the IEEE/CVF Conference on Computer Vision and Pattern Recognition, Seattle, WA, USA, 13–19 June 2020; pp. 10781–10790. [Google Scholar]
  37. Carion, N.; Massa, F.; Synnaeve, G.; Usunier, N.; Kirillov, A.; Zagoruyko, S. End to-end object detection with transformers. In European Conference on Computer Vision; Springer: Berlin/Heidelberg, Germany, 2020; pp. 213–229. [Google Scholar]
  38. Zhu, X.; Su, W.; Lu, L.; Li, B.; Wang, X.; Dai, J. Deformable detr: Deformable transformers for end-to-end object detection. arXiv 2020, arXiv:2010.04159. [Google Scholar]
  39. Meng, D.; Chen, X.; Fan, Z.; Zeng, G.; Li, H.; Yuan, Y.; Wang, J. Conditional detr for fast training convergence. In Proceedings of the IEEE/CVF International Conference on Computer Vision, Online, 10–17 October 2021; pp. 3651–3660. [Google Scholar]
  40. Liu, S.; Li, F.; Zhang, H.; Yang, X.; Qi, X.; Su, H.; Zhang, L. Dab-detr: Dynamic anchor boxes are better queries for detr. arXiv 2022, arXiv:2201.12329. [Google Scholar] [CrossRef]
  41. Zhang, H.; Li, F.; Liu, S.; Zhang, L.; Su, H.; Zhu, J.; Shum, H.Y. Dino: Detr with improved denoising anchor boxes for end-to-end object detection. arXiv 2022, arXiv:2203.03605. [Google Scholar]
  42. Wang, Z.; Li, C.; Xu, H.; Zhu, X. Mamba YOLO: SSMs-Based YOLO For Object Detection. arXiv 2024, arXiv:2406.05835. [Google Scholar] [CrossRef]
  43. Zhou, W.; Kamata, S.I.; Wang, H.; Wong, M.S. Mamba-in-Mamba: Centralized Mamba-Cross-Scan in Tokenized Mamba Model for Hyperspectral Image Classification. arXiv 2024, arXiv:2405.12003. [Google Scholar] [CrossRef]
  44. Dong, W.; Zhu, H.; Lin, S.; Luo, X.; Shen, Y.; Liu, X.; Zhang, B. Fusion-mamba for cross-modality object detection. arXiv 2024, arXiv:2404.09146. [Google Scholar] [CrossRef]
  45. Zhu, L.; Liao, B.; Zhang, Q.; Wang, X.; Liu, W.; Wang, X. Vision mamba: Efficient visual representation learning with bidirectional state space model. arXiv 2024, arXiv:2401.09417. [Google Scholar] [CrossRef]
  46. Xie, J.; Tian, T.; Hu, R.; Yang, X.; Xu, Y.; Zan, L. A Novel Detector for Wind Turbines in Wide-Ranging, Multi-Scene Remote Sensing Images. IEEE J. Sel. Top. Appl. Earth Obs. Remote Sens. 2024, 17, 17725–17738. [Google Scholar] [CrossRef]
  47. Zhao, S.; Chen, H.; Zhang, X.; Xiao, P.; Bai, L.; Ouyang, W. Rs-mamba for large remote sensing image dense prediction. arXiv 2024, arXiv:2404.02668. [Google Scholar] [CrossRef]
  48. Ronneberger, O.; Fischer, P.; Brox, T. U-net: Convolutional networks for biomedical image segmentation. In Proceedings of the Medical Image Computing and Computer-Assisted Intervention—MICCAI 2015: 18th International Conference, Munich, Germany, 5–9 October 2015; Volume 18, pp. 234–241. [Google Scholar]
  49. Liu, M.; Dan, J.; Lu, Z.; Yu, Y.; Li, Y.; Li, X. CM-UNet: Hybrid CNN-Mamba UNet for Remote Sensing Image Semantic Segmentation. arXiv 2024, arXiv:2405.10530. [Google Scholar]
  50. Liu, Y.; Tian, Y.; Zhao, Y.; Yu, H.; Xie, L.; Wang, Y.; Ye, Q.; Jiao, J.; Liu, Y. Vmamba: Visual state space model. Adv. Neural Inf. Process. Syst. 2024, 37, 103031–103063. [Google Scholar]
  51. Zhang, R. Making convolutional networks shift-invariant again. In Proceedings of the International Conference on Machine Learning, Long Beach, CA, USA, 10–15 June 2019; pp. 7324–7334. [Google Scholar]
  52. Howard, A.; Sandler, M.; Chu, G.; Chen, L.C.; Chen, B.; Tan, M.; Adam, H. Searching for mobilenetv3. In Proceedings of the IEEE/CVF International Conference on Computer Vision, Seoul, Republic of Korea, 27 October–2 November 2019; pp. 1314–1324. [Google Scholar]
  53. Cai, Z.; Vasconcelos, N. Cascade r-cnn: Delving into high quality object detection. In Proceedings of the IEEE Conference on Computer Vision and Pattern Recognition, Salt Lake City, UT, USA, 18–22 June 2018. [Google Scholar]
  54. Zheng, K.; Chen, Y.; Wang, J.; Liu, Z.; Bao, S.; Zhan, J.; Shen, N. Enhancing Remote Sensing Semantic Segmentation Accuracy and Efficiency Through Transformer and Knowledge Distillation. IEEE J. Sel. Top. Appl. Earth Obs. Remote Sens. 2025, 18, 4074–4092. [Google Scholar] [CrossRef]
  55. Wang, Y.; Zhang, T.; Zhao, L.; Hu, L.; Wang, Z.; Niu, Z.; Cheng, P.; Chen, K.; Zeng, X.; Wang, Z. Ringmo-lite: A remote sensing lightweight network with cnn-transformer hybrid framework. IEEE Trans. Geosci. Remote Sens. 2024, 62, 5608420. [Google Scholar] [CrossRef]
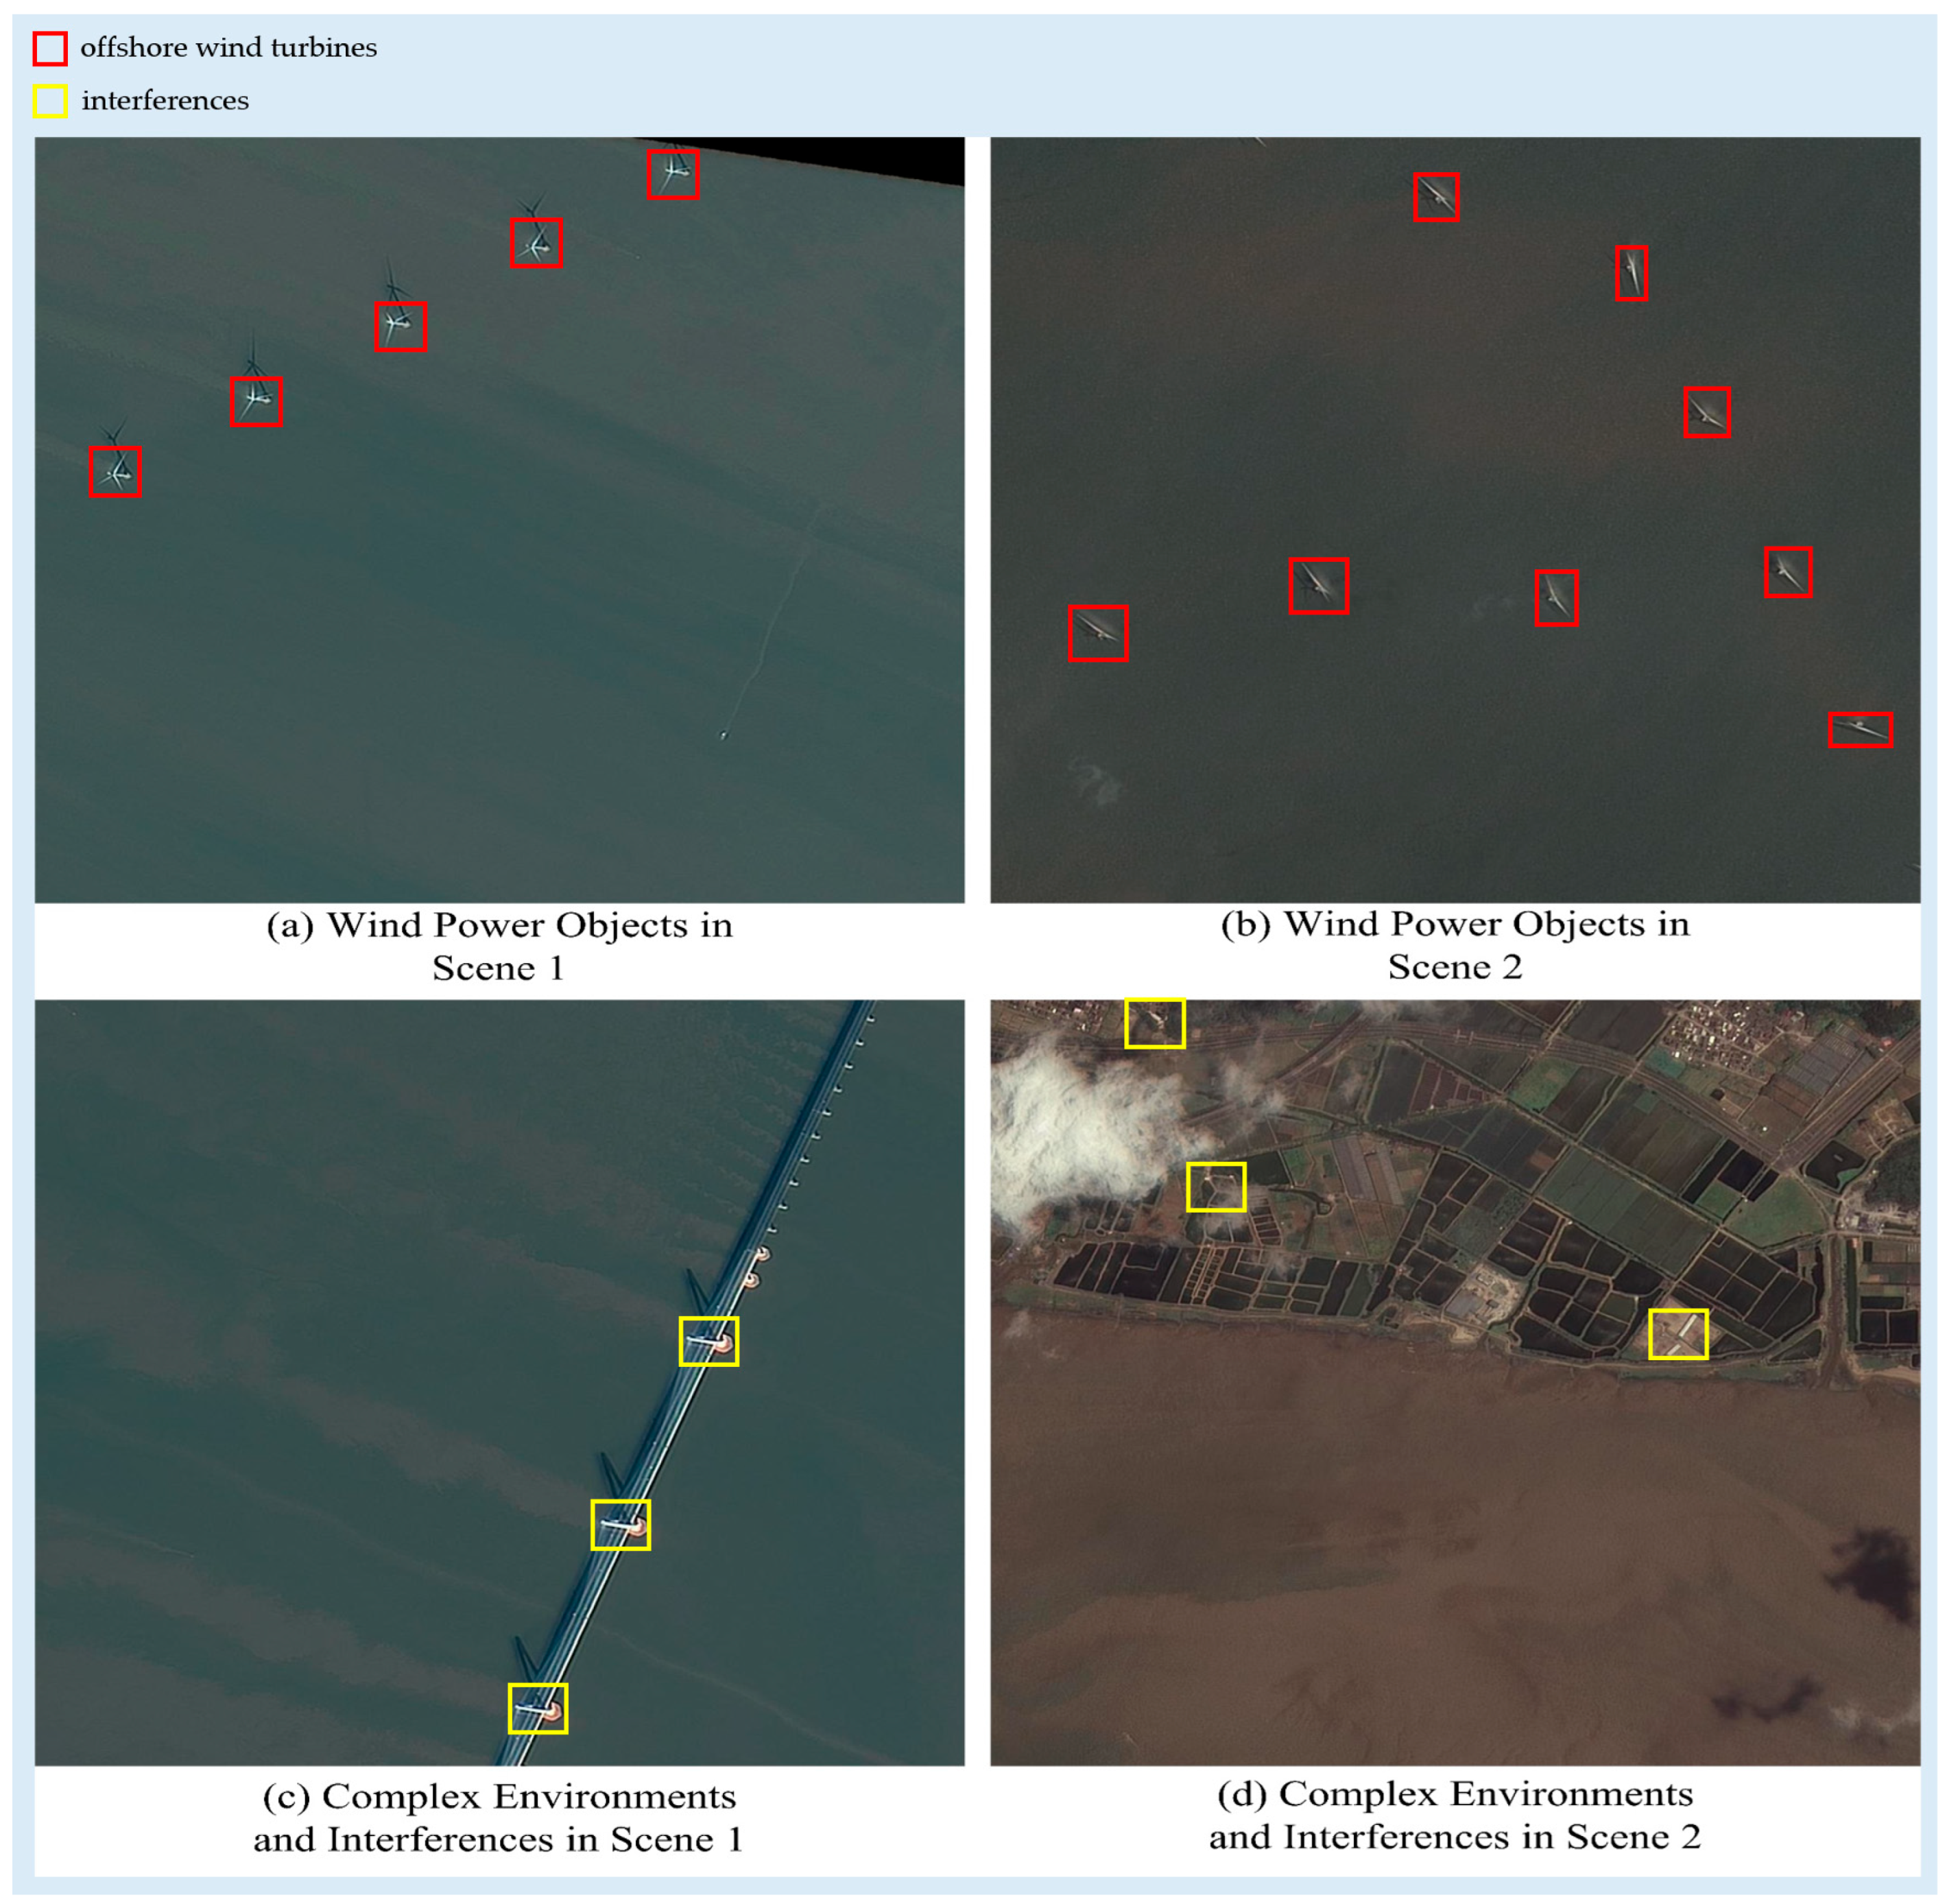
Figure 1. OWTs in remote sensing image.
Jmse 13 02124 g001
Figure 2. The architecture of OWTDNet.
Jmse 13 02124 g002
Figure 3. Remote sensing image splitting strategies.
Jmse 13 02124 g003
Figure 4. Comparison of existing object detection algorithms.
Jmse 13 02124 g004
Figure 5. Difference between Transformer and Mamba in modeling relations.
Jmse 13 02124 g005
Figure 6. The architecture of VSS block.
Jmse 13 02124 g006
Figure 7. The limitations of the Mamba model.
Jmse 13 02124 g007
Figure 8. The architecture of Blurring-MobileNetv3.
Jmse 13 02124 g008
Figure 9. Overview of feature alignment and enhancement module.
Jmse 13 02124 g009
Figure 10. Illustration of channel alignment module.
Jmse 13 02124 g010
Figure 11. Illustration of position alignment module.
Jmse 13 02124 g011
Figure 12. Visualization of different detection models.
Jmse 13 02124 g012
Figure 13. PR curves of OWTDNet at small, medium, and large scales.
Jmse 13 02124 g013
Figure 14. Visual comparison of different detection models.
Jmse 13 02124 g014
Figure 15. Illustration of NMS in post-processing.
Jmse 13 02124 g015
Figure 16. Different encoding structures.
Jmse 13 02124 g016
Figure 17. Detection results under different encoding structures.
Jmse 13 02124 g017
Figure 18. Illustration of prediction robustness under the image shit operation.
Jmse 13 02124 g018
Figure 19. Visual detection results with or w/o channel and position enhancement.
Jmse 13 02124 g019
Figure 20. Comparison of detection results using different classification losses in Cascade R-CNN network.
Jmse 13 02124 g020
Figure 21. The comparison of detection results using different box regression loss.
Jmse 13 02124 g021
Table 1. The advantages and disadvantages of different splitting strategies.
Splitting StrategiesAdvantagesDisadvantages
1
(1)
Good for small targets like wind power facilities.
(2)
Ensures no missed detections caused by splitting strategy.
(1)
Duplicate detections in the gap will lead to performance decline.
(2)
Different patch images contain the same targets, deduplication post-processes are required, increasing the system’s overhead.
2
(1)
Improves the system’s speed and efficacy.
(2)
No post-processing stage, lower deployment costs.
(1)
Missed detections caused by splitting strategy.
Table 2. Captured parameters of different satellites.
Satellite NameSpatial ResolutionLongitude RangeLatitude Range
GF1Full color with 2 m 117.5 ° ~ 122.9 ° 23.5 ° ~ 34.7 °
GF2Full color with 1 m 119.5 ° ~ 120.1 ° 33.5 ° ~ 35.3 °
GF7Full color with 0.8 m 117.4 ° ~ 119.8 ° 23.9 ° ~ 34.6 °
ZY1Full color with 5 m 118.6 ° ~ 122.6 ° 24.2 ° ~ 35.0 °
ZY3Full color with 2.1 m 118.0 ° ~ 121.8 ° 24.7 ° ~ 34.6 °
Table 3. Hardware and software configurations.
PlatformNameDescription
Train HardwareCPUIntel Xeon 6330 2.0 GHz
GPUNVIDIA RTX4090 48 GB × 4
MemoryDDR5 6800 MHz 64 GB
Deploy HardwareCPUIntel 12700KF 3.6 GHz
GPUNVIDIA RTX3090 24 GB × 1
MemoryDDR4 3200MHz 64 GB
SoftwareAnacondaVersion 4.12.0
PythonVersion 3.8.5
CUDAVersion 12.1
cuDNNVersion 8.9.3
PytorchVersion 2.1.0
MMCVVersion 2.1.0
ultralyticsVersion 8.0.6
VMambaVersion 20240525
MMDetectionVersion 3.3.0
Table 4. Training configurations of different methods.
Method
Category
Method
Name
Proposed
Year
Learning RateTrain
Epochs
Batch
Size
Augmentations
CNNFaster R-CNN20150.0013032
RetinaNet20170.0053032RandomResize
Cascade R-CNN [53]20180.0023032RandomCrop
CenterNet20190.0013032RandomFlip
ConvNext20220.00013032
TransformerDETR20200.0001458
Deformable DETR20210.0001458RandomResize
Conditional DETR20210.0001458RandomCrop
DAB-DETR20220.0001458RandomFlip
DINO20230.0001458
YOLOYOLOv320180.0015064RandomResize
YOLOF20210.0015064RandomCrop
YOLOX20210.0015064RandomFlip
YOLOv820230.0015064
MambaVMamba20240.00013512RandomResize
Mamba-YOLO20250.013512RandomCrop
OWTDNetCNN+Mamba 0.00013512RandomFlip
Table 5. Comparison of different OWT detection methods.
Method NameBackboneParams
/MB
A P 50 95
/%
A P 50
/%
A P 75
/%
FLOPs
/T
S p a t c h
/ms
S r s
/s
GPU
/GB
Faster R-CNNR5080.2928.3 ± 0.242.3 ± 0.2734.9 ± 0.210.3551.4399.44.8
R10199.2832.7 ± 01750.9 ± 0.2236.8 ± 0.190.4355.6107.35.3
RetinaNetR5037.9631.3 ± 0.2645.7 ± 0.2734.2 ± 0.230.2622.743.82.8
R10156.9633.6 ± 0.2251.3 ± 0.2437.5 ± 0.220.3229.557.13.8
Swin-T38.4736.3 ± 0.2355.1 ± 0.2642.0 ± 0.270.3148.392.84.4
Swin-S59.7739.7 ± 0.1959.4 ± 0.2246.5 ± 0.240.4468.9132.94.7
Cascade
R-CNN
R5069.3933.2 ± 0.1850.7 ± 0.2236.3 ± 0.210.2435.364.23.3
R10188.3934.7 ± 0.1552.8 ± 0.2138.4 ± 0.190.3238.975.74.3
Swin-T71.9337.5 ± 0.2156.4 ± 0.2640.7 ± 0.240.2952.6101.63.6
Swin-S93.2541.7 ± 0.1662.2 ± 0.1948.3 ± 0.160.3770.2135.73.9
CenterNetR5032.2930.4 ± 0.2747.4 ± 0.2733.6 ± 0.290.2121.341.12.9
R10151.2835.1 ± 0.2253.5 ± 0.2539.2 ± 0.230.2926.450.93.9
ConvNeXtTiny48.0937.7 ± 0.2157.3 ± 0.2141.7 ± 0.210.2729.757.34.6
Small69.7338.6 ± 0.1558.1 ± 0.1942.1 ± 0.220.3638.173.55.3
DETRR5041.5736.4 ± 0.1952.0 ± 0.2238.1 ± 0.180.0926.250.53.9
R10160.5639.8 ± 0.1756.7 ± 0.2143.2 ± 0.190.1835.167.84.3
Deformable DETRR5040.1135.8 ± 0.2453.9 ± 0.2340.4 ± 0.220.237.271.84.5
Conditional DETRR5043.4736.9 ± 0.2256.1 ± 0.2239.4 ± 0.240.1135.368.14.1
DAB-DETRR5043.7237.2 ± 0.2555.7 ± 0.2441.3 ± 0.260.1138.474.24.2
DINOR5047.7138.4 ± 0.2156.2 ± 0.2740.9 ± 0.180.2851.399.64.6
Swin-L218.3347.8 ± 0.1467.8 ± 0.1653.2 ± 0.120.49212.8411.35.7
YOLOv3DarkNet-5361.9529.7 ± 0.3543.5 ± 0.4234.3 ± 0.340.214.127.24.1
YOLOFR5044.1633.7 ± 0.2751.7 ± 0.3536.6 ± 0.290.1115.429.72.8
YOLOXTiny5.0631.2 ± 0.3149.6 ± 0.3235.2 ± 0.270.0211.221.62.5
Small8.9733.1 ± 0.2951.8 ± 0.3335.6 ± 0.280.0313.125.32.8
Large54.2134.8 ± 0.3153.3 ± 0.2638.7 ± 0.240.1919.838.25.4
xLarge99.0739.2 ± 0.2558.2 ± 0.2243.1 ± 0.220.3626.751.57.5
YOLOv8Small11.231.9 ± 0.3147.1 ± 0.2937.6 ± 0.260.038.716.81.6
Medium25.935.3 ± 0.3354.2 ± 0.2639.2 ± 0.250.0816.932.61.8
Large43.737.7 ± 0.2956.5 ± 0.2241.4 ± 0.290.1726.350.72.1
xLarge68.239.5 ± 0.2759.1 ± 0.2445.3 ± 0.230.2641.680.33.3
VMambaTiny53.8638.3 ± 0.2257.6 ± 0.2342.3 ± 0.220.1635.268.22.2
Small68.1843.3 ± 0.1762.6 ± 0.2448.7 ± 0.170.1941.379.82.4
Large82.4744.5 ± 0.1666.4 ± 0.1951.6 ± 0.140.2157.8110.42.8
OWTDNetTiny66.2340.7 ± 0.1861.5 ± 0.2346.4 ± 0.190.2246.389.43.7
Small82.6845.6 ± 0.1568.7 ± 0.2450.7 ± 0.160.2550.697.64.2
Large97.5847.1 ± 0.1667.1 ± 0.1852.4 ± 0.120.2866.3127.74.5
Table 6. Performance of different splitting strategies.
Method NameBackboneSplit A P 50 95
/%
A R 50 95
/%
Pre-Process Time/sPost-Process Time/s S r s /s
Cascade
R-CNN
Swin-S141.40.745.13.8144.6
241.70.714.50140.0
DINOSwin-L148.10.865.14.3420.7
247.80.824.50415.8
YOLOv8xLarge138.20.715.14.689.2
239.50.654.5084.8
VMambaLarge143.90.775.13.8119.3
244.50.744.50114.9
OWTDNetLarge146.80.795.13.7136.5
247.10.764.50132.2
Table 7. Performance comparison under different encoding structures.
StrategyUpper BranchLower Branch A P 50 95 /% S p a t c h
/ms
1Swin Transformer
[53]
R5044.889.6
B-Mv344.383.2
2VMambaR5045.260.7
B-Mv344.952.1
3Swin TransformerR5045.296.7
B-Mv345.488.2
4VMambaR5045.363.2
B-Mv345.255.3
5Swin TransformerR5045.8101.6
B-Mv345.991.2
6VMambaR5045.568.4
B-Mv345.757.1
7Swin TransformerR5046.9114.9
B-Mv346.5101.7
8VMambaR5047.577.9
B-Mv347.166.3
Table 8. Performance comparison under different CNN structures.
Method NameBackboneBlurring ConvolutionData
Augmentation
A P 50 95
/%
S p a t c h
/ms
Cascade R-CNNR50 random shift35.139.3
× 34.639.3
× random shift33.235.3
× 31.635.3
Mv3 random shift34.326.1
× 33.826.1
× random shift29.522.4
× 28.722.4
DINOR50 random shift38.655.7
× 38.355.7
× random shift38.451.3
× 38.251.3
Mv3 random shift37.744.2
× 37.544.2
× random shift37.441.1
× 37.141.1
OWTDNetR50 random shift47.982.3
× 48.182.3
× random shift47.577.9
× 46.877.9
Mv3 random shift47.166.3
× 46.966.3
× random shift46.761.2
× 46.361.2
Table 9. Performance comparison under different channel and position enhancements.
BackboneChannel EnhancePosition Enhance A P 50 95
/%
A P 50
/%
A P 75
/%
Tiny × × 39.159.144.6
× 40.261.145.9
× 39.860.345.2
40.761.546.4
Small × × 44.265.948.7
× 45.467.550.2
× 44.866.549.3
45.668.750.7
Large × × 45.766.551.8
× 46.866.949.8
× 46.266.252.1
47.167.152.4
Table 10. Performance comparison with different loss functions.
Method NameBackboneClass LossReg Loss A P 50 95 /%
Cascade R-CNNSwin-SCross EntropySmooth L137.4
IoU39.1
GIoU39.7
DIoU39.5
CIoU39.6
FocalSmooth L140.6
IoU41.4
GIoU41.5
DIoU41.5
CIoU41.7
DINOSwin-LCross EntropySmooth L145.8
IoU46.6
GIoU46.8
DIoU46.9
CIoU47.1
FocalSmooth L145.7
IoU46.9
GIoU47.4
DIoU47.5
CIoU47.8
VMambaLargeCross EntropySmooth L142.2
IoU43.5
GIoU43.8
DIoU44.2
CIoU44.1
FocalSmooth L142.9
IoU43.7
GIoU44.1
DIoU44.4
CIoU44.5
OWTDNetLargeCross EntropySmooth L144.2
IoU45.1
GIoU45.8
DIoU46.2
CIoU46.4
FocalSmooth L145.2
IoU46.3
GIoU46.9
DIoU47.0
CIoU47.1
Disclaimer/Publisher’s Note: The statements, opinions and data contained in all publications are solely those of the individual author(s) and contributor(s) and not of MDPI and/or the editor(s). MDPI and/or the editor(s) disclaim responsibility for any injury to people or property resulting from any ideas, methods, instructions or products referred to in the content.