Article

Evaluating Gas Saturation in Unconventional Gas Reservoirs Using Acoustic Logs: A Case Study of the Baiyun Depression in the Northern South China Sea

1
State Key Laboratory of Deep Earth Exploration and Imaging, School of Geophysics and Information Technology, China University of Geosciences, Beijing 100083, China
2
Key Laboratory of Polar Geophysical Exploration Technology, Chinese Geophysical Society, China University of Geosciences, Beijing 100083, China
3
Key Laboratory of Intraplate Volcanoes and Earthquakes, Ministry of Education, China University of Geosciences, Beijing 100083, China
*
Authors to whom correspondence should be addressed.
J. Mar. Sci. Eng. 2025, 13(11), 2078; https://doi.org/10.3390/jmse13112078 (registering DOI)
Submission received: 17 September 2025 / Revised: 20 October 2025 / Accepted: 28 October 2025 / Published: 31 October 2025
(This article belongs to the Special Issue Marine Well Logging and Reservoir Characterization)

Abstract

Shallow gas is an unconventional natural gas resource with great potential and has received growing attention recently. Accurate estimation of gas saturation is crucial for reserves assessments and for development program formulations. However, such reservoirs are characterized by weak diagenesis, a high clay content, and low resistivity. These properties pose significant challenges for saturation evaluations. To address the challenge of insufficient accuracy in evaluating the saturation of gas-bearing reservoirs, we propose an acoustic-based saturation evaluation method. In this study, a shallow unconsolidated rock physics model is first constructed to investigate the effect of variations in the gas saturation on elastic wave velocities. The model especially considers the patchy distribution of fluids within pores. In addition, we propose an iterative algorithm based on the updated relationship between porosity and gas saturation by introducing a correction term for the saturation to the density porosity, and successfully apply it to the logging data collected from the shallow gas reservoirs in the Pearl River Mouth Basin of the South China Sea. It is evident from the results that the saturation derived from the array acoustic logs is comparable to that obtained from the resistivity logs, with a mean absolute error of less than 6%. Additionally, it is also consistent with the drill stem test (DST) data, which further verifies the validity and reliability of this method. This study provides a novel non-electrical method for estimating the saturation of shallow gas reservoirs, which is essential to promote the evaluation of unconsolidated sandstone gas reservoirs.

1. Introduction

The excessive use of traditional fossil fuels has led to significant greenhouse gas emissions, causing serious environmental impacts. In the context of this global climate crisis and energy crisis, the search for sustainable energy solutions has become particularly urgent. Natural gas is a high-efficiency and clean fossil fuel that can play a critical role in promoting the green and low-carbon transformation of energy and facilitate the optimization of the energy structure [1,2,3]. Shallow gas refers to relatively shallowly buried natural gas that typically accumulates in sediments within 1000 m below the surface [4,5,6,7]. In addition to its commercial value, shallow gas can also serve as an indication of deeper oil and gas resources [8]. Shallow gas reservoirs with commercial value have been discovered in America, Russia, Canada, China, Germany, Japan, the Netherlands, and South Korea [6,9,10,11,12,13]. As an uppermost method to obtain subsurface information, geophysical logging can continuously measure multi-parameter information about formations and play a significant role in the exploration of shallow gas reservoirs. It can identify reservoirs effectively and estimate the petrophysical properties of reservoirs accurately, including porosity, permeability, and saturation [14,15,16]. Predicting saturation of gas-bearing reservoirs using logging data is a key task in shallow gas exploration.
The saturation is a key parameter in the quantitative evaluation of reservoirs and is essential for reserves estimation and development program formulation [17,18]. At present, the estimation of saturation primarily relies on resistivity logs [19]. Archie’s formula is the most classical method of saturation evaluation based on resistivity logging data [20], and has been widely used. However, with increasingly complex reservoirs (such as low-resistivity reservoirs and high-clay-content reservoirs) being discovered, Archie’s formula is difficult to adapt [21,22]. Consequently, various derivative models have been proposed to evaluate the saturation of different types of reservoirs, including the Simandoux equation [23], Waxman–Smits model [24], Dual-Water model [25], and Indonesia equation [26]. The rock’s electrical parameters, which serve as the critical inputs for these models, significantly influence the final results. They are typically obtained from petrophysical experiments conducted on core samples. Inaccurate parameter values lead to large deviations in the saturation calculations [27]. In addition, electrical experiments on sediments at shallow burial depths are also challenging. Recently, the development of new logging methods, such as nuclear magnetic resonance (NMR), has provided a new idea for the evaluation of reservoir saturation. It is usually combined with resistivity logging for saturation calculation [28,29]. However, due to the high cost and the long logging time of NMR logging, the application of this method is limited.
Unlike oil-bearing reservoirs, the existence of natural gas not only impacts the resistivity of the sediments but also has a significant effect on the elastic wave velocities. Gas-bearing sediments generally exhibit a low compressional velocity and high compressional wave attenuation, while the influence of natural gas on the shear velocity is negligible [30]. Therefore, a new perspective for the evaluation of gas-bearing reservoirs is provided by calculating the saturation using acoustic velocities. Based on acoustic and density logging data, Shi et al. (2019) [31] established a statistical model through a multiple regression to calculate the gas saturation. However, this method requires a large amount of core data as support, which exists as a strong limitation. The empirical fitting equation cannot accurately characterize the relationship between the reservoir saturation and acoustic velocity with only the core statistics. As a vital bridge connecting the fluid properties of reservoirs with the elastic properties of formations, rock physics provides an essential theoretical basis and technical support for reservoir characterization and fluid identification [32,33]. Numerous rock physics models and equations, such as the effective medium model [34], three-phase equation [35], and Biot-Gassmann equation [36], have been established to characterize the relationship between fluid saturation and elastic wave velocities. These models can quantitatively describe the variation in acoustic velocity under different saturation conditions by combining the porosity, fluid modulus, and rock skeleton characteristics. Recently, they have been widely applied to calculate the gas hydrate saturation in marine sediments and permafrost regions [37,38,39,40,41,42], but relatively few studies have applied array acoustic logging data to shallow gas reservoirs.
The Pearl River Mouth Basin (PRMB) is rich in shallow gas resources, with great exploration potential and extremely important commercial value [43]. The Baiyun Depression, a key area of deepwater oil and gas exploration in the PRMB, has been explored for over 40 years [44]. However, with fewer than 200 exploration wells having been drilled, its overall exploration degree remains low [45]. The current exploration activities primarily focus on medium-to-deep oil and gas reservoirs, such as the Zhuhai, Enping, and Wenchang Formations, while the systematic exploration and understanding of shallow gas remain relatively weak [46,47,48]. Nevertheless, drilling has validated the existence of multiple shallow gas accumulation zones in the Baiyun Depression and its surrounding areas. As exploration and development deepen, greater precision of saturation evaluation is required. However, due to the weak diagenesis of shallow strata, the high clay content, and unobvious resistivity response characteristics of gas layers, saturation evaluations based on resistivity faces challenges. Particularly in the absence of core data for calibration, reliance solely on resistivity-based methods for saturation evaluation may not be convincing. Therefore, the development of methods to estimate the gas saturation based on acoustic logs is valuable and can be an effective complement to resistivity-based methods. Using the appropriate rock physics models, the shallow gas saturation can be predicted from velocities [41,49]. In this study, a shallow unconsolidated rock physics model suitable for marine shallow gas reservoirs is constructed, and the Gassmann-Hill model serves to characterize the patchy distribution of pore fluids. Subsequently, an iterative algorithm is proposed for estimating the gas saturation using acoustic velocities by introducing a correction term for the saturation to the density porosity. Finally, the method is applied to the logging data measured by the drilling wells in the PRMB to validate its feasibility.

2. Geological Setting

The Pearl River Mouth Basin (PRMB), located on the northern continental margin of the South China Sea, is a significant offshore oil and gas basin [50,51]. The Baiyun Depression in the study area lies northeast of the Zhu II Depression (Figure 1) and is the largest and deepest sedimentary depression in the PRMB. The region is classified as a deep-water depression. It covers an area of more than 20,000 km2 and has water depths ranging from 200 to 2800 m; 70% of this area has depths greater than 500 m [52,53,54]. The whole Baiyun Depression includes four subsags: the Main Subsag, East Subsag, West Subsag, and South Subsag. In terms of regional tectonics, the Baiyun Depression is situated in the south of the Panyu Low Uplift, the north of the Southern Uplift Belt, the eastern side of the Yunkai Low Uplift, and the western side of the Dongsha Uplift (Figure 1a). The deep formations are thought to be composite graben structures separated by low uplifts, and the shallow are a unified passive continental margin tectonic sedimentary background of the northern South China Sea [55,56].
Multi-phase tectonic movements, such as the Zhuqiong, Nanhai, Baiyun, and Dongsha movements, have occurred successively (Figure 1b) [57,58]. The regional tectonic evolution has been intense and essential for the generation and migration of hydrocarbons. The shallow gas resources within the study area are enriched in the Miocene Hanjiang and Yuehai formations. The burial depths are mostly between 300 m and 1600 m, which is a deep-water-slope sedimentary environment [47,59,60]. The lithology of the formations is loose with a fine-grain size, and is dominated by fine sandstone, siltstone, and mudstone. They have a high clay content, locally reaching up to 60% to 70%. Concurrently, due to the shallow burial depths, the porosity of the formations is generally high, typically exceeding 20%. In summary, the shallow gas reservoirs in this region typically exhibit shallow burial depths, low degrees of cementation and compaction of the gas-bearing formations, and poor diagenesis.

3. Data and Method

3.1. Geophysical Logging Data

Geophysical logging can obtain in situ, high-resolution, and continuous multi-parameter data on underground strata. A large amount of logging data was collected from the boreholes in the Baiyun Depression, South China Sea, including conventional and array acoustic logs. Multipole array acoustic logging tools (MAC) and cross-dipole array acoustic logging tools (XMAC and XMAC-II) (Baker Atlas., Houston, TX, USA) were used for acoustic logging. These logging tools measured the shear and compressional velocities, along with other parameters, providing a wealth of acoustic information. The precise shear and compressional velocities of the formations were easily obtained by time-difference extraction from the collected array acoustic log data [61,62]. In addition, the mud logging data and drill stem test (DST) data were also acquired from some typical wells. The well logging data, including natural gamma ray (GR) logs, resistivity logs, density logs, array acoustic logs, the total gas content (TG) obtained from mud logging, and the results of DST were used in this study (Table 1). The GR logs were used to estimate the mineral content, while the density logs were used to calculate the initial density porosity (two-component system). The total gas content (TG) curves obtained from the mud logging served to determine the gas-bearing reservoirs; the higher the gas content of the sediment, the greater the abnormal amplitude of the curve.

3.2. Method

Theoretical models are essential to the study of rock physics. They idealize actual rocks through assumptions and establish a general relationship based on their inherent physical principles to better understand and predict the properties of rocks [63,64]. The Gassmann equation is widely used in the field of rock physics. It is usually used to investigate the impact of saturated fluids on the acoustic properties of rocks and to describe the relationships between the acoustic response and the rocks’ physical characteristics [65,66]. In addition, the equation indicates that the bulk modulus of saturated sediments is determined by the bulk moduli of the matrix, the dry rock frame, the fluids filled into pores, and the porosity of the rocks [64,67]. The shear modulus of rocks is unaffected by the pore fluids. Fluid substitution is the core of the numerical simulation of acoustic velocities in this study.

3.2.1. Rock Physics Modeling

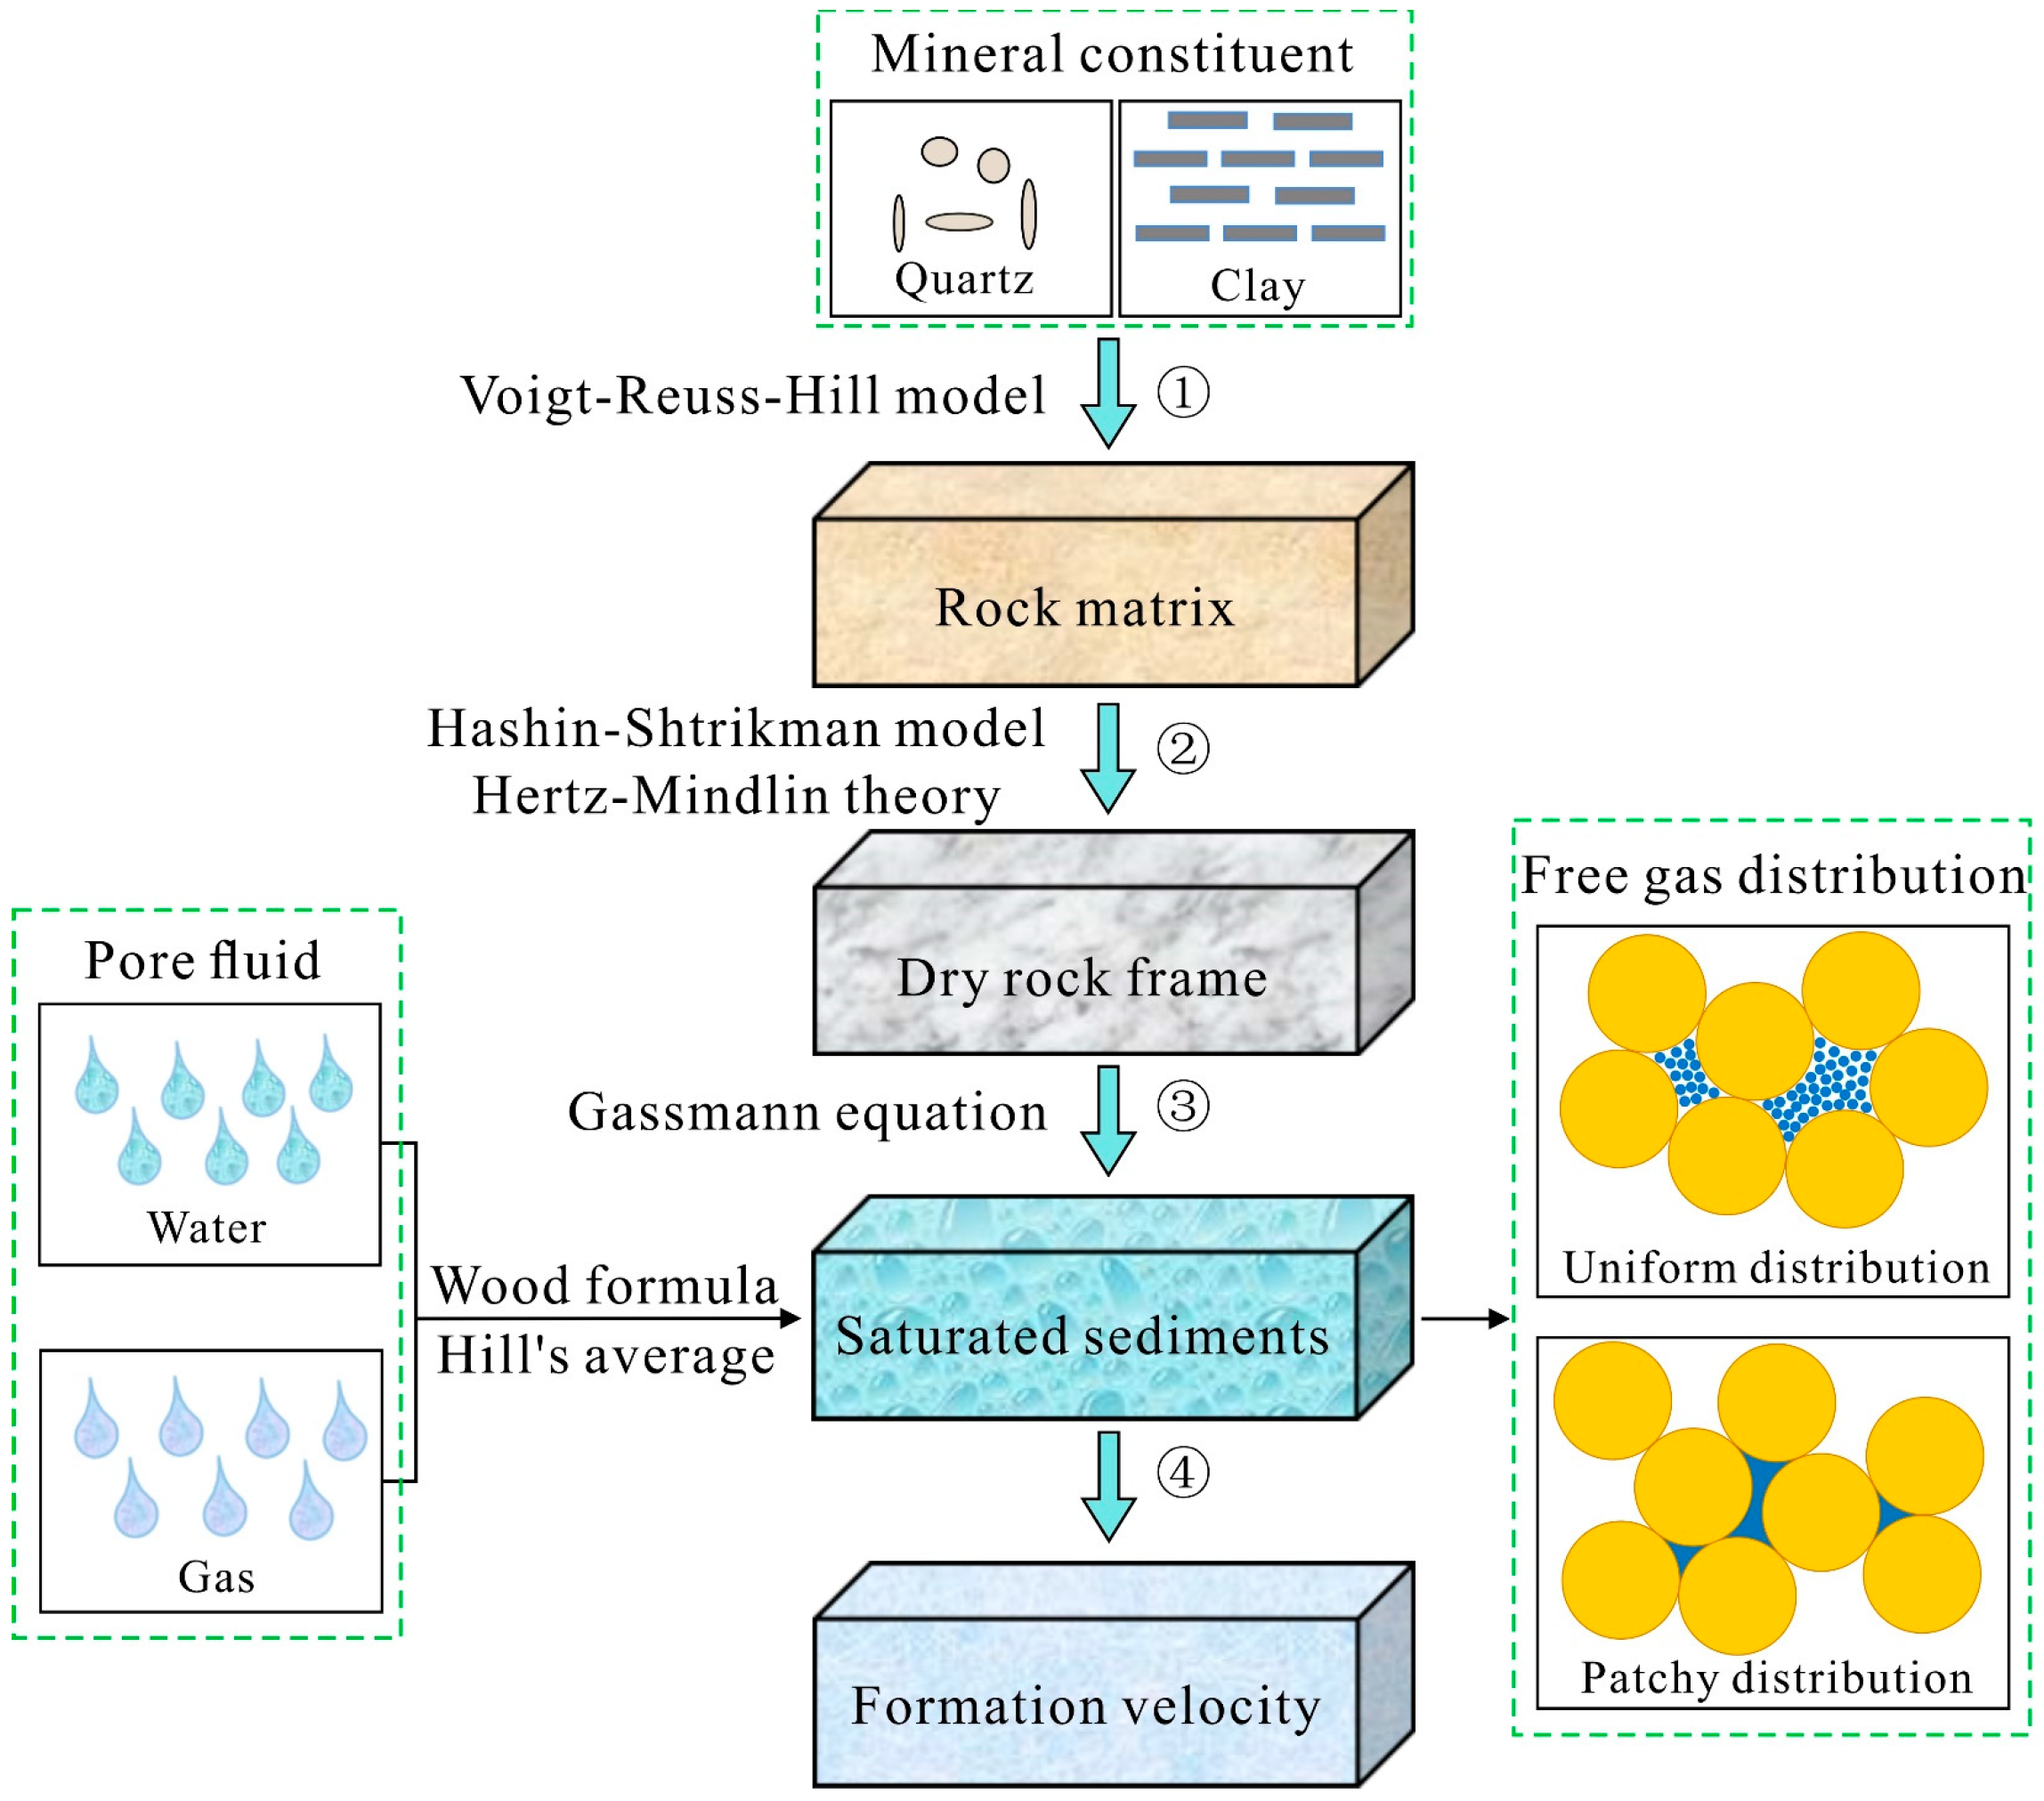
Rock physics modeling mainly involves the following four steps (Figure 2). First, calculate the rock matrix modulus from the elastic modulus of the various minerals contained in the formation. The second step involves incorporating the porosity to calculate the dry rock frame modulus. In the third step, we calculate the bulk modulus of the mixed fluid and then use the dry rock frame modulus to determine the modulus of the saturated sediments. Finally, in the last step, the formation velocities are calculated. It should be noted that the model does not account for the effects of frequency and temperature on the velocity, and assumes the formations to be isotropic.
During fluid substitution, different distributions of fluids within the pores may affect the calculation of bulk moduli of mixed fluids. The two main types of distributions are uniform and patchy. A uniform distribution assumes that a pore is fully water-saturated or that each pore contains an identical ratio of gas to water [34,49]. In contrast, a patchy distribution is observed when the gas patches, significantly exceeding the average pore diameter, are entirely encircled by water-saturated sediments [34,68,69,70].
When the fluids in a pore space are observed to be uniformly distributed, the Reuss average can be used to compute the fluid bulk modulus [71], that is, the Wood equation:
K f = [ S w / K w + ( 1 S w ) / K g ] 1
where S w is the water saturation, and K w and K g represent the bulk moduli of water and methane gas, respectively.
When fluids are heterogeneously distributed in pores (patchy distribution), the bulk moduli of the saturated sediments ( K sat ) can be computed by Hill’s theory [34,69]:
1 K sat + 4 3 G sat = S w K sat , w + 4 3 G sat + 1 S w K sat , g + 4 3 G sat
where K sat , w and K sat , g are the bulk moduli of water-saturated and gas-saturated sediments, respectively. The Gassmann equation [72] is employed to calculate K sat , w and K sat , g . Appendix A contains the thorough derivation process.
The bulk modulus of saturated sediments ( K sat ) with pore fluids showing a uniform distribution can be derived from the Gassmann equation:
K sat = K ma ϕ K dry ( 1 + ϕ ) K f K dry / K ma + K f ( 1 ϕ ) K f + ϕ K ma K f K dry / K ma
where K ma and K dry are the bulk moduli of the matrix and dry rock frame, respectively. ϕ represents the sediment porosity. Appendix A contains the thorough derivation process.
The elastic parameters of the sediment components involved in the model calculation are given in Table 2. The bulk moduli of water and gas are calculated at 20 °C and 25 MPa, following Batzle and Wang, 1992 [73]. Once the elastic modulus of the sediment is known, the compressional velocity ( V P ), shear velocity ( V S ), and bulk density ( ρ B ) of fluid-saturated porous media can be expressed as follows:
V P = K sat + 4 3 G sat ρ B
V S = G sat ρ B
ρ B = 1 ϕ ρ s + ϕ S w ρ w + 1 S w ρ g
where ρ s , ρ w , and ρ g represent the density of matrix, water, and methane gas, respectively (g/cm3). S w is the water saturation.

3.2.2. Saturation Predicted from Velocities

The density porosity is usually obtained from the bulk density by assuming a two-component system (matrix and pore fluid (water)), which inherently assumes the densities of natural gas and water are equivalent [74]. However, since natural gas has a lower density than water, it is not accurate to use a simple two-component system to calculate the porosity of formations with high gas saturation. The increase in gas saturation will cause the estimated density porosity (two-component system) to be greater than the actual porosity of the rock. To obtain an accurate porosity from density logs, the effect of the fluids with different densities in the pores must be fully considered. In the research on gas hydrates, a method has been introduced for updating the density log porosity of a simple two-component system with the gas hydrate saturation [74,75,76]. Therefore, the modified porosity ( ϕ new ) obtained from the bulk density of gas-bearing formations can be written as follows:
ϕ new = ρ ma ρ b ρ ma ρ w + S g ρ w ρ g
where ρ ma is the rock skeleton density, ρ b represents the bulk density from logging, and S g is the gas saturation.
To obtain an accurate porosity from density logging, the actual gas saturation in a formation needs to be known. Updated with the gas saturation, the modified porosity can be further written as follows:
ϕ new = ϕ m ρ w ρ ma ρ w 1 S g + ρ g S g ρ ma
where ϕ m is the two-component density porosity.
In the quantitative evaluation of gas saturation, the global optimization method is used for prediction. The actual elastic wave velocities of formations are obtained from logging, with the solution achieved through the minimization of the objective function:
E = V p obs V p cal 2 + V s obs V s cal 2 1 2
where V p obs and V s obs represent the measured compressional and shear velocities, respectively. V p cal and V s cal are the velocities calculated from the model.
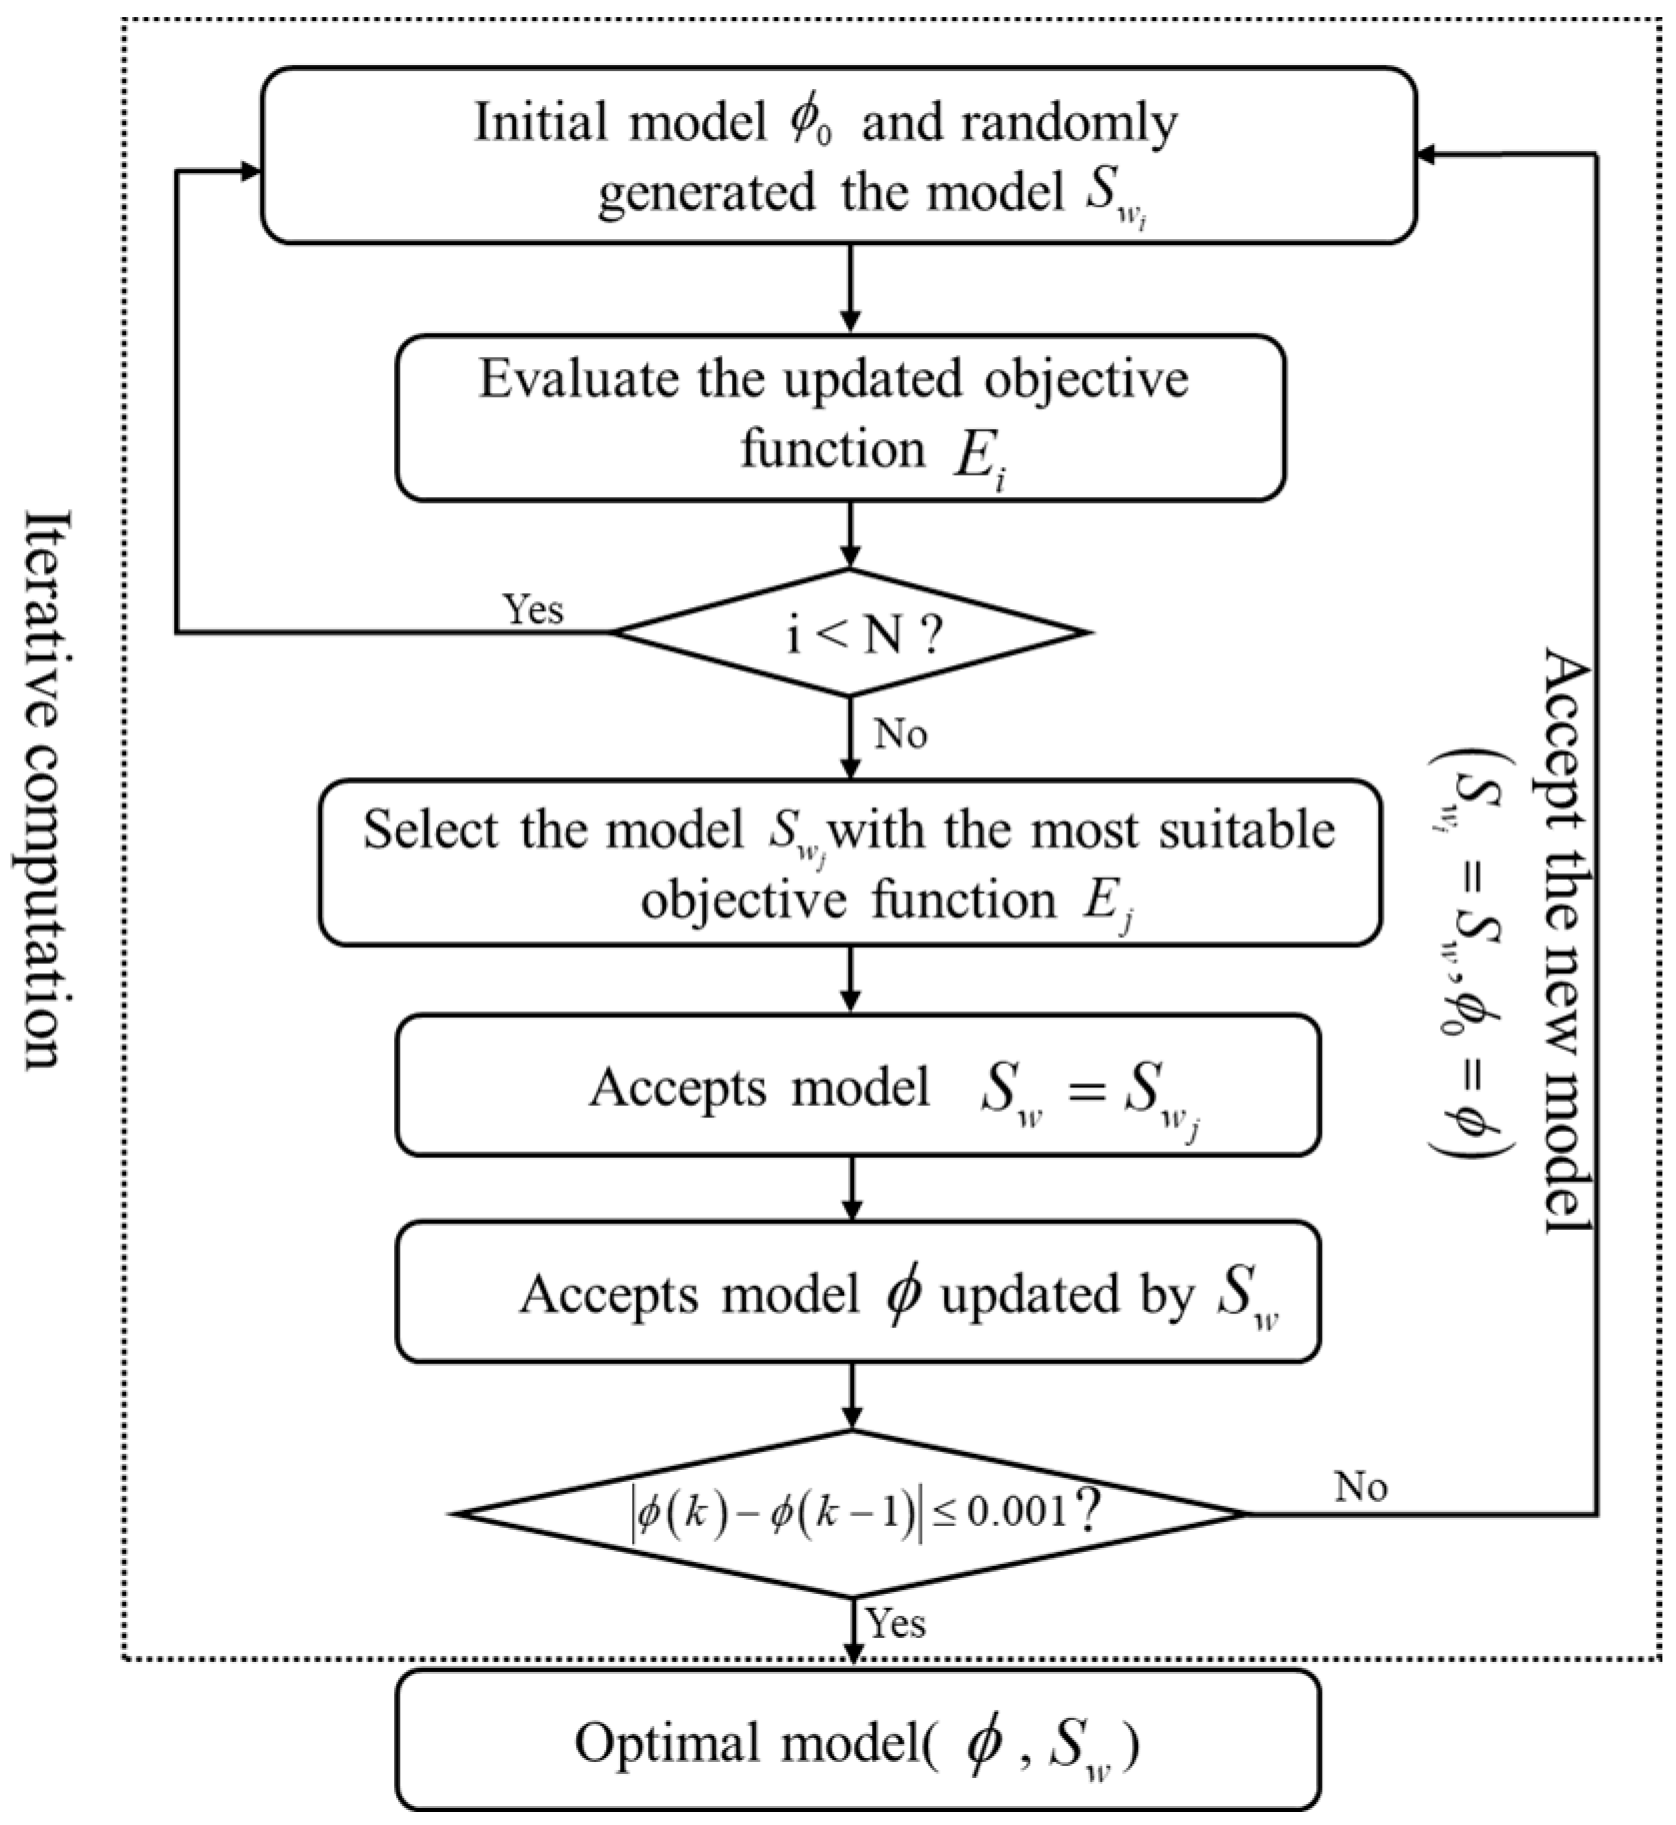
According to the above method, a workflow for the saturation and porosity calculations by this iterative relationship is proposed (Figure 3), where k represents the number of iterations (k = 1, 2, 3…). First, the initial porosity ϕ 0 in the model takes the two-component density porosity (without considering the gas content) as the initial value, and the saturation S w i is randomly generated (from 0 to 1) (i is the number of times the saturation is randomly generated at each depth; i = 1, 2, 3…). The objective function E i , corresponding to each randomly generated saturation, is obtained by the forward calculation of the model. N is the maximum number of times that the saturation is randomly generated at each depth (N = 1, 2, 3…). The number of random times has a direct effect on the final saturation. The more times, the more accurate, but the computation time will also increase. The optimal saturation at each depth is determined when the objective function is minimal, and this saturation is used to update the porosity. At this point, one of the following conditions will occur. If the updated porosity and the porosity before updating satisfy the accuracy requirements of the given error, the calculation will stop, and the results will be output. If the accuracy requirement is not met, the updated porosity and the obtained saturation are used as the input for the next calculation, and the saturation is recalculated. The iteration continues until the error accuracy requirements are finally satisfied, at which point the final porosity and saturation are output. The error accuracy requirement set during the iterative process is that the difference in porosity before and after two successive iterations is within 0.1% at each depth of the entire well section, indicating that the iterative calculation has reached stability and can be output. Table 3 presents the relevant parameters in the model’s calculations.

4. Results

An established rock physics model of shallow unconsolidated formation is employed to identify gas layers and predict the gas saturation in the two typical drilling wells A-1 and A-2 within the study area. The saturation obtained is then compared with that calculated from the Waxman–Smits model based on resistivity logs to verify the validity of the method.

4.1. Logging Response of Gas-Bearing Sandstone Reservoirs

Gas-bearing reservoirs and gas-free reservoirs exhibit distinct response characteristics on logging curves, primarily due to the significant influence of gas on the physical properties of sediments.
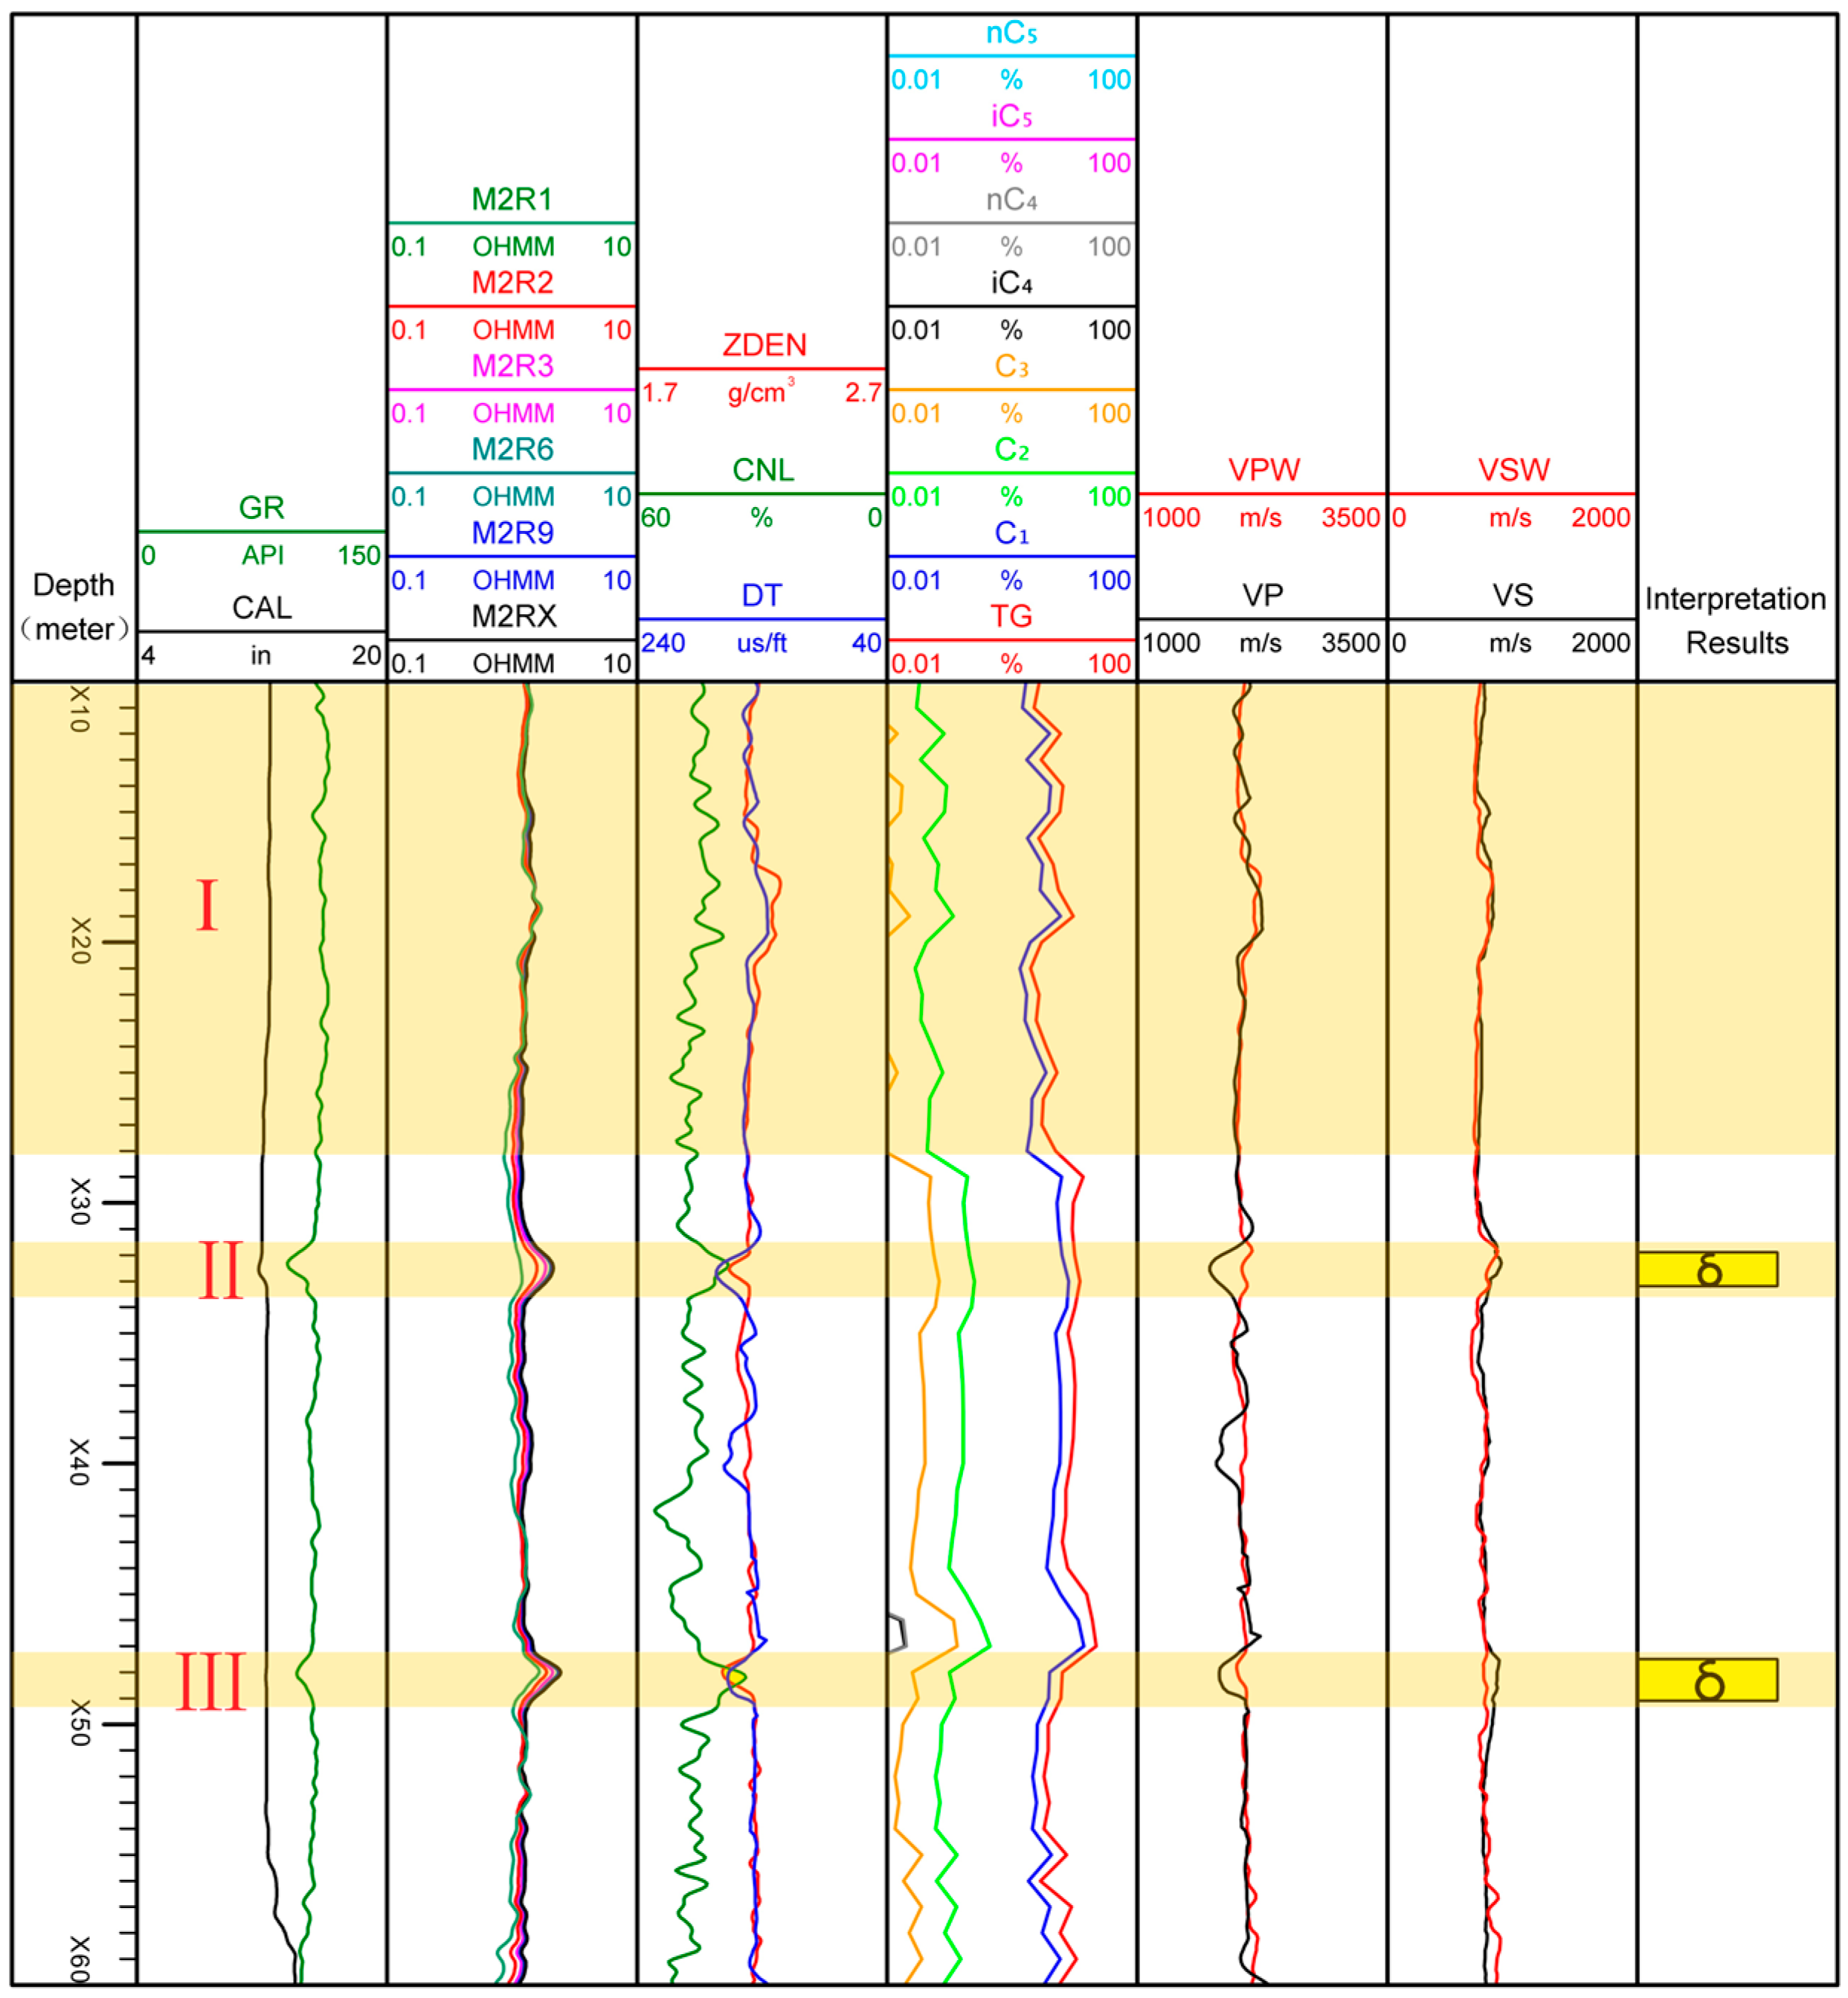
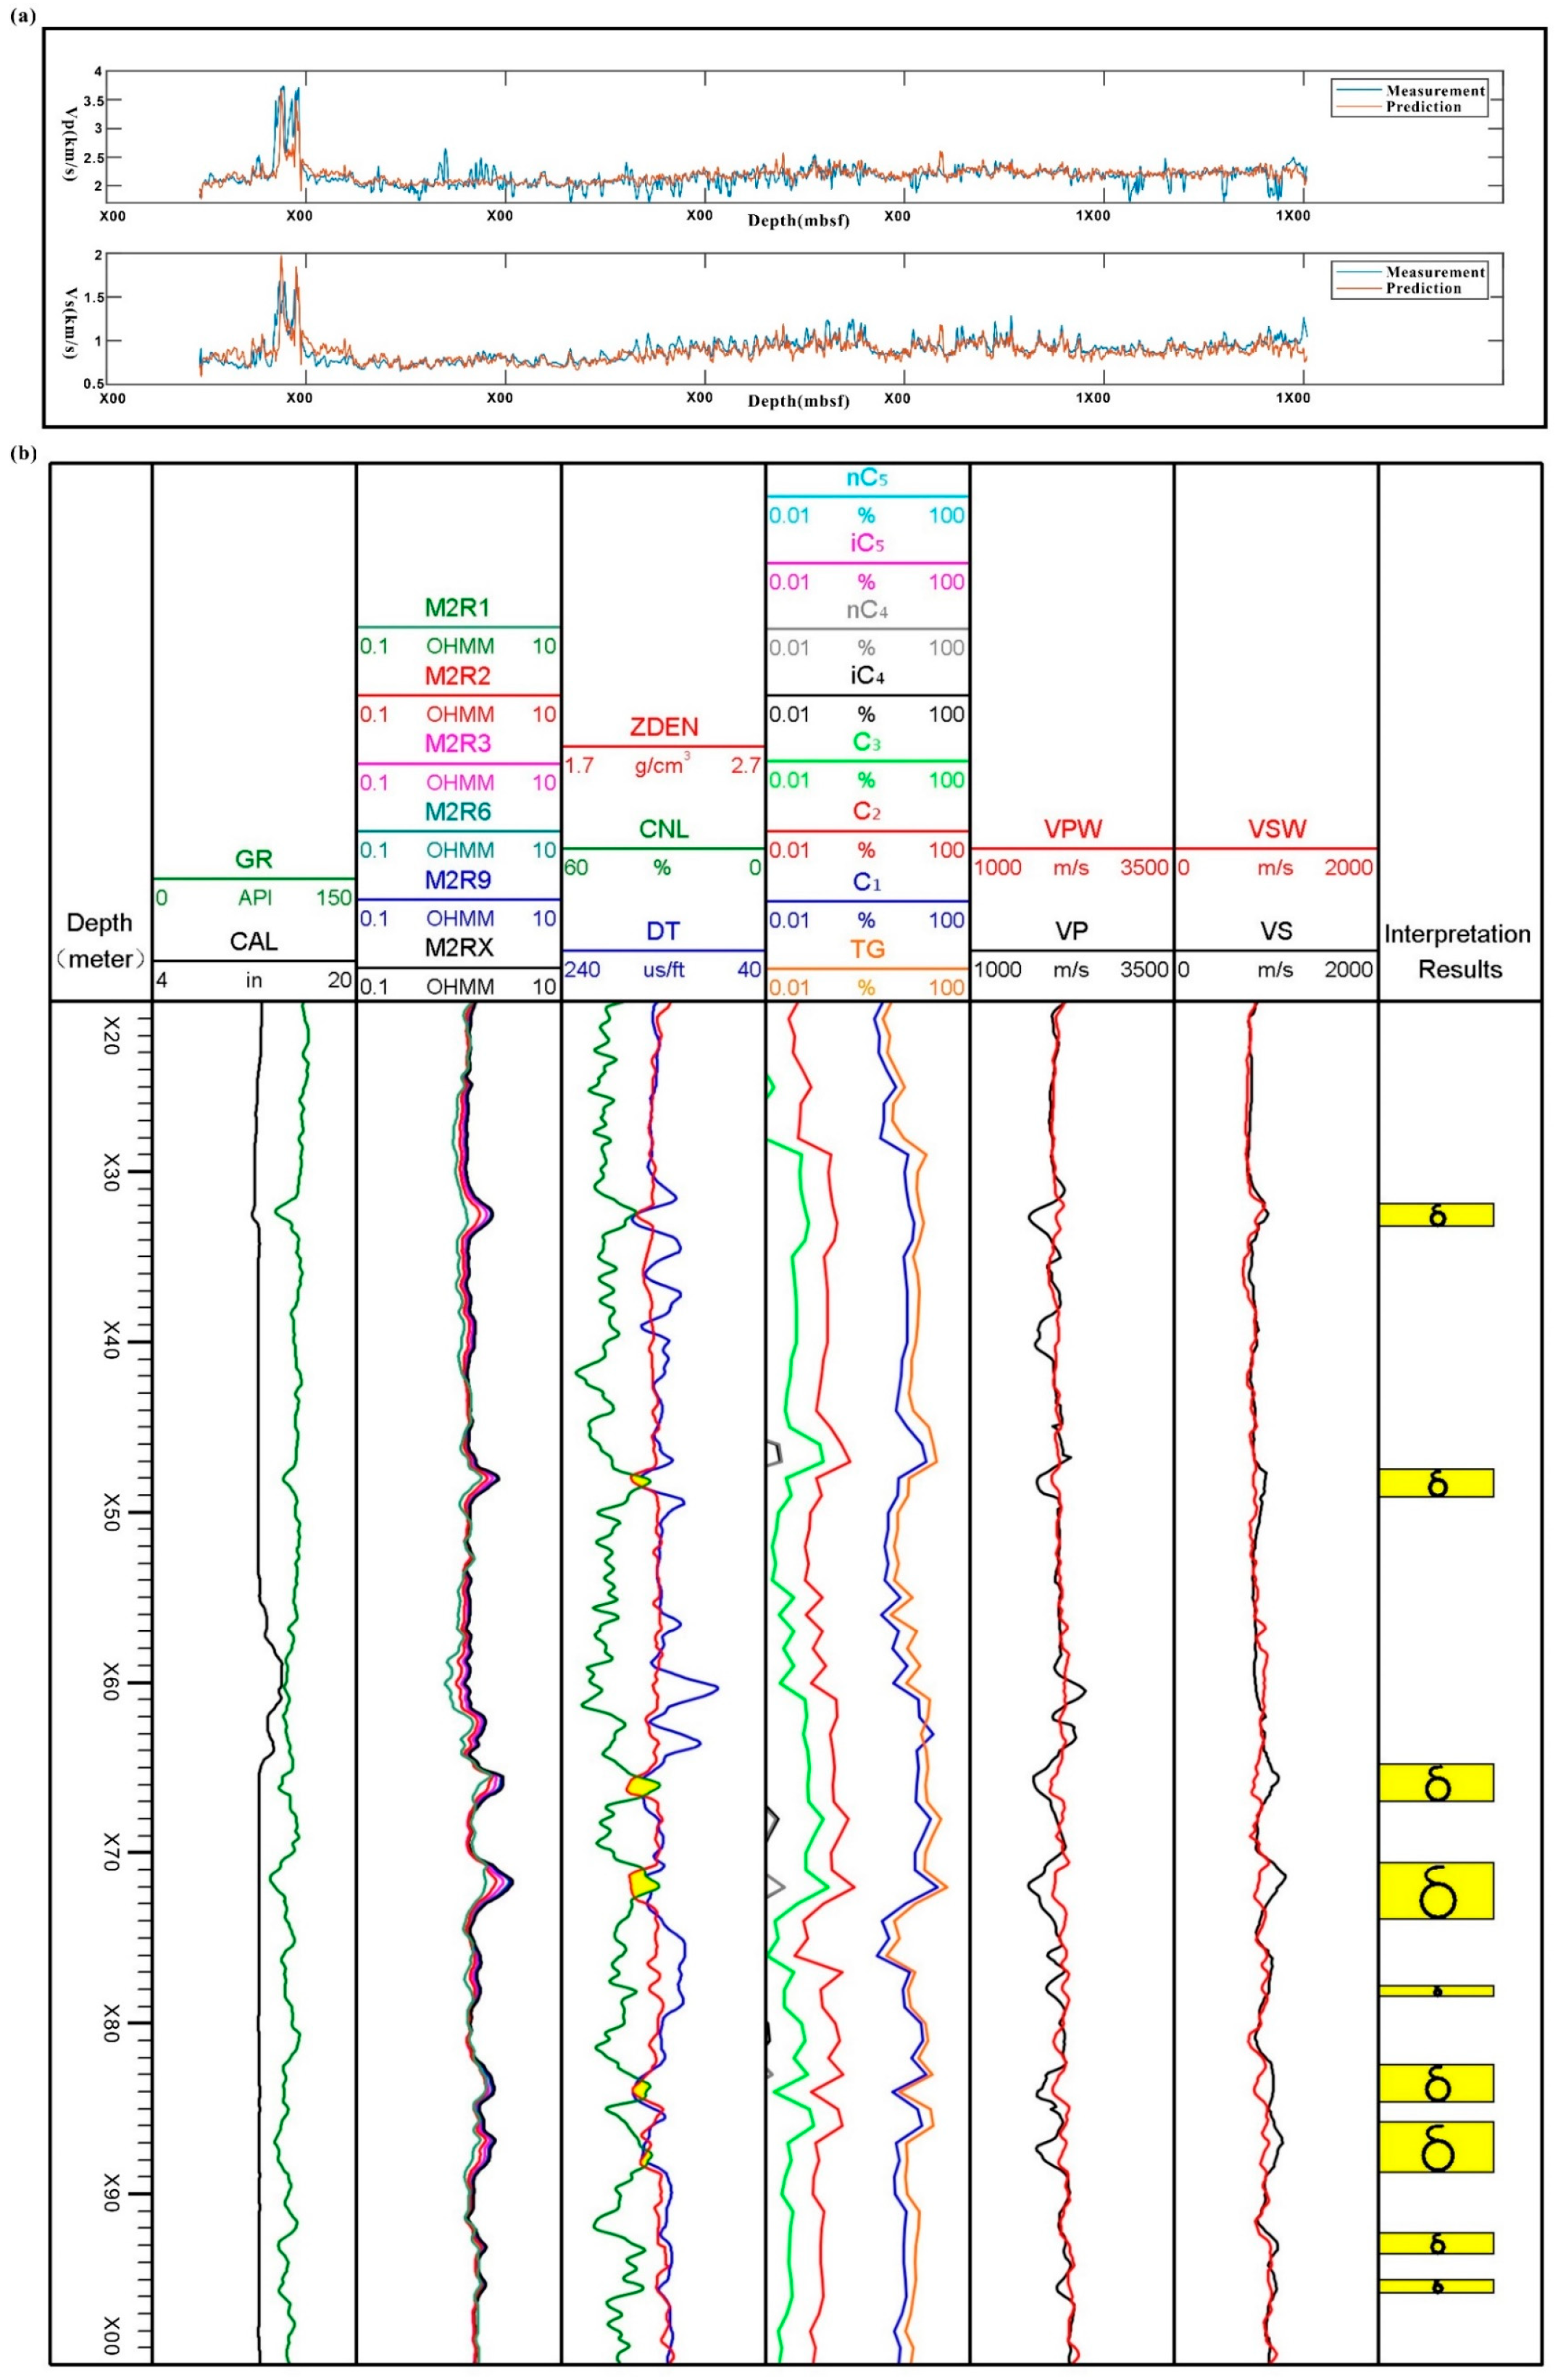
Layer I is a typical non-reservoir (Figure 4). In this layer, the natural gamma ray (GR) values are increased (the second channel), the resistivity curves show a low value and no obvious change, and there is no amplitude difference between the deep and shallow resistivity curves (the third channel). The porosity curves (the fourth channel), which include the compensated density (ZDEN), compensated neutron (CNL), and acoustic interval transit time (DT), show no evidence of being gas-bearing. In addition, the total gas content (TG) from the fifth channel is low and has no significant anomalies. The simulated compressional and shear velocities of water-saturated simulation are essentially identical to the measured acoustic velocities (the sixth and seventh channels).
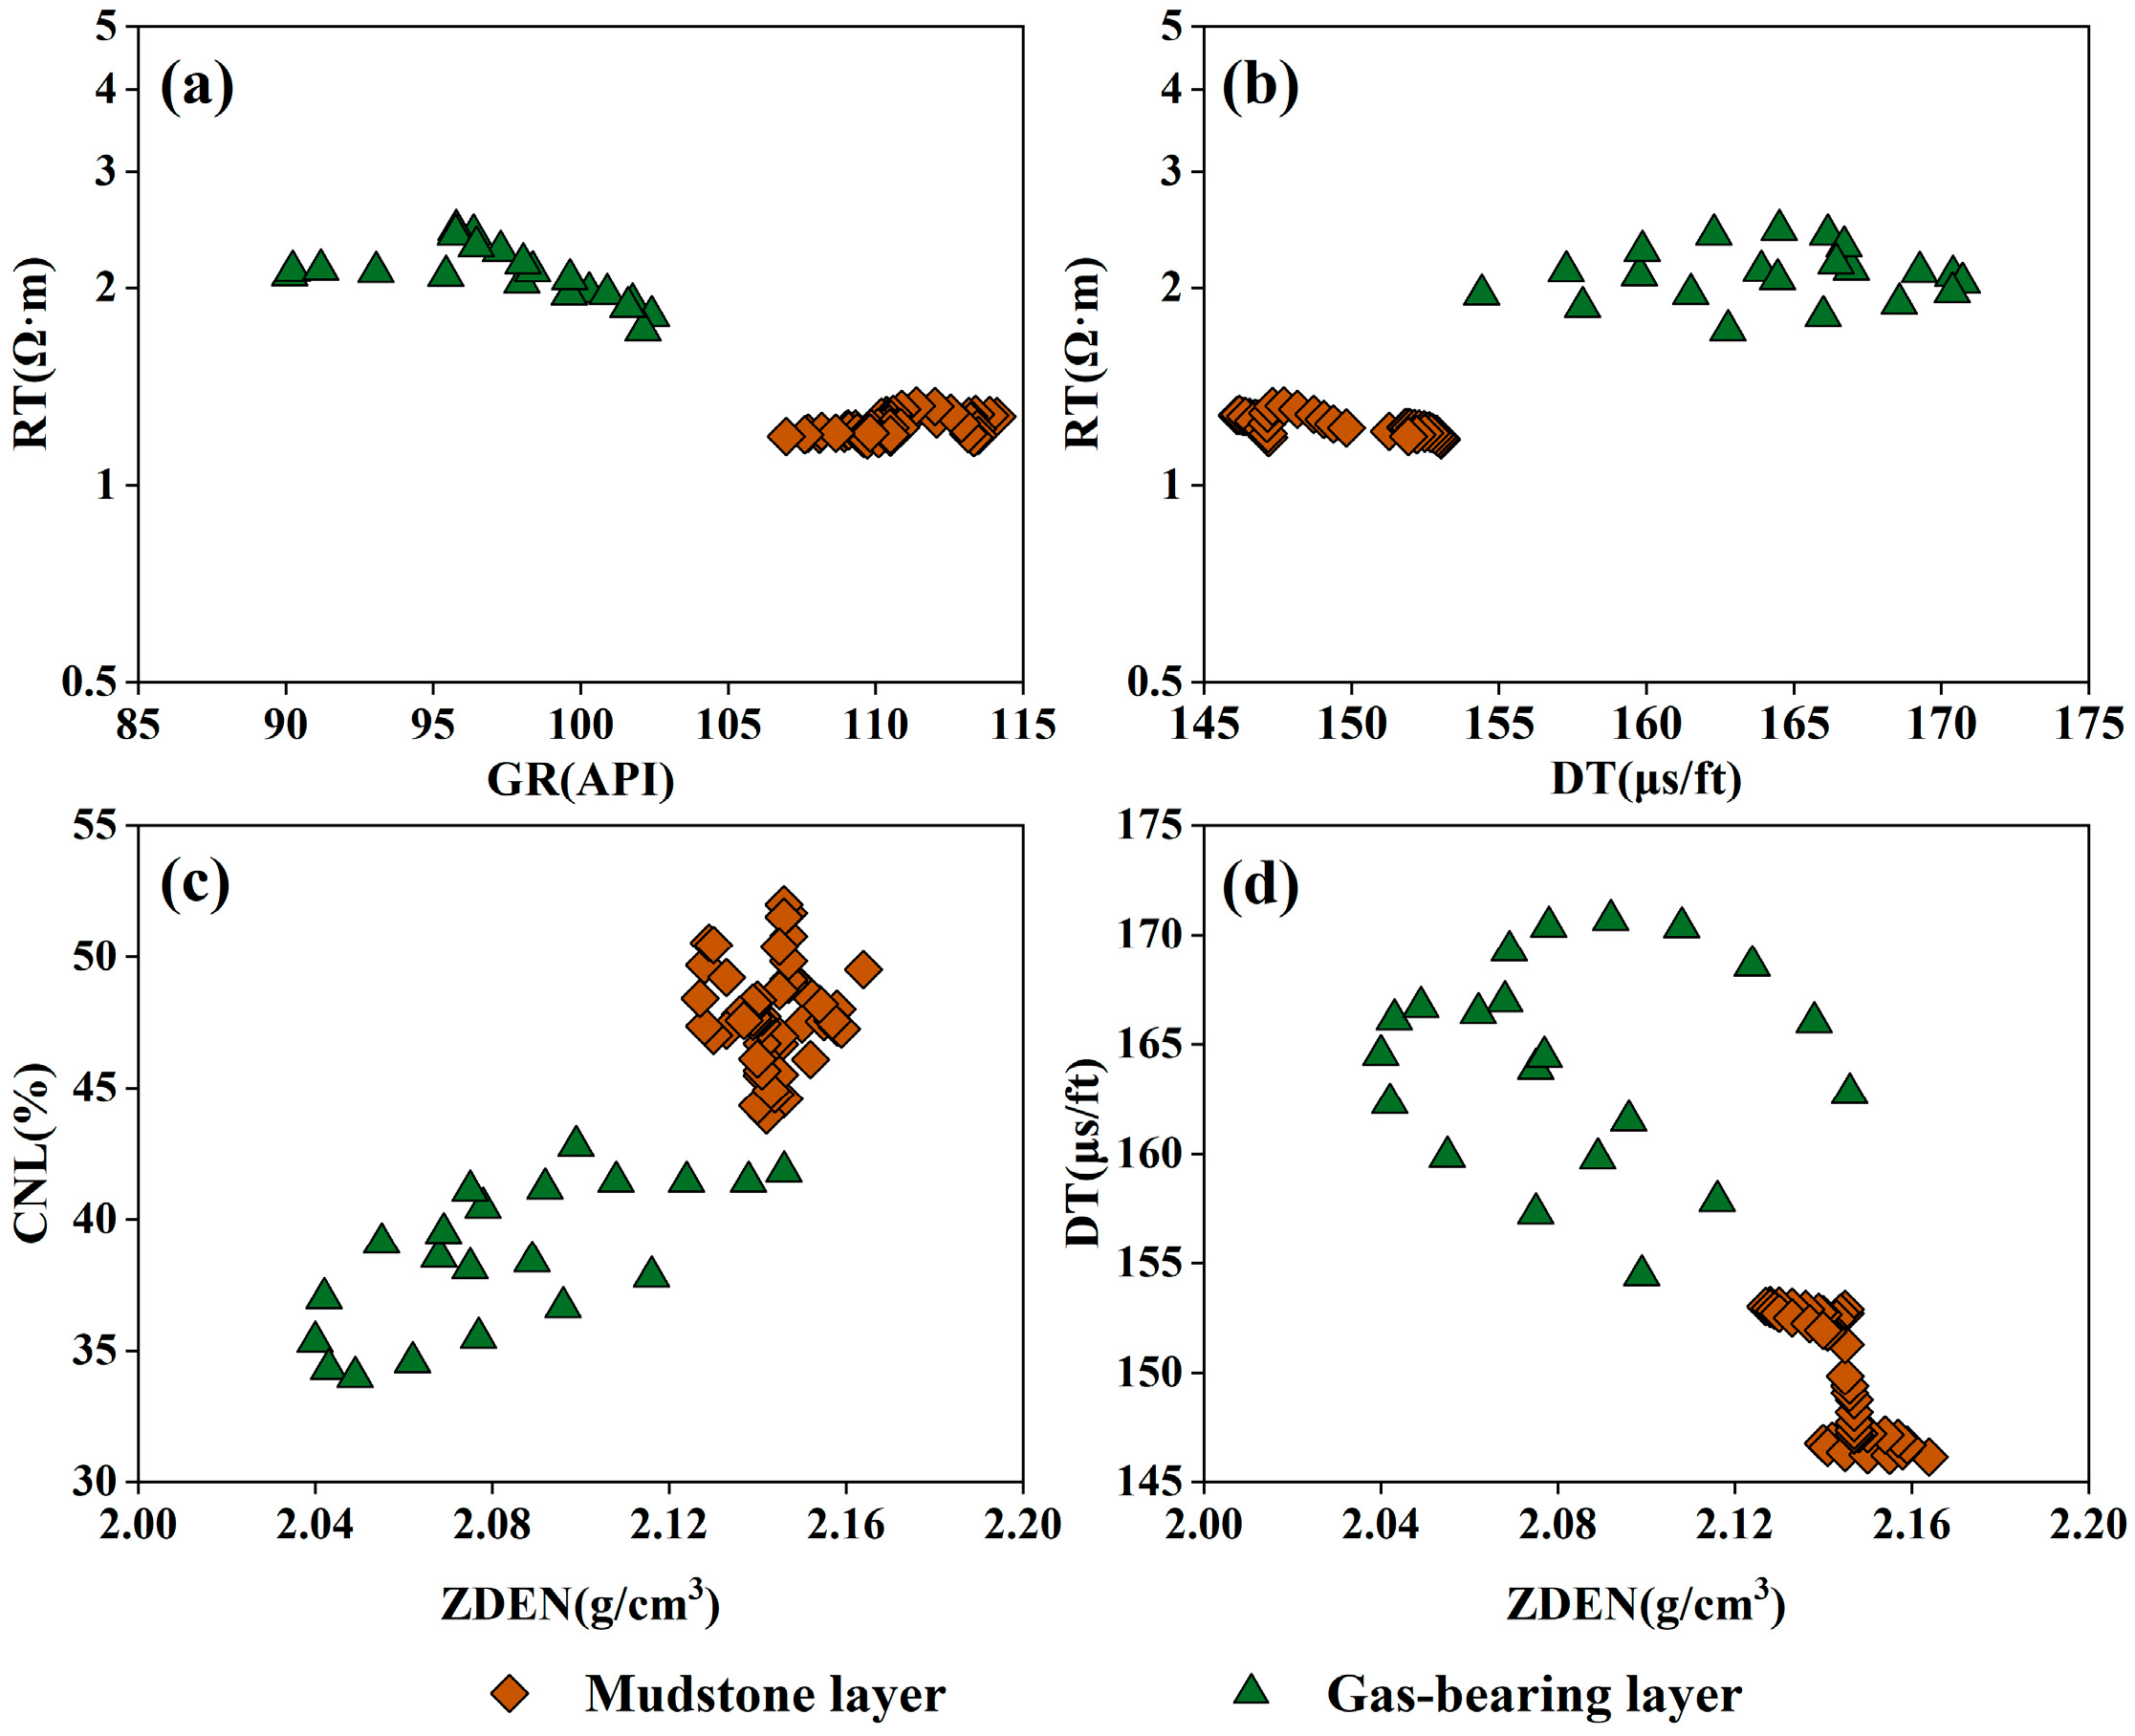
Layers II and III are typical gas layers and their conventional logging curves are clearly characterized in Figure 4. The natural gamma ray values decrease (the second channel), the resistivities increase and exceed 2 Ω·m, and the amplitude difference between the deep and shallow resistivity logs is obvious (the third channel). The three porosity logging curves exhibit distinct characteristics, which are characterized by an obvious increase in the acoustic interval transit time and a clear crossover between the density and neutron curves (the fourth channel). The measured compressional velocity is lower than that in the water-saturated simulation (the sixth channel), while the shear velocity remains almost constant (the seventh channel). Additionally, the increase in the total gas content (TG), which predominantly consists of methane (C1) (the fifth channel), indicates that these layers are gas-bearing reservoirs. In general, gas-bearing reservoirs have a higher resistivity (RT), total gas content (TG), and acoustic interval transit time (DT) values than the non-reservoir intervals (mudstone layer), and lower gamma ray (GR), compensated density (ZDEN), and compensated neutron (CNL) values (Figure 5).

4.2. The Identification Results of the Gas Reservoirs

Accurate reservoir identification is essential for effective evaluations of saturation. Compared to gas-free sediments, the compressional velocity of gas-bearing sediments is significantly lower [30]. Gas layers can be identified by overlaying the measured velocities, derived from the array acoustic logging data, with the baseline velocities. This model employs elastic wave velocities of simulated water-saturated formations as the baseline velocities (including compressional and shear velocities). The calculation of baseline velocities directly influences the identification of reservoirs. In gas-bearing reservoirs, the measured compressional velocity is significantly reduced compared to that for the water-saturated simulation, while the shear velocities remain essentially unchanged or decrease slightly (Figure 6a). The assumption that the shear velocity remains constant is based on the concept that fluids in pore spaces possess only a bulk modulus and lack a shear modulus, suggesting that variations in fluid type may not significantly affect the shear velocity. However, in practice, an increased gas content within a formation can lead to higher estimated bulk densities in water-saturated simulations, which in turn decreases the estimated shear wave velocity. Therefore, in layers with a higher gas saturation, the shear velocities may exhibit some deviation. The results indicate that differences in the acoustic velocities can be a visual indication of gas layers. The identification of gas layers based on array acoustic logging data is accurate and aligns well with the resistivity response characteristics (Figure 6b). In these identified reservoirs, the features of the neutron and density logging curves intersecting in the envelope area are also pronounced. Additionally, the increase in the total gas content (TG) exhibits a distinct anomaly, further validating the accuracy of the gas layer identification.

4.3. Evaluation Results of the Saturation

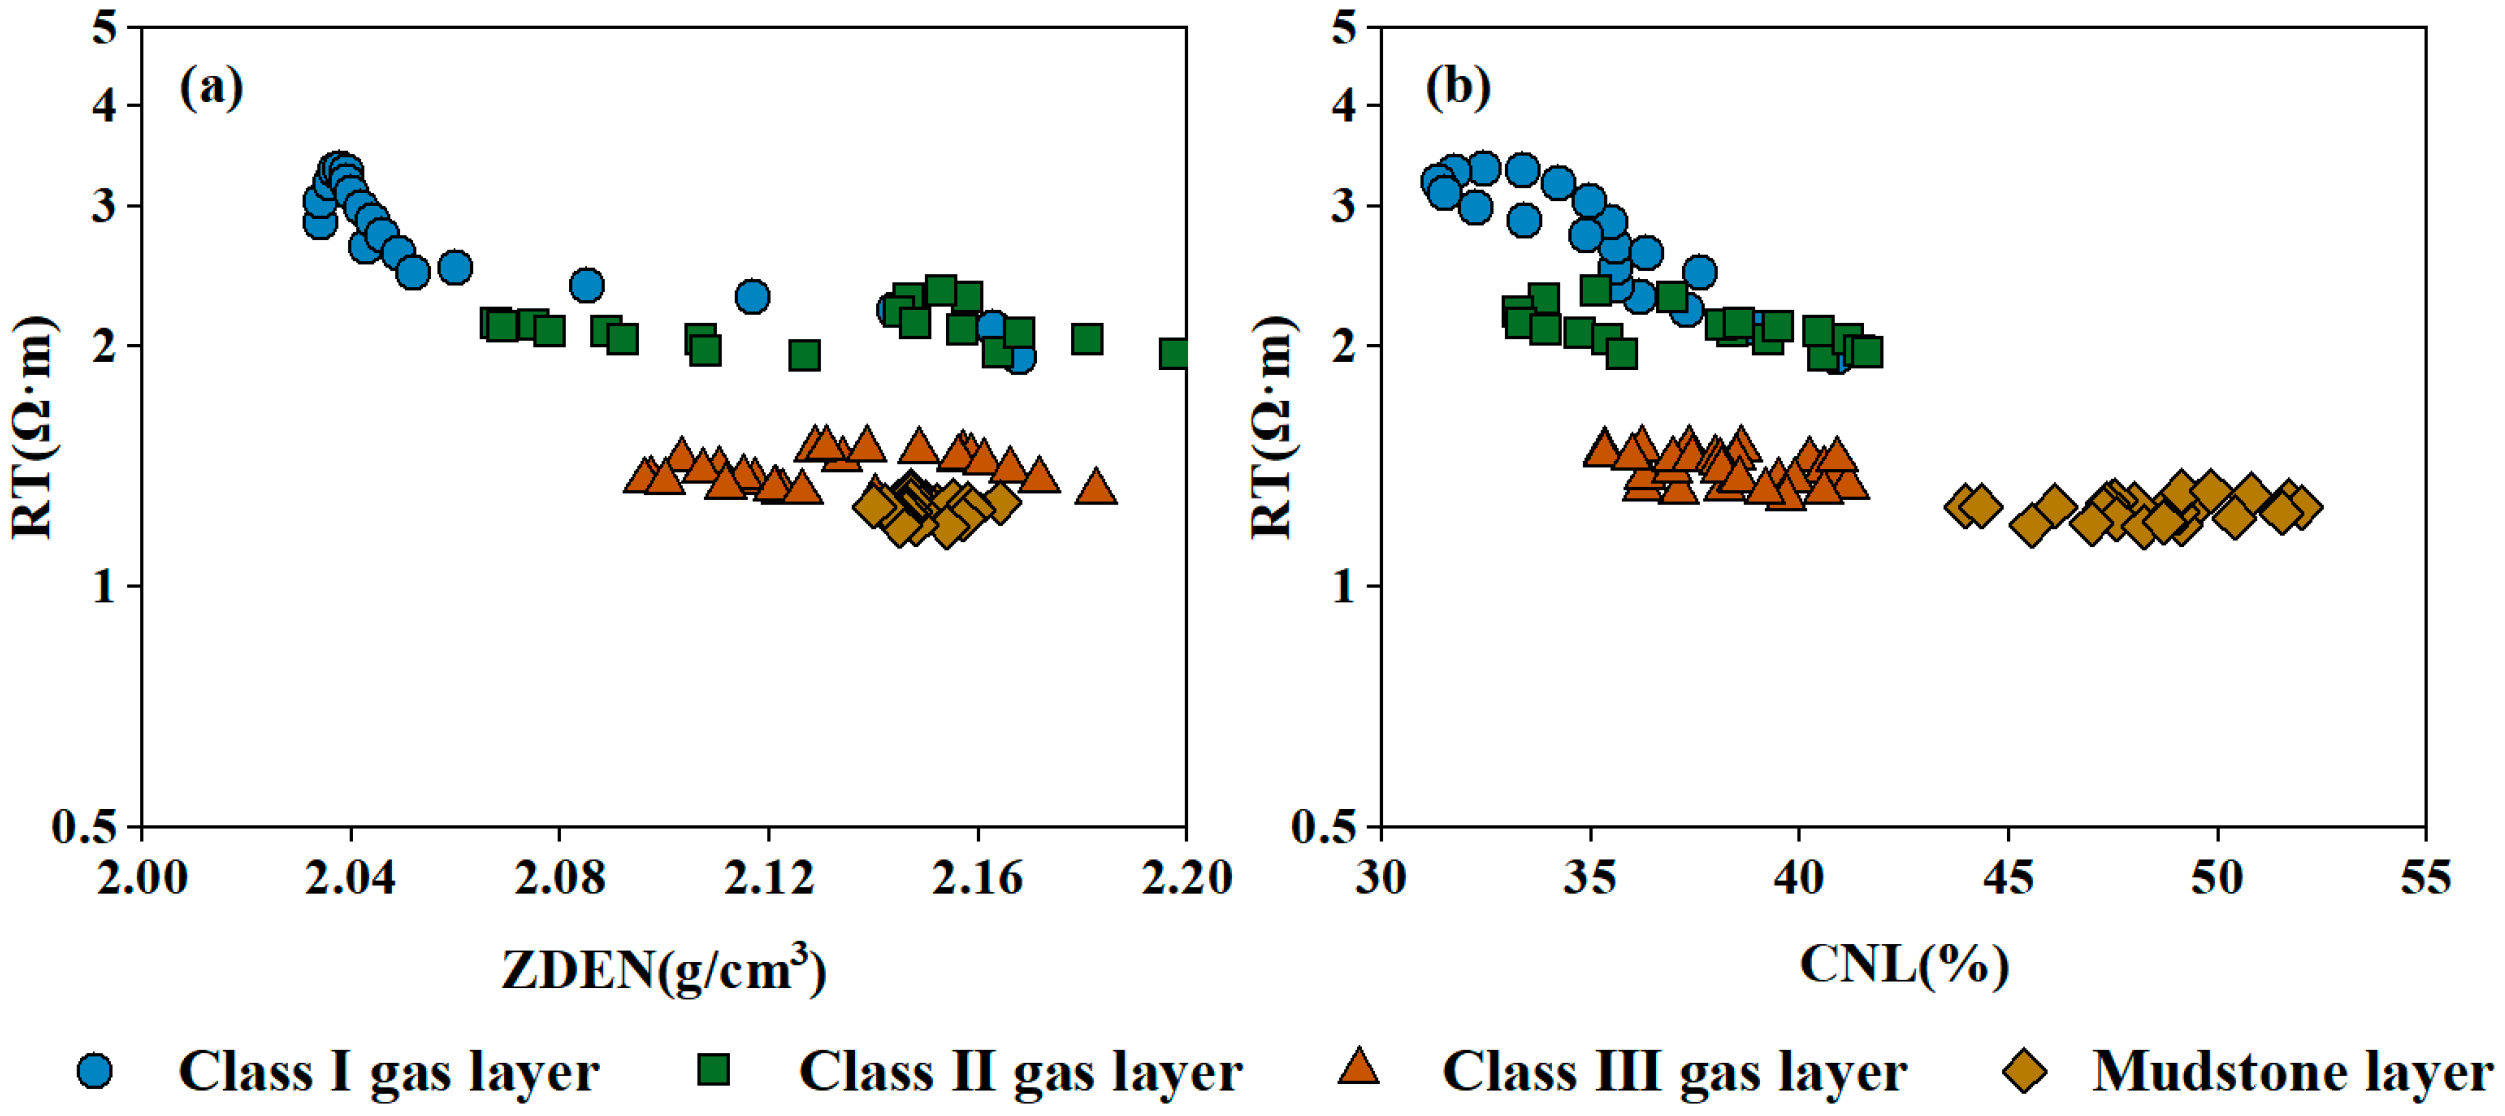
According to the log response characteristics, the gas layers can be classified into three types in this study (Table 4). A comparison of logging data across the different layers is shown in Figure 7. The gas layers in Class I have a resistivity higher than 2 Ω·m. The response of neutron and density logs is obviously reduced, showing a clear intersection characteristic (marked by the yellow filling in the figure). The Class II gas layers also exhibit a resistivity higher than 2 Ω·m, but the decrease in the neutron and density logs is less pronounced than in the Class I gas layers, with a weak density–neutron crossover. The Class III gas layers have a resistivity ranging from 1.2 Ω·m to 2 Ω·m, which is higher than that of the mudstone layers, but the abnormal amplitude is lower than that of the other two types of gas layers.
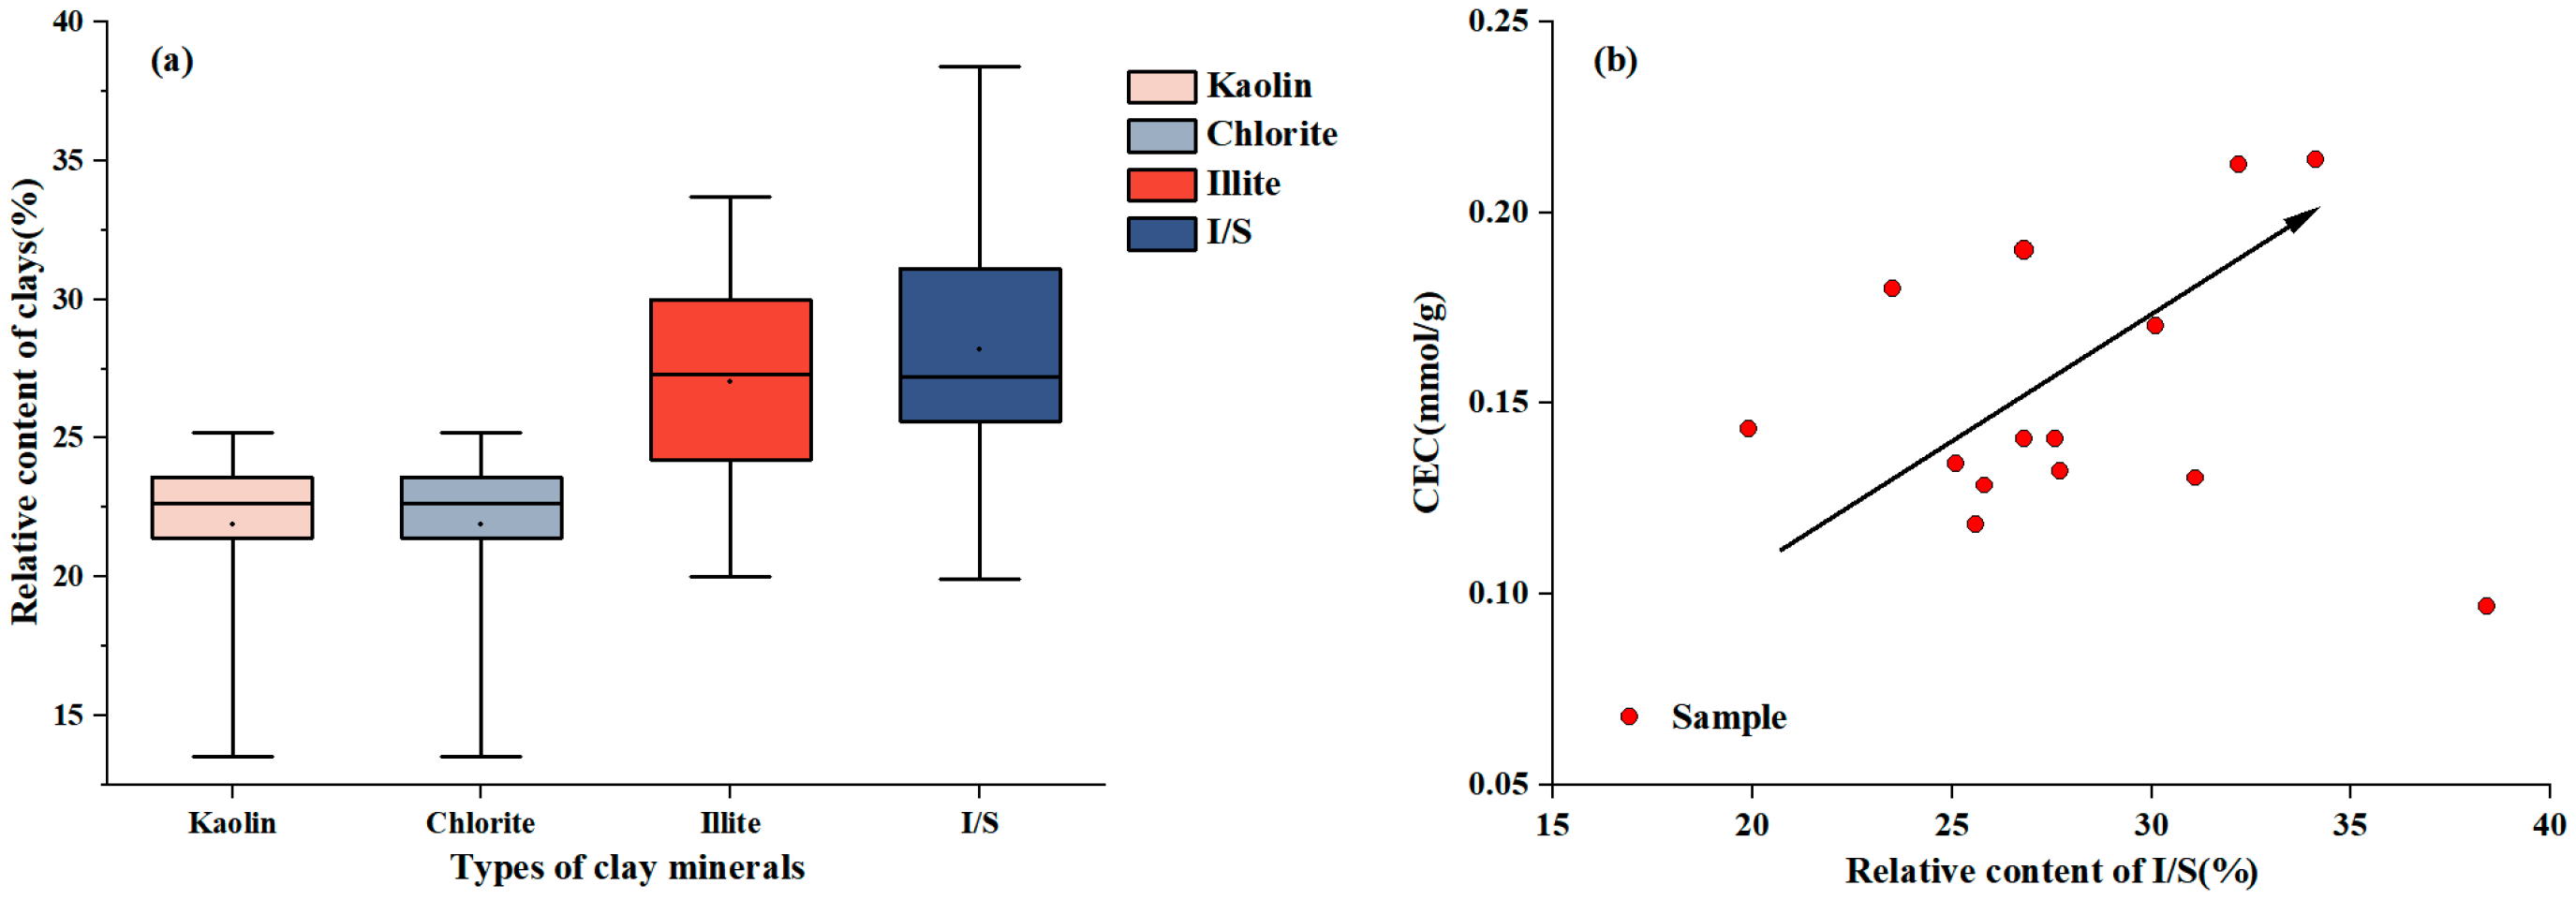
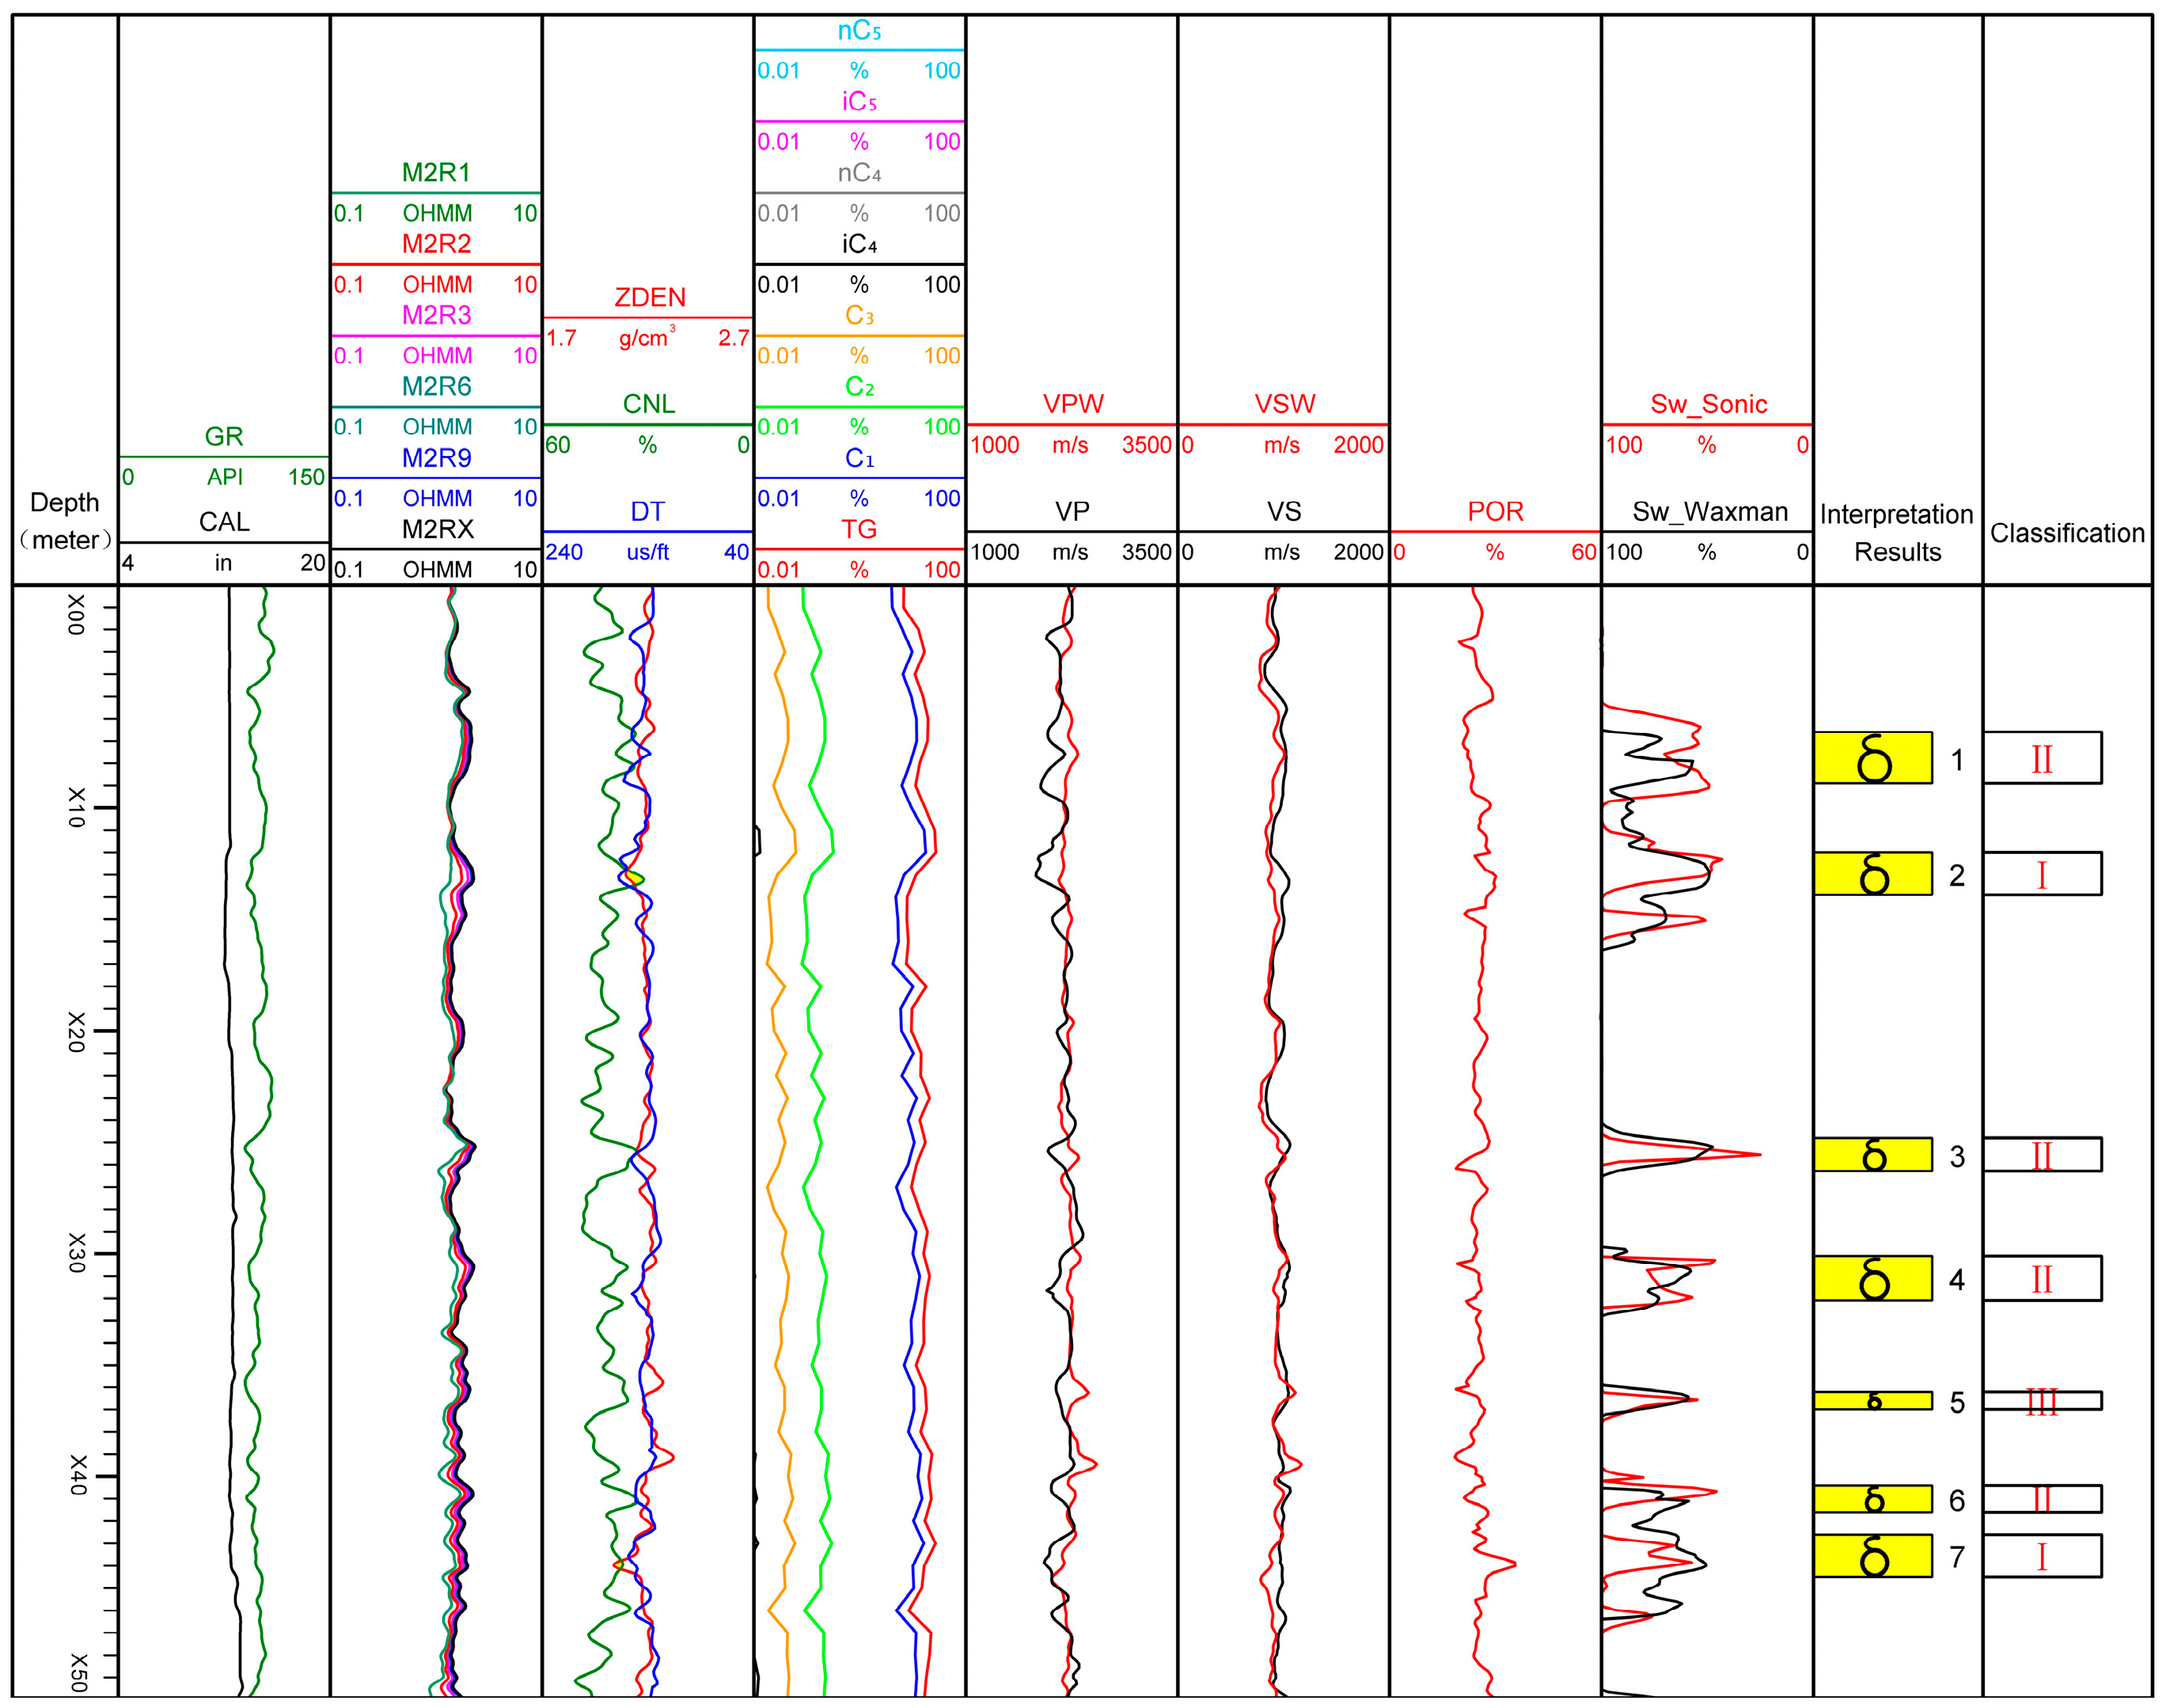
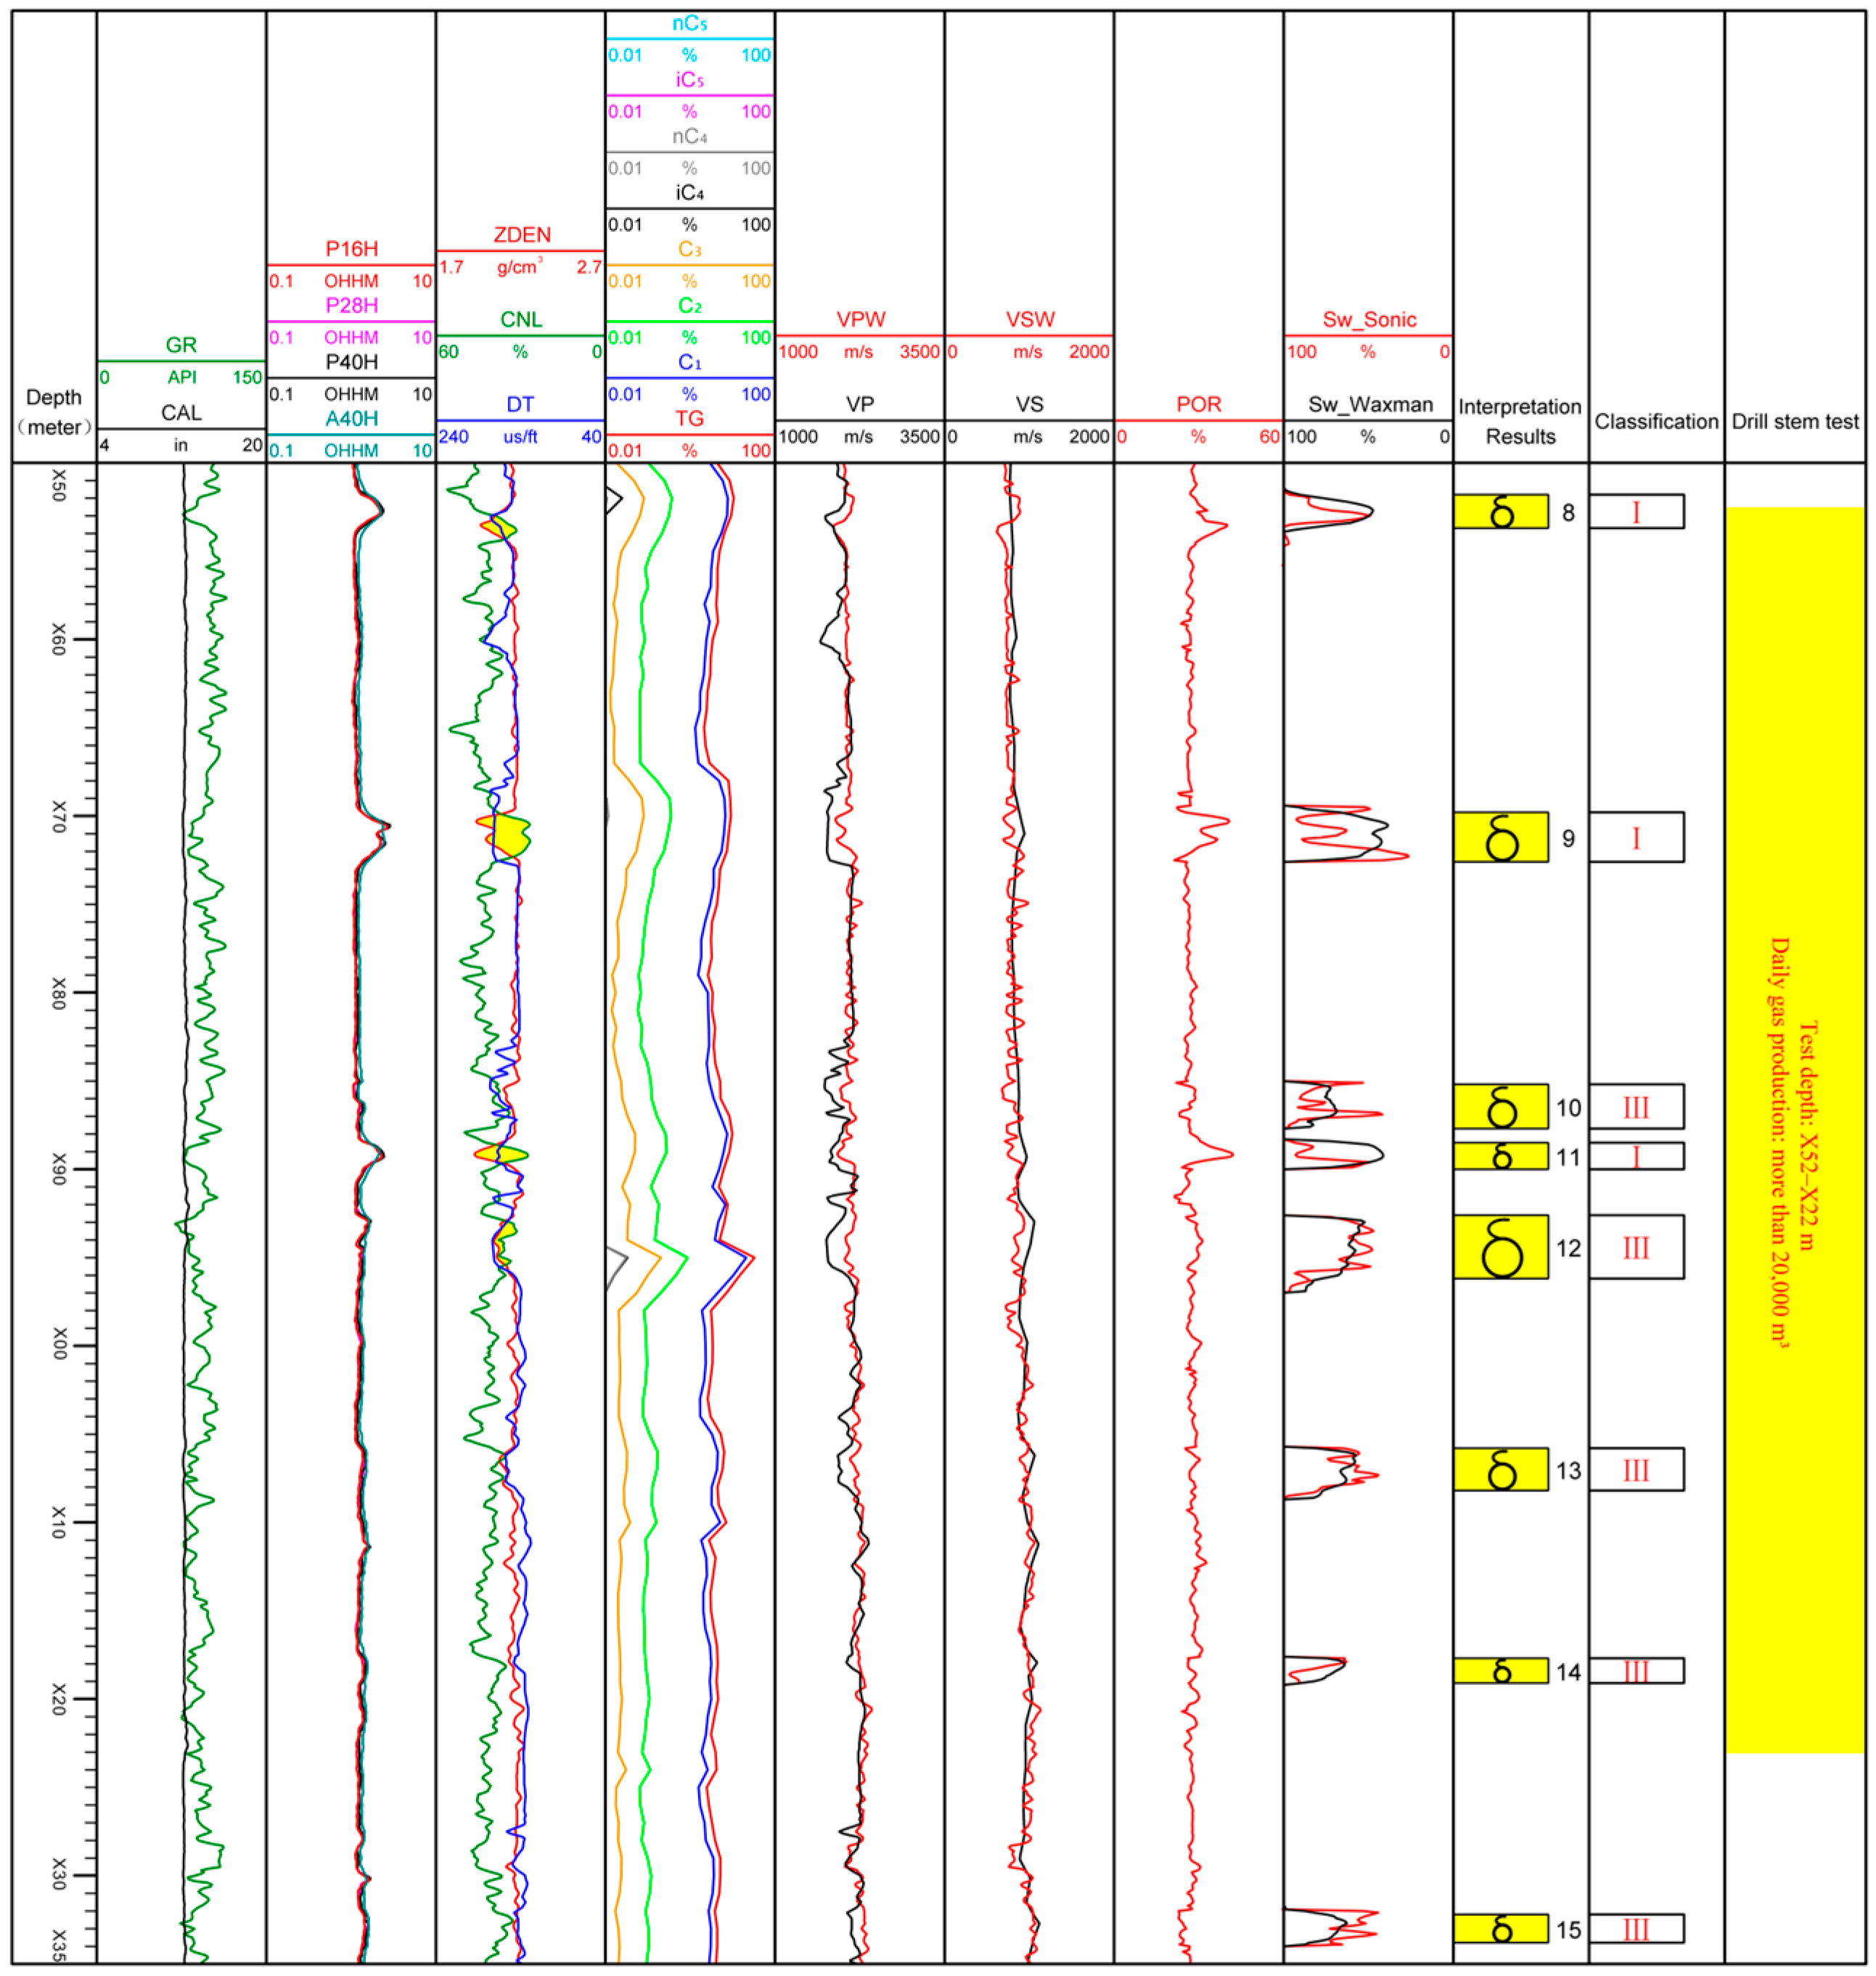
To validate the reliability of gas saturation prediction method proposed in this study, the acoustic logging data collected from two test wells are used to calculate the gas saturation. The evaluation results are compared with those interpreted from the resistivity logs. Since there is a high content of illite-smectite (I/S) mixed layers in the clay minerals of the Yuehai and Hanjiang formations (Figure 8a), the cation exchange capacity (CEC) is greatly increased (Figure 8b). Therefore, the Waxman–Smits model is used to determine the referenced gas saturations from the resistivity in this study. The evaluation results derived from the acoustic and resistivity logs for Well A-1 and Well A-2 are shown in Figure 9 and Figure 10, respectively. (In the figures, Sw_Sonic represents the water saturation derived from the modified method presented in this study, and Sw_Waxman represents the water saturation computed using the Waxman–Smits model.) The eighth channel displays the updated porosity based on the gas saturation. The types of gas layer are given in the eleventh channel.
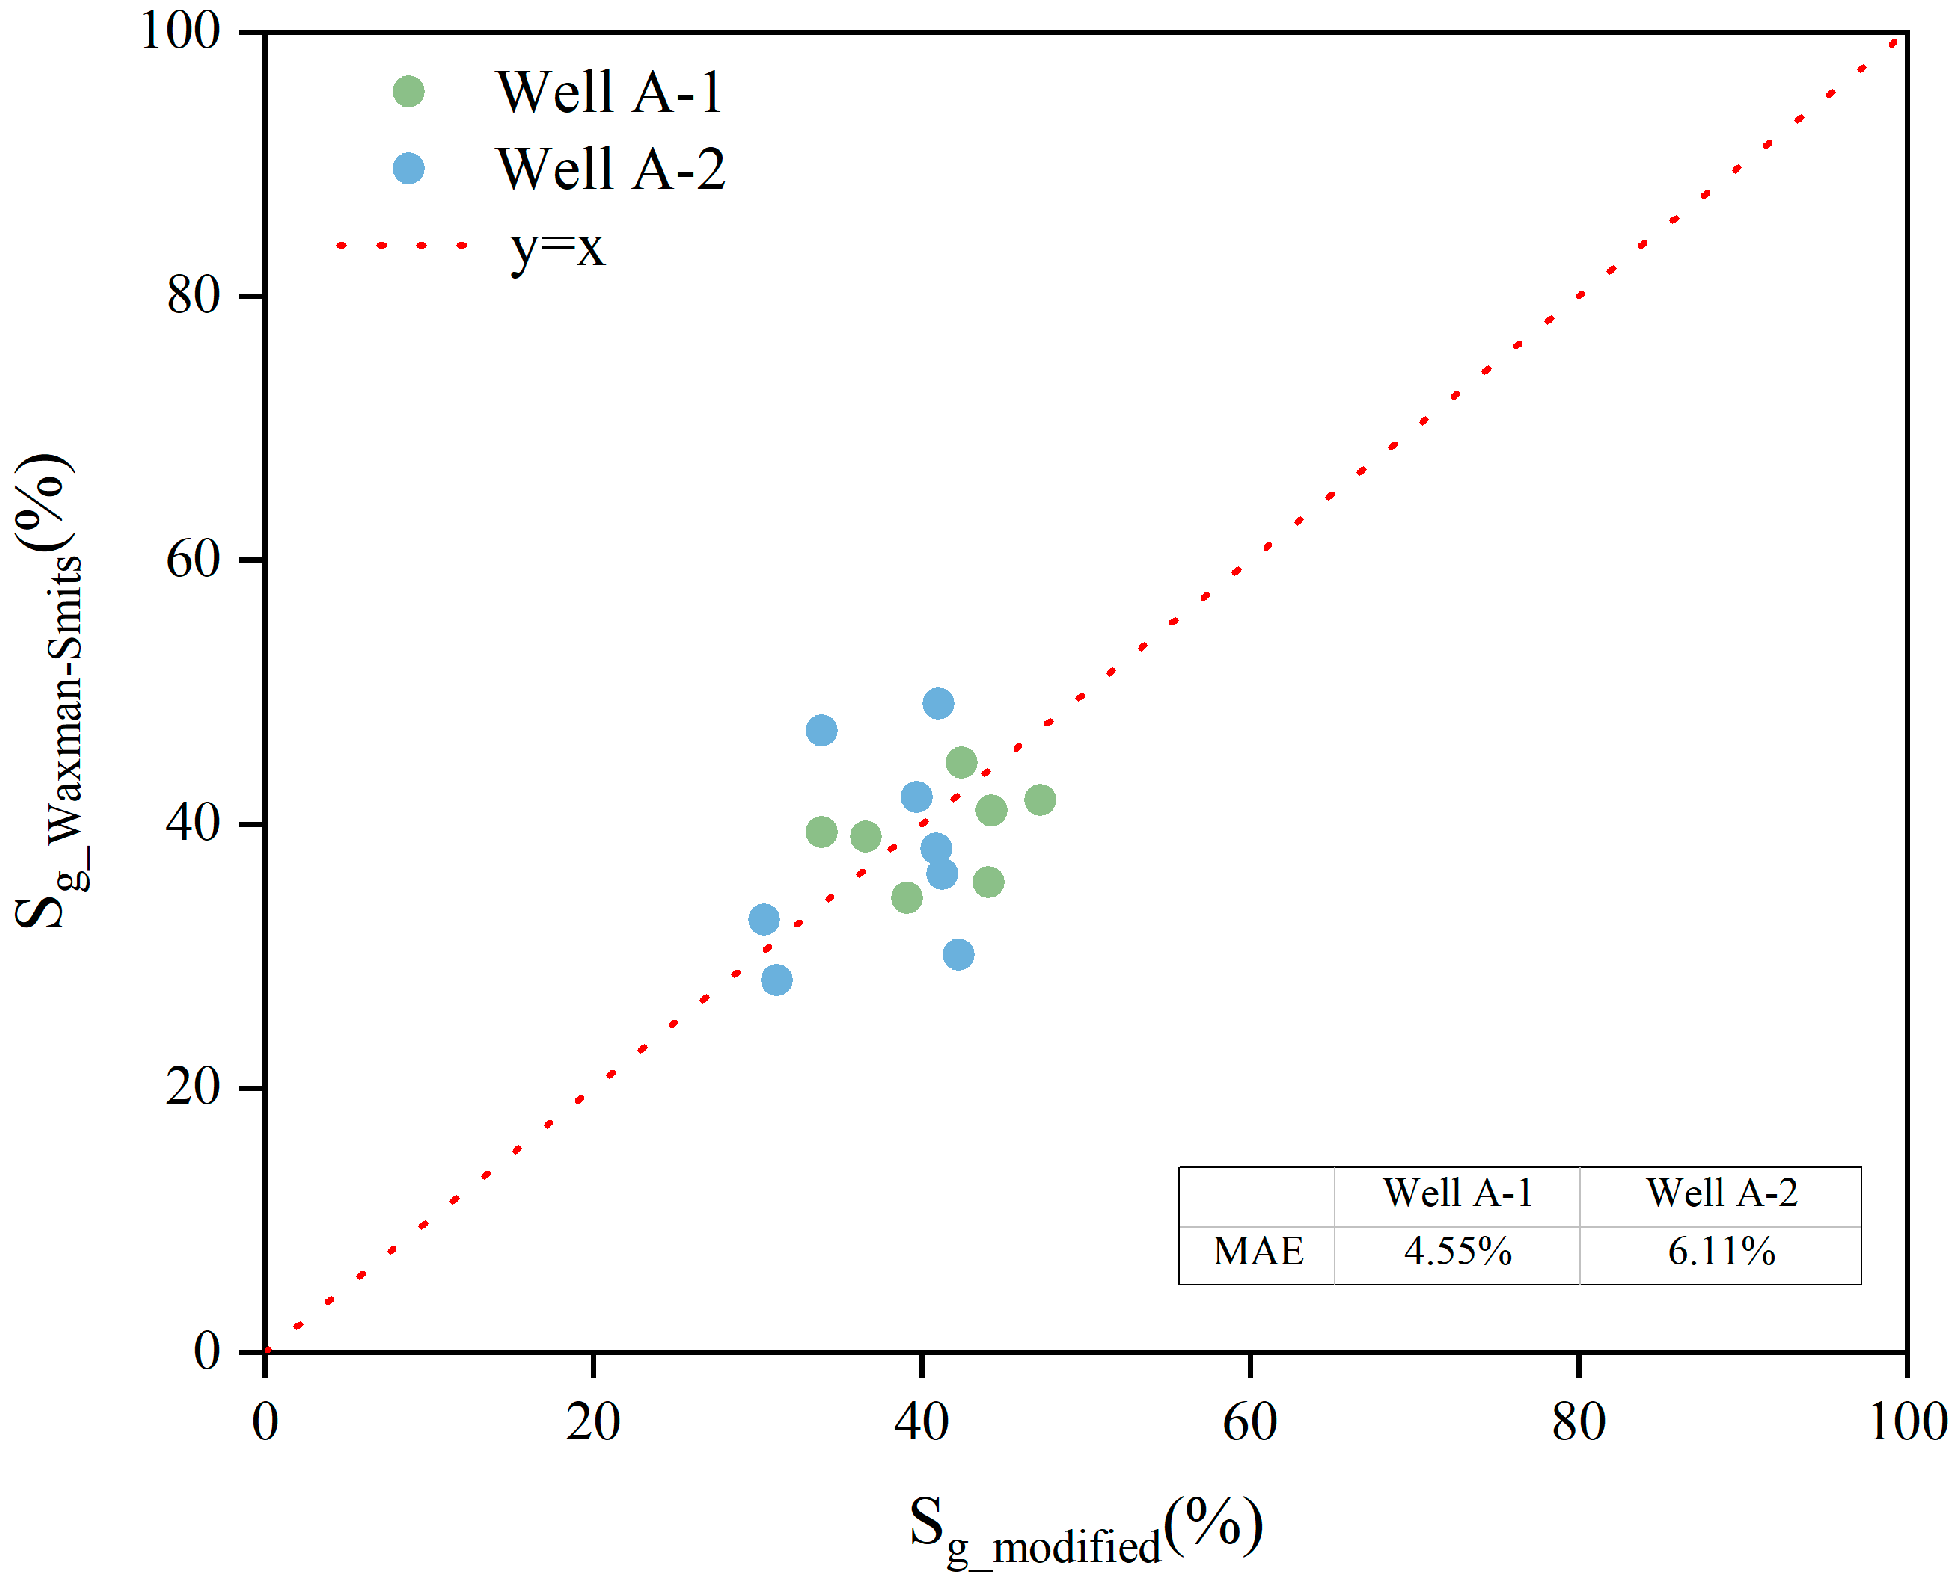
The average porosity of the A-1 Well is 25.34%. As shown in the figure, the resistivity response of the gas-bearing reservoirs at depths between X00 m and X50 m is more pronounced, with most identified as Class II gas layers (resistivity values higher than 2 Ω·m) (Figure 9). The water saturation predicted from the acoustic velocities matches well with those calculated from the resistivity logs, demonstrating a degree of comparability (Figure 9 and Figure 11). A total of seven gas layers were identified in this section of the A-1 Well. The gas saturation predicted using the acoustic velocities ranged from 33.92% to 47.20%, which represents an average improvement of 1.66% compared to the resistivity-based calculation. The mean absolute error (MSE) between the two methods is 4.55%. Table 5 compares the gas saturation obtained using the two different methods.
Compared to the A-1 Well, the A-2 Well features more developed Class III gas layers, with fewer Class I layers present. The average porosity of the A-2 Well is 27.76%. It is evident that the discrepancies in the gas saturation between the two methods are higher for the Class I gas layers in the X50–X35 m interval of the A-2 Well (Figure 10). For instance, in layers 9 and 10, with high resistivity and obvious intersection characteristics of neutron and density logging curves, the prediction from the acoustic velocities is lower than that from the resistivity. As Figure 11 illustrates, there is a distinct deviation from the reference line (y = x). This discrepancy may have occurred because the array acoustic logging data was significantly affected by the gas in the formation. In contrast, compared to the evaluation results using the Waxman–Smits model, the gas saturations derived from the array acoustic logging data are improved for the Class III gas layers (such as layers 10, 12, 13, 14, and 15), with an average increase of 4.12%. The results of the DST in the A-2 Well, which were acquired from the X52–X22 m interval, indicated that over 20,000 m3 of gas was produced per day, which is a zone of high productivity of shallow gas and is consistent with the calculated results.

5. Discussion

5.1. The Validity of the Model

Based on established rock physics models, the acoustic velocities of shallow unconsolidated formations are simulated. Subsequently, the gas saturation is predicted from the array acoustic log data through an iterative updating relationship between the porosity and saturation. Two key aspects confirm the effectiveness of the model: identification of gas layers and quantitative estimation of saturation.
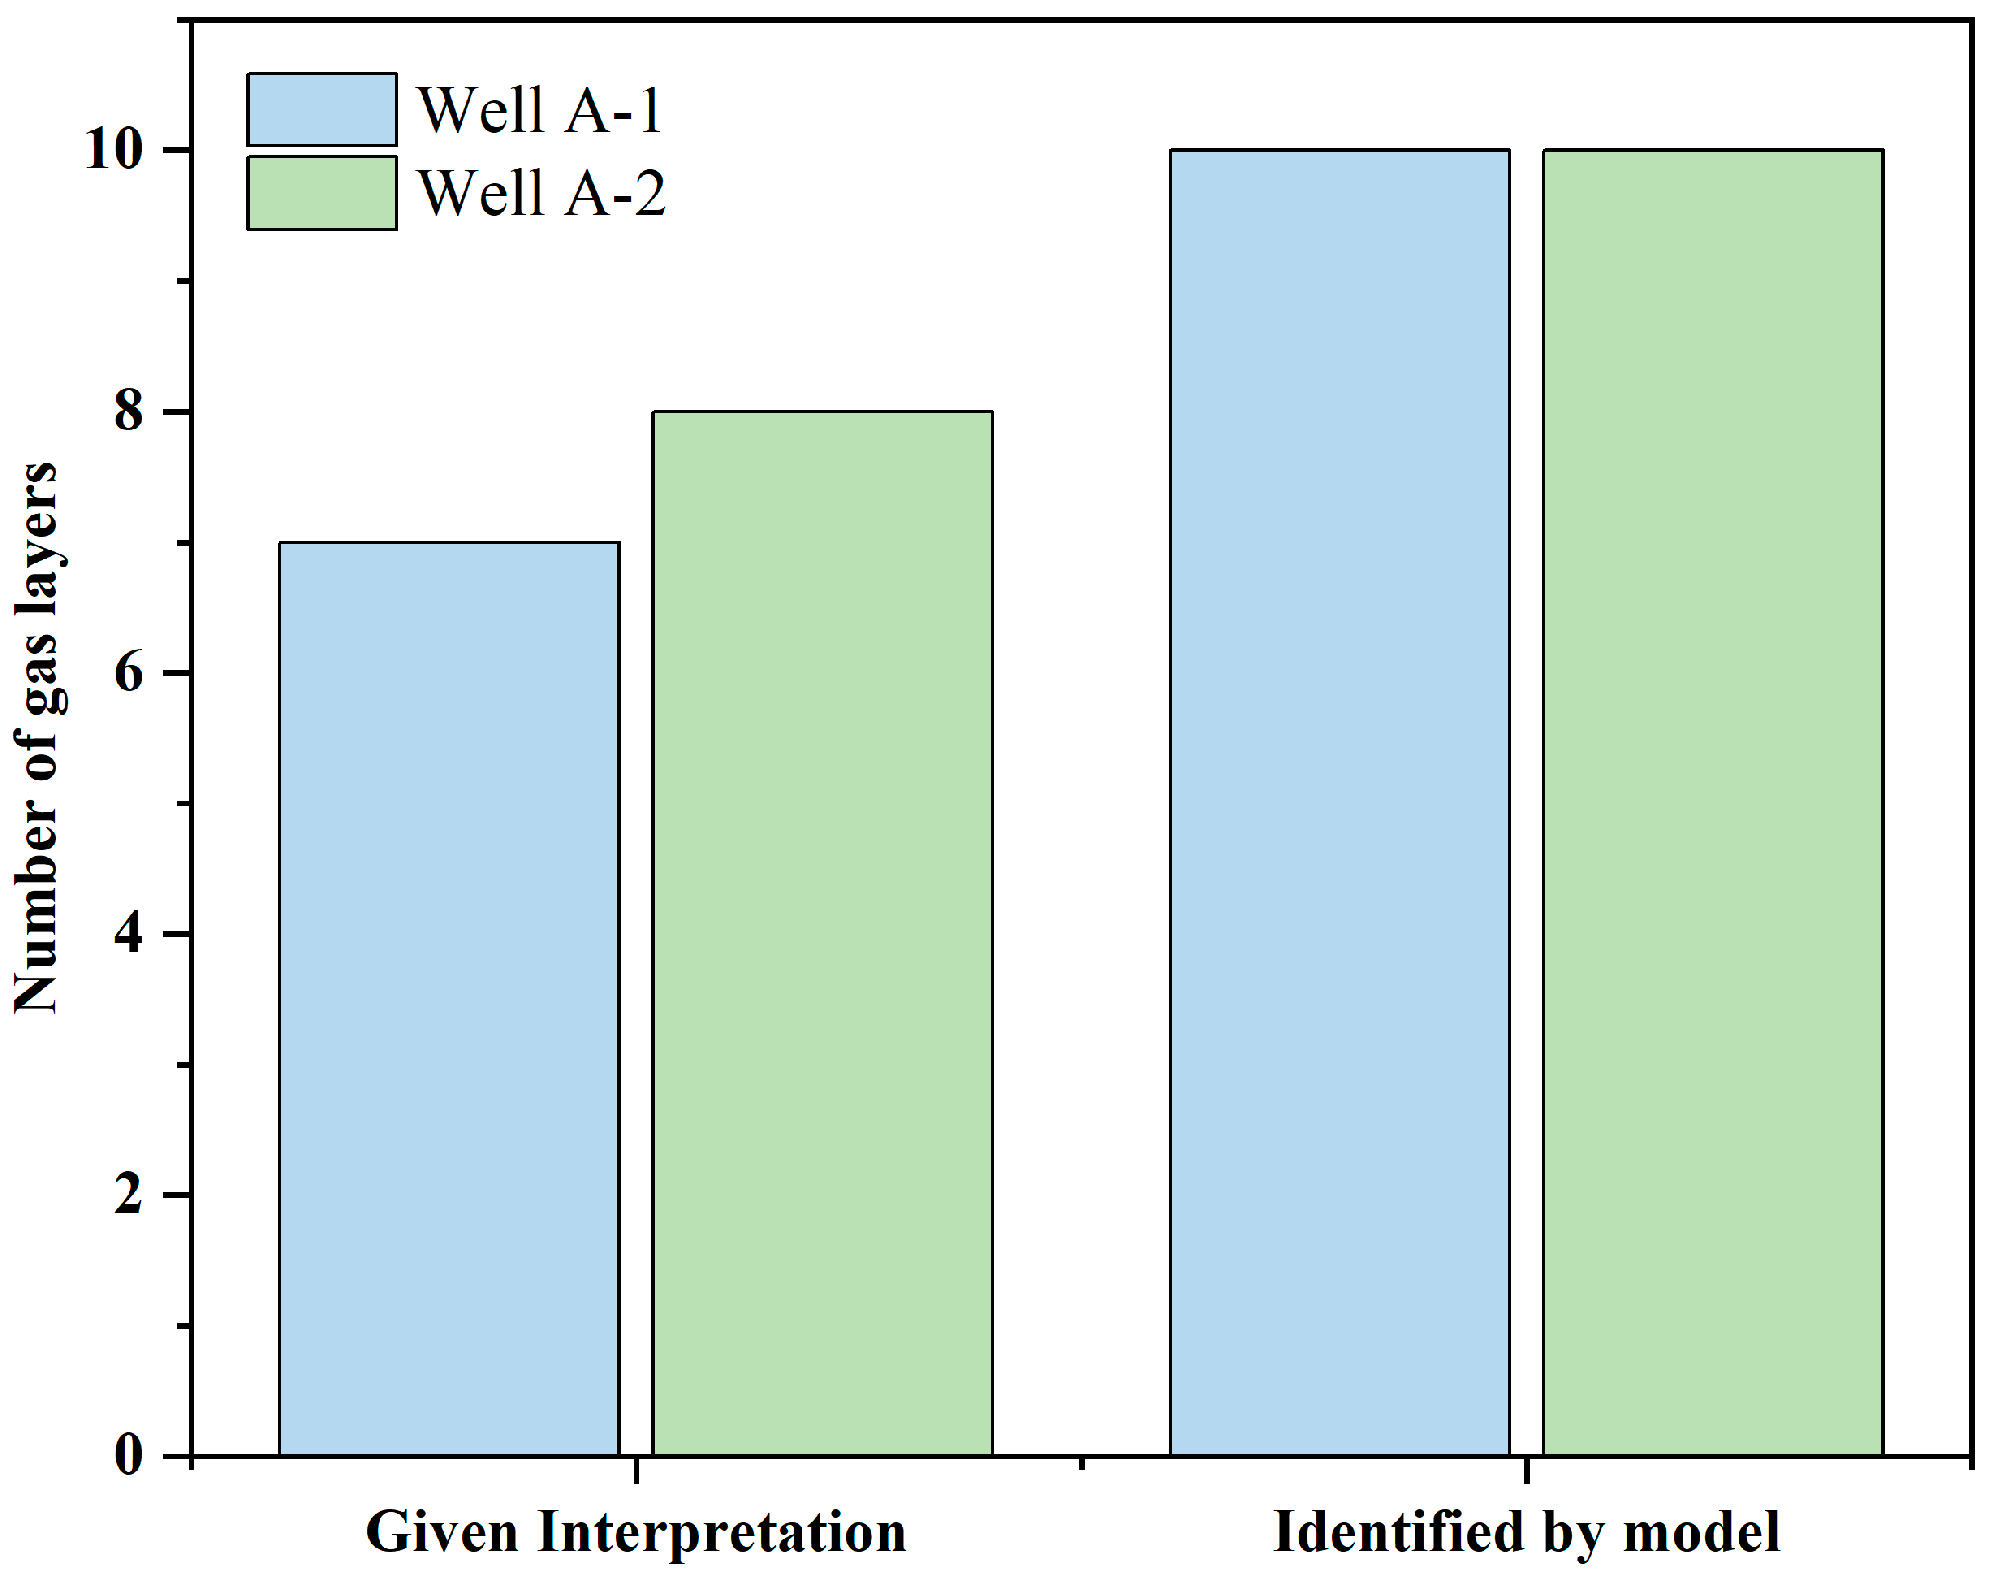
When a formation is gas-free, the measured compressional and shear velocities essentially coincide with the velocities simulated with water-saturated. In contrast, for the gas-bearing reservoirs, the measured compressional velocities are significantly lower than those for the water-saturated simulations, while the shear velocities are largely unaffected by the pore fluids, remaining consistent with the water-saturated simulations or only decreasing slightly. Through a statistical analysis of the gas layer identification results from the 15 layers across the two wells, the model demonstrates a high identification accuracy (Figure 12). While misidentifications occurred in some non-reservoir sections due to variations in the acoustic velocity, the precision of gas layer identification exceeds 70%. The gas layers identified by the acoustic velocities not only exhibit a clear response characteristic of resistivity, but also have significant anomalies in their mud logging (Figure 4, Figure 6, Figure 9, and Figure 10). The consistency between the response characteristics and the anomalies of TG observed from the mud logging results validates the accuracy of the gas layer identification. Relying on the accurate identification of gas layers, the gas saturation is quantitatively evaluated using an iterative procedure. The saturation values derived from the array acoustic logging data show good comparability with the resistivity-based values, with a mean absolute error of less than 6%. Additionally, these results also align well with the DST data. The evaluation results based on the array acoustic logs are improved for the Class II and Class III layers (Table 5), leading to a more accurate saturation evaluation of low-resistivity gas layers. This further validates the model’s accuracy and effectiveness for quantitatively assessing saturation.
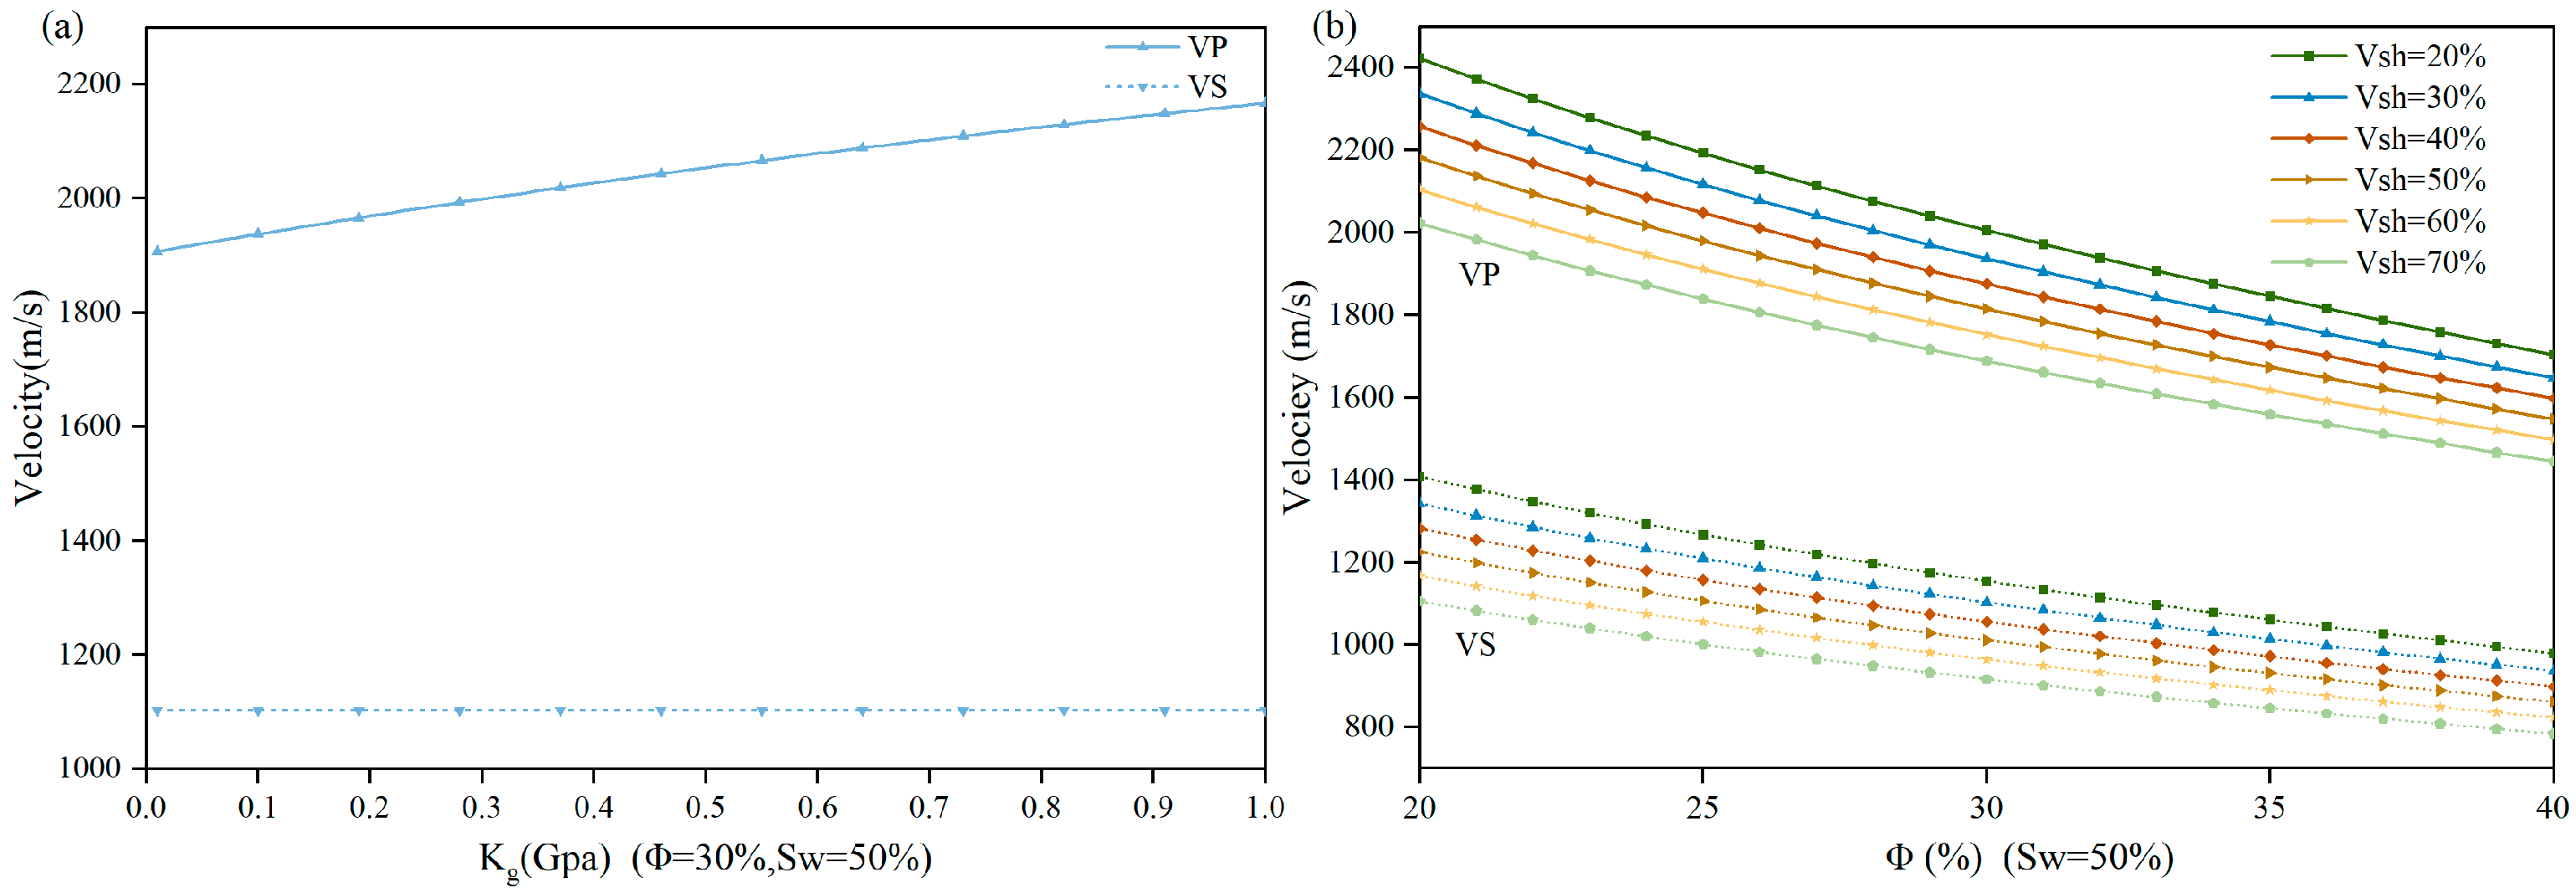
The elastic modulus of saturated sediments and mixed fluids are key parameters for simulating velocities using rock physics models. Calculating the bulk modulus of mixed fluids requires consideration of varying distributions of pore fluids. This study considers two different fluids: water and gas. They may exhibit two different distribution forms—uniform or patchy—in pores. Different calculation methods can lead to different effects on the model’s applicability [77]. The Wood equation presumes fluids are uniformly distributed in pores [78,79]. However, this equilibrium distribution assumed by the Wood equation might be interrupted during drilling or production, and the restoration of equilibrium may take longer than that encountered during logging [67]. Therefore, it is rational to infer that fluids in pores may exhibit a non-uniform distribution [80]. For the non-uniform distribution of fluids, Hill’s theory is typically employed to calculate the effective bulk modulus of sediments [69,81].
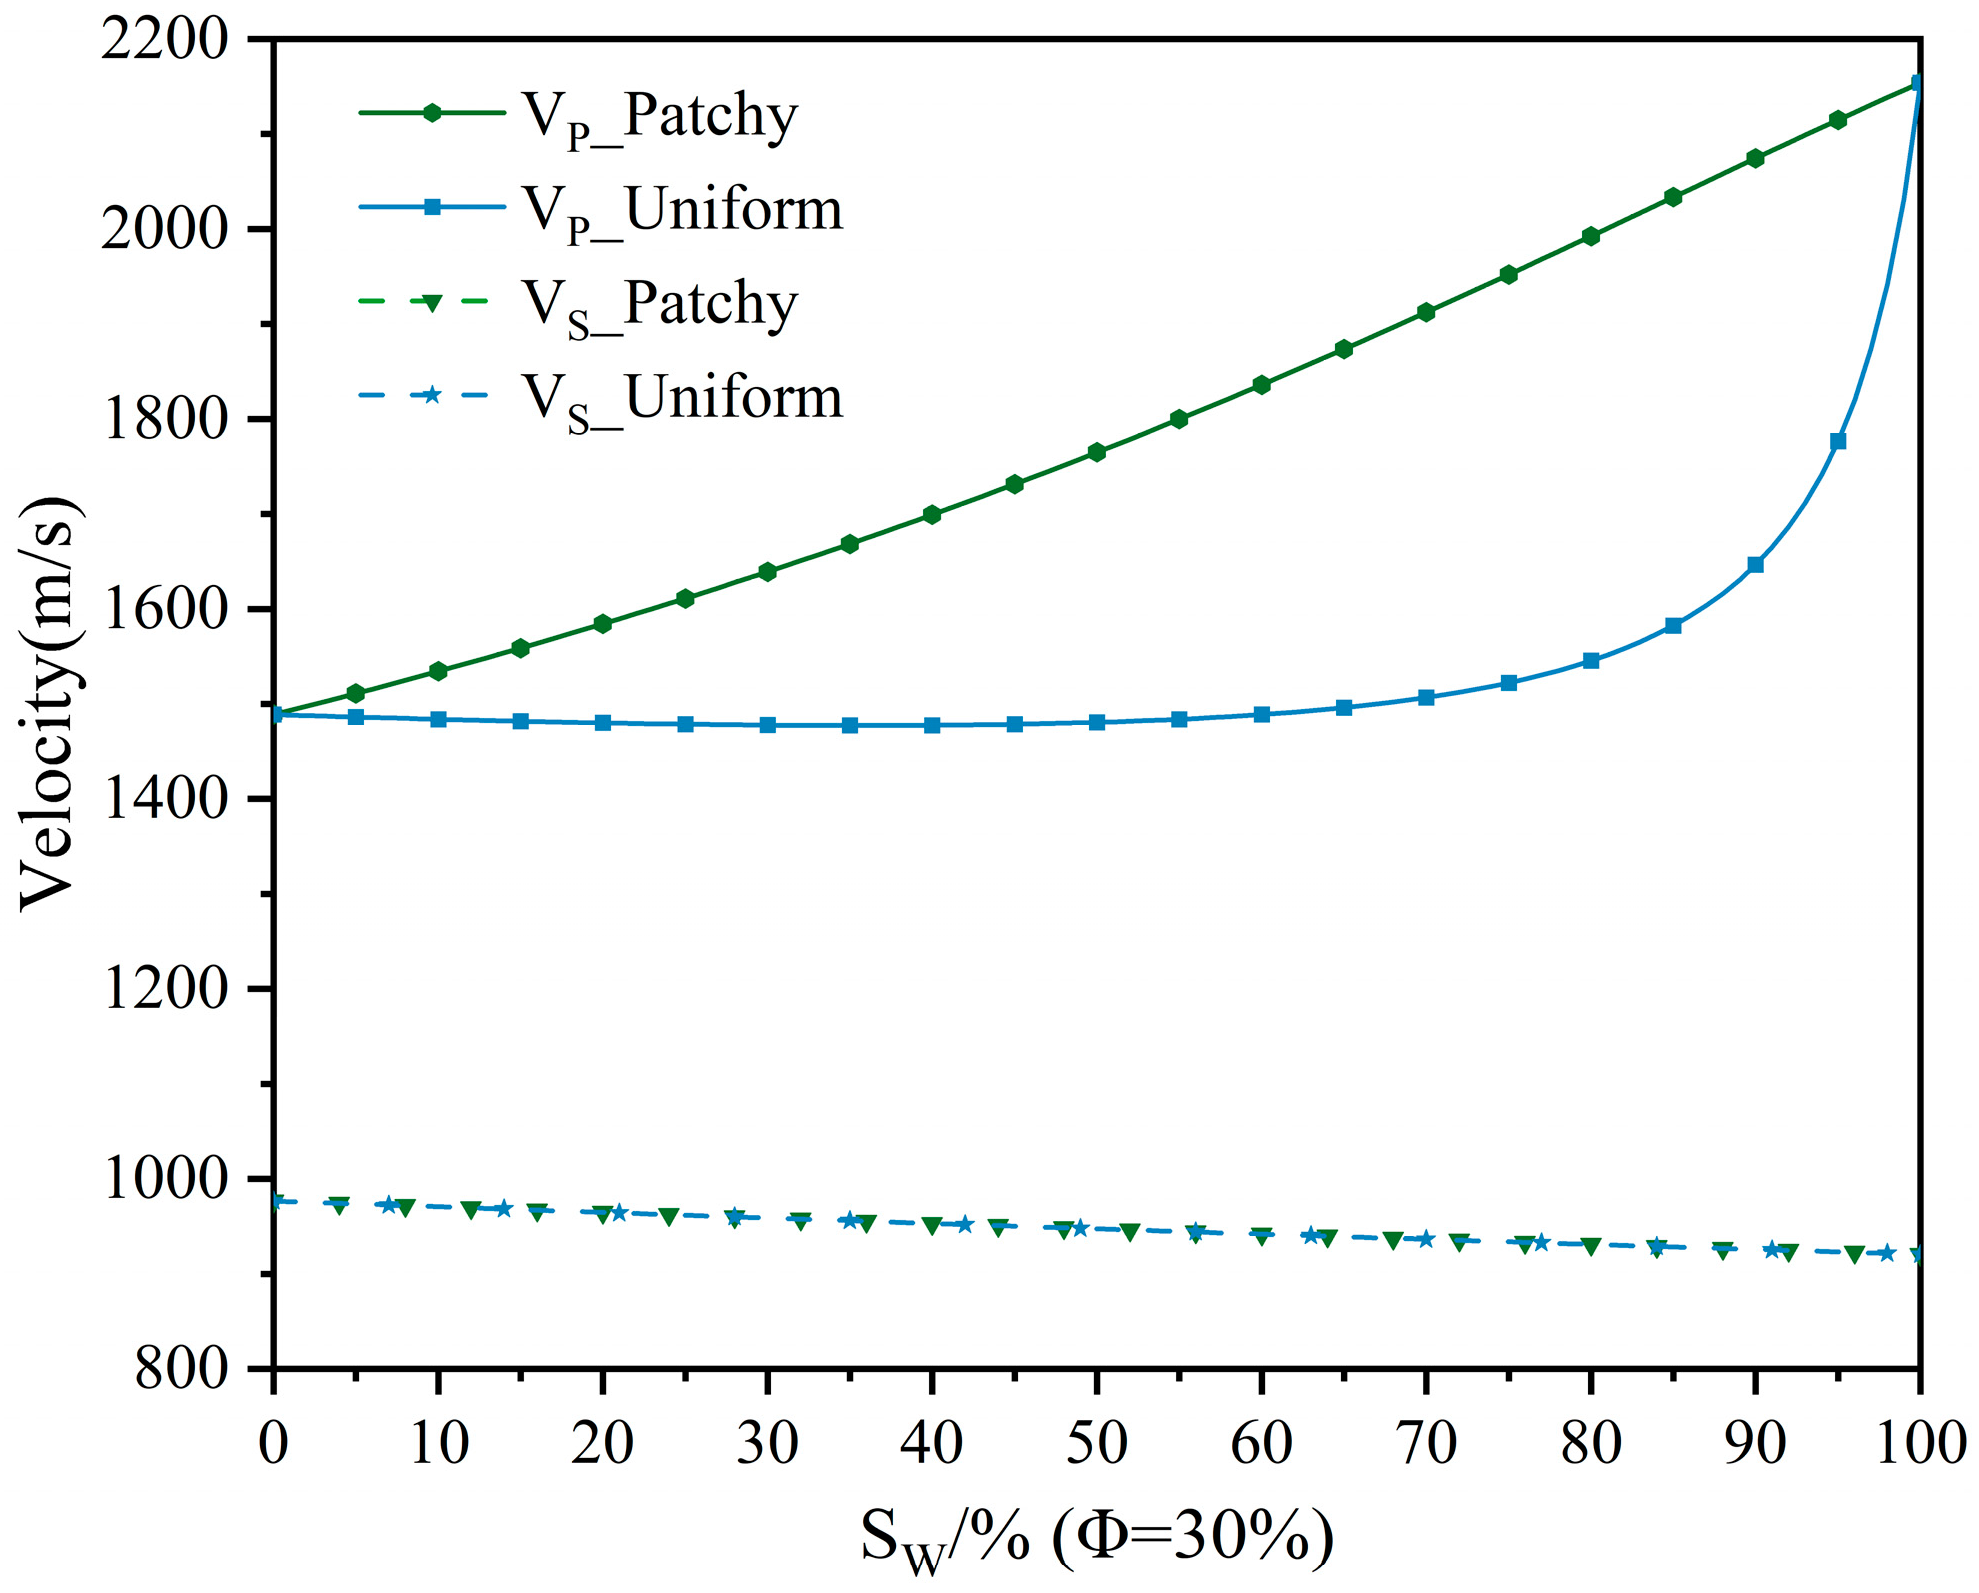
The acoustic wave velocities for both the uniform and patchy distributions are simulated. In the gas-water-saturated reservoirs, the patchy distribution is more sensitive to changes in the water saturation. The predicted compressional velocity increases with rising water saturation and exhibits clear and nearly continuous changes in the whole saturation range (Figure 13). In contrast, significant velocity variations in homogeneous reservoirs occur only when the water saturation approaches 100% (Figure 13 and Figure 14) [70]. This discrepancy may be attributed to the lower bulk modulus of gas. For a uniform distribution, bulk modulus of mixed fluids will change significantly when the saturation reaches a critical value, affecting the simulation results. This critical value may depend on the bulk modulus of gas.
The results indicate that the gas saturation will be significantly underestimated if a uniform distribution is assumed. It is more accurate to compute the bulk modulus of saturated sediments and predict the gas saturation using the Gassmann-Hill model with patchy saturation. This also aligns with the hypothesis proposed by Smith et al. (2003) [67] that pore fluids may be heterogeneously distributed in pore spaces due to drilling disturbance. Additionally, CT scanning revealed internal stereo images of rock, confirming the presence of “gas-in-water” distribution within rocks with patchy saturation [82,83]. The research on shallow gas in the Ulleung Basin also determined a patchy distribution [12], further validating the accuracy of the patchy model. In summary, the model presented in this paper is validated for both the identification of gas layers and the quantitative evaluation of saturation, holding significant implications for reservoir evaluation in the unconsolidated formations of the study area.

5.2. Uncertainty Analysis of Gas Saturation Prediction

The accuracy of saturation estimation is primarily influenced by the quality of the logging data, the composition and percentage of minerals, the selection of the rock physics models and parameters, and the resolution of logging tools [38,39,84]. Acoustic logging exhibits a strong sensitivity to natural gas within pore spaces. However, the existence of gas may also cause anomalies in acoustic logging data, such as “cycle skips”, to occur, leading to unreliable measurements and inaccurate representations of the actual conditions of formations. For instance, significant discrepancies between the saturation predictions based on the acoustic logging data and the calculation results from the resistivity are observed for the Class I gas layers. This may result from the significant influence that the gas exerts on the acoustic logging results, which in turn affects the final saturation evaluation. Accurate and reliable acoustic logging data are the premise and guarantee of saturation evaluations using rock physics models. Additionally, the depth correlation of density, array acoustic, and resistivity log data is also critical for accurate gas reservoir identification and saturation assessment. In this model, the mineral contents are estimated using the natural gamma logs. For simplicity, we assume the solid matrix consists solely of sand and clay. In reality, formations may also contain small amounts of other mineral components, such as calcite. The effective pressure is calculated according to the actual buried depths of the formation, and the detailed derivation process is shown in Appendix A. It should be noted that as the key input parameters of the model’s calculations, various factors, including the mineral composition, porosity, and bulk modulus, will have different degrees of influence on the acoustic velocity and thus affect the prediction of saturation (Figure 15). Furthermore, the details of the pore geometry are still ignored by incorporating the patchy distribution into the Gassmann modeling [67]. Affected by many factors, saturation estimation based on elastic wave velocity is an inverse problem with non-unique solutions, which has a certain degree of uncertainty [39,81].

6. Conclusions

This paper proposes a method for calculating the saturation of shallow gas reservoirs using array acoustic logging data, centered on developing a rock physics model for loose and unconsolidated sediments. The method is successfully applied to the shallow gas reservoirs in the PRMB, and the following conclusions can be drawn:
(1)
The rock physics model of shallow unconsolidated formations established by the Voigt-Reuss-Hill boundary model, Hertz-Mindlin theory, and Gassmann-Hill model achieves a good application effect in the shallow gas reservoirs of the PRMB. Compared to the velocities simulated with water-saturated, the compressional velocity in the gas-bearing reservoirs decreases significantly, and the shear remains essentially identical or decreases slightly, showing obvious gas-bearing characteristics. In the gas-free formations, the simulated velocity basically aligns with the measured velocity.
(2)
Compared with the assumption of uniform distribution in the Wood equation, the patchy distribution has better applicability. The results indicate that the gas saturation calculated from the array acoustic logging data ranges from 33.92% to 47.20% in Well A-1 and from 30.41% to 42.27% in Well A-2. These estimates demonstrate a certain degree of comparability with the saturation evaluated from the resistivity.
(3)
In Class I gas layers, the acoustic logging data are greatly influenced by the gas, resulting in a certain error in the saturation evaluation. However, for Class II and Class III gas layers, the method for saturation evaluation based on array acoustic logs and the shallow unconsolidated rock physics model shows good applicability, with an average improvement of 3.99% compared to the results from resistivity. This study provides a new path to evaluate gas saturation using non-electrical methods.

Author Contributions

Conceptualization, J.S., C.Z. and C.P.; methodology, J.S., C.Z. and C.P.; software, J.S. and C.P.; validation, J.S. and L.X.; formal analysis, K.Q.; investigation, W.S.; resources, C.Z.; data curation, J.S.; writing—original draft preparation, J.S.; writing—review and editing, X.L. and Y.Z.; visualization, K.Q. and H.Z.; supervision, H.Z.; project administration, C.Z. and C.P.; funding acquisition, C.Z. All authors have read and agreed to the published version of the manuscript.

Funding

This research was supported by the Key-Area Research and Development Program of Guangdong Province (Grant: 2020B1111030003).

Data Availability Statement

The data presented in this study are available on request from the corresponding author. The data are not publicly available due to privacy restrictions.

Conflicts of Interest

The authors declare no conflicts of interest.

Appendix A

The solid phase of rocks usually consists of two or more different components. Consequently, the elastic modulus of rock matrix can be calculated by elastic moduli of its constituent minerals. The Voigt model assumes that the minerals constituting the framework are isotropic, linear, and arranged in parallel [85]. Because it assumes an equal strain for each component, it is also referred to as the equal strain model. However, with the exception of single-phase pure minerals, the isotropic mixtures that exist in practice rarely meet the standards of the Voigt model. The upper bounds of elastic modulus of rock matrix can be written as follows:
K mV = i = 1 m f i K i
G mV = i = 1 m f i G i
where K mV and G mV are bulk and shear moduli of rock matrix computed by the Voigt model, f i represents the volume proportion of the i-th mineral in the rock matrix, and K i and G i represent the bulk and shear moduli of the i-th mineral, respectively. The variable m denotes the number of minerals contained in the rock’s solid phase.
In contrast to the Voigt model, the Reuss model presumes that the stress is equal among all components [71]. It can give the lower bounds of bulk ( K mR ) and shear ( G mR ) moduli of a rock matrix:
K mR 1 = i = 1 m f i K i 1  
G mR 1 = i = 1 m f i G i 1
The elastic modulus of actual rocks lies between the estimates provided by the Voigt and Reuss models. The Voigt-Reuss-Hill model provides a theoretical estimate of a rock matrix by calculating the arithmetic average of two models mentioned above [86]:
K ma = K mV + K mR 2
G ma = G mV + G mR 2
The establishment of the model of dry rock frame connects the rock matrix, porosity, and effective pressure of the formation [34,64]. The Hertz-Mindlin theory provides the effective modulus of sediments at the critical porosity [87,88], while the Hashin-Shtrikman bounds are employed to calculate the elastic modulus of the dry rock frame in the regions surrounding the critical porosity [89]. They can be expressed as follows:
K dry = ϕ / ϕ c K HM + 4 3 G HM + 1 ϕ / ϕ c K ma + 4 3 G HM 1 4 3 G HM , ϕ < ϕ c 1 ϕ / 1 ϕ c K HM + 4 3 G HM + ϕ ϕ c / 1 ϕ c 4 3 G HM 1 4 3 G HM , ϕ ϕ c
G dry = ϕ / ϕ c G HM + Z + 1 ϕ / ϕ c G m a + Z 1 Z , ϕ < ϕ c 1 ϕ / 1 ϕ c G HM + Z + ϕ ϕ c / 1 ϕ c Z 1 Z , ϕ ϕ c
Z = G HM 6 9 K HM + 8 G HM K HM + 2 G HM
where K dry and G dry represent the bulk and shear moduli of the dry rock frame, and ϕ c denotes the critical porosity ( ϕ c = 40%) [90]. K HM and G HM represent the effective bulk and shear moduli of dry rock at the critical porosity and they can be written as follows:
K HM = n 2 1 ϕ c 2 G ma 2 18 π 2 1 υ 2 P 1 3
G HM = 5 4 υ 5 2 υ 3 n 2 1 ϕ c 2 G ma 2 2 π 2 1 υ 2 P 1 3
where n represents the coordination number ( n = 8.5), υ and P are Poisson’s ratio and the effective pressure, and they can be specifically expressed as
υ = 1 2 K ma 2 3 G ma K ma + 1 3 G ma
P = ρ ρ w g H
where ρ represents the sediment bulk density, g represents the gravitational acceleration, and H is the depth below the sea floor.
Since the pore fluid (which here refers to the water and natural gas filled into the pores) does not have a shear modulus, only a bulk modulus, the shear modulus remains unaffected by the pore fluids. Consequently, the shear modulus of saturated sediments ( G sat ) can be expressed as follows:
G sat = G dry
When the fluids in pores are uniformly distributed, the bulk modulus of saturated sediments ( K sat ) can be given by the Gassmann equation [72]:
K sat = K ma ϕ K dry ( 1 + ϕ ) K f K dry / K ma + K f ( 1 ϕ ) K f + ϕ K ma K f K dry / K ma
When the fluids in pores present with a patchy distribution, the bulk modulus of saturated sediments can be calculated by the Hill theory [34,69], which can be expressed as follows:
1 K sat + 4 3 G sat = S w K sat , w + 4 3 G sat + 1 S w K sat , g + 4 3 G sat
where K sat , w and K sat , g represent the bulk moduli of water-saturated and gas-saturated sediments, respectively; they can be given by the Gassmann equation through K w and K g :
K sat , w = K m a ϕ K dry ( 1 + ϕ ) K w K dry / K ma + K w ( 1 ϕ ) K w + ϕ K ma K w K dry / K m a
K sat , g = K m a ϕ K dry ( 1 + ϕ ) K g K dry / K ma + K g ( 1 ϕ ) K g + ϕ K ma K g K dry / K ma

References

  1. Aydin, H.; Merey, S. The effect of gas production from deeper conventional gas reservoirs on shallower gas hydrate layer stability: A case study in the conditions of the Sakarya gas field, Western Black Sea. J. Nat. Gas Sci. Eng. 2021, 94, 104103. [Google Scholar] [CrossRef]
  2. Zou, C.N.; Chen, Y.P.; Kong, L.F.; Sun, F.J.; Chen, S.S.; Dong, Z. Underground coal gasification and its strategic significance to the development of natural gas industry in China. Pet. Explor. Dev. 2019, 46, 205–215. [Google Scholar] [CrossRef]
  3. Zou, C.N.; Zhao, Q.; Chen, J.J.; Li, J.; Yang, Z.; Sun, Q.P.; Lu, J.L.; Zhang, G.X. Natural gas in China: Development trend and strategic forecast. Nat. Gas Ind. B 2018, 5, 380–390. [Google Scholar] [CrossRef]
  4. Davis, A.M. Shallow gas: An overview. Cont. Shelf Res. 1992, 12, 1077–1079. [Google Scholar] [CrossRef]
  5. Floodgate, G.D.; Judd, A.G. The origins of shallow gas. Cont. Shelf Res. 1992, 12, 1145–1156. [Google Scholar] [CrossRef]
  6. Müller, S.; Reinhardt, L.; Franke, D.; Gaedicke, C.; Winsemann, J. Shallow gas accumulations in the German North Sea. Mar. Pet. Geol. 2018, 91, 139–151. [Google Scholar] [CrossRef]
  7. Ren, J.F.; Cheng, C.; Xiong, P.F.; Kuang, Z.G.; Liang, J.Q.; Lai, H.F.; Chen, Z.G.; Chen, Y.; Li, T.; Jiang, T. Sand-rich gas hydrate and shallow gas systems in the Qiongdongnan Basin, northern South China Sea. J. Pet. Sci. Eng. 2022, 215, 110630. [Google Scholar] [CrossRef]
  8. Schroot, B.M.; Schüttenhelm, R.T.E. Expressions of shallow gas in the Netherlands North Sea. Neth. J. Geosci. 2003, 82, 91–105. [Google Scholar] [CrossRef]
  9. Cox, D.R.; Huuse, M.; Newton, A.M.; Sarkar, A.D.; Knutz, P.C. Shallow gas and gas hydrate occurrences on the northwest Greenland shelf margin. Mar. Geol. 2021, 432, 106382. [Google Scholar] [CrossRef]
  10. de Bruin, G.; ten Veen, J.; Wilpshaar, M.; Versteijlen, N.; Geel, K.; Verweij, H.; Carpentier, S. Origin of shallow gas in the Dutch North Sea—Seismic versus geochemical evidence. Interpretation 2022, 10, SB63–SB76. [Google Scholar] [CrossRef]
  11. Horozal, S.; Chae, S.; Kim, D.H.; Seo, J.M.; Lee, S.M.; Han, H.S.; Cukur, D.; Kong, G.-S. Seismic evidence of shallow gas in sediments on the southeastern continental shelf of Korea, East Sea (Japan Sea). Mar. Pet. Geol. 2021, 133, 105291. [Google Scholar] [CrossRef]
  12. Lee, S.H.; Chough, S.K. Distribution and origin of shallow gas in deep-sea sediments of the Ulleung Basin, East Sea (Sea of Japan). Geo-Mar. Lett. 2002, 22, 204–209. [Google Scholar] [CrossRef]
  13. Milkov, A.V. Methanogenic biodegradation of petroleum in the West Siberian Basin (Russia): Significance for formation of giant Cenomanian gas pools. AAPG Bull. 2010, 94, 1485–1541. [Google Scholar] [CrossRef]
  14. Hadavimoghaddam, F.; Ostadhassan, M.; Sadri, M.A.; Bondarenko, T.; Chebyshev, I.; Semnani, A. Prediction of water saturation from well log data by machine learning algorithms: Boosting and super learner. J. Mar. Sci. Eng. 2021, 9, 666. [Google Scholar] [CrossRef]
  15. Mondal, S.R.; Ghosh, R.; Ojha, M.; Maiti, S. Well log evaluation of the gas-bearing reservoirs in the Bombay offshore basin, Gulf of Cambay, western coast of India. Explor. Geophys. 2024, 55, 191–212. [Google Scholar] [CrossRef]
  16. Peng, C.; Zou, C.C.; Zhou, T.N.; Li, K.; Yang, Y.Q.; Zhang, G.H.; Wang, W.W. Factors affecting coalbed methane (CBM) well productivity in the Shizhuangnan block of southern Qinshui basin, North China: Investigation by geophysical log, experiment and production data. Fuel 2017, 191, 427–441. [Google Scholar] [CrossRef]
  17. Shedid, S.A.; Saad, M.A. Comparison and sensitivity analysis of water saturation models in shaly sandstone reservoirs using well logging data. J. Pet. Sci. Eng. 2017, 156, 536–545. [Google Scholar] [CrossRef]
  18. Xiao, L.; Zou, C.C.; Mao, Z.Q.; Shi, Y.J.; Jin, Y.; Guo, H.P.; Hu, X.X. Estimation of water saturation from nuclear magnetic resonance (NMR) and conventional logs in low permeability sandstone reservoirs. J. Pet. Sci. Eng. 2013, 108, 40–51. [Google Scholar] [CrossRef]
  19. Tohidi, E.; Hesan, M.; Azad, A.; Abbasi, M.; Sadeghnejad, S. Implementing pore size distribution into saturation height function modelling of reservoir rock types: A case study on a carbonate gas reservoir. Gas Sci. Eng. 2024, 121, 205188. [Google Scholar] [CrossRef]
  20. Archie, G.E. The electrical resistivity log as an aid in determining some reservoir characteristics. Trans. AIME 1942, 146, 54–62. [Google Scholar] [CrossRef]
  21. Chen, Q.; Wu, N.Y.; Liu, C.L.; Zou, C.C.; Liu, Y.; Sun, J.Y.; Li, Y.L.; Hu, G.W. Research progress on global marine gas hydrate resistivity logging and electrical property experiments. J. Mar. Sci. Eng. 2022, 10, 645. [Google Scholar] [CrossRef]
  22. Lan, X.X.; Zou, C.C.; Peng, C.; Wu, C.W.; Zhang, Y.Y.; Wang, S.Y. Numerical Simulation of Electrical Properties for Pore-Scale Hydrate-Bearing Sediments with Different Occurrence Patterns and Distribution Morphologies. J. Mar. Sci. Eng. 2023, 11, 1169. [Google Scholar] [CrossRef]
  23. Simandoux, P. Dielectric measurements on porous media, application to the measurements of water saturation: Study of behavior of argillaceous formations. Rev. L’institut Fr. Pet. 1963, 18, 193–215. [Google Scholar]
  24. Waxman, M.H.; Smits, L.J.M. Electrical conductivities in oil-bearing shaly sands. Soc. Pet. Eng. J. 1968, 8, 107–122. [Google Scholar] [CrossRef]
  25. Clavier, C.; Coates, G.; Dumanoir, J. Theoretical and experimental bases for the dual-water model for interpretation of shaly sands. Soc. Pet. Eng. J. 1984, 24, 153–168. [Google Scholar] [CrossRef]
  26. Poupon, A.; Leveaux, J. Evaluation of water saturation in shaly formations. In Proceedings of the SPWLA Annual Logging Symposium, Dallas, TX, USA, 2–5 May 1971; p. SPWLA-1971-O. [Google Scholar]
  27. Gohari Nezhad, A.; Emami Niri, M. Enhancing water saturation predictions from conventional well logs in a carbonate gas reservoir with a hybrid CNN-LSTM model. J. Pet. Explor. Prod. Technol. 2025, 15, 89. [Google Scholar] [CrossRef]
  28. Coates, G.R.; Gardner, J.S.; Miller, D. Applying pulse-echo NMR to shaly sand formation evaluation. In Proceedings of the SPWLA Annual Logging Symposium, Tulsa, OK, USA, 19–22 June 1994; p. SPWLA-1994-B. [Google Scholar]
  29. Zhang, P.J.; Pan, B.Z.; Guo, Y.H.; Zhang, L.H.; Si, Z.W.; Xu, F.; Zhu, M.Y.; Li, Y. Study on an improved saturation parameter method based on joint inversion of NMR and resistivity data in porous media. Pet. Sci. 2025, 22, 2312–2314. [Google Scholar] [CrossRef]
  30. Qian, J.; Wang, X.J.; Collett, T.S.; Guo, Y.Q.; Kang, D.J.; Jin, J.P. Downhole log evidence for the coexistence of structure II gas hydrate and free gas below the bottom simulating reflector in the South China Sea. Mar. Pet. Geol. 2018, 98, 662–674. [Google Scholar] [CrossRef]
  31. Shi, W.; Wang, X.; Shi, Y.; Feng, A.; Zou, Y.; Young, S. Application of dipole array acoustic logging in the evaluation of shale gas reservoirs. Energies 2019, 12, 3882. [Google Scholar] [CrossRef]
  32. Yuan, H.M.; Han, D.H.; Wang, Y. A review of rock physical models for elastic properties characterization of gas hydrate bearing sediments. J. Pet. Sci. Eng. 2022, 218, 111013. [Google Scholar] [CrossRef]
  33. Guo, Z.; Lv, X.; Liu, C.; Chen, H.; Cai, Z. Characterizing gas hydrate–bearing marine sediments using elastic properties—Part 1: Rock physical modeling and inversion from well logs. J. Mar. Sci. Eng. 2022, 10, 1379. [Google Scholar] [CrossRef]
  34. Helgerud, M.B.; Dvorkin, J.; Nur, A.; Sakai, A.; Collett, T. Elastic-wave velocity in marine sediments with gas hydrates: Effective medium modeling. Geophys. Res. Lett. 1999, 26, 2021–2024. [Google Scholar] [CrossRef]
  35. Tinivella, U. A method for estimating gas hydrate and free gas concentrations in marine sediments. Boll. Geofis. Teor. Appl. 1999, 40, 19–30. [Google Scholar]
  36. Lee, M.W. Biot–Gassmann theory for velocities of gas hydrate-bearing sediments. Geophysics 2002, 67, 1711–1719. [Google Scholar] [CrossRef]
  37. Ghosh, R.; Ojha, M. Amount of gas hydrate estimated from rock physics analysis based on morphology and intrinsic anisotropy in area B, Krishna Godavari offshore basin, expedition NGHP-02. Mar. Pet. Geol. 2021, 124, 104856. [Google Scholar] [CrossRef]
  38. Pan, H.J.; Li, H.B.; Chen, J.Y.; Riedel, M.; Holland, M.; Zhang, Y.; Cai, S.J. Quantification of gas hydrate saturation and morphology based on a generalized effective medium model. Mar. Pet. Geol. 2020, 113, 104166. [Google Scholar] [CrossRef]
  39. Pan, H.J.; Li, H.B.; Chen, J.Y.; Zhang, Y.; Cai, S.J.; Huang, Y.C.; Zheng, Y.; Zhao, Y.; Deng, J. A unified contact cementation theory for gas hydrate morphology detection and saturation estimation from elastic-wave velocities. Mar. Pet. Geol. 2020, 113, 104146. [Google Scholar] [CrossRef]
  40. Qu, L.; Zou, C.C.; Lu, Z.Q.; Yu, C.Q.; Li, N.; Zhu, J.C.; Zhang, X.H.; Yue, X.Y.; Gao, M.Z. Elastic-wave velocity characterization of gas hydrate-bearing fractured reservoirs in a permafrost area of the Qilian Mountain, Northwest China. Mar. Pet. Geol. 2017, 88, 1047–1058. [Google Scholar] [CrossRef]
  41. Shankar, U.; Gupta, D.K.; Bhowmick, D.; Sain, K. Gas hydrate and free gas saturations using rock physics modelling at site NGHP-01-05 and 07 in the Krishna–Godavari Basin, eastern Indian margin. J. Pet. Sci. Eng. 2013, 106, 62–70. [Google Scholar] [CrossRef]
  42. Xiao, K.; Zou, C.C.; Lu, Z.Q.; Deng, J.Z. Gas hydrate saturations estimated from pore-and fracture-filling gas hydrate reservoirs in the Qilian Mountain permafrost, China. Sci. Rep. 2017, 7, 16258. [Google Scholar] [CrossRef]
  43. Jin, J.; Hu, J.; Li, L.; Li, J.; Zhu, Z.; Wang, X.; Zhou, J.; Wang, W. Submarine Slides and Their Influence on Gas Hydrate and Shallow Gas in the Pearl River Mouth Basin. J. Mar. Sci. Eng. 2025, 13, 308. [Google Scholar] [CrossRef]
  44. Wang, X.; Qiu, N.; Zhang, X.; Wang, Z.; Li, Z. Analysis of Hydrocarbon Enrichment in Tight Sandstone Reservoirs in the Eastern Baiyun Depression. Appl. Sci. 2024, 14, 10703. [Google Scholar] [CrossRef]
  45. Gao, Y.D.; Wang, X.D.; Xu, L.Y.; Zhang, Y.L.; Li, K.S.; Zhang, B.; Chen, C. Natural gas exploration history and main controlling factors for formation of large and medium gas fields in Baiyun Sag. China Offshore Oil Gas 2025, 37, 1–15. [Google Scholar]
  46. Ping, H.W.; Chen, H.H.; Zhu, J.Z.; George, S.C.; Mi, L.J.; Pang, X.; Zhai, P.Q. Origin, source, mixing, and thermal maturity of natural gases in the Panyu lower uplift and the Baiyun depression, Pearl River Mouth Basin, northern South China Sea. AAPG Bull. 2018, 102, 2171–2200. [Google Scholar] [CrossRef]
  47. Ping, H.W.; Chen, H.H.; Zhai, P.Q.; Zhu, J.Z.; George, S.C. Petroleum charge history in the Baiyun depression and Panyu lower uplift in the Pearl River Mouth Basin, northern South China Sea: Constraints from integration of organic geochemical and fluid inclusion data. AAPG Bull. 2019, 103, 1401–1442. [Google Scholar] [CrossRef]
  48. Li, H.; Sun, L.P.; Wang, X.C. Multivariate information fusion modeling method and its application in seismic pre-stack inversion of shallow gas reservoir. Gas Sci. Eng. 2025, 139, 205615. [Google Scholar] [CrossRef]
  49. Zhan, L.S.; Kang, D.J.; Lu, H.L.; Lu, J.A. Characterization of coexistence of gas hydrate and free gas using sonic logging data in the Shenhu Area, South China Sea. J. Nat. Gas Sci. Eng. 2022, 101, 104540. [Google Scholar] [CrossRef]
  50. Jiang, W.M.; Li, Y.; Yang, C.; Xiong, Y.Q. Organic geochemistry of source rocks in the Baiyun sag of the Pearl River Mouth Basin, south China sea. Mar. Pet. Geol. 2021, 124, 104836. [Google Scholar] [CrossRef]
  51. Ping, H.W.; Chen, H.H.; Zhai, P.Q.; Zhu, J.Z.; Xiong, W.L.; Kong, L.T.; Gong, S.; Vergara, T.J.; George, S.C. Evidence for deeply buried, oil-prone source rocks in the Baiyun depression, Pearl River Mouth Basin, northern South China Sea. AAPG Bull. 2021, 105, 749–783. [Google Scholar] [CrossRef]
  52. Fu, J.; Zhang, Z.T.; Chen, C.; Wang, T.G.; Li, M.J.; Ali, S.; Lu, X.L.; Dai, J.H. Geochemistry and origins of petroleum in the Neogene reservoirs of the Baiyun Sag, Pearl River Mouth Basin. Mar. Pet. Geol. 2019, 107, 127–141. [Google Scholar] [CrossRef]
  53. Lu, X.L.; Li, M.J.; Li, Y.C.; Yang, Y.C.; Yang, H.Z.; Wang, N.; Ran, Z.C.; Ali, S. Early Oligocene marine transgression and organic matter accumulation recorded in the upper Eocene to lower Oligocene Enping Formation of the Baiyun Sag, Pearl River Mouth Basin, South China Sea. J. Asian Earth Sci. 2024, 259, 105909. [Google Scholar] [CrossRef]
  54. Sun, R.; Li, Z.; Zhao, Z.G.; Yang, H.Z.; Wang, X.Y.; Zhao, Z. Characteristics and origin of the Lower Oligocene marine source rocks controlled by terrigenous organic matter supply in the Baiyun Sag, northern South China Sea. J. Pet. Sci. Eng. 2020, 187, 106821. [Google Scholar] [CrossRef]
  55. Sun, Q.L.; Alves, T.M.; Wu, S.G.; Zhao, M.H.; Xie, X.N. Early Miocene magmatism in the Baiyun Sag (South China Sea): A view to the origin of intense post-rift magmatism. Gondwana Res. 2023, 120, 127–144. [Google Scholar] [CrossRef]
  56. Zeng, Z.W.; Zhu, H.T.; Yang, X.H.; Zeng, H.L.; Xia, C.C.; Chen, Y. Using seismic geomorphology and detrital zircon geochronology to constrain provenance evolution and its response of Paleogene Enping Formation in the Baiyun Sag, Pearl River Mouth Basin, South China sea: Implications for paleo-Pearl River drainage evolution. J. Pet. Sci. Eng. 2019, 177, 663–680. [Google Scholar] [CrossRef]
  57. Jin, J.P.; Wang, X.J.; Zhang, Z.Y.; He, M.; Magee, C.; Li, J.; Li, Y.P.; Li, S.Z.; Luan, Z.D.; Zhang, G.X. Shallow gas and gas hydrate accumulations influenced by magmatic complexes in the Pearl River Mouth Basin, South China Sea. Mar. Geol. 2022, 453, 106928. [Google Scholar] [CrossRef]
  58. Gao, J.W.; Peng, X.C.; Wu, S.G.; Lüdmann, T.; McIntosh, K.; Ma, B.J.; Xu, Z.Y. Different expressions of the crustal structure across the Dongsha Rise along the northeastern margin of the South China Sea. J. Asian Earth Sci. 2019, 171, 187–200. [Google Scholar] [CrossRef]
  59. Jiang, W.M.; Chen, C.; Long, Z.L.; Li, Y.; Yang, C.; Xiong, Y.Q. Geochemical characteristics and possible sources of crude oils in the Baiyun deep-water area of the Pearl River Mouth Basin, South China Sea. Mar. Pet. Geol. 2022, 135, 105410. [Google Scholar] [CrossRef]
  60. Zhao, Y.H.; Ren, J.Y.; Pang, X.; Yang, L.L.; Zheng, J.Y. Structural style, formation of low angle normal fault and its controls on the evolution of Baiyun Rift, northern margin of the South China Sea. Mar. Pet. Geol. 2018, 89, 687–700. [Google Scholar] [CrossRef]
  61. Wang, B.; Guo, T.; Wang, H.; Tan, B. Extracting near-borehole P and S reflections from array sonic logging data. J. Geophys. Eng. 2011, 8, 308–315. [Google Scholar] [CrossRef]
  62. Xiang, M.; Wang, Z.W.; Liu, J.H. Extracting array acoustic logging signal information by combining fractional Fourier transform and Choi–Williams distribution. Appl. Acoust. 2015, 90, 111–115. [Google Scholar] [CrossRef]
  63. Abe, J.S.; Edigbue, P.I.; Lawrence, S.G. Rock physics analysis and Gassmann’s fluid substitution for reservoir characterization of “G” field, Niger Delta. Arab. J. Geosci. 2018, 11, 656. [Google Scholar] [CrossRef]
  64. Dvorkin, J.; Prasad, M.; Sakai, A.; Lavoie, D. Elasticity of marine sediments: Rock physics modeling. Geophys. Res. Lett. 1999, 26, 1781–1784. [Google Scholar] [CrossRef]
  65. Feng, Q.X.; Jiang, L.; Liu, M.Q.; Wan, H.; Chen, L.; Xiao, W. Fluid substitution in carbonate rocks based on the Gassmann equation and Eshelby–Walsh theory. J. Appl. Geophys. 2014, 106, 60–66. [Google Scholar] [CrossRef]
  66. Yan, F.Y.; Han, D.H. Effect of pore geometry on Gassmann fluid substitution. Geophys. Prospect. 2016, 64, 1575–1587. [Google Scholar] [CrossRef]
  67. Smith, T.M.; Sondergeld, C.H.; Rai, C.S. Gassmann fluid substitutions: A tutorial. Geophysics 2003, 68, 430–440. [Google Scholar] [CrossRef]
  68. Dvorkin, J.; Moos, D.; Packwood, J.L.; Nur, A.M. Identifying patchy saturation from well logs. Geophysics 1999, 64, 1756–1759. [Google Scholar] [CrossRef]
  69. Dvorkin, J.; Nur, A. Acoustic signatures of patchy saturation. Int. J. Solids Struct. 1998, 35, 4803–4810. [Google Scholar] [CrossRef]
  70. Knight, R.; Dvorkin, J.; Nur, A. Acoustic signatures of partial saturation. Geophysics 1998, 63, 132–138. [Google Scholar] [CrossRef]
  71. Reuß, A. Berechnung der fließgrenze von mischkristallen auf grund der plastizitätsbedingung für einkristalle. ZAMM-J. Appl. Math. Mech. Z. Angew. Math. Mech. 1929, 9, 49–58. [Google Scholar] [CrossRef]
  72. Gassmann, F. Elastic waves through a packing of spheres. Geophysics 1951, 16, 673–685. [Google Scholar] [CrossRef]
  73. Batzle, M.; Wang, Z. Seismic properties of pore fluids. Geophysics 1992, 57, 1396–1408. [Google Scholar] [CrossRef]
  74. Lee, M.W.; Collett, T.S. Amount of gas hydrate estimated from compressional-and shear-wave velocities at the JAPEX/JNOC/GSC Mallik 2L-38 gas hydrate research well. Bull. Geol. Surv. Can. 1999, 544, 313–322. [Google Scholar]
  75. Cook, A.E.; Waite, W.F. Archie’s saturation exponent for natural gas hydrate in coarse-grained reservoirs. J. Geophys. Res. Solid Earth 2018, 123, 2069–2089. [Google Scholar] [CrossRef]
  76. Lee, M.W.; Collett, T.S. Gas hydrate saturations estimated from fractured reservoir at Site NGHP-01-10, Krishna-Godavari Basin, India. J. Geophys. Res. Solid Earth 2009, 114, B07102. [Google Scholar] [CrossRef]
  77. Chen, J.; Hu, G.W.; Bu, Q.T.; Wu, N.Y.; Liu, C.L.; Chen, Q.; Li, C.F.; Wan, Y.Z.; Wang, Z.H.; Zhao, W.G. Elastic wave velocity of marine sediments with free gas: Insights from CT-acoustic observation and theoretical analysis. Mar. Pet. Geol. 2023, 150, 106169. [Google Scholar] [CrossRef]
  78. Chen, J.; Hu, G.W.; Bu, Q.T.; Liu, C.L.; Dong, L.; Wan, Y.Z.; Mao, P.X.; Guo, Y.; Wang, Z.H. Elastic wave velocities of hydrate-bearing sands containing methane gas bubbles: Insights from CT-acoustic observation and theoretical analysis. J. Nat. Gas Sci. Eng. 2021, 88, 103844. [Google Scholar] [CrossRef]
  79. Mavko, G.; Mukerji, T. Bounds on low-frequency seismic velocities in partially saturated rocks. Geophysics 1998, 63, 918–924. [Google Scholar] [CrossRef]
  80. Brie, A.; Pampuri, F.; Marsala, A.F.; Meazza, O. Shear sonic interpretation in gas-bearing sands. In Proceedings of the SPE Annual Technical Conference and Exhibition, Dallas, TX, USA, 22–25 October 1995; SPE: Danbury, CT, USA, 1995; p. SPE-30595-MS. [Google Scholar]
  81. Pan, H.J.; Li, H.B.; Chen, J.Y.; Zhang, Y.; Liu, X.B.; Cai, S.J.; Cao, C.J. Evaluation of gas hydrate resources using hydrate morphology-dependent rock physics templates. J. Pet. Sci. Eng. 2019, 182, 106268. [Google Scholar] [CrossRef]
  82. Yu, H.; Ba, J.; Carcione, J.; Li, J.S.; Tang, G.; Zhang, X.Y.; He, X.Z.; Ouyang, H. Rock physics modeling of heterogeneous carbonate reservoirs: Porosity estimation and hydrocarbon detection. Appl. Geophys. 2014, 11, 9–22. [Google Scholar] [CrossRef]
  83. Yu, H.; Li, J.S.; Yan, X.F.; Xu, G.C.; Jin, X.; Xu, B. Microscopic pore structure characterization of heterogeneous carbonate reservoirs and gas detection: A case study from limestone gas reservoirs on the right bank block of Amu Darya River. Geophys. Prospect. Pet. 2017, 56, 472–482. [Google Scholar] [CrossRef]
  84. Ghosh, R.; Ojha, M.; Kumar, P. Review of rock physics theories for quantifying gas hydrate and associated uncertainties. J. Asian Earth Sci. 2023, 256, 105828. [Google Scholar] [CrossRef]
  85. Voigt, W. Ueber die Beziehung zwischen den beiden Elasticitätsconstanten isotroper Körper. Ann. Phys. 1889, 274, 573–587. [Google Scholar] [CrossRef]
  86. Hill, R. On discontinuous plastic states, with special reference to localized necking in thin sheets. J. Mech. Phys. Solids 1952, 1, 19–30. [Google Scholar] [CrossRef]
  87. Dvorkin, J.; Nur, A. Elasticity of high-porosity sandstones: Theory for two North Sea data sets. Geophysics 1996, 61, 1363–1370. [Google Scholar] [CrossRef]
  88. Mindlin, R.D. Compliance of elastic bodies in contact. J. Appl. Mech. 1949, 16, 259–268. [Google Scholar] [CrossRef]
  89. Hashin, Z.; Shtrikman, S. A variational approach to the theory of the elastic behaviour of multiphase materials. J. Mech. Phys. Solids 1963, 11, 127–140. [Google Scholar] [CrossRef]
  90. Nur, A.; Mavko, G.; Dvorkin, J.; Galmudi, D. Critical porosity: A key to relating physical properties to porosity in rocks. Lead. Edge 1998, 17, 357–362. [Google Scholar] [CrossRef]
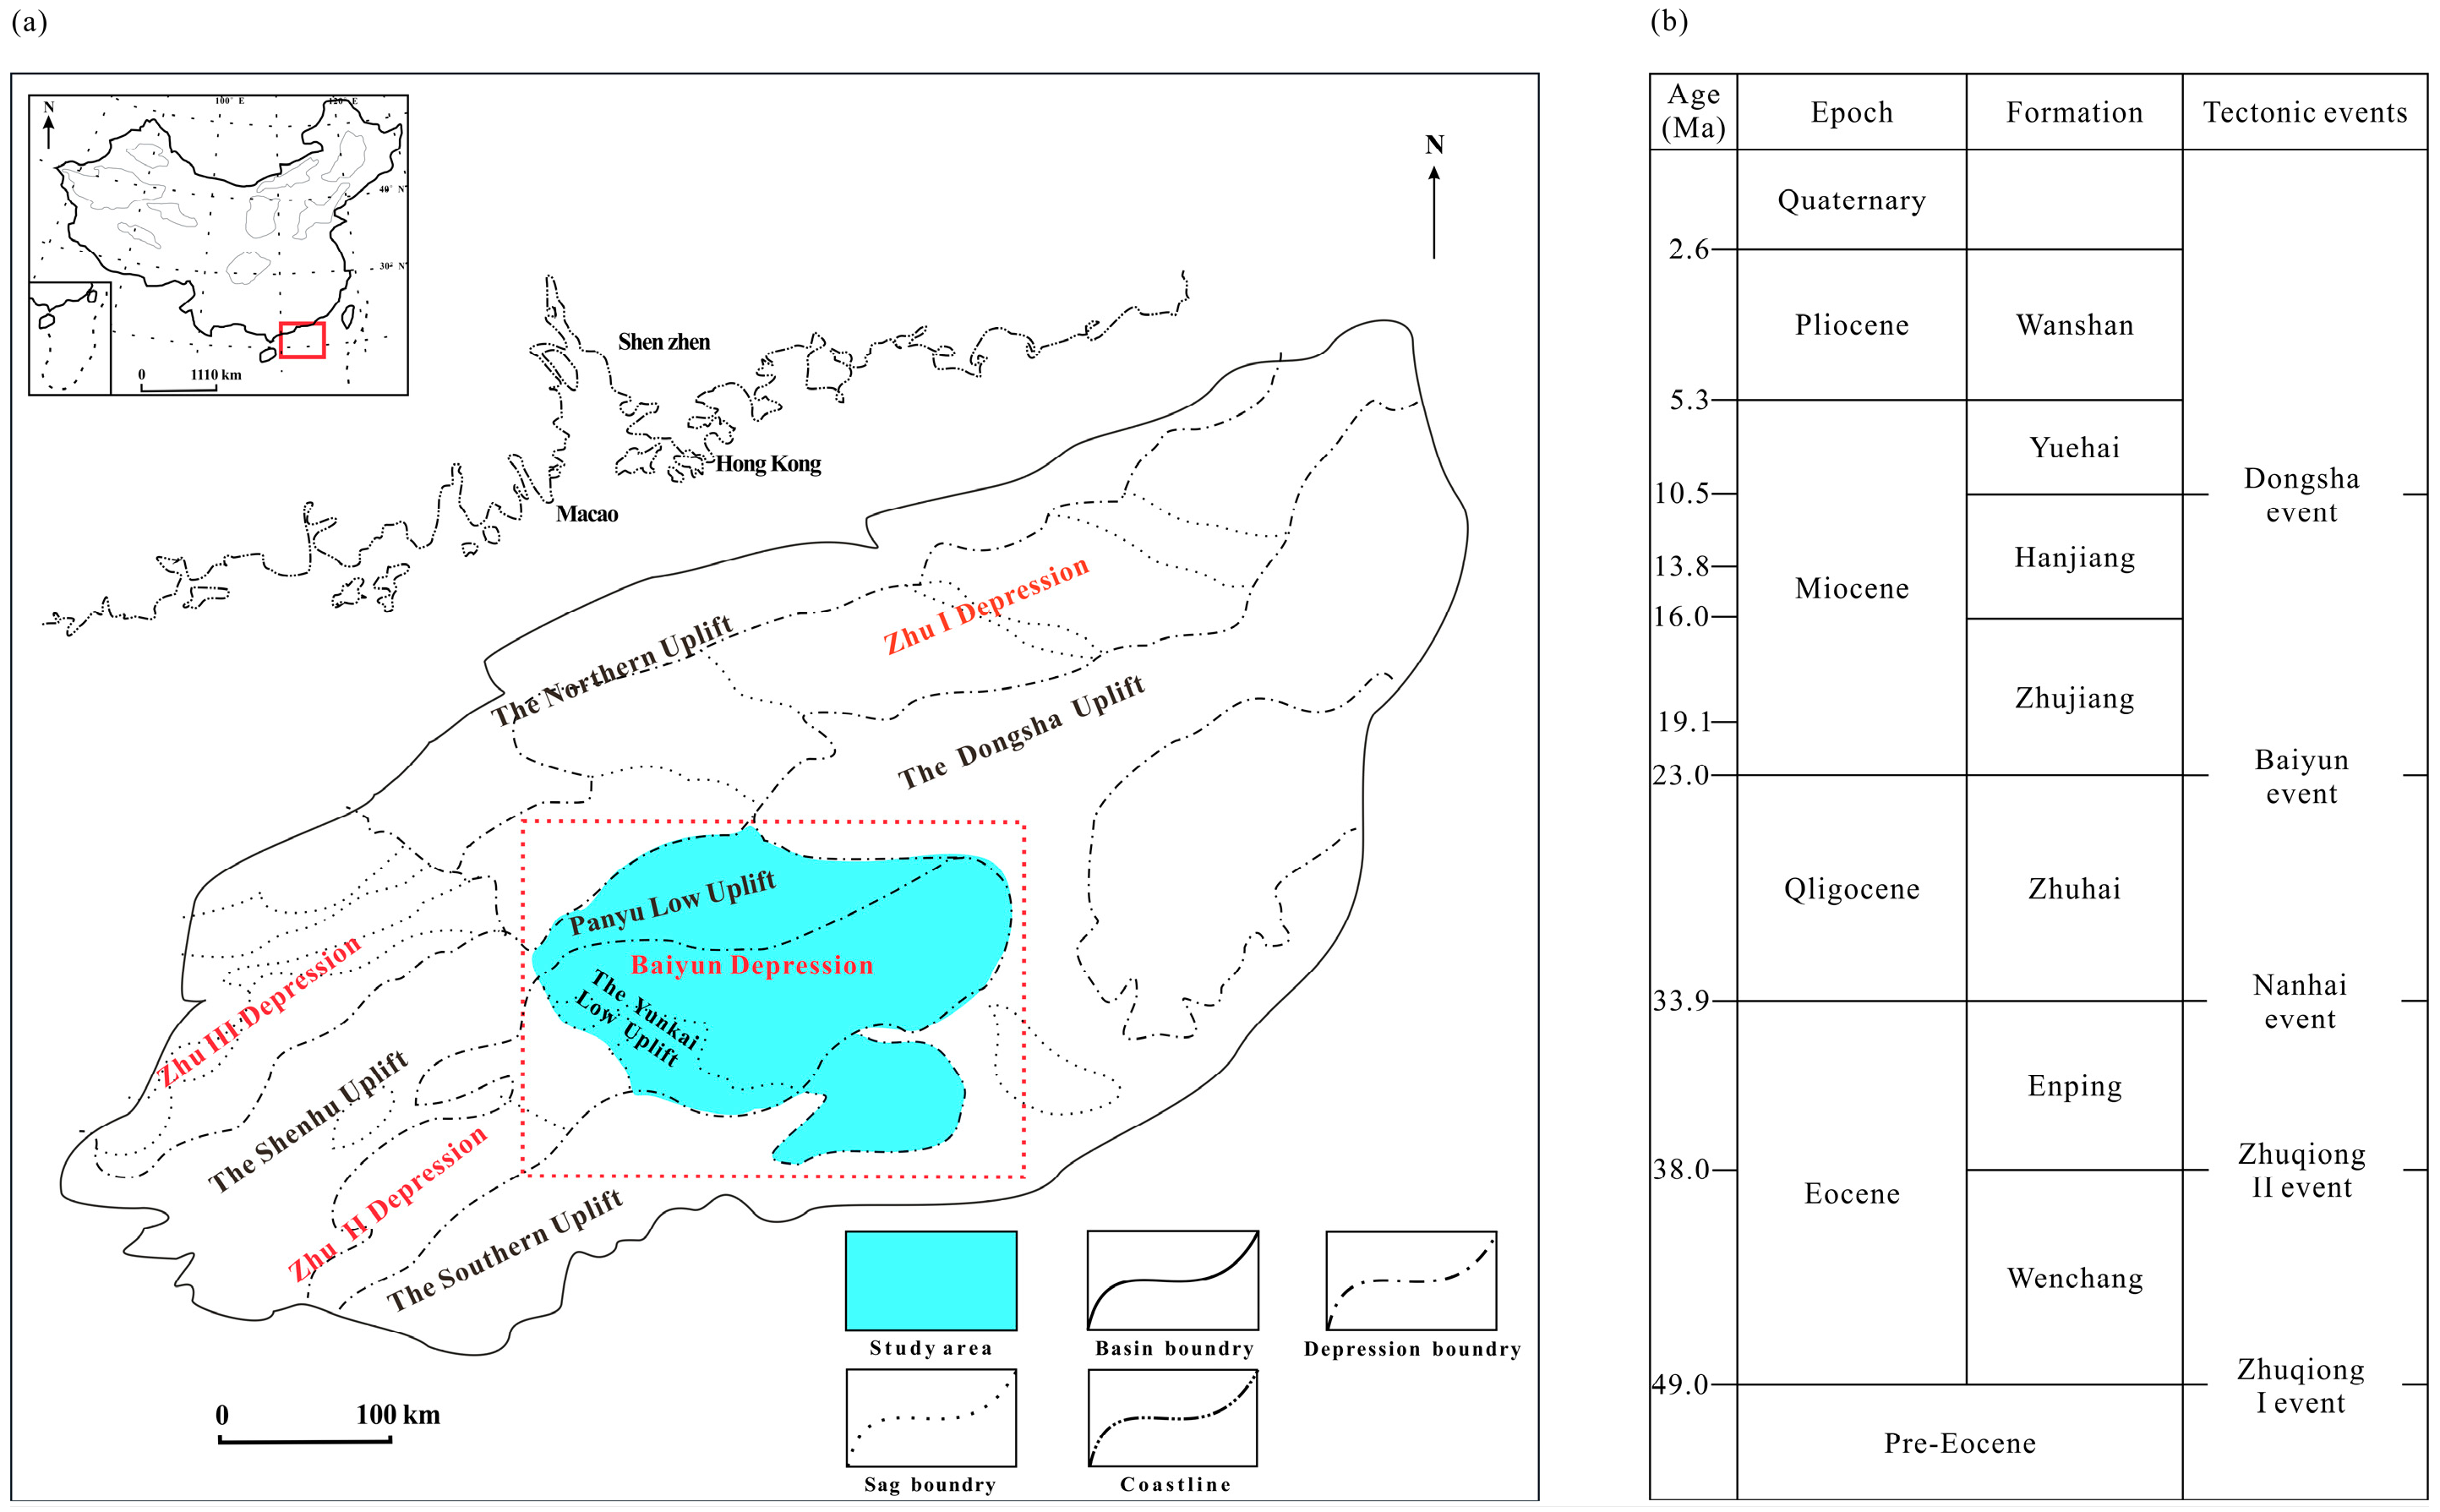
Figure 1. (a) Location map of the Baiyun Depression. (b) Tectonic evolution of the Baiyun Depression (modified from [52]).
Jmse 13 02078 g001
Figure 2. Flow chart for rock physics modeling of shallow unconsolidated formations.
Jmse 13 02078 g002
Figure 3. Workflow for iterative calculation of porosity and saturation in a three-component system.
Jmse 13 02078 g003
Figure 4. Log response characteristics of the typical reservoir section and non-reservoir section. In the figure, VPW and VSW represent the compressional and shear velocities of water-saturated sediments simulated by the model, while VP and VS represent the elastic wave velocity obtained from the array acoustic log data.
Jmse 13 02078 g004
Figure 5. Cross-plot of logging data from gas-bearing layers and mudstone layers: (a) GR-RT, (b) DT-RT, (c) ZDEN-CNL, (d) ZDEN-DT.
Jmse 13 02078 g005
Figure 6. Identification of gas layers using acoustic velocities. (a) Field example of reservoir identification using proposed method in drilling Well A-1. From top to bottom are compressional velocities and shear velocities, respectively. (b) Identification of gas layers in interval X20–X00 m of Well A-1 are compared to response characteristics of conventional logging curves.
Jmse 13 02078 g006
Figure 7. Cross-plot of resistivity (RT) with compensated density (ZDEN) and compensated neutron (CNL): (a) ZDEN-RT, (b) CNL-RT.
Jmse 13 02078 g007
Figure 8. Composition of clay minerals in the study area. (a) Relative content of clay minerals. (b) The relationship between the I/S and CEC. In the figures, CEC represents the cation exchange capacity and I/S represents the illite–smectite (I/S) mixed-layer content in the clay minerals. The proportion of the illite-smectite mixed layer in the clay minerals is higher and the cation exchange capacity (CEC) increases as the illite–smectite (I/S) mixed-layer content increases.
Jmse 13 02078 g008
Figure 9. Evaluation results of part of Well A-1.
Jmse 13 02078 g009
Figure 10. Evaluation results of part of Well A-2.
Jmse 13 02078 g010
Figure 11. Scatter plot comparing the results from two different methods. Sg_Waxman-Smits represents the gas saturation calculated using the Waxman–Smits model, and Sg_modified represents the gas saturation predicted by the proposed method.
Jmse 13 02078 g011
Figure 12. Statistics for identifying gas layers. “Given interpretation” represents the accurate identification of the gas layers, while “identified by model” represents the results obtained by comparing the simulated and measured acoustic wave velocities.
Jmse 13 02078 g012
Figure 13. Variations in acoustic velocities with saturation in different distributions.
Jmse 13 02078 g013
Figure 14. Variations in acoustic velocities with porosity under different saturation states of a uniform distribution.
Jmse 13 02078 g014
Figure 15. The influence of the key input parameters on the elastic wave velocities. (a) Sensitivity of elastic wave velocities to the bulk modulus of methane gas. (b) Sensitivity of elastic wave velocities to the mineral content and porosity.
Jmse 13 02078 g015
Table 1. Logging data used in this study.
CodeName of Well LogUnit
GRNatural gamma rayAPI
CALCaliperinch
M2R1~M2RXArray induction resistivityOhm·m
P16H~P40HPhase-shift resistivityOhm·m
ZDENDensityg/cm3
CNLCompensated neutronporosity unity
DTAcoustic interval transit timeμs/ft
C1, C2, …TGMud logging%
DSTDrill stem test-
VP, VSArray acoustic loggingm/s
Table 2. Constants used for modeling.
ConstituentBulk Modulus (GPa)Shear Modulus (GPa)Density (g/cm3)
Quartz36452.65
Clay20.96.852.58
Water2.501.032
Methane gas0.100.23
Table 3. The related parameters in the calculations.
ParametersTypes/Values
Matrix compositionQuartz and clay
Critical porosity40%
Coordination number8.5
Convergence tolerance0.1%
Table 4. Response characteristics of different types of gas layers.
TypeResistivity (Ω·m)Crossover of Neutron–Density Logging
Class I>2Clear crossover (marked by the yellow filling in the figure)
Class II>2Weak crossover (with no filling in the figure)
Class III1.2–2Weak crossover (with no filling in the figure)
Table 5. Comparison of evaluation results from two calculation models for gas-bearing reservoirs.
Well NameLayer
Number
Gas Saturation (%)Absolute
Error
Mean
Modified MethodWaxman–SmitsAbsolute Error
A-1139.12%34.41%4.71%4.55%
242.44%44.67%2.23%
347.20%41.84%5.36%
436.60%39.04%2.44%
544.26%41.03%3.23%
644.07%35.61%8.46%
733.92%39.36%5.44%
A-2839.72%42.06%2.34%6.11%
941.04%49.12%8.08%
1031.2%28.19%3.01%
1133.92%47.06%13.14%
1240.88%38.16%2.72%
1341.26%36.19%5.07%
1430.41%32.77%2.36%
1542.27%30.11%12.16%
Disclaimer/Publisher’s Note: The statements, opinions and data contained in all publications are solely those of the individual author(s) and contributor(s) and not of MDPI and/or the editor(s). MDPI and/or the editor(s) disclaim responsibility for any injury to people or property resulting from any ideas, methods, instructions or products referred to in the content.