Article

Numerical Modeling of Wave Hydrodynamics Around Submerged Artificial Reefs on Fringing Reefs in Weizhou Island of Northern South China Sea

1
Guangxi Laboratory on the Study of Coral Reefs in the South China Sea, Coral Reef Research Center of China, School of Marine Sciences, Guangxi University, Nanning 530004, China
2
School of Resources, Environment and Materials, Guangxi University, Nanning 530004, China
3
Southern Marine Science and Engineering Guangdong Laboratory (Guangzhou), Guangzhou 511458, China
4
College of Civil Engineering, Qingdao University of Technology, Qingdao 266033, China
5
School of Engineering & Built Environment, Griffith University Gold Coast Campus, Southport, QLD 4222, Australia
*
Author to whom correspondence should be addressed.
J. Mar. Sci. Eng. 2025, 13(11), 2031; https://doi.org/10.3390/jmse13112031
Submission received: 11 September 2025 / Revised: 16 October 2025 / Accepted: 21 October 2025 / Published: 23 October 2025
(This article belongs to the Section Ocean Engineering)

Abstract

This study numerically investigates wave transformation and setup processes across fringing reefs, focusing on artificial reef configuration effects under varying tidal conditions and incident wave parameters. The OpenFOAM-based waves2Foam model simulates hydrodynamic processes along reef profiles containing a fore-reef slope and reef flat. Following validation against laboratory data, the model simulates cross-shore wave height attenuation and setup within fringing reef systems. The results demonstrate that reef flat water depth substantially modulates wave dynamics: during low tide, intensified wave breaking elevates the maximum wave height and setup by up to 45.7% and 78.5%, respectively, compared to high-tide conditions. Furthermore, this water depth critically governs the reef configuration’s influence on wave energy dissipation efficiency. Under high tide, additional reef rows increase the peak wave height by 5.2% while reducing wave setup by 10.5%. In contrast, expanded reef spacing reduces the peak wave height by 2.1% and decreases the peak wave setup by 2.4%. The temporal evolution of wave reflection ( K R ) and transmission ( K T ) coefficients reveals that shallow-water conditions amplify wave reflection while diminishing transmission capacity, as tidal variations directly regulate wave propagation mechanisms through water depth modulation. At the outer reef flat boundary, K R and K T values for existing artificial reefs exhibit variations below 5% across all tidal phases, row configurations, and spacing combinations. Consequently, current reef structures provide limited control over wave transmission in fringing reef terrains, indicating that structural modifications such as increasing reef elevation or deploying reefs on the fore-reef slope could enhance attenuation performance.

1. Introduction

Coral reefs represent highly complex underwater ecosystems that support more than 25% of all known marine species, and their morphological characteristics exhibit substantial variation depending on the geological setting. Fringing reefs function as effective natural barriers that significantly dissipate wave energy, reducing nearshore hydrodynamic disturbance and protecting adjacent beaches [1]. Furthermore, waves breaking over complex reef topography generate flows that regulate sediment dynamics, nutrient fluxes, and benthic habitats on reef flats [2]. Consequently, site-specific hydrodynamic assessments are required to assess ecosystem stability.
Research on reef hydrodynamics has evolved since the late 20th century, employing diverse methodologies that include field observations, experimental studies, and numerical modeling. Early investigations extensively characterized wave and wave–current interactions through field campaigns [3,4,5] and wave flume experiments [6,7,8,9,10]. Later, numerical simulations of hydrodynamic processes in reef environments became established research approaches [11,12,13,14,15,16]. More recently, Yao et al. [17] examined the influences of tidal currents on the vertical structure of surf zone currents within coral reefs, including wave height, wave setup, turbulent kinetic energy, and Reynolds shear stress intensity. In contrast, Watanabe et al. [18] demonstrated that the structures of the reef slope at the micrometer scale enhance turbulence and the transport of nutrients driven by waves, yet they minimally affect wave energy density across reef flats or overall storm wave dissipation; these processes remain dominated by the slope, crest, and flat morphology of the macrometer scale of the reef. Wang et al. [19] further examined realistic topographical effects, quantifying how the height, position, and seaward slope gradient of a reef ledge affect secondary wave breaking and reflection during tsunami propagation.
Artificial coral reefs provide dual ecological restoration and coastal protection benefits by offering alternative habitats for degraded coral ecosystems. Fadli et al. [20] evaluated artificial reef modules’ potential for habitat rehabilitation in degraded areas of Aceh, Indonesia, demonstrating effectiveness despite limited resilience to large-scale climatic disturbances such as anomalous warming. Corroborating this, Blakeway et al. [21] confirmed successful coral settlement and community development in nearshore artificial structures in high-turbidity environments of Dampier Harbour, Western Australia, through long-term monitoring. Further supporting evidence emerges from Tanaya et al. [22], whose 29-year observational dataset revealed significantly higher coral cover (predominantly Acropora spp.) on breakwaters versus adjacent natural reefs, establishing artificial structures as viable restoration tools. Knoester et al. [23] subsequently examined how the structural characteristics (e.g., material, orientation) of artificial reefs in southern Kenya influence the survival, recruitment, and recovery of coral fragments of associated fish and invertebrate communities. In addition, Reguero et al. [24] identified coral reef degradation as a primary driver of coastal erosion in Grenville Bay, proposing that engineered reef structures simultaneously attenuate wave energy, modify wave direction, and provide marine habitats. In summary, these investigations demonstrate that scientifically designed artificial reefs enhance biodiversity conservation and coastal resilience through the construction of three-dimensional habitats.
The hydrodynamic processes surrounding artificial reefs (ARs) exhibit strong dependencies on site selection, structural configuration, and ecological results. Webb and Allen [25] identified a significant negative correlation between the wave transmission coefficient and relative height for non-rock ARs, indicating limited attenuation capacity; conventional rubble mound formulae were shown to overestimate attenuation by neglecting porosity. Srineash and Murali [26] subsequently demonstrated that reef-induced wave breaking (RIB) constitutes the primary dissipation mechanism in modular porous ARs under varying crest widths, depths of submergence, and wave conditions. Consequently, the controlled adjustment of the relative depth of submergence can actively induce RIB for design optimization. In contrast, van Gent et al. [27] established that vertical impermeable screens in submerged ARs significantly reduce transmission by impeding orbital velocities, yielding a unified hyperbolic tangent-based empirical formula for transmission coefficient ( K T ) predictions across submerged and emergent structures. Complementarily, Ghiasian et al. [28] quantified the performance of a trapezoidal AR model, achieving larger than 35% incident wave height reduction and 63% energy dissipation; the incorporation of Acropora cervicornis skeletons further enhanced frictional resistance, providing additional reductions of 10% in wave height and 14% in energy. Huang et al. [29] differentiated dissipation mechanisms: solid ARs predominantly rely on wave breaking, while permeable designs utilize continuous internal drag forces, leading to a novel predictive formula based on effective water depth. Based on this, Huang et al. [30] developed a parameterized phase-averaged model that separately quantifies the dissipation of breaking, the dissipation of the reef drag, and the reflection processes. Their analysis revealed that reduced porosity or increased crest length substantially enhances drag-dominated attenuation efficiency, whereas wave reflection contributes minimally.
In summary, current artificial reef applications focus predominantly on fishery resource enhancement, while the hydrodynamic evaluation of wave attenuation efficacy for reefs in coral habitats remains critically insufficient. The new scientific contributions of the present work are outlined here:
  • The novel integration of in situ bathymetric measurements with submerged artificial reef data, thereby enabling the systematic quantification of morphology–hydrodynamic interactions.
  • A comprehensive analysis of wave hydrodynamics at fringing reef sites using field hydrological data, which evaluates the wave attenuation efficacy of deployed artificial reef configurations under diverse wave regimes.
In this study, a comprehensive numerical investigation of hydrodynamics at coral reef sites on Weizhou Island is conducted, focusing on wave transformation, breaking, and setup processes. The OpenFOAM-based waves2Foam model [31] is adopted in this study, which solves Reynolds-averaged Navier–Stokes equations to simulate complex flow dynamics over fringing reefs characterized by fore-reef slope and reef flat geometry. Before application, the model undergoes rigorous validation against laboratory experiments to ensure an accurate simulation of wave profiles at the reef front. Using the validated model, the cross-shore characteristics of the wave-induced setup and wave height attenuation under varying deep-water conditions are subsequently examined.

2. Field Investigation

Weizhou Island (21°00′–21°10′N, 109°00′–109°15′E; Figure 1a) hosts a relatively high-latitude coral reef system in the South China Sea. This system potentially functions as a thermal refuge under global warming [32], with well-developed reefs primarily distributed in shallow northern, southeastern, and southwestern coastal waters. These reefs are dominated by massive coral species, including Porites sp., Favites abdita, and Goniopora stutchburyi [33]. However, significant degradation has reduced average live coral cover to approximately 10.7% [34].
Hydrodynamic investigations focus on a 1.3 km fringing reef section along the southwestern coast of Weizhou Island (Figure 1b). During spring tides, underwater topography surveys employ an ultrasonic depth sounder (RISEN-SFCC; maximum range: 50 m; minimum detection depth: 0.8 m; sampling rate: 1 Hz), covering areas from nearshore shallows (depth ≥ 0.8 m) to deeper offshore zones. Simultaneously, beach profile measurements utilize a high-precision differential GNSS (Leica GS15; horizontal accuracy: 8 mm ± 1 ppm; vertical accuracy: 15 mm ± 1 ppm), extending from the vegetation line to water depths of ≥1 m. These integrated surveys produce the composite cross-sectional bathymetric profile shown in Figure 1c. The specific submerged artificial reef structures adopted in this study, which are deployed in coral restoration initiatives on northern Weizhou Island, appear in Figure 1d.
There is a regular diurnal tidal regime with an annual mean range of 2.35 m in Weizhou Island [35]. An analysis of historical wave data (1973–1995) from the Weizhou Ocean Monitoring Station further identifies south–southwest (SSW) as the predominant wave direction [36]. Following the Code of Hydrology for Harbours and Waterways (JTS 145-2015) [37], wave heights and periods ( H 1 / 3 and T 1 / 3 ) for 5-, 10-, 25-, and 50-year return periods are calculated, yielding respective values of 2.76 m and 7.82 s, 3.15 m and 8.4 s, 3.55 m and 8.97 s, and 3.86 m and 9.43 s. These offshore incident wave parameters, implemented as regular waves in the model simulations, are detailed in Table 1.

3. Numerical Model

3.1. Governing Equations

For an incompressible viscous fluid, the wave domain is governed by the Reynolds-averaged Navier–Stokes equations [31], which encompass both the continuity and momentum equations:
· U = 0 ,
ρ U t + · ( ρ U U T ) = p * g · X ρ + · ( μ U + ρ τ ) + σ T κ α 1 α 1 ,
in which U  = the velocity vector; ρ  = the density of the fluid; p *  = the pseudodynamic pressure; μ  = the dynamic molecular viscosity; X  = the position vector; τ  = the specific Reynolds stress tensor; σ T  = the surface tension coefficient; and κ α 1  = the curvature of the interface. The volume fraction index ( α 1 ) is introduced to track the fluid surface (that is, α 1 is 0 for air and 1 for water); thus the distribution of α 1 is modeled by an advection equation.
α 1 t + · [ U α 1 ] + · [ U r α 1 ( 1 α 1 ) ] = 0 ,
where U r  = the relative velocity, and the properties of the mixture are calculated as follows:
Φ = α 1 Φ w + ( 1 α 1 ) Φ a ,
in which Φ w and Φ a are any water and air properties, respectively. In addition, the k ϵ model [38] is adopted to simulate the turbulence effect of breaking waves near the front reef slope.

3.2. Numerical Setup and Mesh Scheme

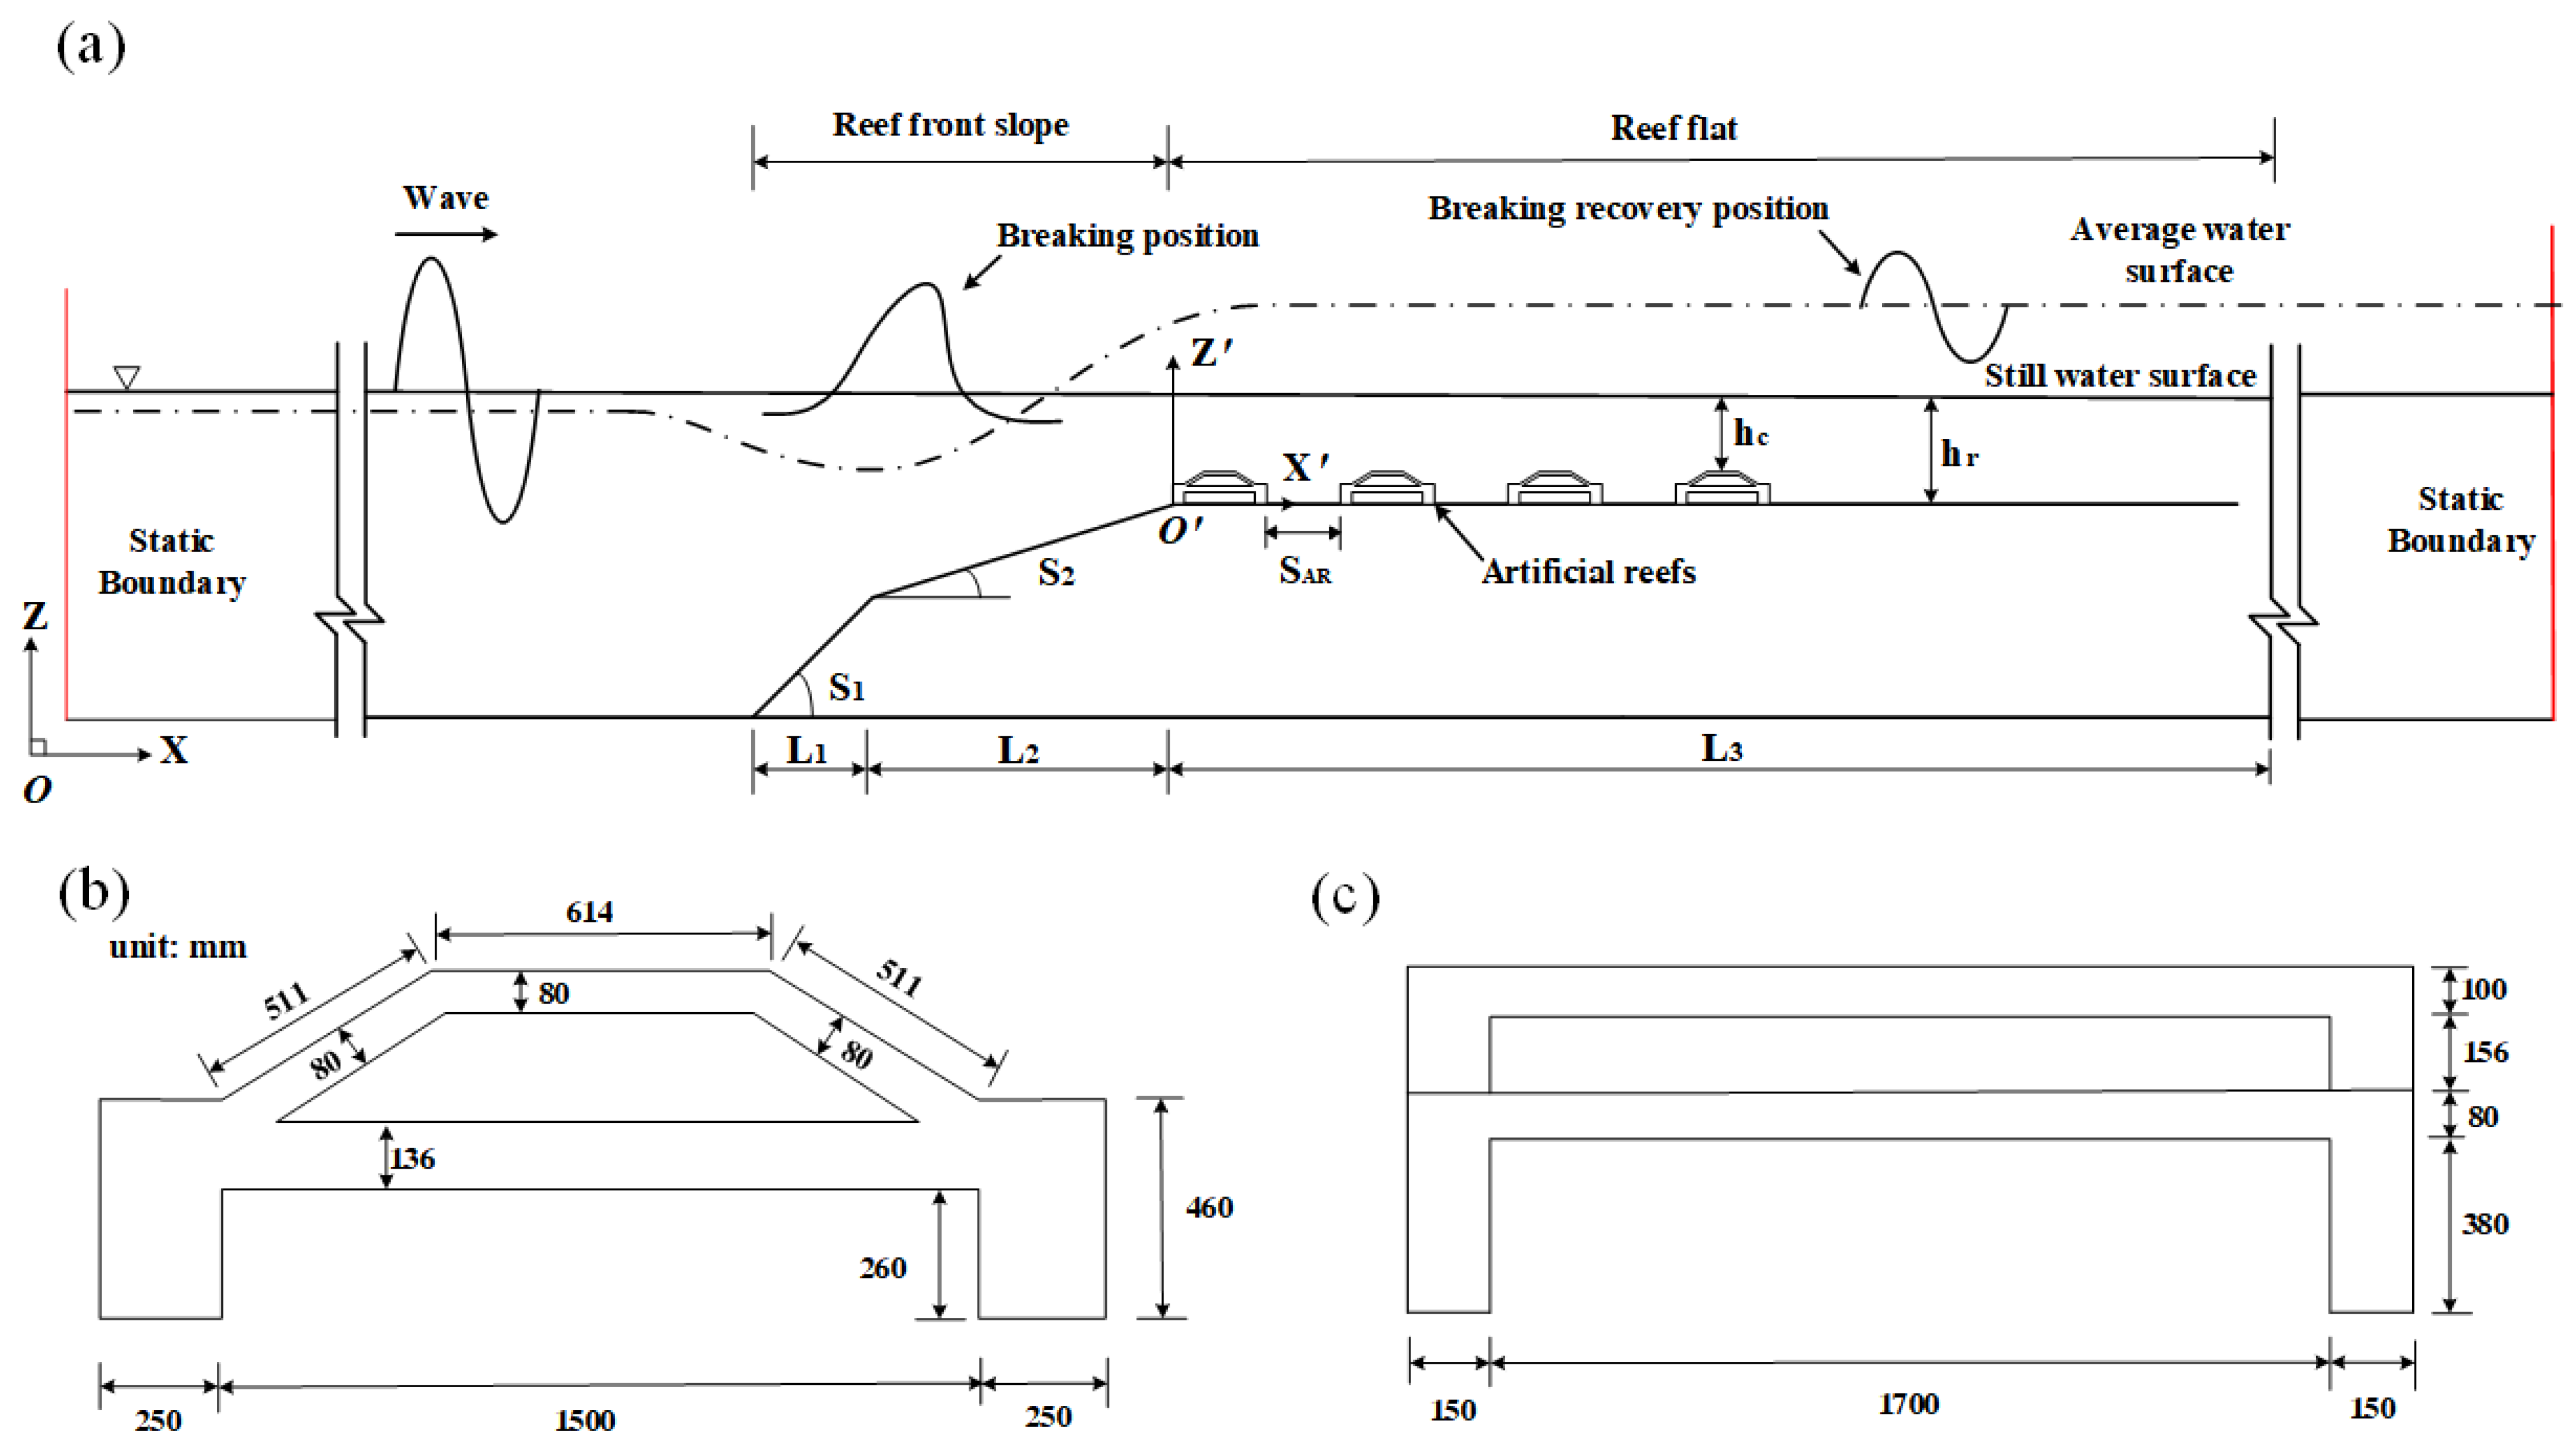
Specifically, Figure 2a illustrates the computational domain with a total length of 900 m, coinciding with the fore-reef slope toe. From this point, two onshore slopes (gradient 1:23) extend landward for 67.62 m and 190.26 m, respectively, transitioning to an approximately horizontal reef flat spanning 891.83 m (see Table 1). The boundary conditions consist of the following: (1) atmospheric pressure at the top boundary; (2) zero-gradient conditions at lateral boundaries; and (3) no-slip conditions at both the seabed and reef surfaces. It is noted that this study employs a two-dimensional approach. Wave generation employs second-order Stokes theory to produce monochromatic waves at the offshore (left) boundary. To suppress wave reflections, explicit relaxation absorption with weighting function w R [ 0 , 1 ] adjusts the solution variables ( Φ ) within 100 m absorption zones at both domain ends, as indicated by the red lines. The artificial reef geometry, illustrated in Figure 2b,c, is imported as an STL file. Subsequently, the background mesh is generated using OpenFOAM’s surfaceFeatureExtract and snappyHexMesh utilities, incorporating local refinement near the reef surface to resolve its geometric features accurately.
To balance computational accuracy and efficiency, the domain along the wave propagation direction is divided into three regions: a wave generation zone (0–150 m), a reef zone (150–800 m), and a wave absorption zone (800–900 m), with non-uniform gridding. Grid sizes in the X-direction are 0.8 , 0.4 , and 0.8 m , while the corresponding Z-direction dimensions are 0.1 , 0.05 , and 0.1 m . Finer resolution is employed near the free surface within the reef zone where significant wave deformation occurs.

3.3. Model Validation

To validate the numerical model, this study replicates three physical experiments simulating hydrodynamic processes induced by regular and solitary waves over varying coral reef topographies [10,19,39]. The key experimental parameters corresponding to the validation cases are tabulated in Table 2. To quantitatively assess model performance, the skill value [40] is adopted, defined as follows:
skill = 1 | X m o d e l X o b s | 2 | X m o d e l X o b s ¯ | + | X o b s X o b s ¯ | 2
where X m o d e l is the predicted value, X o b s is the measured value, and the overbar represents the average value. Then a skill value of 1 is assigned to a perfect model result and 0 to an obvious predictive error.

3.3.1. Validation 1

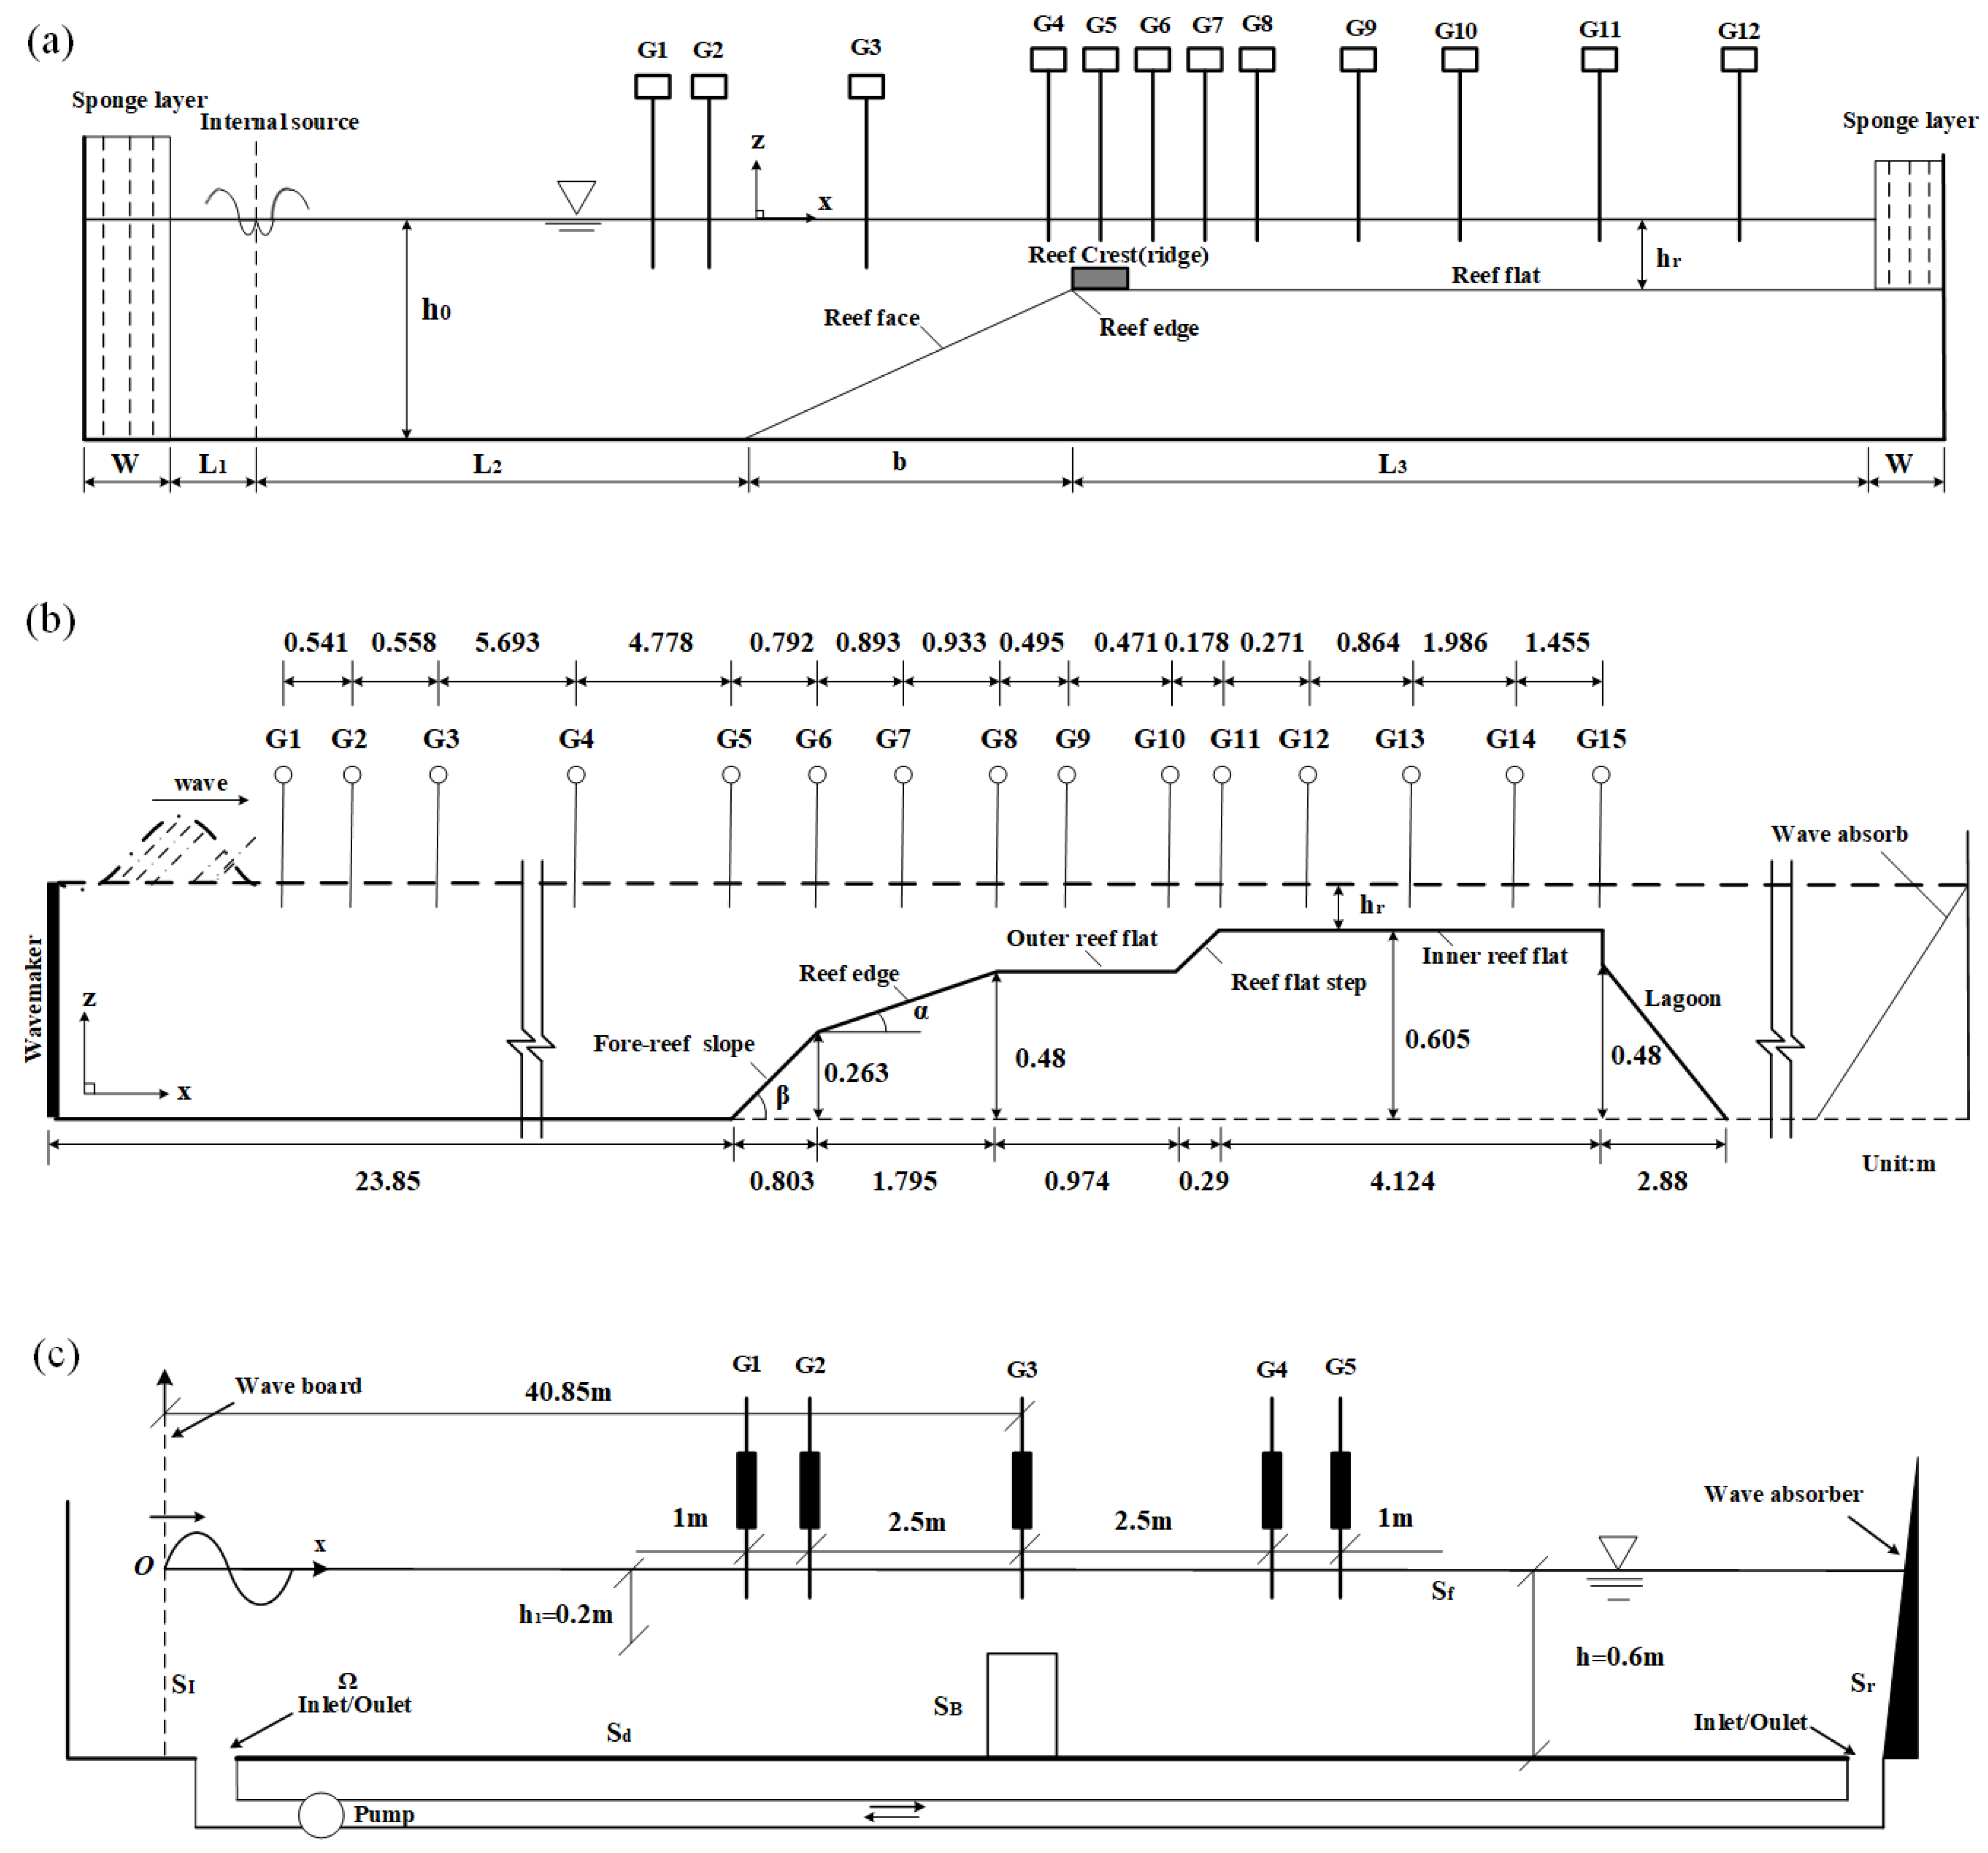
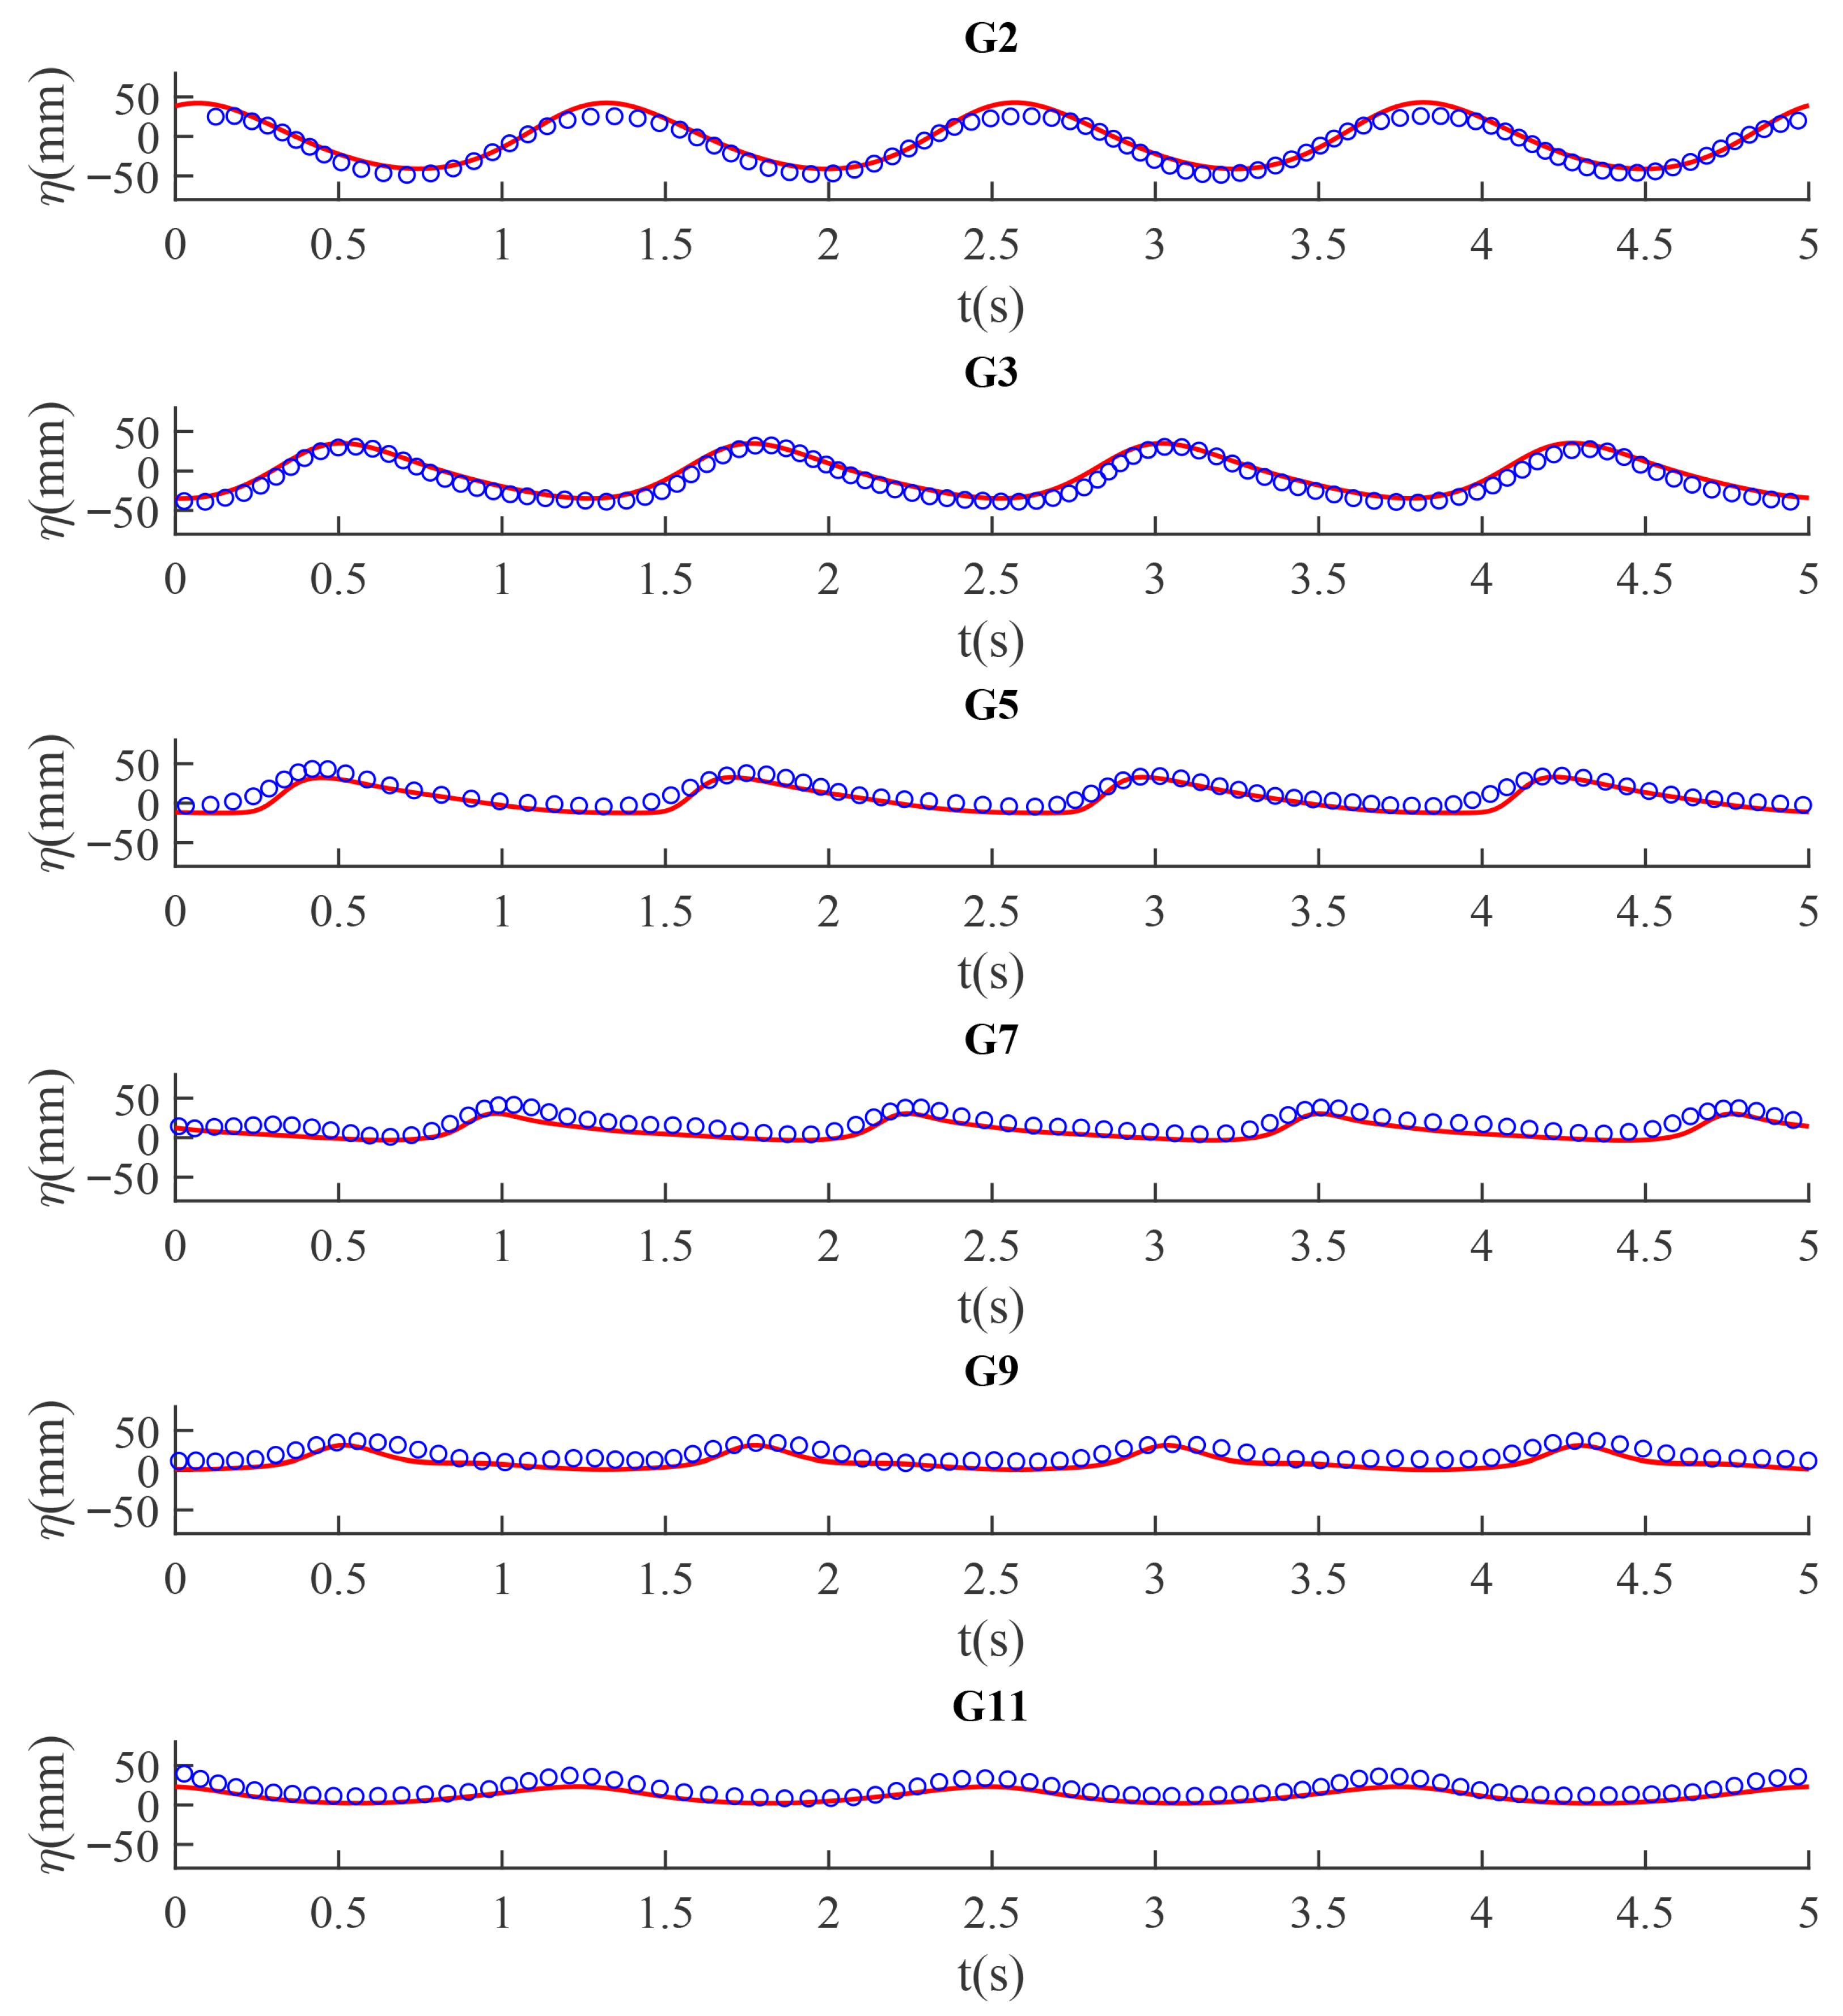
The experiments of Yao et al. [10] are conducted in a custom flume (36.0 m long × 0.55 m wide × 0.6 m deep; see Figure 3a). A piston-type wave maker is installed at one end of the flume to generate the designed waves. Furthermore, two simplified fringing reef configurations are investigated: a steep reef slope with a 1:6 gradient and a 7 m flat section and a reef edge ridge represented by a rectangular box measuring 55 × 50 × 5 cm. Twelve wave gauges (G1–G12) are strategically positioned to quantify wave transformation across the reef topography. For model validation, the monochromatic wave scenario ( T = 1.25 s, H = 0.095 m, and h r = 0.1 m) is reproduced and compared with laboratory measurements. The temporal variation in free-surface elevation (see Figure 4) is strongly affected by the reef crest, which leads to reduced skill values at the reef flat (G9 and G11). However, the overall skill values remain above 0.7.

3.3.2. Validation 2

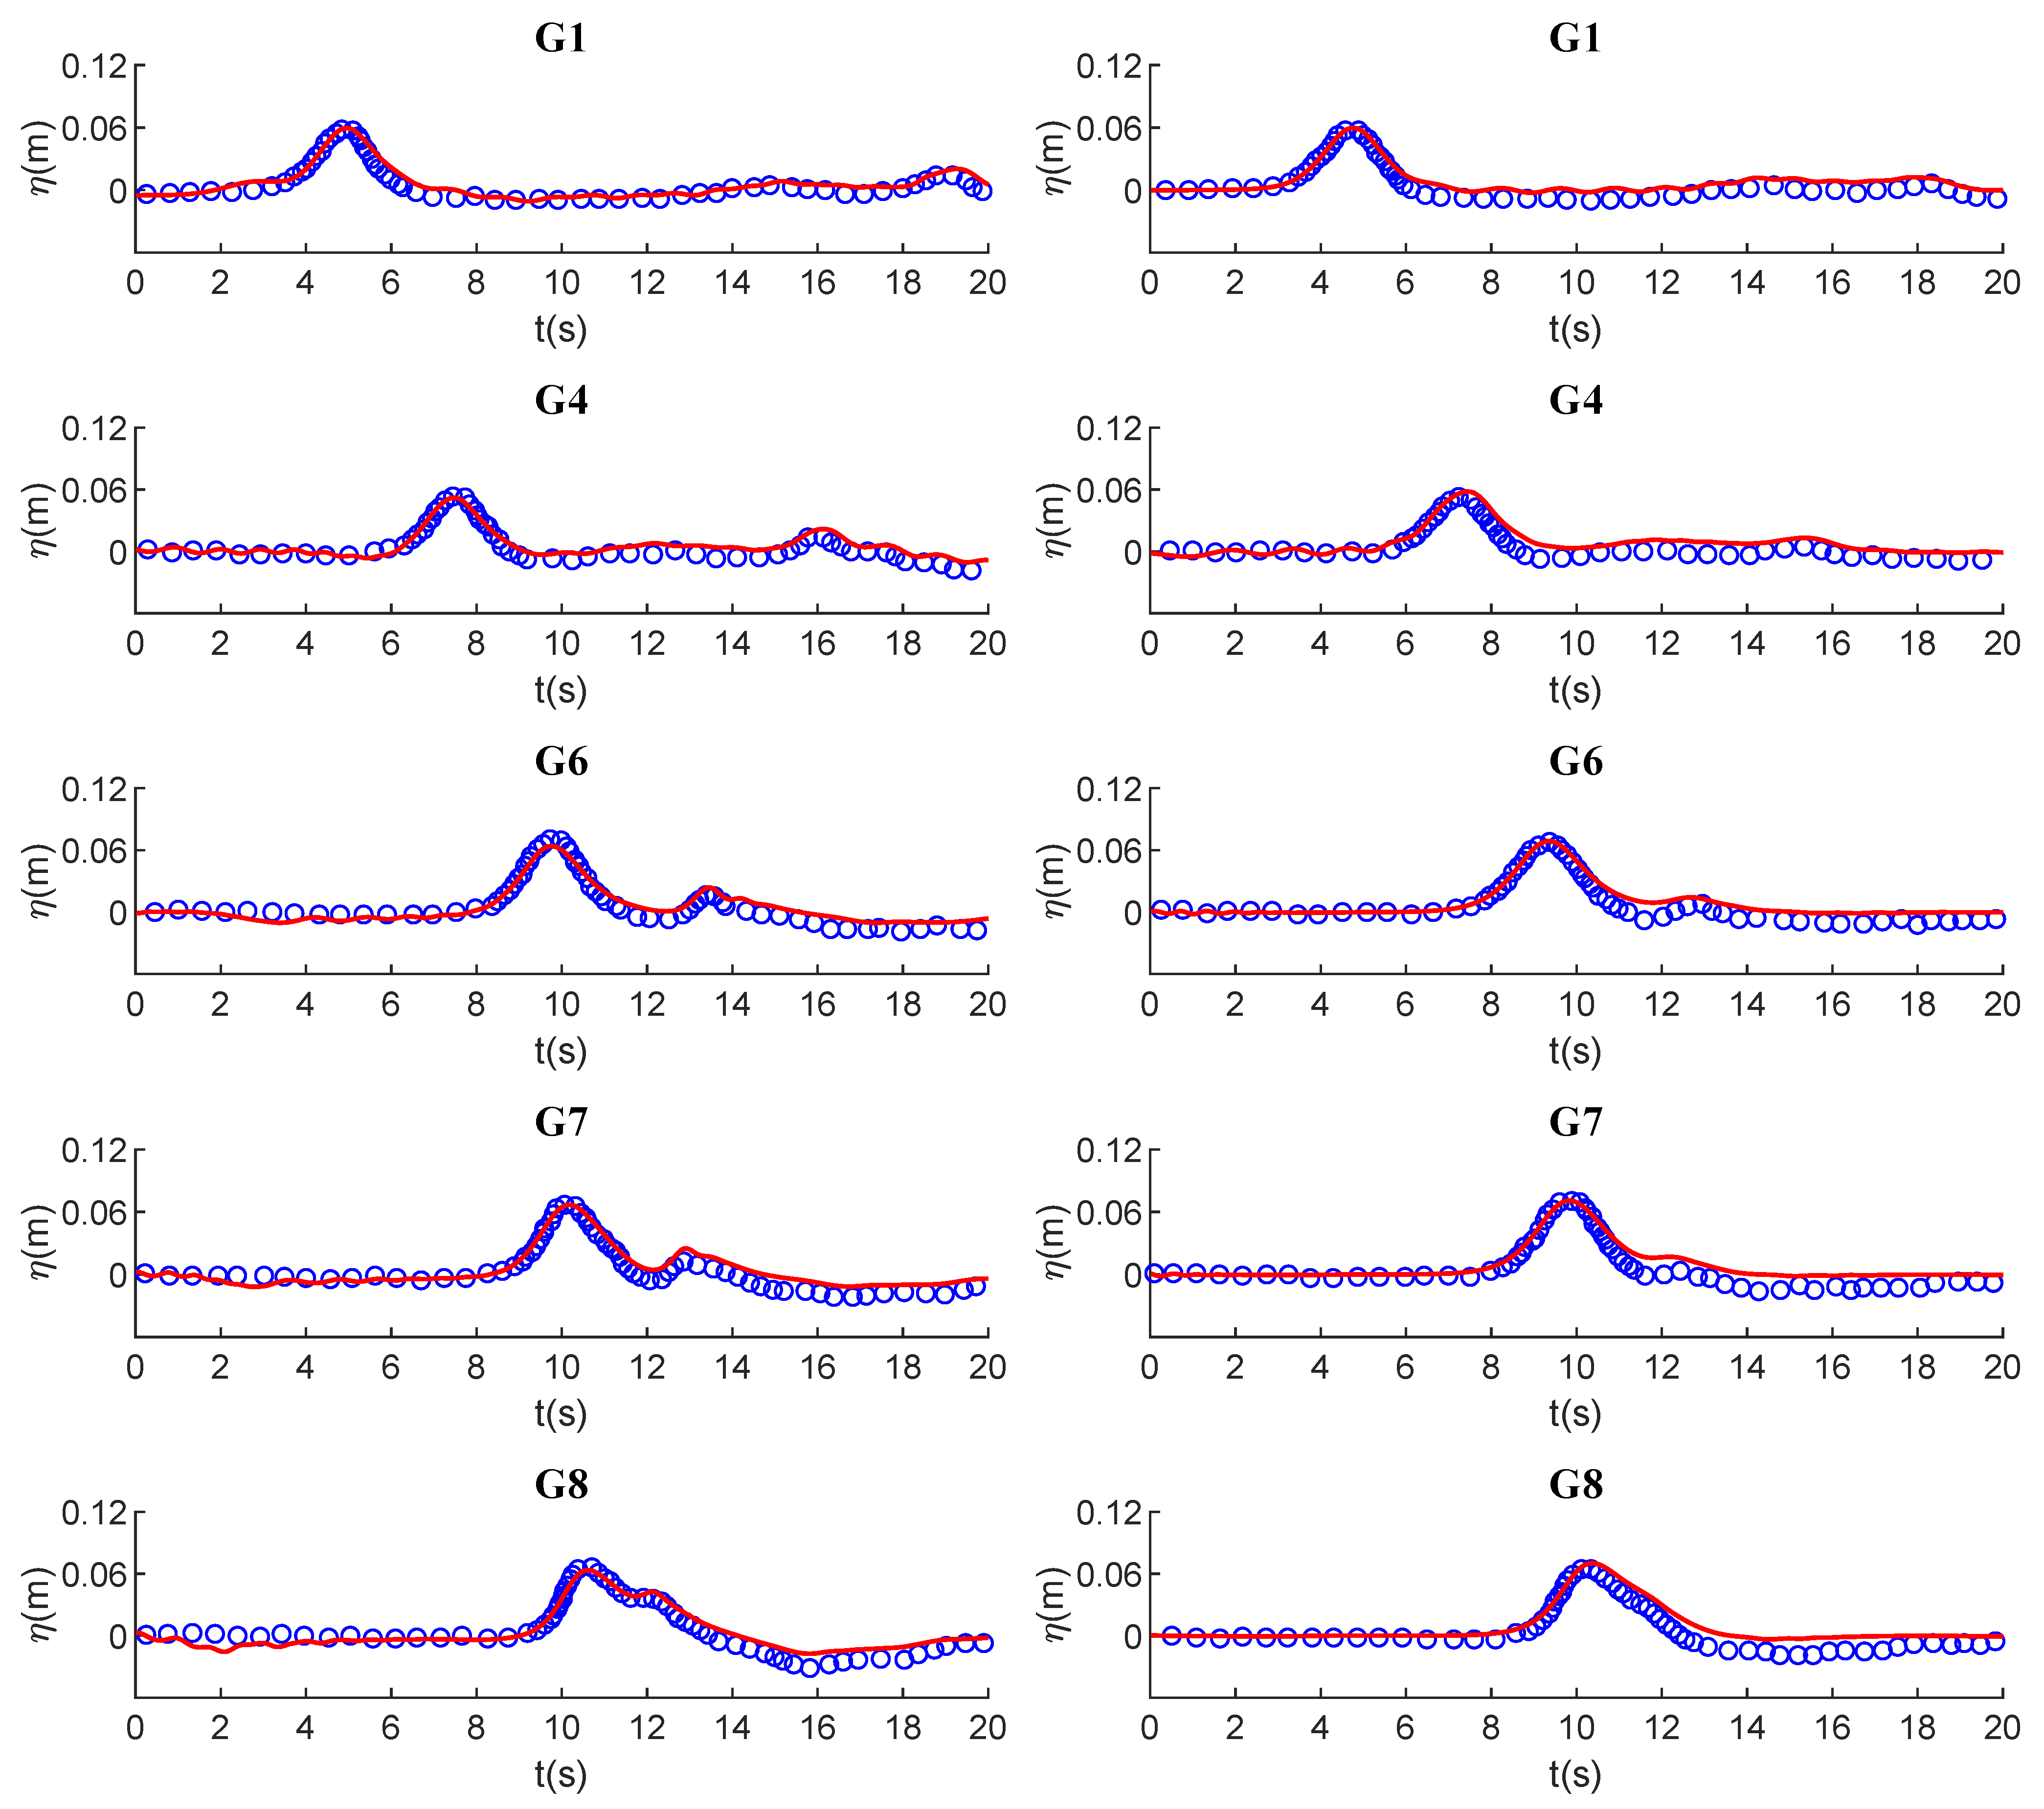
The experimental study of Wang et al. [19] is conducted in a wave flume measuring 45 m in length, 0.8 m in width, and 1 m in depth, which contains a geometrically scaled ( 1 : 40 ) reef model (see Figure 3b). A flap-type wave maker generates solitary waves for this study. The model topography comprises a fore-reef slope, a reef step, and a lagoon, interconnected by a 1 : 2.32 slope that links the outer and inner reef flats. The investigation considers four distinct water depths over the inner reef flat ( h r = 0 , 0.025 , 0.05 , and 0.075 m) and five incident wave heights ( H 0 = 0.02 to 0.1 m in 0.02 m increments). The temporal evolution of the free-surface elevation is measured by fifteen strategically placed wave gauges (G1–G15). For validation, experimental cases with H 0 = 0.06 m and water depths of h r = 0 m and 0.05 m are reproduced. A comparison between simulated water levels and experimental data in Figure 5 demonstrates close agreement, with a minimum skill number exceeding 0.94.

3.3.3. Validation 3

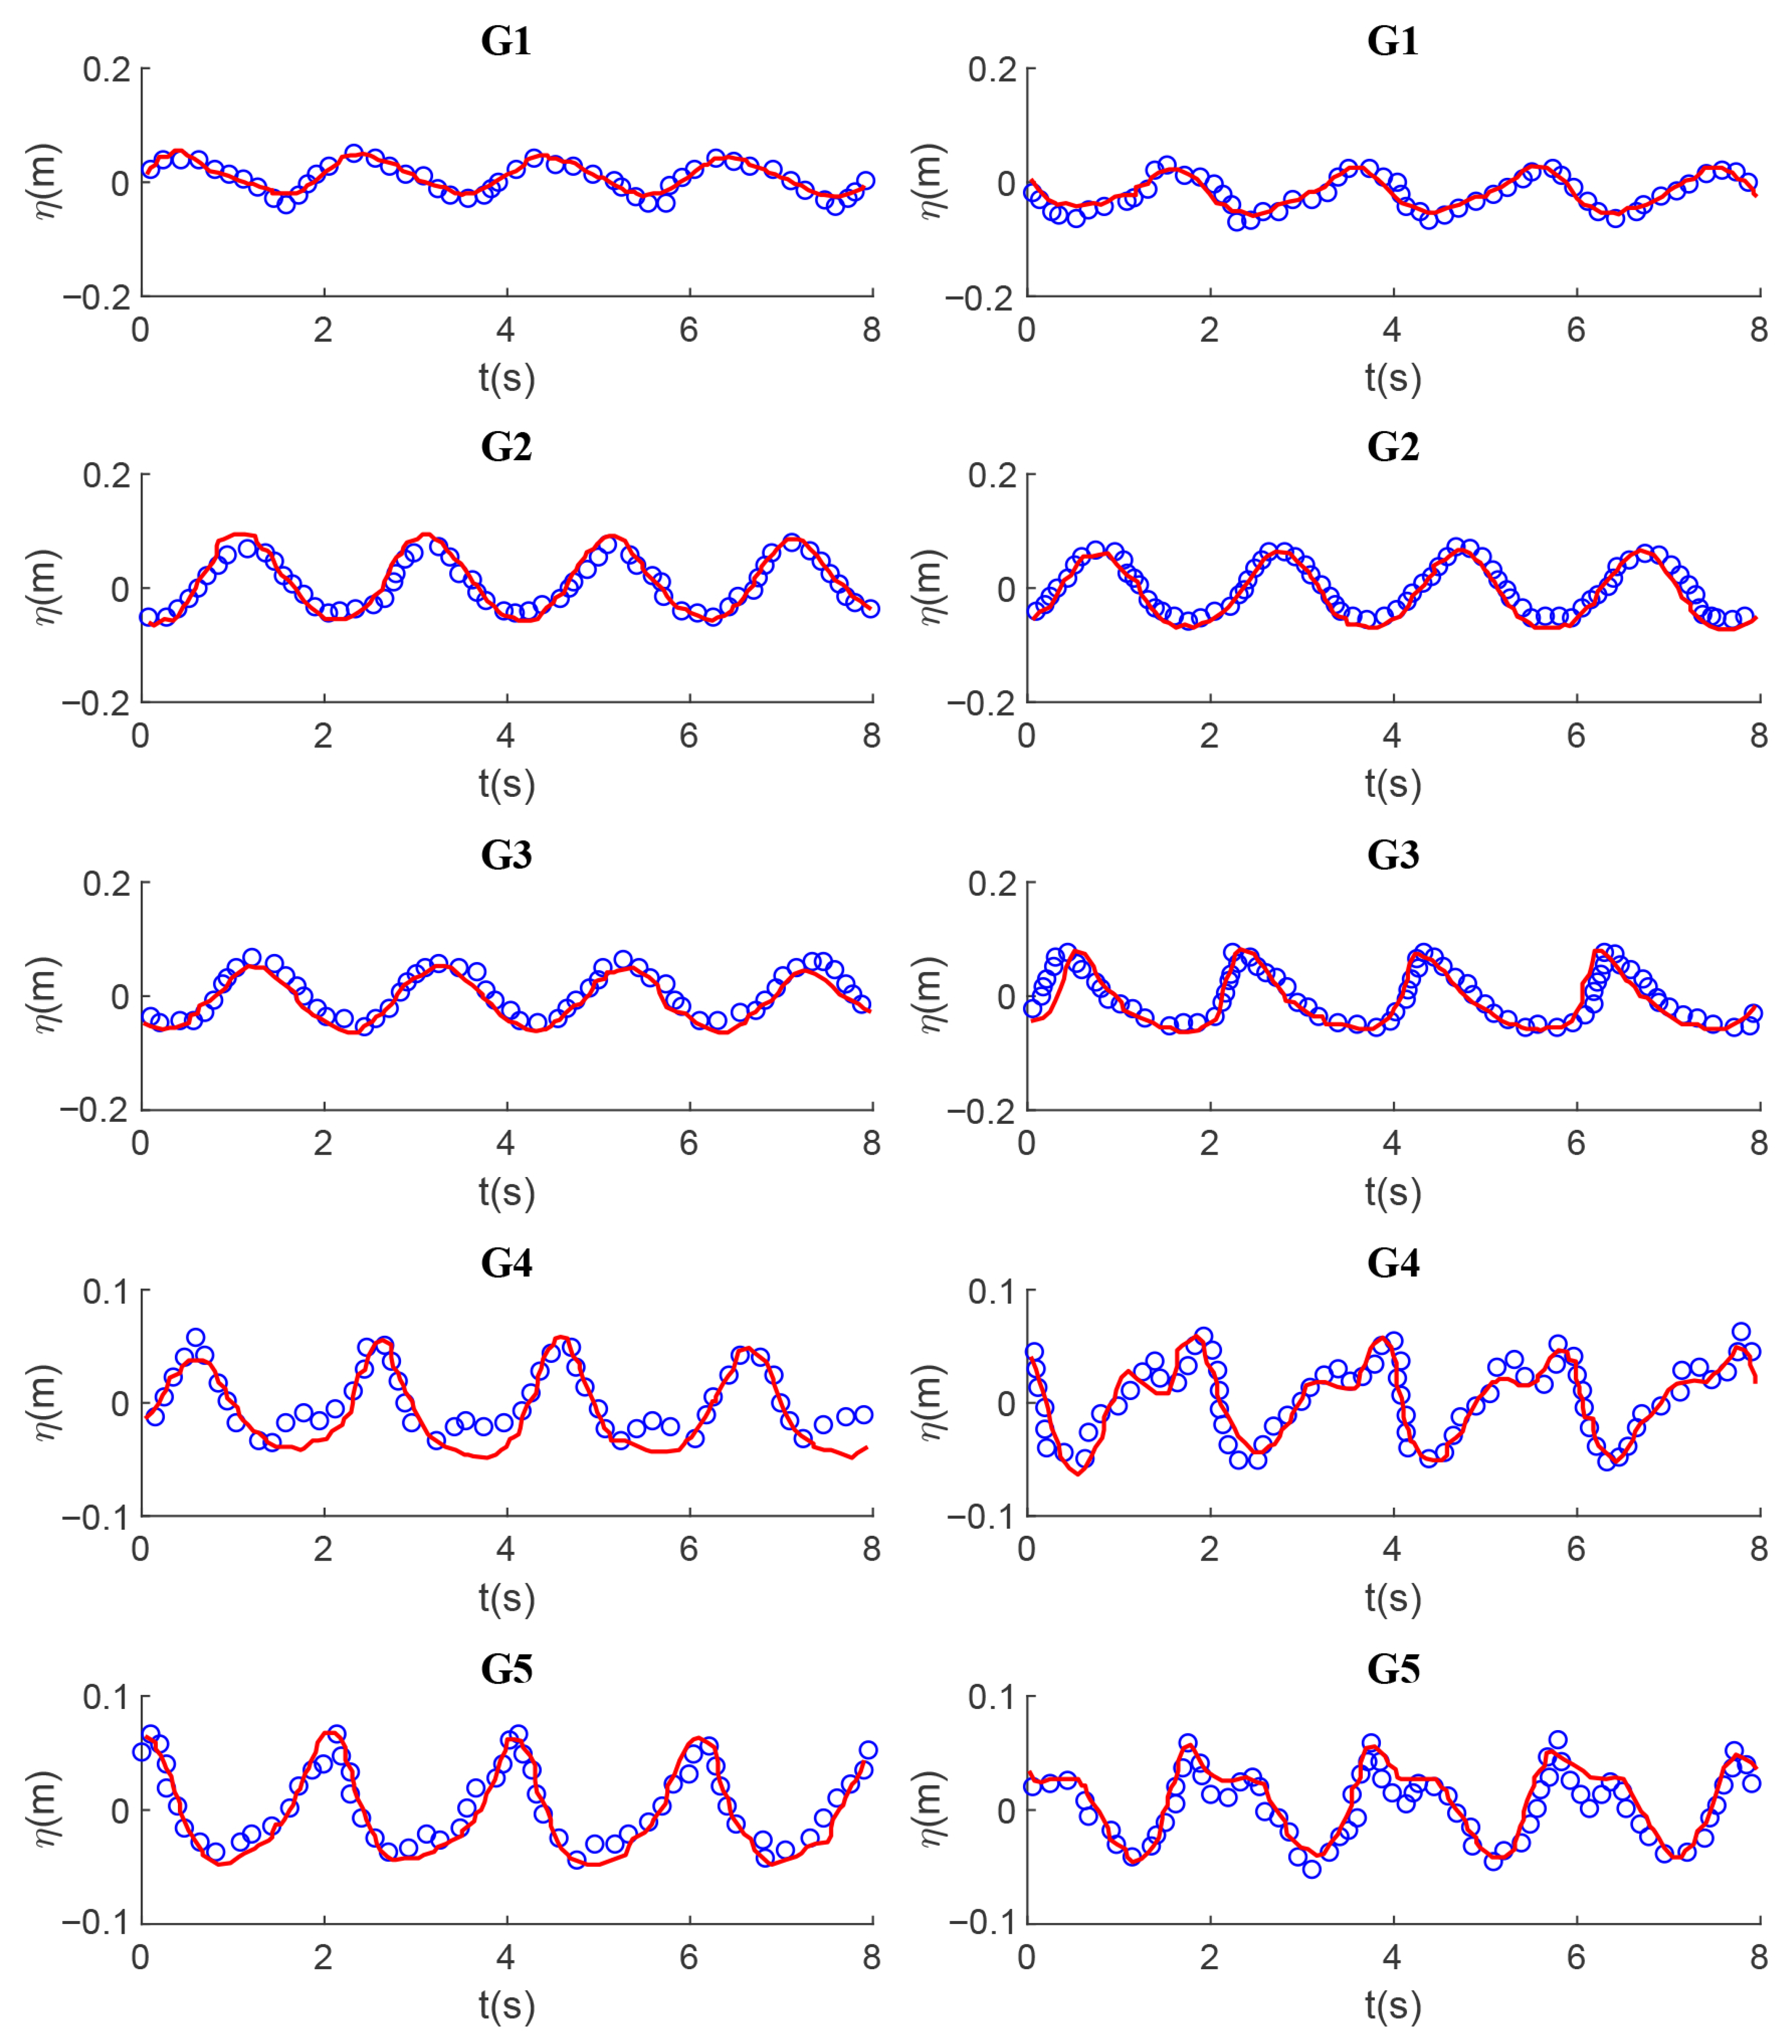
The experimental setup of Chen et al. [39] utilizes a wave flume that measures 69 m in length, 2 m in width, and 1.8 m in height (see Figure 3c). Nonlinear regular waves are produced by a hydraulic piston-type wave generator, with uniform currents supplied through a bidirectional centrifugal pump. Wave propagation over a rectangular submerged breakwater (0.8 m long × 0.5 m wide × 0.4 m high) is investigated under the following and opposing current conditions. Free-surface elevations are recorded at multiple locations surrounding the structure. Figure 6 presents the time histories of free-surface elevations at wave gauges G1–G5 for the wave parameters of T = 2 s and H = 0.108 m. Experimental measurements and numerical predictions are compared for co-current and counter-current scenarios at U c = 0.2 m/s. These results demonstrate robust agreement in wave–current interaction dynamics, where all skill scores exceed 0.9.

3.4. Data Analysis

As mentioned previously, the numerical wave flume originates at the leftmost point (Point O, located at X = 0 m). The reef front slope spans from 172 m to 430 m, followed by a nearly horizontal reef flat section. Artificial reef units are deployed starting from the beginning of the reef flat at 430 m, where the first row is positioned; subsequent rows are arranged shoreward at fixed intervals. Additionally, a local coordinate system originates at 430 m ( O ), where the negative X-direction extends seaward from the reef slope and the positive X-direction extends landward across the reef flat, thus facilitating a comparative analysis of the simulation results. Thereafter, each case is simulated for 400 s, and the data from the final 200 s of stable operation are extracted for post-processing analysis.
In all considered cases, the actual wavelength ( L w = 88–118 m) significantly exceeds the Bragg resonance wavelength corresponding to the artificial reef spacing ( S A R = 2–8 m). This substantial mismatch leads to an exceptionally weak Bragg reflection effect, which is considered negligible. Specifically, the ratio of 2 S A R / L w remains much smaller than 1 across all scenarios. In short, this study employs a two-dimensional numerical model to quantitatively analyze the wave dissipation performance of existing artificial reefs under regular wave conditions.

4. Results and Discussion

This section presents numerical examples demonstrating the engineering applications of the proposed model. Specifically, the variations in wave height ( H w ) and setup ( η ) around both natural and artificial reef structures are analyzed to systematically investigate the effects of incident wave conditions ( H 0 and T 0 ), reef flat water depth ( h r ), tidal range ( Δ d ), and structural parameters ( R A R and S A R ) on wave transformation processes. Furthermore, the wave dissipation capacity of artificial reefs within fringing reef systems is quantified using two metrics: the reflection coefficient ( K R ) measured seaward of the reef front slope and the transmission coefficient ( K T ) across the reef flat.

4.1. Spatial Variation in Wave Height and Setup Across the Reef Profile

4.1.1. Effect of Wave Conditions for Various Return Periods

This subsection simulates four wave conditions representing 5-, 10-, 25-, and 50-year return periods, characterized by offshore wave heights of 2.76 m, 3.15 m, 3.55 m, and 3.86 m with corresponding wave periods of 7.82 s, 8.4 s, 8.97 s, and 9.43 s, respectively. Figure 7a,b demonstrate that under high-tide conditions, the wave height amplification of onshore-propagating incident waves intensifies, with the maximum amplification consistently occurring on the fore-reef slope rather than the reef flat. For an incident wave height of 2.76 m and wave period of 7.82 s, a peak wave height of approximately 3.06 m emerges on the rear section of the fore-reef slope. The wave setup/set-down effects progressively strengthen shoreward, transitioning from set-down to setup near the reef edge ( X = 0 m), followed by the maximum setup developing on the outer reef flat, located within 250 m of the reef edge ( O ). Quantitative analysis reveals that as the offshore wave height increases from 2.76 m to 3.86 m and the wave period extends from 7.82 s to 9.43 s, the maximum wave height on the fore-reef slope rises from 3.06 m to 4.29 m, while the peak setup increases from 0.09 m to 0.2 m, representing respective increases of approximately 40.3% and 123%.
Figure 7c,d demonstrate that enhanced wave shoaling and breaking under low-tide conditions generate pronounced cross-shore gradients in both wave height and setup/set-down distributions while inducing a seaward shift in the corresponding wave transformation zone relative to high-tide scenarios. The maximum wave height persistently concentrates on the fore-reef slope, with the setup/set-down transition point migrating shoreward to this region accompanied by significantly increased variation rates, where the extreme values occur within 100 m of the reef edge. Quantitative analysis reveals that as the offshore wave height increases from 2.76 m to 3.86 m and the wave period extends from 7.82 s to 9.43 s, the peak wave height on the fore-reef slope rises from 3.03 m to 4.42 m, whereas the maximum setup elevates from 0.19 m to 0.33 m, representing increases of 45.7% and 78.8%, respectively. The systematically amplified wave heights and setup magnitudes along the reef under low-tide conditions compared to high-tide conditions confirm the critical regulatory mechanism of the reef flat water level on wave transformation processes, where lower tidal stages enhance shoaling effects to augment wave heights and intensify breaking processes that subsequently steepen setup gradients.

4.1.2. The Effect of the Number of Rows

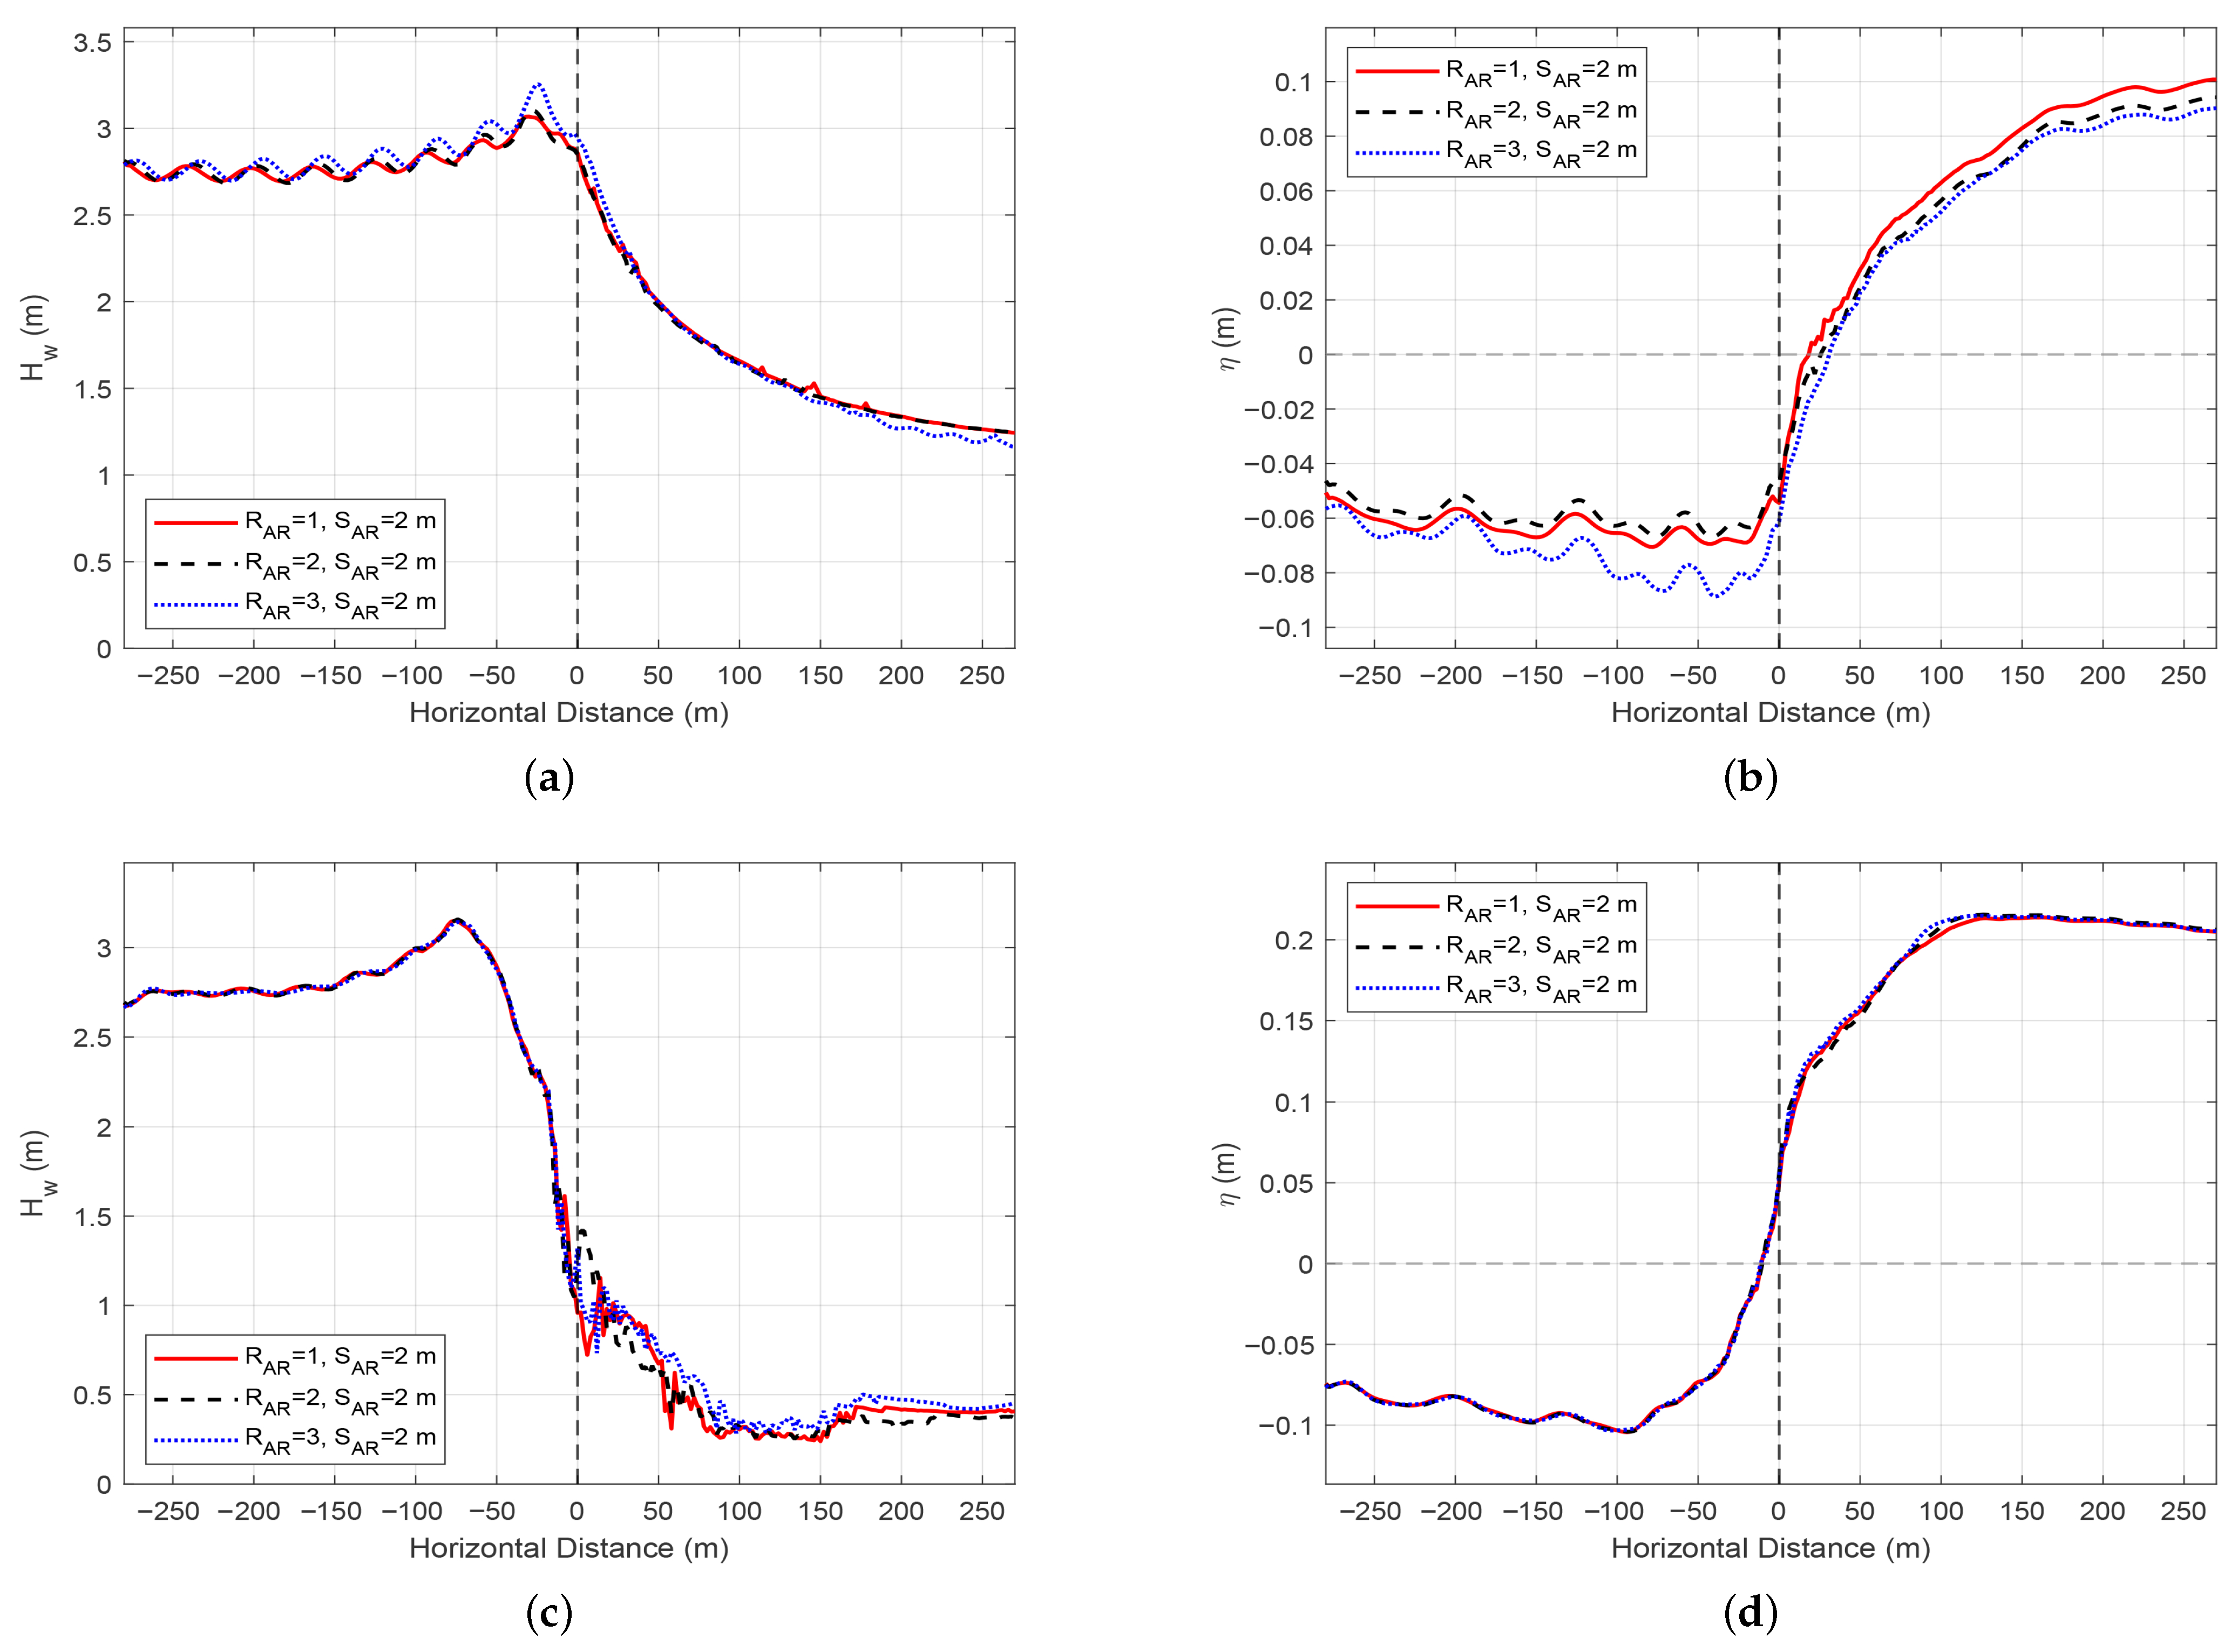
Figure 8a,b compare wave height distributions and setup characteristics for artificial reefs in single-row, double-row, and triple-row configurations ( R A R = 1, 2, 3) with constant spacing ( S A R = 2 m) under wave conditions corresponding to a 5-year return period. During high tide, wave heights demonstrate initial attenuation followed by local amplification along the fore-reef slope (X = −130 to 0 m) due to combined shoaling effects and reef interactions. The peak wave height for the single-row configuration occurs at X = −30 m on the landward portion of the fore-reef slope, reaching 3.07 m. This peak shifts shoreward to X = −28 m (3.10 m) for double-row reefs and further to X = −24 m (3.26 m) for triple-row reefs. The maximum setup consistently develops within 250 m shoreward of the reef edge ( X > 250 m), measuring 0.10 m for single-row structures but decreasing marginally to 0.09 m for multi-row configurations. Under low-tide conditions (Figure 8c,d), enhanced topographic forcing intensifies wave shoaling along the fore-reef slope, concentrating peak wave heights at X = −74 m where all configurations yield identical values of 3.15 m. The maximum setup emerges at X = 125 m on the reef flat, registering 0.21 m for single-row arrangements versus 0.22 m for multi-row systems with marginal differences. This reveals that increasing reef rows elevates peak wave heights by 5.2% during high tide, whereas this effect becomes negligible during low tide. Concurrently, additional reef rows reduce setup values by 10.5% under high-tidal conditions but merely 0.5% under low-tidal conditions, confirming that reef layouts significantly enhance wave energy dissipation efficiency during periods of high water levels.

4.1.3. The Effect of the Spacing of Rows

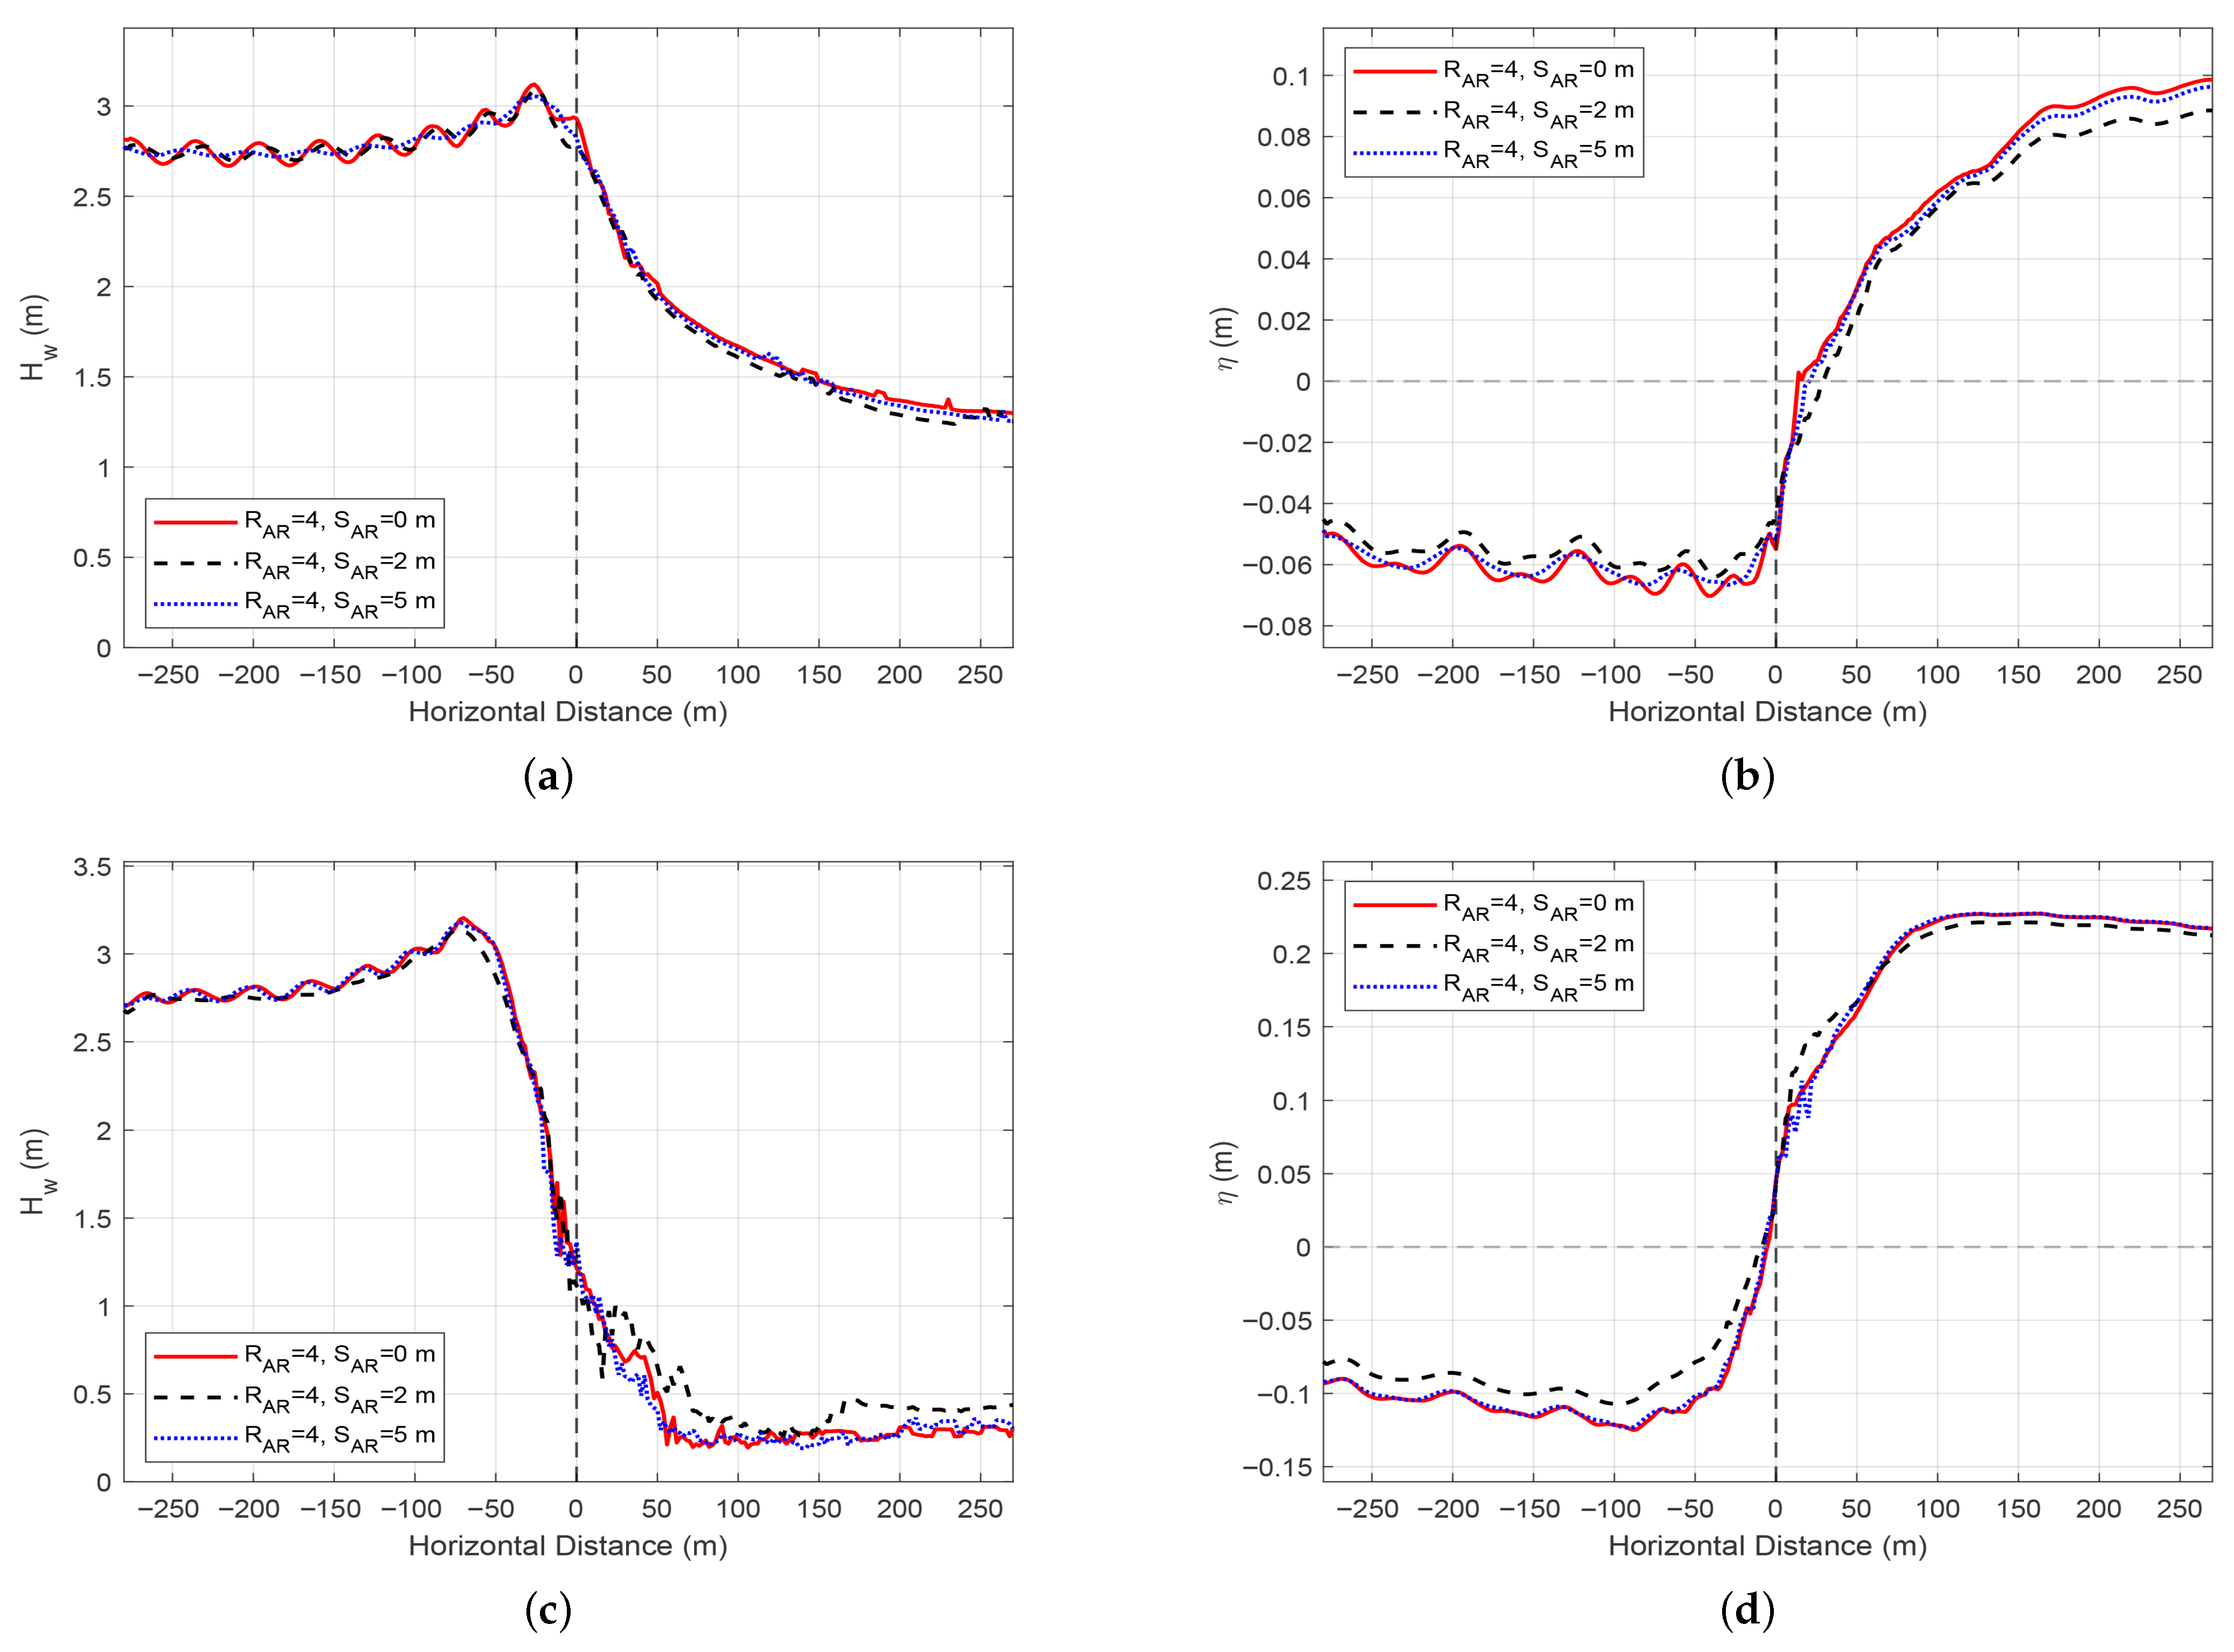
Figure 9a,b illustrate the influence of artificial reef spacing ( S A R = 0 m, 2 m, 5 m) with fixed row ( R A R = 4) on wave height and setup distribution under high-tidal conditions using wave scenarios with a 5-year return period. Wave height peaks consistently occur at the fore-reef slope (X = −26 m), with the maximum value of approximately 3.12 m observed at the 0 m spacing, followed by 3.09 m at the 2 m spacing and 3.05 m at the 5 m spacing, indicating that the maximum wave height progressively decreases with increasing spacing. The peak setup emerges within the inner reef flat region ( X > 250 m), reaching its highest magnitude of 0.09 m at the 2 m spacing, while both the 0 m and 5 m spacing configurations yield values around 0.10 m. Under low-tidal conditions (Figure 9c,d), wave height maxima concentrate along the fore-reef slope between X = −74 m and X = −70 m. The 0 m spacing configuration produces the highest peak of 3.20 m, whereas the 2 m and 5 m spacings generate peaks of 3.13 m and 3.18 m, respectively. The peak setup values manifest shoreward of the reef edge beyond X = 100 m, measuring approximately 0.23 m for both the 0 m and 5 m spacings, compared to 0.22 m for the 2 m spacing. Comprehensive analysis reveals that increasing reef spacing reduces the peak wave height across the reef profile under identical tidal stages, corresponding to reductions of 2.1% during high tide and 0.8% during low tide. Concurrently, the peak setup decreases by 2.4% under high-tidal conditions but exhibits no significant variation during low tide. This trend parallels the influence of reef row arrangements, confirming that modifications in reef layout under high tidal levels substantially regulate wave energy dissipation efficiency.

4.2. Characteristics of Wave Reflection and Transmission

Based on the variations in wave reflection and transmission coefficients, the following analysis examines how different reef configurations and hydrodynamic conditions influence wave dissipation, while the relationships among these factors are further elucidated to clarify their combined effects. For this purpose, the incident wave components are separated using the three-gauge method proposed by Mansard and Funke [41], applied immediately seaward of the reef slope. Subsequently, the reflection coefficient K R for the fringing reef—either with or without an artificial reef—is defined as the ratio of the reflected wave height H R to the incident wave height H I , expressed as follows:
K R = H R H I
The transmission coefficient K T for waves propagating across a coral reef flat is defined based on the ratio of transmitted to incident wave energy fluxes [42]. This definition accounts for two key factors: (i) the transmitted wave spectrum contains significantly higher-harmonic components in addition to the primary frequency, and (ii) water depths (and thus wave celerities) differ between the offshore and reef flat regions. Accordingly, K T is expressed as follows:
K T = i = 1 5 E T i C g , T i E I C g , I
where E T i and E I denote the energy densities of the i-th transmitted harmonic component (up to fifth order) over the reef flat and the incident wave in deep water, respectively, while C g , T i and C g , I represent the corresponding wave group velocities. Specifically, the incident wave energy flux E I C g , I can be converted from the deep-water wave energy flux E 0 C g , 0 using energy conservation principles. According to linear wave theory, the deep-water wave energy density is E 0 = ρ g H 0 2 / 8 , where H 0 is derived from the incident wave height H I . The deep-water group velocity is given by C g , 0 = g T / ( 4 π ) . The total transmitted energy flux is obtained by analyzing the free-surface elevation time series recorded at a fixed location on the reef flat using Fast Fourier Transform (FFT). The energy spectrum derived from this analysis is used to compute the summation of E T i C g , T i for each harmonic component ( i = 1 to 5). The wave group velocity C g , T i for each harmonic is determined by solving the dispersion relation.
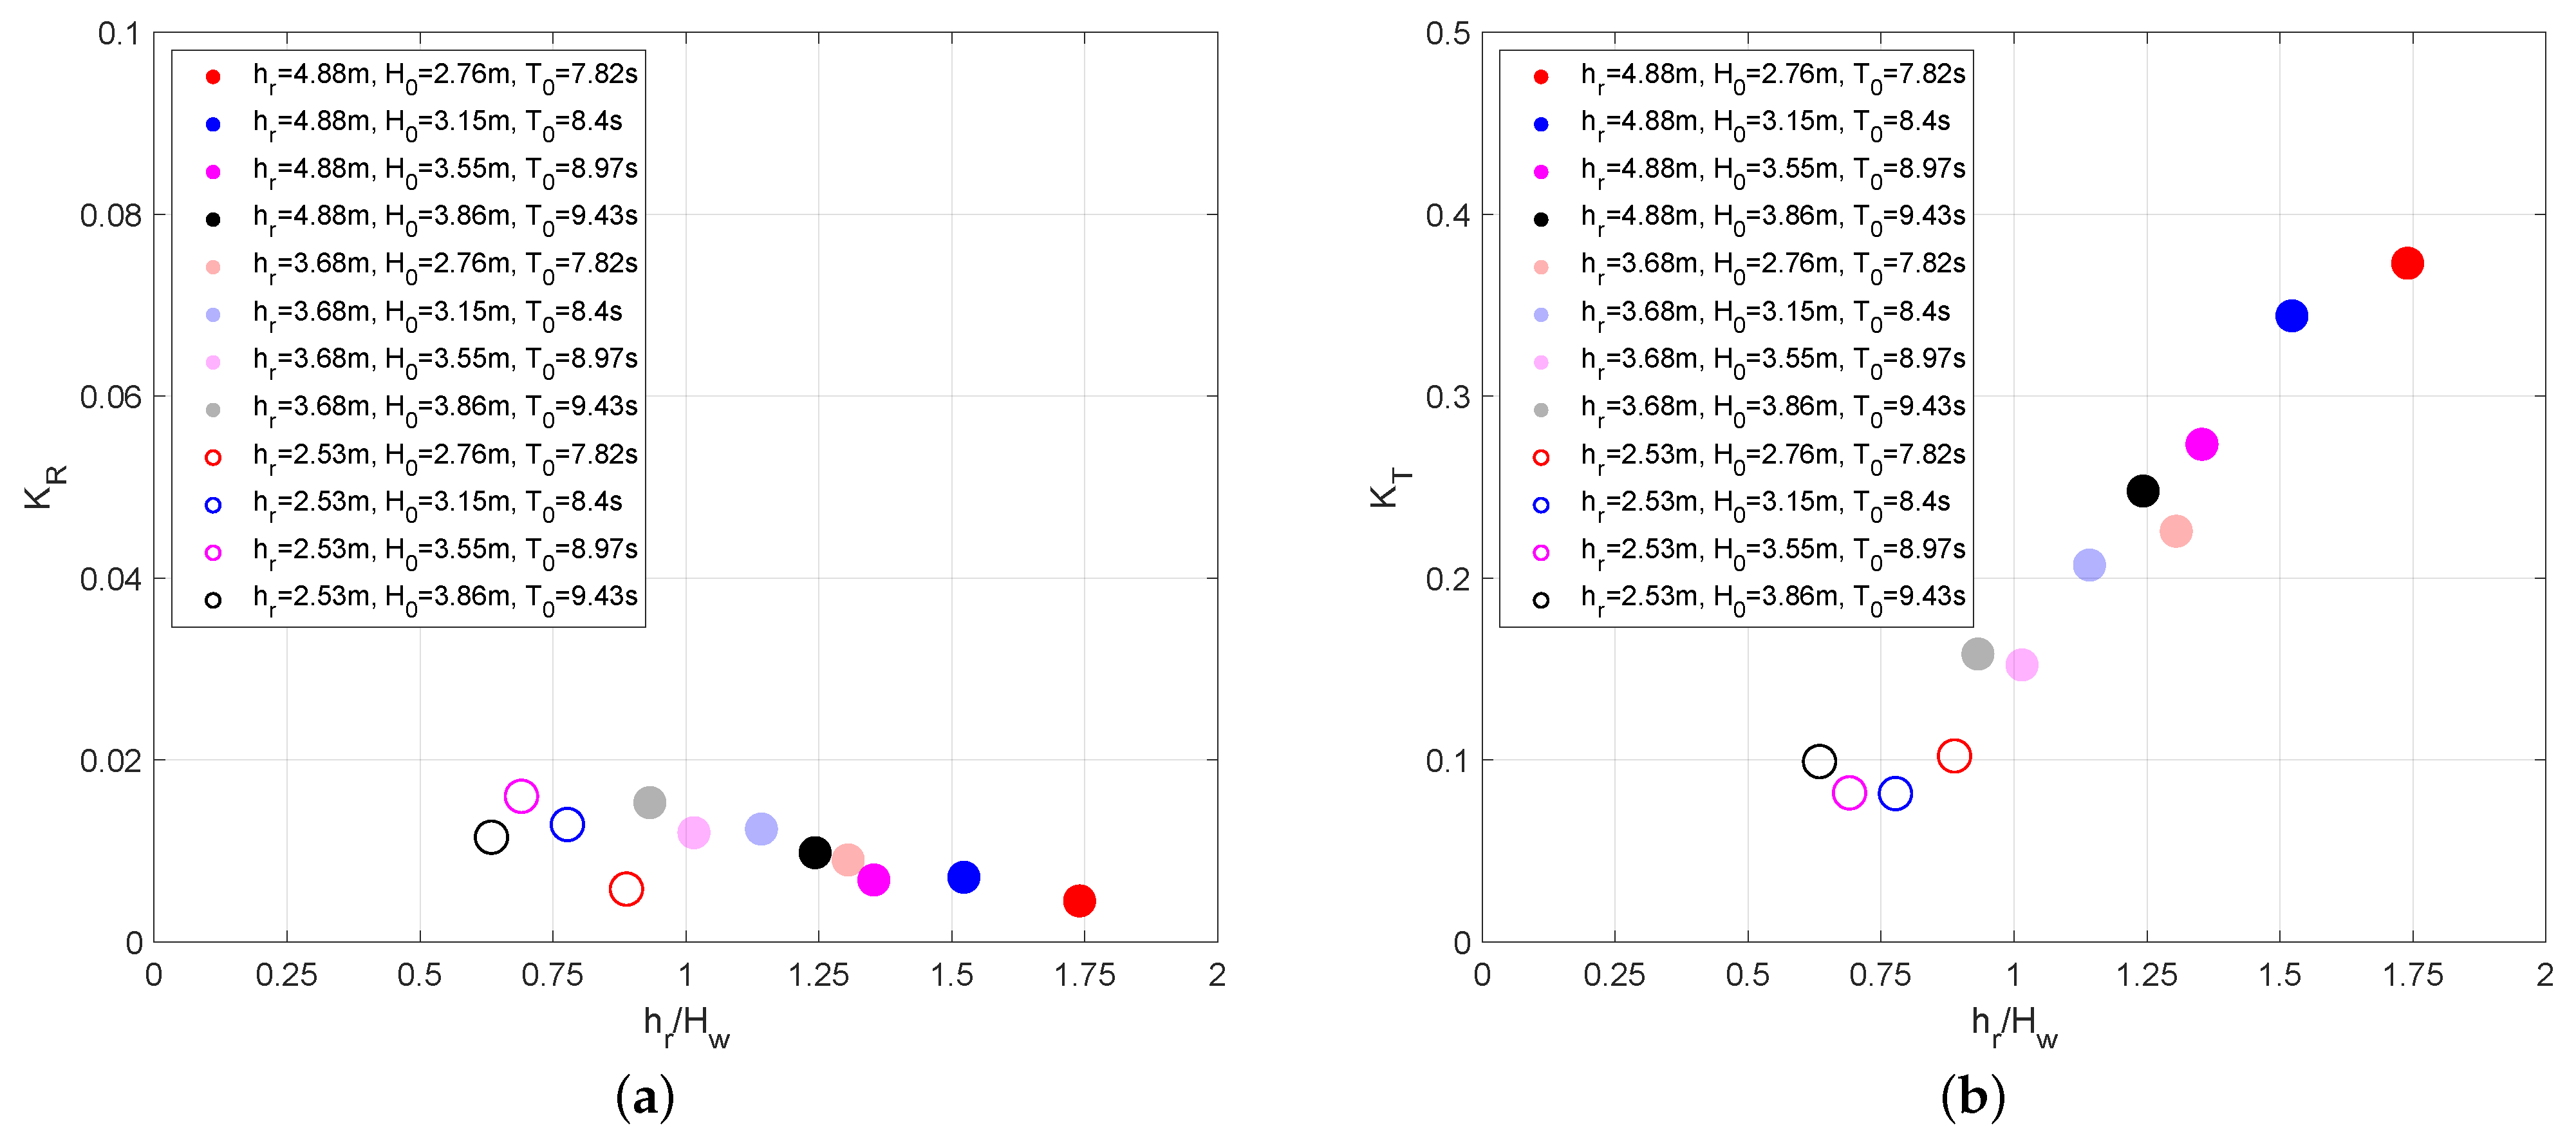
Figure 10a,b first illustrate the influence of varying incident wave parameters and reef flat water depths on the wave reflection and transmission coefficients in the absence of an artificial reef. Under high-tide conditions ( h r = 4.88 m), the reflection coefficient K R increases from approximately 0.005 to 0.009 as the wave height increases from 2.76 m to 3.86 m and the wave period increases from 7.82 s to 9.43 s. Meanwhile, the transmission coefficient K T decreases from 0.373 to 0.248. This trend suggests that higher wave energy conditions enhance wave breaking and energy dissipation, leading to a reduction in transmission capacity, while the reflection coefficient exhibits only minor variations. Under low-tide conditions ( h r = 2.53 m), K R values are significantly higher than those at high tide. For instance, under a specific wave condition with a height of 3.15 m and a period of 8.4 s, K R reaches 0.013 during low tide compared to 0.007 during high tide, while under the same condition, K T values are 0.082 and 0.344, respectively. These results indicate that shallow water conditions promote wave reflection and suppress wave transmission. Further comparison under identical wave parameters shows that K R is markedly higher and K T is significantly lower during low tide. Moreover, smaller incident wave heights generally lead to a decrease in K R and an increase in K T . It can thus be concluded that tidal variations directly modulate wave propagation mechanisms by altering the water depth over the reef flat.
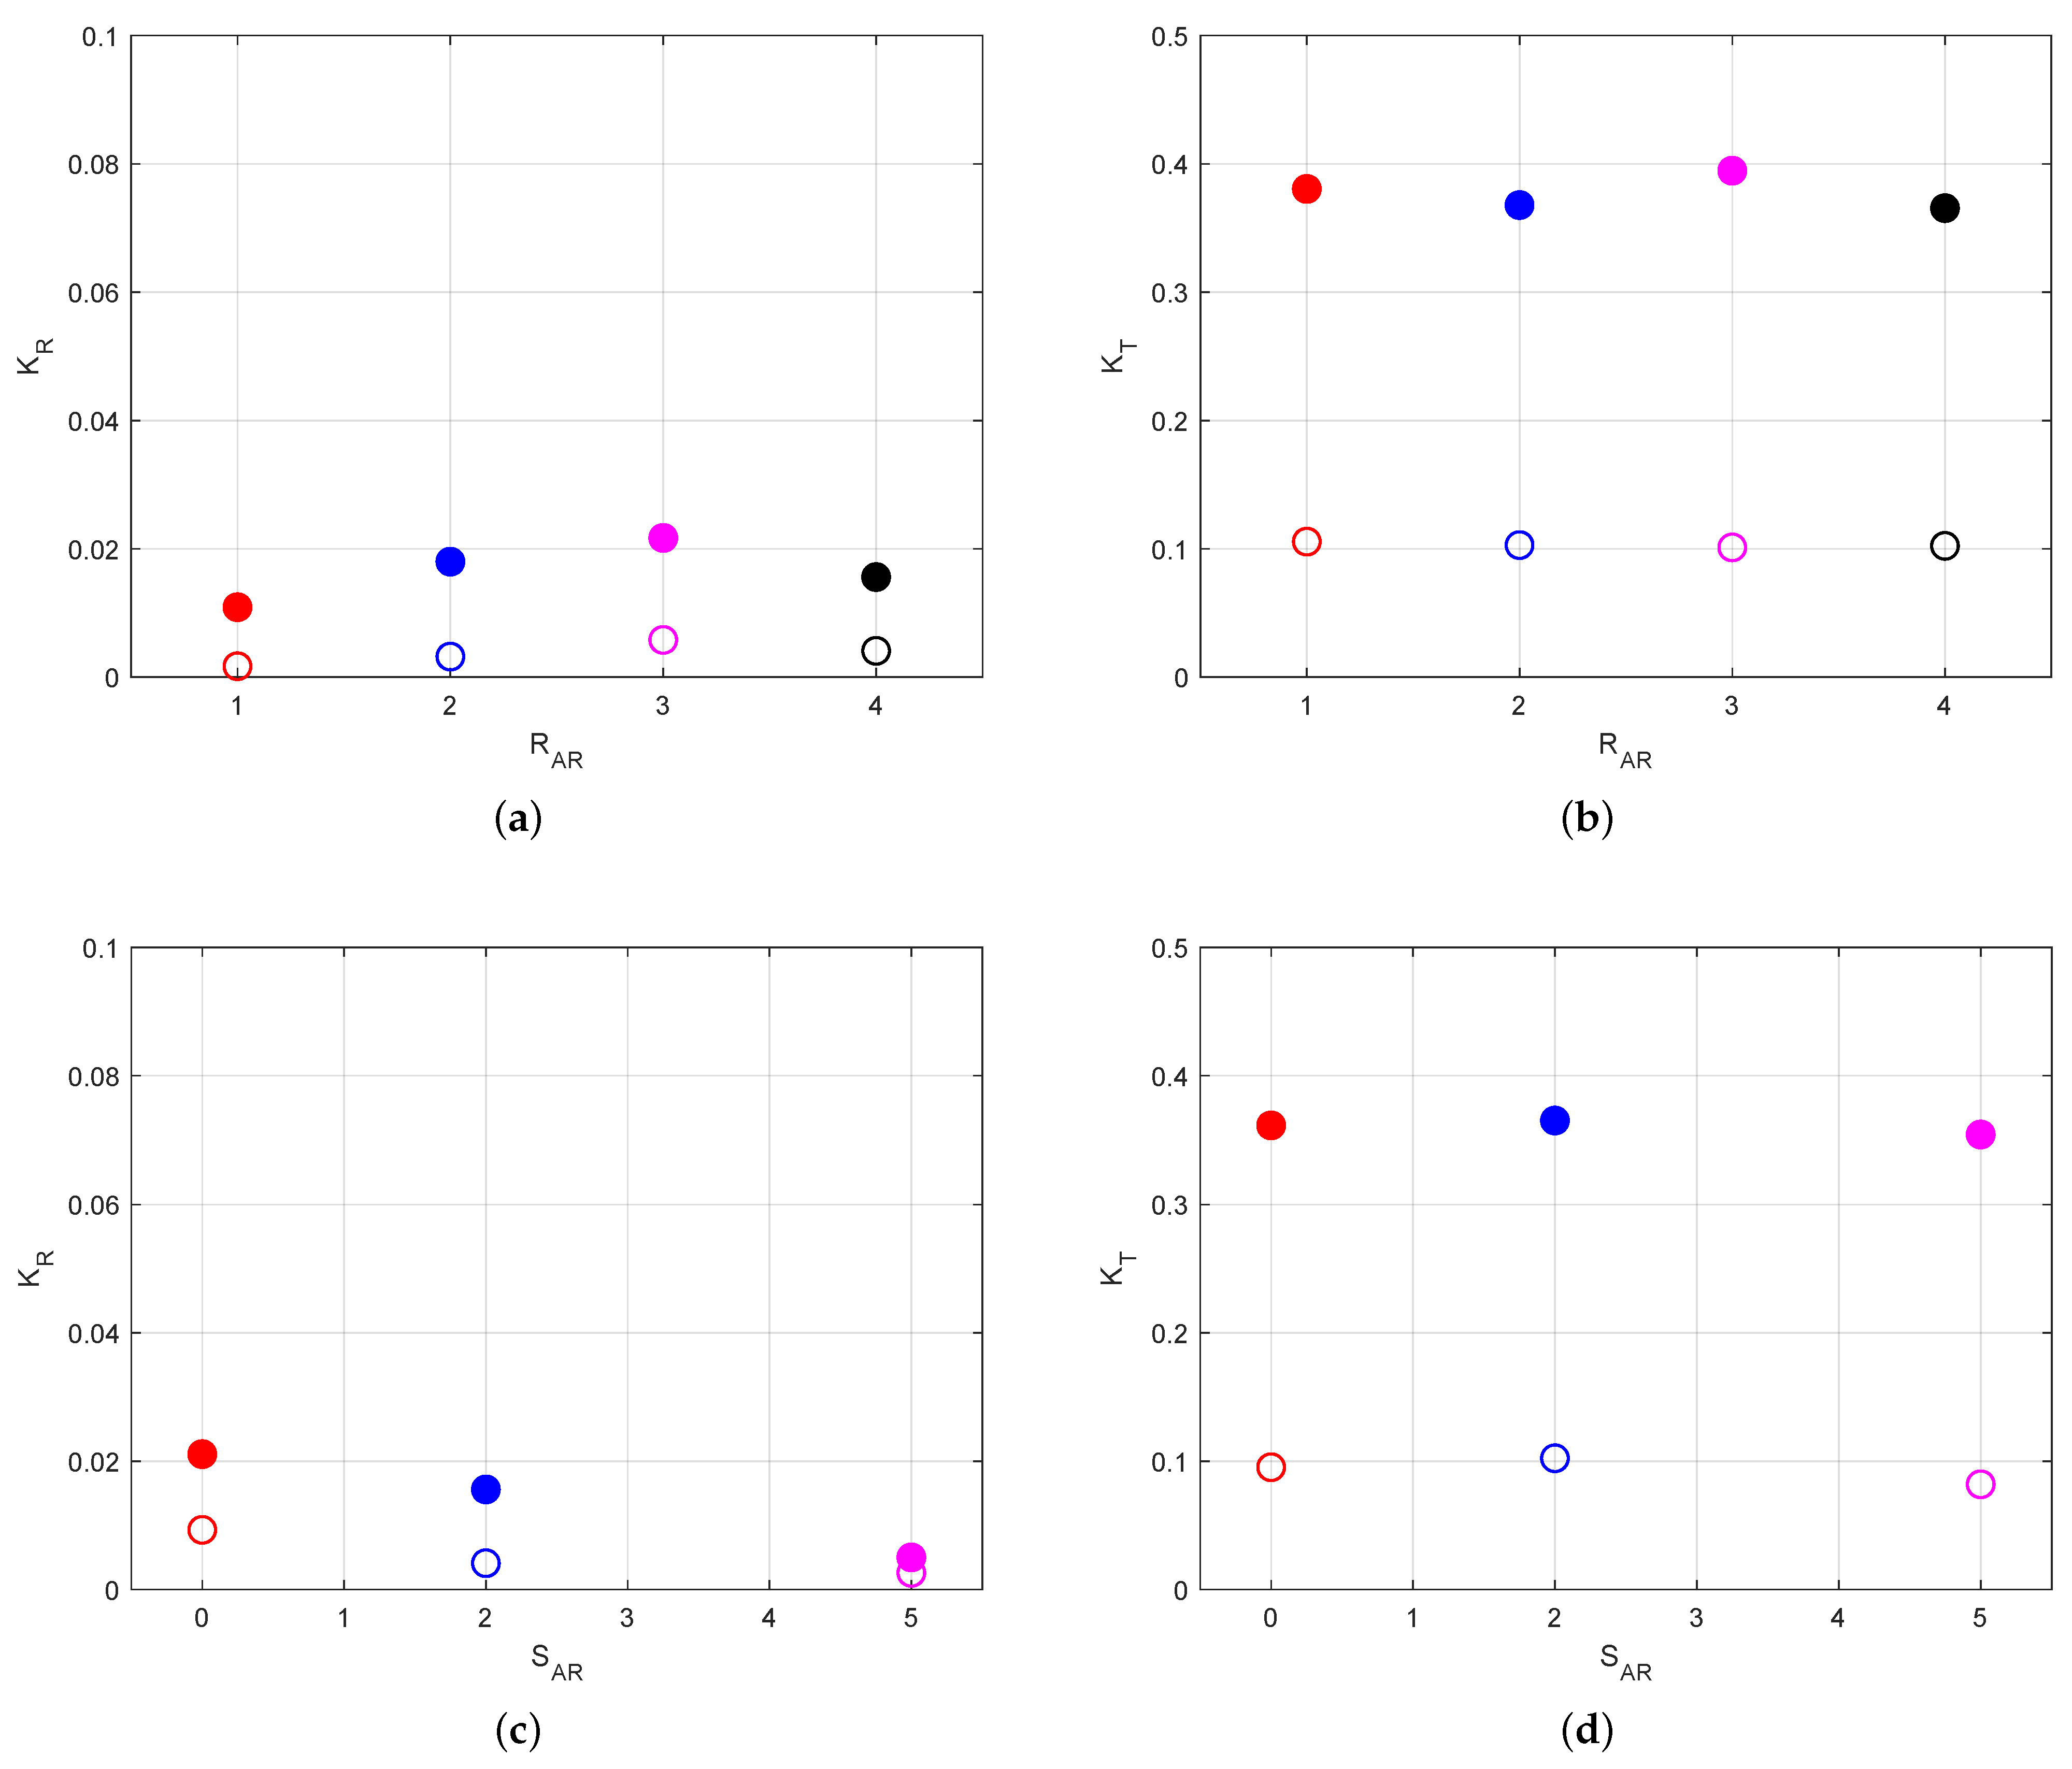
Figure 11a,b analyze the influence of different tidal levels ( Δ d ) and artificial reef rows ( R A R ) on the wave reflection coefficient K R and transmission coefficient K T under fixed incident wave conditions and a reef spacing of 2 m. Under high-tide conditions ( h r = 4.88 m) with an incident wave height of 2.76 m and a period of 7.82 s, K R exhibits an initial slight increase followed by a minor decrease as the number of reef rows increases, rising from approximately 0.011 for a single row to about 0.022 for three rows and then decreasing marginally to 0.016 for four rows. Meanwhile, K T fluctuates within a narrow range of 0.366 to 0.395, showing no clear monotonic trend. The weak correlation between K R and the reef row parameter S A R indicates that the influence of reef rows on wave reflection behavior is inconsistent during high tide. Under low-tide conditions ( h r = 2.53 m) with the same wave parameters, K R also displays a slight increasing trend with additional rows, with average values across multiple-row configurations ranging between 0.002 and 0.006, whereas K T remains relatively stable around 0.101. Altogether, significant differences are observed between high and low tidal levels across one to four rows of artificial reefs, with K R and K T varying by factors of up to 4.47 and 3.66, respectively.
Figure 11c,d illustrate the influence of tidal level ( Δ d ) and artificial reef spacing ( S A R ) on the wave reflection coefficient K R and transmission coefficient K T under fixed incident wave conditions. Under high-tide conditions ( h r = 4.88 m) with an incident wave height of 2.76 m, a period of 7.82 s, and a reef configuration of four rows, K R decreases significantly with increasing reef spacing, declining from approximately 0.021 at zero spacing to 0.016 at 2 m spacing and 0.005 at 5 m spacing, corresponding to reductions of 26.1% and 76.3%, respectively. In contrast, K T shows only minor variations, with values of 0.362, 0.366, and 0.355, indicating that reef spacing has limited influence on wave transmission. Under low-tide conditions ( h r = 2.53 m) with identical wave parameters, K R similarly decreases with greater spacing, falling from 0.009 at zero spacing to 0.004 at 2 m and 0.003 at 5 m, representing reductions of 55.9% and 72%, which demonstrates that reduced spacing consistently enhances wave reflection across tidal levels. Meanwhile, K T remains stable around 0.1 under low-tide conditions regardless of spacing. Overall, substantial differences in K R and K T are observed between high and low tidal levels across reef spacings from 0 to 5 m, with corresponding factors of 2.61 and 3.87, respectively.
To enhance the wave attenuation performance of coral reefs in fringing reef environments, a systematic analysis of wave propagation characteristics with and without artificial reef units is essential. Figure 12a,b compare the ratios of reflection and transmission coefficients under high- and low-tidal conditions for existing artificial reef configurations deployed at the outer reef flat edge, incorporating varying row numbers and spacings, so as to evaluate their wave dissipation effectiveness. Here, K R 0 and K T 0 denote the wave reflection and transmission coefficients, respectively, in the absence of artificial reefs, whereas K R n and K T n represent the corresponding coefficients under identical incident wave and water depth conditions with artificial reefs present. Data points ( K R n , K R 0 ) and ( K T n , K T 0 ) located below the red polyline in the figure indicate that the artificial reefs influence wave propagation. Points falling within the region bounded by two black dashed lines suggest that the differences in reflection and transmission coefficients induced by the reefs do not exceed 5%. The results show that under low-water-level conditions, the values of ( K R n , K R 0 ) remain below 0.01, indicating that the reefs enhance wave breaking, thereby reducing reflected wave energy to a very small fraction of the incident waves. In contrast, under high-water-level conditions, the distribution of ( K R n , K R 0 ) shifts rightward with different reef row numbers and spacing configurations, demonstrating the modulating effect of artificial reefs on wave reflection. By comparison, the distribution of ( K T n , K T 0 ) is relatively clustered, and reef-induced variations in transmission coefficients remain within 5% under both high and low water levels, indicating that the current reef structures provide limited control over wave transmission across the fringing reef profile. Therefore, modifications such as increasing reef height or deploying reefs on the fore-reef slope are required to improve overall wave attenuation capacity.

5. Conclusions

This study employs the OpenFOAM-based model to investigate hydrodynamic processes along the fringing reef of Weizhou Island under various conditions. Numerical analyses reveal key mechanisms governing wave transformation, with the following conclusions drawn:
(1)
The transformation of wave energy across coral reef systems is modulated by reef flat water depth, where wave dissipation is enhanced on the gentle fore-reef slope. Under constant incident wave conditions, transmission coefficients ( K T ) increase significantly as reflection coefficients ( K R ) decrease with greater reef flat water depth, which demonstrates the critical control of depth-limited breaking on wave energy redistribution.
(2)
Tidal conditions modulate how reef configuration influences wave transformation processes. The spacing of the reef significantly affects the reflection of the waves during low tide, while the number of rows of reefs exhibits limited influence. In contrast, the transmission coefficients show substantial variation during high tide, indicating that the tidal stage determines the relative importance of different structural parameters in the dissipation of wave energy.
(3)
Existing reef design configurations markedly affect wave reflection, particularly during high-tide conditions. However, their impact on wave transmission remains minimal, with values of K T varying less than 5% compared to scenarios without artificial reefs under identical hydrodynamic conditions. This limited effect suggests that structural modifications, such as increasing reef height or implementing fore-reef deployment, are necessary to achieve improved wave attenuation performance.
(4)
This study quantitatively analyzes the wave dissipation performance of existing artificial reefs under regular wave conditions; however, certain limitations persist. Subsequent investigations will incorporate irregular wave regimes to examine distinct reef configurations, such as those transplanted with varying-sized Acropora coral canopies, thereby elucidating the impact mechanisms of reef structures on wave energy components, including short-crested waves and infragravity waves.

Author Contributions

Z.L.: Conceptualization, Methodology, Writing—original draft preparation; G.H.: Investigation, Validation; W.H.: Formal analysis, Visualization; H.C.: Software, Data curation; K.Y.: Conceptualization, Project administration, Writing—review and editing; D.-S.J.: Conceptualization, Writing—review and editing. All authors have read and agreed to the published version of the manuscript.

Funding

This research was funded by the Inclusive Support Policies for Young Talent of Guangxi (No. ZX02080031024002) and the Guangxi Science and Technology Program (No. AD25069075).

Data Availability Statement

The original contributions presented in this study are included in the article. Further inquiries can be directed to the corresponding author.

Acknowledgments

Special thanks go to the anonymous reviewers for their careful reading of the manuscript and valuable comments.

Conflicts of Interest

The authors declare no conflicts of interest.

References

  1. Ferrario, F.; Beck, M.W.; Storlazzi, C.D.; Micheli, F.; Shepard, C.C.; Airoldi, L. The effectiveness of coral reefs for coastal hazard risk reduction and adaptation. Nat. Commun. 2014, 5, 3794. [Google Scholar] [CrossRef]
  2. Monismith, S.G. Hydrodynamics of coral reefs. Annu. Rev. Fluid Mech. 2007, 39, 37–55. [Google Scholar] [CrossRef]
  3. Young, I.R. Wave transformation over coral reefs. J. Geophys. Res. Ocean. 1989, 94, 9779–9789. [Google Scholar] [CrossRef]
  4. Hardy, T.A.; Young, I.R. Field study of wave attenuation on an offshore coral reef. J. Geophys. Res. Ocean. 1996, 101, 14311–14326. [Google Scholar] [CrossRef]
  5. Vetter, O.; Becker, J.M.; Merrifield, M.A.; Pequignet, A.C.; Aucan, J.; Boc, S.J.; Pollock, C.E. Wave setup over a Pacific Island fringing reef. J. Geophys. Res. Ocean. 2010, 115, C12066. [Google Scholar] [CrossRef]
  6. Gourlay, M.R. Wave transformation on a coral reef. Coast. Eng. 1994, 23, 17–42. [Google Scholar] [CrossRef]
  7. Gourlay, M.R. Wave set-up on coral reefs. 1. Set-up and wave-generated flow on an idealised two dimensional horizontal reef. Coast. Eng. 1996, 27, 161–193. [Google Scholar] [CrossRef]
  8. Gourlay, M. Wave set-up on coral reefs. 2. Set-up on reefs with various profiles. Coast. Eng. 1996, 28, 17–55. [Google Scholar] [CrossRef]
  9. Demirbilek, Z.; Nwogu, O.G.; Ward, D.L. Laboratory Study of Wind Effect on Runup over Fringing Reefs. Report 1. Data Report; Technical Report; U.S. Army Engineer Research and Development Center: Vicksburg, MS, USA, 2007. [Google Scholar]
  10. Yao, Y.; Lo, E.Y.; Huang, Z.; Monismith, S.G. An experimental study of wave-induced set-up over a horizontal reef with an idealized ridge. In Proceedings of the International Conference on Offshore Mechanics and Arctic Engineering, Honolulu, HI, USA, 31 May–5 June 2009; Volume 43468, pp. 383–389. [Google Scholar]
  11. Nwogu, O.; Demirbilek, Z. Infragravity wave motions and runup over shallow fringing reefs. J. Waterw. Port Coastal Ocean. Eng. 2010, 136, 295–305. [Google Scholar] [CrossRef]
  12. Yao, Y.; Huang, Z.; Monismith, S.G.; Lo, E.Y. 1DH Boussinesq modeling of wave transformation over fringing reefs. Ocean. Eng. 2012, 47, 30–42. [Google Scholar] [CrossRef]
  13. Ma, G.; Su, S.F.; Liu, S.; Chu, J.C. Numerical simulation of infragravity waves in fringing reefs using a shock-capturing non-hydrostatic model. Ocean. Eng. 2014, 85, 54–64. [Google Scholar] [CrossRef]
  14. Shi, J.; Zhang, C.; Zheng, J.; Tong, C.; Wang, P.; Chen, S. Modelling wave breaking across coral reefs using a non-hydrostatic model. J. Coast. Res. 2018, 85, 501–505. [Google Scholar] [CrossRef]
  15. Lowe, R.J.; Buckley, M.L.; Altomare, C.; Rijnsdorp, D.P.; Yao, Y.; Suzuki, T.; Bricker, J. Numerical simulations of surf zone wave dynamics using Smoothed Particle Hydrodynamics. Ocean. Model. 2019, 144, 101481. [Google Scholar] [CrossRef]
  16. Liu, Y.; Li, S.; Liao, Z.; Liu, K. Physical and numerical modeling of random wave transformation and overtopping on reef topography. Ocean. Eng. 2021, 220, 108390. [Google Scholar] [CrossRef]
  17. Yao, Y.; Li, Z.; Xu, C.; Jiang, C. A study of wave-driven flow characteristics across a reef under the effect of tidal current. Appl. Ocean. Res. 2023, 130, 103430. [Google Scholar] [CrossRef]
  18. Watanabe, M.; Kan, H.; Toguchi, K.; Nakashima, Y.; Roeber, V.; Arikawa, T. Effect of the structural complexity of a coral reef on wave propagation: A case study from Komaka Island, Japan. Ocean. Eng. 2023, 287, 115632. [Google Scholar] [CrossRef]
  19. Wang, C.; Qu, K.; Li, J.; Li, W. Physical and modelling analysis on hydrodynamic transforming processes of tsunami-like wave over an uneven coral reef. Ocean. Eng. 2025, 320, 120326. [Google Scholar] [CrossRef]
  20. Fadli, N.; Campbell, S.J.; Ferguson, K.; Keyse, J.; Rudi, E.; Riedel, A.; Baird, A.H. The role of habitat creation in coral reef conservation: A case study from Aceh, Indonesia. Oryx 2012, 46, 501–507. [Google Scholar] [CrossRef]
  21. Blakeway, D.; Byers, M.; Stoddart, J.; Rossendell, J. Coral colonisation of an artificial reef in a turbid nearshore environment, Dampier Harbour, western Australia. PLoS ONE 2013, 8, e75281. [Google Scholar] [CrossRef]
  22. Tanaya, T.; Iwamura, S.; Okada, W.; Kuwae, T. Artificial structures can facilitate rapid coral recovery under climate change. Sci. Rep. 2025, 15, 9116. [Google Scholar] [CrossRef]
  23. Knoester, E.; Rienstra, J.; Schürmann, Q.; Wolma, A.; Murk, A.; Osinga, R. Community-managed coral reef restoration in southern Kenya initiates reef recovery using various artificial reef designs. Front. Mar. Sci. 2023, 10, 1152106. [Google Scholar] [CrossRef]
  24. Reguero, B.G.; Beck, M.W.; Agostini, V.N.; Kramer, P.; Hancock, B. Coral reefs for coastal protection: A new methodological approach and engineering case study in Grenada. J. Environ. Manag. 2018, 210, 146–161. [Google Scholar] [CrossRef] [PubMed]
  25. Webb, B.M.; Allen, R. Wave transmission through artificial reef breakwaters. In Coastal Structures and Solutions to Coastal Disasters Joint Conference 2015; American Society of Civil Engineers: Reston, VA, USA, 2015; pp. 432–441. [Google Scholar]
  26. Srineash, V.; Murali, K. Functional performance of modular porous reef breakwaters. J.-Hydro-Environ. Res. 2019, 27, 20–31. [Google Scholar] [CrossRef]
  27. van Gent, M.R.; Buis, L.; van den Bos, J.P.; Wüthrich, D. Wave transmission at submerged coastal structures and artificial reefs. Coast. Eng. 2023, 184, 104344. [Google Scholar] [CrossRef]
  28. Ghiasian, M.; Carrick, J.; Rhode-Barbarigos, L.; Haus, B.; Baker, A.C.; Lirman, D. Dissipation of wave energy by a hybrid artificial reef in a wave simulator: Implications for coastal resilience and shoreline protection. Limnol. Oceanogr. Methods 2021, 19, 1–7. [Google Scholar] [CrossRef]
  29. Huang, J.; Lowe, R.J.; Ghisalberti, M.; Hansen, J.E. Wave transformation across impermeable and porous artificial reefs. Coast. Eng. 2024, 189, 104488. [Google Scholar] [CrossRef]
  30. Huang, J.; Lowe, R.J.; Ghisalberti, M.; Hansen, J.E. Parametric modelling of wave transformation across porous artificial reefs. Coast. Eng. 2025, 200, 104754. [Google Scholar] [CrossRef]
  31. Jacobsen, N.G.; Fuhrman, D.R.; J, F. A wave generation toolbox for the open-source CFD library: OpenFOAM. Int. J. Numer. Methods Fluids 2012, 70, 1073–1088. [Google Scholar] [CrossRef]
  32. Yu, W.; Wang, W.; Yu, K.; Wang, Y.; Huang, X.; Huang, R.; Liao, Z.; Xu, S.; Chen, X. Rapid decline of a relatively high latitude coral assemblage at Weizhou Island, northern South China Sea. Biodivers. Conserv. 2019, 28, 3925–3949. [Google Scholar] [CrossRef]
  33. Liang, W.; Zhou, H.; Wang, X.; Rongyong, H.; Kefu, Y. Studies on scleractinian coral community structure characteristics in the southwest seawaters of the Weizhou Island. Haiyang Xuebao 2021, 43, 123–135. [Google Scholar]
  34. Yang, Z.; Zhang, J.; Lv, X.; Zheng, Y.; Jiang, G.; Shi, X.; Tao, W.; Li, X.; Lv, Y. The ecological succession of scleratinian coral communites and their environmental factors in Weizhou Island. Acta Ecol. Sin. 2021, 41, 7168–7179. [Google Scholar]
  35. Li, G.; Liang, W.; Nong, H.; Liu, J. Preliminary Study on Conditions of Coral Reef Ecological Environment along the Coast of Weizhou Island. Guangxi Sci. 2004, 11, 379–384. [Google Scholar]
  36. Huang, Z.; Zhang, C.; Shen, Y.; Jiang, S. Analysis of the climatic characteristics of wind and wave in Weizhou Island sea area. Mar. Forecast. 2021, 38, 62–68. [Google Scholar]
  37. Industry Standard JTS 145-2015; Hydrological Code for Port and Waterway Engineering. China Communications Press: Beijing, China, 2015.
  38. Launder, B.E.; Spalding, D.B. The numerical computation of turbulent flows. Comput. Methods Appl. Mech. Eng. 1974, 3, 269–289. [Google Scholar] [CrossRef]
  39. Chen, L.F.; Ning, D.Z.; Teng, B.; Zhao, M. Numerical and Experimental Investigation of Nonlinear Wave-Current Propagation over a Submerged Breakwater. J. Eng. Mech. ASCE 2017, 143, 04017061. [Google Scholar] [CrossRef]
  40. Willmott, C.J. On the validation of models. Phys. Geogr. 1981, 2, 184–194. [Google Scholar] [CrossRef]
  41. Mansard, E.P.; Funke, E. The measurement of incident and reflected spectra using a least squares method. In Coastal Engineering 1980; American Society of Civil Engineers: Reston, VA, USA, 1980; pp. 154–172. [Google Scholar]
  42. Yao, Y.; He, F.; Tang, Z.; Liu, Z. A study of tsunami-like solitary wave transformation and run-up over fringing reefs. Ocean. Eng. 2018, 149, 142–155. [Google Scholar] [CrossRef]
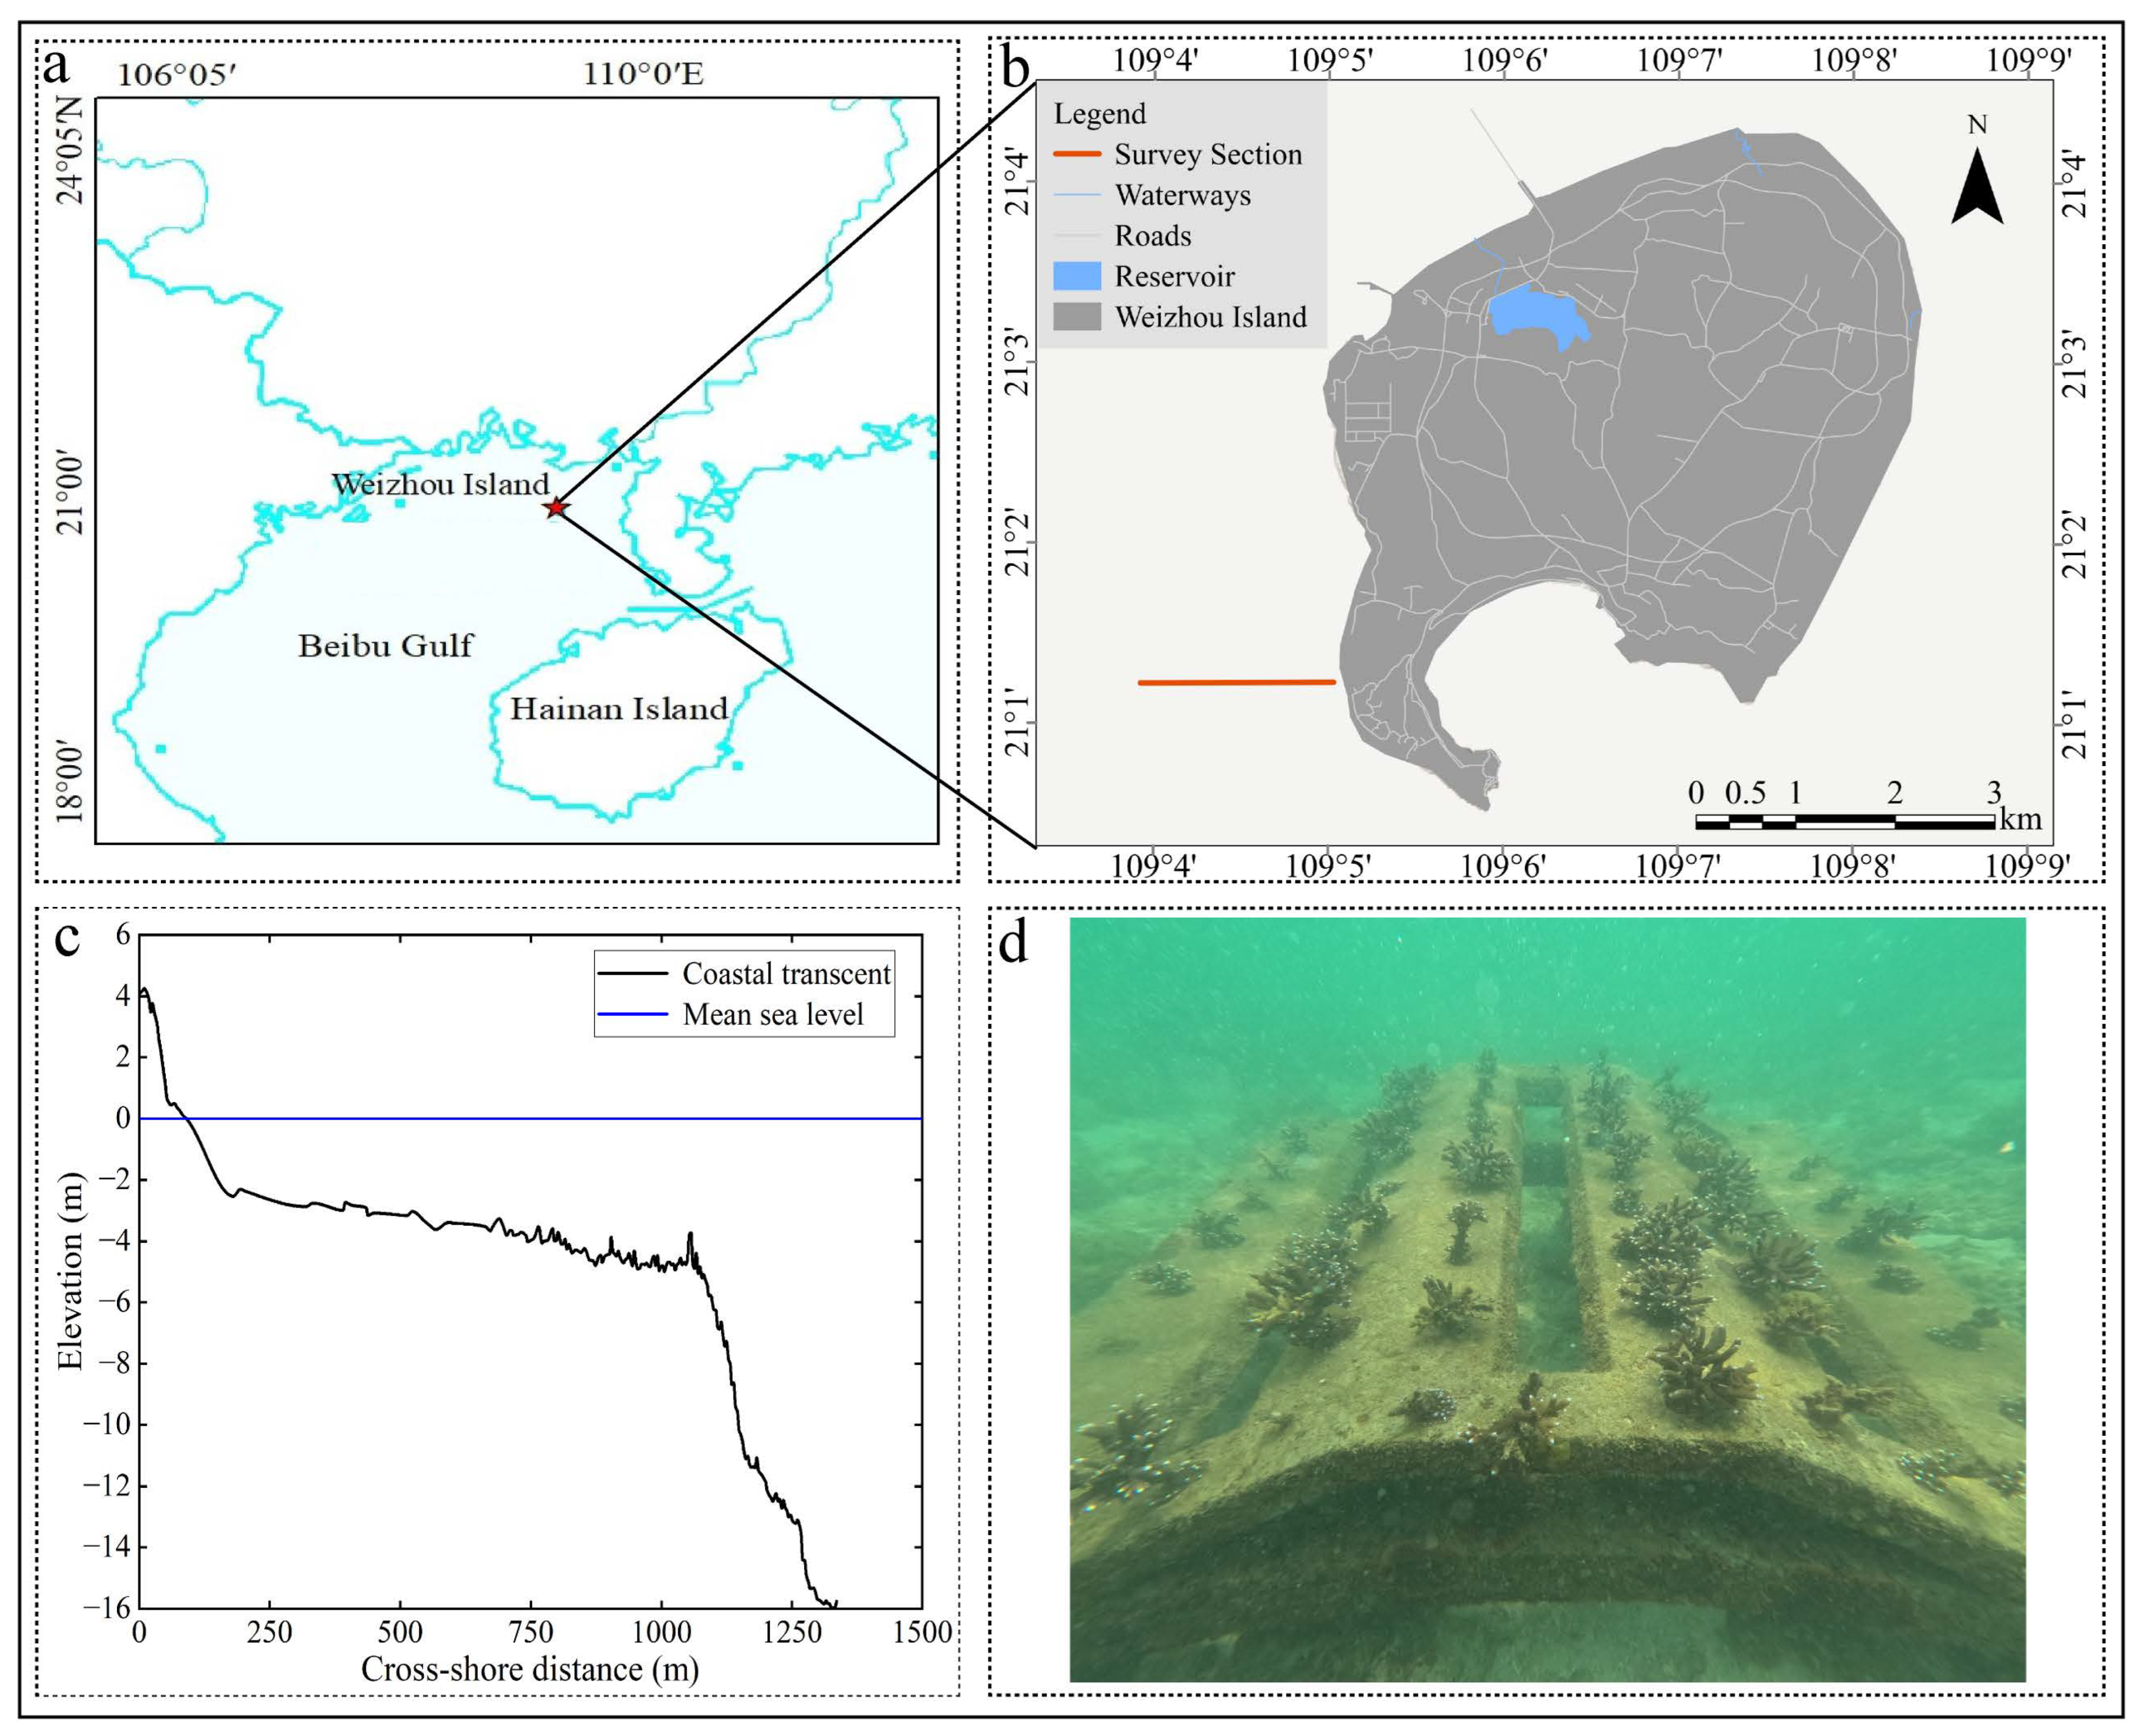
Figure 1. (a) Map showing location of study area. (b) Delineation of Weizhou Island’s scope. (c) Cross-sectional profile of southwestern fringing reef. (d) Schematic of deployed submerged artificial reef.
Jmse 13 02031 g001
Figure 2. A schematic diagram of the model setup: (a) the computational domain, (b) the side view of the artificial reef structure, and (c) the corresponding front view.
Jmse 13 02031 g002
Figure 3. The experimental setup of previous wave flume tests [10,19,39] for the validation of the OpenFOAM-based model. (a) Yao et al. [10]’s experiment for wave-induced set-up over the horizontal reef with idealized ridge. (b) Wang et al. [19]’s experiment for tsunami-like wave over the uneven coral reef. (c) Chen et al. [39]’s experiment for the wave-current interaction with submerged rectangular breakwater.
Jmse 13 02031 g003
Figure 4. Time series of free-surface elevations at six gauge locations (G2, G3, G5, G7, G9, and G11). Note that laboratory measurements are indicated by circles and model predictions by solid lines. The respective skill scores for these gauges are 0.966, 0.967, 0.933, 0.84, 0.765, and 0.736.
Jmse 13 02031 g004
Figure 5. Time series of free-surface elevations at gauges G1, G4, G6, G7, and G8 under two submergence water depths ( h r ). Circles: laboratory measurements; solid lines: predictions by the present model. The corresponding skill values for the gauges are 0.9823, 0.9552, 0.9489, 0.9546, and 0.9468 ( h r = 0 m, left column) and 0.9382, 0.917, 0.9587, 0.9457, and 0.9459 ( h r = 0.05 m, right column).
Jmse 13 02031 g005
Figure 6. Time series of free-surface elevations at five gauge locations (G1 to G5). Circles: laboratory measurements; solid lines: predictions by the present model. The corresponding skill values for the gauges are 0.979, 0.9725, 0.9614, 0.9416, and 0.9749 ( U c = 0.2 m/s, left column) and 0.9582, 0.9744, 0.918, 0.955, and 0.9483 ( U c = −0.2 m/s, right column).
Jmse 13 02031 g006
Figure 7. The variations in wave height (left) and wave-induced setup (right) across the reef profile are examined under different incident wave conditions ( H 0 = 2.76, 3.15, 3.55, 3.86 m; T 0 = 7.82, 8.4, 8.97, 9.43 s) and reef flat water depths ( h r = 2.53, 4.88 m). Subfigures (a,b) and (c,d) illustrate the corresponding results for high-tide ( h r = 4.88 m, Δ d = 0 m) and low-tide ( h r = 2.53 m, Δ d = 2.35 m) scenarios, respectively.
Jmse 13 02031 g007
Figure 8. The variations in wave height (left) and wave-induced setup (right) across the reef profile are presented for configurations with different numbers of artificial reef rows ( R A R = 1, 2, 3), maintained at a constant spacing ( S A R = 2 m). These results are obtained under fixed incident wave conditions ( H 0 = 2.76 m and T 0 = 7.82 s) and two reef flat water depths ( h r = 2.53, 4.88 m). Subfigures (a,b) and (c,d) correspond to the high-tide ( h r = 4.88 m, Δ d = 0 m) and low-tide ( h r = 2.53 m, Δ d = 2.35 m) conditions, respectively.
Jmse 13 02031 g008
Figure 9. The variations in wave height (left) and wave-induced setup (right) across the reef profile are shown for different artificial reef spacings ( S A R = 0, 2, 5 m) with a constant number of reef rows ( R A R = 4). These results are obtained under fixed incident wave conditions ( H 0 = 2.76 m and T 0 = 7.82 s) and two reef flat water depths ( h r = 2.53, 4.88 m). Subfigures (a,b) and (c,d) present the results for high-tide ( h r = 4.88 m, Δ d = 0 m) and low-tide ( h r = 2.53 m, Δ d = 2.35 m) conditions, respectively.
Jmse 13 02031 g009
Figure 10. The variations in the reflection coefficient ( K R ) and transmission coefficient ( K T ) with three reef flat water depths under various incoming wave conditions. Note that three reef flat water depths h r are set to 4.88 m, 3.68 m, and 2.53 m, represented by circles with fill levels of 100%, 50%, and 0%, respectively. Four wave conditions, characterized by wave height H 0 and wave period T 0 pairs of 2.76 m and 7.82 s, 3.15 m and 8.4 s, 3.55 m and 8.97 s, and 3.86 m and 9.43 s, are applied and denoted by the colors red, blue, magenta, and black, accordingly.
Jmse 13 02031 g010
Figure 11. The variations in the wave reflection coefficient ( K R ) and transmission coefficient ( K T ) across different artificial reef configurations, including (a,b) various rows ( R A R ) and (c,d) varying spacings ( S A R ), under constant wave conditions with H 0 = 2.76 m, T 0 = 7.82 s, and d 0 = 16 m. Solid and hollow symbols correspond to high tide ( h r = 4.88 m; Δ d = 0 m) and low tide ( h r = 2.53 m; Δ d = 2.35 m), respectively.
Jmse 13 02031 g011
Figure 12. A comparison of the wave reflection coefficient ( K R ) and transmission coefficient ( K T ) under constant wave conditions ( H 0 = 2.76 m; T 0 = 7.82 s; d 0 = 16 m). Note that R A R 0 and S A R 0 denote scenarios without artificial reefs, while R A R n and S A R n represent configurations with artificial reefs applied. Circle and square symbols correspond to variations in R A R and S A R , respectively, with solid and hollow markers indicating high-tide ( h r = 4.88 m; Δ d = 0 m) and low-tide ( h r = 2.53 m; Δ d = 2.35 m) conditions.
Jmse 13 02031 g012
Table 1. Parameters for the present model.
CharacteristicsValueUnit
Wave and tide characteristics
Wave height ( H 0 )2.76, 3.15, 3.55, 3.86[m]
Wave period ( T 0 )7.82, 8.4, 8.97, 9.43[s]
Deep water depth ( d 0 )16[m]
Tidal range ( Δ d )0, 1.2, 2.35[m]
Fringing reef characteristics
Slope1 ( S 1 )1:23[-]
Slope2 ( S 2 )1:23[-]
Slope3 ( S 3 )1:378[-]
Length1 ( L 1 )67.62[m]
Length2 ( L 2 )190.26[m]
Length3 ( L 3 )891.83[m]
Reef flat water depth ( h r )2.53, 3.68, 4.88[m]
Artificial reef characteristics
Porosity ( n A R )0.867[-]
Reef top width ( w t )0.614[m]
Reef bottom width ( w b )2[m]
Reef height ( h A R )0.716[m]
Submerged crest depth ( h c )1.814, 2.964, 4.164[m]
Effective crest depth ( h c , e )2.435, 3.585, 4.785[m]
Spacing ( S A R )0, 2, 5[m]
Row ( R A R )1, 2, 3, 4[-]
Table 2. Parameters for the validation cases (the data was from [10,19,39]).
Validation Case/Flow CharacteristicsHT h 0 h r U c
[m] [s] [m] [m] [m/s]
 Yao et al. [10]0.0951.250.450.10
 Wang et al. [19]0.06-0.605/0.6550/0.050
 Chen et al. [39]0.0810.6-±0.2
Disclaimer/Publisher’s Note: The statements, opinions and data contained in all publications are solely those of the individual author(s) and contributor(s) and not of MDPI and/or the editor(s). MDPI and/or the editor(s) disclaim responsibility for any injury to people or property resulting from any ideas, methods, instructions or products referred to in the content.