Abstract
The deep-sea mining pump is a core component in deep-sea mineral resource extraction, whose performance directly determines the transportation efficiency of coarse-grained ore and overall system reliability. However, deep-sea mining pumps suffer from severe abrasion of internal components due to continuous impact by coarse ore particles, leading to short service life and high maintenance costs. These issues adversely impact the economics and continuity of mining operations. Consequently, studying the solid-liquid flow to understand wear mechanisms and develop optimized, wear-resistant designs is crucial for enhancing pump performance. This paper establishes a fully coupled solid-liquid two-phase flow platform by integrating Fluent and EDEM, based on an artificial diffusion-based coarse-particle CFD-DEM (Computational Fluid Dynamics-Discrete Element Method) approach, to systematically investigate the critical technical issue of internal pump wear. The study finds that wear in traditional spiral centrifugal pump blades is primarily concentrated on the leading edge and the middle section. On the leading edge, wear comprises 56.4% cutting wear and 44.7% impact wear; in contrast, cutting wear accounts for 96.8% of the total wear in the middle section. To address the premature failure of traditional impeller blades caused by localized wear concentration, this paper proposes an optimized design for a novel spiral centrifugal impeller with segmented blades. By modifying the impeller structure, the proposed design relocates the primary wear zones to the leading edges of the two blade segments, thereby facilitating the application of anti-wear treatments.
1. Introduction
Driven by the global technological revolution and the demand for new energy resources, the global demand for strategic metal resources such as copper, nickel, manganese, lithium, and cobalt has grown exponentially. Faced with the depletion of terrestrial resources and increasing extraction challenges, the development of deep-sea polymetallic nodules and cobalt-rich crusts has become a focal point of international strategic competition. Their industrial-scale mining relies on efficient and stable ore transportation systems. The deep-sea mining system [1] is a complex engineering project comprising a surface platform, underwater collection equipment, a vertical lifting system, and an environmental monitoring system [2]. Among these components, the lifting system serves as the core, utilizing pipeline lifting technology to achieve continuous mineral transport. Its structure includes mining pumps, relay stations, and pipeline systems. As the “power heart” of the system, the deep-sea mining pump is responsible for transporting centimeter-sized ore from the seabed at depths of several thousand meters to the surface. Given the extreme difficulty of maintenance in deep-sea environments, wear resistance becomes a critical factor in its development. Conducting research on the optimization of flow channel dynamics within the pump under conditions of large particles and high concentration is an essential path to overcoming technical bottlenecks.
In the 1970s, German company KSB pioneered the development of the first canned lifting pump system [3], marking the official entry of high-pressure slurry pumps into engineering applications. Subsequently, in 1978, U.S. company OMI conducted a 5000-m deep-sea trial in the Pacific Ocean, achieving a single lift of 1000 tons of minerals. However, the trial revealed severe wear issues in the flow-handling components [4]. South Korea completed sea trials of a hydraulic lifting system in 1993 and a two-stage mining pump in 2009 [5], but both failed to meet standards due to clogging and insufficient reliability. In 2010, India encountered similar particle clogging problems during a trial in the Arabian Sea at a depth of 521 m [6]. A significant milestone was achieved in 2017 when Japan’s JOGMEC successfully conducted the first continuous extraction of seafloor massive sulfide deposits at a depth of 1600 m in the Okinawa Trough, which is recognized as the first internationally successful case [7]. China’s deep-sea mining research began in the 1980s. In 2001, a 130-m lake trial was completed in Fuxian Lake, achieving continuous lifting of 900 kg of simulated minerals. In 2005, the Changsha Research Institute of Mining and Metallurgy developed a two-stage lifting pump but still faced challenges with flow passage clogging. After years of development, China successfully conducted a full-system integrated trial for deep-sea polymetallic nodule mining in 2021 [8].
With the rapid development of computational fluid dynamics (CFD) technology and computer performance, various CFD-based numerical simulation methods for solid-liquid two-phase flow have emerged, primarily including the Particle Pseudo-Fluid Model (PPM), the Euler-Euler (E-E) model, and the Euler-Lagrange (E-L) model. The PPM is suitable for micro-scale systems but is computationally expensive [9]. The E-E model offers high computational efficiency [10,11,12] but struggles to accurately simulate coarse particle flows and particle collisions, leading to significant errors. In contrast, the E-L model is more suitable for conditions involving large particles, high concentrations, and frequent collisions. It can be combined with the Discrete Element Method (DEM) to form the CFD-DEM approach [13,14]. The ratio of fluid grid size to particle diameter significantly impacts simulation accuracy. The resolved method requires a size ratio ≤ 0.1, while the unresolved method recommends a ratio ≥ 3 [15,16]. In the intermediate range, both methods exhibit limitations in accuracy. To address this, researchers have proposed approaches such as the artificial diffusion method to improve particle boundary treatment. By introducing a diffusion-smoothing mechanism for physical quantities, this method effectively enhances numerical stability and has been successfully validated in practical studies: Sun and Xiao [17] applied it to a CFD-DEM solver based on OpenFOAM and LAMMPS. In fluidized bed simulations using refined grids with size ratios ranging from 1/2 to 2, they obtained more reliable and physically realistic results, significantly improving grid convergence. Zhou et al. [18] used this method to simulate solid-liquid two-phase flow of coarse particles in a vertical pipe. They found that lift forces improved numerical accuracy and revealed the influence of feed concentration on pressure drop and particle distribution. Zhao et al. [19] introduced an artificial diffusion method to develop a general CFD-DEM algorithm for ultra-coarse particles. The algorithm achieved two-way coupling between particles and turbulence, and its accuracy and broad applicability were successfully verified. Zhang et al. [20] employed the artificial diffusion method to systematically investigate, for the first time, the wear distribution of centimeter-sized particles in series elbows, revealing that wear depends not only on the number of collisions but also on particle energy and motion trajectories. These studies demonstrate that the artificial diffusion method exhibits strong adaptability and stability under unstructured grids and high Reynolds number conditions, making it particularly suitable for simulating coarse particles and high-concentration transport. Furthermore, the interaction between turbulence and particles cannot be neglected. In simulations of coarse particles and high-concentration transport, a two-way coupling approach must be used to incorporate particle effects as source terms in the fluid control equations and turbulence models [21,22], thereby more accurately reflecting flow characteristics.
In simulations of solid-liquid two-phase flow wear, early studies primarily employed the Mixture model based on the Euler-Euler approach. However, this method struggled to accurately capture interactions between large particles and wall surfaces, as well as associated wear. The Euler-Lagrange (E-L) method provided an effective solution to address this limitation. Among its variants, the Discrete Phase Model (DPM) and Dense Discrete Phase Model (DDPM) have been widely applied to predict wear in components such as pumps and bends. These models have been used to analyze the influence of particle size, concentration, and wall shape on wear. Studies have shown that optimizing blade leading-edge geometry or incorporating swirl generators can significantly reduce wear [23]. Nevertheless, these methods treat particles as mass points, neglecting volume fraction and inter-particle collisions, and are thus only suitable for low-concentration dilute flows. For conditions involving high concentrations and centimeter-sized large particles, the coupled CFD-DEM demonstrates distinct advantages and has been successfully applied to investigate wear mechanisms in bends: Zeng et al. [24] used the CFD-DEM to analyze the formation mechanism of rare V-shaped wear patterns in bends, identifying direct impact and sliding friction as the primary causes. Zhao et al. [25] revealed, based on a CFD-DEM model, that particle mass loading is a key parameter influencing wear in 90° bends, while lift forces play a negligible role. They also highlighted that pressure gradient forces and virtual mass forces should be considered in wear prediction. These studies demonstrate the strong potential of the CFD-DEM in elucidating complex wear mechanisms.
In centrifugal pump wear studies, the intense rotational and high-shear flows markedly enhance particle-fluid and particle-wall interactions. To accurately investigate these complex systems, the CFD-DEM has become a key tool, as it precisely characterizes particle dynamics and their coupling with the fluid. Lin et al. [26] used CFD-DEM simulations to study the effect of high particle concentration in a centrifuge. They found that increased particle loading aggravates flow distortion, wall wear, and degradation of hydraulic performance, with erosion mainly concentrated in high-turbulence zones and regions where particles collide with the wall. Cao et al. [27] employed a coupled CFD-DEM and Archard wear model to analyze the influence of particle size and shape on wear in a guide-vane centrifugal pump. Their study revealed that wear primarily occurs at the leading and trailing edges of the blades and the front edge of the guide vanes, and that both larger and smaller spherical particles exacerbate component wear.
Based on these foundations, this paper employs an oversize particle CFD-DEM numerical simulation method based on artificial diffusion. By tracking particle collision velocity, collision angle, and other information, the wear rate is calculated. Building upon earlier spiral centrifugal pump models with better wear resistance, the operational performance of a spiral centrifugal deep-sea mining pump under conditions of large particles and high concentration media is studied. The focus is on analyzing its wear, with optimization based on simulation results. To address the issue of localized premature failure caused by the wear distribution pattern in traditional spiral centrifugal pumps, this paper innovatively proposes a segmented-blade spiral centrifugal pump. Section 2 introduces the mathematical principles of the numerical model, while Section 3 systematically analyzes the particle motion and wear distribution in traditional spiral centrifugal pumps. Section 4 systematically examines the wear distribution in the segmented-blade spiral centrifugal pump and compares it with the original model to reveal its wear mechanism. Section 5 summarizes the main conclusions of the study.
2. Numerical Methods and Model Configuration
2.1. Liquid Phase
This study neglects temperature effects and treats the fluid phase as an incompressible continuous medium. The governing equations for the fluid consist solely of the mass conservation equation and the momentum conservation equation, expressed as follows:
where and are the fluid density and velocity, respectively; is the volumetric force exerted by particles on the fluid within a grid cell; represents the force applied by the fluid on a particle within the fluid grid; denotes the volume fraction occupied by the fluid; and are the volume of the computational cell and the number of particles within the cell, respectively.
Compared to the ordinary single-phase flow, two additional source terms, and , are introduced in the equations. According to the work by Crowe et al. [28], the influence of particles on the turbulent kinetic energy and turbulent dissipation rate can be expressed as:
where represents the instantaneous fluid velocity at the center of the particle, obtained by interpolating the transient fluid velocity at the center of the CFD cell, and is the particle velocity. The drag coefficient is defined as , and , where and .
2.2. Solid Phase
The governing equations for particle motion are established based on Newton’s second law, where the velocity of a particle in the flow field changes over time entirely governed by the forces acting upon it. The governing equations for particle motion include both the translational motion equation and the rotational motion equation, with their specific expressions given as follows:
In the equations, the left-hand side of Equation (7) represents the rate of change in particle momentum over time; the right-hand side accounts for all forces acting on the particle, including the drag force exerted by the fluid, the gravitational force of the particle itself, the lift force applied by the fluid, the pressure gradient force , the virtual mass force , the particle-particle and particle-wall interaction forces , and the buoyant force generated by the fluid on the particle. In the rotational motion equation, the left-hand side describes the temporal variation in the particle’s rotational velocity, where denotes the moment of inertia of the particle and represents its angular velocity; the right-hand side represents the torques acting on the particle, including the contact torque and the fluid-induced torque .
2.2.1. Drag Force Model
In the study of solid-liquid two-phase flow systems, the drag force fundamentally represents the core mechanism of momentum exchange between the continuous and dispersed phases. The drag model strategy proposed by Di Felice [29] is primarily adopted herein. By introducing a voidage correction factor, this model more smoothly and accurately captures the variation in drag forces across a wide range of flow conditions—from low-Reynolds-number viscous regimes to high-Reynolds-number inertial regimes. This capability makes it more universally applicable and accurate than fixed-formula models (e.g., Schiller-Naumann) when simulating solid-liquid two-phase flows in pumps where both low- and high-Reynolds-number flow structures coexist. The expression is given as follows:
here the particle Reynolds number is defined as:
where represents the spherical drag coefficient, which can be expressed as follow:
For non-spherical particles, the drag coefficient calculation model proposed by Haider and Levenspiel [30] can be adopted.
2.2.2. Lift Force Model
In multiphase flow systems, the lift force is a key mechanism in particle-fluid interactions, arising from asymmetric pressure distribution caused by flow shear, particle rotation, and turbulent fluctuations. It significantly influences the spatial distribution of particles (e.g., stratification in fluidized beds and enrichment in cyclones). Saffman [31] proposed a lift force model for particles in shear flow, originally applicable at low particle Reynolds numbers. Mei [32] subsequently modified the Saffman lift coefficient, introducing an approximate expression valid for higher Reynolds numbers. Oesterlé & Dinh [33] further investigated the Magnus lift induced by particle rotation and developed a calculation method for the corresponding lift coefficient at elevated particle Reynolds numbers. The Loth model [34] decomposes lift force into two additive parts: shear-induced and rotation-induced. This approach overcomes the limits of Saffman and Magnus models by considering both fluid vorticity and particle rotation. Therefore, this study adopts the more accurate Loth lift model:
where and denote the fluid vorticity and relative fluid vorticity, respectively; and represent the particle angular velocity and relative particle angular velocity, respectively; and indicates the rotational Reynolds number of the particle.
2.2.3. Models of Virtual Mass Force and Pressure Gradient Force [35]
The pressure gradient force arises from the uneven distribution of pressure within a fluid. In essence, it is a body force exerted on particles due to the spatial gradient in pressure potential, with an expression of:
The added mass force, on the other hand, arises when an accelerating particle induces an inertial effect in the surrounding fluid. This manifests as a delayed response of the fluid’s kinetic energy to the particle’s acceleration, with an expression of:
2.3. Solid-Liquid Bidirectional Coupling Model
2.3.1. Volume Fraction Algorithm Based on Artificial Diffusion
This study achieves simulation of complex two-phase flow by coupling interphase forces, volume fraction, and turbulence-particle interaction models. The back-coupling effect of particles on the fluid phase and turbulence modulation are handled through the incorporation of source terms. However, when the particle size is similar to the fluid grid scale, the traditional method of calculating particle volume fraction based on direct summation fails, which can easily trigger numerical oscillations and severely impact computational convergence. To address this issue, Sun and Xiao [36] proposed a particle volume fraction smoothing method based on pseudo-temporal diffusion. First, the mesh porosity is preliminarily calculated using the Monte Carlo point method according to Equation (23), which is designated as the initial particle volume fraction. Subsequently, the transient diffusion Equations (24) and (25) are solved over pseudo-time τ to achieve smoothing treatment of the volume fraction field.
where represents the volume of the discrete portion of particle within the grid cell, and denotes the number of particles overlapping with the grid cell.
In this method, the diffusion distance (bandwidth b) is determined based on the particle wake scale. Wu and Faente et al. [37] recommend setting b to 2 to 4 times the particle diameter. This model has been validated as effective in fluidized bed simulations, significantly improving the accuracy of flow field calculations in the simulation of large-particle transport using traditional unresolved CFD-DEM, and demonstrates good adaptability to complex grids and irregular boundaries.
2.3.2. Random Walk Model [38]
The instantaneous fluid velocity is composed of the mean fluid velocity and the fluctuating velocity :
The fluctuating velocity in turbulence follows a Gaussian distribution and is obtained by the following expression:
where , and are all random numbers following a Gaussian distribution. In the Reynolds-averaged approach, turbulence is treated as isotropic. Thus, the fluctuating velocity is calculated as follows:
where denotes the turbulent kinetic energy of the fluid.
2.4. Wear Model
The accuracy of wear prediction relies on precise simulation of flow fields and particle interactions, as well as appropriate wear models. Based on extensive experimental data, Ahlert [39] established a mathematical relationship between particle velocity, shape, impact angle, material hardness, and wall wear volume. Peng and Cao [40] compared five wear models and combined them with a particle rebound model to predict wear in pipe bends. Their results indicated that the E/CRC (Erosion/Corrosion Research Center) model showed the best agreement with experimental data. The specific expression is as follows:
where ER denotes the erosion rate, representing the weight of material loss caused by particle impact on the surface; BH refers to the Brinell hardness of the wall material; is the particle shape coefficient, with a value of 0.2 adopted in this study; indicates the particle impact velocity; represents the impact angle in radians; serves as the velocity exponent; and is an empirical constant. The values of () are 5.3983, −10.1068, 10.9327, −6.3283, and 1.4234, respectively.
3. Research on Wear Characteristics of Helical Centrifugal Mining Pumps
3.1. Model Establishment and Mesh Generation
3.1.1. Geometric Model
The main design and geometric parameters of the helical centrifugal deep-sea mining pump studied in this paper are presented in Table 1, and its three-dimensional model is shown in Figure 1. Under clear water conditions, the two-stage pump achieves a head of 110.4 m and an efficiency of 57.29%.

Table 1.
Main parameters of the pump.
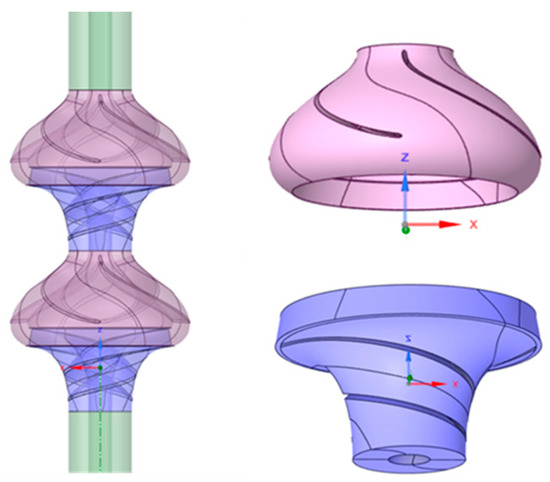
Figure 1.
3D model of the pump and fluid domains of main flow components.
3.1.2. Mesh Generation
For CFD-EDEM coupled simulations, computational accuracy does not solely depend on finer mesh resolution. Instead, the mesh element size should approach the particle diameter while ensuring mesh quality and sufficient resolution of the flow field. To balance computational accuracy and efficiency in solid-liquid two-phase flow simulations, three mesh schemes (as shown in Figure 2) were tested: fine mesh (7.26 million elements), medium mesh (4.32 million elements), and coarse mesh (1.31 million elements). A grid independence study was conducted using the head at the design flow rate under clear water conditions (as shown in Figure 3a), as well as the velocity (as shown in Figure 3b) and pressure (as shown in Figure 3c) at the inlet and outlet of the first-stage impeller blades as reference metrics. The results show that the computational deviations of the coarse and medium grids relative to the fine grid are 2.5% and 2.8%, respectively, both falling within an acceptable range. Ultimately, the medium mesh scheme was selected for meeting the required computational precision.
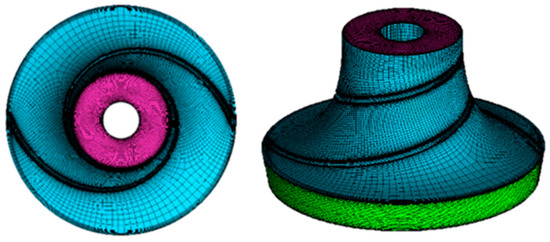
Figure 2.
Mesh generation.
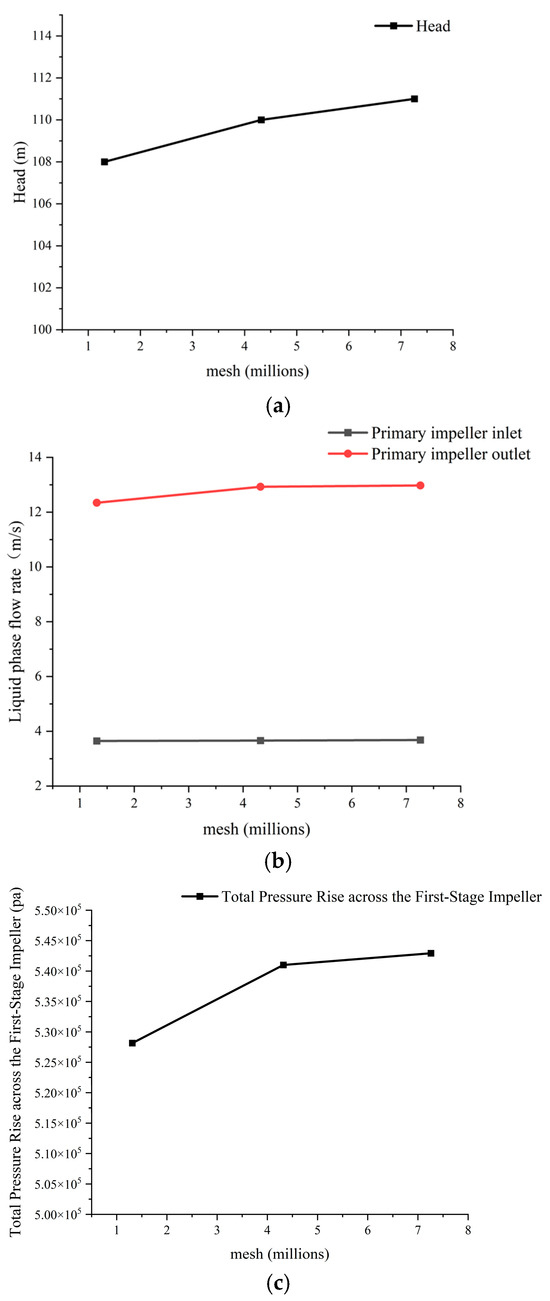
Figure 3.
Grid Independence Analysis: (a) head under clear water conditions; (b) velocity magnitude at first-stage impeller inlet/outlet; (c) total pressure rise across the first-stage impeller.
3.1.3. Boundary Condition Setup
This study employed ANSYS Fluent 17.2 software for computational fluid dynamics (CFD) simulations. The fluid medium was ordinary seawater, with physical properties set as follows: temperature 20 °C, density 1000 kg/m3, and dynamic viscosity 0.001003 Pa·s. A velocity inlet boundary condition was applied at the inlet, with a flow velocity of 3.65 m/s, turbulence intensity of 5%, and hydraulic diameter set equal to the pump inlet diameter. The outlet was configured as an outflow boundary. The impeller region was defined as a rotating domain with a rotational speed of 1450 rpm, while the remaining regions were stationary. Data exchange between different domains was achieved through interface connections. To ensure full mixing of particles and fluid, a straight pipe section with a length of 7 times the pipe diameter was placed upstream of the impeller. All walls were treated with no-slip conditions. For numerical calculations, the RNG k-ε turbulence model was selected. The coupling between velocity and pressure fields was resolved using the SIMPLEC algorithm. Discretization of the momentum equation, turbulent kinetic energy, and turbulent dissipation rate was performed using the second-order upwind scheme.
Particle dynamics were simulated using EDEM 2018 software, with the impeller rotational speed consistent with the Fluent settings (1450 rpm). In the EDEM model, the pump inlet was defined as a virtual boundary where a particle factory was set to control the volume concentration of the particulate phase by adjusting the number of particles injected per second. Particle-particle interactions were described using the Hertz-Mindlin (no-slip) contact model, and the E/CRC wear model was introduced to evaluate the erosive wear of particles on the flow-passing walls. Referring to the prevailing particle concentration of 12% in modern mining pumps, this study selected particles with a diameter of 20 mm and conducted calculations and analyses of the pump’s hydraulic performance, particle distribution characteristics, and wear amount on overflow components under volume concentrations ranging from 5% to 15%. The specific property parameters of particles and wall materials are listed in Table 2.
Table 2.
Properties of particles and wall materials.
A self-developed coupling interface was employed to achieve bidirectional coupled calculations between EDEM and FLUENT. This interface established two-way interaction models for particle-fluid and particle-turbulence coupling. To balance computational accuracy and efficiency, a phased computation strategy was adopted: first, a 0.2 s pure fluid flow simulation (corresponding to 5 impeller revolutions) was conducted to stabilize the flow field, after which particle generation was activated at the inlet of the straight pipe section. Based on particle properties and impeller rotational speed, the EDEM time step was set to 1 × 10⁻⁵ s, representing 20–40% of the Rayleigh critical time step. During coupled simulation, the fluid time step was set as an integer multiple of the particle time step (5 × 10⁻⁵ s), with a step ratio of 1:5, meaning the flow field was updated every 4.35° of impeller rotation. The convergence residual was set to the default standard, with a maximum of 100 iterations per step and a total of 120,000 computation steps. Data were saved every 0.1 s, and the total simulated duration was 6 s (equivalent to 145 impeller revolutions).
3.2. Particle Motion in a Helical Centrifugal Mining Pump
Figure 4, Figure 5 and Figure 6 present the distributions of particle position, velocity, and velocity vectors within the pump at different particle concentrations, respectively. By combining Figure 5 and Figure 6, it is observed that the particle motion patterns are similar across the three operating conditions. First, Figure 4 reveals a noticeable decrease in particle velocity near the first-stage impeller at a particle concentration of 5%. This phenomenon may be attributed to the complex pressure gradient generated by the impeller rotation at the inlet of the first-stage impeller. Given that the density of particles is significantly higher than that of water, inertial effects prevent the particles from fully following the fluid’s instantaneous changes in motion. As a result, the particles deviate from the streamlines, leading to localized velocity lag. Additionally, at higher particle concentrations, increased inter-particle collisions and particle-fluid friction exacerbate energy loss and suppress turbulence intensity, which also contributes to the reduction in particle velocity in this region. As the particle concentration increases, enhanced particle aggregation further intensifies energy loss, resulting in a decreased average particle velocity in the inlet pipe.
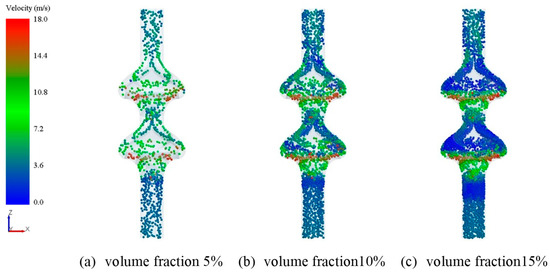
Figure 4.
The distribution of particle position and velocity in a helical centrifugal mining pump at different concentrations.
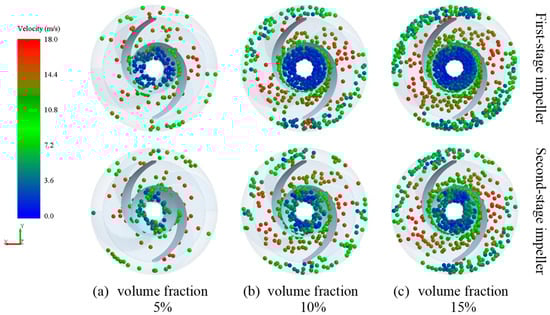
Figure 5.
The distribution of particle position and velocity in a helical centrifugal impeller at different concentrations.
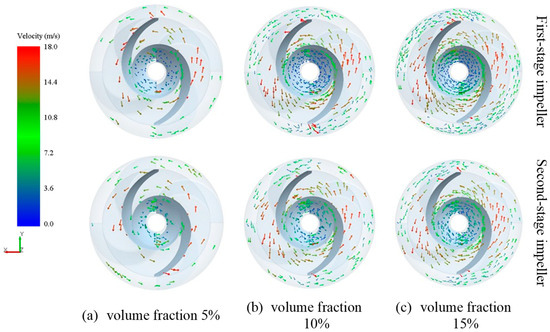
Figure 6.
The velocity vector diagram of particles in a helical centrifugal impeller at different concentrations.
The helical leading edge of the spiral centrifugal pump draws particles from the impeller inlet into the flow channel, and the helical section then conveys them toward the centrifugal section. As shown in Figure 5 and Figure 6, particles initially move close to the suction side of the blades. As the flow passage widens, the particles detach from the suction side and disperse within the passage while gradually moving toward the pressure side of the impeller. This behavior is influenced by the impeller’s two-blade design. The specific blade orientation, characterized by a high rap angle, means the leading edge (LE) of one blade aligns with the mid-region of the suction side of the opposing blade. This geometry guides particles sucked in from the leading edge. Subsequently, the combined effects of the flow channel shape and centrifugal force cause the particles to disperse. At the inlet impeller first-stage, the particles concentration with low velocity increased as the particle volume fraction. However, the particles concentration at inlet impeller second-stage, the area with low velocity with high velocity particles apparition. Furthermore, the particles velocity decrease from the suction side to outer region. Under the effect of flow separation on the suction side, the particles disperse within the passage. Subsequently, driven by centrifugal force, the particles gradually accelerate in the mid-to-rear section of the impeller, gathering along the spiral flow path to-wards the outer region. In this section, the velocity gradient decreases, and flow stability improves.
3.3. Wear Characteristics
3.3.1. Wear Distribution
In this section, the wear characteristics of the deep-sea mining pump with helical centrifugal blades are analyzed under the 10% concentration condition based on wear contour maps. By comparing the wear regions, wear rates, and impact frequencies between the primary and secondary stages, the wear patterns are elucidated. As shown in Figure 7, which presents the wear contours of the primary and secondary impellers at a particle concentration of 10%, it can be observed that the wear regions of the primary impeller are generally consistent with those of the secondary impeller, but the wear degree of the primary impeller is significantly more severe.
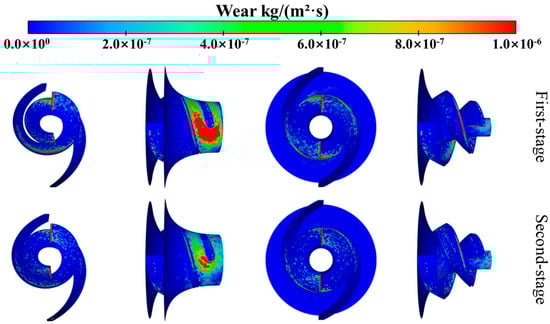
Figure 7.
Wear distribution on components of primary and secondary impellers at 10% volume concentration.
Due to the scattered distribution of wear patches on the spiral centrifugal blades, with the upper part of the blades showing densely concentrated flocculent wear, the blades were divided into 10 equal intervals, denoted as A (as shown in Figure 8), to study the specific wear distribution on the blades. Here, A represents the normalized position coordinate, ranging from 0 to 1.0, where A = 0 corresponds to the blade’s leading edge (inlet), and A = 1.0 corresponds to the trailing edge (outlet). The segment from A = 0 to A = 0.1 is defined as the first segment, and so forth. Each interval includes the suction side and the pressure side. The average wear rate within each interval was calculated and is presented in Figure 9. The spatial distribution of blade wear is shown in Figure 7. Its main characteristics are as follows: apart from the concentrated wear area at the leading edge, high-wear regions are primarily located in the mid-section of the blade. This spatial distribution closely corresponds to the wear statistics in Figure 9—the leading edge (A = 0–0.1) contributes 61% of the total wear, while the mid-section (A = 0.25–0.65) accounts for 28%, with the peak observed at A = 0.45. The wear in the mid-section results from its proximity to the leading edge of an adjacent blade: some particles rebound after impacting the leading edge and strike the mid-section surface with higher energy in a secondary impact, eventually sliding out along the suction side. This process leads to significant cutting wear in this region. The wear region on the front shroud starts from the blade leading edge and extends until the particles are centrifugally thrown out. Since particles tend to accumulate near the junction between the blade concave surface and the front shroud, the wear distribution pattern on the front shroud generally aligns with that on the blade concave surface.
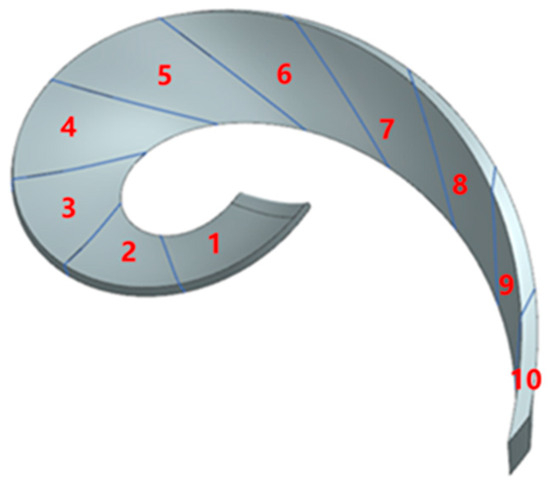
Figure 8.
Blade area division: The numbers 1–10 in the diagram represent ten equally spaced intervals divided from the blade leading edge to the trailing edge.
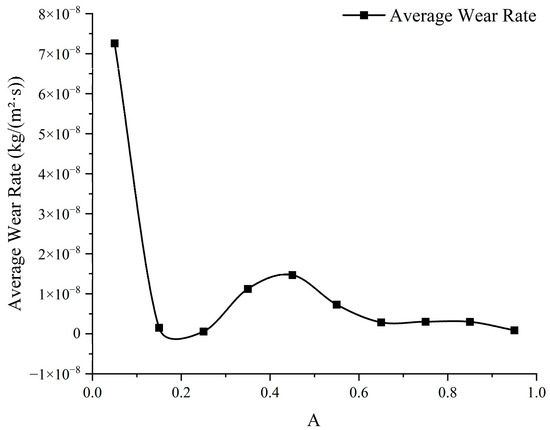
Figure 9.
Average wear rate of primary impeller blades at 10% particle volume concentration.
Figure 10 shows the total wear rate distribution of the primary and secondary impellers. It can be observed that the component with the highest total wear in the primary impeller is the blade, followed by the front shroud, while the wear on the rear shroud is minimal. This is because, under centrifugal force, most particles are concentrated near the intersection of the blades and the front shroud. Therefore, the subsequent analysis will focus primarily on the blades and the front shroud. Figure 11 compares the impact frequencies of different parts of the primary and secondary impellers. The impact frequency on the front shroud of the primary impeller is significantly higher than that on the blades, yet its wear amount is only one-third of that on the blades. This suggests that the wear mechanisms for these two components may differ. As mentioned earlier, particles exhibit lower velocities and phenomena such as flow separation and velocity lag near the impeller inlet. In this region, the relative velocity between the particles and the high-speed rotating blades is considerable. Although the impact frequency is relatively low, the collisions still cause significant impact wear. On the other hand, particles are transported outward along the flow channel by the helical conveying effect of the impeller and are continuously accelerated by centrifugal force while remaining close to the blades. As a result, high-speed particles frequently contact the blades, but the relative velocity between the particles and the points of contact on the blades is low, and the impact angles are small. This type of wear can be classified as cutting wear.
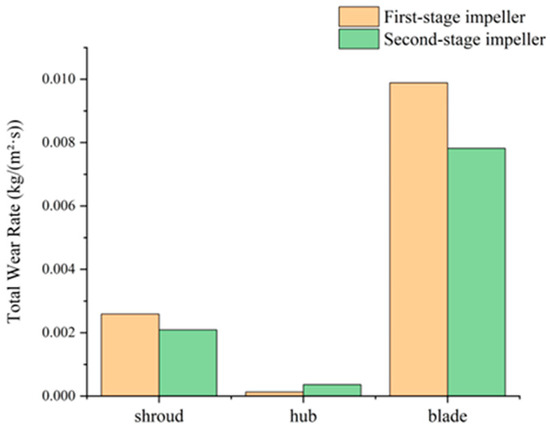
Figure 10.
Total wear rates of primary and secondary impeller components at 10% particle volume concentration.
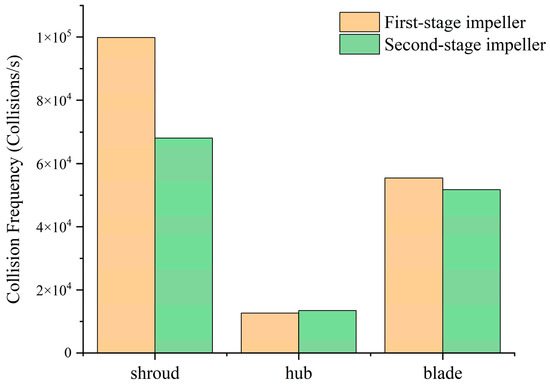
Figure 11.
Collision frequency of primary and secondary impeller components at 10% particle volume concentration.
3.3.2. Effect of Particle Concentration on Wear
Figure 12 shows the wear distribution contours on different components of first-and second-stage impeller under 15% particle volume concentration condition. Compared to the 10% condition, the wear area expands significantly, although the fundamental wear characteristics remain largely unchanged. However, the wear magnitude increases noticeably across all regions. Specifically, the severely worn areas near the leading edge of the blades extend further on the concave surface of the adjacent blade and the front shroud. The wear regions on the concave surface of the front shroud become more continuous around the blade concave surface, while the strip-like worn areas on the blade concave surface expand toward the rear shroud.
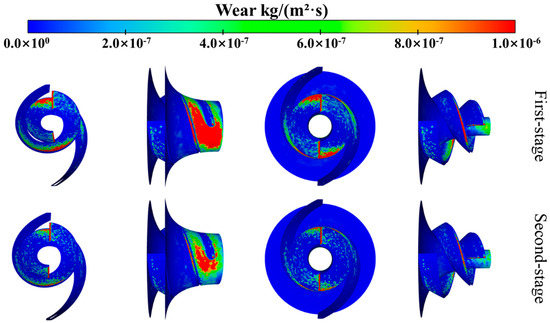
Figure 12.
Wear distribution on components of primary and secondary impellers at 15% volume concentration.
Figure 13 and Figure 14 show the comparative changes in total wear rate and impact frequency of the primary and secondary impellers at different particle concentrations, where “1” denotes the primary impeller and “2” denotes the secondary impeller. As observed in the figures, when the particle volume concentration increases from 5% to 10%, both the total wear rate and impact frequency of the impellers rise with increasing concentration. Among these, the total wear rate of the primary impeller blades shows the largest increase, while the impact frequency on the front shroud increases the most. When the particle concentration increases from 10% to 15%, the growth rates of both wear rate and impact frequency decrease significantly. This is because, as the particle volume fraction increases, more particles accumulate on the blade surface, forming a “protective layer” composed of particles. This layer prevents additional particles from causing further wear on the blades. Therefore, as the particle volume fraction increases, the wear rate of the blades tends to saturate, and the increase in wear amount becomes less pronounced.
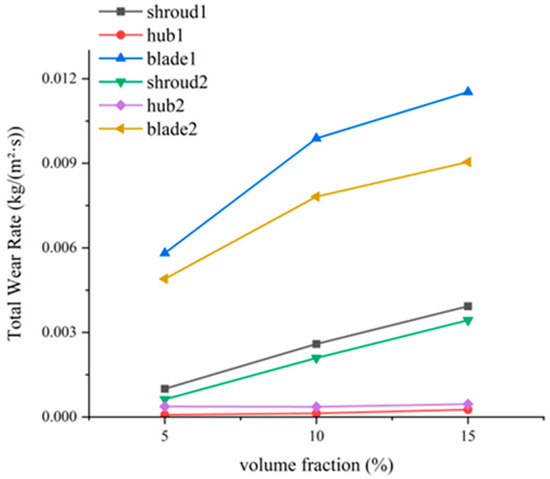
Figure 13.
Variation in total wear rates in primary and secondary impellers at different particle concentrations.
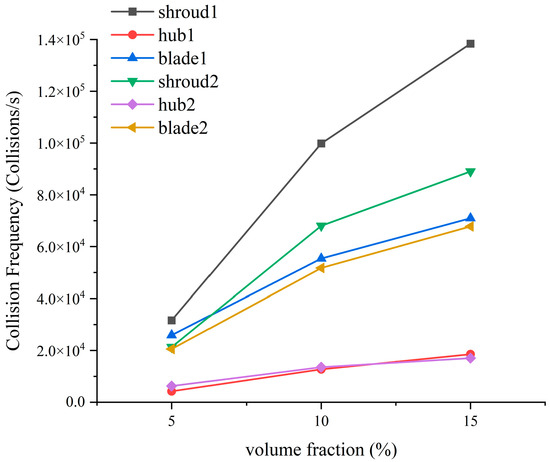
Figure 14.
Variation in collision frequency in primary and secondary impellers at different particle concentrations.
When comparing the primary and secondary impellers, although the wear distribution pattern shows little change, the total wear on both the blades and the front shroud has significantly decreased, with a reduction magnitude similar to that of the impact frequency. The total wear rate at the blades decreased from 0.00989 kg/(s·m2) in the primary impeller to 0.00782 kg/(s·m2) in the secondary impeller, a reduction of 21%. Meanwhile, the impact frequency decreased from 55,382 collision/s in the primary impeller to 51,736 collision/s in the secondary impeller, a reduction of 7%. This indicates that, for the blades, the difference between the primary and secondary impellers is influenced by the change in impact frequency.
In summary, during the actual operation of conventional spiral centrifugal deep-sea mining pumps, impeller wear is not uniformly distributed but is highly concentrated in two critical regions: the leading edge of the blade inlet and the mid-section of the blade. The leading edge suffers severe impact wear due to direct impingement by high-velocity, coarse particles, a problem exacerbated by the mismatch between the inflow angle and the blade inlet angle. Meanwhile, particles rebound after striking the leading edge of adjacent blades and are carried along the suction side of the mid-blade section, resulting in significant cutting wear as they are propelled outward. This discontinuous and distinct wear distribution poses a major challenge for implementing effective anti-wear treatments. Applying a uniform surface hardening process—such as wear-resistant alloy overlay welding—fails to address the differing mechanical demands: the leading edge requires high impact resistance, while the mid-section needs endurance against sustained abrasive wear. As a result, treatment effectiveness is often compromised. Alternatively, applying region-specific treatments introduces complications such as complex processes, high costs, and potential weak points at treatment boundaries. Therefore, this specific wear pattern significantly limits the practicality of existing anti-wear technologies. Even after treatment, localized premature failure remains a persistent risk, making it a critical bottleneck in enhancing the reliability and service life of the equipment.
4. Study on Wear Characteristics of Segmented-Blade Helical Centrifugal Mining Pumps
The above discussion indicates that the wear distribution pattern on conventional helical centrifugal impeller blades in solid-liquid two-phase flow significantly complicates wear-resistant treatment. Therefore, this study innovatively proposes an optimized design of a segmented-blade helical centrifugal impeller, aiming to modify the wear distribution pattern on the blades, facilitate more effective wear-resistant treatment, and ultimately enhance the service life of the impeller.
4.1. Model Development of a Segmented-Blade Helical Centrifugal Mining Pump
This section presents the optimized impeller model for the helical centrifugal deep-sea mining pump. The main design and geometric parameters remain largely consistent with those of the conventional helical centrifugal mining pump described in the previous section, but structural improvements have been implemented. The new segmented helical centrifugal impeller concentrates severe wear primarily on the blade leading edges. The segmented-blade design involves truncating and staggeringly arranging the blades at locations prone to concentrated wear, while moderately increasing the axial spacing of the impeller. The three-dimensional model of the optimized design is shown in Figure 15. Mesh generation and computational settings follow the same methodology as earlier sections and are not repeated here. Figure 16 compares the hydraulic performance of the models before and after optimization. The results show a 1.37% increase in head and a 3.8% decrease in efficiency. The elongation of the impeller axial spacing raises the head, but the structure of the segmented spiral centrifugal impeller reduces efficiency.
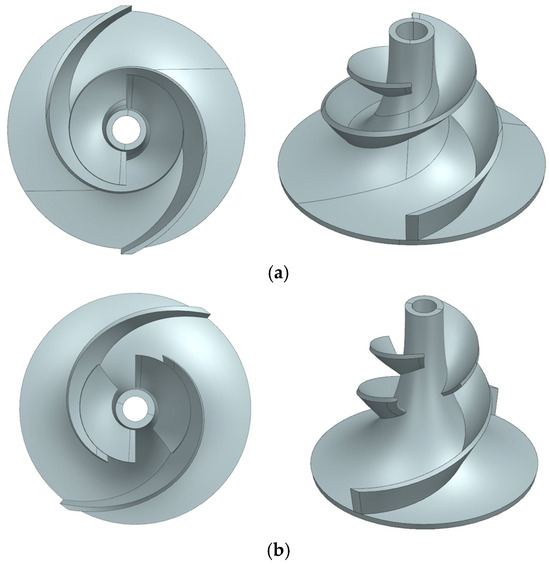
Figure 15.
Pump 3D modeling and fluid domain of main overflow components: (a) original model impeller blades; (b) the impeller blades of the optimized model.
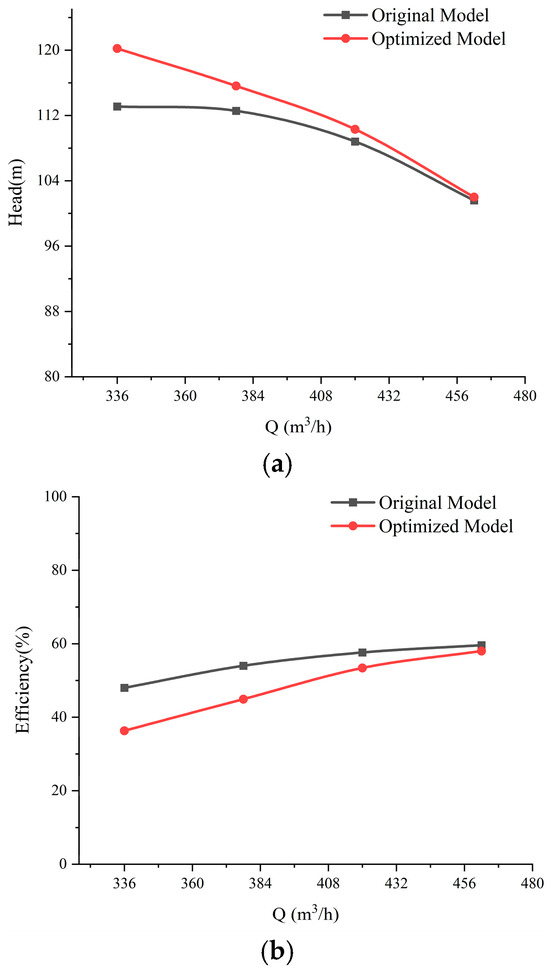
Figure 16.
Comparison of hydraulic performance: (a) head under clear water conditions; (b) head under clear water conditions.
4.2. Particle Motion in a Segmented-Blade Helical Centrifugal Mining Pump
Figure 17 shows the position and velocity distribution of particles at different concentrations within the pump. Combined with Figure 18 and Figure 19, it can be observed that particles enter the impeller from the inlet, collide with the blades and cause wear. When reaching the front and middle sections of the blades, most particles pass through the truncated region from the suction side to the pressure side of the blades, and disperse in the flow channel under the action of drag force, thereby preventing continuous wear on the suction side of the blades.
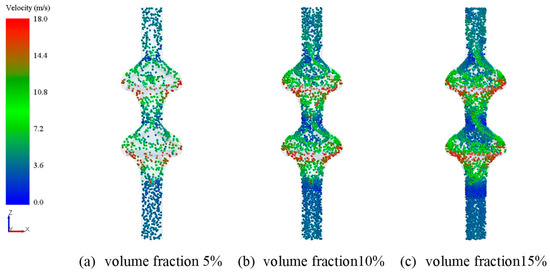
Figure 17.
The distribution of particle position and velocity in a segmented-blade helical centrifugal mining pump at different concentrations.
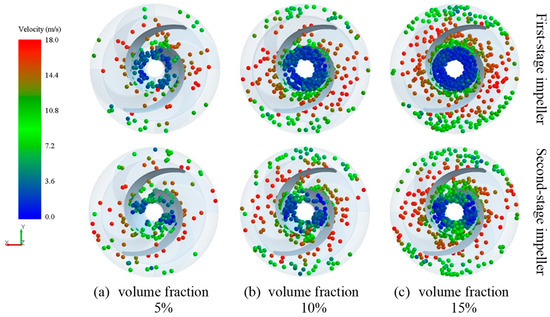
Figure 18.
The distribution of particle position and velocity in a segmented-blade helical centrifugal impeller at different concentrations.
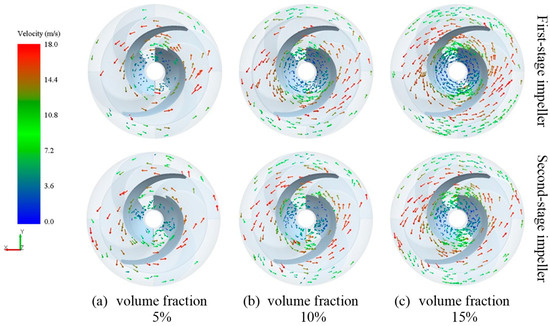
Figure 19.
The velocity vector diagram of particles in a segmented-blade helical centrifugal impeller at different concentrations.
4.3. Wear Characteristics Comparison
This section takes the 10% concentration condition as an example to compare the segmented-blade helical centrifugal mining pump with the conventional helical centrifugal mining pump, analyzing their differences in wear characteristics based on wear contour maps.
Figure 20 and Figure 21 compare the wear distribution contours of the impellers for both the segmented-blade helical centrifugal mining pump and the conventional helical centrifugal mining pump at a particle volume concentration of 10%. The differences in wear distribution between the two impeller types are clearly visible: the conventional helical centrifugal impeller exhibits concentrated wear at the blade leading edges and mid-sections, whereas the segmented-blade helical centrifugal impeller shows concentrated wear mainly at the leading edges of its two blade segments, with only minor wear distributed in other areas of the blades. Additionally, at the impeller inlet, the severe wear area on the front shroud of the segmented-blade impeller is smaller than that of the conventional impeller, but the overall wear area is larger.
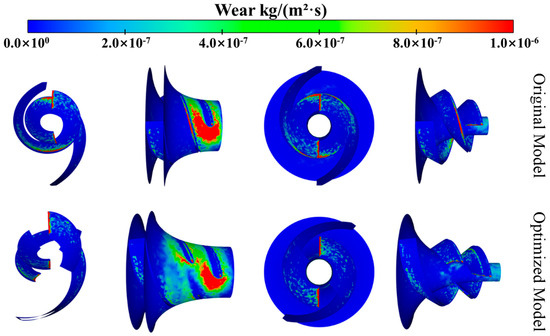
Figure 20.
Wear distribution on components of the primary impeller at 10% particle volume concentration.
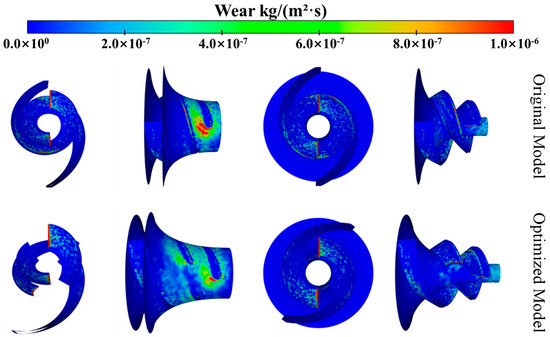
Figure 21.
Wear distribution on components of the secondary impeller at 10% particle volume concentration.
Figure 22 quantitatively compares the average wear rate distribution of the primary impeller between the conventional helical centrifugal pump and the segmented-blade helical centrifugal pump. As shown in the figure, the concentrated distribution patterns of wear rates in both models align with the wear area patterns described earlier. For the segmented-blade centrifugal impeller, the wear rates are primarily concentrated at the leading edge regions, specifically in the intervals A = 0–0.1 and A = 0.2–0.3. In contrast, the conventional helical centrifugal impeller exhibits concentrated wear not only at the leading edge (A = 0–0.1) but also in the front-to-mid sections of the blade, specifically in the interval A = 0.25–0.65.
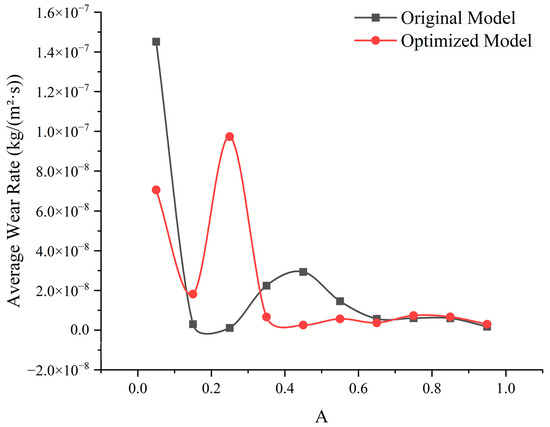
Figure 22.
Average wear rate distribution of the first-stage impeller components at a 10% particle volume concentration.
Figure 23 shows the blade impact frequency distribution of the original and optimized models, which follows a similar pattern to the wear rate distribution in Figure 22. Figure 24 further analyzes the impact angles in the concentrated impact and wear regions of the blades for both models. The results indicate that in the conventional spiral centrifugal impeller blades, approximately 56.4% of impact angles in the leading-edge region (A = 0–0.1) are below 20°, corresponding to cutting wear. In contrast, in the front-middle blade region (A = 0.25–0.65), as high as 96.8% of impact angles are below 20°. This suggests that wear at the blade leading edge results from a combination of cutting wear and impact wear, while the concentrated wear in the front-middle region is dominated by cutting wear. This also partly explains why the wear rate at the blade leading edge is higher than that in the front-middle region.
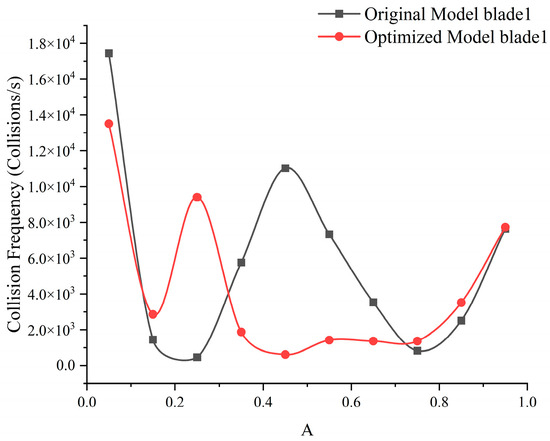
Figure 23.
Distribution of the collision frequency of the impeller blades.
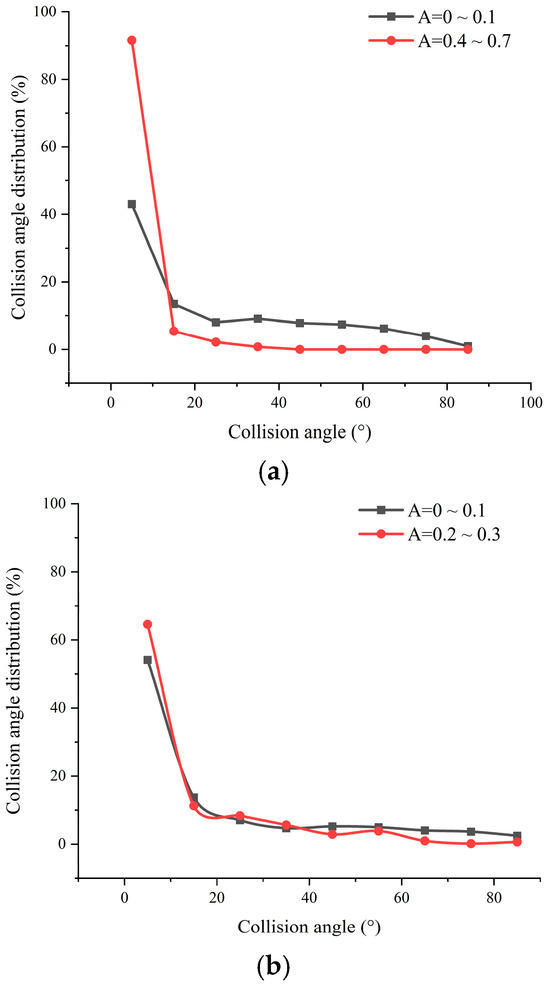
Figure 24.
Distribution of the collision angle of the impeller blades: (a) collision angle Distribution on Blades of the Original Impeller Model; (b) collision angle Distribution on Blades of the Optimized Impeller Model.
In the segmented-blade helical centrifugal impeller, the impact frequency at the leading edge of the first blade segment is slightly higher than that of the second blade segment, while the distribution of impact angles is similar for both leading edges. This indicates that wear in both regions results from a combination of cutting wear and impact wear. Notably, the average relative impact velocity between particles and the leading edge of the first blade segment is approximately 6.79 m/s. However, after being accelerated by the first blade segment, the average relative impact velocity of particles striking the leading edge of the second blade segment increases to 8.67 m/s. This difference in impact velocity is a key reason why the wear rate at the leading edge of the second blade segment is higher than that of the first blade segment.
Simultaneously, the reason why the wear rate at the leading edge of the conventional helical centrifugal impeller blade is higher than that of the segmented-blade helical centrifugal impeller can also be explained. The elongation of the impeller’s axial spacing alters the angle of attack at the leading edge of the blades. This change reduces the impact frequency on the leading edge of the segmented helical centrifugal impeller. More importantly, it modifies the distribution pattern of impact angles: compared to the impact angle distribution at the leading edge of the conventional helical centrifugal impeller, the impact angles at the leading edge of the segmented-blade helical centrifugal impeller are more concentrated below 20°. This indicates that a portion of the impact wear has shifted to cutting wear.
Furthermore, the reason why the wear rate at the leading edge of the conventional helical centrifugal impeller blade is higher than that of the segmented-blade design is also clarified. The extended axial spacing of the impeller alters the attack angle at the blade leading edge, which reduces the impact frequency on the leading edge of the segmented-blade impeller. More importantly, it modifies the distribution pattern of impact angles: compared to the conventional impeller, the impact angles at the leading edge of the segmented-blade impeller are more concentrated below 20°, indicating that a portion of impact wear has been transformed into cutting wear. Simultaneously, the total wear rates of various components in the impeller before and after optimization are shown in Figure 25 and Figure 26. In the optimized model, the total wear rate of the primary impeller remains similar, while that of the secondary impeller decreases significantly to 79.5% of its original value.
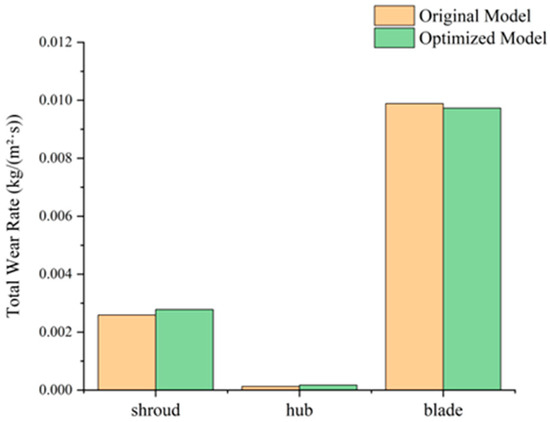
Figure 25.
Total wear rates of primary impeller components at 10% particle volume concentration.
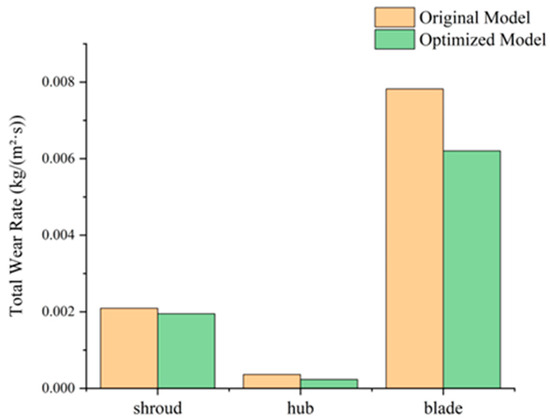
Figure 26.
Total wear rates of secondary impeller components at 10% particle volume concentration.
5. Conclusions
To enhance the wear resistance of deep-sea mining pumps under conditions involving large particles and high concentrations, this paper proposes a novel design scheme for a segmented-blade spiral centrifugal impeller. Based on CFD-DEM coupled numerical simulations, the particle motion, and wear distribution of the proposed design are systematically analyzed and compared with those of traditional spiral centrifugal pumps. The main findings are as follows:
- Impeller Structural Innovation: A segmented double-blade layout is adopted, where the blades are truncated and arranged in a staggered configuration in wear-prone areas. This design guides particles from the suction side to the pressure side, improves flow uniformity, and extends the axial length of the impeller, thereby balancing the demands for high head and high passage capability.
- Optimization of Particle Motion: The new impeller effectively disrupts the adherence of particles to the suction side, promotes particle diffusion within the flow passage, optimizes velocity distribution, and reduces localized impact and energy loss.
- Shift in Wear Mechanism: In traditional impellers, wear bands are continuously distributed along the front and middle sections of the blades, leading to premature local failure. In contrast, the new impeller confines wear concentration to the leading edges of the two blade segments. The wear mechanism shifts from being predominantly cutting-based to a combination of impact and cutting, facilitating targeted anti-wear treatments and significantly extending the impeller’s service life.
Future research should further explore the adaptability of this design to different types of pumps and extreme concentration conditions, and validate its long-term wear resistance through experimental studies. The findings of this research not only directly contribute to the technological advancement of deep-sea mining equipment, but also offer valuable insights for the development of other industrial pumps handling highly abrasive media, by introducing a design philosophy of “controlling wear by guiding particle movement.”
Author Contributions
Conceptualization, R.Z. and H.L.; methodology, R.Z. and H.L.; software, I.F. and T.Y.; validation, T.Y. and I.F.; formal analysis, H.L.; investigation, T.Y.; resources, R.Z. and D.Z.; data curation, R.Z.; writing—original draft preparation, H.L. and I.F.; writing—review and editing, H.L. and R.Z.; visualization, H.L. and T.Y.; supervision, R.Z.; project administration, R.Z.; funding acquisition, R.Z. and D.Z. All authors have read and agreed to the published version of the manuscript.
Funding
This research was funded by the National Natural Science Foundation of China, grant number 52176038, and the National Natural Science Foundation of China, grant number 52571294.
Data Availability Statement
The original contributions presented in this study are included in the article. Further inquiries can be directed to the corresponding author.
Conflicts of Interest
The authors declare no conflicts of interest.
References
- Hong, S.; Kimg, H.W.; Choi, J.; Yeu, T.K.; Park, S.J.; Lee, C.H.; Yoon, S.M. A self-propelled deep-seabed miner and lessons from shallow water tests. In Proceedings of the International Conference on Offshore Mechanics and Arctic Engineering, Shanghai, China, 6–11 June 2010; Volume 49118, pp. 75–86. [Google Scholar]
- Chung, J.S. An articulated pipe-miner system with thrust control for deep-ocean crust mining. Mar. Georesour. Geotechnol. 1998, 16, 253–271. [Google Scholar] [CrossRef]
- Stawinski, L.; Kosucki, A.; Morawiec, A.; Sikora, M. A new approach for control the velocity of the hydrostatic system for scissor lift with fixed displacement pump. Arch. Civ. Mech. Eng. 2019, 19, 1104–1115. [Google Scholar] [CrossRef]
- Hilber, H.M.; Hughes, T.J.R.; Taylor, R.L. Improved numerical dissipation for time integration algorithms in structural dynamics. Earthq. Eng. Struct. Dyn. 1977, 5, 283–292. [Google Scholar] [CrossRef]
- Yoon, C.H.; Park, Y.C.; Lee, D.K.; Kwon, K.S.; Kwon, S.K. Hydraulic pumping test system of KIGAM for deep-sea manganese nodules. In Proceedings of 33rd Underwater Mining Institute, Jeju, Republic of Korea, 6–10 October 2003; pp. 131–135. [Google Scholar]
- Ramesh, N.R.; Thirumurugan, K.; Raphael, D.C.; Ramadass, G.A.; Atmanand, M.A. Development and subsea testing of polymetallic nodule crusher for underwater mining machine. Mar. Technol. Soc. J. 2021, 55, 65–72. [Google Scholar] [CrossRef]
- Okamoto, N.; Shiokawa, S.; Kawano, S.; Yamaji, N.; Sakurai, H.; Kurihara, M. World’s first lifting test for seafloor massive sulphides in the Okinawa Trough in the EEZ of Japan. In Proceedings of the ISOPE International Ocean and Polar Engineering Conference, Honolulu, HI, USA, 16–21 June 2019. [Google Scholar]
- Hu, Q.; Li, Z.F.; Zhai, X.Y.; Zheng, H. Development of hydraulic lifting system of deep-sea mineral resources. Minerals 2022, 12, 1319. [Google Scholar] [CrossRef]
- Ge, W.; Wang, L.; Xu, J. Discrete simulation of granular and particle-fluid flows: From fundamental study to engineering application. Rev. Chem. Eng. 2017, 33, 551–623. [Google Scholar] [CrossRef]
- Hadinoto, K. Predicting turbulence modulations at different Reynolds numbers in dilute-phase turbulent liquid–particle flow simulations. Chem. Eng. Sci. 2010, 65, 5297–5308. [Google Scholar] [CrossRef]
- Kaushal, D.R.; Thinglas, T.; Tomita, Y.; Kuchii, S.; Tsukamoto, H. CFD modeling for pipeline flow of fine particles at high concentration. Int. J. Multiph. Flow 2012, 43, 85–100. [Google Scholar] [CrossRef]
- Liu, Y.C.L. Numerical investigation on the pressure loss of coarse particles hydraulic lifting in the riser with the lateral vibration. Powder Technol. 2020, 367, 105–114. [Google Scholar] [CrossRef]
- Kuang, S.; Zhou, M.; Yu, A. CFD-DEM modelling and simulation of pneumatic conveying: A review. Powder Technol. 2020, 365, 186–207. [Google Scholar] [CrossRef]
- Kuang, S.; Chu, K.; Yu, A.; Zou, Z.S.; Feng, Y.Q. Computational investigation of horizontal slug flow in pneumatic conveying. Ind. Eng. Chem. Res. 2008, 47, 470–480. [Google Scholar] [CrossRef]
- Uhlmann, M. An immersed boundary method with direct forcing for the simulation of particulate flows. J. Comput. Phys. 2005, 209, 448–476. [Google Scholar] [CrossRef]
- Wang, Z.; Teng, Y.; Liu, M. A semi-resolved CFD–DEM approach for particulate flows with kernel based approximation and Hilbert curve based searching strategy. J. Comput. Phys. 2019, 384, 151–169. [Google Scholar] [CrossRef]
- Sun, R.; Xiao, H. Diffusion-based coarse graining in hybrid continuum–discrete solvers: Applications in CFD–DEM. Int. J. Multiph. Flow 2015, 72, 233–247. [Google Scholar] [CrossRef]
- Zhou, M.; Wang, S.; Kuang, S.; Luo, K.; Fan, J.; Yu, A. CFD-DEM modelling of hydraulic conveying of solid particles in a vertical pipe. Powder Technol. 2019, 354, 893–905. [Google Scholar] [CrossRef]
- Zhao, R.; Zhang, Y.; Zhang, X.; Wang, X. Validation of a Eulerian–Lagrangian numerical algorithm for simulating ultra-coarse particles transported in horizontal and vertical hydraulic pipes. Comput. Fluids 2024, 276, 106263. [Google Scholar] [CrossRef]
- Zhang, Y.H.; Wang, X.J.; Zhang, X.Z.; Saad, M.; Zhao, R.-J. Numerical investigation of the impacts of large particles on the turbulent flow and surface wear in series-connected bends. J. Mar. Sci. Eng. 2024, 12, 164. [Google Scholar] [CrossRef]
- Santiago Laín, M.S. Characterisation of pneumatic conveying systems using the Euler Lagrange approach. Powder Technol. 2013, 235, 764–782. [Google Scholar] [CrossRef]
- Zhao, R.; Zhou, Y.; Zhang, D.; Gao, X. Numerical investigation of the hydraulic transport of coarse particles in a vertical pipe based on a fully-coupled numerical model. Int. J. Multiph. Flow 2022, 155, 104094. [Google Scholar] [CrossRef]
- Zhao, S.; Bao, J.; Ge, S.; Wang, Z.; Yin, Y.; Li, Y. Influence of solid-liquid two-phase flow conveying parameters on the elbow wear with and without the swirler. Tribol. Int. 2023, 186 (Suppl. SC), 108635. [Google Scholar] [CrossRef]
- Zeng, D.; Zhang, E.; Ding, Y.; Yi, Y.; Xian, Q.; Yao, G.; Zhu, H.; Shi, T. Investigation of erosion behaviors of sulfur-particleladen gas flow in an elbow via a CFD-DEM coupling method. Powder Technol. 2018, 329, 115–128. [Google Scholar] [CrossRef]
- Zhao, R.; Zhao, Y.; Si, Q.; Gao, X. Effects of different characteristics of the dilute liquid-solid flow on the erosion in a 90° bend. Powder Technol. 2022, 398, 117043. [Google Scholar] [CrossRef]
- Lin, Z.; Hu, L.; Tao, J.; Zhu, X.; Zhou, C.; Li, Y. Analysis of high-concentration solid-liquid flow and erosion characteristics of centrifugal pump based on CFD-DEM. Chem. Eng. Sci. 2025, 317, 122106. [Google Scholar] [CrossRef]
- Cao, W.; Wang, H.; Tang, J. Study on wear characteristics of a guide vane centrifugal pump based on CFD–DEM. J. Mar. Sci. Eng. 2024, 12, 593. [Google Scholar] [CrossRef]
- Crowe, C.; Sommerfeld, M.; Tsuji, Y. Multiphase Flows with Droplets and Particles; CRC Press: Boca Raton, FL, USA, 1998. [Google Scholar]
- Di Felice, R. The voidage function for fluid-particle interaction systems. Int. J. Multiph. Flow 1994, 20, 153–159. [Google Scholar] [CrossRef]
- Haider, A.; Levenspiel, O. Drag coefficient and terminal velocity of spherical and nonspherical particles. Powder Technol. 1989, 58, 63–70. [Google Scholar] [CrossRef]
- Saffman, P.G. The lift on a small sphere in a slow shear flow. J. Fluid Mech. 1965, 22, 385–400. [Google Scholar] [CrossRef]
- Mei, R. An approximate expression for the shear lift force on a spherical particle at finite Reynolds number. Int. J. Multiph. Flow 1992, 18, 145–147. [Google Scholar] [CrossRef]
- Oesterlé, B.; Dinh, T.B. Experiments on the lift of a spinning sphere in a range of intermediate Reynolds numbers. Exp. Fluids 1998, 25, 16–22. [Google Scholar] [CrossRef]
- Loth, E.; Dorgan, A.J. An equation of motion for particles of finite Reynolds number and size. Environ. Fluid Mech. 2009, 9, 187–206. [Google Scholar] [CrossRef]
- Horne, W.J.; Mahesh, K. A massively-parallel, unstructured overset method to simulate moving bodies in turbulent flows. J. Comput. Phys. 2019, 397, 108790. [Google Scholar] [CrossRef]
- Sun, R.; Xiao, H. Diffusion-based coarse graining in hybrid continuum–discrete solvers: Theoretical formulation and a priori tests. Int. J. Multiph. Flow 2015, 77, 142–157. [Google Scholar] [CrossRef]
- Wu, J.-S.; Faeth, G.M. Sphere wakes in still surroundings at intermediate Reynolds numbers. AIAA J. 1993, 31, 1448–1455. [Google Scholar] [CrossRef]
- Gosman, A.D.; Loannides, E. Aspects of computer simulation of liquid-fueled combustors. J. Energy 1983, 7, 482–490. [Google Scholar] [CrossRef]
- Ahlert, K.R. Effects of Particle Impingement Angle and Surface Wetting on Solid Particle Erosion of AISI 1018 Steel. Master’s Thesis, University of Tulsa, Tulsa, OK, USA, 1994. [Google Scholar]
- Peng, W.; Cao, X. Numerical simulation of solid particle erosion in pipe bends for liquid solid flow. Powder Technol. 2016, 294, 266–279. [Google Scholar] [CrossRef]
Disclaimer/Publisher’s Note: The statements, opinions and data contained in all publications are solely those of the individual author(s) and contributor(s) and not of MDPI and/or the editor(s). MDPI and/or the editor(s) disclaim responsibility for any injury to people or property resulting from any ideas, methods, instructions or products referred to in the content. |
© 2025 by the authors. Licensee MDPI, Basel, Switzerland. This article is an open access article distributed under the terms and conditions of the Creative Commons Attribution (CC BY) license (https://creativecommons.org/licenses/by/4.0/).