Article

Calculation and Analysis on Mechanical Properties of the Perforated Offshore Casing with Defects

1
College of Mechanical and Electronic Engineering, China University of Petroleum (East China), Qingdao 266580, China
2
National Engineering Research Center of Marine Geophysical Prospecting and Exploration and Development Equipment, China University of Petroleum (East China), Qingdao 266580, China
*
Author to whom correspondence should be addressed.
J. Mar. Sci. Eng. 2025, 13(10), 1948; https://doi.org/10.3390/jmse13101948 (registering DOI)
Submission received: 9 September 2025 / Revised: 4 October 2025 / Accepted: 5 October 2025 / Published: 11 October 2025
(This article belongs to the Special Issue Offshore Oil and Gas Drilling Equipment and Technology)

Abstract

Perforation, a common well completion method in oil and gas exploitation, introduces structural defects in casings that alter their mechanical properties. Based on engineering specifications, this study calculates critical loads (i.e., collapse pressure and yield pressure) and the triaxial equivalent stress for casings. Four load cases were selected for analysis: uniform external pressure, uniform internal pressure, external pressure with axial compression, and internal pressure with axial tension. The equivalent stresses around circular, elliptical, pentagonal, and hexagonal perforation defects were computed. A self-defined perforation influence coefficient was used to evaluate changes in mechanical performance. Results show that circular defects have the least effect on the mechanical properties of the casing. Maximum equivalent stress occurs along the hole centerline parallel to the casing axis and increases with greater disparity between ellipse axes or smaller polygon angles. High shot density (>24 holes/m) and large phase angle (60°) generally enhance safety, but an optimal combination exists. Under tensile loads near cracked defects, crack propagation may lead to fracture. For elliptical defects with cracks, the Mode I stress intensity factor grows faster with greater axis disparity, accelerating crack tip stress and deformation, and raising fracture risk. Cracks perpendicular to tensile stress influence the stress intensity factor more significantly than parallel ones.

1. Introduction

Offshore oil and gas development relies heavily on stable well completion technologies to achieve efficient hydrocarbon extraction. Casing perforation in the oil layer remains one of the most widely used well completion methods for establishing fluid communication between the reservoir and wellbore [1,2,3,4,5,6]. However, this process inevitably introduces structural defects into the casing string, fundamentally altering its mechanical integrity and leading to significant reductions in key strengths such as collapse strength, tensile strength, and burst strength [7,8,9,10]. Therefore, analyzing the mechanical performance of perforated offshore casing is of great significance for ensuring wellbore integrity and the safe operation of offshore fields. The methods for analyzing the mechanical performance [11] of perforated casing can be summarized into three categories.
The first category is the simulation method based on finite element modeling. The research idea is to use a set of circular holes [12,13,14,15] that penetrate the wall as the casing’s defects caused by perforation, and a 3D finite element model can be established to calculate the residual strength of the perforated casing. The quantitative impact of different perforation parameters on the casing stress can be obtained by using the finite element software, such as ANSYS and LS-DYNA. Bi et al. [16] established a numerical model of casing perforation using ANSYS/LS-DYNA software to analyze the jet formation process, penetration depth, hole diameter, and stress changes in the inner and outer casing walls. This provided a basis for optimizing casing perforation parameters, and the reliability of the simulation results was verified through experiments. Combining the finite element calculations with the orthogonal numerical test method, Ding et al. [17] find that the casing collapse strength was reduced significantly due to the presence of the perforation holes. The effect of perforation parameters on the casing collapse strength from big to small is ranked as phasing, shot density, and hole size. When uniform pressure is applied to the inner and outer surfaces of the pipe body, the stress concentration appears near the perforation holes. The influence zone is distributed along the spiral line, along which casing damage easily develops. To study the mechanical properties of casing under the detonation impact load of jet perforation, Cao et al. [18] use LS-DYNA to establish a 3D model of the perforating charge, perforating gun, and casing. The key findings are as follows: the detonation produces a “cold-work hardening” effect on the circular area at the edge of the perforation hole with a 20 mm radius; the mechanical properties of the casing material in this area no longer conform to the stress–strain rules of the raw material, and the casing strength approximately increases by about 250 MPa. Sun et al. [19] combined experimental methods with finite element simulation to study the deformation and cracking behavior of defective casings under non-uniform load. Their work demonstrated that defects significantly reduce the bearing capacity, and the crack propagation process follows specific relationships with load displacement.
The second method is to derive calculation formulas through simplified models built by combining related mechanics theories with certain assumptions. For example, Zong et al. [20] recognized that a casing, as a medium-thickness pipe with initial ellipticity, undergoes elliptical deformation and collapses when subjected to uniform external pressure. Therefore, the Soviet scientist T.E Eremenko’s method was used to calculate the collapse pressure of the perforated casing. The perforation holes are simplified to a square, and the calculation formula for the collapse resistance reduction coefficient K of perforated casing without cracks was derived according to the rod–tube similarity theory. Then, the influence of perforating parameters and perforation hole distribution on the K value was discussed. Yu [21], inspired by the derivation process of Zong’s theoretical formula, expanded the perforation hole shapes to include rectangles, diamonds, circles, and ellipses. The calculation formulas for the elastic collapse resistance reduction coefficient of perforated casings corresponding to the four shapes were derived by using the perturbation theory. By combining the calculation results with the elastic–plastic finite element analysis method, the remaining collapse resistance of perforated casing in practical engineering was analyzed [22]. However, according to the basic theory of plane strain in elasticity, Tang et al. [23] obtained the stress distribution of the casing pipe body using Lamé’s solution for a cylinder subjected to uniform external pressure only. They recognized that the magnitude of the radial stress is far less than that of the hoop stress when the ratio of casing diameter to casing wall thickness is greater than 15. Therefore, the problem is simplified to a model like an infinite plate with a circular hole subjected to tensile stress in the horizontal direction only, and the stress distribution along the edge of the perforation hole can be calculated [24]. Liu et al. [25] expand the simplified model of the perforated casing from an infinite orifice plate with uniaxial stress to a biaxial stress orifice plate model. The biaxial stress is composed of the axial compressive stress caused by the casing string weight and the radial stress generated by the pressure difference between the inner and outer of the casing, and these two stresses are perpendicular to each other. XUE et al. [26] addressed the stress concentration in perforated casings under complex loading conditions in deep wells. By combining elastic theory with finite element validation, they proposed an analytical model that accurately characterizes the hoop and radial stress concentration effects around the perforation, providing a theoretical basis for optimizing perforation parameters. Lian et al. [27] investigated the deformation and failure of perforated casings under external load. Using an indirect coupling two-step method—first determining the external load on the casing and then calculating its mechanical strength—they analyzed the influence of different in situ stress differences on the casing stress state under redistributed in situ stress fields, offering theoretical support for casing selection and perforation process design. Tong et al. [28] and Xu et al. [29] both realized that the safety performance of the pipe body will be greatly reduced by the propagation of crack-like imperfections at the edge of the perforation hole when subjected to high internal pressure. Therefore, they all use the fracture mechanics theory to deduce a fracture criterion for the perforated casing with defects [30]. Tong’s model is a cylindrical shell with a crack. The stress intensity factor of the perforated casing is derived on the basis of the distributions of stress and displacement near the crack a numerical method. On the other hand, Xu’s model is an infinitely thin plate with cracks at the hole edge. The solution formula for the critical internal pressure for the crack growth is obtained by introducing the cylindrical curvature into the expression for the stress intensity factor.
The third approach involves conducting a series of laboratory tests using a full-scale perforated casing [31]. By simulating the downhole environmental conditions where the production casing is perforated, the deformation and degree of damage to the casing can be directly observed by measuring and collecting data after perforation with a standard perforating device. Li [32], Jiao et al. [33], Fu et al. [34], and Wu et al. [35] all adopted similar test schemes to conduct simulated well perforation tests on casings belonging to different steel grades. The test results can be summarized as follows: (1) the shape of the perforation hole is closer to an ellipse; (2) burrs are generated on the edge of the hole after perforation, and the height of the burrs is generally no more than 3 mm; (3) the casing with high impact toughness, good yield strength, and homogeneous grains does not produce cracks at the edge of perforation holes, whereas the casing with poor properties will generate unilateral or bilateral cracks at the perforation hole edge; (4) the yield strength, collapse strength and tensile strength of the casing are slightly reduced, while the hardness of the hole edge is slightly increased after perforation. Dou et al. [36] carried out a full-scale casing indoor experiment under compressive load for testing the mechanical properties of perforated casing. According to the photo of the experimental result, it can be seen that the fracture of the perforated casing mostly generates along the direction of the line between the nearest two holes. This verifies the correctness of Ding’s [17] conclusion of the finite element simulation analysis that perforated casing damage tends to develop along the perforation spiral line. Jia et al. [37] took specimens from the perforated casing with steel grade P110; then, the composition changes in the metallographic structure near the perforation hole could be observed by using SEM (scanning electron microscope). They found that plate martensite appeared in the material composition after perforation, and the closer to the perforation hole, the more martensite there was. High strength, high hardness, and low toughness are the mechanical properties of plate martensite. Therefore, as the amount of martensite increases, the hardness of the pipe body increases, and the toughness is reduced. The observation results of this experiment verified the inference that the detonation produces a “cold-work hardening, obtained by Cao et al. [18]”. GODFREY et al. [38] conducted collapse tests in the laboratory on P110 and V150 grade casings with different perforation parameters. The data show that the collapse resistance is reduced more for perforations in an axial line (0° or 180° phasing) than for those in a helical pattern (90° phasing), and the reduction in collapse resistance is less than 10% for six or fewer holes per foot in an axial line or for eight or fewer holes per foot in a helix. Qiu et al. [39] validated the feasibility of double-layer casing perforation technology through a combination of penetration performance tests and full-scale experiments, obtaining quantitative relationships between hole diameter, penetration depth, and the corresponding reduction coefficients. A series of tests to describe the effect of numerous holes in casing on the mechanical crush resistance has been conducted by King [40,41]. The results of the axial resistance tests indicated that (1) no significant strength reduction was seen in shot densities up to 16 holes per foot; (2) shot densities of 24~36 holes per foot at 60° phasing reduced the axial load-bearing capacity by 20% or more when compared to an unperforated tube; (3) the hole diameter was a major factor in strength only at over 24 holes per foot for big holes of 0.75 in and 0.9 in scaled diameters.
The common research results of the above studies are as follows: (1) different load action modes have different effects on the casing of the perforation section; (2) perforation parameters (phasing, shot density, hole size) can influence the residual strength distribution rules of the perforated casing; (3) although the holes and the cracks both belong the pipe body defects caused by perforation, the calculation basis and the judgment criterion of the influence on the mechanical performance are different. To meet the needs of engineering applications, the purpose of this research is to calculate the applied loads based on actual working conditions and general engineering standards. The study is structured into two main parts to systematically address the mechanical performance of perforated casing. First, building upon fracture mechanics studies relevant to casing integrity [29,30], it investigates the stress concentration and equivalent stress changes caused by different perforation defect shapes (circular, elliptical, pentagonal, hexagonal), establishing the basis for identifying critical zones where failure is most likely to initiate. Second, focusing on the failure and fracture parameters highlighted in the abstract, it delves into the crack propagation behavior from these defects by calculating the Mode I stress intensity factor (SIF), which is crucial for assessing fracture risk. Through detailed data comparison and analysis, the quantitative influence law of perforation parameters on the mechanical properties of the perforated casing is obtained, which can provide simple, clear, and referential theoretical guidance for practical engineering applications.

2. Mechanical Property Analysis of Casing Pipe Body

2.1. Load Analysis on Perforated Section of Casing String

Oil exploitation is a long-term and complex process. Different well types, different production and exploitation stages, and different down-hole working conditions will make the casing load change. Therefore, clarifying the load distribution in the perforated section of the casing string is very important before analyzing the mechanical properties of the perforated casing.
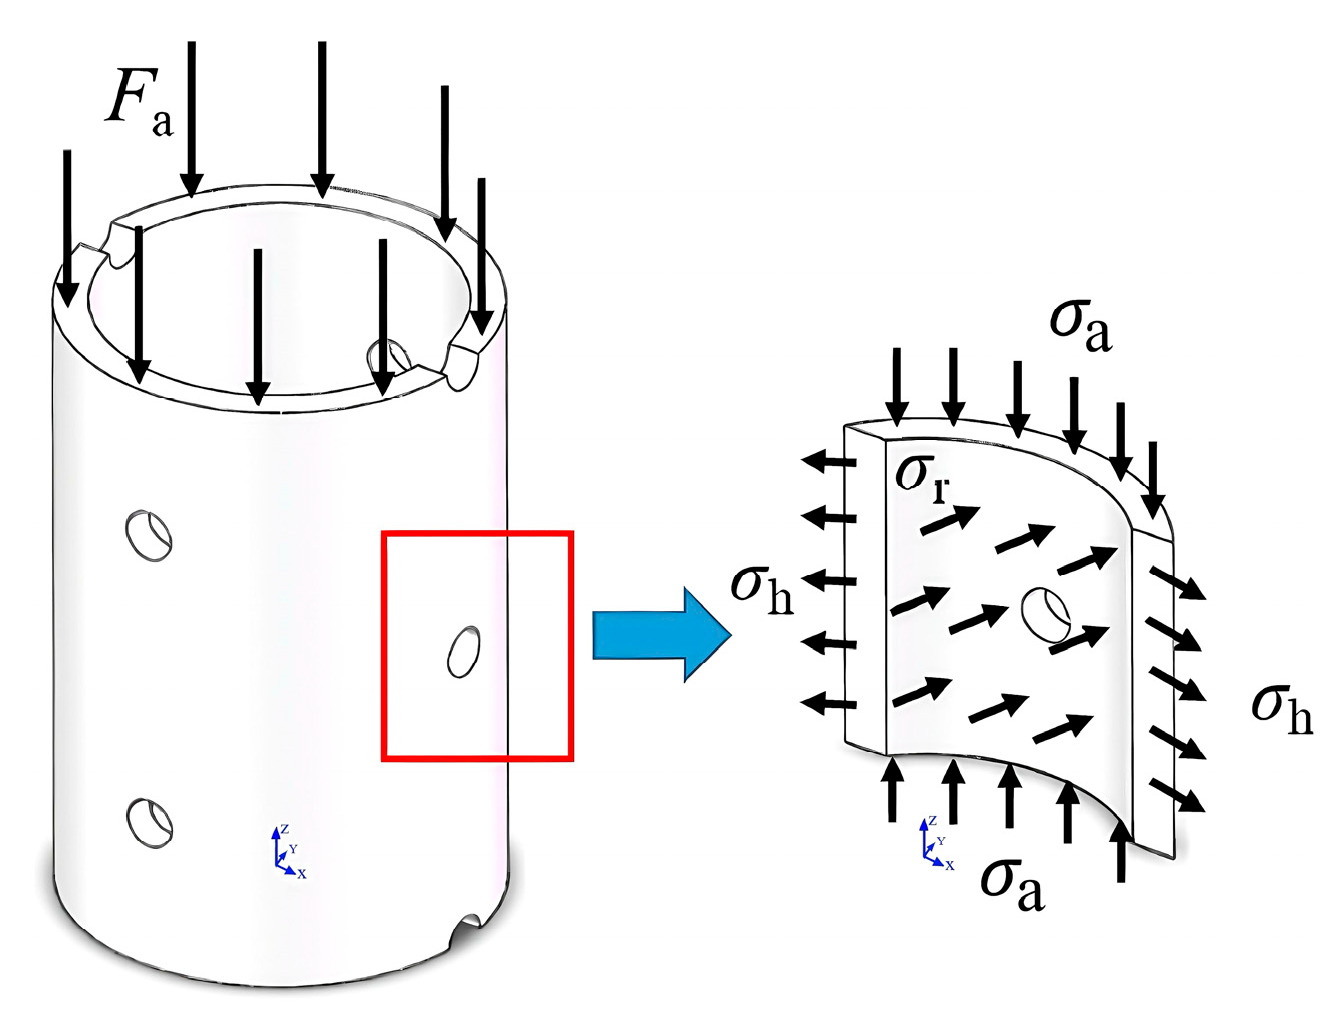
As Figure 1a shows, the support of the bottom-hole and the gravity of the upper string work together to generate the compressive load Fa in the vertical well. The external pressure Po on the outer surface of the casing (as shown in Figure 1a) is mainly from the formation pressure, without considering the influence of the cement ring. The maximum value of the internal pressure Pi on the casing’s inner surface (as shown in Figure 1a) is the injected liquid pressure value during the water injection and fracturing operation in the middle and late stages of oilfield development. The external pressure Po and the internal pressure Pi, as shown in Figure 1b, on the outer and inner surfaces of the perforated section in the horizontal well are caused by the same source as a vertical well. However, due to the pressure generated by the high-pressure liquid on the capped-end casing inner surface, a tensile load Fa along the Z-axis is generated in the process of water injection or fracturing operation, shown in Figure 1b. Apparently, there are three load types in the perforated section of casing string: external pressure Po, internal pressure Pi, and axial load Fa (tension or compression). Photographs of the experimental results show that fractures in perforated casing mostly propagate along the line connecting the two nearest holes.

2.2. Equations for Critical Loads of Casing Pipe Body

(1)
Triaxial yield limit state equation
Given the internal and external pressures, axial force, the equivalent stress, σe, is defined based on the von Mises yield criterion, which is applicable to the judgment of plastic yielding of metallic materials. Its expression is shown in Equation (1) [42]:
σ e = σ r 2 + σ h 2 + σ a 2 σ r σ h σ r σ a σ h σ a
σ r = p i d i 2 p o d o 2 p i p o d i 2 d o 2 / 4 r 2 d o 2 d i 2
σ h = p i d i 2 p o d o 2 + p i p o d i 2 d o 2 / 4 r 2 d o 2 d i 2
σ a = F a A p
where σe is the equivalent stress; σa is the component of axial stress not due to bending; σr is the radial stress; σh is the hoop stress (σa, σr, and σh are schematically shown in Figure 2); do is the specified pipe outside diameter; di is the pipe inside diameter; d i = d o 2 t ; t is the specified pipe wall thickness; pi is the internal pressure; po is the external pressure; r is the radial coordinate, d i / 2 r d o / 2 ; Fa is the axial force; Ap is the area of the pipe cross-section, A p = π d o 2 d i 2 .
The onset of yield is defined as:
σ e = Y
where σe < Y corresponds to elastic behavior; Y is the specified minimum yield strength. The values of different grades are shown in the published tables [43].
(2)
Collapse pressure formulas
The minimum collapse strength of the pipe under no axial force or internal pressure is calculated using a series of formulas that correspond to different collapse failure modes (yield strength collapse, plastic collapse, transition collapse, and elastic collapse), depending on the specified minimum yield strength and cross-sectional dimensions of the pipe body [44].
  • Yield strength collapse pressure formula
P o Y P = 2 Y d o / t 1 d o / t 2
Valid range
d o / t A 2 + A 2 2 + 8 B + C / Y 2 B + C / Y
  • Plastic collapse pressure formula
P o P = Y A d o / t B C
Valid range
A 2 + A 2 2 + 8 B + C / Y 2 B + C / Y < d o / t Y A F C + Y B G
  • Transition collapse pressure formula
P o T = Y F d o / t G
Valid range
Y A F C + Y B G < d o / t 2 + B / A 3 B / A
  • Elastic collapse pressure formula
P o E = 46.95 × 10 6 d o / t d o / t 1 2
Valid range
d o / t > 2 + B / A 3 B / A
where PoYP is the pressure for yield strength collapse; PoP is the pressure for plastic collapse; PoT is the pressure for transition collapse; PoE is the pressure for elastic collapse.
For SI units, where yield stress is in MPa and diameter in mm, the collapse formulas and range formulas are the same. The API constants (A, B, C, F, and G) are empirical coefficients derived from regression analysis of experimental collapse data. These dimensionless constants are used to define the boundaries between different collapse failure modes and to calculate the corresponding collapse pressures. They are functions of the specified minimum yield strength (Y) of the pipe material, as defined by the following formulas [42]:
A = 2.8762 + 0.15489 × 10 3 Y + 0.44809 × 10 6 Y 2 0.16211 × 10 9 Y 3 B = 0.026233 + 0.73402 × 10 4 Y C = 3.2125 + 0.030867 Y 0.15204 × 10 5 Y 2 + 0.77810 × 10 9 Y 3 F = 3.237 × 10 5 3 B / A 2 + B / A 3 Y 3 B / A 2 + B / A B / A 1 3 B / A 2 + B / A 2 G = F B / A
The collapse resistance of the casing in the presence of an axial stress is calculated by modifying the yield stress to an axial stress equivalent grade according to Equation (15) [41]:
Y a = 1 0.75 σ a / Y 2 0.5 σ a / Y Y
where Y a is the equivalent yield strength in the presence of axial stress;   σ a is the component of axial stress not due to bending (tension is positive and compression is negative).
Using the modified yield stress, the collapse resistance under axial stress is calculated by means of Equations (6), (8), (10), (12) and (14).
Equation (16) is based on the internal pressure acting on the inside diameter and the external pressure acting on the outside diameter [42].
P o o i = P c + 1 2 t / d o P i
where P o o i   is the collapse pressure in the presence of internal pressure; P c is the collapse resistance calculated neglecting internal pressure, but accounting for any axial load; P i is the internal pressure.
(3)
Yield internal pressure formulas
When the end of the casing is closed, the internal pressure generates an axial tension stress. In this case, the influence of the axial stress on the yield internal pressure must be considered, and it can be calculated by the following formula for a capped-end pipe [41]:
P i Y L C = Y × 1 3 d o 4 + d w a l l 4 d o 2 d w a l l 2 2 + d i 4 d o 2 d i 2 2 2 d i 2 d w a l l 2 d o 2 d w a l l 2 d o 2 d i 2
where P i Y L C   is the internal pressure at yield for a capped-end pipe; dwall is the inside diameter based on tkwall; dwall = do − 2tkwall.
When the axial stress component generated by the internal pressure is zero, only the yielding governed by hoop stress needs to be considered. In this case, the internal pressure at yield for a pipe is as follows [42]:
P i Y L O = Y d o 2 d w a l l 2 3 d o 4 + d w a l l 4
where P i Y L O   is the internal pressure for pipe yield.

2.3. Solving Critical Loads and Equivalent Stress of Casing Pipe Body in Perforation Section

Assuming perforation is carried out in a reservoir with a well depth of 3000 m, the specified parameters of the selected production casing are shown in Table 1.
According to the analysis of the loads in the perforated section, the types of load combination for perforated casing in a vertical well are external pressure, external pressure + compression load, external pressure + compression load + internal pressure, and in the horizontal well are internal pressure, internal pressure + tension load, internal pressure + tension load + external pressure.
The gravitational force field gives rise to an axial force Fa in the vertical well. The force Fa is calculated as the weight of the casing string above the perforation section, where the negative sign indicates compression. The cross-sectional area Ap is calculated from the inner and outer diameters. The resulting axial stress assumed uniform across any cross section of the casing string by Equation (4) is as follows:
σ a = F a A p = g H M π ( d 0 2 d 1 2 ) / 4 = 9.8 × 3000 × 29.76 π 139.7 2 121.36 2 / 4 = 232.68   M P a
where g is the gravitational acceleration, m/s2; H is the well depth, m.
In the horizontal well, the axial stress resulting from internal pressure can be calculated by Lamé’s solution [7].
σ a = 2 v p i d i 2 p o d o 2 d o 2 d i 2
where v is the Poisson’s ratio.
From the data in Table 1, the value of d o / t is approximately equal to 15.23 by Equation (9). Then, the pressure for plastic collapse is 76.54 MPa, as calculated by Equations (8) and (14). Given the axial compression stress is −232.68 MPa calculated by Equation (19), the critical pressure of plastic collapse is 82.41 MPa by Equations (8), (14) and (15). When the internal pressure (pi = 86.35 MPa) is added, the critical pressure for plastic collapse is 157.42 MPa, as calculated by Equation (16).
The internal pressure at yield for a capped-end pipe is 94.55 MPa by Equation (17), and the axial tension stress, which is generated by the action of internal pressure on the capped-end pipe, is 174.51 MPa by Equation (20). Without the axial stress, the internal pressure at yield for a pipe is 86.35 MPa by Equation (18).
Given the internal pressure (pi), external pressure (po), and axial stress (σa), the equivalent stress (σe), the radial stress (σr), and the hoop stress (σh) in the pipe are calculated separately according to Equations (1)–(3) (as shown in Figure 2).
The calculation results of the above-mentioned casing stress are listed in Table 2. According to the comparison analysis on the data, it is shown that (1) the equivalent stress on the casing inner surface is always greater than that on the casing outer surface. So, regardless of the load forms, the pipe body yield will always occur at the inner surface. (2) The values of the critical collapse pressure and the yield internal pressure of the pipe body are the lowest when the casing is only subjected to uniform external pressure or uniform internal pressure. The axial compression load and the internal pressure can increase the critical collapse pressure of the casing, while the axial tension load and the external pressure can increase the yield internal pressure of the casing pipe body. The influence of internal and external pressures is greater than that of axial load. (3) Considering the representativeness of the results, the simplicity of calculation and the safety of the project, the following four load forms are selected to calculate and analyze the mechanical properties of the perforated casing: uniform external pressure (76.54 MPa), uniform external pressure (76.54 MPa) + axial compression stress (−232.68 MPa), uniform internal pressure (86.35 MPa), and uniform internal pressure (94.55 MPa) + axial tension stress (174.51 MPa).

3. Theoretical Models and Calculation Methods

This section elaborates on the theoretical frameworks and analytical models employed to assess the mechanical performance of the perforated casing. First, stress calculation models for different perforation defect shapes (circular, elliptical, and polygonal) are presented to quantify the stress concentration. Subsequently, the formulas for determining the spatial distribution parameters of perforation defects are provided. Finally, the calculation models for the Mode I stress intensity factor (SIF) under various crack configurations at the defect edge are derived, establishing the basis for the subsequent fracture mechanics analysis.

3.1. Stress Calculation Models for Different Perforation Defect Shapes

Small hole defects occur on the casing body through the perforation process. This causes the stress and deformation near the hole to change, leading to stress concentration where the stress at the boundary of the hole is much greater than in the non-perforated region. This section focuses on quantifying the stress concentration resulting from the geometry of the defect itself, which is the primary factor affecting the static stress distribution and the initial yield potential of the casing. Therefore, the circle, ellipse, pentagon, and hexagon are selected below to represent the geometric shapes of defects generated by perforation. The stress concentration degree of these different defects is quantified by solving the stress at the boundary of the hole with its corresponding calculation model.
(1)
Circular hole [45]
There is a circular hole with a radius of R on a rectangular plate (as shown in Figure 3). When the left and right sides of the plate are only subjected to uniform tensile stress   σ x , the following formula can be used to calculate the stress distribution near the circular hole:
σ ρ = σ x 2 1 R 2 ρ 2 + 1 4 R 2 ρ 2 + 3 R 4 ρ 4 cos 2 θ σ θ = σ x 2 1 + R 2 ρ 2 1 + 3 R 4 ρ 4 cos 2 θ
where σρ is the radial stress at point A; σθ is the hoop stress at point A; R is the radius of circular hole; ρ is the radial coordinate, ρR; θ is the angle corresponds to point A.
When the upper and lower sides of the plate are only subjected to uniform tensile stress   σ y , the following formula can be used to calculate the stress distribution near the circular hole:
σ ρ = σ y 2 1 R 2 ρ 2 1 4 R 2 ρ 2 + 3 R 4 ρ 4 cos 2 θ σ θ = σ y 2 1 + R 2 ρ 2 + 1 + 3 R 4 ρ 4 cos 2 θ
When the plate is subjected to uniform stress   σ x on the left and right sides, and uniform stress   σ y on the upper and lower sides, by superposing Formulas (21) and (22), the stress distribution near the circular hole can be obtained as follows:
σ ρ = σ x + σ y 2 1 R 2 ρ 2 + σ x σ y 2 1 4 R 2 ρ 2 + 3 R 4 ρ 4 cos 2 θ σ θ = σ x + σ y 2 1 + R 2 ρ 2 σ x σ y 2 1 + 3 R 4 ρ 4 cos 2 θ
When ρ = R in Formula (23), the formula for calculating stress at the circular hole boundary can be obtained
σ ρ = 0 σ θ = σ x + σ y 2 σ x σ y cos 2 θ
It can be seen from Formula (24) that the stress at the circular hole boundary is independent of the hole radius R; the radial stress at the hole boundary is always 0, and the hoop stress varies with the angle θ between the calculation point A and the x-axis.
(2)
Ellipse hole
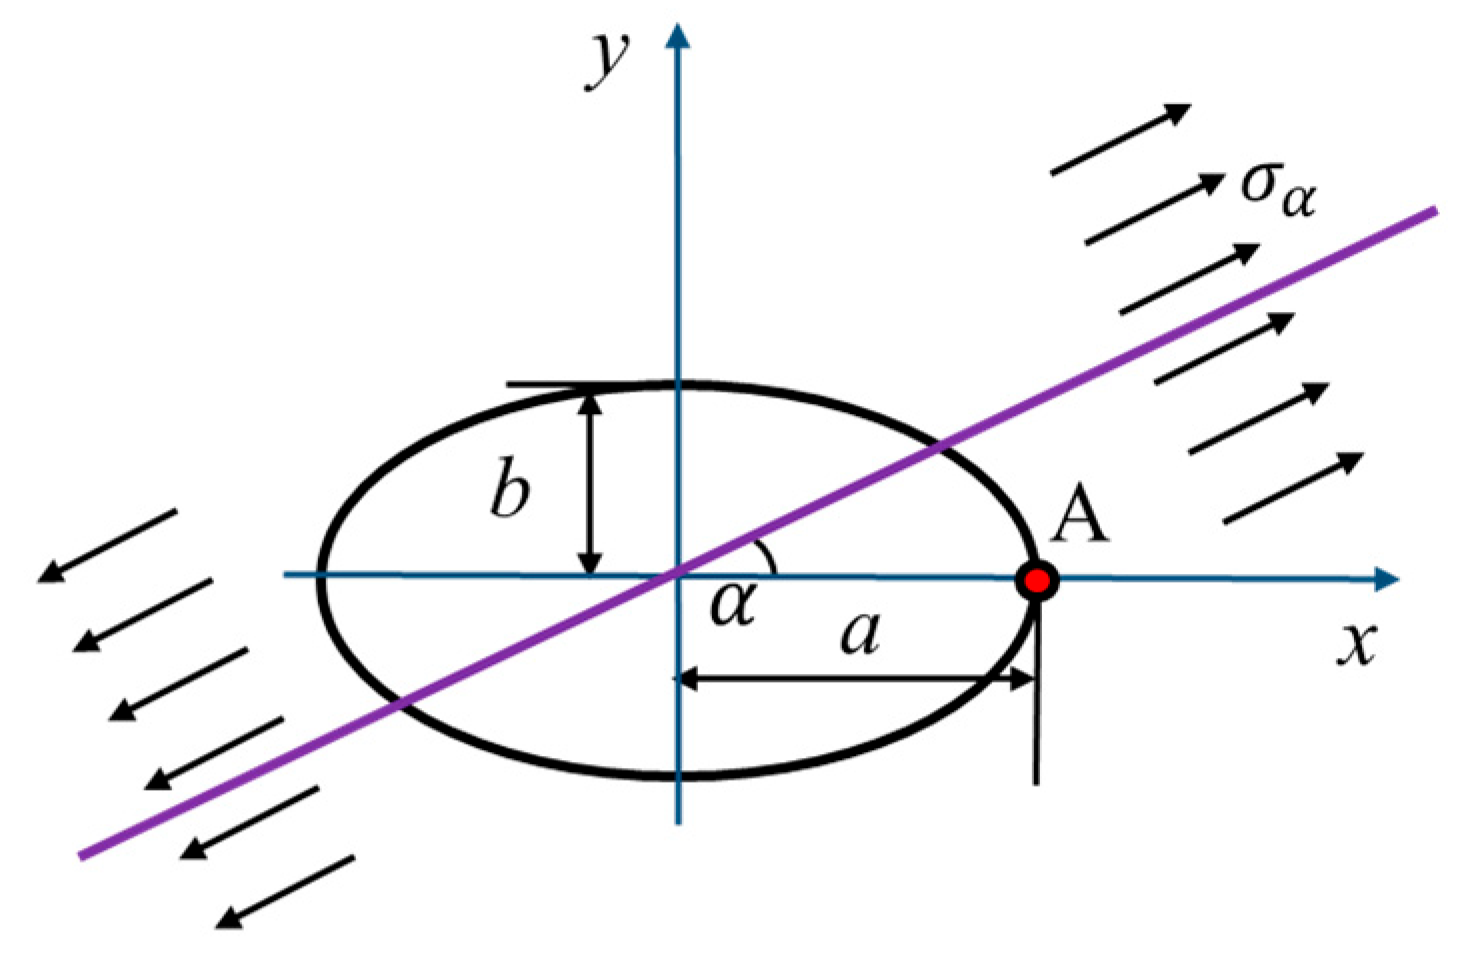
There is an elliptical small hole in the rectangular plate, the major axis is 2a and the minor axis is 2b. The radial stress at the ellipse hole boundary, which is the same as the circular hole, is also 0. The hoop stress at the hole boundary can be calculated by [46,47]
σ θ = σ α 1 m 2 + 2 m cos 2 α 2 cos 2 α + θ 1 + m 2 2 m cos 2 θ m = a b a + b
where m is defined here as the ratio coefficient of the major and minor axis of the ellipse; α is the angle at which uniaxial tension σα is inclined to the x-axis (as shown in Figure 4); θ is the parameter that corresponds to point A x + iy = ξ(e + me) of the boundary of the hole.
It can be seen from Formula (25) that the hoop stress not only changes with the angle θ but also is related to the ratio m of the major and minor axes of the elliptical hole and the angle α between the uniform external stress and the major direction.
When point A is located at the end of the major axis (θ = 0°/180°), the Formula (26) can be simplified as follows:
σ θ = σ α 1 m 2 + 2 m cos 2 α 2 cos 2 α 1 + m 2 2 m m = a b a + b
(3)
Polygonal hole
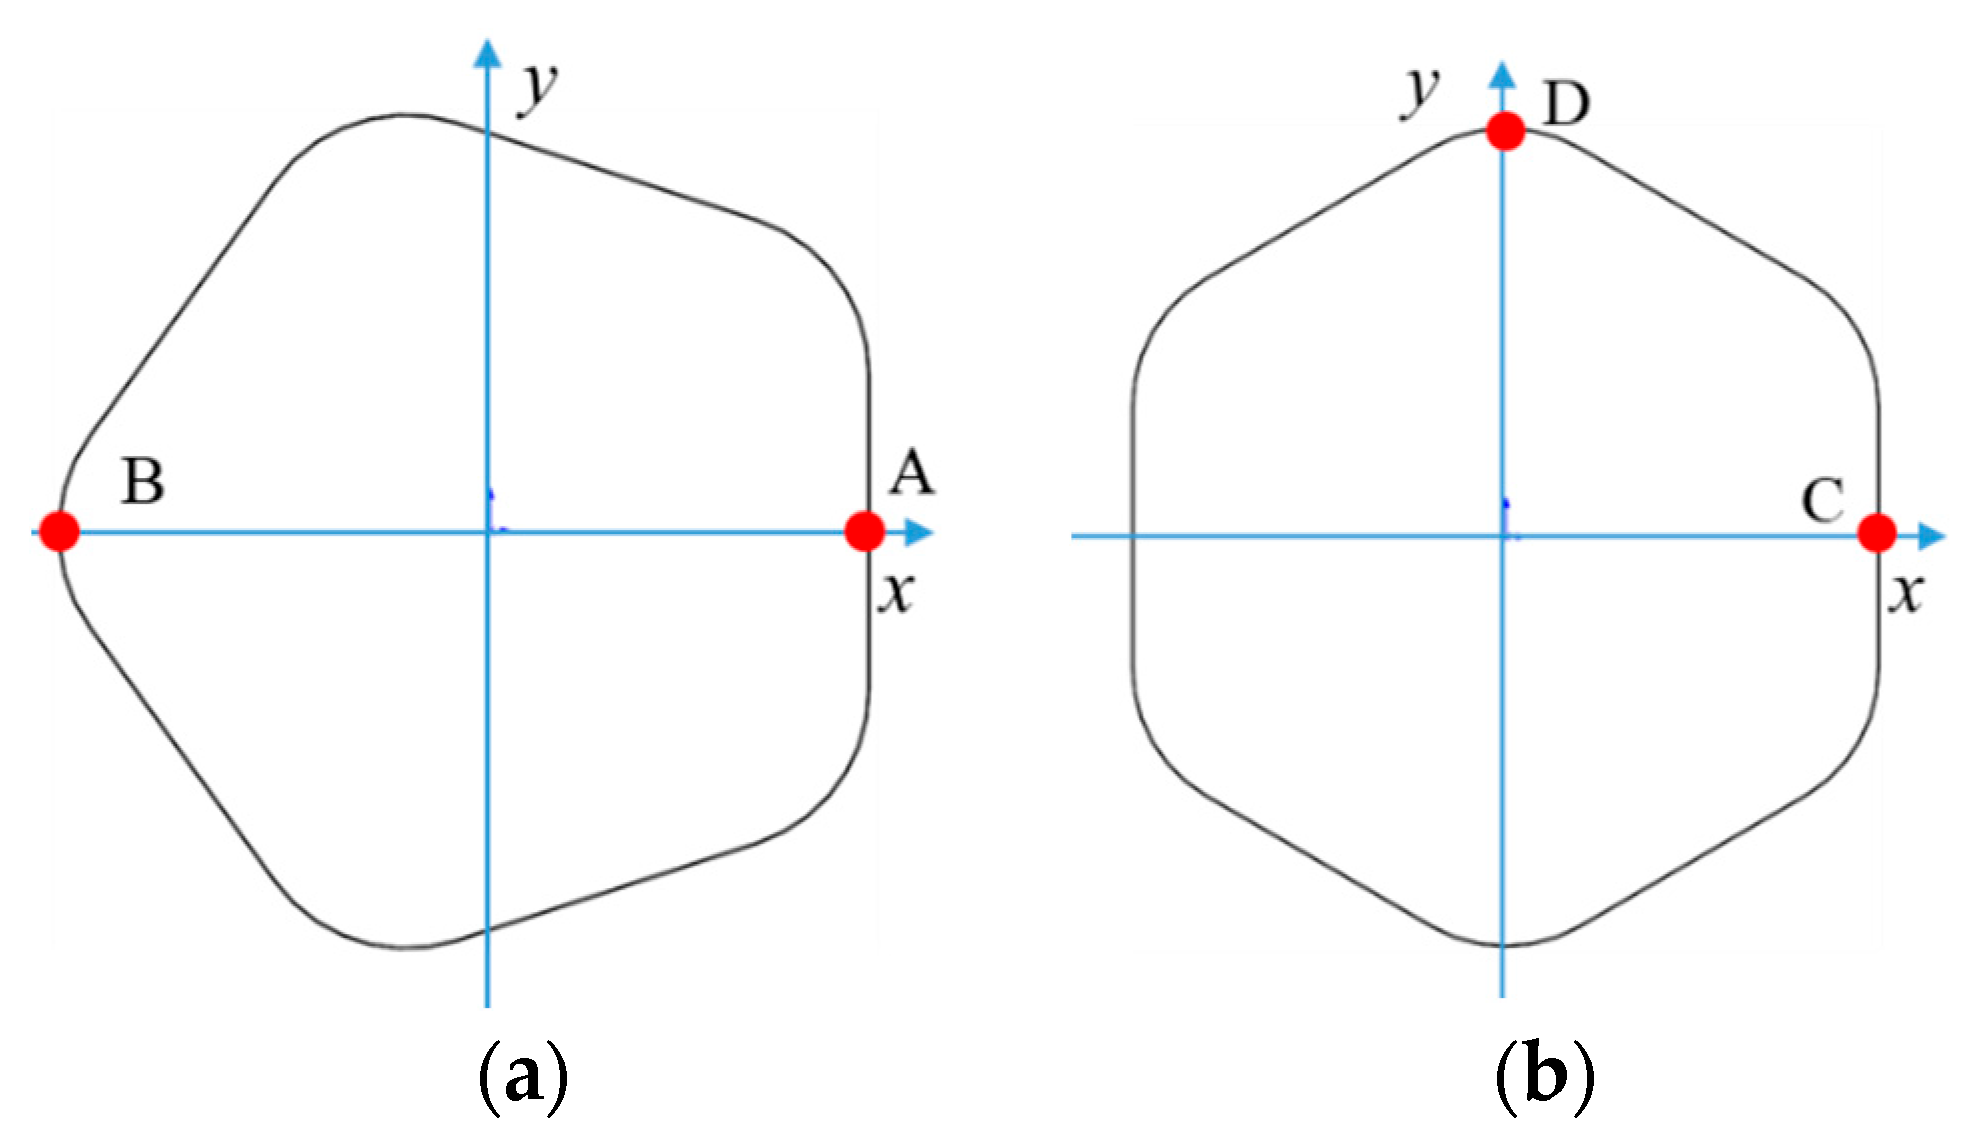
For polygonal holes with N sides (N > 4) in a rectangular plate, as shown in Figure 5, the distribution of the hoop stress at the boundary is [48]
σ θ = σ α × 1 N 1 2 m 2 + 2 N 1 N 3 m 2 1 1 N 3 m 2 cos 2 α + θ 1 + N 1 2 m 2 2 N 1 m cos N θ + 4 m 1 N 3 m 2 cos 2 α N 2 θ 1 + N 1 2 m 2 2 N 1 m cos N θ
where α is the angle at which uniaxial tension σα is inclined to the x-axis (as shown in Figure 5); θ is the parameter that corresponds to point x1 + ix2 = R(e + mei(N−1)θ) of the boundary of the hole.
The hoop stress at point A and point B in Figure 5a can be calculated by Formula (27):
Point A: θ = 0°, N = 5, m = 1/10
σ θ = σ α 0.84 1.44 0.98 cos 2 α 0.36
Point B: θ = 180°, N = 5, m = 1/10
σ θ = σ α 0.84 1.84 0.98 cos 2 α + 0.4 0.98 cos π 2 α 1.96
The hoop stress at point C and point D in Figure 5b can be calculated by Formula (27):
Point C: θ = 0°, N = 6, m = 1/15
σ θ = σ α 2 135 37 cos 2 α
Point D: θ = 90°, N = 6, m = 1/15
σ θ = σ α 8 630 37 cos 2 α + π + 90 37 c o s 2 α 16

3.2. Location Parameter Calculation for Perforation Defects

In order to avoid the overlap of the elastoplastic stress zone, the distance between the perforation defects must be large enough to greatly reduce the interaction between them and prevent perforation from damaging the mechanical properties of the casing pipe body. The distribution position between the holes is directly determined by the perforation parameters (shot density and phasing), and the geometric relationship between the holes is shown in Figure 6.
For a given well diameter, the optimal combination of the shot density and phasing of spirally arranged must meet the general engineering design requirements. That is, at least one pair of the distances among l12, l13, and l23 must be approximately equal in order to reach the maximum hole spacing. According to the geometric relationship shown in Figure 6, the formula for calculating the distance between three adjacent holes can be derived as follows:
l 12 = 1000 n · 360 α l 13 = 1000 n 2 + 2 π r α 360 2 l 23 = l 13 · cos β 2 + l 12 l 13 · sin β 2
where
β = a r c t a n 500 · 360 n α · π r θ = a r c t a n l 12 l 13 sin β l 13 cos β
where l 12 is the distance between Hole 1 and Hole 2, mm; l 13 is the distance between Hole 1 and Hole 3, mm; l 23 is the distance between Hole 2 and Hole 3, mm; n is the perforation shot density, holes/m; α is the perforation phase angle, °; r is the cylinder inner radius, mm. According to previous research results, the casing is always yielded from the inner wall. So, the radius r is taken as the inner diameter of the given casing r = 121.36/2 = 60.68 mm.
From Formulas (32) and (33), the values of l l12, l13, l23, β, θ corresponding to the given shot density and phase angle can be calculated and are listed in Table 3.
According to the calculation results in Table 3, when the shot density is 48 holes/m and the phase angle is 30°, the minimum hole spacing l13 is 37.99 mm. Based on this, it can be inferred that the overlap of the elastoplastic stress zone is likely to occur between Hole 1 and Hole 3, and the mechanical properties of the casing in this area are more susceptible to being affected by the interference between holes.
The following can be seen from Figure 7:
(1)
In most cases, the hole spacing l12 is closer to l23’s value. Only when the shot density and phase angle are both high, the hole spacing l23 is closer to the l13’s value. According to this, it can be judged that the common combinations of shot density and phase angle, which are listed in Table 3, meet the general engineering requirements for casing safety.
(2)
When the shot density is a fixed value, the hole spacing l12 and the angles of β and θ decrease with the increase in the phase angle. However, the hole spacing l13 increases with the increase in the phase angle. In most cases, the β is smaller than the θ, and the l12 and l23 are bigger than the l13. Based on this, it can be deduced that the overlap of the elastoplastic stress zone is more likely to occur between Hole 1 and Hole 3, which are on the spiral line.
(3)
Under a constant phase angle, increasing the shot density reduces the values of l12, l13, l23, β, and θ. While the hole spacing l13 and the angle θ exhibit similar variations with the phase angle across different shot densities, the sensitivity of l12, l23, and β to phase angle changes diminishes as shot density increases. This shows us that the distance between Hole 1 and Hole 3 on the spiral line is almost unaffected by the change in shot density, and the larger shot density, the less degree of the other parameters l12, l23, and β affected by the change in phase angle.

3.3. Calculation Models for Stress Intensity Factors with Cracks

Building upon the stress concentration analysis of perforation defects in the previous section, this part addresses the failure mode initiated from these stress concentrators: crack propagation. A mechanical performance calculation based solely on tensile or yield strength does not address failure due to the propagation of crack-like imperfections, where failure is governed by the stress intensity around the crack. When the applied stress intensity factor, KI, reaches a critical value referred to as the fracture toughness KIC, the crack propagates, and pipe rupture is imminent. The fracture toughness, KIC, is a material property that can be influenced by environmental conditions such as temperature and corrosive media.
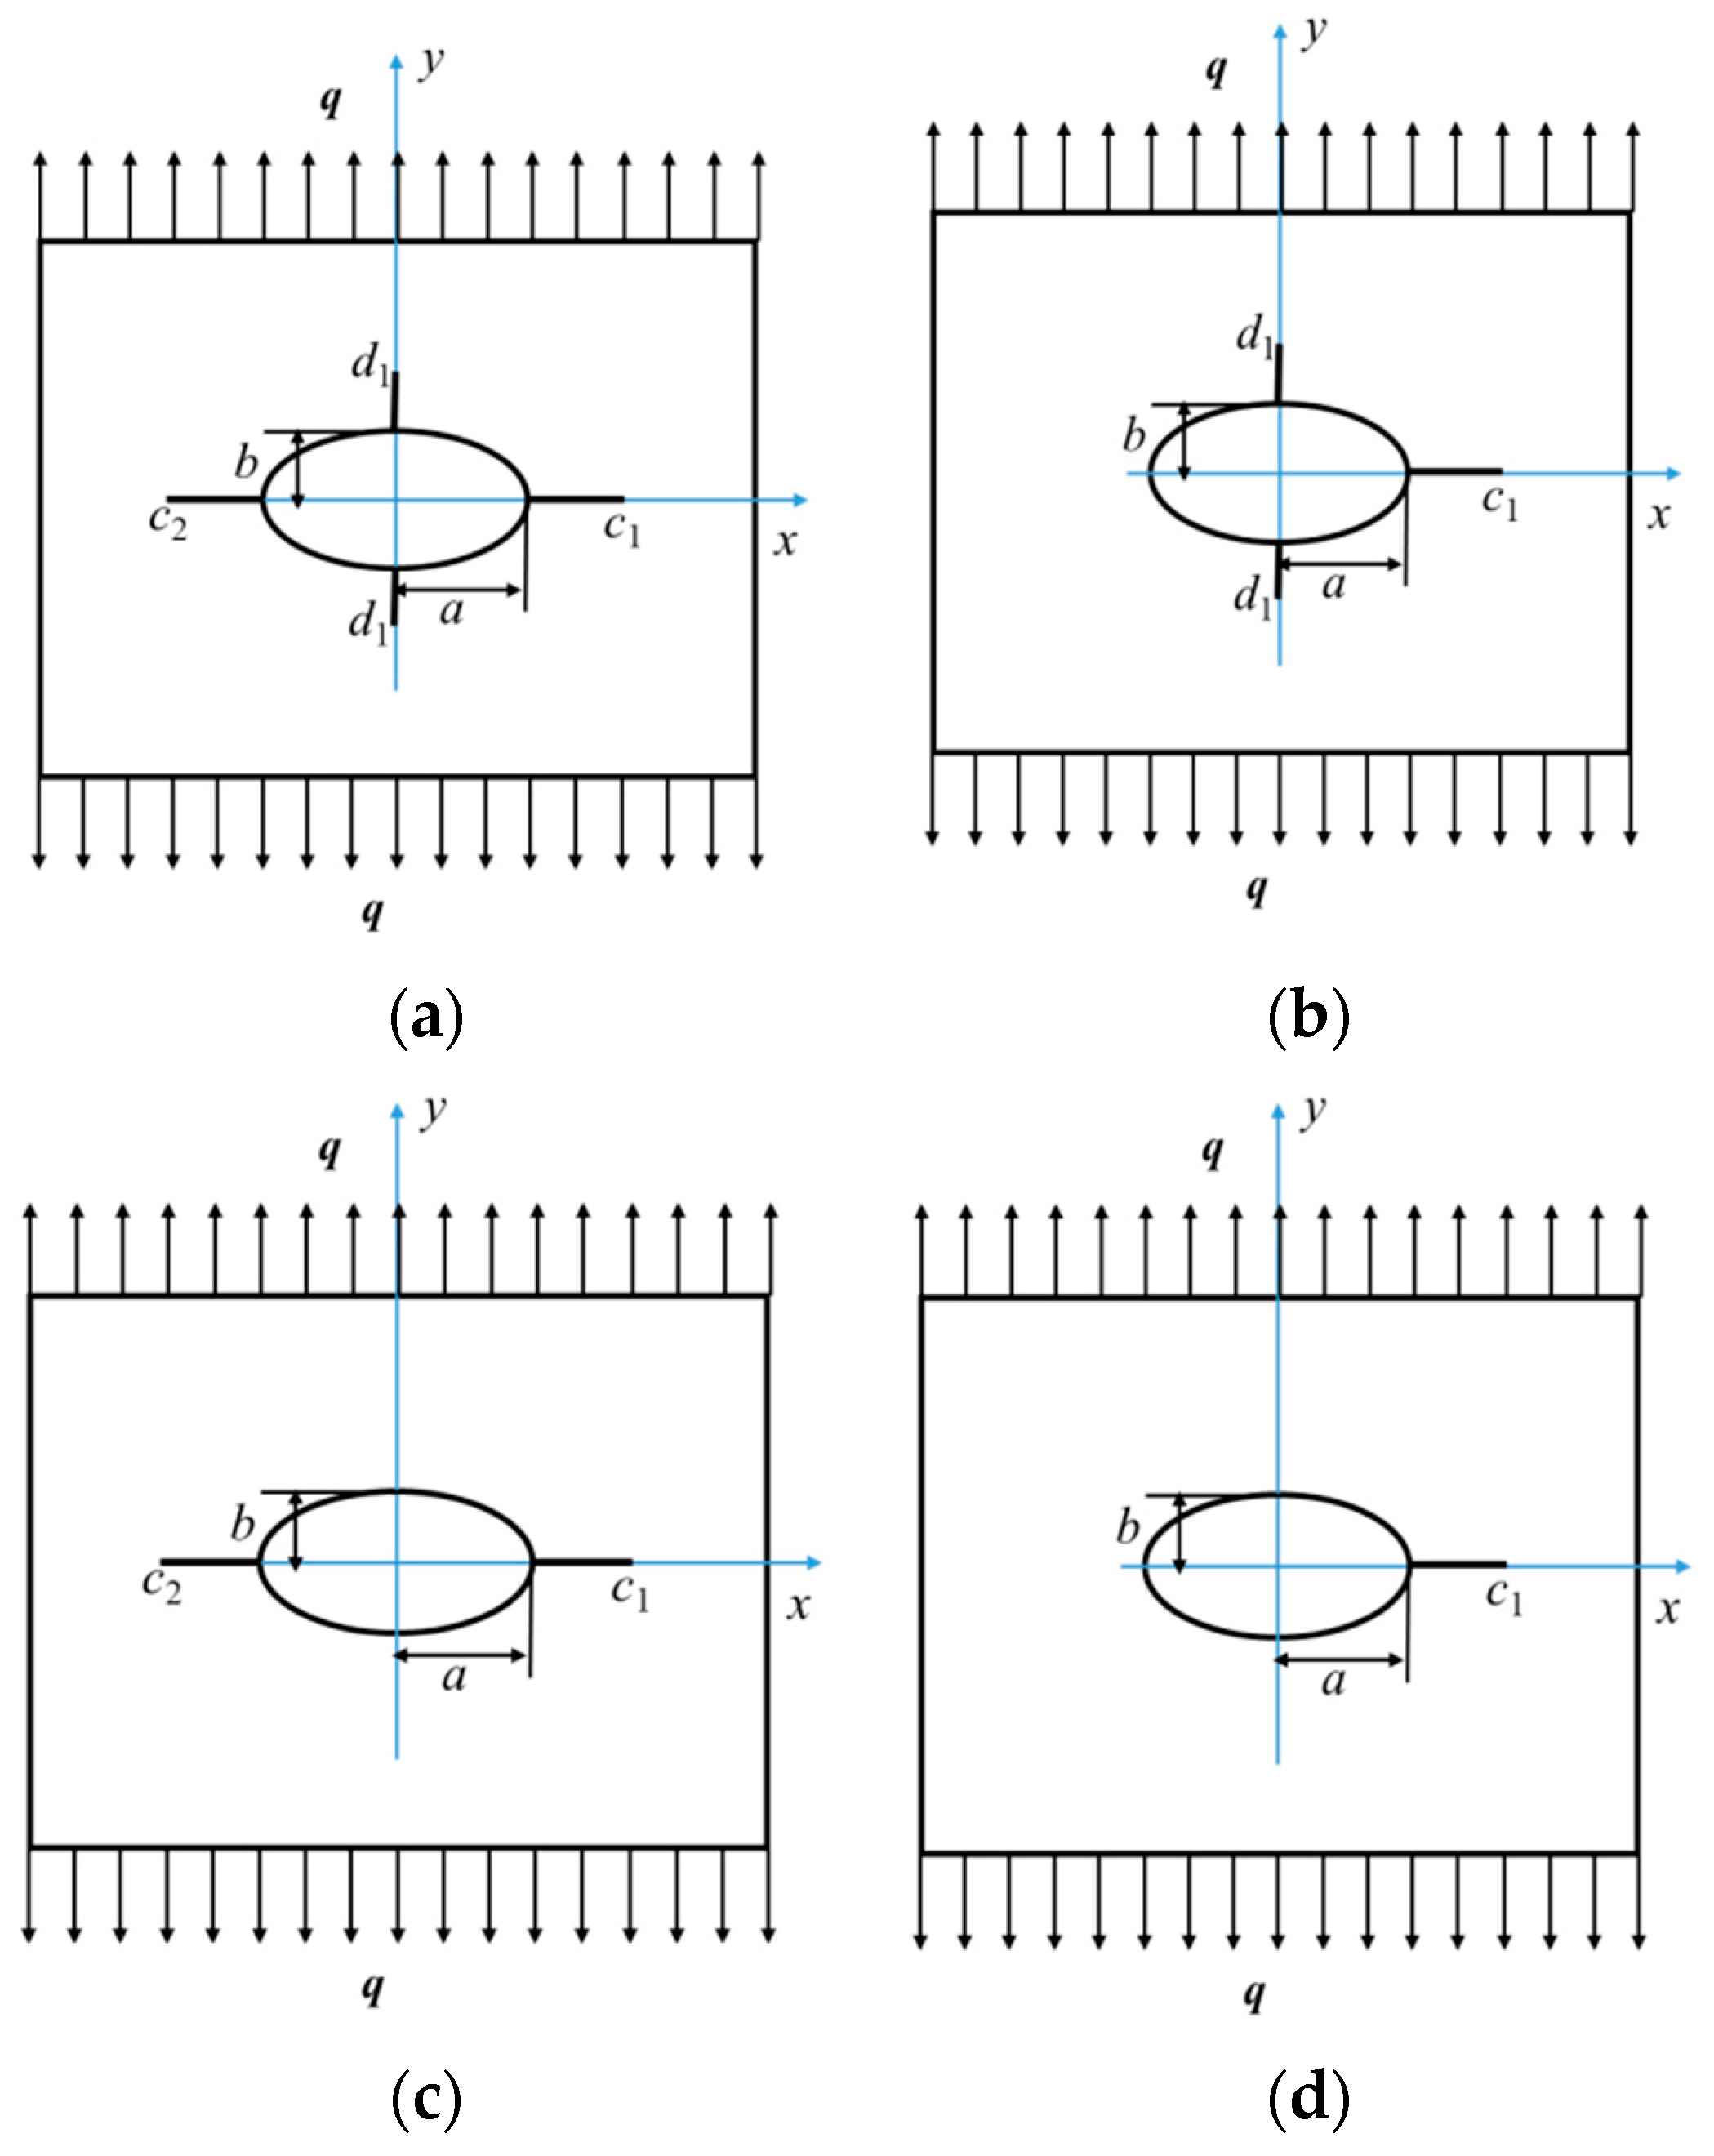
Figure 8 only shows the Mode I failure and the crack propagation perpendicular to the applied load.
(1)
Four cracks
Supposing there is an elliptical perforation defect with four cracks in an infinite plate, a and b are the lengths of the major and minor semi-axes of the ellipse, respectively. c1-a and c2-a are the lengths of two horizontal cracks, and d1-b represents the length of vertical cracks. The flat plate is only subjected to a uniform tension stress q along the y-axis, as shown in Figure 8a, and the formulas for calculating the stress intensity factor of the type I crack at the crack tip (c1, 0) of the elliptical defect are as follows [49]:
K I c 1 , 0 = q a + b π g 1 g 1 + g 1 2 1 g 1 2 + g 3 2 1 4 a + b g 1 + g 1 2 1 2 a b × g 1 2 1 1 4 g 2 2 + g 3 2 + g 1 2 + g 3 2 1 2
where
g 1 = e 1 2 + 1 2 e 1 g 2 = e 2 2 + 1 2 e 2 g 3 = f 1 2 1 2 f 1 e 1 = c 1 + c 1 2 a 2 + b 2 a + b e 2 = c 2 + c 2 2 a 2 + b 2 a + b f 1 = d 1 + d 1 2 + a 2 b 2 a + b
When a = b, Formula (35) can be used to calculate the Mode I stress intensity factor at the crack tip (c1, 0) of a circular defect with four cracks:
K I c 1 , 0 = q 2 π a g 1 g 1 2 1 1 4 g 2 2 + g 3 2 + g 1 2 + g 3 2 1 2 g 1 2 + g 3 2 1 4 g 1 + g 1 2 1
where
g 1 = c 1 2 + a 2 2 c 1 a g 2 = c 2 2 + a 2 2 c 2 a g 3 = d 1 2 a 2 2 d 1 a
(2)
Three cracks
When c2 = a, e2 = 1, g2 = 1, the formula for calculating the stress intensity factor of the Mode I crack at the crack tip (c1, 0) of an elliptical defect with three cracks can be derived from Formula (36):
K I c 1 , 0 = q a + b π g 1 g 1 + g 1 2 1 g 1 2 + g 3 2 1 4 a + b g 1 + g 1 2 1 2 a b × g 1 2 1 1 4 1 + g 3 2 + g 1 2 + g 3 2 1 2
where
g 1 = e 1 2 + 1 2 e 1 g 3 = f 1 2 1 2 f 1 e 1 = c 1 + c 1 2 a 2 + b 2 a + b f 1 = d 1 + d 1 2 + a 2 b 2 a + b
When a = b, Formula (37) can be used to calculate the Mode I stress intensity factor at the crack tip (c1, 0) of a circular defect with three cracks:
K I c 1 , 0 = q 2 π a g 1 g 1 g 1 2 1 g 1 2 + g 3 2 1 4 × g 1 2 1 1 4 1 + g 3 2 + g 1 2 + g 3 2 1 2
where
g 1 = c 1 2 + a 2 2 c 1 a g 3 = d 1 2 a 2 2 d 1 a
(3)
Two cracks
When d1 = b, f1 = 1, g3 = 0, the formula for calculating the stress intensity factor of the Mode I crack at the crack tip (c1, 0) of an elliptical defect with two cracks can be derived from Formula (38):
K I c 1 , 0 = q a + b π g 1 + g 2 g 1 + g 1 2 1 g 1 2 1 1 4 a + b g 1 + g 1 2 1 2 a b
where
g 1 = e 1 2 + 1 2 e 1 g 2 = e 2 2 + 1 2 e 2 e 1 = c 1 + c 1 2 a 2 + b 2 a + b e 2 = c 2 + c 2 2 a 2 + b 2 a + b
When a = b, Formula (39) can be used to calculate the Mode I stress intensity factor at the crack tip (c1, 0) of a circular defect with two cracks. The deduced formula is the same as that in the literature [50]:
K I c 1 , 0 = q z π a g 1 + g 2 g 1 g 1 2 1 g 1 2 1 1 4
where
g 1 = c 1 2 + a 2 2 c 1 a g 2 = c 2 2 + a 2 2 c 2 a
(4)
One crack
When d1 = b, c2 = a, f1 = 1, g3 = 0, e2 = 1, g2 = 1, the formula for calculating the stress intensity factor of the Mode I crack at the crack tip (c1, 0) of an elliptical defect with one crack can be derived from Formula (40), which is the same as the deduced formula in the literature [51]:
  K I c 1 , 0 = q a + b π g 1 + 1 g 1 + g 1 2 1 g 1 2 1 1 4 a + b g 1 + g 1 2 1 2 a b
where
g 1 = e 1 2 + 1 2 e 1 e 1 = c 1 + c 1 2 a 2 + b 2 a + b
When a = b, Formula (41) can be used to calculate the Mode I stress intensity factor at the crack tip (c1, 0) of a circular defect with two cracks:
K I c 1 , 0 = q 2 π a g 1 + 1 g 1 g 1 2 1 g 1 2 1 1 4
where
g 1 = c 1 2 + a 2 2 c 1 a
From the Formulas (36)–(41), it is found that the value of the Mode I stress intensity factor is not only proportional to the tensile load, but also affected by the shape of the perforation defect (the length of a and b) and the length of different cracks (such as c1-a, c2-a, d1-b).

4. Presentation and Analysis of Results

Based on the theoretical models established in Section 2, this section presents and systematically analyzes the calculated results concerning the mechanical properties of the perforated casing. The analysis begins with an evaluation of stress concentration and safety performance under different defect geometries, focusing on the perforation influence coefficient. The discussion then proceeds with the fracture behavior, investigating the effects of crack number, defect shape, and crack length on the Stress Intensity Factor.

4.1. Stress Concentration Analysis of Casing with Perforation Defects

4.1.1. Mechanical Property Analysis of Casing with Circular Defects

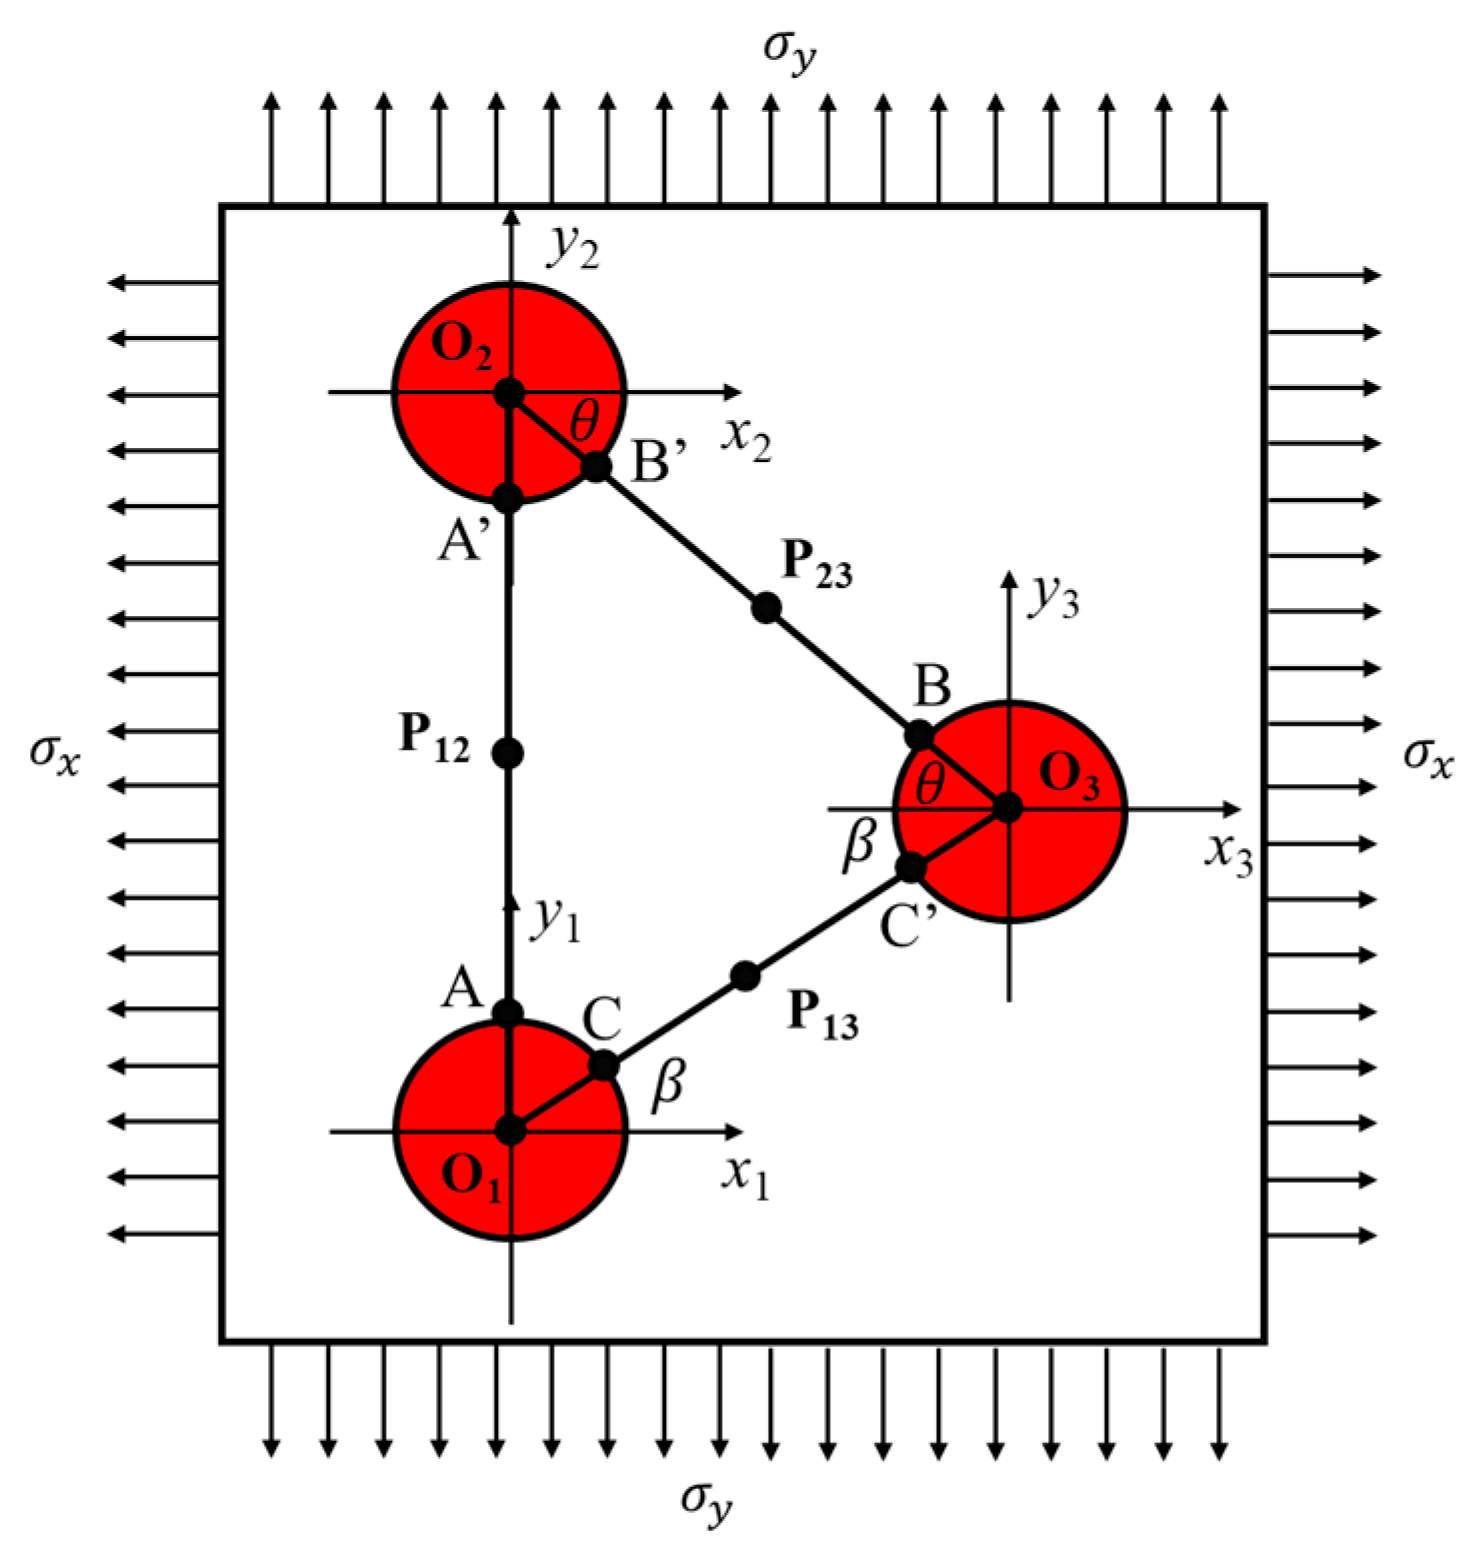
Points P12, P13, and P23 in Figure 9 are the midpoints of the distances between Hole 1 and Hole 2, Hole 1 and Hole 3, and Hole 2 and Hole 3, respectively. Based on the circular hole stress calculation model, it can be known that the stress at point A of Hole 1 equal the stress at point A’ of Hole 2, the stress at point C of Hole 1 equal the stress at point C’ of Hole 3, and the stress at point B of Hole 3 equal the stress at point B’ of Hole 2. Taking the circular hole diameter as 10 mm, the hoop stress and the radial stress at points A, B, C, P12, P13, and P23 can be calculated according to the previously solved loads shown in Table 2. The position parameters of each calculation point are shown in Table 4.
(1)
Uniform external pressure (76.54 MPa)
From the calculation data in Table 2, it can be seen that when a uniform external pressure of 76.54 MPa is applied, the inner surface of the selected casing begins to collapse. At this time, the radial stress σr = 0 and the hoop stress σh = −623.96 MPa on the inner surface of the casing, corresponds to the stress σx = −623.96 MPa, σy = 0, σz = 0 in Figure 8. We calculated the hoop stress and radial stress at A, B, C, P12, P13, and P23 using Formula (21).
Through calculation, it can be known that the hoop stress and radial stress at point P13, where interference between holes is more likely to occur, are −207.43 MPa and −382.06 MPa, respectively. The equivalent stress at point P13 (shot density is 48 holes/m, phase angle is 30°) can be obtained by Formula (1):
σ e , P 13 = ( 207.43 ) 2 + ( 382.06 ) 2 ( 207.43 ) × ( 382.06 )   =   331.28   M P a   <   758   M P a ,
where 758 MPa corresponds to the specified minimum yield strength of the pipe material.
Based on this, it can be seen that under the commonly used combinations of shot density and phase angle, the interference between holes, due to the small hole spacing, will not cause an adverse effect on casing safety in the perforation section when subjected to a critical collapse external pressure.
(2)
External pressure (76.54 MPa) + Compression stress (−232.68 MP)
When the combined action of uniform external pressure + axial compression load is applied to the selected casing, the radial stress σr = 0, the hoop stress σh = −623.96 MPa, and the axial compression stress σa = −232.68 MPa on the inner surface of the casing can be found in Table 2. The stress σx = −623.96 MPa, σy = −232.68 MPa, σz = 0 are shown in Figure 8. We calculated the hoop stress and radial stress at A, B, C, P12, P13, and P23 according to Formula (23)
Through calculation, it can be known that the hoop stress and radial stress at point P13, where interference between holes is more likely to occur, are −378.88 MPa and −456.15 MPa, respectively. The equivalent stress at point P13 (shot density is 48 holes/m, phase angle is 30°) can be obtained by Formula (1):
σ e , P 13 = 378.88 2 + 456.15 2 ( 378.88 ) × ( 456.15 ) = 422.84   M P a < 758   M P a ,
where 758 MPa corresponds to the specified minimum yield strength of the pipe material.
Based on this, it can be seen that although the pipe body stress is increased when a compound load of uniform external pressure and axial compression is applied, the commonly used combinations of shot density and phase angle still meet the safety requirements of the engineering standard.
(3)
Uniform internal pressure (86.35 MPa)
From the calculation data in Table 2, it can be seen that when a uniform internal pressure of 86.35 MPa is applied, the inner surface of the selected casing begins to yield. At this time, the radial stress σr = −86.35 MPa and the hoop stress σh = 617.57 MPa on the inner surface of the casing, corresponding to the stress σx = 617.57 MPa, σy = 0, σz = −86.35 MPa in Figure 8. We calculated the hoop stress and radial stress at A, B, C, P12, P13, and P23 according to Formula (21).
Through calculation, it can be known that the hoop stress and radial stress at point P13, where interference between holes is more likely to occur, are −205.31 MPa and 378.15 MPa, respectively. The equivalent stress at point P13 (shot density is 48 holes/m, phase angle is 30°) can be obtained by Formula (1):
σ e , P 13 = 205.31 2 + 378.15 2 + 86.35 2 205.31 × 378.15 205.31 × 86.35 378.15 × 86.35 = 406.63   M P a < 758   M P a ,
where 758 MPa corresponds to the specified minimum yield strength of the pipe material.
Based on this, it can be seen that although the pipe body stress increases 75.35 MPa compared with the critical collapse external pressure, the commonly used combinations of shot density and phase angle still meet the safety requirements of the engineering standard when a critical internal pressure yield load is applied.
(4)
Uniform internal pressure (94.55 MPa) + Tension stress (174.51 MPa)
When the combined action of uniform internal pressure + axial tension load is applied to the selected casing, the radial stress σr = −94.55 MPa, the hoop stress σh = 676.26 MPa, and the axial tension stress σa = 174.51 MPa on the inner surface of the casing can be found in Table 2. The stress σx = 676.26 MPa, σy = 174.51 MPa, σz = −94.55 MPa are shown in Figure 8. We calculated the hoop stress and radial stress at A, B, C, P12, P13, and P23 according to Formula (23)
Through calculation, it can be known that the hoop stress and radial stress at point P13, where interference between holes is more likely to occur, are −353.41 MPa and 469.65 MPa, respectively. The equivalent stress at point P13 (shot density is 48 holes/m, phase angle is 30°) can be obtained by Formula (1):
σ e , P 13 = 353.41 2 + 469.65 2 + 94.55 2 353.41 × 469.65 353.41 × 94.55 469.65 × 94.55 = 515.99   M P a < 758   M P a ,
where 758 MPa corresponds to the specified minimum yield strength of the pipe material.
Based on this, it can be seen that although the pipe body stress increases 93.15 MPa compared with the compound load of uniform external pressure and axial compression, the commonly used combinations of shot density and phase angle still meet the safety requirements of the engineering standard when a compound load of uniform external pressure + axial compression is applied.
(5)
Comparative analysis of the influence degree of perforated casing
In order to intuitively reflect the influence degree of the perforation parameters and load forms on the mechanical properties of the perforated casing, the following formula is used to define the perforation influence degree coefficient λ:
λ = σ e , i / σ e , o
where σ e , i is the equivalent stress corresponding to each point A, B, C, P12, P13, P23, calculated by Formula (1); σ e , o is the equivalent stress of the non-perforated casing, which is listed in Table 2 under different critical loads.
When λ = 1, the equivalent stress of the calculated point after perforation is equal to that before perforation, which means that the analysis factor has no effect on the mechanical properties and safety performance of the perforated casing; when λ > 1, the equivalent stress of the calculated point after perforation is greater than that before perforation. The higher λ value, the greater equivalent stress difference before and after perforation. That is, compared with the casing in the non-perforation section, the perforation increases the equivalent stress of the calculated point under the same load. This shows that the analysis factor has a greater negative impact on the casing mechanical properties, resulting in a greatly reduced casing safety performance, and the perforated casing is prone to damage and failure. When λ < 1, the equivalent stress of the calculated point after perforation is less than that before perforation. The lower the value of λ, the greater the equivalent stress difference before and after perforation. That is, compared with the casing in the non-perforation section, the perforation decreases the equivalent stress of the calculated point under the same load. This means that the analysis factor has a greater positive impact on casing mechanical properties, and the safety performance of the casing is improved. The casing in this perforation section is not prone to damage and failure.
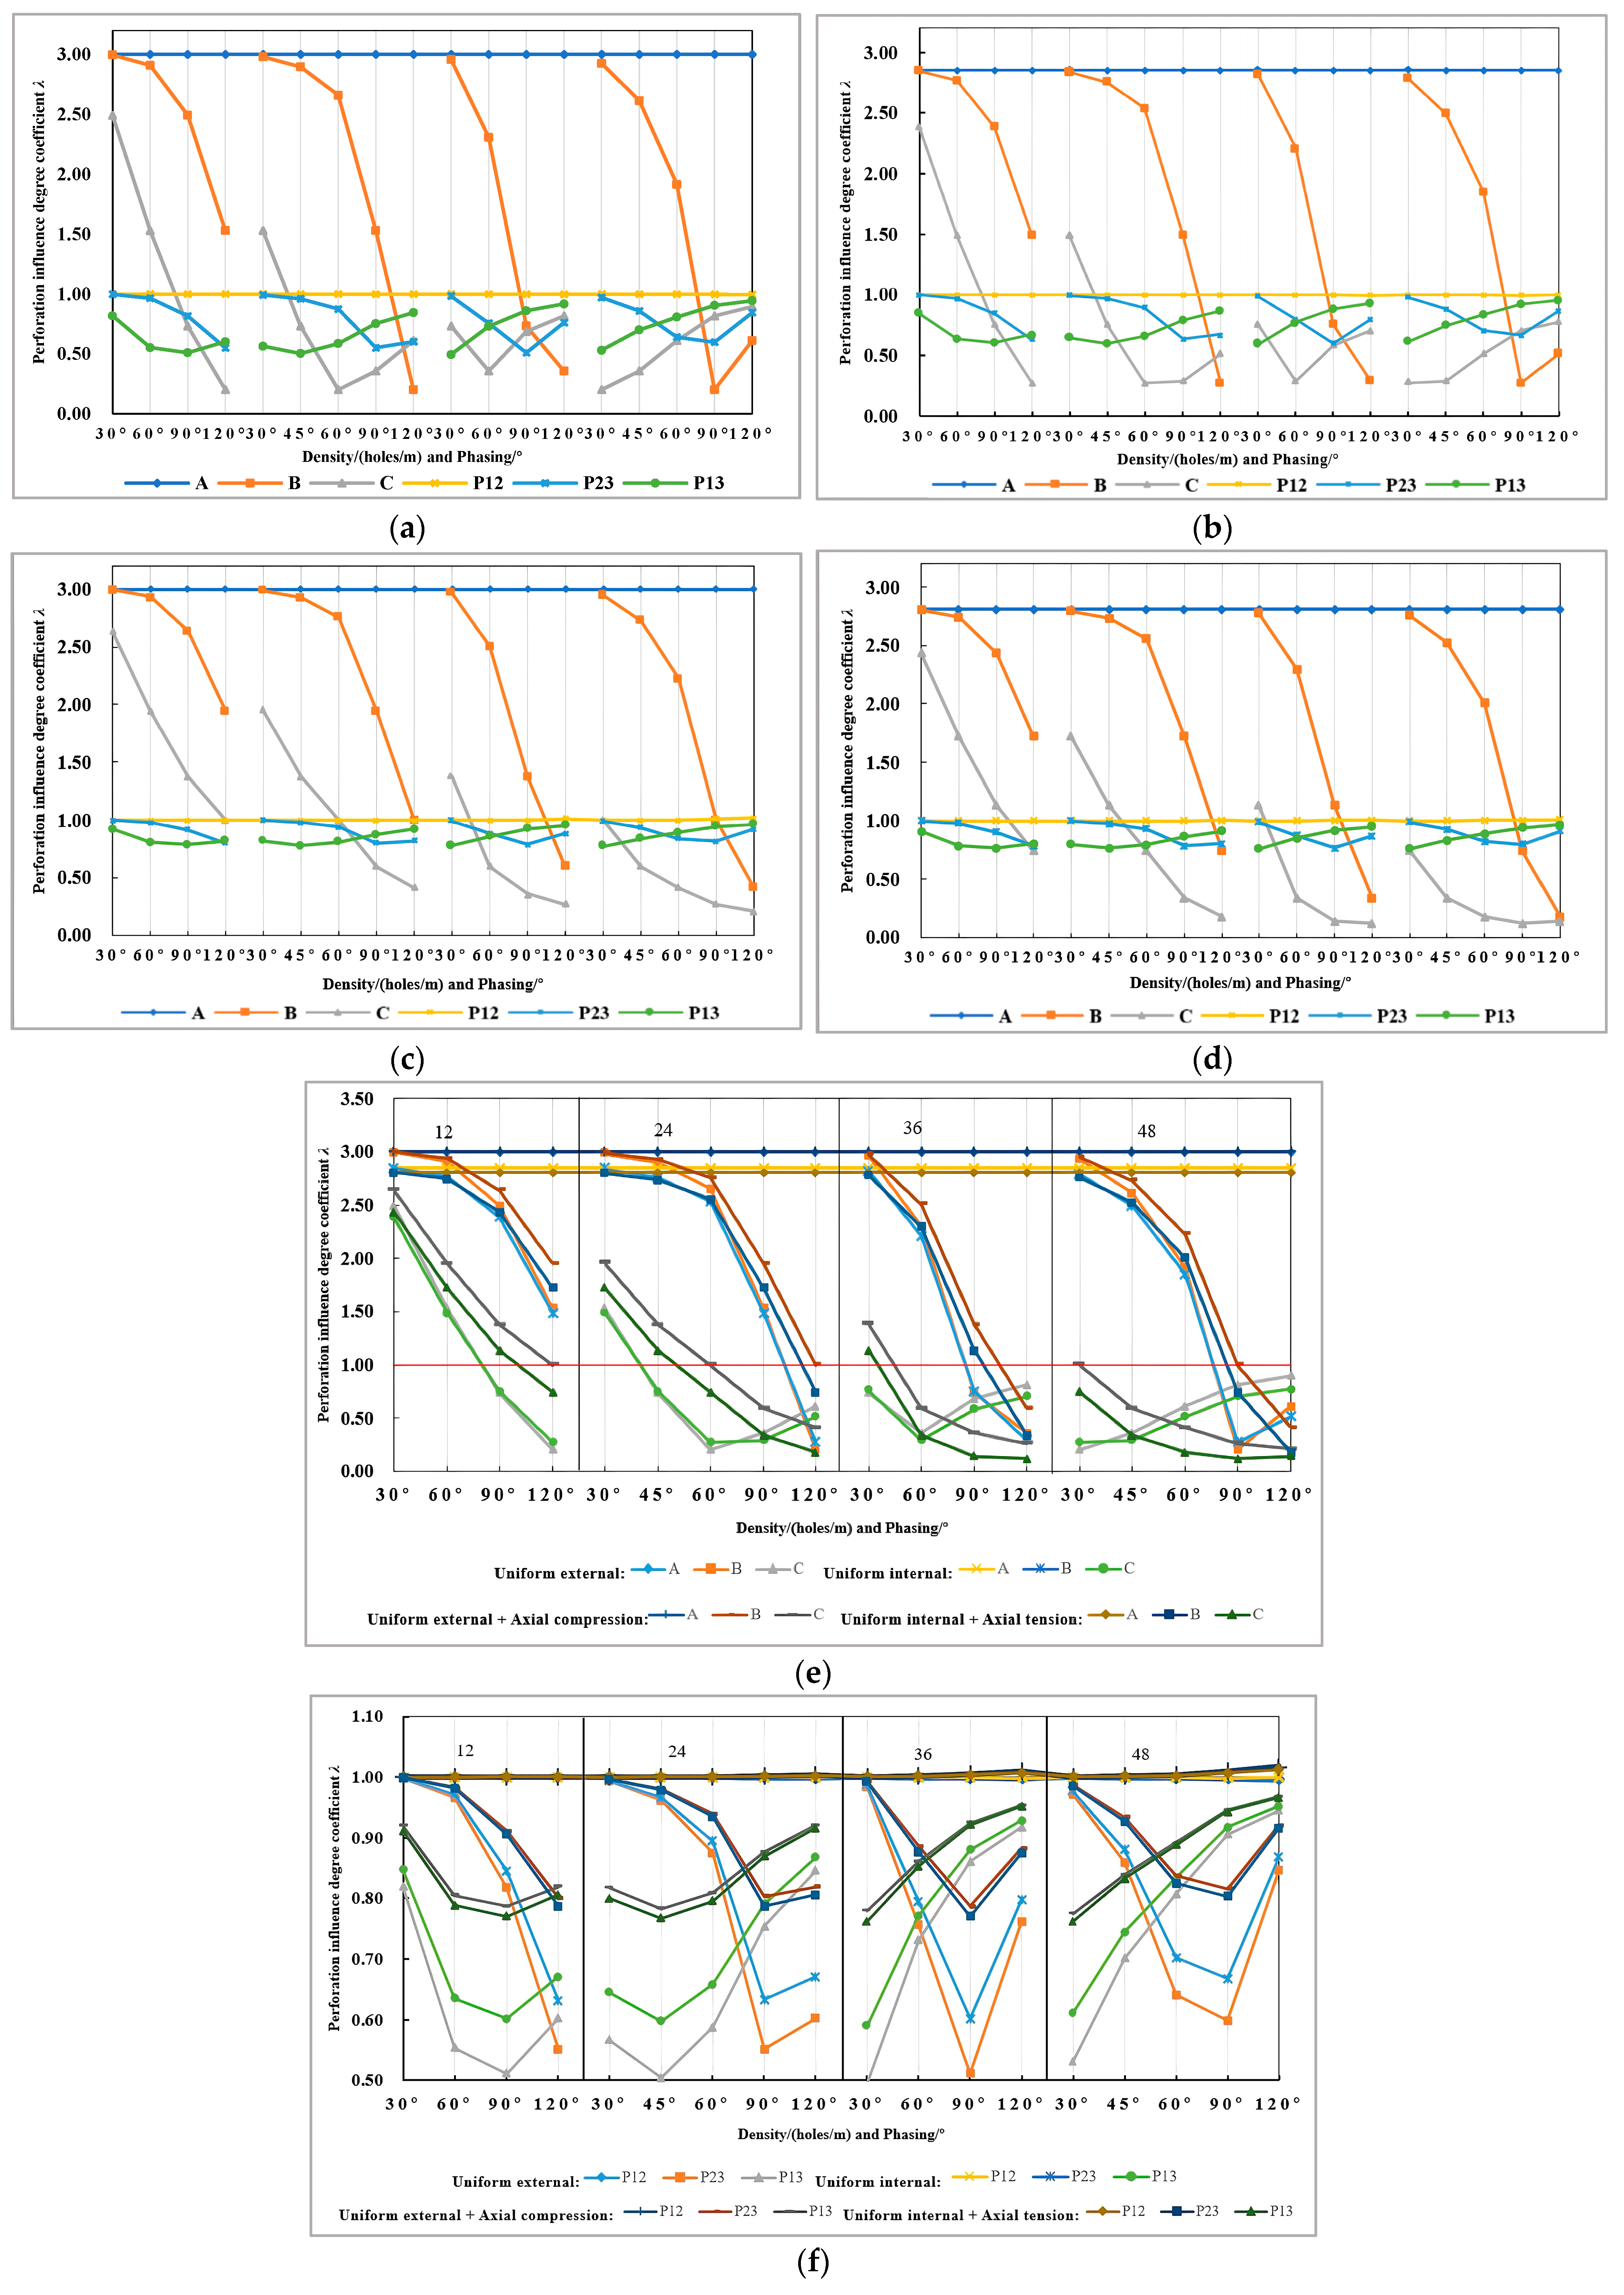
The following can be seen from Figure 10:
(1)
The maximum λ value consistently appears at point A across all loads: λ ≈ 3 under uniform external pressure and λ ≈ 2.85 under uniform internal pressure, with no variation against shot density or phasing. This confirms that the hole centerline parallel to the casing axis is the most significant stress concentration zone, where perforation most significantly compromises the mechanical properties of the casing, resulting in the lowest safety performance of the pipe body.
(2)
The analysis of points B and C under various loads consistently demonstrates that a higher shot density and a larger phase angle generally enhance the safety performance of the perforated casing by reducing the stress concentration factor (λ). For both points, for λ > 1, a larger phase angle reduces the λ value, with the effect being more pronounced at higher shot densities—indicating a mitigation of perforation’s negative impact. Conversely, for λ < 1, increasing the shot density allows more points to enter this beneficial region, demonstrating a positive mechanical benefit. However, the λ values at point B (e.g., rising from 0.2 to 0.61 under external pressure as the phase angle increases to 120°) confirm that an optimal range also exists for combining these parameters to maximize safety performance.
(3)
Mechanical analysis of key points reveals distinct perforation effects under various loads. At point P12, λ remains approximately 1, indicating negligible influence from perforation. From the data in Table 5, Table 6, Table 7 and Table 8, while stress concentrations are highest at hole-edge points A and A’, no significant elastoplastic stress overlap occurs between adjacent holes within common parameter ranges, and the overall casing safety remains comparable to its non-perforated state. In contrast, points P23 and P13 consistently exhibit λ < 1, reflecting a beneficial stress reduction and improved safety. Although high shot density and large phase angle generally enhance performance, their interaction requires optimization. As shown in Figure 10f, the optimal phase angles for P23 and P13 vary with shot density, with minimal λ values occurring at 36 holes/m (90° for P23, 30° for P13). Synthesizing the λ values across all points (P12, P23, P13), the optimal parameter combination is determined to be a shot density of 36 holes/m with a phase angle of 60°.

4.1.2. Mechanical Property Analysis of Casing with Elliptical Defects

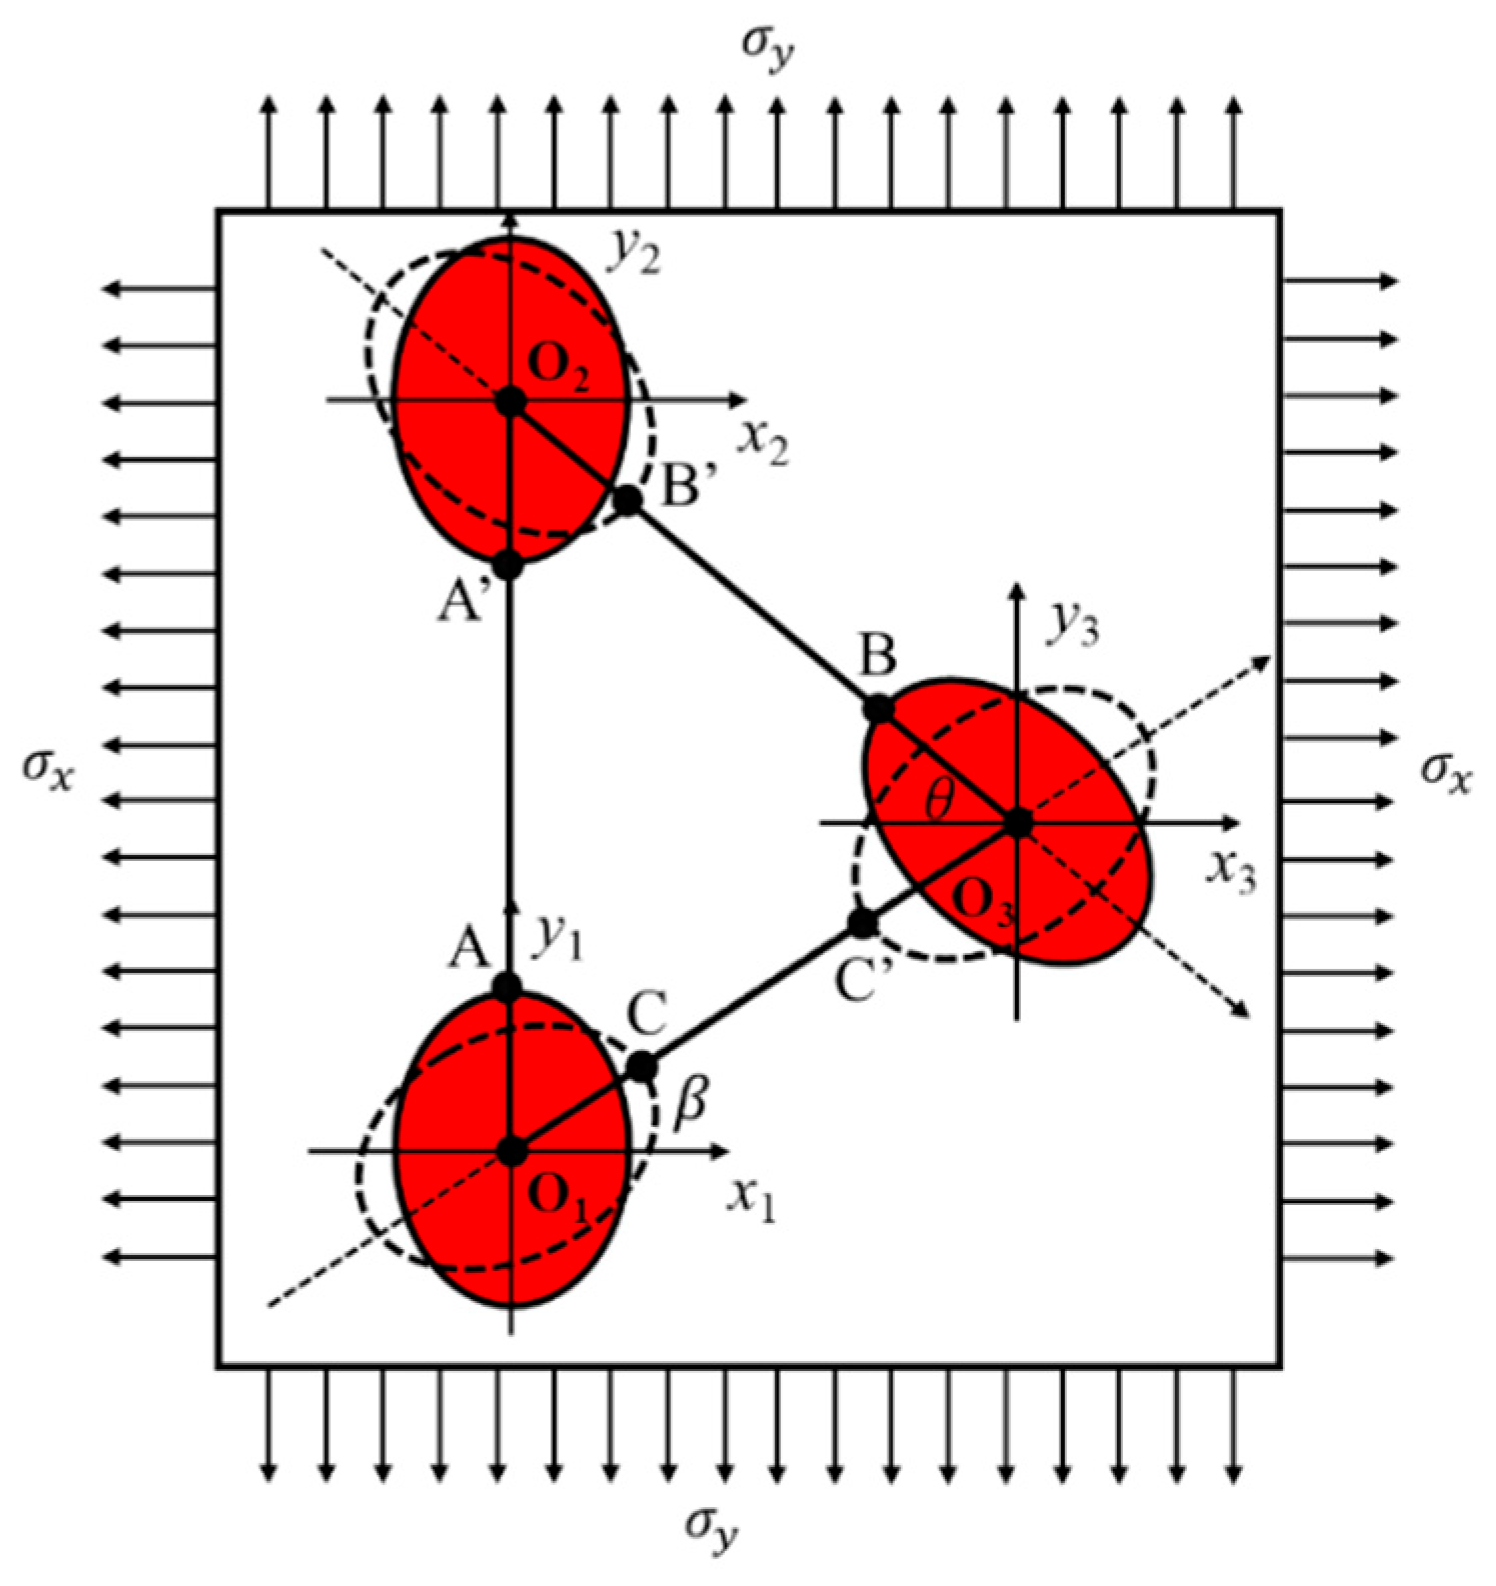
Assume that the three elliptical perforation defects at the positions of point O1, O2, and O3 are placed as shown in Figure 11, where the line O1O2 between the center points of Hole 1 and Hole 2 is parallel to the axis of the casing. Based on the elliptical hole stress calculation model, it can be known that when the major axes of Holes 1 and 2 are both on the O1O2 line, the stress at point A of Hole 1 equals the stress at point A’ of Hole 2. When the major axes of Hole 2 and Hole 3 are both on the O2O3 line, the stress at point B of Hole 3 equals the stress at point B’ of Hole 2. When the major axes of Hole 1 and Hole 3 are both on the O1O3 line, the stress at point C of Hole 1 equals the stress at point C’ of Hole 3. Taking the length of the elliptical hole’s minor axis 2b is 10 mm, and the length of the major axis 2a is 12.5 mm, 15 mm, 17.5 mm, and 20 mm, respectively. The hoop stress at points A, B, and C can be calculated according to the values of β and θ shown in Table 3 and Formula (26). The position parameters of each calculation point are shown in Table 9.
(1)
Uniform external pressure (76.54 MPa)
From the calculation results in Table 10, it can be seen that when a uniform external pressure of 76.54 MPa is applied, the radial stress σr = 0 and the hoop stress σh = −623.96 MPa on the inner surface of the casing, corresponding to the stress σx = −623.96 MPa, σy = 0, σz = 0 in Figure 10. Regarding σ α as σx = −623.96 MPa, calculate the hoop stress and radial stress at A, B, and C under different ellipse ratio coefficients m according to Formula (26). The calculation results can be seen in Table 10.
(2)
External pressure (76.54 MPa) + Compression stress (−232.68 MP)
When the combined action of uniform external pressure + axial compression load is applied to the selected casing, the radial stress σr = 0, the hoop stress σh = −623.96 MPa and the axial compression stress σa = −232.68 MPa on the inner surface of the casing can be found in Table 2. The stress σx = −623.96 MPa, σy = −232.68 MPa, σz = 0 are shown in Figure 10. First, the hoop stress at points A, B, and C can be calculated by using Formula (26) when σ α is regarded as σx = −623.96 MPa, and then the hoop stress at points A, B, and C is calculated again when σ α is regarded as σy = −232.68 MPa. Finally, the two calculation results are superimposed to obtain the hoop stress at A, B, and C under the combined action of uniform external pressure + axial compression (see Table 11 for calculation results).
(3)
Uniform internal pressure (86.35 MPa)
From the calculation results in Table 2, it can be seen that when a uniform internal pressure of 86.35 MPa is applied, the inner surface of the selected casing begins to yield. At this time, the radial stress σr = −86.35 MPa and the hoop stress σh = 617.57 MPa on the inner surface of the casing, corresponding to the stress σx = 617.57 MPa, σy = 0, σz = −86.35 MPa in Figure 10. Regarding σ α as σx = 617.57 MPa, calculate the hoop stress and radial stress at A, B, and C under different ellipse ratio coefficients m according to Formula (26). The calculation results can be seen in Table 12.
(4)
Uniform internal pressure (94.55 MPa) + Tension stress (174.51 MPa)
When the combined action of uniform internal pressure + axial tension load is applied to the selected casing, the radial stress σr = −94.55 MPa, the hoop stress σh = 676.26 MPa and the axial tension stress σa = 174.51 MPa on the inner surface of the casing can be found in Table 2. The stress σx = 676.26 MPa, σy = 174.51 MPa, σz = −94.55 MPa are shown in Figure 10. First, the hoop stress at points A, B, and C can be calculated by using Formula (26) when σ α is regarded as σx = 676.26 MPa, and then the hoop stress at points A, B, and C is calculated again when σ α is regarded as σy = 174.51 MPa. Finally, the two calculation results are superimposed to obtain the hoop stress at A, B, and C under the combined action of uniform internal pressure + tension stress (see Table 13 for calculation results).
(5)
Comparative analysis of the influence degree of perforated casing
The perforation influence degree coefficient λ is obtained by Formula (34), and the mechanical properties of the casing with elliptical perforation defects can be analyzed as follows.
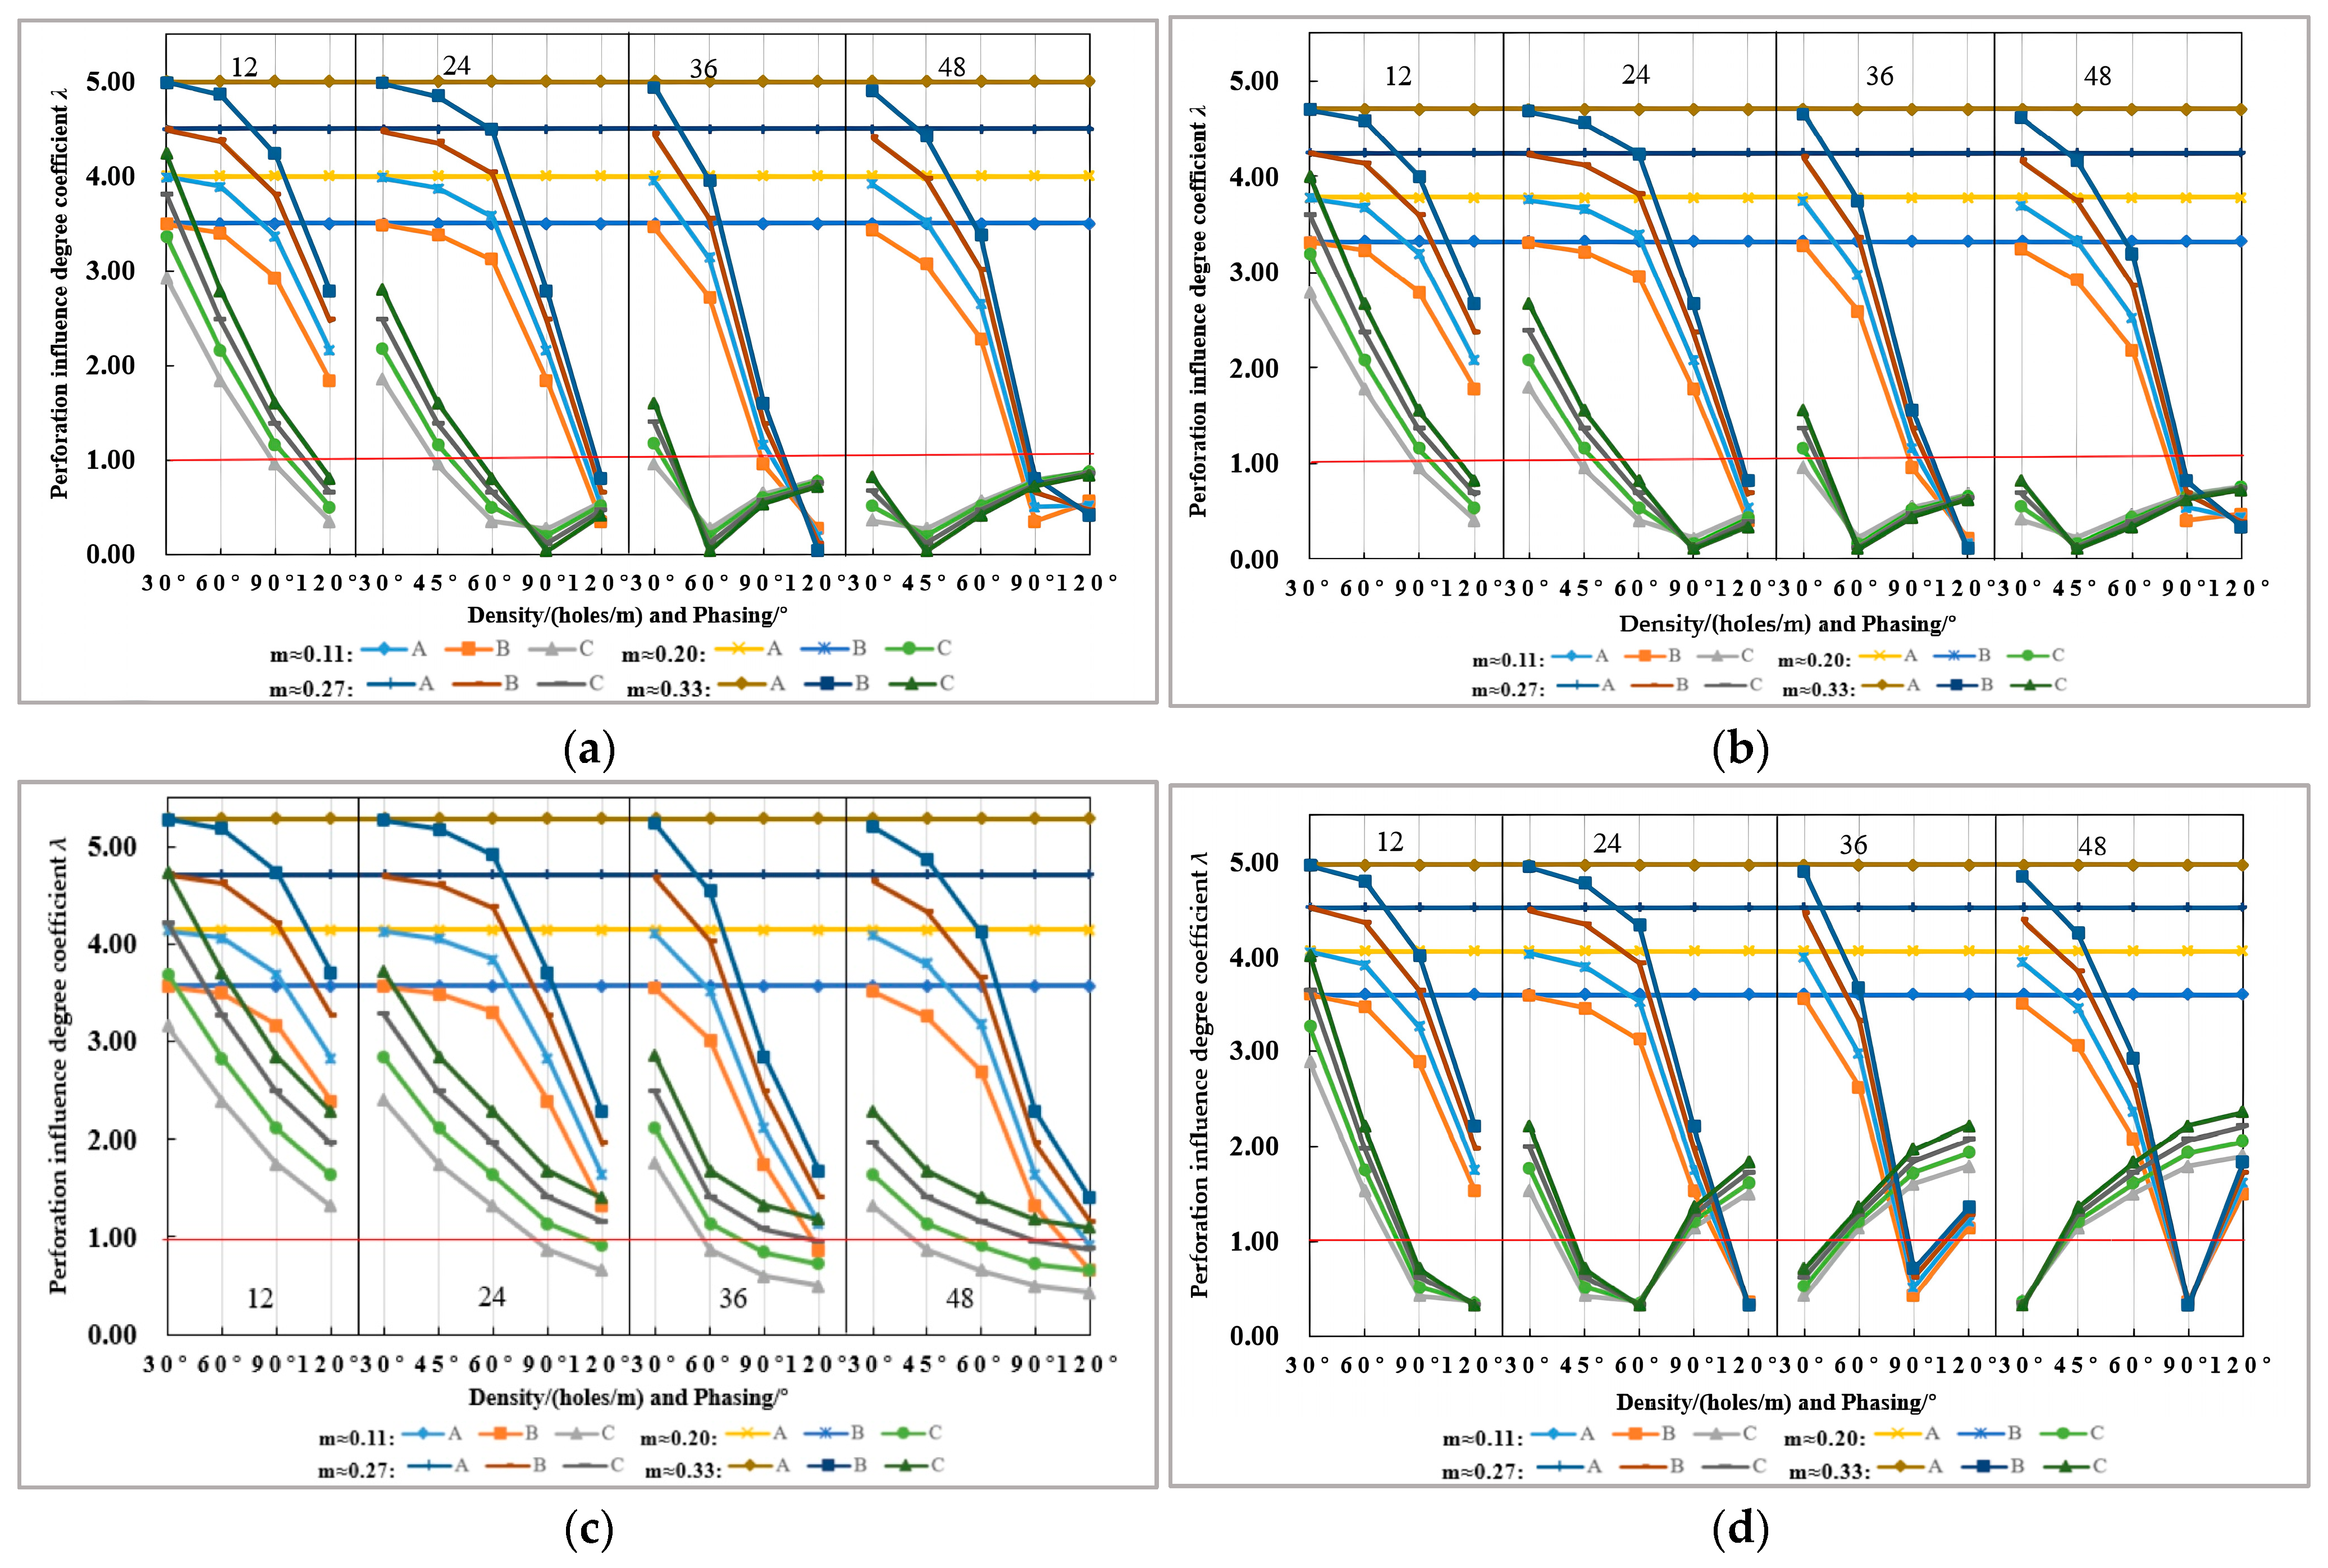
The following can be seen from Figure 12:
(1)
When the major axis of elliptical defects Hole 1 and Hole 2 are on the O1O2 line, the perforation influence degree coefficient λ at point A and point A’ is always the maximum under different loads. Its value is independent of shot density and phase angle but increases with the aspect ratio coefficient m. For instance, as m rises from 0.11 to 0.33, λ increases from 3.50 to 5.00 under external pressure and exhibits similar growth trends under other loads. This identifies the line connecting the major axis endpoints of adjacent ellipses as the zone of maximum stress concentration, where perforation most significantly reduces casing safety. Furthermore, comparing all the calculated data for point A in Figure 12a,b, λ values under external pressure are consistently slightly higher than under internal pressure, indicating that the perforated section is more susceptible to collapse failure than internal yield when subjected to its respective critical load.
(2)
When the major axis of elliptical defects Hole 2 and Hole 3 are on the O2O3 line, comparing the data of point B in Figure 12a–d it can be seen that point B exhibits a consistent trend: for λ > 1, its value decreases as the phase angle increases, with higher shot densities accelerating this reduction; for λ < 1, more points enter this beneficial region as shot density rises. Both trends confirm that the high shot density and large phase angle can improve the safety performance of the casing in the perforation section. However, the optimal combination is also influenced by the elliptical aspect ratio (m). For example, at a phase angle of 120°, the λ value at point B is minimum at m ≈ 0.11 for 24 holes/m but maximum at the same m for 36 and 48 holes/m. Furthermore, at 48 holes/m and m ≈ 0.11, the optimal phase angle shifts from 120° to 90°. This indicates that the axis ratio m is a critical factor in determining the optimal pairing of shot density and phase angle.
(3)
When the major axis of elliptical defects Hole 1 and Hole 3 are on the O1O3 line, from the perforation influence degree coefficient λ of point C in Figure 12a–d, it can be seen that a high shot density and large phase angle improve casing safety by reducing λ (for λ > 1) and promoting more points into the beneficial λ < 1 region. When the perforated casing is subjected to external and internal pressure load separately, the phase angle of the minimum λ value decreases from 90° to 45°, corresponding to the shot density increases from 24 holes/m to 48 holes/m, as shown in Figure 12a,b. This trend proves that there is an optimal combination scheme between shot density and phase angle which can ensure the safety performance of the casing. The calculated data at point C in Figure 12c,d show that the application of axial compression/tension in combined loading increases the number of points with λ > 1, thereby reducing safety compared to scenarios involving only internal or external pressure. A comprehensive comparison of the three defect orientations reveals that aligning the major axis along the perforation spiral (O1O3 line) yields the highest casing safety, while aligning it parallel to the casing axis (O1O2 line) results in the lowest.

4.1.3. Mechanical Property Analysis of Casing with Polygonal Perforation Defect

The calculation results of the stress distribution of circular and elliptical defects show that the maximum values of the hoop stress and the perforation influence degree coefficient λ are located on the line parallel to the casing axis at the defect boundary. The maximum values are only affected by the form and magnitude of the applied load, and do not change with the shot density and phase angle. Considering the representativeness of the calculation results, the simplicity of the calculation process, and the safety of engineering standards, the maximum hoop stress and its corresponding perforation influence degree coefficient λ of A and B in Figure 5a, C, and D in Figure 5b are calculated according to Formulas (28)–(31). The relevant calculation parameters and results are shown in Table 14 and Table 15.
By comparing the calculation results of the maximum hoop stress in Table 14 and Table 15, it can be seen that under all load forms, the hoop stress value of point A at the boundary of the pentagon defect is always greater than that of point B, and the hoop stress value of point C at the boundary of the hexagonal defect is always greater than that of point D. From this, it can be known that the maximum stress concentration occurs at the polygon edges rather than the vertices. The hoop stress value of point A at the boundary of the pentagonal defect is greater than the hoop stress value of point C at the boundary of the hexagonal defect, but the hoop stress value of point B is less than that of point D. Based on this, it can be inferred that as the number of polygon sides increases (or the vertex angle decreases), the hoop stress along the edges decreases, while the stress at the vertices increases. Whether a pentagon or a hexagon, the λ value under the external pressure load is always slightly greater than the λ value under the internal pressure load. According to this, it implies that the perforated casing section is more prone to collapse failure than internal yielding when subjected to its respective critical limit loads.

4.2. Fracture Mechanics Analysis of Casing with Cracks at Perforation Defects

Only when internal pressure or direct tensile load is applied to the casing, the tension stress q that is perpendicular to the crack propagation direction can occur near the perforation defect. According to the calculation results of the casing’s critical limit load in Table 2, the internal pressure at yield of the selected casing is −86.35 MPa. The hoop stress of the pipe body caused by the internal pressure can be regarded as the uniform tensile stress q = 617.57 MPa, leading to crack propagation. The Mode I stress intensity factor at the crack tip (c1, 0) of an elliptical or circular defect under different numbers of cracks can be obtained by Formulas (35)–(42). The following will study the influence on the mechanical properties of perforated casing under different crack numbers, crack length, and defect shape by using the calculation results.

4.2.1. Crack Numbers and Defect Shapes

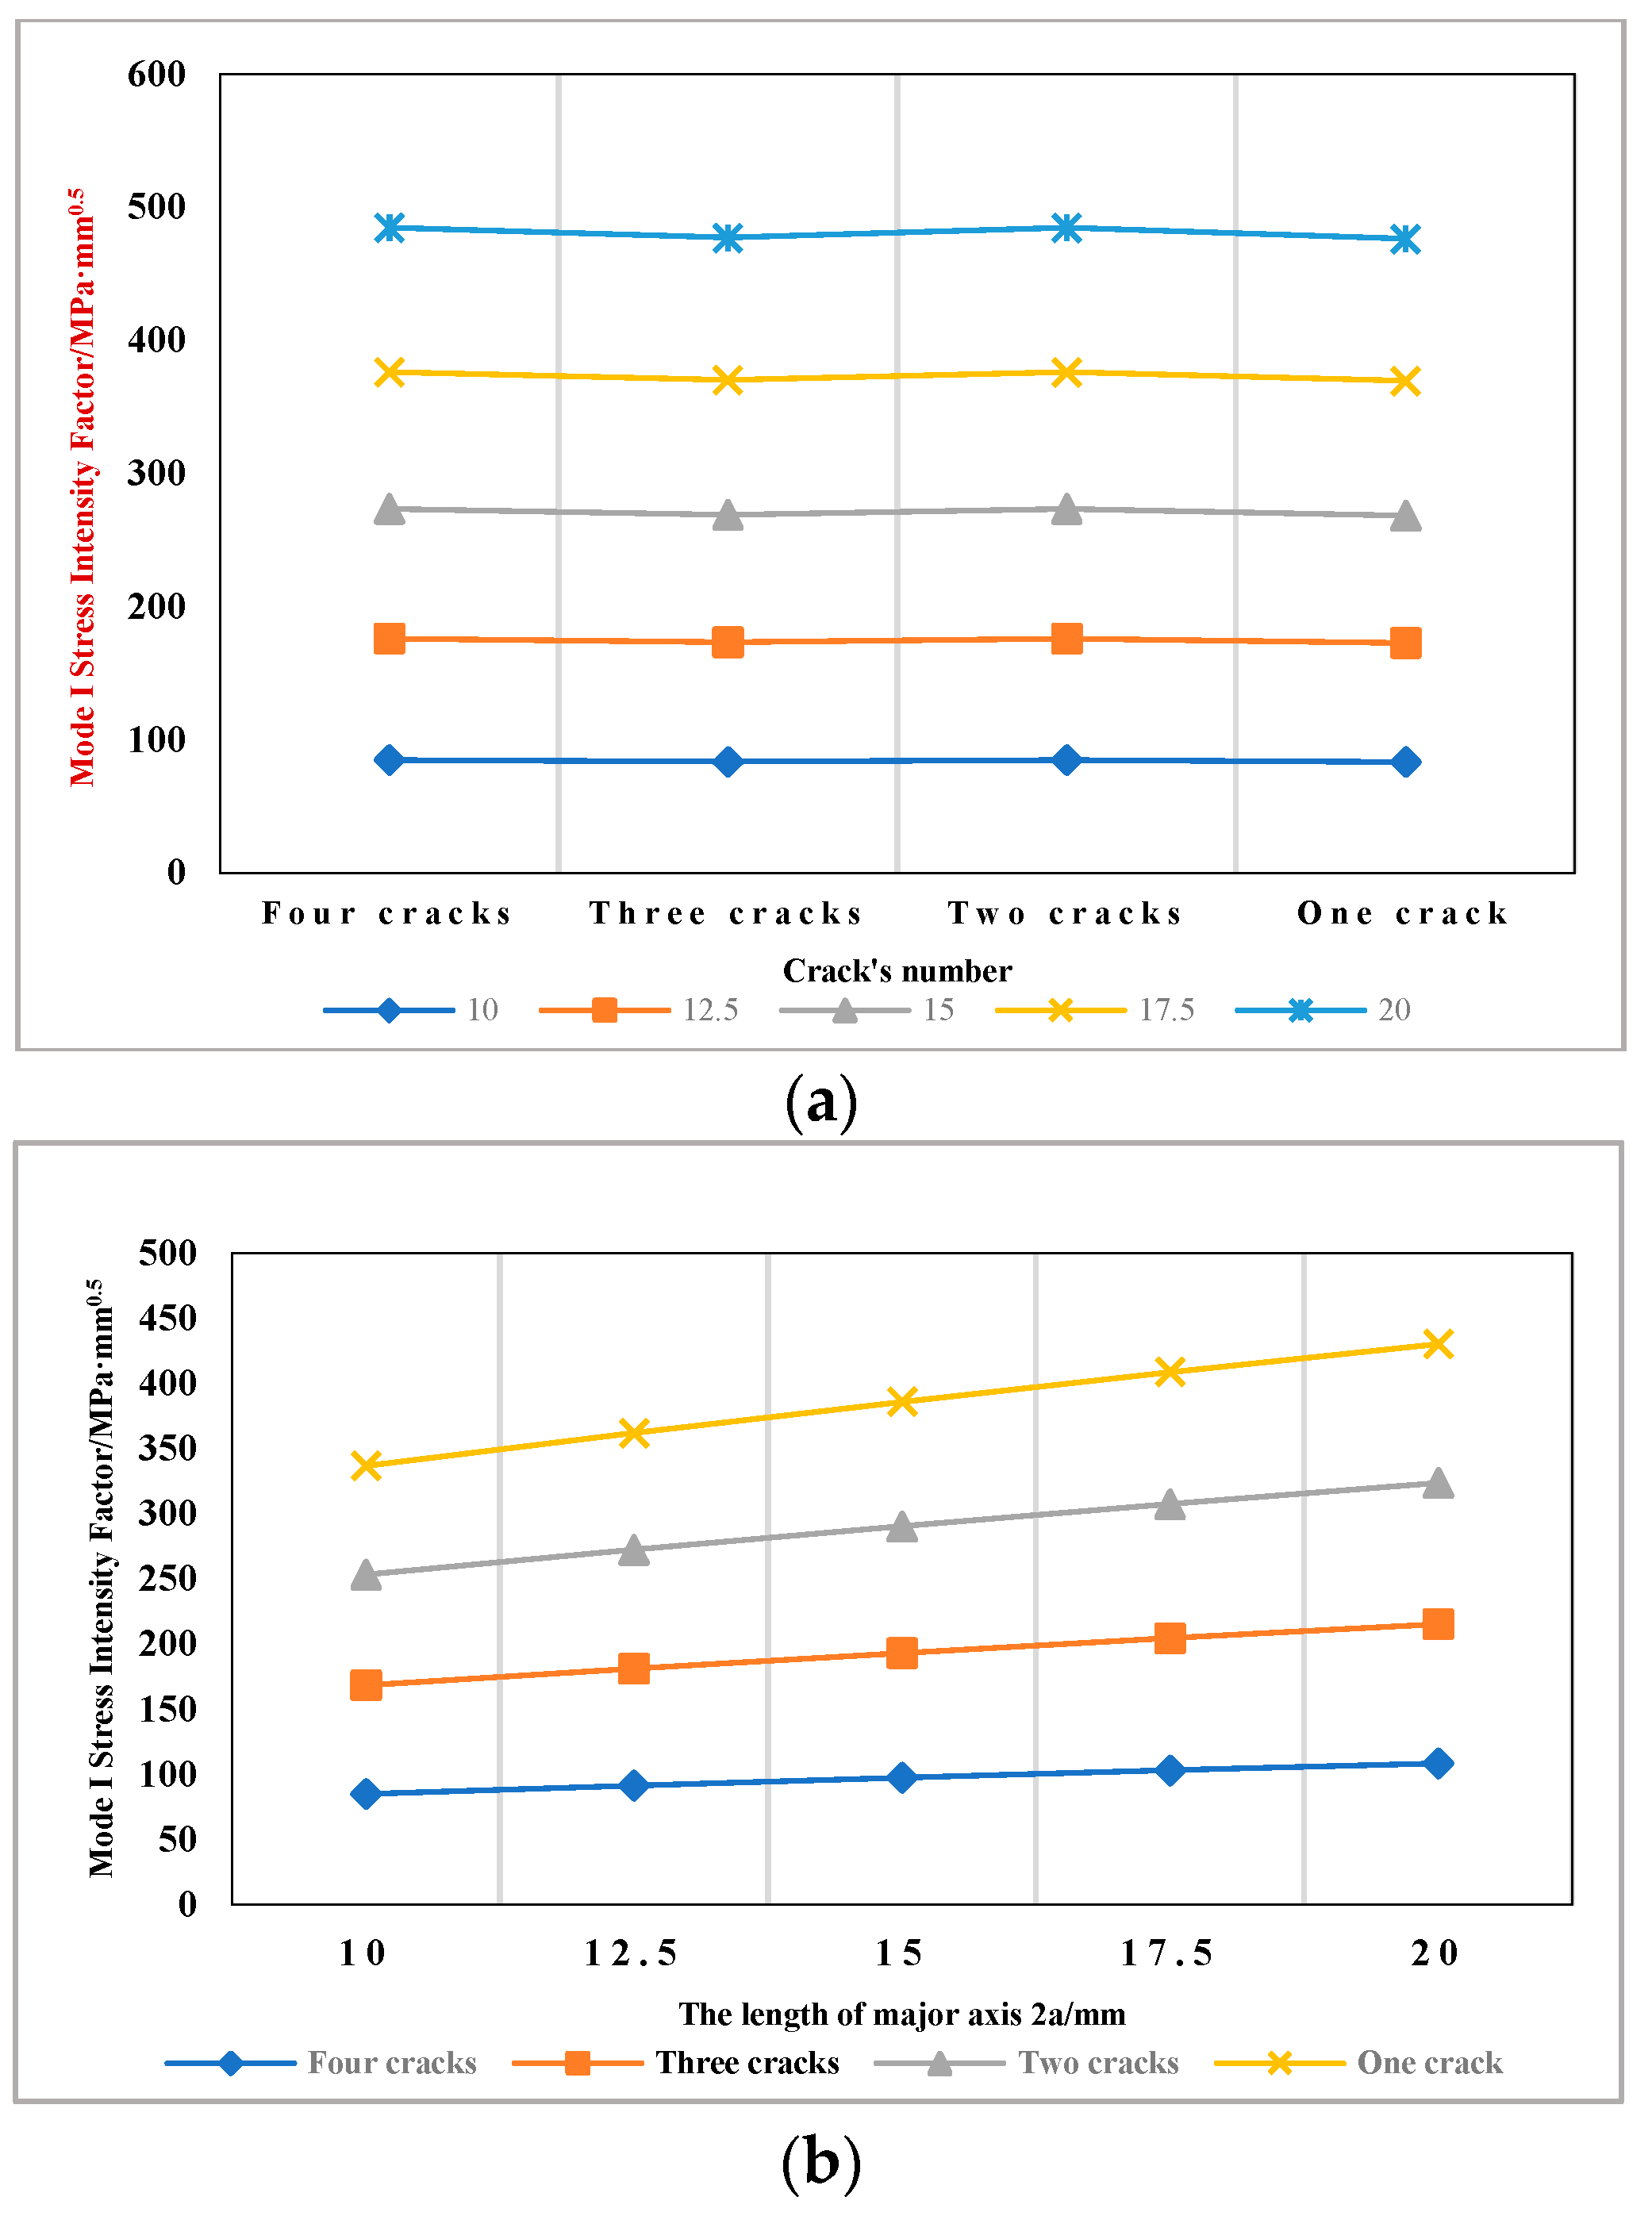
The length of the minor axis of the elliptical defect is taken as 2b = 10 mm, while the length of the major axis 2a is taken as 10 mm, 12.5 mm, 15 mm, 17.5 mm, and 20 mm, respectively. The length of all cracks is 2.5 mm; that is, c1-a = 2.5 mm, c2-a = 2.5 mm, d1-b = 2.5 mm. The Mode I stress intensity factor at the crack tip (c1, 0) under different numbers of cracks and different a/b ratios can be obtained by Formulas (35)–(42) (shown in Table 16).
Table 16 and Figure 13 illustrate the following:
(1)
The Mode I stress intensity factor at the crack tip (c1, 0) for the four-crack configuration in Figure 12a is nearly identical to that for the two-crack case in Figure 12c. The maximum difference between the three-crack and one-crack configurations is only 0.22 MPa·mm0.5 when the major axis length 2a is 10 mm. This indicates that adding a crack (d1-b) parallel to the tensile load has a negligible effect.
(2)
The maximum SIF difference at (c1, 0) reaches 1.60 MPa·mm0.5 (between four and three cracks) and 1.68 MPa·mm0.5 (between two and one crack) when 2a = 20 mm. Based on this, it is inferred that the addition of a crack (c2-a) perpendicular to the tensile load has a more significant effect on the Mode I stress intensity factor at the crack tip (c1, 0) than that of the crack (d1-b) parallel to the tensile load.
(3)
The SIF at (c1, 0) consistently increases with the length of the elliptical defect’s major axis. This indicates that greater ellipticity (a larger difference between the major and minor axes) elevates the crack-tip stress, thereby increasing the risk of fracture failure in the perforated casing under tension.

4.2.2. Crack Lengths

According to the previous analysis, it is known that there are different effects on the value of the Mode I stress intensity factor at the crack tip (c1, 0) between cracks perpendicular to the tensile load and cracks parallel to the tensile load. Therefore, the following needs to analyze the difference and the influence of the law of the mechanical properties of the perforated casing with the crack lengths changed in different orientations.
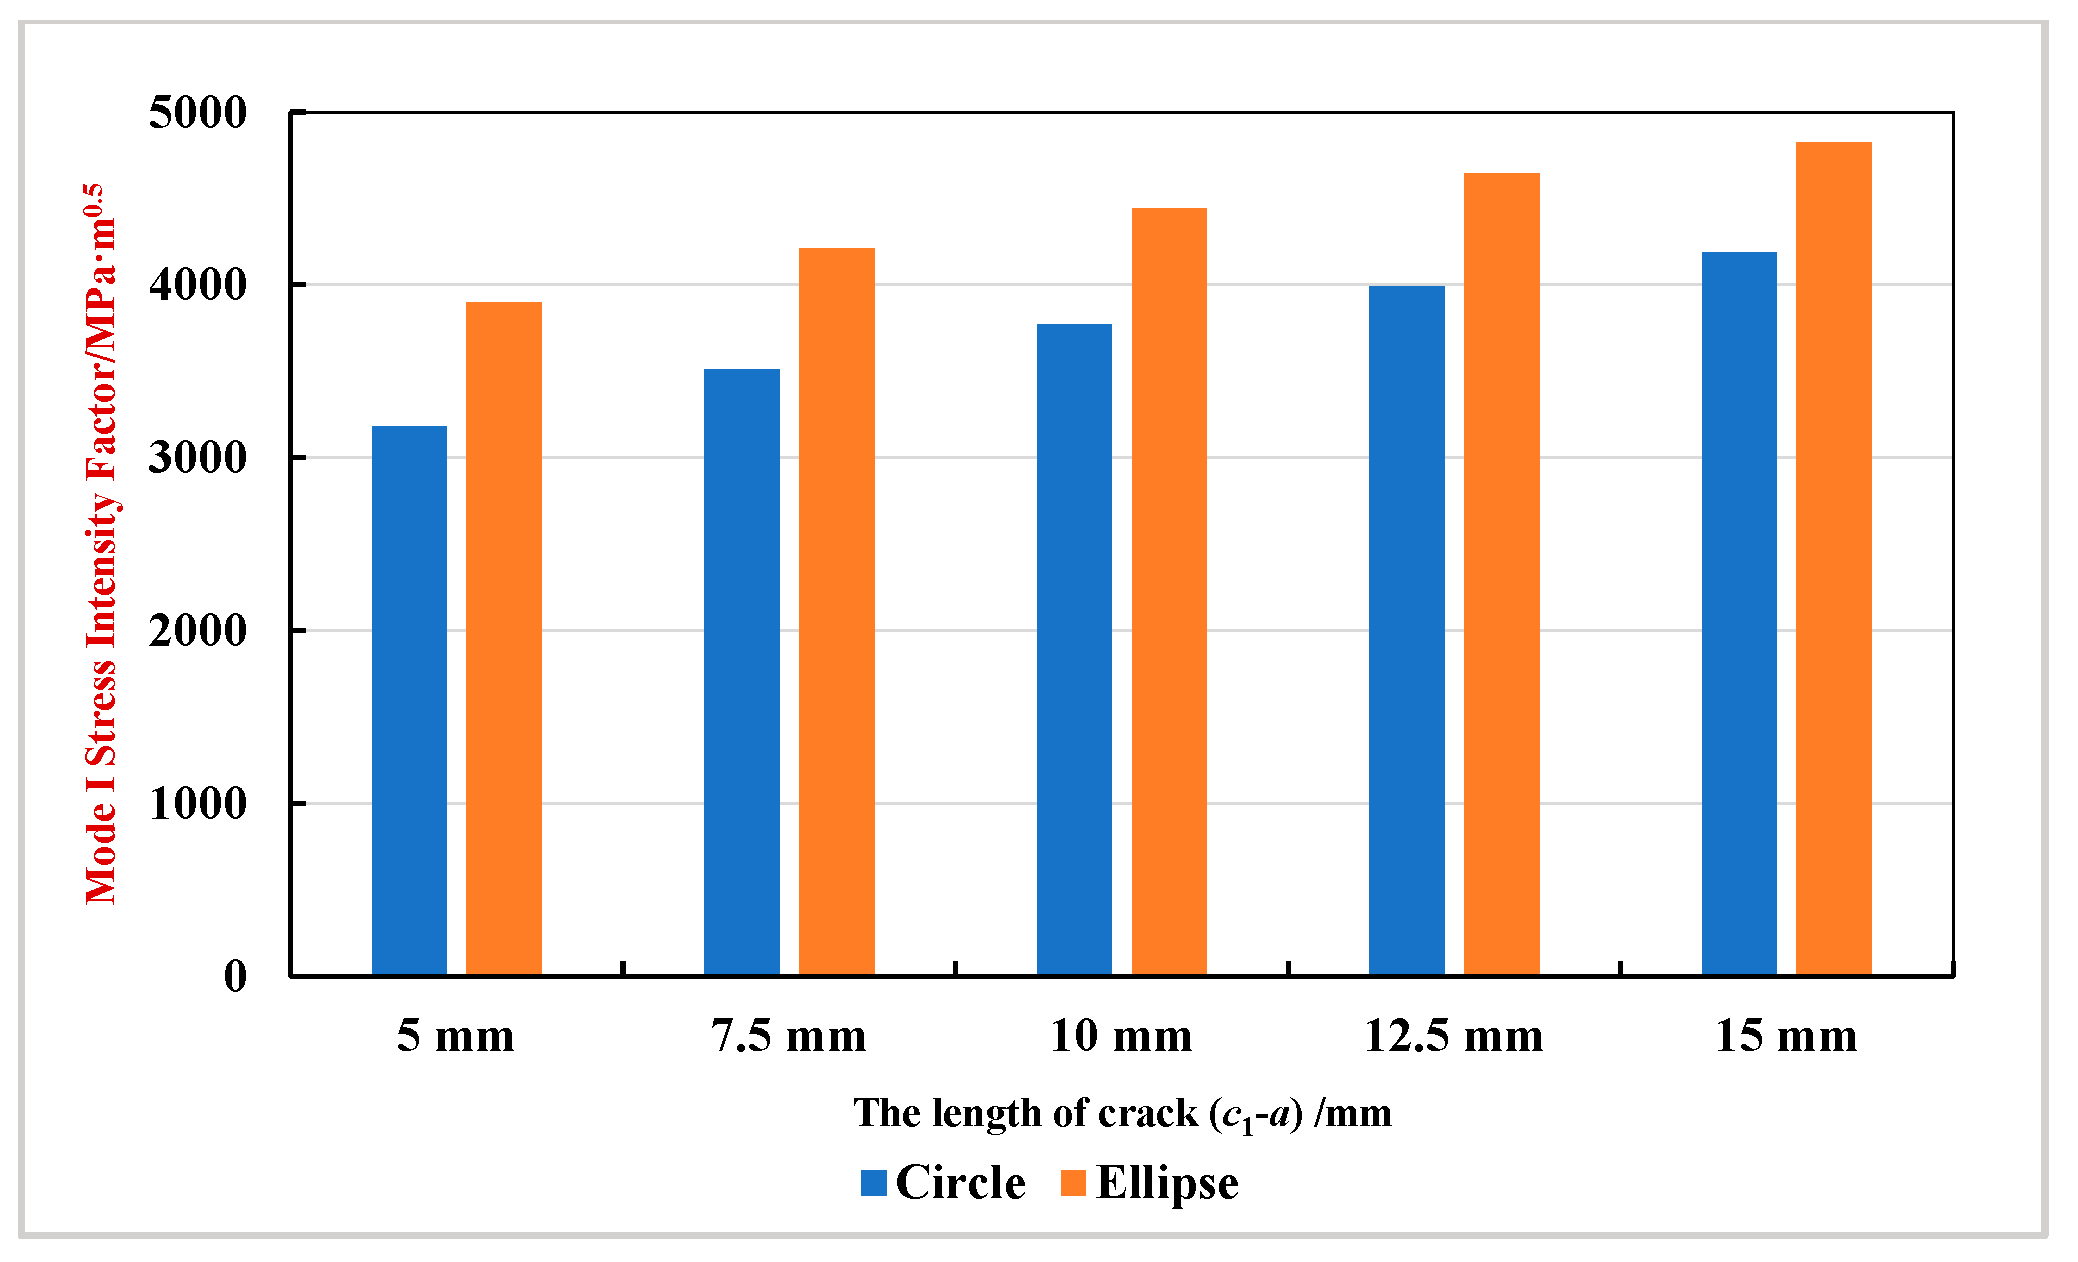
As shown in Figure 12d, there is a crack (c1-a) whose length has changed from 5 mm to 15 mm. Formulas (41) and (42) were used to calculate the Mode I stress intensity factor at the crack tip (c1, 0) when the defect shape is a circle (2a = 10 mm, 2b = 10 mm) and an ellipse (2a = 20 mm, 2b = 10 mm), respectively. The calculation results are shown in Table 17 and Figure 14.
As shown in Table 17 and Figure 14, the Mode I stress intensity factor increases with crack length (c1-a), indicating elevated stress and deformation at the crack tip (c1, 0) and a consequent reduction in casing safety. By comparing the calculation results of the Mode I stress intensity factor corresponding to circular and elliptical defects under different crack lengths, it is found that the values of the Mode I stress intensity factor at the crack tip (c1, 0) of the elliptical defect are always greater than those of the circular defect. This verifies the previous conclusion that the bigger the difference between the major and minor axes of the elliptical defect, the higher the Mode I stress intensity factor at the crack tip (c1, 0) is, and the fracture failure caused by crack propagation is more likely to occur in the perforated casing under the same tension.
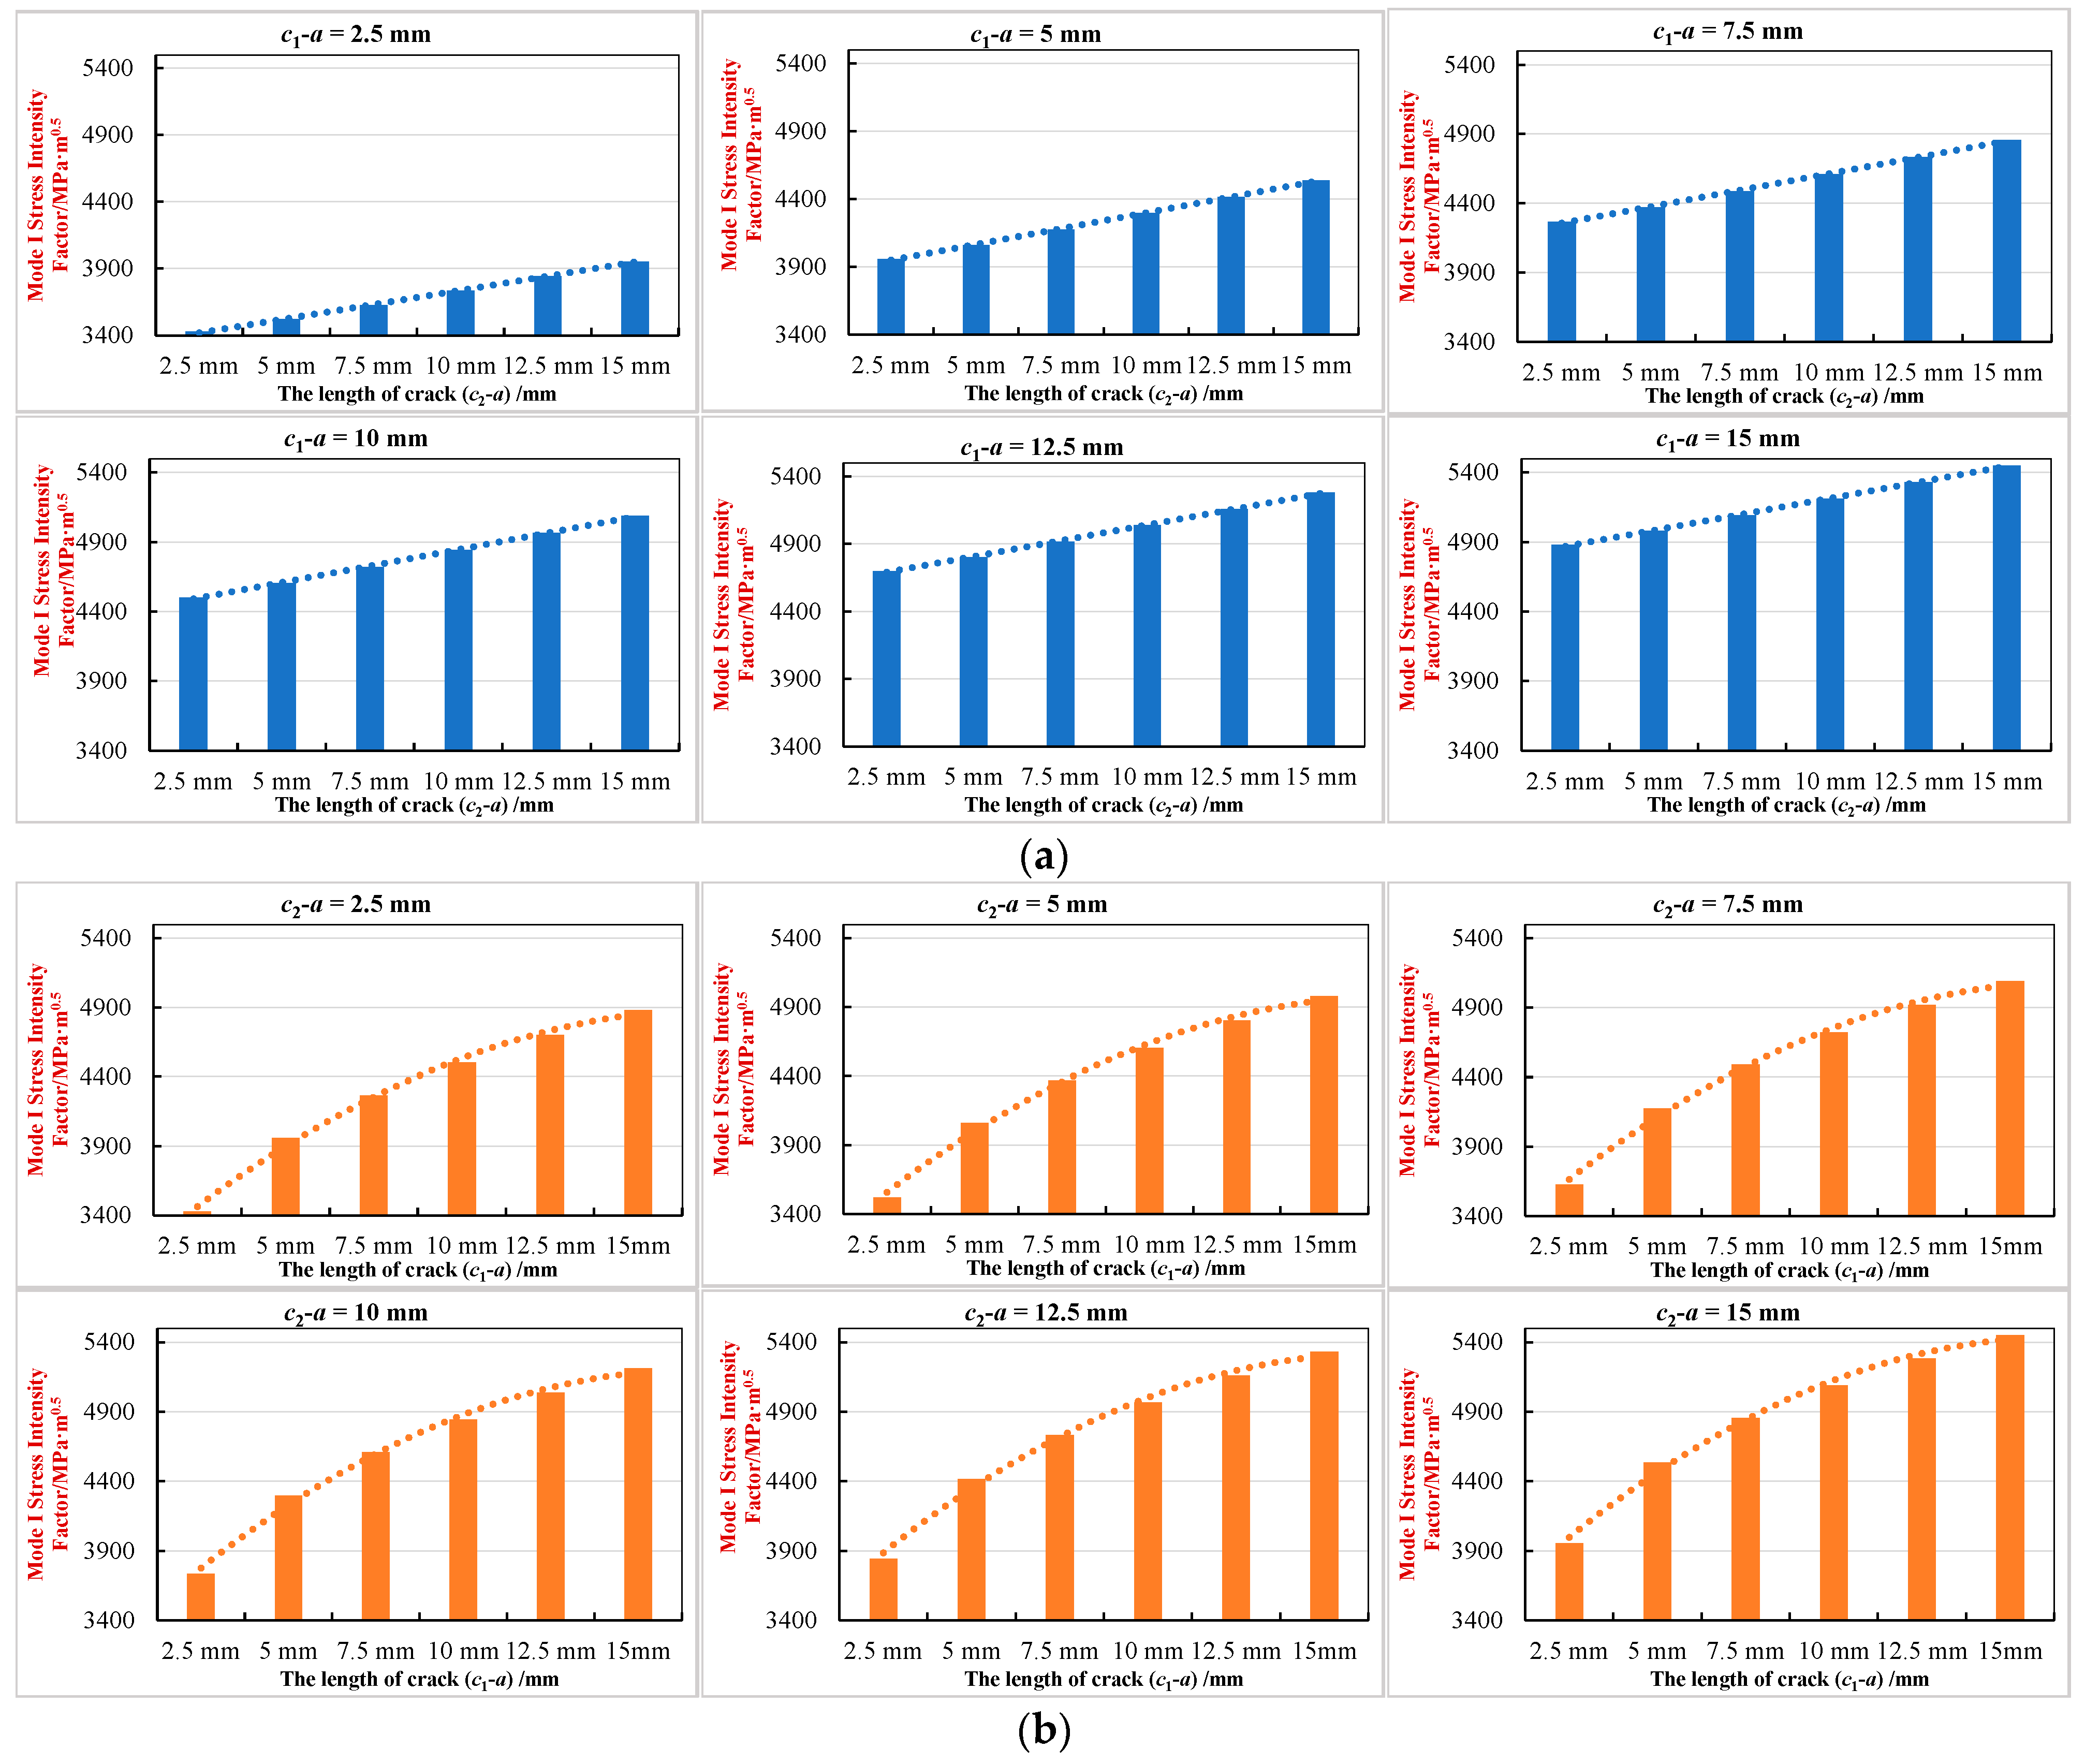
As shown in Figure 12c, there are two cracks (c1-a) and (c1-a) with the defect shape being an ellipse (2a = 20 mm, 2b = 10 mm). The lengths of the two cracks are 2.5 mm, 5 mm, 7.5 mm, 10 mm, 12.5 mm, and 15 mm, respectively, and they are combined in pairs. Then, using Formula (39) to calculate the Mode I stress intensity factor at the crack tip (c1, 0), the calculation results are shown in Table 18 and Figure 15.
The calculation results in Table 18 illustrate the following:
The Mode I stress intensity factor (SIF) at the crack tip (c1, 0) increases with the length of both cracks (c1-a) and (c2-a). However, the influence of crack (c1-a) is significantly greater; the SIF increase caused by lengthening (c1-a) is approximately three times that caused by lengthening (c2-a). This indicates that crack (c1-a) has a more pronounced negative impact on mechanical properties and casing safety.
The trend lines in Figure 15a show that the Mode I stress intensity factor changes with the length of the crack (c2-a) to be approximately linear when the crack (c1-a) is a constant value. The trends in Figure 15b show that when the crack (c2-a) is a constant value, the relationship between the value of the Mode I stress intensity factor and the length of the crack (c1-a) is approximately a quadratic parabola. This again proves that the crack (c1-a) has a greater influence on the Mode I stress intensity factor at the crack tip (c1, 0) than that of the crack (c2-a).
As shown in Figure 12b, there is one crack (c1-a) and two cracks (d1-b) with the same length. The defect shape is an ellipse (2a = 20 mm, 2b = 10 mm). Taking the length of the crack (c1-a) and cracks (d1-b) is 2.5 mm, 5 mm, 7.5 mm, 10 mm, 12.5 mm, and 15 mm, respectively, and combining them in pairs. Then, we used Formula (39) to calculate the Mode I stress intensity factor at the crack tip (c1, 0). The calculation results are shown in Table 19 and Figure 16.
The calculation results in Table 19 illustrate the following:
The Mode I stress intensity factor (SIF) at the crack tip (c1, 0) increases with the length of the crack (c1-a) and the two parallel cracks (d1-b). By comparing the increased value of the Mode I stress intensity factor caused by the length increase, it is found that the increased value corresponding to the crack (c1-a) is several times (the minimum is about 7.8 times, the maximum is about 52 times) that corresponding to the two cracks (d1-b). This conclusively shows that cracks parallel to the tensile load have a minimal effect on the SIF at this tip.
The trend lines in Figure 16a show that the SIF varies nearly linearly with the length of the (d1-b) cracks when the crack (c1-a) is a constant value, but with a very small slope, indicating a weak influence. The trends in Figure 16b show that when the crack (d1-b) is a constant value, the value of the Mode I stress intensity factor and the length of the crack (c1-a) still show a quadratic parabolic relationship.
Synthesizing the influence of all cracks, it is inferred that for the four-crack configuration in Figure 12a, the SIF maintains a quadratic parabolic relationship with (c1-a) length, a linear relationship with (c2-a) length, and a weak linear relationship with (d1-b) length. The order of influence is confirmed as: crack (c1-a) > crack (c2-a) > cracks (d1-b).

5. Conclusions

(1)
In this paper, there are four forms of critical loads: uniform external pressure, uniform external pressure + axial compression stress, uniform internal pressure, and uniform internal pressure + axial tension stress are applied to the casing in the perforation section, respectively. According to the case study of the equivalent stress between the circular perforation defects, it can be seen that the general combination of the shot density (12 holes/m to 48 holes/m) and phase angle (30° to 120°) in the spiral distribution scheme can meet the requirements of the casing safety performance in engineering standards, and the yield failure of the perforated casing pipe body will not occur because of the excessive interference between defects. This analysis, based on stress concentration and equivalent stress, provides the foundation for assessing collapse and yield failure risks. In addition, by comparing the perforation influence degree coefficients of all defects with different geometric shapes when they independently bear the critical limit load of internal pressure and external pressure, it is found that the maximum stress at the boundary of the hole caused by external pressure is always slightly higher than that caused by internal pressure. Therefore, compared with the internal yield failure, the casing in the perforation section is more prone to collapse failure. Meanwhile, it is also evident that the addition of axial compression/tension changes the trend of perforation’s influence on the mechanical properties of the casing and reduces the safety performance of the perforated casing section when the main load is external or internal pressure.
(2)
When the shape of the perforation defect is a circle, the maximum value of the perforation influence coefficient λ is the smallest compared with the other shapes such as an ellipse, a pentagon, and a hexagon (circle: λ ≈ 3, ellipse: λ ≈ 5.29, pentagon: λ ≈ 6.58, hexagon: λ ≈ 5.75). When λ > 1, the greater the value, the greater the difference in the equivalent stress before and after perforation; that is, under the same load, the equivalent stress after perforation is higher than that before perforation. The negative influence on the mechanical properties of the casing increases, which greatly reduces the safety performance of casing in the perforation section. Therefore, in the well completion and perforation operations, it is necessary to ensure that the shape of the perforation defects is approximately circular. At the same time, ellipses with a large difference between the major axis and minor axis and polygons with small angles should be avoided.
(3)
When the production casing is perforated according to the spiral distribution, the maximum value of the equivalent stress at the defect’s boundary is always located on the connecting line of the holes’ centers parallel to the casing axis. This value does not change with the perforation parameters (shot density and phase angle). However, this value is affected by the form and magnitude of the applied load and increases with the increase in the difference between the major and minor axes of the ellipse and the decrease in the polygon angle.
(4)
The combined findings from the stress concentration analysis (Section 2) and the fracture mechanics analysis (Section 3) offer a comprehensive framework for evaluating the safety performance of perforated casings. The stress concentration factor (λ) helps identify locations and conditions most susceptible to yielding or collapse initiation, while the Stress Intensity Factor (SIF) directly quantifies the risk of fracture failure due to crack propagation.
(5)
Generally speaking, choosing higher shot density (>24 holes/m) and larger phase angle (>60°) can reduce the negative influence on the mechanical properties and improve the safety performance of the casing in the perforation section. However, there is an optimal combination scheme between them. According to the calculation and analysis results in this paper, when perforation defects are approximately circular, the recommended values are 36 holes/m and 60°.
(6)
Under the same tensile load, compared with the number of cracks, the difference between the major and minor axes of the elliptical defect has a more significant effect on the Mode I stress intensity factor. The greater the difference value between the major axis and minor axis of the elliptical defect, the faster the Mode I stress intensity factor increases, which means that the stress and deformation at the crack tip increase with the difference value, and the casing in this perforation section is more prone to fracture failure caused by crack propagation.
(7)
For the cracks in different directions at the edge of the perforation defect, the effects of the crack’s length change on the Mode I stress intensity factor are different. Cracks parallel to the tensile stress direction have a small effect on the Mode I stress intensity factor, while cracks perpendicular to the tensile stress direction have a significant influence on it. It can be seen from the calculation example that the influence degree of the crack’s length on the crack tip side is about 3 times that of the crack’s length change on the symmetrical side.

6. Discussion

The purpose of calculating and analyzing the mechanical properties of the perforated casing is to evaluate the safety performance of casing with perforation defects in practical engineering applications. The reference factors for evaluating the safety performance of casing can be summarized as load, strength, and standard.
(1)
Although there are four types of loads considered in this study, including external pressure and internal pressure loads acting alone, as well as the combination of external pressure + axial compression, internal pressure + axial tension, the characteristics of all the loads are uniformly distributed. According to the analysis of Casero et al. [52], deep and high-pressure unconventional wells located in active tectonic regions with dominant SS (Strike-Slip Faulting) or TF/RF (Thrust-Fault/Reverse-Faulting) stress regimes can be prone to casing deformation resulting from natural-fracture/fault and/or bedding plane reactivation. The statistical data analysis of casing deformation by Han et al. [53] shows that the non-uniformity of geological load leads to a non-uniform external pressure on the casing. Compared with a uniformly distributed load, the casing is prone to collapse and damage in the non-uniformly distributed load area. An example of the extreme non-uniform load action is that in the geological fracture development area, stratum sliding causes a directional concentrated load, which leads to shear deformation of the casing. Li et al. [54] also believed that the shear deformation of the casing stems from the fracture sliding in the high-angle geology. Therefore, the follow-up research should focus on the non-uniformity of the casing equivalent stress in the perforation section under the non-uniform applied load.
(2)
This time, the research object of the casing strength is only the pipe body itself. The research goal of the perforated casing with different defects is to determine the quantitative influence of the perforation parameters. In most cases, there is a layer of cement ring between the casing string and the formation in the perforation section of the well. The non-uniform external pressure load caused by geological movement is transferred to the casing body through the cement ring. Chen et al. [55] mentioned that the strength improvement of the cement ring and the high cementing quality can prevent casing deformation. However, the lack of a cement ring and the low cementing quality will lead to stress concentration and casing deformation [56]. Therefore, more and more studies [57,58,59] claim that the influence of applied load on the casing can be reduced by adjusting the thickness, strength, and toughness of the cement ring. In order to make the theoretical analysis results have a higher reference value in actual engineering applications, the mechanical property analysis model should be established by taking the “casing-cement ring-formation” as a whole in the subsequent research.
(3)
The traditional casing design standard does not allow the pipe body to yield. The triaxial equivalent stress and casing safety performance involved in this research were calculated and judged by the beginning of pipe yield. When the applied load is lower than the critical yield load, the mechanical property analysis of the casing is based on the stress–strain relationship of linear elasticity. However, the casing has typical elastic–plastic mechanical properties because its material is metal. When the applied load exceeds the critical yield load, plastic deformation of the pipe body will occur. The high temperature and impact effect caused by the perforation will generate a plastic zone near the perforation defect. After multi-stage fracturing and repeated fracturing in an oil and gas well, the strain hardening or the strength softening effect of the material will occur in the perforated casing. All these actual engineering scenarios will result in a nonlinear stress–strain relationship of the pipe body, which makes the traditional calculation standard for mechanical properties and the evaluation methods of casing safety performance no longer applicable. Therefore, the follow-up research should refer to more mechanical knowledge and practical engineering cases, thereby broadening the theoretical calculation basis and field application scope of the casing design standard.

Author Contributions

All authors are as follows: Z.X.: Conceptualization, Methodology, Formal Analysis, Writing—Original Draft, Supervision. K.Y.: Validation, Data Curation, Visualization. L.S.: Investigation, Resources, Writing—Review and Editing. Y.L.: Formal Analysis, Project Administration. X.L.: Validation, Writing—Review and Editing. We confirm that the manuscript has been read and approved by all named authors and that there are no other persons who satisfied the criteria for authorship but are not listed. We further confirm that the order of authors listed in the manuscript has been approved by all of us. All authors have read and agreed to the published version of the manuscript.

Funding

This paper is supported by the National Natural Science Foundation of China (No. 51875579 and 51804330); This research was funded by National Natural Science Foundation of China (Grant No: 52271300, 52071337), National Key Research and Development Program of China (2022YFC2806501).

Data Availability Statement

All data generated or analyzed during this study are included in this published article.

Acknowledgments

We sincerely thank all our classmates in the research group for their constructive discussions, collaborative spirit, and technical assistance. Their insightful comments during group seminars and willingness to share knowledge greatly enriched this work. The supportive and stimulating research environment fostered by the group is deeply appreciated. Finally, the authors thank the anonymous reviewers and the editorial office for their valuable time.

Conflicts of Interest

The authors declare no conflict of interest.

References

  1. Xu, L.; Hu, P.; Li, Y.; Qiu, N.; Chen, G.; Liu, X. Improved Fatigue Reliability Analysis of Deepwater Risers Based on RSM and DBN. J. Mar. Sci. Eng. 2023, 11, 688. [Google Scholar] [CrossRef]
  2. Wei, R.; Deng, S.; Yan, X.; Peng, M.; Ke, K.; Wang, L.; Hu, Z.; Yang, K.; Huo, B.; Cao, L. A Review of Intelligent Methods for Environmental Risk Identification in Polar Drilling and Well Completion. Processes 2025, 13, 1873. [Google Scholar] [CrossRef]
  3. Peng, Y.; Fu, G.; Sun, B.; Sun, X.; Chen, J.; Estefen, S.F. Bending Deformation and Ultimate Moment Calculation of Screen Pipes in Offshore Sand Control Completion. J. Mar. Sci. Eng. 2023, 11, 754. [Google Scholar] [CrossRef]
  4. Li, J.Z. Oil Drilling and Production Machinery Introduction, 2nd ed.; China University of Petroleum Press: Qingdao, China, 2015. (In Chinese) [Google Scholar]
  5. Pogrebnyak, V.G.; Chudyk, I.I.; Pogrebnyak, A.V.; Perkun, I.V. High-efficiency Casing Perforation Oil and Gas Wells. SOCAR Proc. 2021, 2021, 112–120. [Google Scholar] [CrossRef]
  6. Roostaei, M.; Soroush, M.; Mohammadtabar, F.; Mohammadtabar, M.; Hosseini, S.A.; Mahmoudi, M.; Sadrzadeh, M.; Ghalambor, A.; Fattahpour, V. Design for Reliability: Experimental and Numerical Simulation of Cased and Perforated Completions with Standalone Screen. SPE Drill. Complet. 2021, 36, 680–706. [Google Scholar] [CrossRef]
  7. Byrom, T.G. Casing and Liners for Drilling and Completion: Design and Application, 2nd ed.; Gulf Professional Publishing: Waltham, MA, USA, 2015. [Google Scholar]
  8. Li, M.F.; Zhang, M.Y.; Huang, J.F.; Liang, J.W.; Dou, Y.H.; Jing, S.Y. Residual strength analysis of perforating casing with coplanar surface. Well Test. 2024, 33, 1–8. [Google Scholar] [CrossRef]
  9. Dong, Q.; Xu, G.; Hu, Y.; Peng, Z. Research on the Residual Strength of Cracked Plate Considering Fatigue Crack Propagation under Cyclic Load. J. Mar. Sci. Eng. 2023, 11, 706. [Google Scholar] [CrossRef]
  10. Saad-Eldeen, S.; Garbatov, Y. Experimental and Numerical Analysis of Structural Capacity of Perforated Stiffened Plates. J. Mar. Sci. Eng. 2023, 11, 842. [Google Scholar] [CrossRef]
  11. He, X.; Zhang, M.; Xu, T.; Lei, L.; Li, Y. Evaluation of Mechanical Properties of Different Casing Drilling Steels. Metals 2023, 13, 427. [Google Scholar] [CrossRef]
  12. Smith, M.B.; Pattillo, P.D. A finite element analysis of collapse of perforated casing. J. Press. Vessel Technol. 1983, 105, 234–240. [Google Scholar] [CrossRef]
  13. Li, W.; Yang, B.; Chen, S.T. Finite element analysis of perforated casing high stress area compressed volume coefficient. Adv. Pet. Explor. Dev. 2014, 8, 69–72. [Google Scholar] [CrossRef]
  14. Li, M.F.; Xu, F.; Dou, Y.H.; Zhang, W.J. Safety Analysis of Reperforated Casing under Fracturing Conditions. China Pet. Mach. 2018, 46, 92–99. (In Chinese) [Google Scholar]
  15. Zhao, X.F.; Guan, Z.C.; Zhang, H.; Liao, H.L.; Sun, B.J.; Zhou, Y.B. Mechanical response of perforated cement sheath through hydraulic fracturing. Fault-Block Oil Gas Field 2017, 24, 695–699. (In Chinese) [Google Scholar]
  16. Bi, G.; Han, F.; Wu, J.-M.; Yuan, P.-J.; Fu, S.-S.; Ma, Y. Dynamic simulation of double-cased perforation in deepwater high temperature and high-pressure oil and gas wells. Pet. Sci. 2024, 5, 3482–3495. [Google Scholar] [CrossRef]
  17. Ding, Z.P.; Luo, Y.Y.; Han, B.; Deng, C.F. Influence of perforating on casing collapsing strength and its test. Drill. Prod. Technol. 2016, 39, 15–18. (In Chinese) [Google Scholar]
  18. Cao, Y.P.; Li, M.F.; Dou, Y.H.; Yu, Y. Simulation analysis on the stress intensity coupling of perforation gun and casing under the action of detonation and shaped charge jet. Drill. Prod. Technol. 2016, 39, 15–18. (In Chinese) [Google Scholar] [CrossRef]
  19. Sun, J.; Zhang, L.; Fan, J.; Liu, Y.; Yang, Y.; Yang, Z.; Zhang, Z. Experimental study on deformation and cracking of casing with defects under non-uniform load. Exp. Tech. 2025, 28, 3209–3223. [Google Scholar] [CrossRef]
  20. Zong, Y.; Zhao, H.; Bu, J. Collapse testing of perforated tubing. ACTA Pet. Sin. 1988, 9, 84–97. (In Chinese) [Google Scholar] [CrossRef]
  21. Yu, Y.N. Analysis of elastic collapse of perforated casing. Mech. Eng. 2004, 26, 24–26. (In Chinese) [Google Scholar]
  22. Yu, Y.N.; Yang, X.J. Remaining collapse resistance analysis of perforated casing. J. Univ. Pet. China 2004, 28, 77–80+84. (In Chinese) [Google Scholar]
  23. Tang, B.; Lian, Z.H.; Liu, G.; Liu, Y.G.; Huang, S.Y.; Zhang, P.; Yang, J.X. Theoretical analysis of collapsing strength of the perforated casing. China Pet. Mach. 2004, 32, 11–13+19. (In Chinese) [Google Scholar]
  24. Mnzool, M.; Al-Mukhtar, A.; Majeed, A.J.; Arafat, A.; Gomaa, E. Simulation and performance characteristics of rock with borehole using Visual Finite Element Analysis. Min. Miner. Deposits 2024, 18, 33–41. [Google Scholar] [CrossRef]
  25. Liu, Z.P.; Wang, H.W.; Yan, X.Z. Analysis of casing strength after perforation using plastic-elasticity theory. Pet. Drill. Tech. 2007, 35, 31–35. (In Chinese) [Google Scholar]
  26. Xue, Y.; Wang, S.; Zhang, Q.; Ding, L.; Luo, W.; Yao, L.; Zhou, X.; Zhao, Y. A refined analytical model for stress concentration in perforated casings under complex loading conditions in deep oil and gas wells. Geoenergy Sci. Eng. 2025, 253, 214003. [Google Scholar] [CrossRef]
  27. Zhanghua, L.; Yuheng, T.; Qiang, Z.; Hao, Y.; Yisheng, M.; Weixing, Y. Strength analysis of perforated casing in ultra-deep horizontal shale wells during sublevel acidizing and hydraulic fracturing process. Adv. Mech. Eng. 2022, 14, 16878132221114592. [Google Scholar] [CrossRef]
  28. Tong, S.K.; Xu, X.H.; Feng, Q.; Ju, Q.L.; Lv, Z.G. Fracture mechanical analysis of completion perforating casing in high temperature and high pressure deep well. Oil Field Equip. 2013, 42, 31–37. (In Chinese) [Google Scholar]
  29. Xu, Z.Q.; Liang, Y.H.; Yan, Y.F.; Wang, B.B. Analysis of hole edge cracking behavior of perforating casing based on fracture mechanics. Press. Vessel Technol. 2020, 37, 50–56. (In Chinese) [Google Scholar]
  30. Majeed, A.J.; Alshara, A.K.; Al-Mukhtar, A.M.; Abood, F.A. Fracturing parameters in petroleum reservoirs and simulation. In Advances in Material Sciences and Engineering; Springer: Singapore, 2019; pp. 491–498. [Google Scholar]
  31. SY/T 6238.1-1996; Procedures of Full Scale Oil Tube and Collapse Test. Petroleum Industry Press: Beijing, China, 1996. (In Chinese)
  32. Li, Z.B. Perforation test of SEW oil casing under simulated well conditions. Welded Pipe Tube 2017, 40, 22–26. (In Chinese) [Google Scholar] [CrossRef]
  33. Jia, B.G.; Wang, W.; Huan, G.Q.; Zhang, J.B.; Wang, S.L.; Lyu, X. Experimental study on perforating test in model well of 140 grade steel casing for ultra-deep well. Oil Field Equip. 2015, 44, 38–43. (In Chinese) [Google Scholar]
  34. Fu, J.; Zhang, C.; Wu, C.; Tian, D.; Zou, W. Perforation test on casing under simulation well condition. Spec. Steel 2000, 21, 31–34. (In Chinese) [Google Scholar]
  35. Wu, C.H.; Lin, Q.; Fu, J.C.; Sun, K.M. Perforation test of TP65 oil casing under simulated well conditions. Steel Pipe 2001, 30, 7–10. (In Chinese) [Google Scholar]
  36. Dou, Y.H.; Cao, Y.P.; Li, M.F.; Zhang, Y.F. Experimental and theoretical study on the mechanical characteristics of perforated casings. Procedia Struct. Integr. 2019, 22, 33–42. [Google Scholar] [CrossRef]
  37. Jia, X.; Wang, S.; Ma, F.; Tang, K.; Chen, H.; Ma, X.; Pan, D. Influence of perforation shock-induced phase transformation on the collapsing strength of perforated casing. Acta Pet. Sin. 2017, 38, 348–355. (In Chinese) [Google Scholar]
  38. Godfrey, W.K.; Methven, N.E. Casing damage caused by jet perforating. In Proceedings of the Fall Meeting of the Society of Petroleum Engineers of AIME, Houston, TX, USA, 4–7 October 1970. [Google Scholar]
  39. Qiu, H.; Wen, M.; Cao, Y.F.; Hou, Z.; Ma, N.; Han, F.; Bi, G. Simulation test on the feasibility of double-layer casing perforation technology in deepwater high-temperature and high-pressure gas field. China Offshore Oil Gas 2023, 35, 124–133. [Google Scholar]
  40. King, G.E. The effect of high-density perforating on the mechanical crush resistance of casing. In Proceedings of the SPE Production Operations Symposium, Oklahoma City, OK, USA, 13–14 March 1989. [Google Scholar] [CrossRef]
  41. King, G.E. Casing crush resistance loss to high-density perforating: Casing tests. In Proceedings of the SPE Annual Technical Conference and Exhibition, New Orleans, LA, USA, 23–26 September 1990. [Google Scholar] [CrossRef]
  42. ISO/TR 10400; Petroleum and Natural Gas Industries—Formulae and Calculations for the Properties of Casing, Tubing, Drill Pipe, and Line Pipe Used as Casing or Tubing. International Organization for Standardization: Geneva, Switzerland, 2007.
  43. American Petroleum Institute. Bulletin of Performance Properties of Casing, Tubing, and Drill Pipe: API Bulletin 5C2; American Petroleum Institute: Washington, DC, USA, 1999. [Google Scholar]
  44. American Petroleum Institute. Bulletin on Formulas and Calculations for Casing, Tubing, Drill Pipe and Line Pipe Properties: API Bulletin 5C3; American Petroleum Institute: Washington, DC, USA, 1994. [Google Scholar]
  45. Kirsch, G. The theory of elasticity and the requirement of resistance of materials. Z. Vereneis Dtsch. Ingenieure 1898, 42, 797–807. (In German) [Google Scholar]
  46. Inglis, C.E. Stresses in a plate due to the presence of cracks and sharp comers. Trans. Inst. Nav. Archit. 1913, 55, 219–230. [Google Scholar]
  47. Kolosov, G.V. On an Application of Complex Function Theory to a Plane Problem of the Mathematical Theory of Elasticity; Mattisen: Yuriev, Russia, 1983. (In Russian) [Google Scholar]
  48. Mark, K.; Boris, S.; Igor, T. Handbook of Elasticity Solutions; Kluwer Academic Publishers: Dordrecht, The Netherland, 2003. [Google Scholar]
  49. Li, Z.X.; Yang, L.X. An analysis of the elastic plane problem of an elliptical hole with four edge cracks. J. Inn. Mong. Univ. (Nat. Sci. Ed.) 2013, 44, 133–140. (In Chinese) [Google Scholar]
  50. Guo, J.H.; Liu, G.T. Stress analysis of the problem about a circular hole with asymmetry collinear cracks. J. Inn. Mong. Norm. Univ. (Nat. Sci. Ed.) 2007, 36, 418–422. (In Chinese) [Google Scholar]
  51. Guo, H.M.; Liu, G.T.; Pi, J.D. Stress analysis of an ellipse hole with a straight edge crack by complex variable method. ACTA Mech. Solida Sin. 2007, 28, 308–312. (In Chinese) [Google Scholar] [CrossRef]
  52. Casero, A.; Rylance, M. The unconventional unconventionals: Tectonically influenced regions, stress states and casing failure. In Proceedings of the SPE Hydraulic Fracturing Technology Conference and Exhibition, The Woodlands, TX, USA, 4–6 February 2020. [Google Scholar]
  53. Han, L.H.; Yang, S.Y.; Wei, F.Q.; Ye, X.Q.; Wang, J.J. Casing deformation mechanism and controlling method for shale gas well under complex fracture environment. Pet. Tubul. Goods Instrum. 2020, 6, 16–23. (In Chinese) [Google Scholar] [CrossRef]
  54. Li, L.; Wang, G.; Lian, Z.; Zhang, L.; Mei, J.; He, Y. Deformation mechanism of horizontal shale gas well production casing and its engineering solution: A case study on the Huangjinba block of the Zhaotong national shale gas demonstration zone. Nat. Gas Ind. B 2018, 5, 261–269. [Google Scholar] [CrossRef]
  55. Chen, Z.; Shi, L.; Xiang, D. Mechanism of casing deformation in the Changning—Weiyuan national shale gas demonstration area and countermeasures. Nat. Gas Ind. B 2017, 4, 1–6. [Google Scholar] [CrossRef]
  56. Mai, Y.; Mo, L.; Fu, D.; Wang, X.; Fan, Y.; Nie, R. Effect of cementing quality on casing failure in horizontal section of shale gas well. China Pet. Mach. 2019, 47, 123–130. (In Chinese) [Google Scholar] [CrossRef]
  57. Li, Y.; Liu, S.Q.; Wang, Z.H. Effect of cement thickness and its mechanical parameters on cement stress. Oil Drill. Prod. Technol. 2010, 32, 37–41. (In Chinese) [Google Scholar] [CrossRef]
  58. Zeng, J.; Gao, D.L.; Wang, Y.B. Study on tensile failure mechanism of cement in volume fractured wellbore. Drill. Prod. Technol. 2019, 42, 1–4. (In Chinese) [Google Scholar]
  59. Musaed, N.; Alawad, J.; Khalid, A. Characterization of Oil Well Cement–Formation Sheath Bond Strength. Eng 2025, 6, 117. [Google Scholar] [CrossRef]
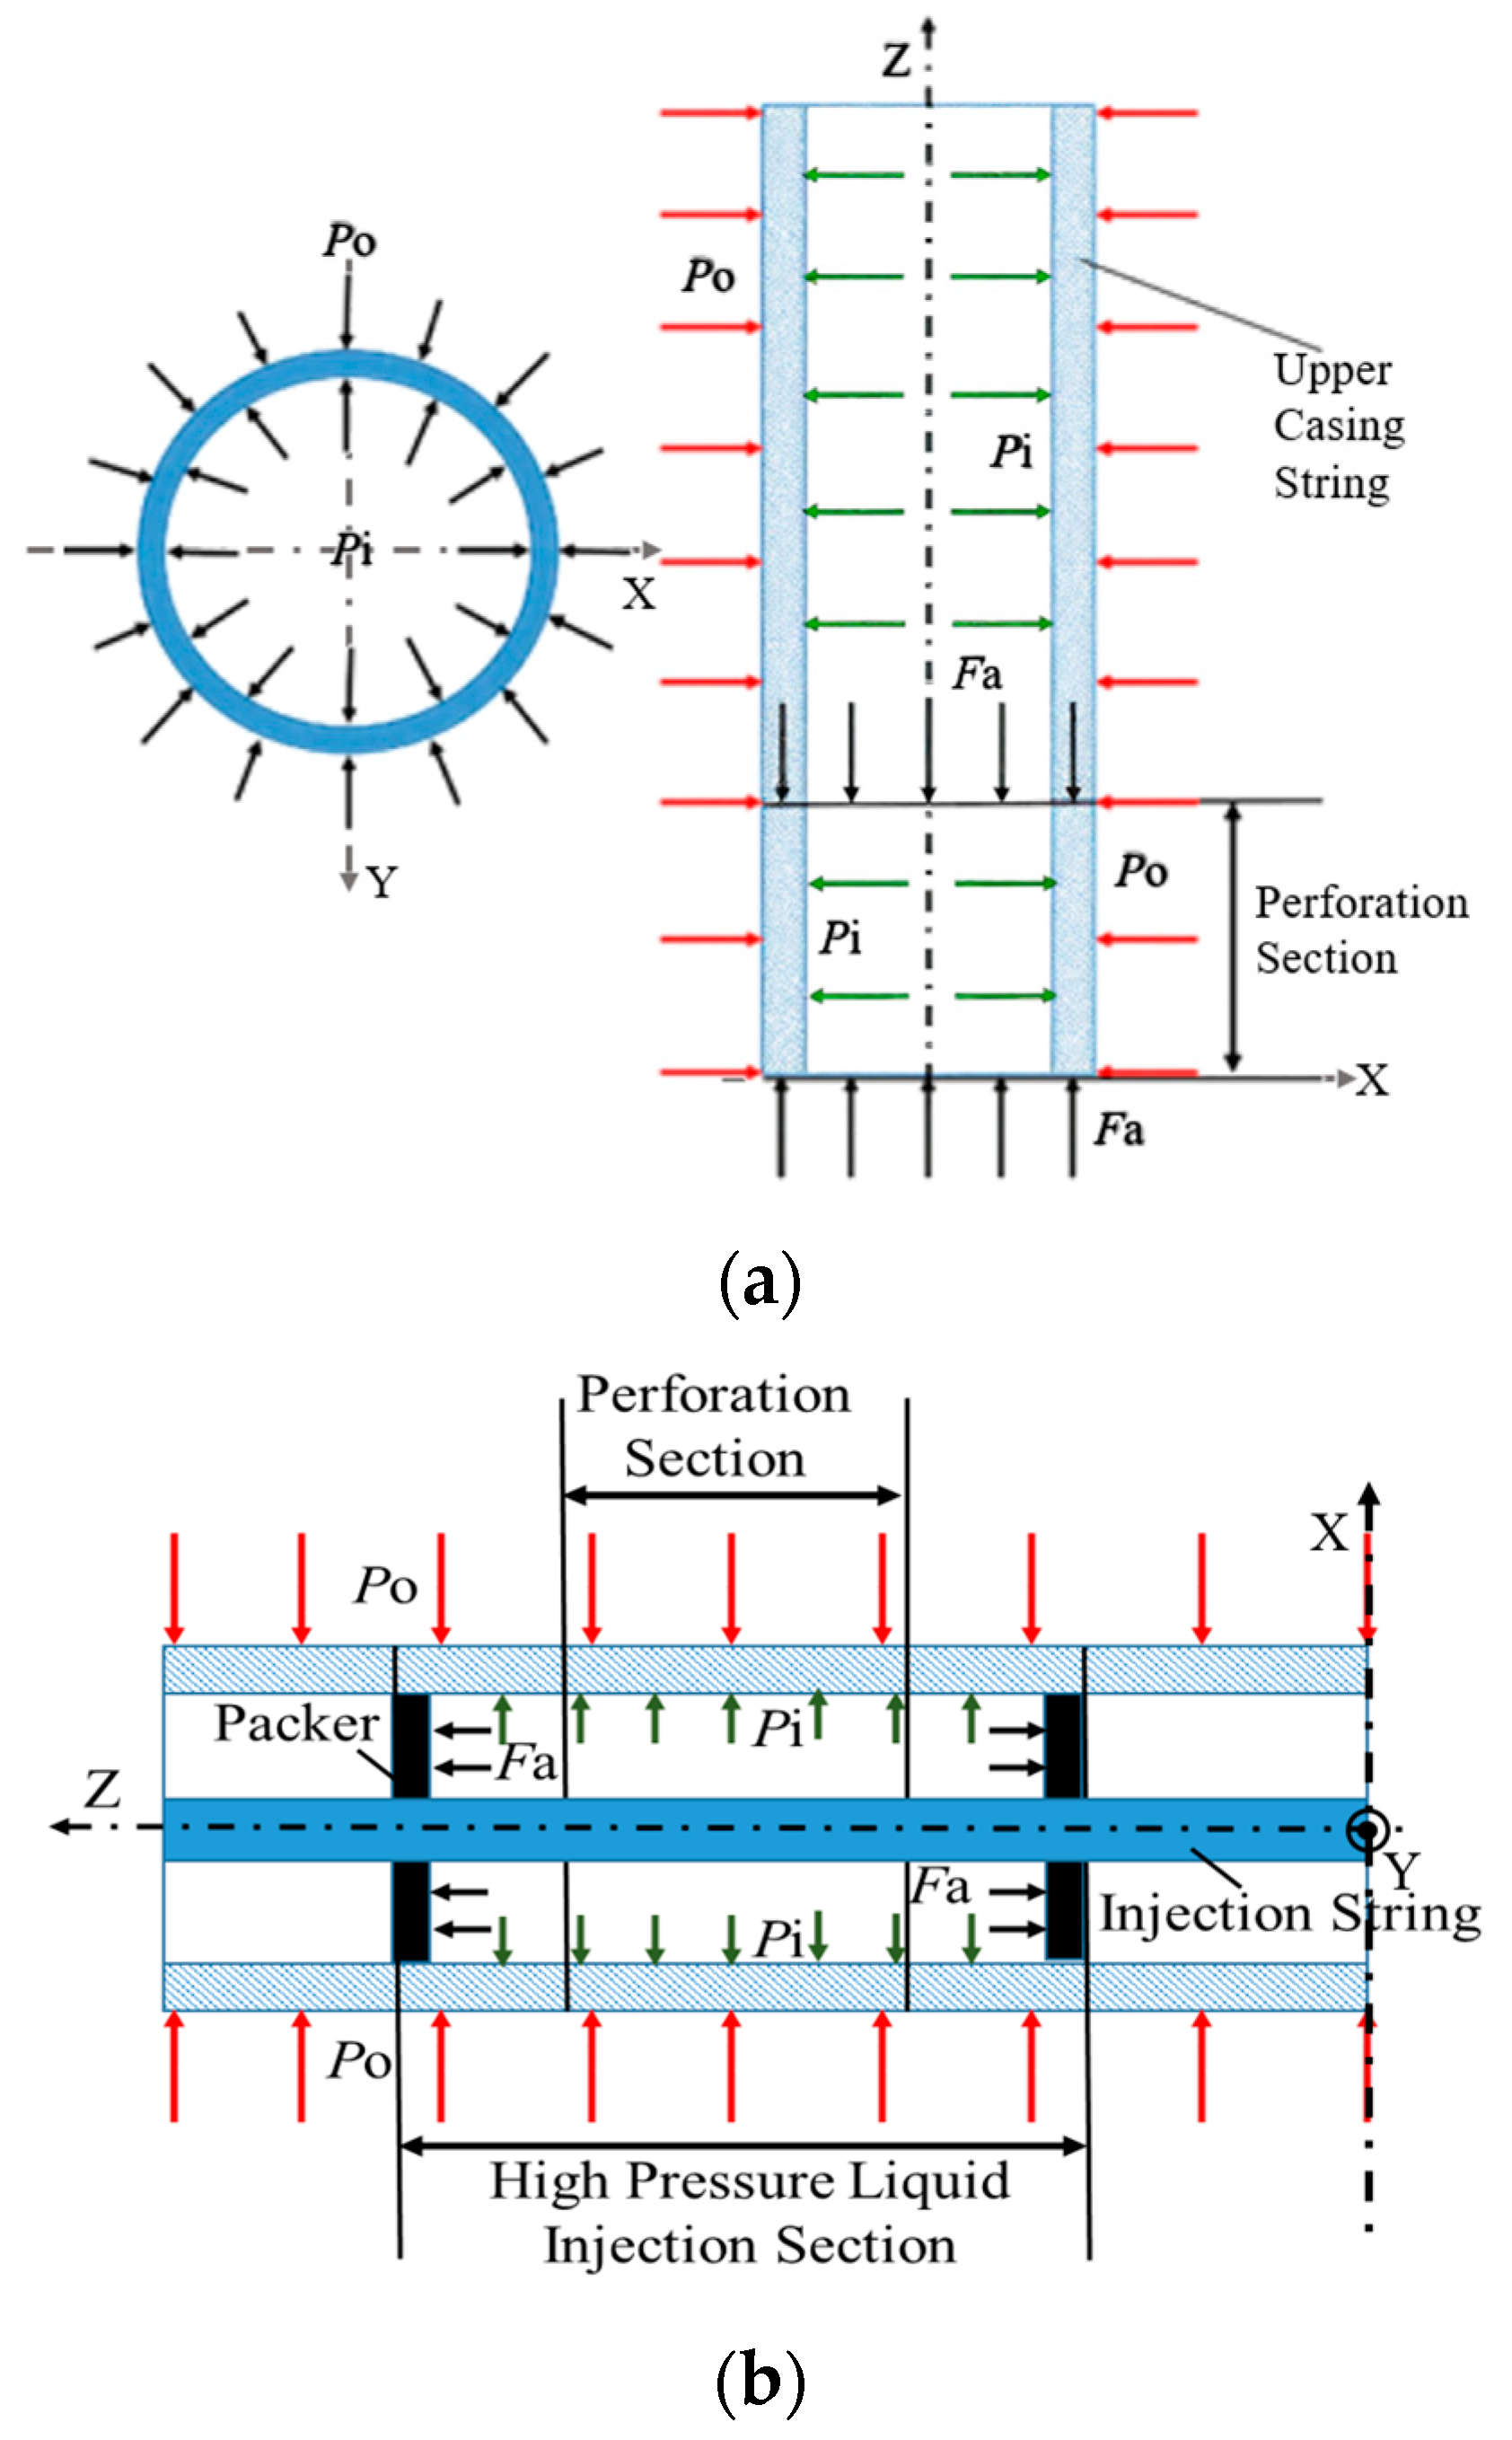
Figure 1. Schematic diagram of casing load distribution in perforated section under different oil well types: (a) vertical well; (b) horizontal well. (a) Load distribution in vertical well; (b) load distribution in horizontal well.
Jmse 13 01948 g001
Figure 2. Schematic diagram of pipe body stress.
Jmse 13 01948 g002
Figure 3. Schematic diagram of stress calculation model for circular hole plate.
Jmse 13 01948 g003
Figure 4. Schematic diagram of stress calculation model for elliptical hole plate.
Jmse 13 01948 g004
Figure 6. Defect distribution of spiral perforation. (a) Casing perforation distribution and planar hole geometry. (b) Geometric relationship calculation model for perforation defect location parameters.
Jmse 13 01948 g006
Figure 7. Schematic diagram of parameters changing with defect distribution position. (a) Distance between defects; (b) angles corresponding to the defect’s location.
Jmse 13 01948 g007
Figure 8. Calculation model of stress intensity factor under a different number of cracks: (a) four cracks; (b) three cracks; (c) two cracks; (d) one crack.
Jmse 13 01948 g008
Figure 5. Schematic diagram of polygonal hole: (a) pentagon hole (N = 5, m = 1/10); (b) hexagonal hole (N = 6, m = 1/15).
Jmse 13 01948 g005
Figure 9. Mechanical property calculation model of casing with circular defects.
Jmse 13 01948 g009
Figure 10. Comparison diagram of the influence degree coefficients at points near the circular defects under different loads: (a) uniform external pressure; (b) uniform internal pressure; (c) uniform external pressure + axial compression; (d) uniform internal pressure + axial tension; (e) comparison of points A, B, C; (f) comparison of points P12, P23, P13.
Jmse 13 01948 g010
Figure 11. Mechanical property calculation model of casing with elliptical defects.
Jmse 13 01948 g011
Figure 12. Comparison diagram of the influence degree coefficients at points near the elliptical defects under different loads: (a) uniform external pressure; (b) uniform internal pressure; (c) uniform external pressure + axial compression; (d) uniform internal pressure + axial tension.
Jmse 13 01948 g012
Figure 13. Trend chart of the Mode I stress intensity factor changing with crack numbers and defect shapes: (a) focus on the trend of the Mode I stress intensity factor changing with crack numbers; (b) focus on the trend of the Mode I stress intensity factor changing with defect shapes.
Jmse 13 01948 g013
Figure 14. Schematic diagram of the Mode I stress intensity factor of elliptical and circular defects changing with the length of a crack.
Jmse 13 01948 g014
Figure 15. Schematic diagram of the Mode I stress intensity factor of elliptical defect changing with the lengths of two cracks. (a) The changing trend of the mode I Stress Intensity Factor with the length of crack (c2-a) under different lengths of crack (c1-a). (b) The changing trend of the Mode I stress intensity factor with the length of crack (c1-a) under different lengths of crack (c2-a).
Jmse 13 01948 g015
Figure 16. Schematic diagram of the Mode I stress intensity factor of an elliptical defect changing with the lengths of three cracks. (a) The changing trend of the Mode I stress intensity factor with the length of crack (d1-b) under different lengths of crack (c1-a). (b) The changing trend of the Mode I stress intensity factor with the length of crack (c1-a) under different lengths of crack (d1-b).
Jmse 13 01948 g016
Table 1. Specified parameters of the selected casing.
Terms and DefinitionsSymbolsValues
GradeP110
Specified minimum yield strengthY758 MPa
Specified pipe outside diameterdo139.7 mm
Pipe inside diameterdi121.36 mm
Specified pipe wall thicknesst9.17 mm
Calculated mass per unit lengthM29.76 kg/m
Table 2. List of calculation results of casing stresses under different load forms.
Load FormsExternal Pressure po/MPaInternal Pressure pi/MPaAxial Stress
σa/MPa
LocationsRadial Stress
σr/MPa
Hoop Stress
σh/MPa
Equivalent Stress σe/MPaCritical Collapse Pressure/MPaYield Internal Pressure/MPa
Uniform external pressure76.5400Inner surface0−623.96623.9676.54-
Outer surface−76.54−547.42513.45
External + compression76.540−232.68Inner surface0−623.96546.1582.41-
Outer surface−76.54−547.42415.44
External + compression + internal76.5486.35−232.68Inner surface−86.35−6.38198.77157.42-
Outer surface−76.54−16.19193.51
Uniform internal pressure086.350Inner surface−86.35617.57664.96 86.35
Outer surface0531.23531.23
Internal + tension094.55174.51Inner surface−94.55676.26677.60-94.55
Outer surface−0581.71517.03
Internal + tension + external76.5486.35174.51Inner surface−86.35−6.38231.48--
Outer surface−76.54−16.19226.97
Table 3. Parameter combination and calculation result of the perforation defects distribution position.
Density/(holes/m)Phasing/
°
l12/
mm
l23/
mm
l13/
mm
β/
°
θ/
°
12301000917.2289.1869.1388.01
60500421.48104.8052.6781.32
90333.33267.55126.6141.1669.13
120250209.59151.9733.2552.67
2430500459.4352.4052.6786.03
45333.33295.5363.0341.1680.72
60250217.8175.9933.2573.04
90166.67157.19104.0323.6152.67
120125151.97133.7418.1533.25
3630333.33307.2042.2041.1684.06
60166.67152.7369.3523.6165.42
90111.11126.6199.2816.2541.16
12083.33138.70130.0912.3323.61
4830250231.3637.9933.2582.11
45166.67153.4252.0123.6171.90
60125122.0266.8718.1558.62
9083.33113.9897.5712.3333.25
12062.5133.74128.789.3118.15
Table 4. Calculating the parameters of points related to position (circular defects).
PointDistance/
mm
Angle/
°
PointDistance /
mm
Angle /
°
A590P12l12/290
B5180-θP23l23/2180-θ
C5βP13l13/2β
Table 5. Calculation Results of Stress at Points in Perforated Casing under Uniform External Pressure.
Density/(holes/m)Phasing/
°
Hoop Stress /MPaP12/MPaP23/MPaP13/MPa
ABCHoop StressRadial StressHoop StressRadial StressHoop StressRadial Stress
1230−1871.88−1868.89−1555.12−623.99−0.09−623.25−0.86−548.80−86.86
60−1871.88−1815.15−954.24−624.08−0.37−609.95−14.68−397.41−229.56
90−1871.88−1555.12−457.31−624.24−0.84−545.21−80.05−272.26−350.66
120−1871.88−954.24−126.49−624.46−1.50−395.26−229.45−188.96−432.85
2430−1871.88−1859.94−954.24−624.08−0.37−621.12−3.42−406.24−229.75
45−1871.88−1806.98−457.31−624.24−0.84−608.09−17.22−278.02−341.78
60−1871.88−1659.45−126.49−624.46−1.50−571.51−54.63−192.90−422.44
90−1871.88−954.24223.54−625.10−3.36−395.82−229.48−102.93−513.19
120−1871.88−126.49381.72−626.00−5.95−188.96−432.85−62.28−556.06
3630−1871.88−1845.18−457.31−624.24−0.84−617.62−7.64−287.44−327.16
60−1871.88−1439.88223.54−625.10−3.36−517.31−110.15−106.32−500.02
90−1871.88−457.31428.58−626.55−7.52−272.26−350.66−51.93−561.35
120−1871.88223.54510.16−628.65−13.28−101.71−517.84−30.26−586.99
4830−1871.88−1824.81−126.49−624.46−1.50−612.78−13.42−207.43−382.06
45−1871.88−1631.05223.54−625.10−3.36−565.09−63.15−110.77−481.86
60−1871.88−1195.00381.72−626.00−5.95−456.85−170.94−67.16−534.31
90−1871.88−126.49510.16−628.65−13.28−189.99−430.14−31.63−580.41
120−1871.88381.72558.65−632.56−23.35−62.28−556.06−18.18−598.65
Table 6. Calculation Results of Stress at Points in Perforated Casing under External Pressure + Compression Stress.
Density/(holes/m)Phasing/
°
Hoop Stress /MPaP12/MPaP23/MPaP13/MPa
ABCHoop StressRadial StressHoop StressRadial StressHoop StressRadial Stress
1230−1639.20−1637.32−1440.57−624.00−232.72−623.54−233.19−579.76−284.23
60−1639.20−1603.63−1063.76−624.13−232.82−615.31−241.75−484.01−374.51
90−1639.20−1440.57−752.13−624.35−233.00−574.90−282.56−404.86−451.13
120−1639.20−1063.76−544.68−624.65−233.25−481.07−376.04−352.18−503.11
2430−1639.20−1631.72−1063.76−624.13−232.82−622.29−234.72−495.91−368.28
45−1639.20−1598.50−752.13−624.35−233.00−614.28−243.21−412.83−441.20
60−1639.20−1505.99−544.68−624.65−233.25−591.56−266.45−357.68−493.56
90−1639.20−1063.76−325.18−625.51−233.95−481.83−375.64−299.38−552.35
120−1639.20−544.68−225.99−626.73−234.92−352.18−503.11−273.04−580.08
3630−1639.20−1622.46−752.13−624.35−233.00−620.23−237.22−425.99−424.78
60−1639.20−1368.29−325.18−625.51−233.95−558.08−300.76−304.19−541.40
90−1639.20−752.13−196.60−627.47−235.51−404.86−451.13−267.60−582.34
120−1639.20−325.18−145.44−630.25−237.66−297.67−556.21−253.03−599.40
4830−1639.20−1609.68−544.68−624.65−233.25−617.38−240.66−378.88−456.15
45−1639.20−1488.18−325.18−625.51−233.95−588.03−271.29−310.74−526.25
60−1639.20−1214.73−225.99−626.73−234.92−520.73−338.31−280.00−562.54
90−1639.20−544.68−145.44−630.25−237.66−353.61−500.63−254.96−594.21
120−1639.20−225.99−115.04−635.31−241.36−273.04−580.08−245.48−606.69
Table 7. Calculation Results of Stress at Points in Perforated Casing under Uniform Internal Pressure.
Density/(holes/m)Phasing/
°
Hoop Stress /MPaP12/MPaP23/MPaP13/MPa
ABCHoop StressRadial StressHoop StressRadial StressHoop StressRadial Stress
12301852.711849.751539.20617.600.09616.870.85543.1885.97
601852.711796.56944.47617.690.37603.7114.53393.34227.21
901852.711539.20452.62617.850.83539.6279.23269.47347.07
1201852.71944.47125.19618.071.48391.21227.10187.02428.42
24301852.711840.90944.47617.690.37614.763.39402.08227.40
451852.711788.47452.62617.850.83601.8617.05275.18338.28
601852.711642.46125.19618.071.48565.6654.07190.93418.11
901852.71944.47−221.25618.693.32391.76227.13101.88507.94
1201852.71125.19−377.81619.585.89187.02428.4261.64550.36
36301852.711826.29452.62617.850.83611.297.56284.50323.81
601852.711425.13−221.25618.693.32512.01109.02105.23494.90
901852.71452.62−424.19620.137.44269.47347.0751.40555.60
1201852.71−221.25−504.94622.2113.15100.67512.5429.95580.98
48301852.711806.12125.19618.071.48606.5013.29205.31378.15
451852.711614.35−221.25618.693.32559.3062.50109.63476.93
601852.711182.76−377.81619.585.89452.18169.1966.47528.84
901852.71125.19−504.94622.2113.15188.05425.7331.31574.47
1201852.71−377.81−552.92626.0823.1161.64550.3617.99592.52
Table 8. Calculation Results of Stress at Points in Perforated Casing under Internal Pressure + Tension Stress.
Density/(holes/m)Phasing/
°
Hoop Stress/MPaP12/MPaP23/MPaP13/MPa
ABCHoop StressRadial StressHoop StressRadial StressHoop StressRadial Stress
12301854.271851.861599.55676.30174.57675.70175.18618.02242.17
601854.271808.651116.36676.43174.74665.09186.21495.67357.52
901854.271599.55716.76676.64175.03613.17238.64394.53455.40
1201854.271116.36450.74676.94175.43492.75358.62327.21521.83
24301854.271844.671116.36676.43174.74674.06177.18507.54352.90
451854.271802.08716.76676.64175.03663.70188.16402.43444.99
601854.271683.45450.74676.94175.43634.45218.07332.65511.19
901854.271116.36169.26677.80176.58493.51358.34258.90585.58
1201854.27450.7442.06679.01178.18327.21521.83225.57620.68
36301854.271832.80716.76676.64175.03671.34180.47415.45427.80
601854.271506.88169.26677.80176.58591.24262.34263.63572.97
901854.27716.764.38679.75179.14394.53455.40218.04624.14
1201854.27169.26−61.22682.54182.68257.21590.02199.88645.50
48301854.271816.42450.74676.94175.43667.59184.98353.41469.65
451854.271660.61169.26677.80176.58629.66224.55270.03555.54
601854.271309.9642.06679.01178.18543.05310.80232.42600.27
901854.27450.74−61.22682.54182.68328.63519.06201.78639.41
1201854.2742.06−100.21687.64188.82225.57620.68190.18654.86
Table 9. Calculating the parameters of points related to position(elliptical defects).
PointAngle Between σ x and Major Axis/°Angle Between σ y and Major Axis/°
A900
Bθ−(90 − θ)
Cβ90 − β
Table 10. Calculation Results of Hoop Stress at Points in Perforated Casing under Uniform External Pressure (Unit: MPa).
Density/(holes/m)Phasing/
°
m ≈ 0.11 (2a = 12.5 mm)m ≈ 0.20 (2a = 15 mm)m ≈ 0.27 (2a = 17.5 mm)m ≈ 0.33 (2a = 20 mm)
ABCABCABCABC
1230−2183.9−2180.5−1827.5−2495.8617.1132.1−2807.8616.482.9−3119.8615.833.7
60−2183.9−2120.0−1151.5−2495.8−1677.9−1657.3−2807.8−1908.1−1885.4−3119.8−2138.3−2113.5
90−2183.9−1827.5−592.5−2495.8132.1−122.8−2807.882.9−197.5−3119.833.7−272.2
120−2183.9−1151.5−220.3−2495.8−1657.3−969.5−2807.8−1885.4−1128.8−3119.8−2113.5−1288.2
2430−2183.9−2170.4−1151.5−2495.8587.3−1657.3−2807.8583.7−1885.4−3119.8580.0−2113.5
45−2183.9−2110.8−592.5−2495.8−1228.7−122.8−2807.8−1414.0−197.5−3119.8−1599.2−272.2
60−2183.9−1944.9−220.3−2495.8580.4−969.5−2807.8576.0−1128.8−3119.8571.6−1288.2
90−2183.9−1151.5173.5−2495.8−1657.3−2124.0−2807.8−1885.4−2398.8−3119.8−2113.5−2673.6
120−2183.9−220.3351.4−2495.8−969.5−35.8−2807.8−1128.8−101.7−3119.8−1288.2−167.7
3630−2183.9−2153.8−592.5−2495.8500.8−122.8−2807.8488.5−197.5−3119.8476.2−272.2
60−2183.9−1697.9173.5−2495.8−2279.2−2124.0−2807.8−2569.6−2398.8−3119.8−2859.9−2673.6
90−2183.9−592.5404.2−2495.8−122.8−912.7−2807.8−197.5−1066.4−3119.8−272.2−1220.0
120−2183.9173.5495.9−2495.8−2124.0−1681.6−2807.8−2398.8−1912.1−3119.8−2673.6−2142.7
4830−2183.9−2130.9−220.3−2495.8286.0−969.5−2807.8252.2−1128.8−3119.8218.4−1288.2
45−2183.9−1912.9173.5−2495.8341.6−2124.0−2807.8313.4−2398.8−3119.8285.2−2673.6
60−2183.9−1422.4351.4−2495.8−2100.2−35.8−2807.8−2372.6−101.7−3119.8−2645.1−167.7
90−2183.9−220.3495.9−2495.8−969.5−1681.6−2807.8−1128.8−1912.1−3119.8−1288.2−2142.7
120−2183.9351.4550.5−2495.8−35.8−1506.6−2807.8−101.7−1719.7−3119.8−167.7−1932.8
Table 11. Calculation Results of Hoop Stress at Points in Perforated Casing under External Pressure + Compression Load (Unit: MPa).
Density/(holes/m)Phasing/
°
m ≈ 0.11 (2a = 12.5 mm)m ≈ 0.20 (2a = 15 mm)m ≈ 0.27 (2a = 17.5 mm)m ≈ 0.33 (2a = 20 mm)
ABCABCABCABC
1230−1951.2−1949.1−1727.7−2263.2847.3181.4−2575.1846.3113.9−2887.1845.446.3
60−1951.2−1911.2−1303.8−2263.2−2303.6−2275.3−2575.1−2619.6−2588.5−2887.1−2935.6−2901.7
90−1951.2−1727.7−953.2−2263.2181.4−168.6−2575.1113.9−271.2−2887.146.3−373.7
120−1951.2−1303.8−719.8−2263.2−2275.3−1331.0−2575.1−2588.5−1549.8−2887.1−2901.7−1768.6
2430−1951.2−1942.8−1303.8−2263.2806.3−2275.3−2575.1801.3−2588.5−2887.1796.3−2901.7
45−1951.2−1905.4−953.2−2263.2−1686.9−168.6−2575.1−1941.2−271.2−2887.1−2195.6−373.7
60−1951.2−1801.3−719.8−2263.2796.8−1331.0−2575.1790.8−1549.8−2887.1784.8−1768.6
90−1951.2−1303.8−472.9−2263.2−2275.3−2916.1−2575.1−2588.5−3293.4−2887.1−2901.7−3670.6
120−1951.2−719.8−361.3−2263.2−1331.0−49.1−2575.1−1549.8−139.7−2887.1−1768.6−230.2
3630−1951.2−1932.3−953.2−2263.2687.6−168.6−2575.1670.7−271.2−2887.1653.8−373.7
60−1951.2−1646.4−472.9−2263.2−3129.2−2916.1−2575.1−3527.8−3293.4−2887.1−3926.4−3670.6
90−1951.2−953.2−328.3−2263.2−168.6−1253.1−2575.1−271.2−1464.0−2887.1−373.7−1675.0
120−1951.2−472.9−270.7−2263.2−2916.1−2308.7−2575.1−3293.4−2625.2−2887.1−3670.6−2941.7
4830−1951.2−1918.0−719.8−2263.2392.7−1331.0−2575.1346.3−1549.8−2887.1299.9−1768.6
45−1951.2−1781.3−472.9−2263.2469.0−2916.1−2575.1430.3−3293.4−2887.1391.5−3670.6
60−1951.2−1473.7−361.3−2263.2−2883.4−49.1−2575.1−3257.4−139.7−2887.1−3631.4−230.2
90−1951.2−719.8−270.7−2263.2−1331.0−2308.7−2575.1−1549.8−2625.2−2887.1−1768.6−2941.7
120−1951.2−361.3−236.5−2263.2−49.1−2068.5−2575.1−139.7−2361.0−2887.1−230.2−2653.5
Table 12. Calculation Results of Hoop Stress at Points in Perforated Casing under Uniform Internal Pressure (Unit: MPa).
Density/(holes/m)Phasing/
°
m ≈ 0.11 (2a = 12.5 mm)m ≈ 0.20 (2a = 15 mm)m ≈ 0.27 (2a = 17.5 mm)m ≈ 0.33 (2a = 20 mm)
ABCABCABCABC
12302161.52158.21808.82470.3−610.8−130.82779.1−610.1−82.13087.9−609.5−33.4
602161.52098.31139.72470.31660.71640.32779.11888.51866.13087.92116.42091.9
902161.51808.8586.42470.3−130.8121.62779.1−82.1195.53087.9−33.4269.4
1202161.51139.7218.02470.31640.3959.62779.11866.11117.33087.92091.91275.0
24302161.52148.21139.72470.3−581.31640.32779.1−577.71866.13087.9−574.12091.9
452161.52089.2586.42470.31216.1121.62779.11399.5195.53087.91582.8269.4
602161.51925.0218.02470.3−574.4959.62779.1−570.11117.33087.9−565.81275.0
902161.51139.7−171.72470.31640.32102.32779.11866.12374.33087.92091.92646.2
1202161.5218.0−347.82470.3959.635.42779.11117.3100.73087.91275.0166.0
36302161.52131.8586.42470.3−495.7121.62779.1−483.5195.53087.9−471.3269.4
602161.51680.5−171.72470.32255.92102.32779.12543.32374.33087.92830.62646.2
902161.5586.4−400.02470.3121.6903.42779.1195.51055.43087.9269.41207.5
1202161.5−171.7−490.92470.32102.31664.42779.12374.31892.63087.92646.22120.8
48302161.52109.1218.02470.3−283.1959.62779.1−249.61117.33087.9−216.21275.0
452161.51893.3−171.72470.3−338.12102.32779.1−310.22374.33087.9−282.32646.2
602161.51407.8−347.82470.32078.735.42779.12348.3100.73087.92618.0166.0
902161.5218.0−490.92470.3959.61664.42779.11117.31892.63087.91275.02120.8
1202161.5−347.8−544.82470.335.41491.22779.1100.71702.13087.9166.01913.0
Table 13. Calculation Results of Hoop Stress at Points in Perforated Casing under Internal Pressure + Tension Load (Unit: MPa).
Density/(holes/m)Phasing/
°
m ≈ 0.11 (2a = 12.5 mm)m ≈ 0.20 (2a = 15 mm)m ≈ 0.27 (2a = 17.5 mm)m ≈ 0.33 (2a = 20 mm)
ABCABCABCABC
12302394.22389.61908.62703.0−380.7−81.53011.7−380.3−51.23320.5−379.8−20.8
602394.22307.2987.42703.01035.01022.33011.71177.01163.03320.51319.01303.7
902394.21908.6225.62703.0−81.575.83011.7−51.2121.83320.5−20.8167.9
1202394.2987.4−281.52703.01022.3598.03011.71163.0696.33320.51303.7794.6
24302394.22375.9987.42703.0−362.31022.33011.7−360.01163.03320.5−357.81303.7
452394.22294.7225.62703.0757.975.83011.7872.2121.83320.5986.5167.9
602394.22068.5−281.52703.0−358.0598.03011.7−355.3696.33320.5−352.6794.6
902394.2987.4−818.12703.01022.31310.23011.71163.01479.73320.51303.71649.2
1202394.2−281.5−1060.62703.0598.022.13011.7696.362.83320.5794.6103.4
36302394.22353.2225.62703.0−308.975.83011.7−301.3121.83320.5−293.7167.9
602394.21731.9−818.12703.01406.01310.23011.71585.01479.73320.51764.11649.2
902394.2225.6−1132.42703.075.8563.03011.7121.8657.83320.5167.9752.6
1202394.2−818.1−1257.52703.01310.21037.33011.71479.71179.53320.51649.21321.7
48302394.22322.0−281.52703.0−176.4598.03011.7−155.6696.33320.5−134.7794.6
452394.22025.0−818.12703.0−210.71310.23011.7−193.31479.73320.5−175.91649.2
602394.21356.5−1060.62703.01295.522.13011.71463.662.83320.51631.6103.4
902394.2−281.5−1257.52703.0598.01037.33011.7696.31179.53320.5794.61321.7
1202394.2−1060.6−1331.82703.022.1929.43011.762.81060.83320.5103.41192.2
Table 14. Calculation results of the maximum hoop stress and its influence degree coefficient at the polygonal defect’s boundary (number of sides N: 5, shape parameter: m = 1/10, unit: MPa).
Load FormLoad Magnitude
σα/MPa
Load Direction
α
Point APoint B
Hoop StressλHoop Stressλ
External pressure−623.9690−40036.41−9951.59
Internal pressure617.579039626.029851.55
External+
compression
−623.96
−232.68
90
0
−35966.58−8231.51
Internal+
tension
676.26
174.51
90
0
40806.099701.51
Table 15. Calculation results of the maximum hoop stress and its influence degree coefficient at the polygonal defect’s boundary (number of sides N: 6, shape parameter: m = 1/15, unit: MPa).
Load FormLoad Magnitude
σα/MPa
αPoint CαPoint D
Hoop StressλHoop Stressλ
External pressure−623.9690−35255.650−10711.72
Internal pressure617.579034885.31010601.66
External+
compression
−623.96
−232.68
90
0
−31415.750
90
−9731.78
Internal+
tension
676.26
174.51
90
0
35325.280
90
10871.68
Table 16. The Mode I stress intensity factor under different crack numbers and defect shapes (unit: MPa·mm0.5).
The Length of Major Axis 2a
/mm
1012.51517.520
Four cracks84.9291.2397.22102.92108.38
Three cracks83.4989.7395.67101.34106.78
Two cracks84.9291.2397.22102.92108.38
One crack83.2789.5795.54101.24106.70
Table 17. The values of Mode I stress intensity factor changing with one crack length (unit: MPa·m0.5).
The Length of Crack (c1-a) /mm57.51012.515
Circle3179.573511.313768.383989.494189.45
Ellipse3900.244207.264441.464641.384821.62
Table 18. The values of Mode I stress intensity factor changing with two crack lengths separately (unit: MPa·m0.5).
c1-a2.5 mm5 mm7.5 mm10 mm12.5 mm15 mm
c2-a
2.5 mm3427.293958.524266.474500.304699.354878.51
5 mm3520.704060.824370.524603.824801.434978.78
7.5 mm3625.604175.884487.714720.584916.735092.15
10 mm3734.384295.364609.584842.165036.945210.51
12.5 mm3844.004415.914732.714965.185158.715330.54
15 mm3953.064536.004855.525088.025280.455450.66
Table 19. The values of Mode I stress intensity factor changing with three crack lengths separately (unit: MPa·m0.5).
c1-a2.5 mm5 mm7.5 mm10 mm12.5 mm15 mm
d1-b
2.5 mm3376.623907.064217.634454.434656.184837.69
5 mm3382.413922.624241.684484.954691.414876.26
7.5 mm3388.993940.844270.634522.544735.594925.35
10 mm3395.103958.334299.284560.694781.404977.14
12.5 mm3400.323973.724325.224596.134824.905027.24
15 mm3404.623986.724347.714627.604864.345073.49
Disclaimer/Publisher’s Note: The statements, opinions and data contained in all publications are solely those of the individual author(s) and contributor(s) and not of MDPI and/or the editor(s). MDPI and/or the editor(s) disclaim responsibility for any injury to people or property resulting from any ideas, methods, instructions or products referred to in the content.