Article

A Low-Frequency Component Filtering Method for Heave Acceleration Signal of Marine Ship

1
School of Logistics Engineering, Shanghai Maritime University, Shanghai 201306, China
2
Institute of Logistics Science and Engineering, Shanghai Maritime University, Shanghai 201306, China
*
Author to whom correspondence should be addressed.
J. Mar. Sci. Eng. 2025, 13(10), 1919; https://doi.org/10.3390/jmse13101919
Submission received: 15 September 2025 / Revised: 29 September 2025 / Accepted: 3 October 2025 / Published: 6 October 2025

Abstract

The motion of ships in the ocean follows six degrees of freedom, and accurately measuring this motion is crucial for improving marine engineering operations. Among the six degree-of-freedom movement of ships, the change in ship heave freedom has the worst impact on offshore lifting operations. At present, the most common method for measuring heave displacement is by integrating heave acceleration twice. The heave motion of ships belongs to low-frequency motion, but the low-frequency band range is often easily overlooked. This paper first analyzes the wave spectrum to determine the dominant frequency range of ship heave motion under typical wind speeds, which is found to be between 0.22 Hz and 0.45 Hz. The accuracy of low-frequency ship heave displacement signals largely depends on the heave acceleration signal, and filtering acceleration signals in the low-frequency range is particularly difficult. To address this challenge, this paper proposes a low-frequency component filtering method for heave acceleration signal of marine ships, which effectively avoids the phase and peak-to-peak errors introduced by traditional filters. This method further improves the filtering performance of acceleration signals in the 0.2 Hz to 0.5 Hz low-frequency range and can provide the crane driver with a motion reference for the heave of the ship when the ship is performing lifting operations.

1. Introduction

During offshore lifting operations, ship heave motion can often lead to serious safety incidents. Therefore, accurately measuring ship heave displacement and compensating for heave motion can significantly reduce safety risks in offshore operations. Ship motion signals fall within the low-frequency range, and existing studies typically rely on absolute measurement methods to measure these signals. Absolute measurement determines ship displacement by performing double integration on the ship’s acceleration [1,2]. Consequently, the accuracy of low-frequency acceleration signal measurement directly affects the precision of ship heave displacement measurement.
In the field of signal measurement, the measurement of acceleration signals is often aimed at vibration measurement of mechanical equipment. Mechanical vibration acceleration signals are high-frequency signals, and piezoelectric sensors are usually used [3]. However, for the measurement of low-frequency acceleration signals, capacitive sensors are more suitable [4]. In the process of measuring low-frequency acceleration signals, the measurement accuracy of low-frequency acceleration signals often deteriorates due to the presence of sensor bias and high-frequency noise. In order to reduce the impact of high-frequency vibration signals of ships on capacitive acceleration sensors, low-pass or bandpass filters are used. However, the use of filters inherently changes the amplitude and phase characteristics of the signal [5]. Additionally, to ensure signal reliability, high sampling frequencies are often used, which demands advanced hardware and increases costs.
Accurate low-frequency filtering of ship acceleration signals is crucial, as it directly affects the precision of ship motion characterization and subsequent marine engineering applications. Liu F. established a method in 2021 that effectively reduces noise and drift-related errors by selectively filtering acceleration components, improving upon traditional filtering techniques [6]. Precise extraction and filtering of these low-frequency acceleration signals form the basis for accurate real-time sea state estimation, ship motion prediction, inertial navigation alignment, and active roll control through gyro stabilization [7,8,9]. These capabilities are essential for improving the safety and efficiency of marine operations [10].
Jakovlev S focuses on detecting impacts between shipping containers and vertical cell guides using ship acceleration signals, where precise filtering of these signals is essential to accurately capture and analyze collision events during handling operations [11]. Bossau J and Bekker A apply line detection techniques to time–frequency images of hull acceleration measurements, emphasizing the need for effective filtering methods to isolate and identify slamming impulses in complex ship motion data [12]. Many studies have focused on environment, vision, and advanced signal processing techniques to enhance ship motion estimation and control [13,14,15]. For example, extended Kalman filters combined with GNSS data have been used for path-following control by accurately estimating vessel speed and course [16], while deep learning methods such as LSTM networks with adaptive step sizes have been proposed for ship motion prediction and filtering [17]. Overall, advanced acceleration signal filtering and processing methods are vital tools for monitoring mechanical behaviors and detecting anomalies in marine environments, thereby supporting safe and reliable marine operations [18,19,20]. Many scholars have proposed excellent low-frequency signal measurement methods, but they are often based on high sampling frequency signals, and the low-frequency range exceeds the frequency of ship heave displacement.
In order to meet the low-frequency signal measurement of ship heave, we propose a low-frequency component filtering method for heave acceleration signal of marine ships. The method converts the analog signal of the capacitive acceleration sensor into a digital signal with a low sampling frequency by using a data acquisition module with a low sampling frequency. Then, Fast Fourier Transform is performed on the digital signal to intercept the amplitude–frequency function within the range of the interested low-frequency component. Next, the amplitude of the non-interested frequency component is reset to zero, and only the interested low-frequency component is inversely Fourier-transformed into the original time domain signal. Finally, a Kalman filter is used in the time domain to filter out the imaginary error in the inverse Fourier transform process, and an accurate low-frequency acceleration signal can be obtained. In order to ensure the accuracy and advantages of the proposed method, we verified it in the laboratory. The existing sinusoidal wave heave platform in the laboratory was used to simulate the low-frequency heave motion of the ship under different sea conditions. The capacitive sensor is used to collect the acceleration signal of the ship, and the low-cost data acquisition module is used to collect the acceleration analog signal into a low sampling frequency digital signal. And the proposed method, a low-frequency component filtering method for heave acceleration signal of marine ships, is used to obtain a high-precision, low-frequency acceleration signal of the ship. At the same time, we also compared the proposed method with traditional low-pass filters, such as Butterworth filter, Chebyshev filter, Basel filter, etc., to verify the accuracy and advantages of the proposed method.
Two major advantages of the proposed method:
  • Compared with the expensive high sampling frequency data acquisition card, the proposed method uses a low sampling frequency data acquisition module. This allows the filtered acceleration signal to achieve similar signal accuracy as the high sampling frequency system at a lower sampling frequency. This hardware change not only reduces hardware costs but also reduces the burden of data storage and transmission, thereby improving the efficiency of data collection and making it more suitable for real-time monitoring systems of ship status.
  • Compared with the traditional filtering method, the proposed method uses digital filtering, which can flexibly adjust the ship heave acceleration under different sea conditions. Secondly, combined with Fast Fourier Transform, the noise component is effectively identified and suppressed, and the phase effect brought by the traditional filter is completely eliminated. Finally, the Kalman time domain filter is used to further suppress the imaginary error brought by the inverse Fourier transform and ensure the amplitude accuracy of the peak-to-peak value.
The subsequent contents of this manuscript are as follows: Section 2 introduces the filtering principles of several traditional filters for low-frequency signals. Section 3 describes in detail a low-frequency component filtering method for heave acceleration signal of marine ships. Section 4 designs experimental verification of the proposed method. Section 5 presents conclusions and provides suggestions for future work.

2. Preliminary Work

According to the sampling theorem, the sampling frequency must be at least twice the signal bandwidth, that is, f s 2 · f m a x . If the sampling frequency of the signal is lower than the Nyquist frequency ( 2 · f m a x ), aliasing will occur, resulting in signal reconstruction failure. In practical applications, a sampling value higher than the minimum sampling frequency is usually selected to ensure the accuracy and stability of signal processing. Currently, the data acquisition cards on the market basically meet the sampling requirements. Generally, in ship status monitoring, the acceleration signal of the ship is collected by using an inertial measurement unit and a data acquisition card [21]. The inertial measurement unit is more accurate in measuring high-frequency signals, but has poor sensitivity to low-frequency signals, and the output signal may be unstable under static or low-frequency conditions. The data acquisition card is expensive and requires a stable PCIe slot and must be attached to a computer to work. This monitoring system often requires an industrial control cabinet for the ship, making the small working space more crowded.

2.1. Low-Frequency Component Range of Ship Heave Acceleration

During navigation, the ship vibration acceleration signal has two main components. One component is the high-frequency noise component generated by factors such as the vibration of the ship engine and the inherent vibration of the ship machinery [22]; the other component is the low-frequency vertical acceleration component of the ship rising and falling with the waves. In order to further study the low-frequency component acceleration signal of the ship, the P–M spectrum proposed by Pierson and Moskowitz in 1964 [23] is considered. Under common wind speed conditions [5 m/s–20 m/s], the main frequency range of the wave spectrum is approximately [0.22 Hz–0.45 Hz], as shown in Figure 1. The P–M spectrum formula is as follows:
s 2 π f = α g 2 2 π f 5 exp β f 0 f 4         f 0
where
s 2 π f : Wave energy density at frequency.
α : Dimensionless constant, typically 8.1 × 10⁻³.
g : Gravitational acceleration, approximately 9.81 m/s2.
f : Angular frequency, in rad/s.
β : Dimensionless constant, typically 0.74.
f 0 : Peak angular frequency of the spectrum, related to wind speed:
f 0 = g 2 π ( U g ) 1 2
U : the wind speed at 19.5 m above the sea surface.
Taking into account factors such as climate, wind speed, and ship weight, we decided to select a wider frequency band as the main frequency component of ship heave for analysis. Therefore, this paper mainly studies how to better filter out the low-frequency components of ship heave acceleration within [0.2–0.5 Hz], which covers almost all sea conditions for sailing.

2.2. Low-Frequency Component Filters

In the existing methods, the common method to filter the low-frequency components in the signal is to design a filter for filtering. According to the interested low-frequency components, [0.2–0.5 Hz], the frequency characteristics and cutoff frequency of the filter will directly determine the filtering results of the frequency band of interest. Therefore, it is very important to select a suitable filter and determine its parameters. The Butterworth Filter has a smooth frequency response characteristic and can provide a good amplitude response. It is suitable for occasions that require smooth output:
H s = 1 1 + s ω c 2 n
Among them, s represents the Laplace transform, ω c is the cutoff frequency, and n is the filter order.
The Elliptic Filter has relatively small fluctuations in both the passband and stopband and can achieve faster attenuation while maintaining passband flatness. It is suitable for applications with high performance requirements:
H s = 1 1 + ε 2 R n 2 s ω c
Among them, s represents the Laplace transform,   ω c is the cutoff frequency, n is the filter order, ε is the amplitude of the passband fluctuation, and R n is a function related to the Chebyshev polynomial.
The Bessel Filter is known for its excellent phase characteristics. It can maintain the signal waveform in the passband and is very suitable for applications with high requirements for time domain response:
H s = 1 1 + k = 1 n b k s k
Among them, s represents the Laplace transform, n is the filter order, and b k is the Bessel polynomial coefficient.
The Chebyshev Type I Filter has large fluctuations in the passband, but has a faster attenuation characteristic in the transition band, which is suitable for applications that do not require high passband flatness:
H s = 1 1 + ε 2 T n 2 s ω c
Among them, s represents the Laplace transform, ω c is the cutoff frequency, n is the filter order, and ε is the amplitude of the passband fluctuation.
The Chebyshev Type II Filter has no fluctuations in the passband compared with Chebyshev Type I, but has fast attenuation in the stopband, which is suitable for occasions where specific frequencies need to be suppressed:
H s = 1 1 + ε 2 T n 2 ω c s
Among them, s represents the Laplace transform, ω c is the cutoff frequency, n is the filter order, and ε is the amplitude of the passband fluctuation.
In order to minimize the peak-to-peak error, the cutoff frequency is determined according to the frequency point where the amplitude response gain decreases by one thousandth. That is, the amplitude gain at 0.5 Hz should be greater than 0.999. In order to unify the comparison effect, the Butterworth filter with the smoothest frequency response characteristic curve is used as the standard, and the fourth-order filter is converted to the j ω domain as follows:
H ω = 1 1 + ω ω c 8 0.999
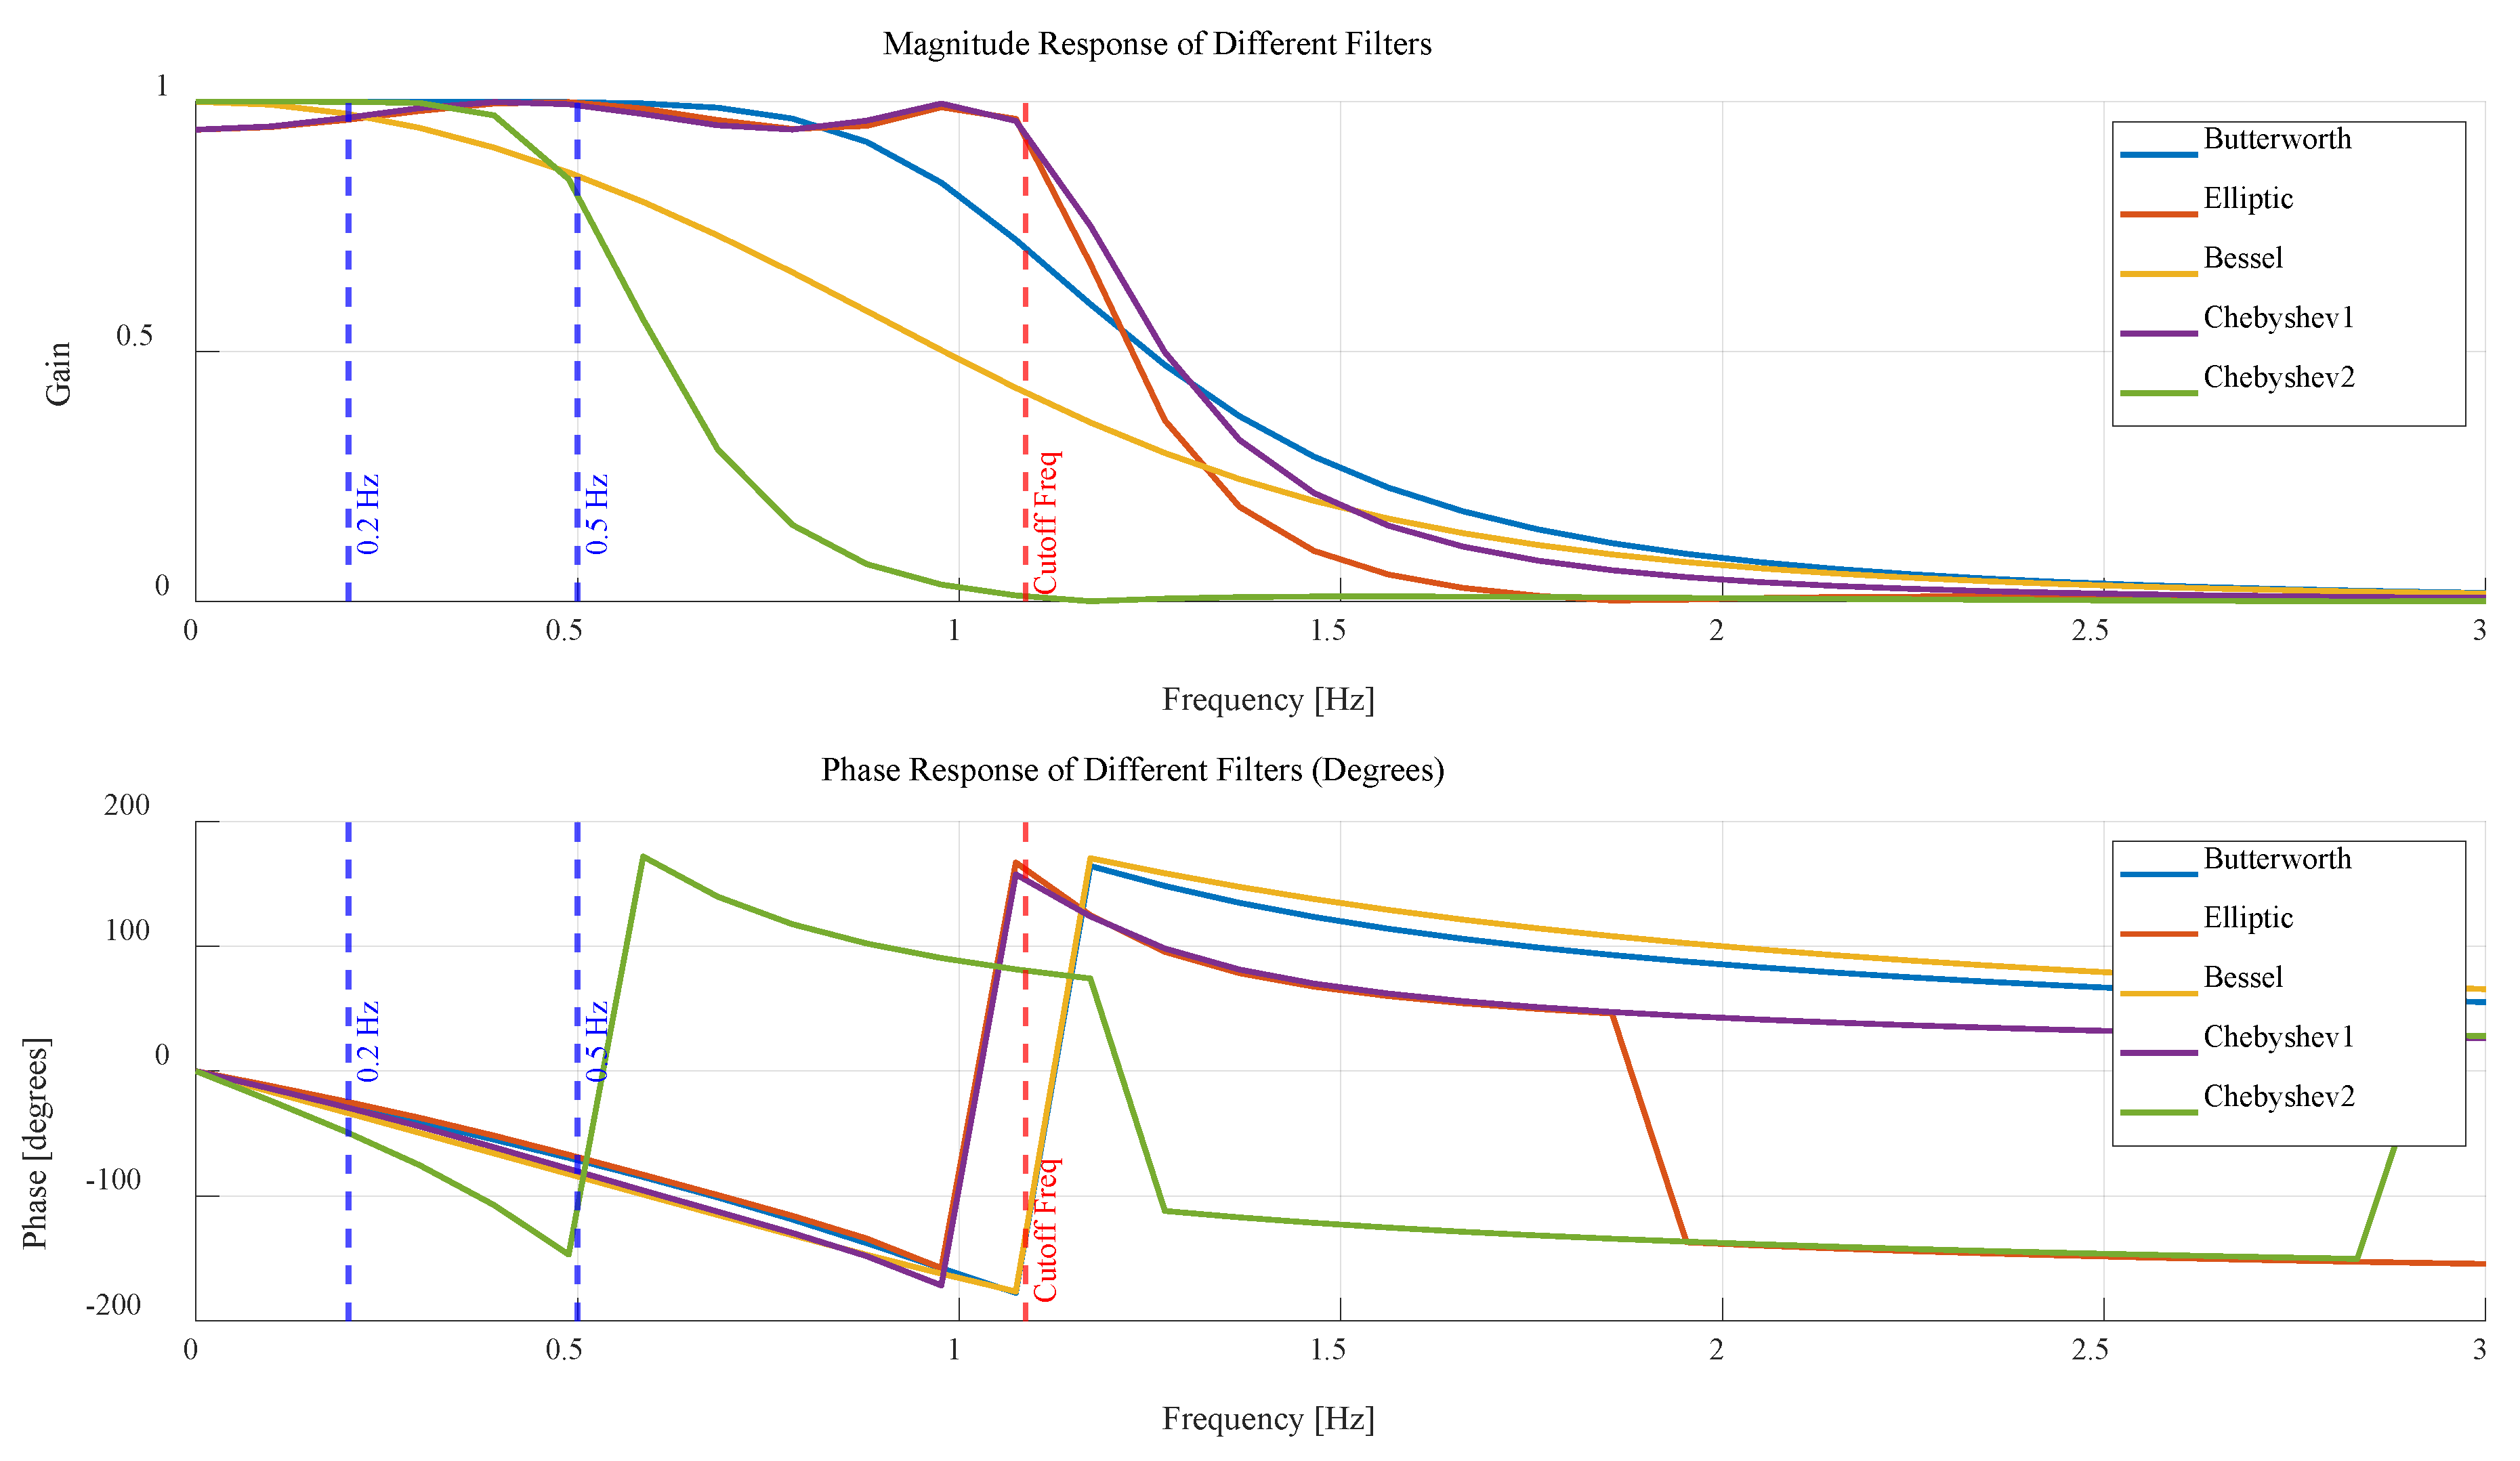
After substituting ω = 0.5   H z, the cutoff frequency ω c can be calculated to be 1.087 Hz. According to the determined cutoff frequency, the frequency response characteristic of the above commonly used filters is shown in Figure 2. It can be seen from the results that the use of filters often leads to amplitude and phase errors. In order to balance the problems of phase advance and amplitude gain attenuation, Ning cascaded a fourth-order Butterworth low-pass filter after the high-pass filter [24]. Hu and Tao et al. cascaded a first-order digital all-pass filter after the high-pass filter [25]. Another attempt is that Ben designed a new bandpass filter [26]. The above method has a good effect on high sampling frequency signals, but the error is large for low sampling frequency signals.
It can be analyzed from the frequency response characteristic curves of various traditional filters that the use of traditional filters will have more or less phase error and peak-to-peak error problems. Even if a bandpass filter is used, since the passband frequency of the filter is in the ultra-low frequency components of [0.2–0.5 Hz], designing a bandpass filter suitable for the 0.2 Hz to 0.5 Hz frequency band requires a high-order filter to ensure a flat passband response and good frequency selectivity. However, the phase error introduced by the high-order filter cannot be avoided. In some applications that require high-precision time domain analysis, this phase error may affect the accuracy of the signal. For very low frequencies such as 0.2 Hz, the design of the bandpass filter may encounter challenges. Especially during low-frequency signal collection, it may be affected by sensor noise and environmental factors. The effect of the filter in this frequency band may not be as expected, especially when using hardware implementation, it may be interfered by instrument noise. Therefore, many scholars are still continuously studying the filtering of the low-frequency components of the ship acceleration signal.

3. Proposed Method

3.1. Low Sampling Frequency Data Acquisition Module

Data acquisition modules (usually refers to embedded or dedicated data acquisition hardware modules) have their own advantages and applicable scenarios in many aspects. Data acquisition modules have the advantages of high integration and modularity. They are usually designed as independent hardware units that are easy to integrate. They generally include sensor interfaces, amplifiers, sampling, and processing functions. These modules are suitable for various embedded systems and application scenarios that require flexible layout, and are suitable for embedding into control systems, robots or other custom hardware. Data acquisition modules are usually designed to be more compact and durable, with excellent corrosion resistance, suitable for use in the harsh environment of deep-sea ships. They usually have characteristics such as shock resistance, dustproof and waterproof, which are suitable for embedded applications and mobile devices. Due to the variability of buses and interfaces, some data acquisition modules support wireless connections (such as Wi-Fi, Bluetooth, or Zigbee), which enable them to perform remote data acquisition and is suitable for occasions where direct access to computers is not possible.
In comparison, data acquisition cards are usually inserted into computers through PCI/PCIe slots and mainly rely on the processing power of the computer. These devices require a PC or workstation with sufficient computing resources to run, which limits their usage scenarios and mobility. Acquisition cards need to rely on the computer’s processor and memory and are suitable for occasions that require high data processing and complex control. Based on this, it is completely possible to abandon the high sampling rate of the data acquisition card, sacrifice unnecessary ultra-high sampling rate, and use data acquisition modules in exchange for lower costs and better portability and reliability.

3.2. A Low-Frequency Component Filtering Method for Heave Acceleration Signal of Ships

In order to better filter out the low-frequency components of the ship acceleration signal, this paper proposes a low-frequency component filtering method for heave acceleration signal of marine ships, which belongs to the time–frequency domain filtering method. Unlike traditional approaches, this method does not rely on conventional filters. Instead, it performs digital filtering on the original acceleration signal with a low sampling frequency, collected by the data acquisition module. The core of the digital filtering process involves applying the Fast Fourier Transform (FFT) to the original low sampling frequency acceleration signal, converting the time-domain signal into the frequency domain, and then performing filtering through digital operations. The FFT is an efficient algorithm for computing the Discrete Fourier Transform (DFT). Specifically, the FFT uses symmetry and periodicity properties to decompose a DFT of length N into multiple smaller DFT computations. The most common FFT algorithm is the Cooley–Tukey FFT algorithm, which recursively breaks down the DFT into smaller DFTs. This algorithm is particularly efficient when N is a power of 2, i.e., N = 2 m , (where m = 2, 4, 8, 16…). The signal is divided into even and odd terms, and their respective DFTs are computed separately before merging the results.
In detail, assuming the length N of the ship acceleration time-domain signal x n is a power of 2, the computation process of the DFT can be decomposed as follows:
X k = n = 0 N 1 x n e j 2 π N k n , k = 0,1 , 2 , , N 1
For N = 2 m , it can be decomposed into two DFTs of size N / 2 :
one for the even-indexed part ( x 2 , x 4 , x 6 , …),
one for the odd-indexed part ( x 1 , x 3 , x 5 , …).
Where
x n is the n th sample of the acceleration time domain signal.
X k is the k th sample of the frequency domain signal, represents the complex amplitude of the signal.
N is the length of the signal (number of samples).
e j 2 π N k n is the complex exponential term, representing the transformation of the time-domain signal into the frequency domain.
In this paper, the acceleration frequency domain signal X k after FFT processing is intercepted to the interested low-frequency component, such as [0.2–0.5] Hz. Perform the Inverse Fast Fourier Transform (IFFT) on the intercepted frequency domain signal X k to obtain the acceleration time-domain signal x n that contains the interested low-frequency component:
x n = 1 N X k e j 2 π N k n
where
x n is the n th sample of the time domain signal after intercepted.
X k is the k th sample of the frequency domain signal, that is, the frequency component obtained from DFT.
N is the length of the time domain signal.
e j 2 π N k n is a complex exponential term, which represents the recovery from the frequency domain to the time domain, which is exactly the opposite of the complex exponential term in DFT.
1 N is a normalization factor to ensure that the amplitude of the transformed signal will not be amplified due to the transformation.
Although the influence of phase error can be eliminated by intercepting low-frequency components through frequency domain methods, the imaginary part value will be ignored after IFFT, resulting in peak-to-peak error in the filtered signal. Here, we combine the frequency domain filtering with the time domain filtering, Kalman filtering, to perform time domain filtering on the time domain signal x n after IFFT, and the update equation is:
x ^ n ¯ = A x ^ n 1 + B u n 1
P n ¯ = A P n 1 A T + Q
K n = P n ¯ H T H P n ¯ H T + R
x ^ n = x ^ n ¯ + K n · x n H x ^ n ¯
  P n = I K n H P n ¯
where
x ^ n and x ^ ( n 1 ) represent the a posteriori state estimates at time n and time n 1 , respectively, which are one of the results of the filtering process.
x ^ n ¯ is the prior state estimate at time n , an intermediate calculation result of the filtering process.
P n and P n 1 represent the posterior estimation covariances at time n and time n 1 , respectively.
P ( n ¯ ) is the prior estimation covariance at time n .
H is the conversion matrix from state variables to measured values.
x n is the measured value, which is the input to the filter.
K n is the filter gain matrix.
A is the state transfer matrix.
B is the state matrix.
Q is the process excitation noise covariance.
R is the measured noise covariance.
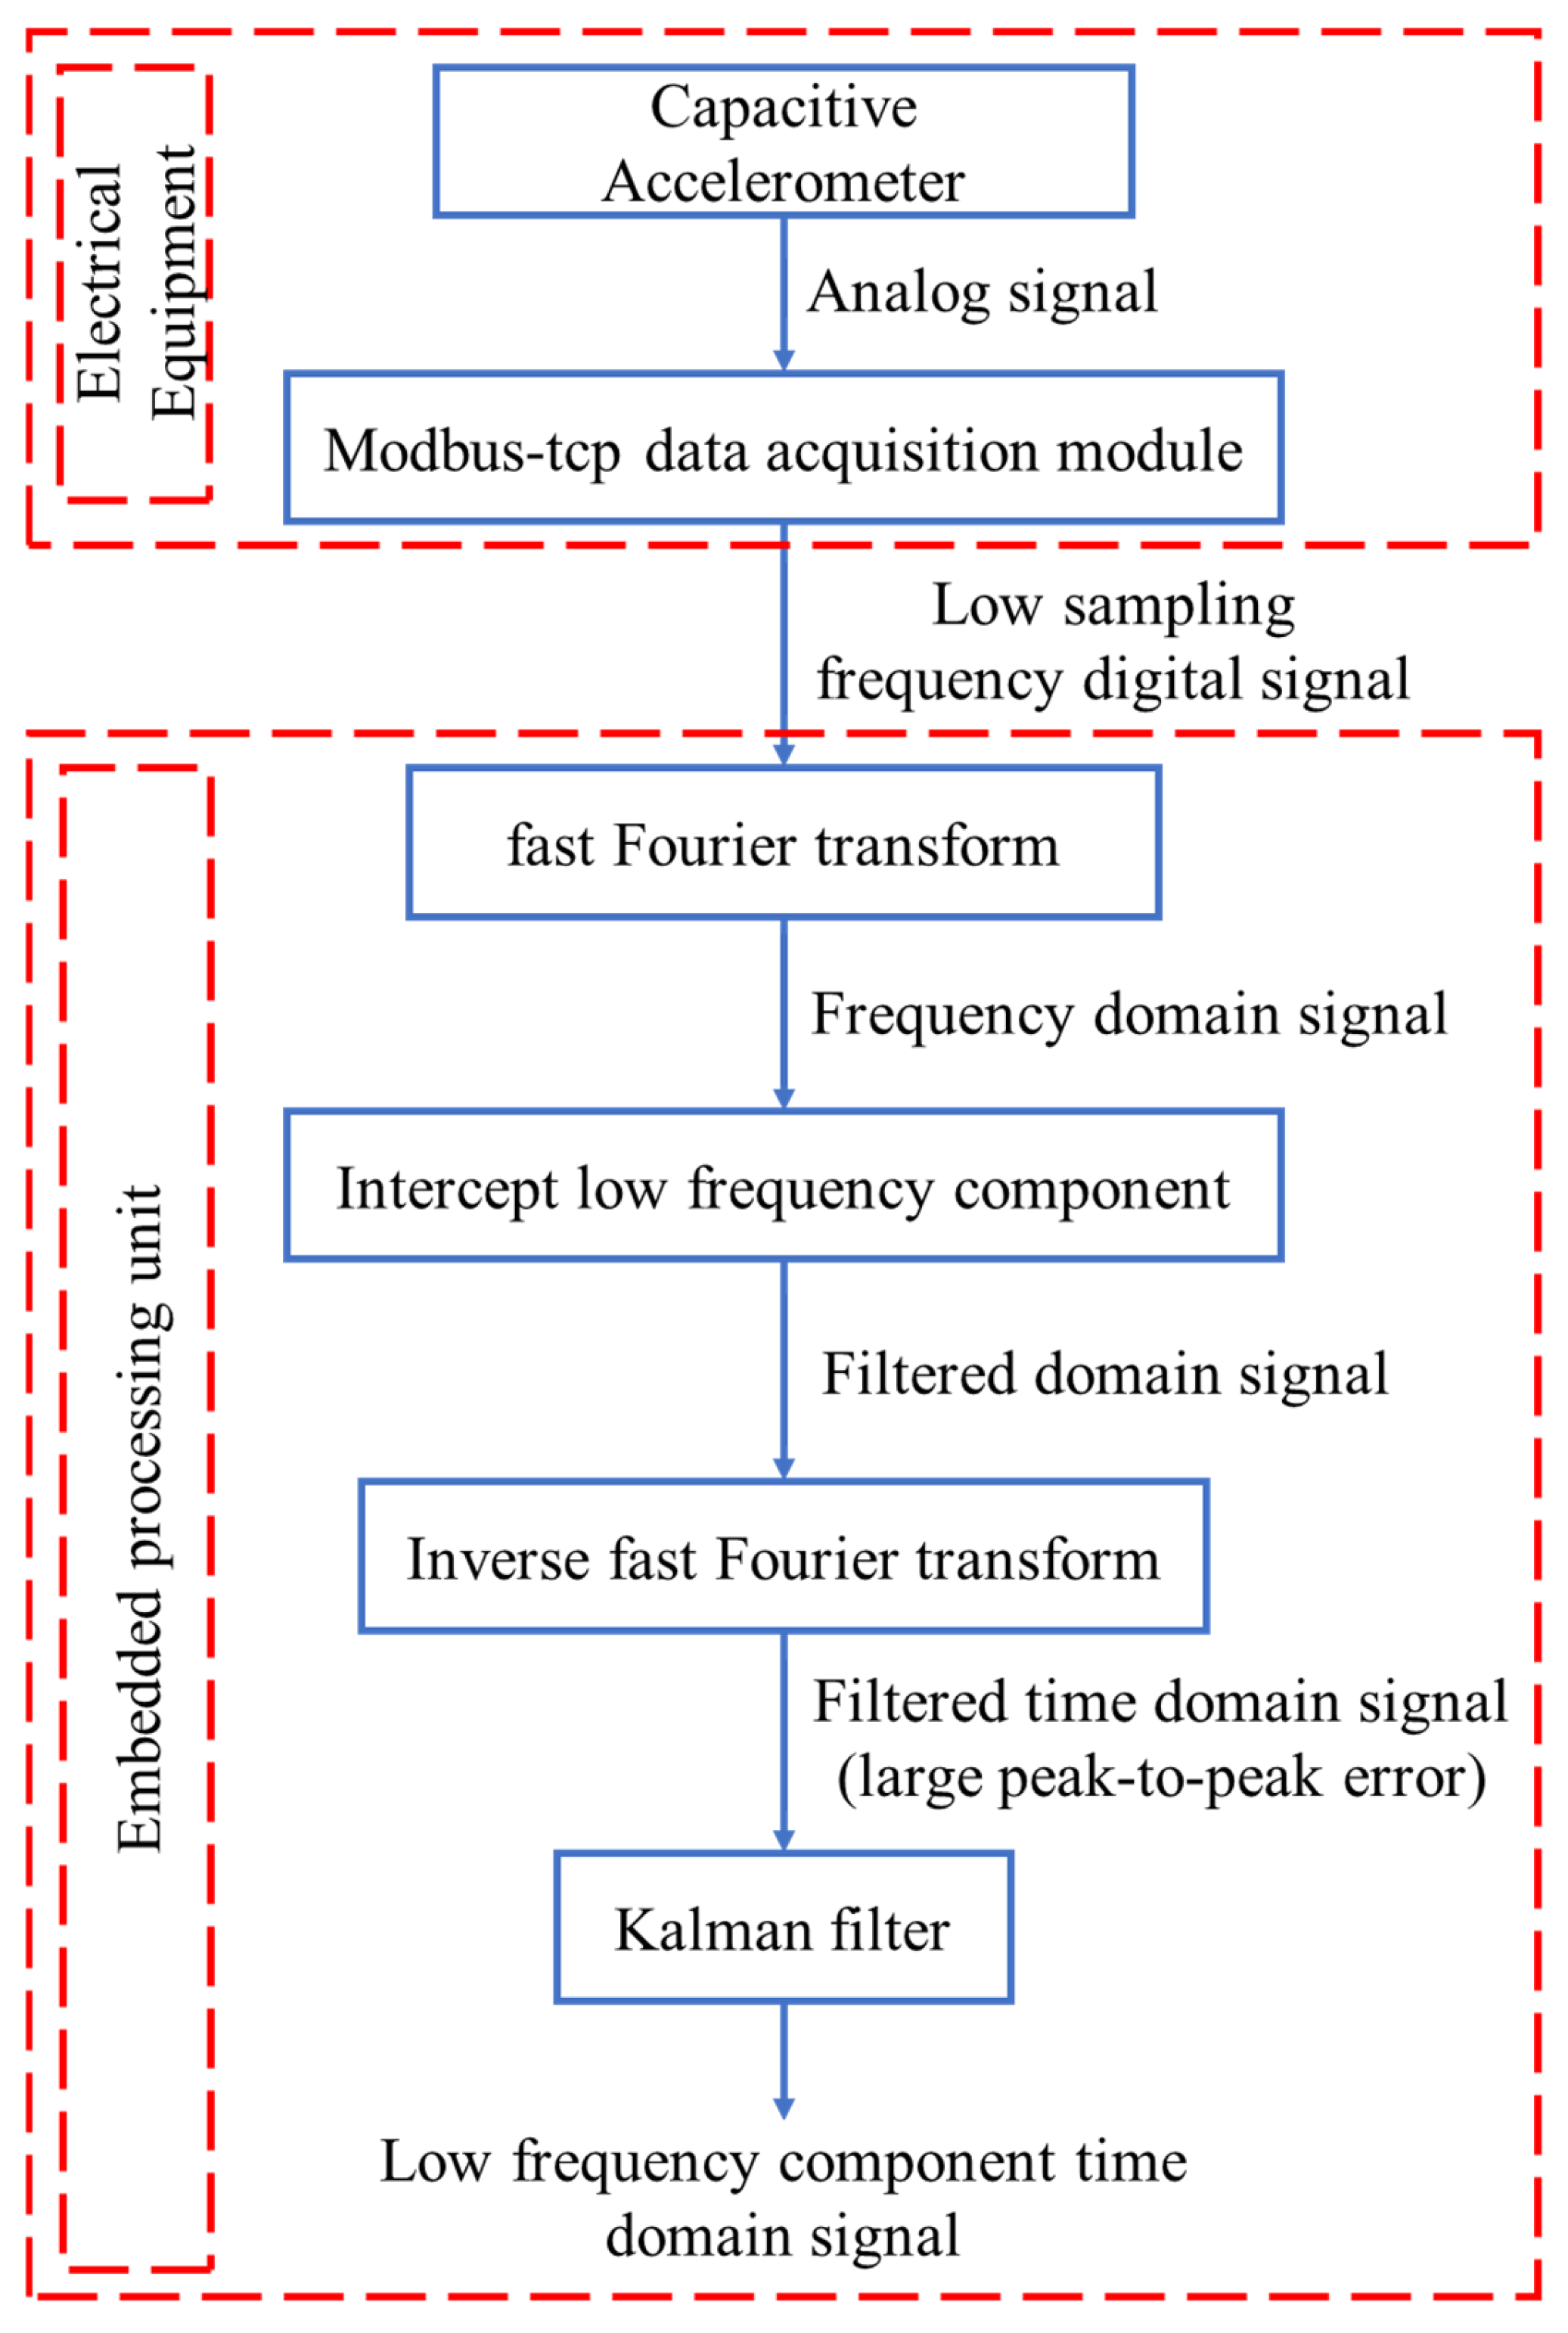
Although the intercepted acceleration signal is a real signal, the signal output by IFFT usually contains a very small imaginary part. By performing Kalman filtering on the acceleration signal after IFFT, the accuracy of the low-frequency component is ensured and the phase error caused by the filter is eliminated. The process principle of the proposed method is shown in Figure 3.

4. Experimental Results and Analysis

In order to verify the proposed a low-frequency component filtering method for heave acceleration signal of marine ships, we designed experiments in the laboratory. Since the purpose of this paper is to illustrate the effectiveness of the proposed filtering method, in order to focus the experimental results on the filtering effect, the low-frequency heave motion model of the ship is simplified to a sine function model in this experimental design. In addition, in actual sea conditions, the measurement of the ship heave acceleration signal will definitely be affected by gravity acceleration. In summary, in order to eliminate the influence of gravity acceleration, we use the laboratory’s sine motion platform to simulate the ship heave motion and place the motion platform horizontally to eliminate the influence of gravity acceleration on the filtering results.

4.1. Horizontal Sine Motion Simulation Platform

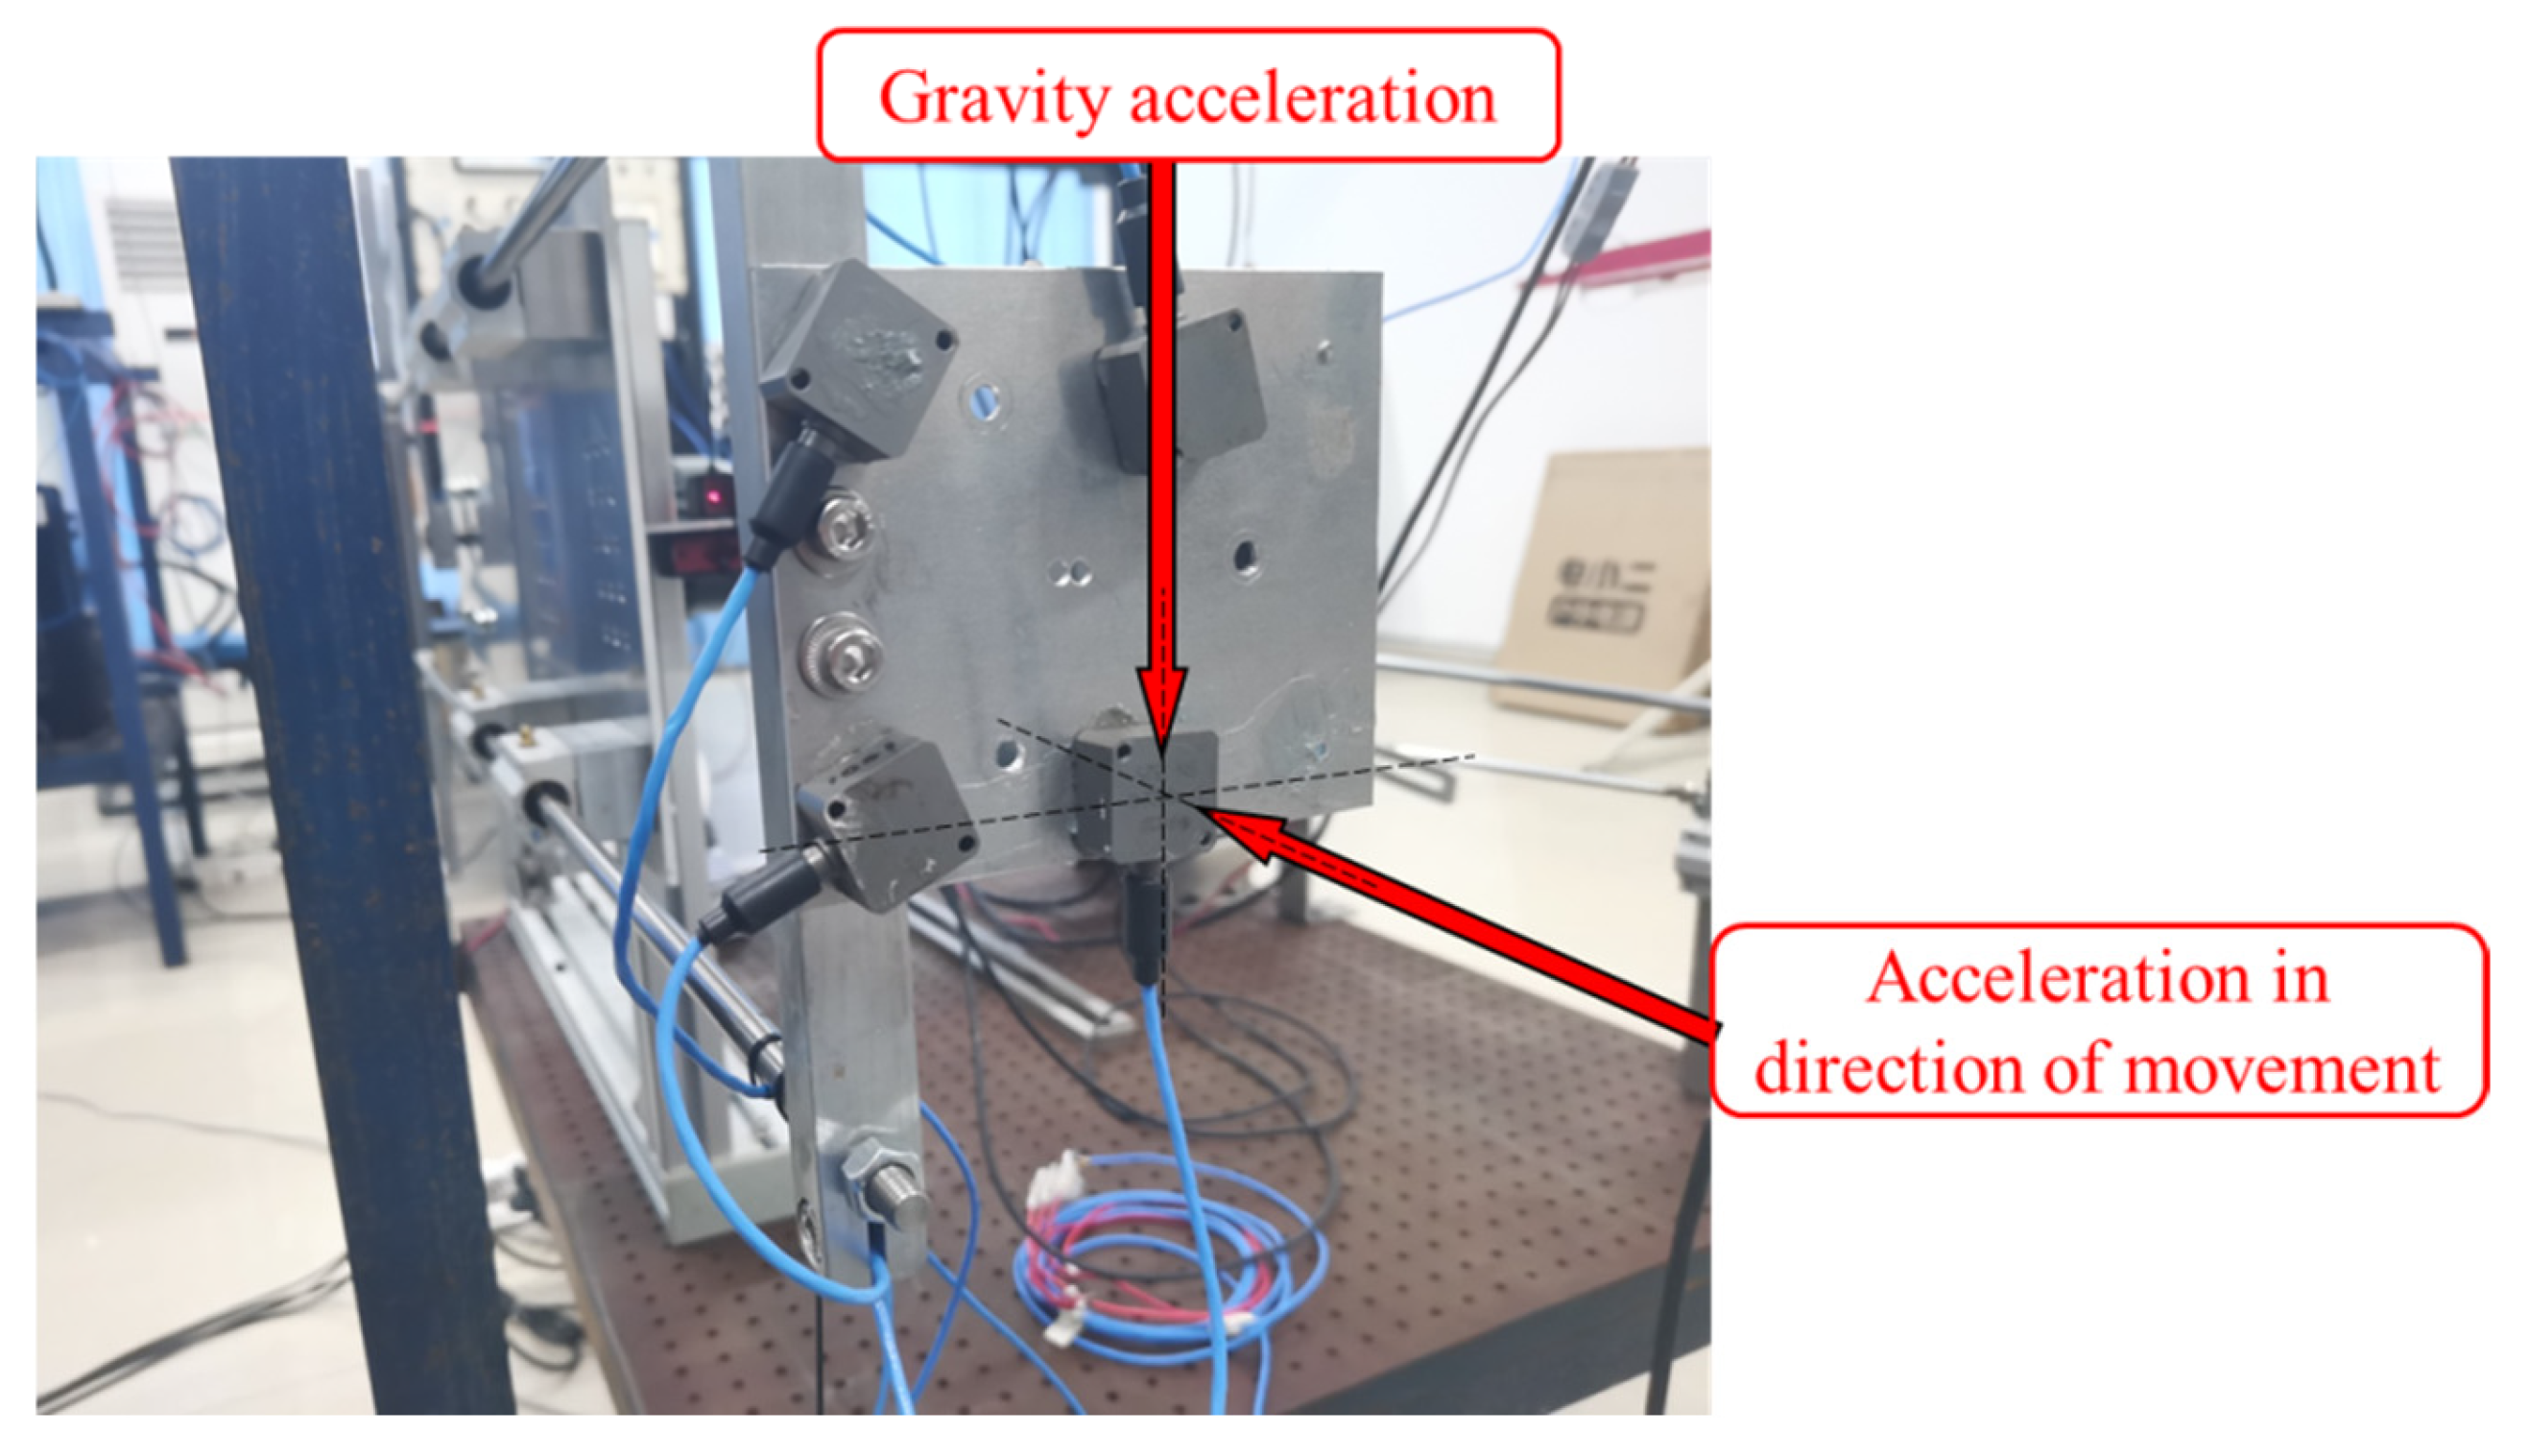
In this experiment, we chose a capacitive sensor from PCB Company of the United States, model: 3711B122G, which is a high-precision acceleration sensor. The sensor has an extremely high sensitivity of 1000 mV/g, a range of [−2 g, +2 g], and a measurement frequency range of [0 Hz, 250 Hz]. The sensor is fixed on the sine motion platform, and its sensitivity axis is perpendicular to the direction of gravity acceleration, which can allows the output value of the acceleration to be undisturbed by gravity acceleration. The performance of the acceleration sensor is shown in Table 1, and its fixing method is shown in Figure 4.
The sine motion platform used in this experiment is a linear reciprocating mechanism driven by a three-phase asynchronous motor. When the sine motion platform is placed horizontally, there is no interference from gravity on the pressure surface of the capacitive acceleration sensor, so the analog output value of the sensor is 0 V when it is stationary. We selected three special points of the acceleration signal in the horizontal direction to introduce the sine motion platform. That is, the farthest point, the closest point, and the midpoint of the sine motion platform. When the platform moves to the farthest point and the closest point, the speed is 0, and the acceleration is the largest at this time, and the direction is opposite. When the platform moves to the midpoint, the acceleration is zero. The mechanism of sine motion platform is shown in Figure 5.
Due to the limitations of the sensor range, the extreme position of the sine motion platform and other factors, we list the detail parameters of the motion platform according to the relationship between acceleration, velocity, and displacement as shown in Table 2.
d t = A s i n 2 π f t
v t = d d t d t = A · 2 π f c o s 2 π f t
a t = d d t v t = A · 2 π f 2 s i n 2 π f t
where
A is the amplitude, which indicates the maximum displacement of the sinusoidal motion platform;
f is the reciprocating frequency of the sinusoidal motion platform (in Hz).

4.2. Signal Acquisition System

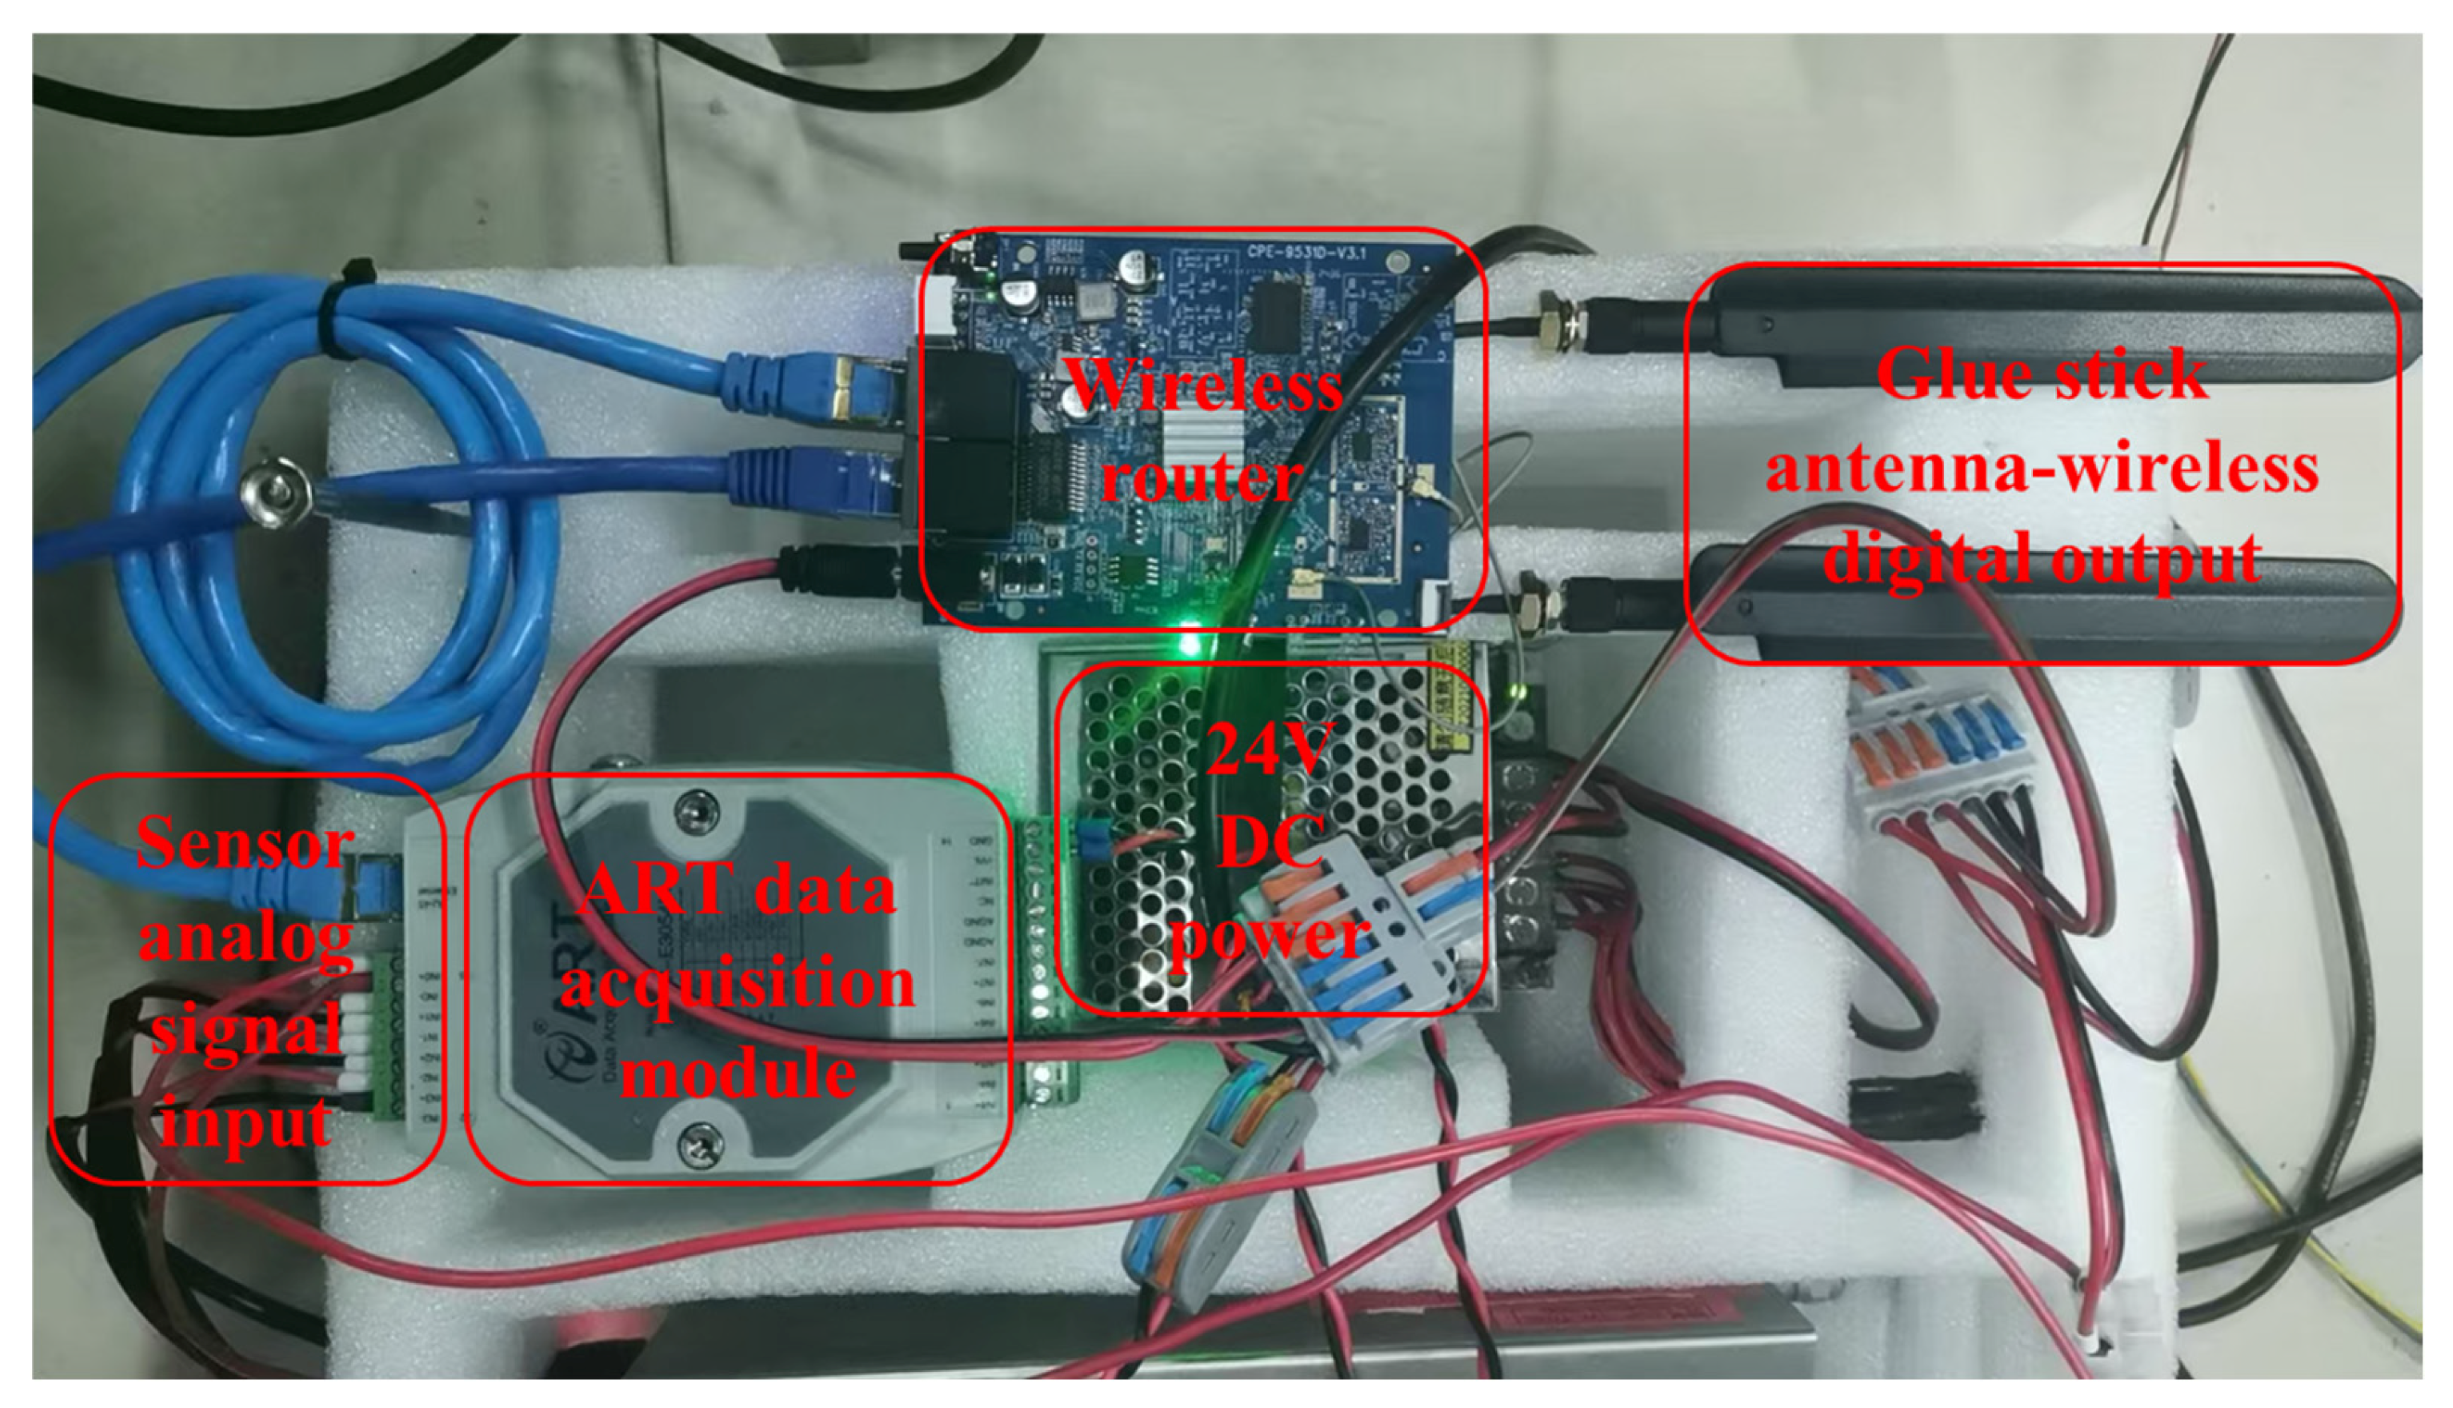
In this experiment, we chose the analog signal acquisition module of China ART Company, model: DAM-E3054, which is a 16-bit acquisition module with eight channels. The sampling frequency can stably maintain a sampling frequency of 100 Hz during multi-channel acquisition. It supports ±10 V voltage analog signal acquisition. The module can convert the collected analog quantity into digital quantity and transmit it through the network cable, supporting the standard Modbus TCP protocol. In order to meet the marine, portable and wireless acquisition environment, we equipped it with a routing module for long-distance signal transmission. The detailed acquisition system is shown in Figure 6.
In order to verify the accuracy of the filtered acceleration signal, we introduced a laser sensor. The laser sensor cannot directly measure the acceleration of the sine motion platform, but it can measure the displacement signal of the sinusoidal motion platform in real time with high precision. Therefore, in this experiment, we differentiated the collected laser displacement signal and indirectly obtained the acceleration signal, which is considered to be the standard acceleration signal of the motion platform. By comparing the acceleration signal after filtering by the proposed method with the standard acceleration signal, the effectiveness of the proposed method is demonstrated.
All equipment used in this experiment is summarized in Table 3.

4.3. Detailed Experimental Setup

After setting the static IP address and other parameters in the Ethernet port of the host computer, the original acceleration signal can be collected. In this paper, we control the sine motion platform to perform low-frequency motion at frequencies of 0.2 Hz, 0.3 Hz, 0.4 Hz, and 0.5 Hz with amplitudes of ±75 mm, ±100 mm, and ±150 mm, respectively. The sampling frequency of the sampling module is set to 100 Hz. In order to further clearly discuss the proposed method, we take the result with an amplitude of ±75 mm as an example to explain in detail our filtering steps at different frequencies.
Step 1: “Signal acquisition”.
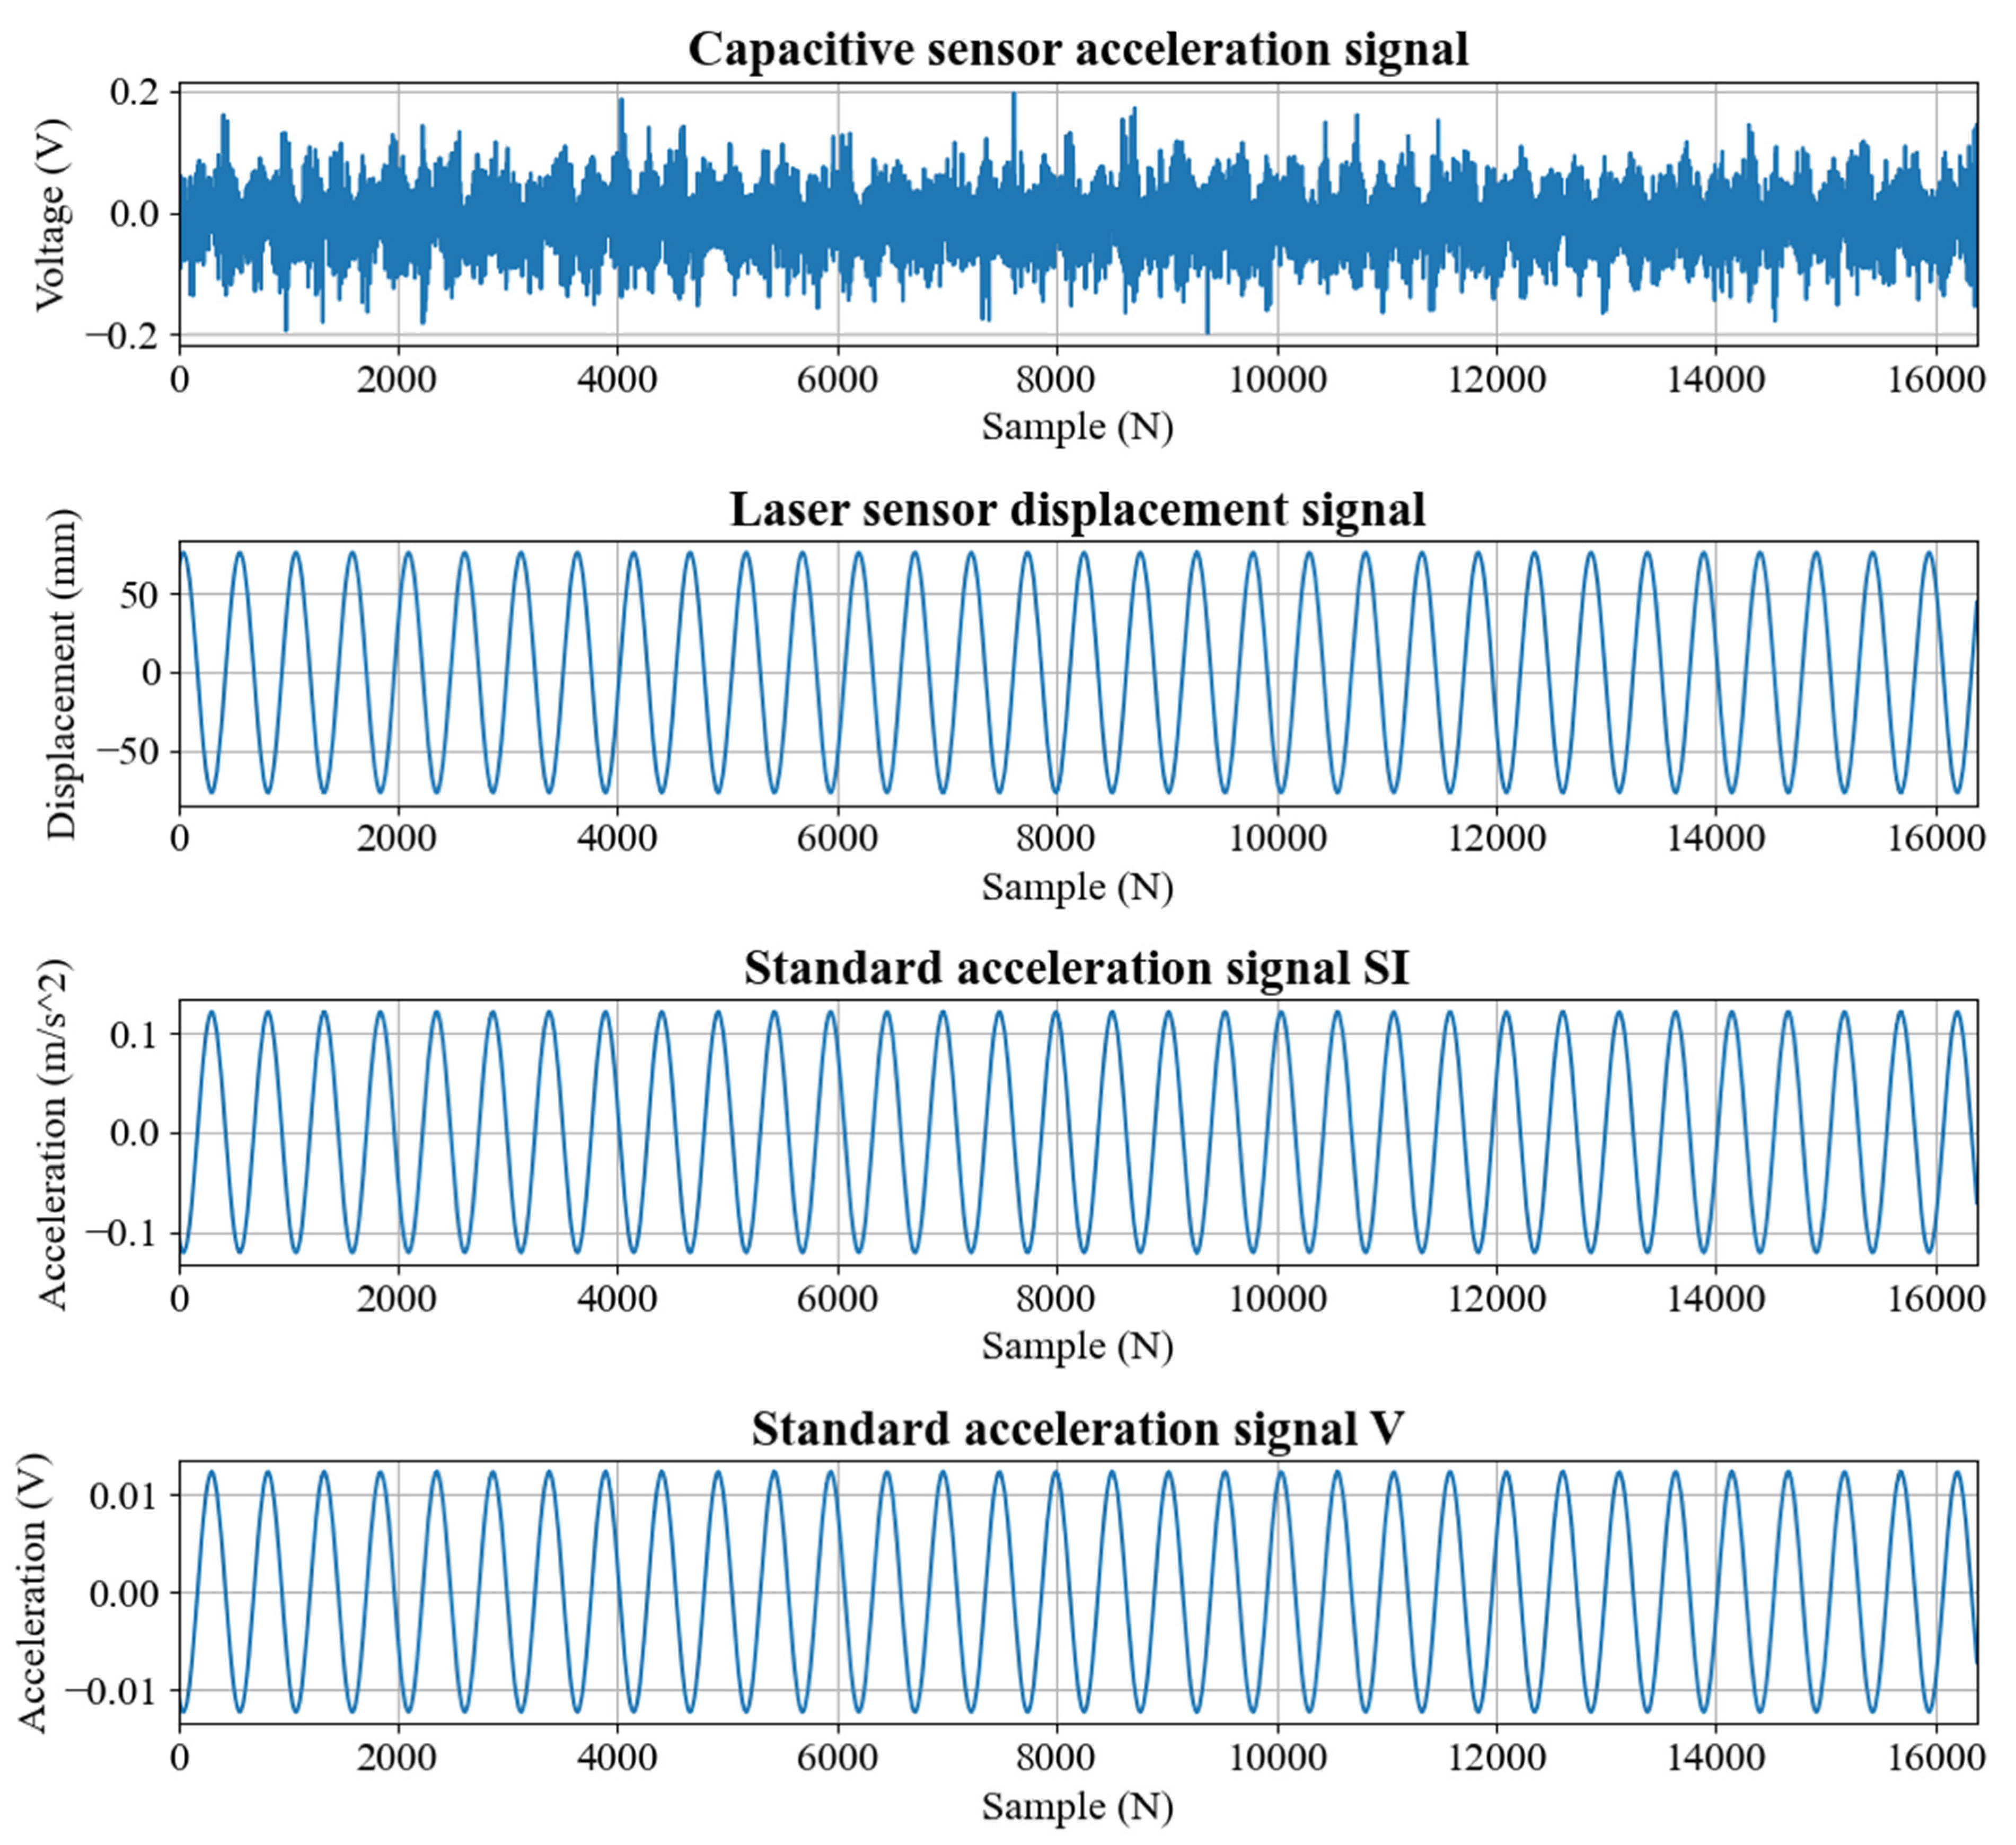
The low-frequency motion signal of the sine motion platform is collected for 180 s through the acquisition module, and the number of sampling points is 18,000. Since the length of the number of points in FFT is a power of 2, we selected 2 to the 14th power, that is, 16,384 points, and displayed them on the host computer. In order to unify the physical meaning of all signals for comparison, we unified the physical units of the signals in the host computer. Since the capacitive acceleration sensor can only collect the original acceleration analog signal, the unit is V. The laser sensor collects the displacement signal, the unit is mm. And after the displacement signal is differentiated twice, the standard acceleration signal is obtained, the unit is m/s2. According to the sensitivity of the capacitive sensor in Table 1, 101.9 mV/(m/s2), the standard acceleration signal is converted into a voltage value, the unit is V. The unit conversion results of all signals are shown in Figure 7.
Step 2: “Digital frequency domain filtering, filtering at frequency domain by using FFT”.
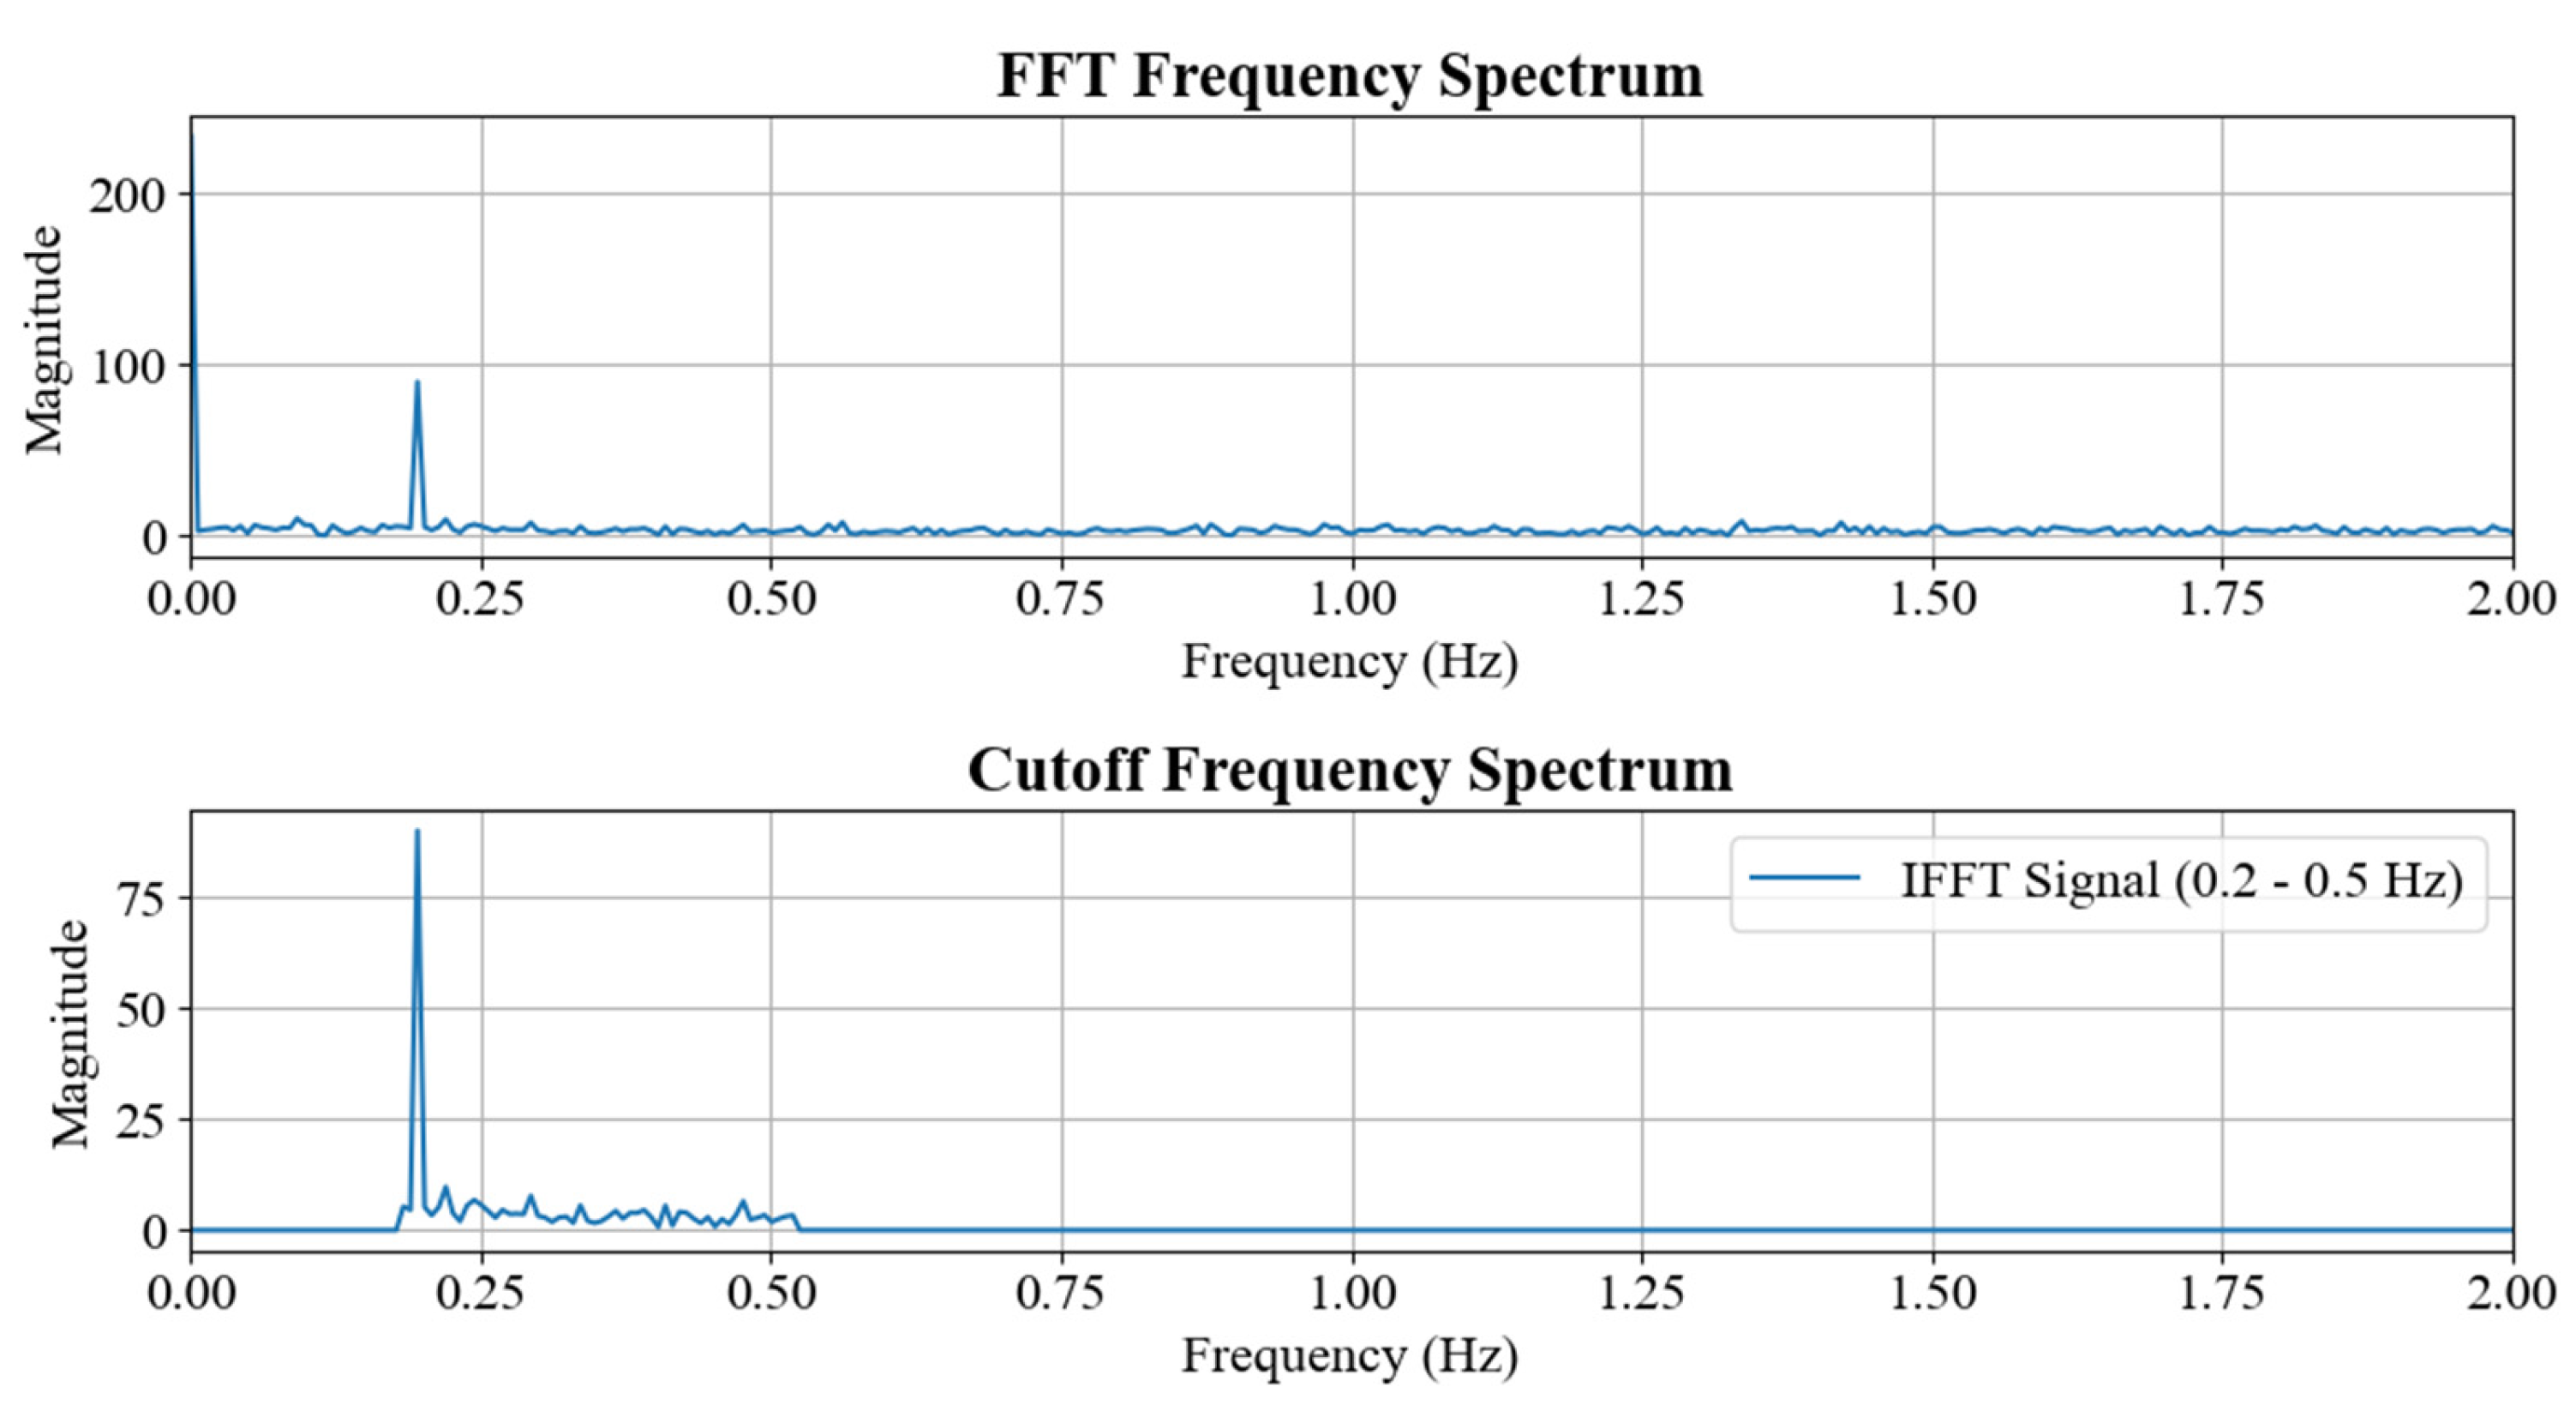
The acceleration signal of the capacitive sensor collected by the acquisition module is first processed by FFT, the absolute value of the transformation is taken, and only the positive frequency part is retained to obtain the frequency domain signal of the acceleration signal. Then, the low-frequency component of interest [0.2–0.5 Hz] is intercepted on the positive frequency axis. Similarly, according to the symmetry of FFT, the symmetrical negative frequency components are intercepted on the negative frequency axis. Similarly, according to the symmetry of FFT, the corresponding negative frequency component is intercepted on the negative frequency axis. Finally, the signal after frequency domain filtering is obtained by performing IFFT on the intercepted frequency component. At this time, the signal obtained by IFFT is different from the signal obtained by using the filter, eliminating the disadvantage of using the filter to introduce phase error. The FFT processing and frequency domain component interception processing of the acceleration signal is shown in Figure 8.
Step 3: “Digital time domain filtering, filtering using Kalman transform”.
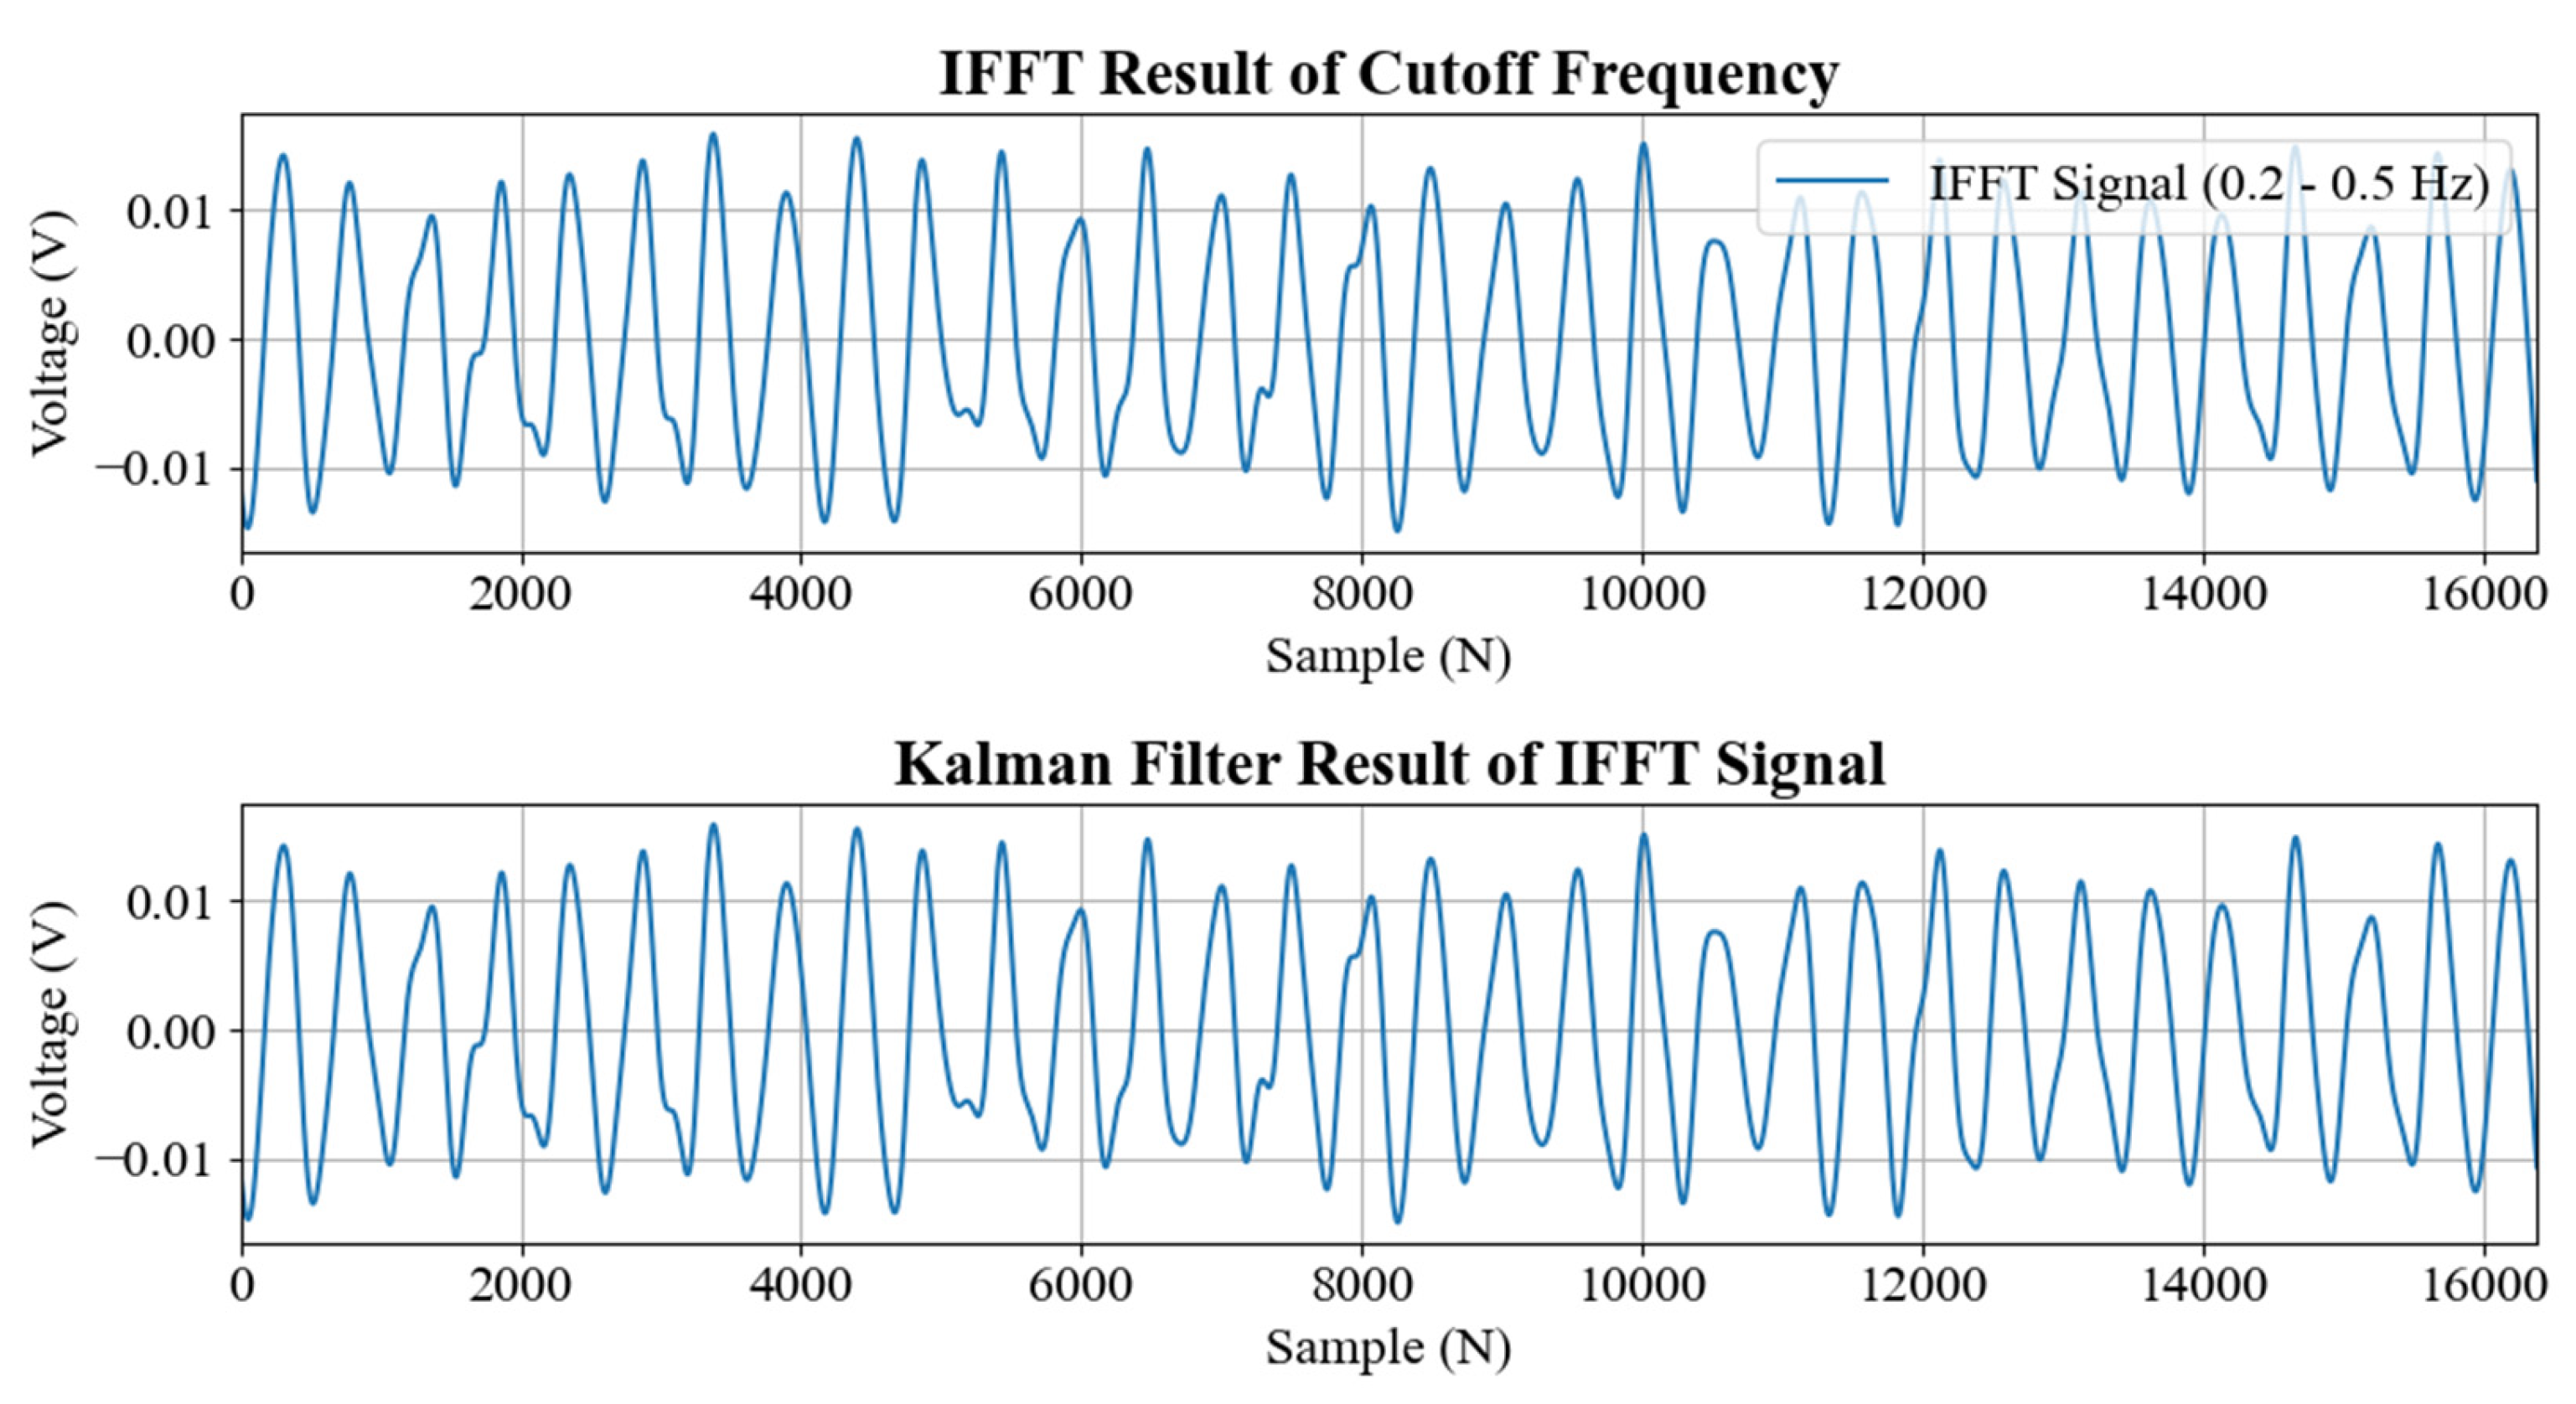
In the previous filtering process, IFFT processing will return complex numbers, but when we generate signals, we often only use the real part. Therefore, the signal after IFFT still has peak-to-peak error and imaginary error. In order to further eliminate the peak-to-peak error of the signal in time and not introduce phase error, we perform time domain filtering on the signal, that is Kalman filtering. The detailed parameters of Kalman filter are as follows: The initial state estimate is set to the initial value of the signal after IFFT; the initial error covariance is 1; the process noise covariance is 0.01; the measurement noise variance is 0.1; Here, we believe that the Kalman gain should rely more on the prediction results rather than the measurement results. Therefore, the noise measurement covariance is increased, making the output of the Kalman filter more inclined to the prediction value, thereby reducing the peak-to-peak error of the IFFT signal. The intercepted IFFT signal and the Kalman-filtered signal are shown in Figure 9.
Finally, the comparison is summarized.
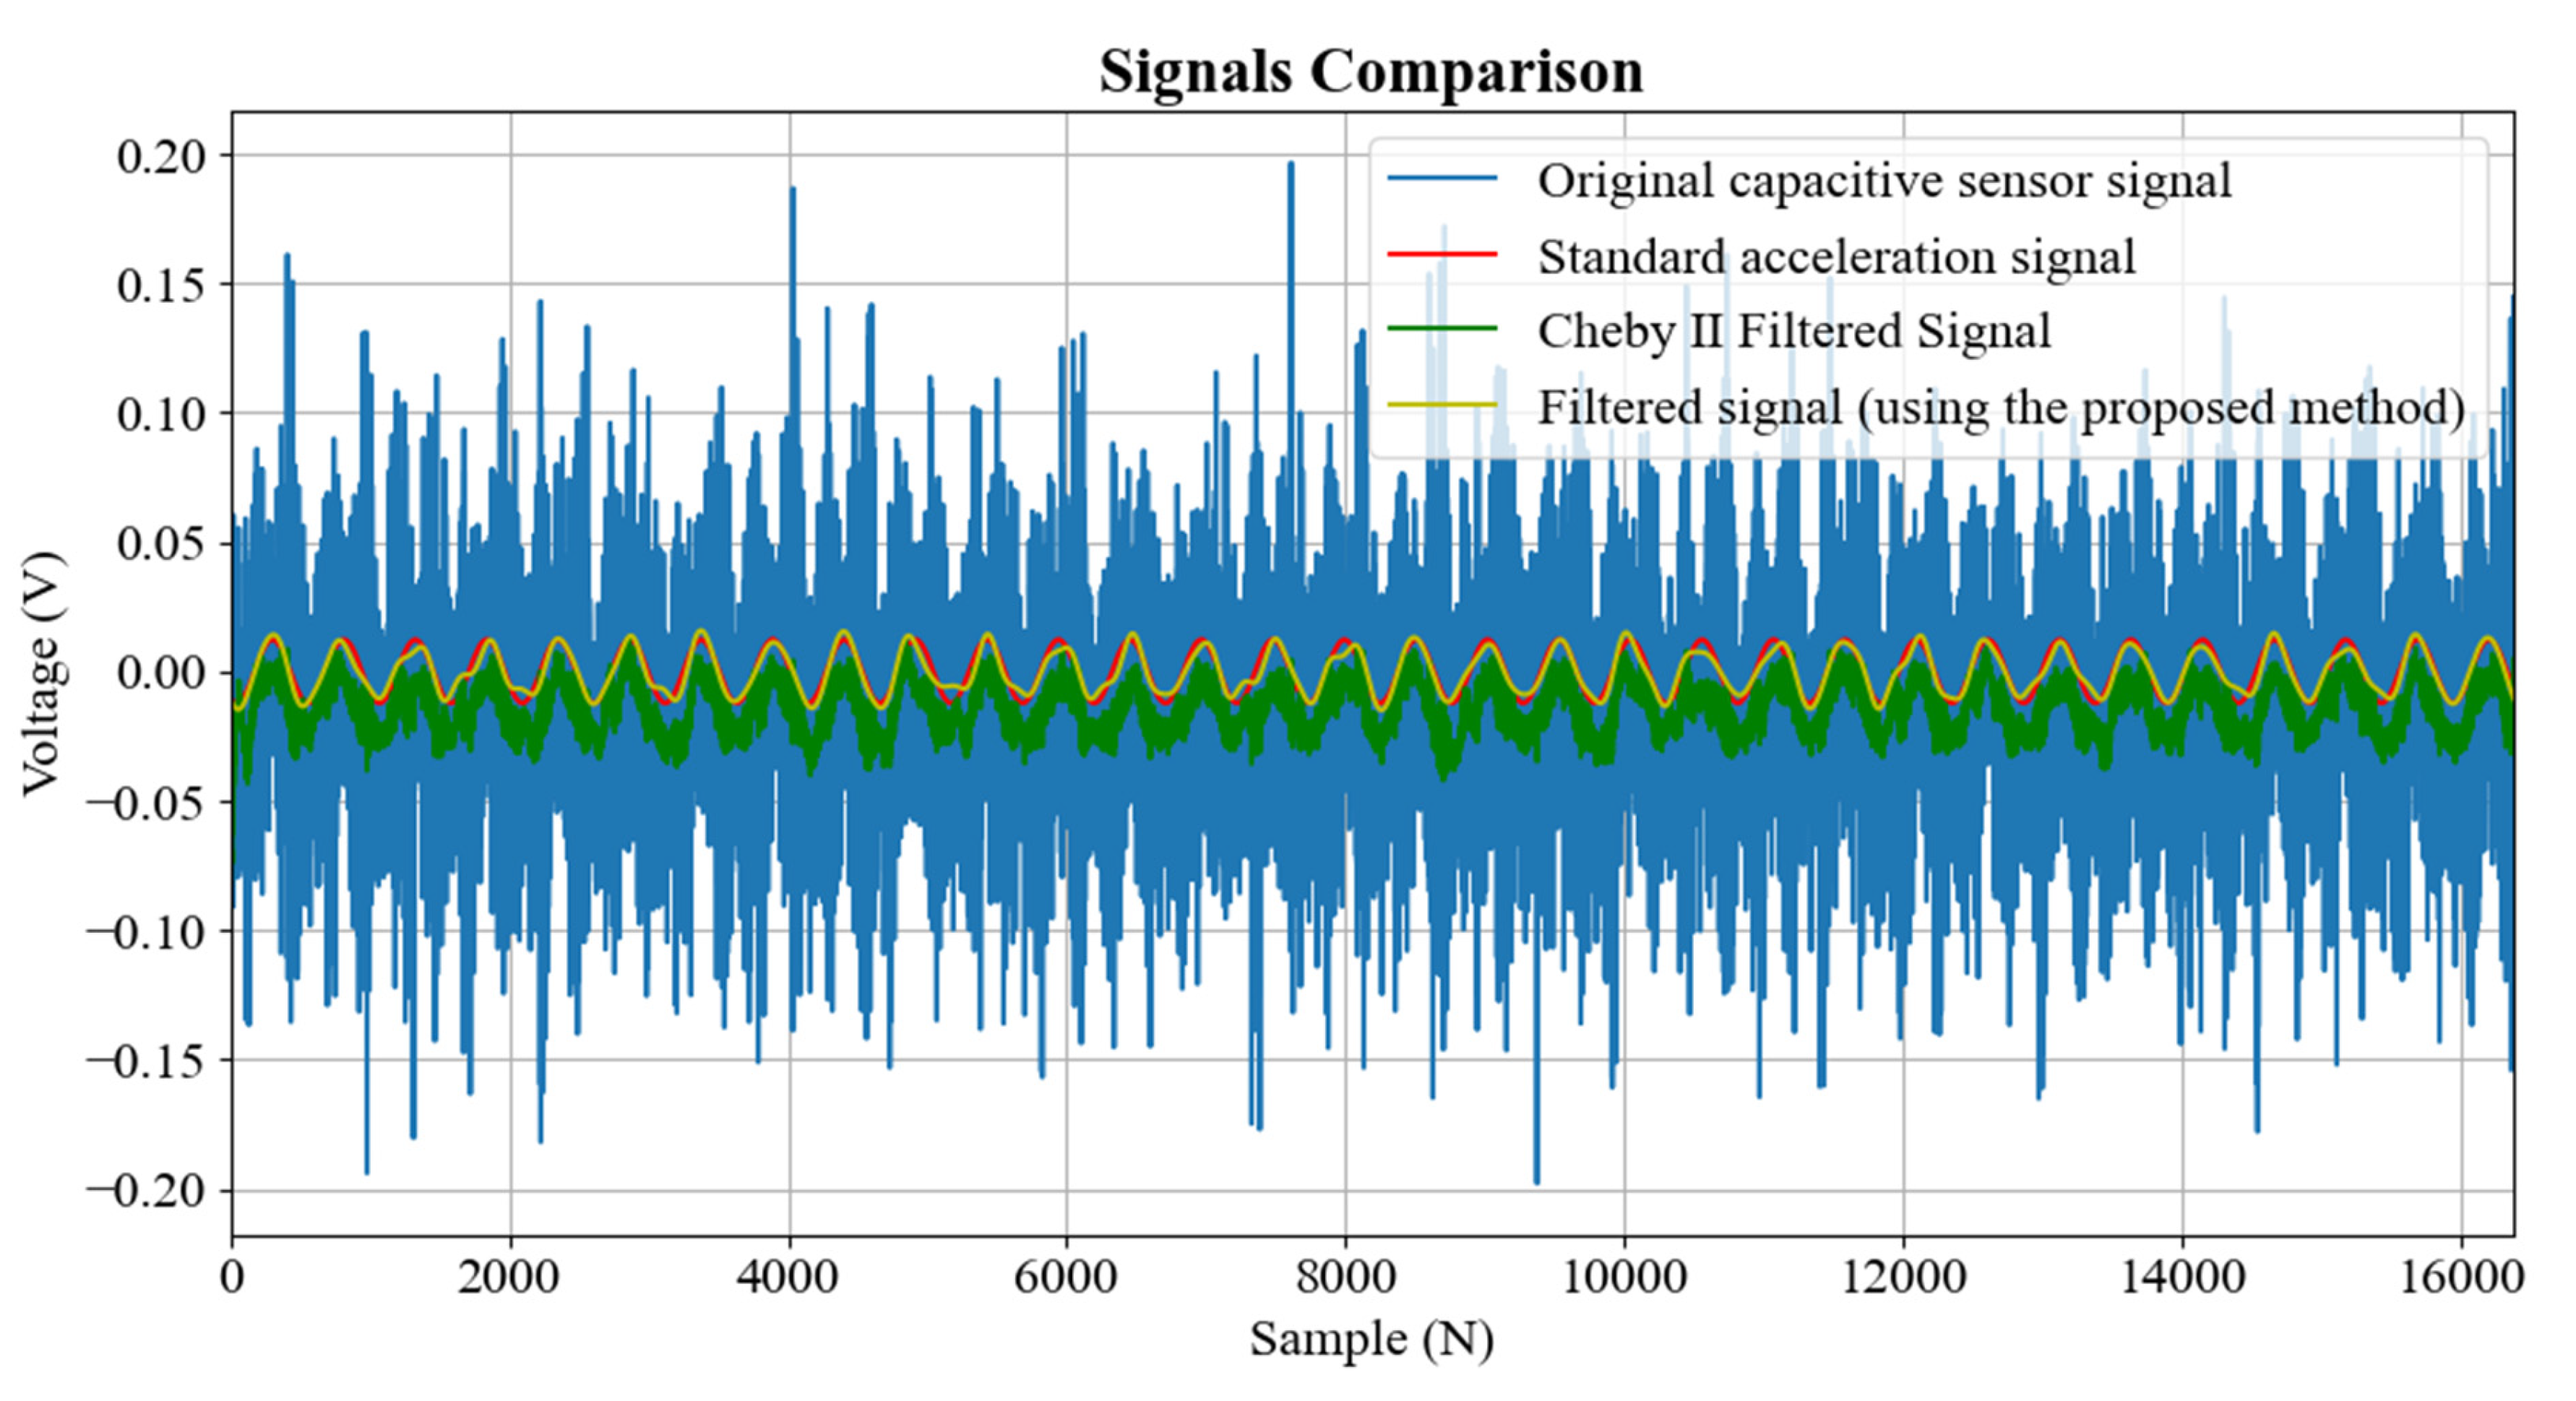
In order to verify the accuracy of the final signal, we filtered the original acceleration signal of the capacitive sensor using the traditional Chebyshev II filter. (In order to achieve the best filtering effect as much as possible, the parameters of the Chebyshev II filter we designed here are: fourth-order low-pass filter, stopband attenuation 10 dB, cutoff frequency 1.087 Hz.) In order to compare the filtering effect more intuitively, we compare the original capacitive sensor signal, the standard acceleration signal after laser displacement differentiation, the acceleration signal after Chebyshev II filtering, and the filtered signal using the proposed method. The comparison results are shown in Figure 10.
After comparing and analyzing the four groups of signals, we found that whether using the Chebyshev II filter or the filtering method we proposed, a certain filtering effect was achieved. By observing the filtering results, it can be intuitively seen that although the noise of the signal processed by the Chebyshev II filter is suppressed, there is still obvious noise residue. This makes the filtered acceleration signal difficult to use in ocean engineering, especially when the signal is used for measurement or control, its accuracy is still difficult to meet the requirements. In order to quantitatively evaluate the performance of the filter, we selected the mean square error (MSE) and the correlation coefficient as two key indicators.
The MSE of the signal after using the Chebyshev II filter and the standard acceleration signal is 0.00024012, and the correlation coefficient is 0.80365028. This shows that although the signal after filtering has improved in some aspects, the overall matching degree is still not high due to the residual noise.
In contrast, after using our proposed filtering method, the MSE dropped to 0.00000646, and the correlation coefficient increased to 0.95607133. These values show that our filtering method has significant advantages in reducing noise and maintaining signal accuracy, especially in the offshore field with high accuracy requirements.
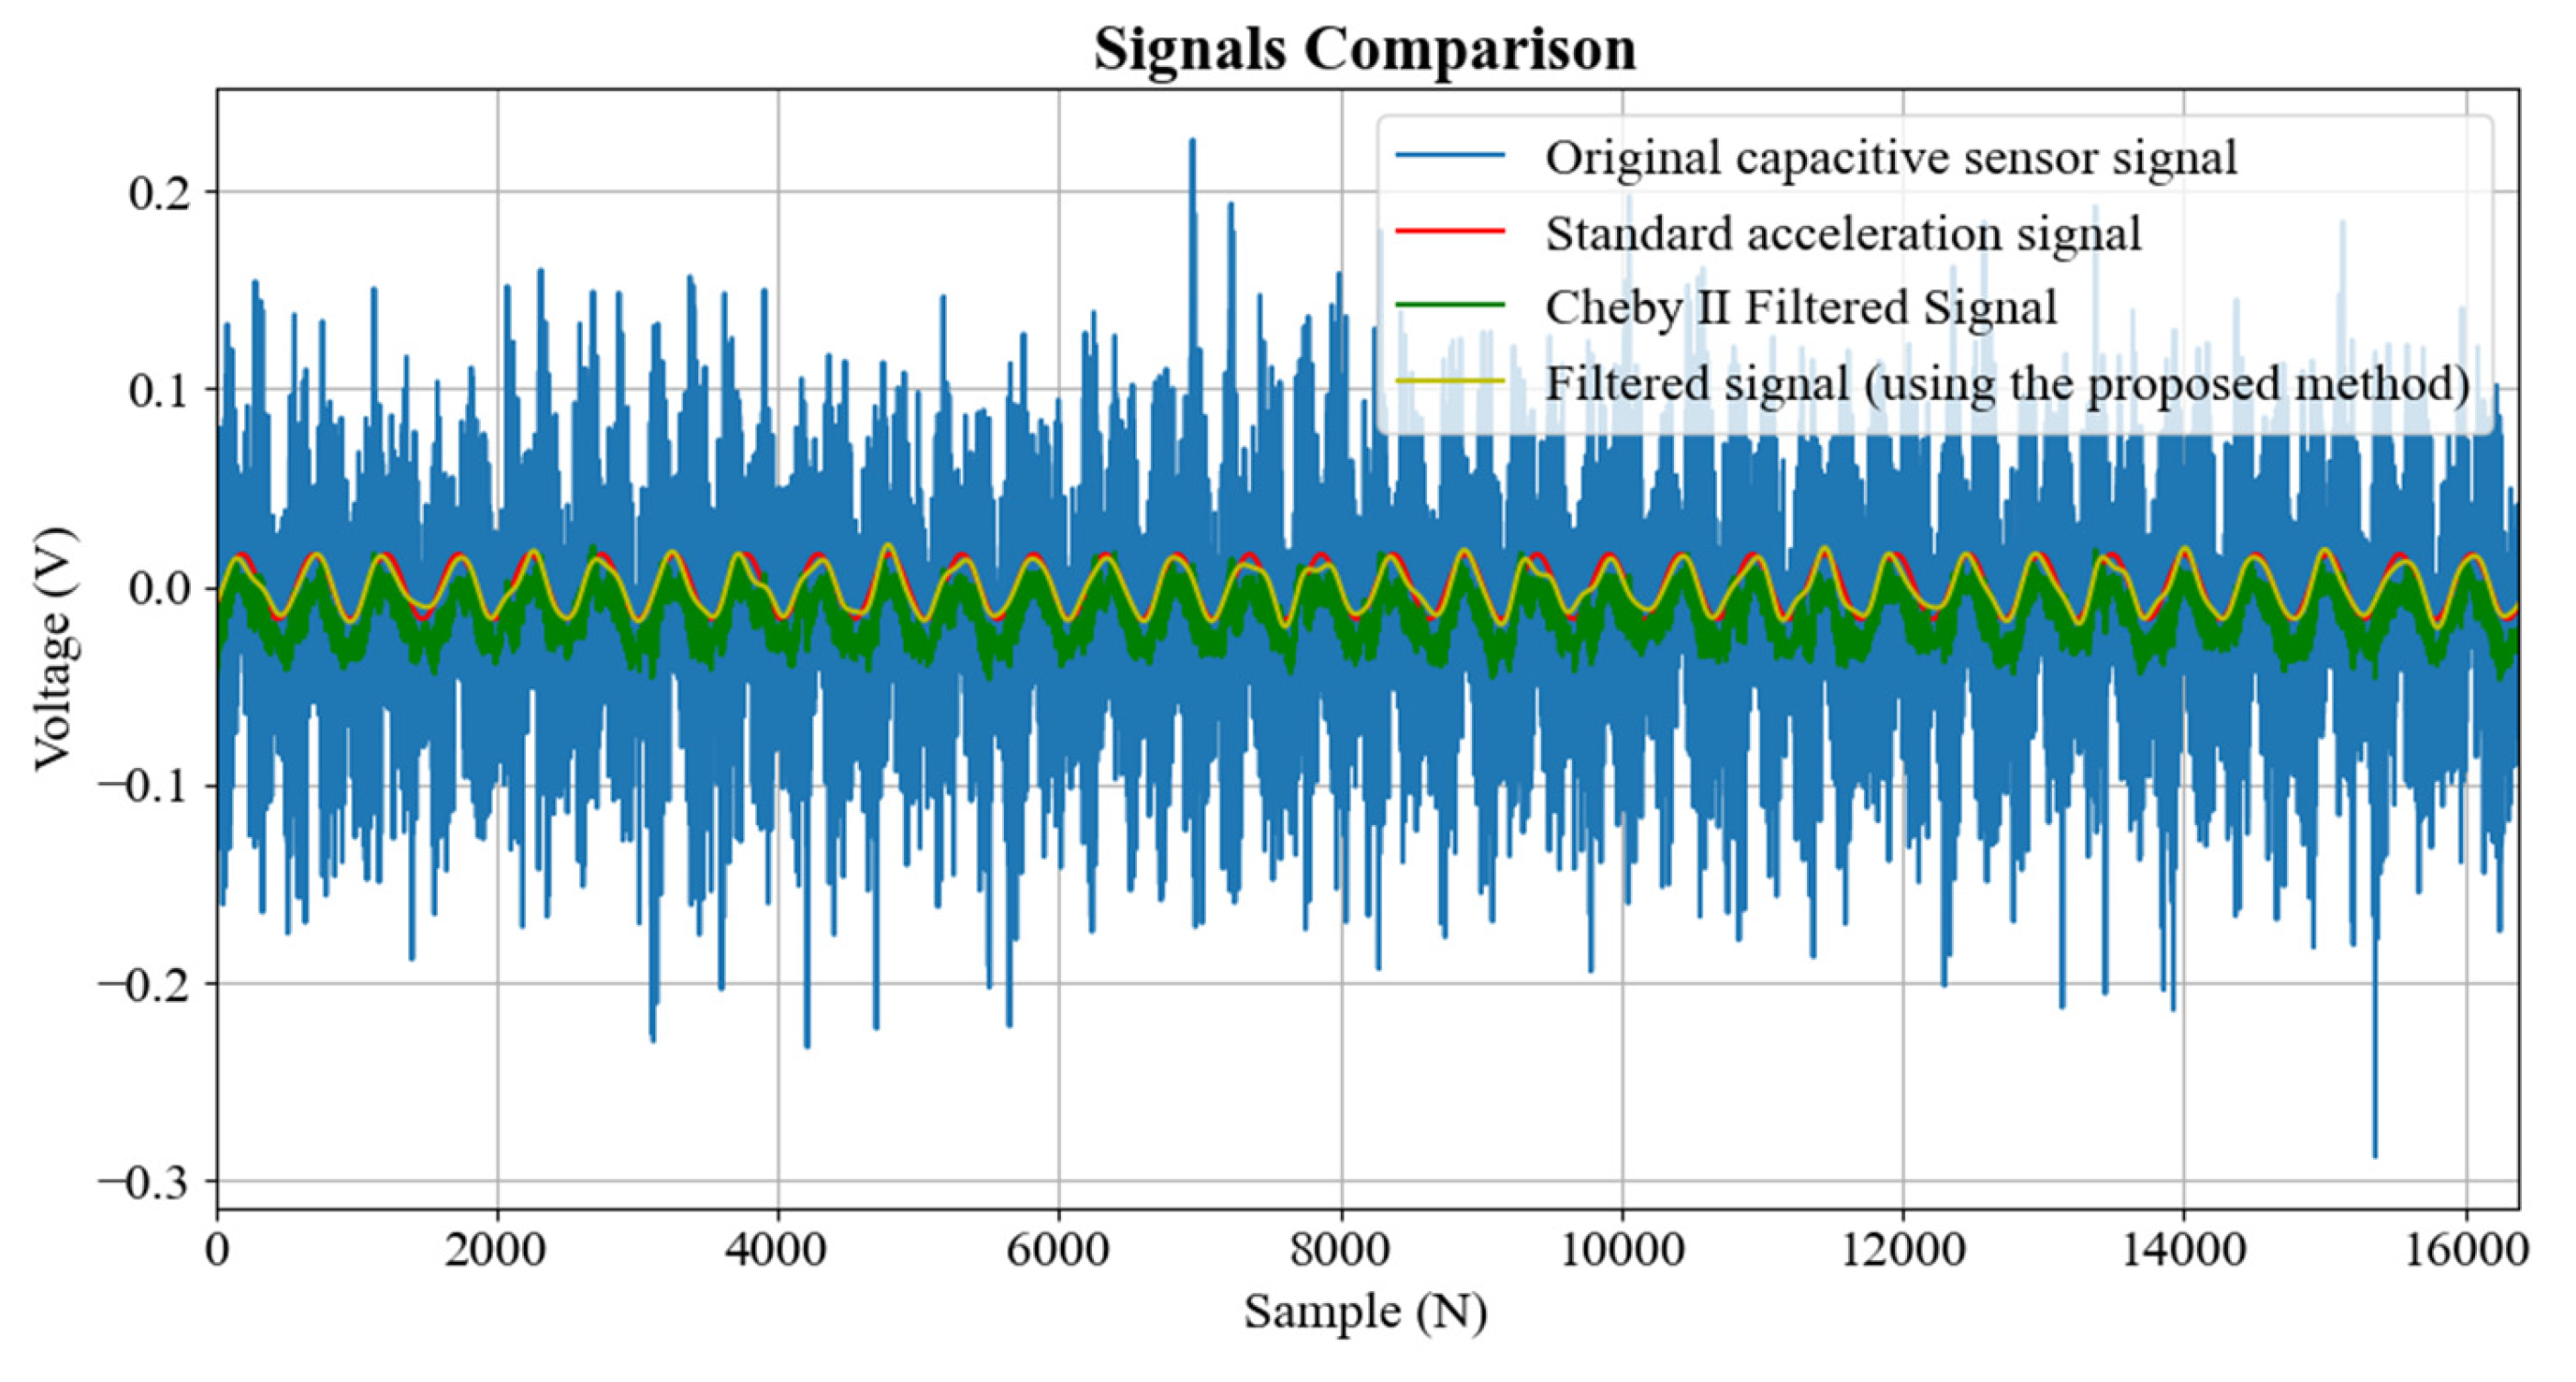
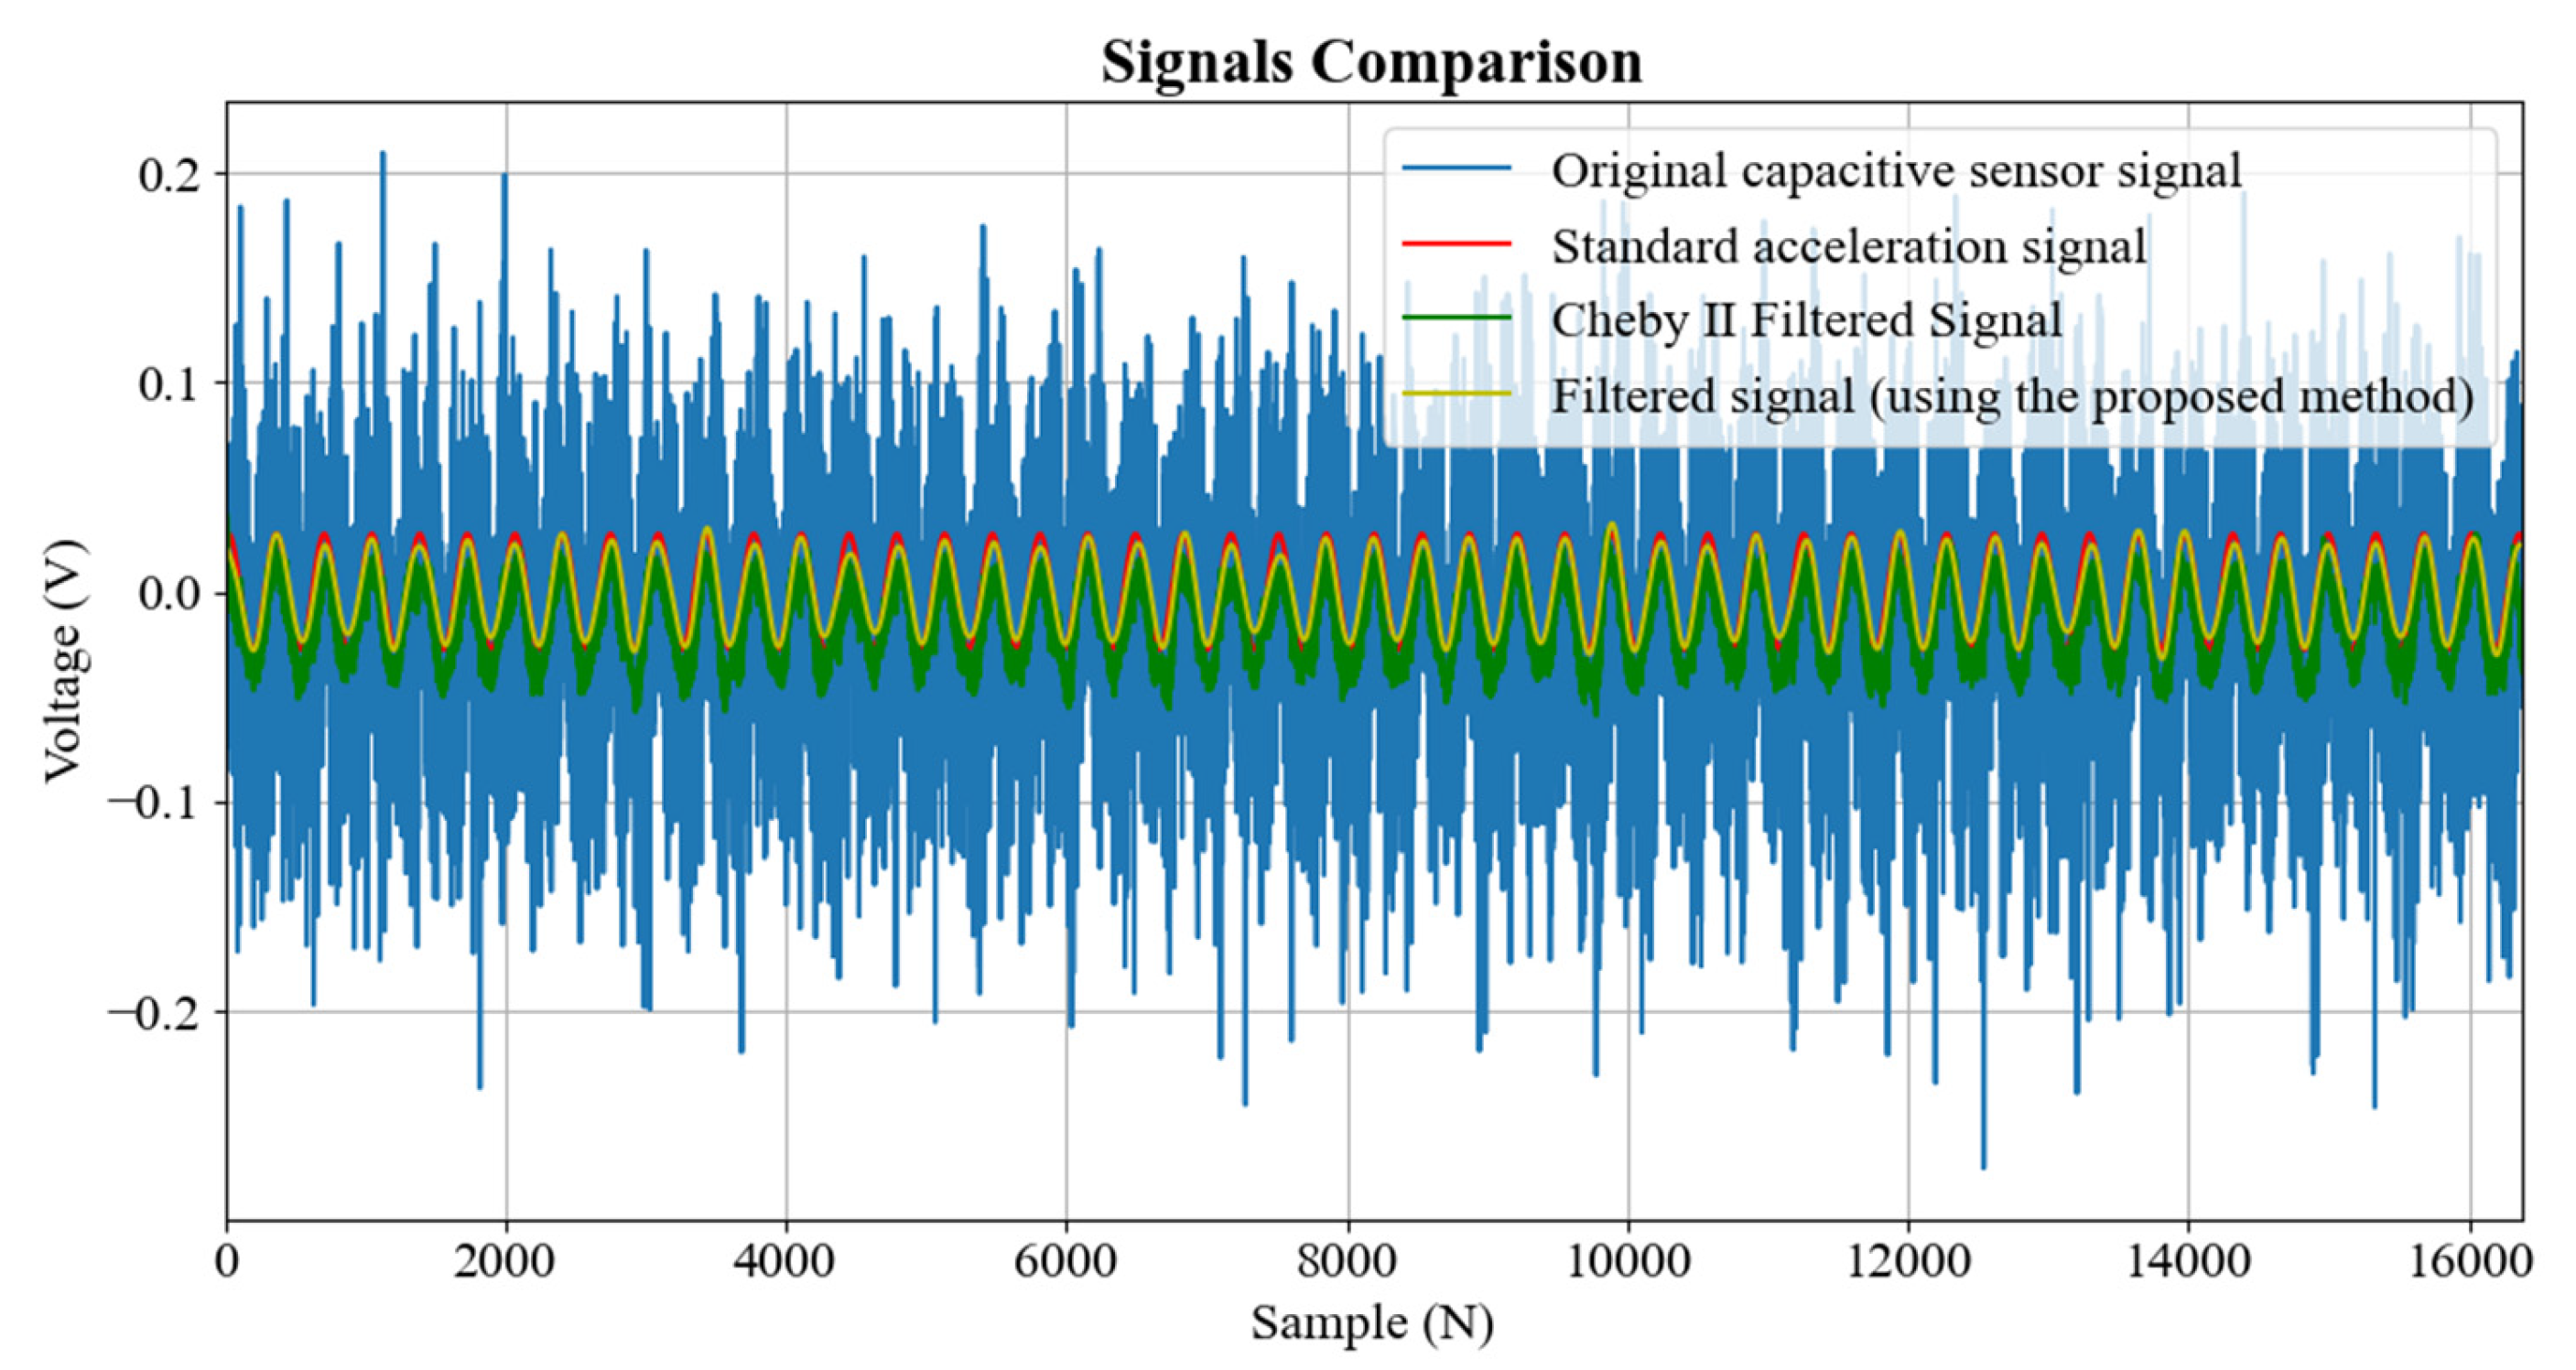
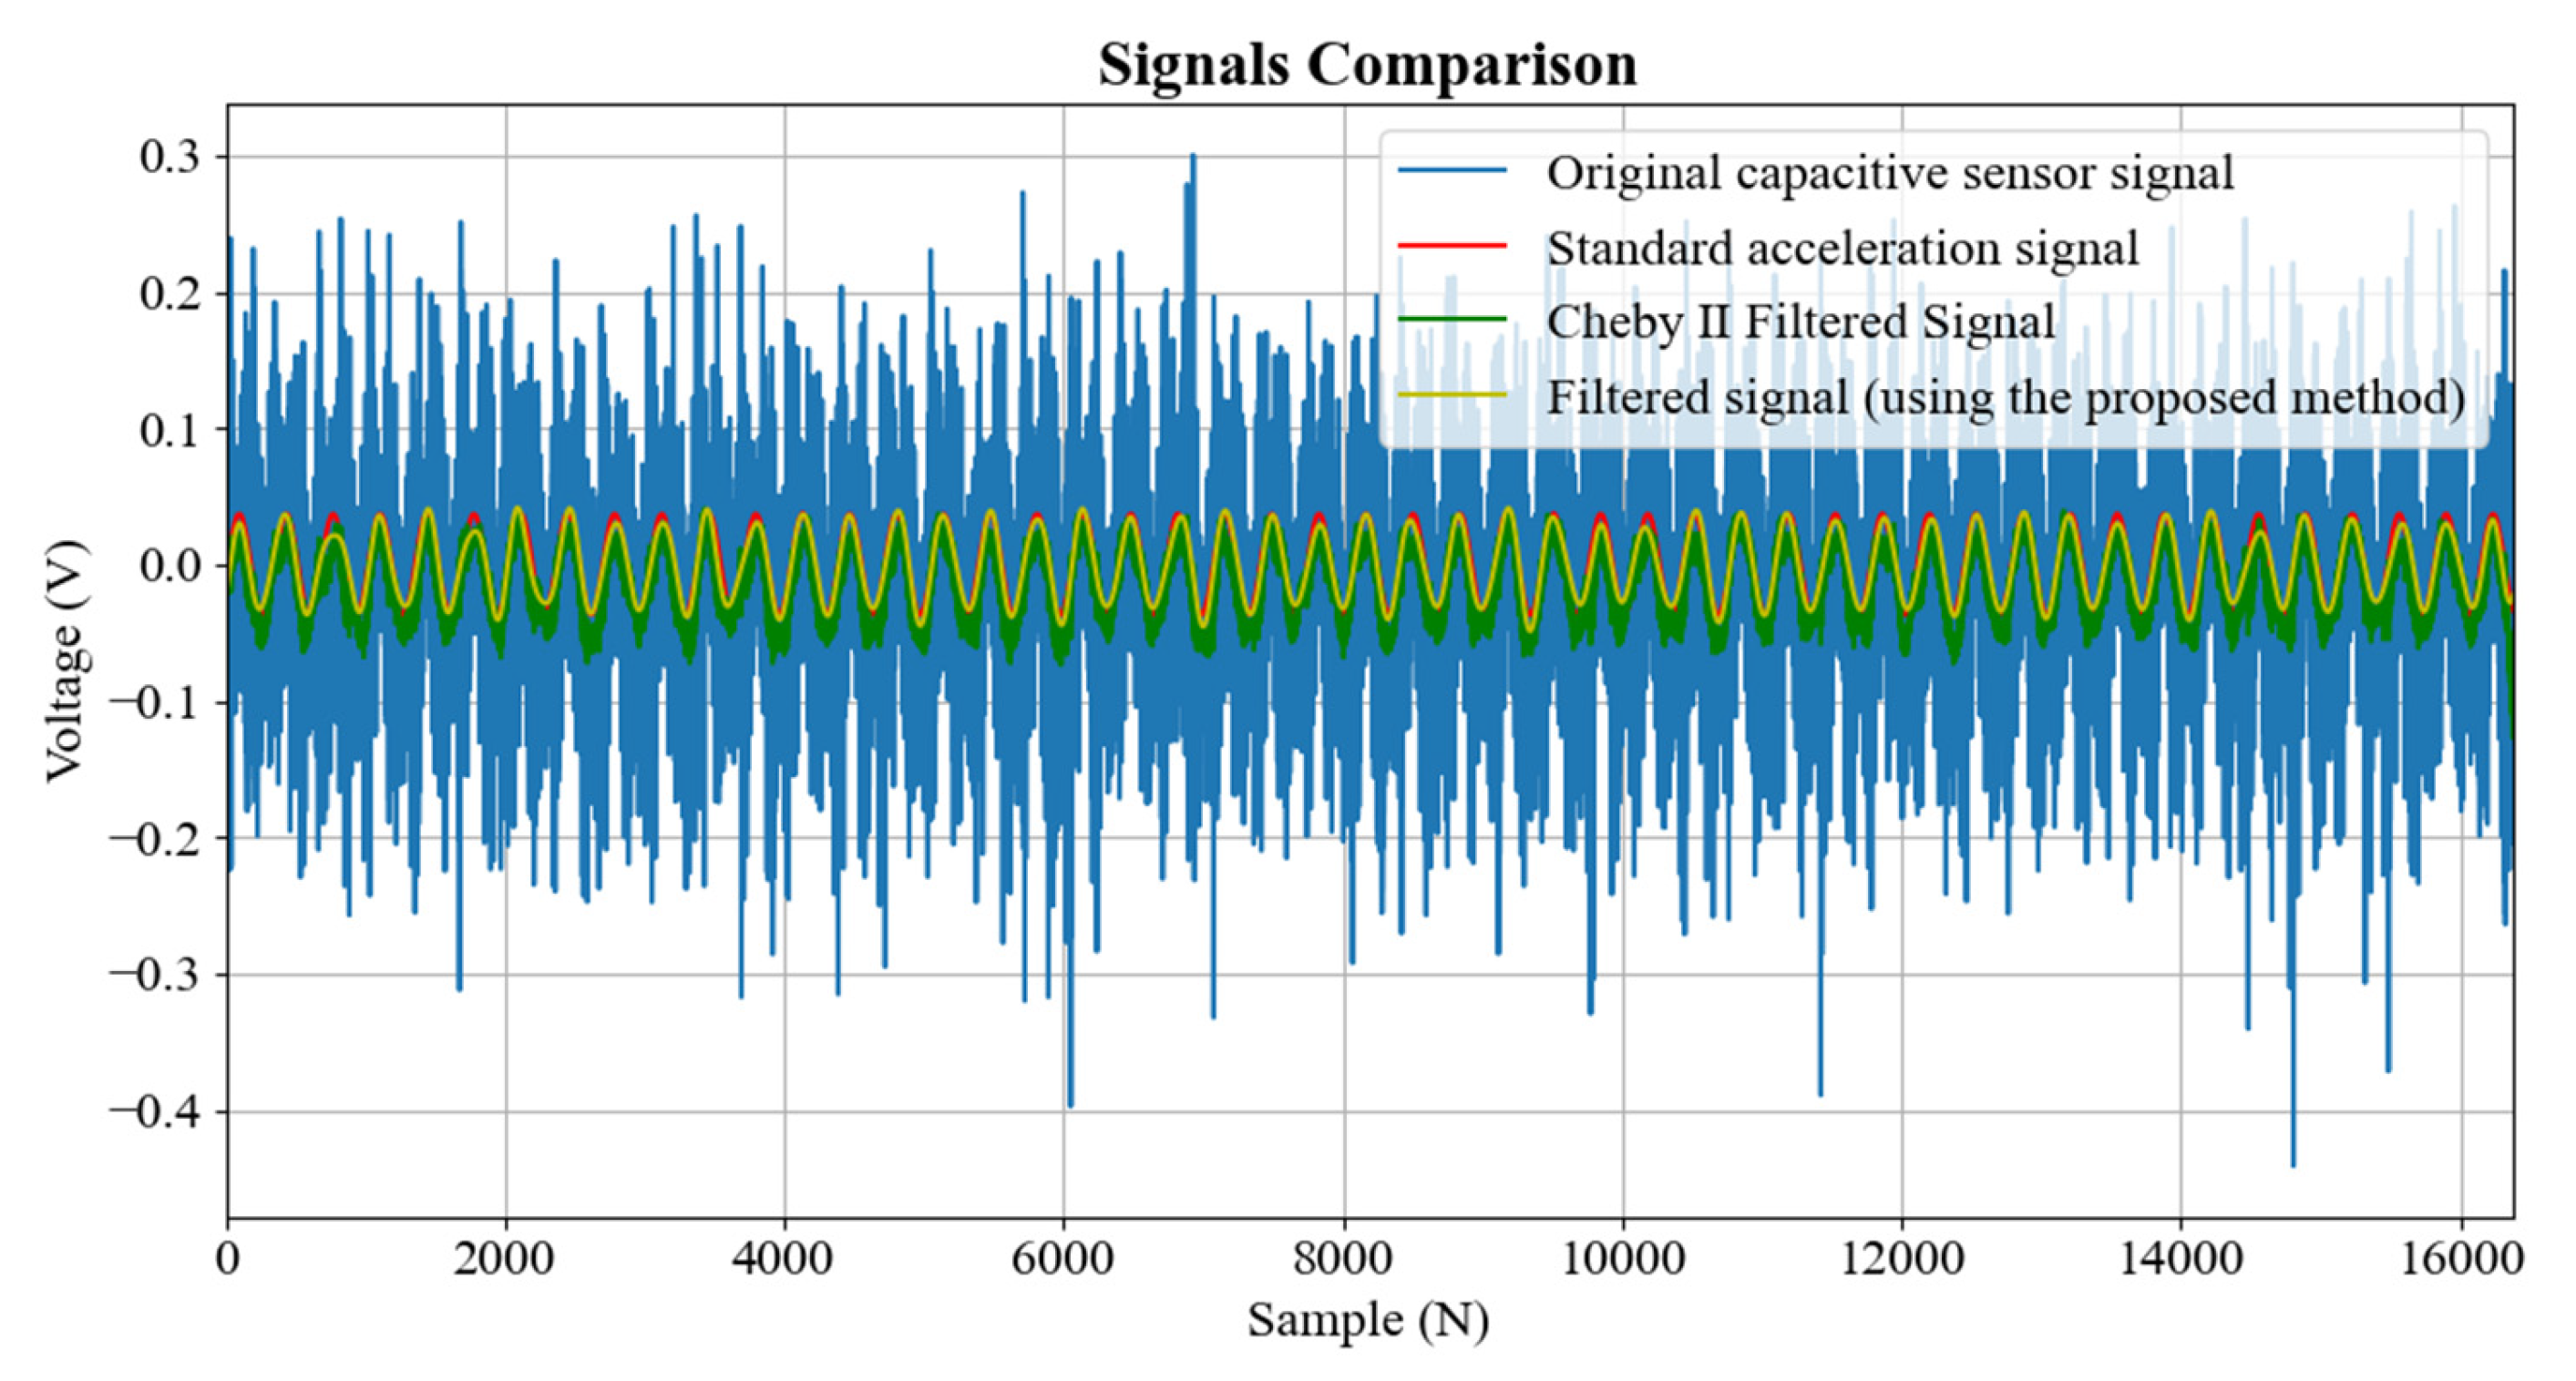
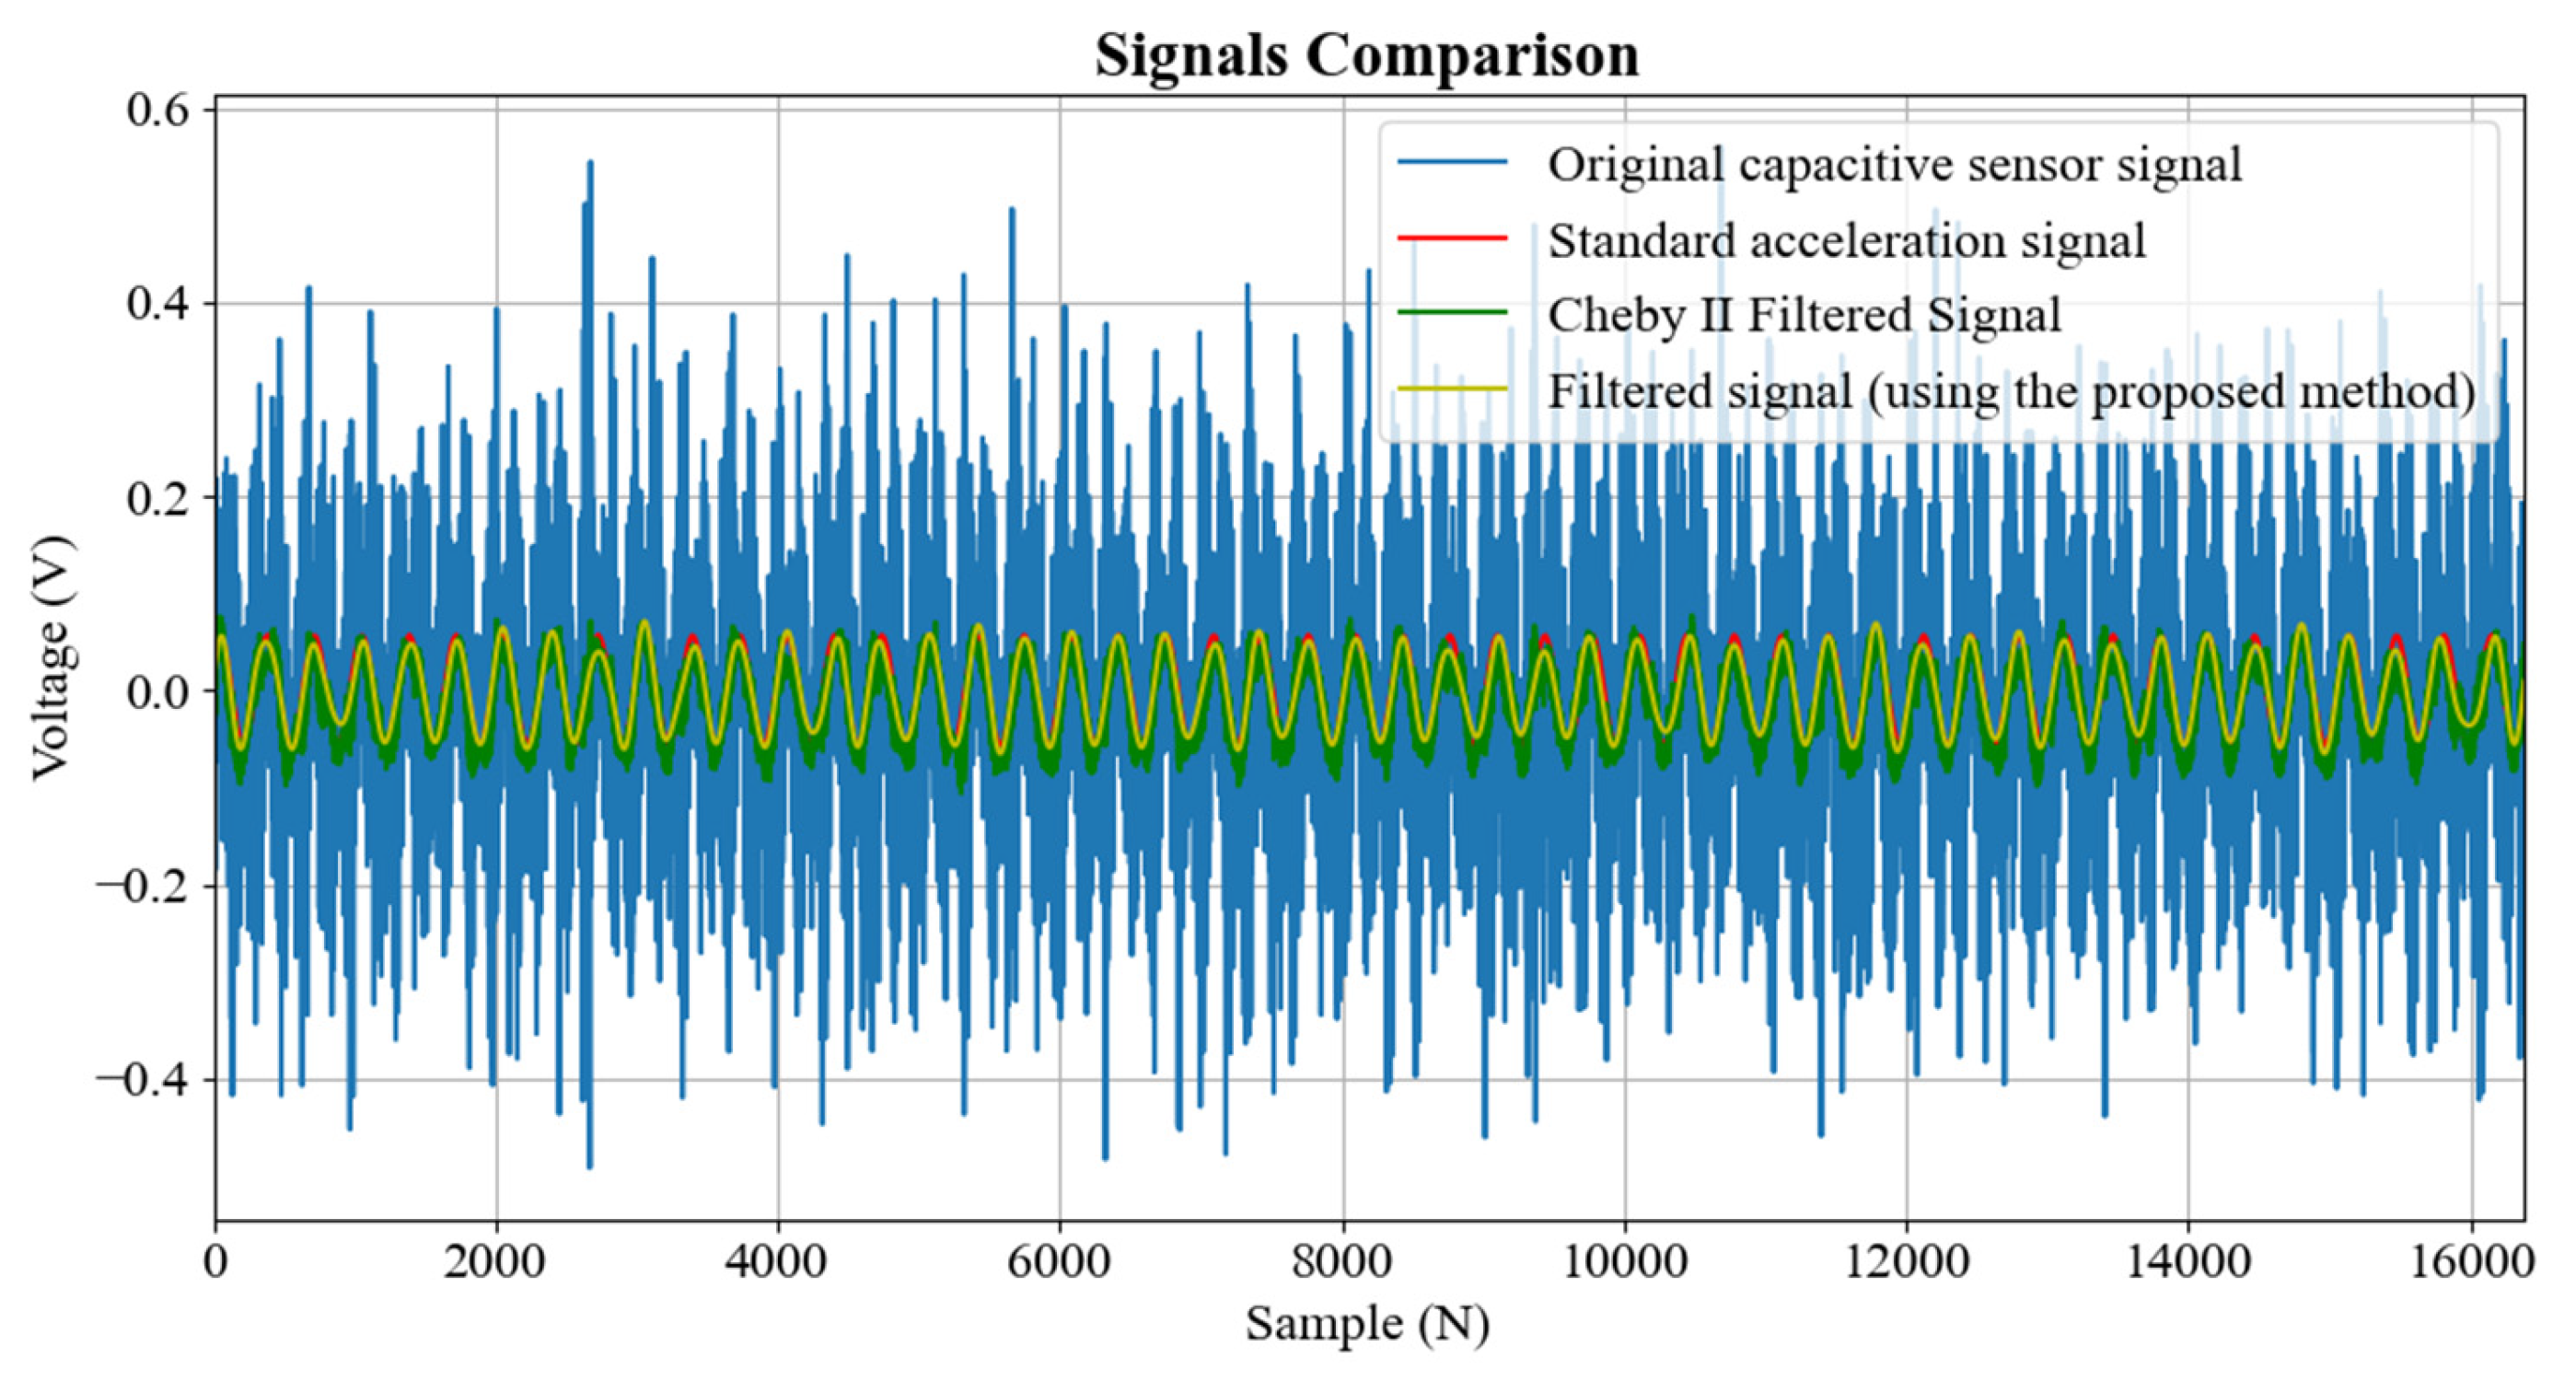
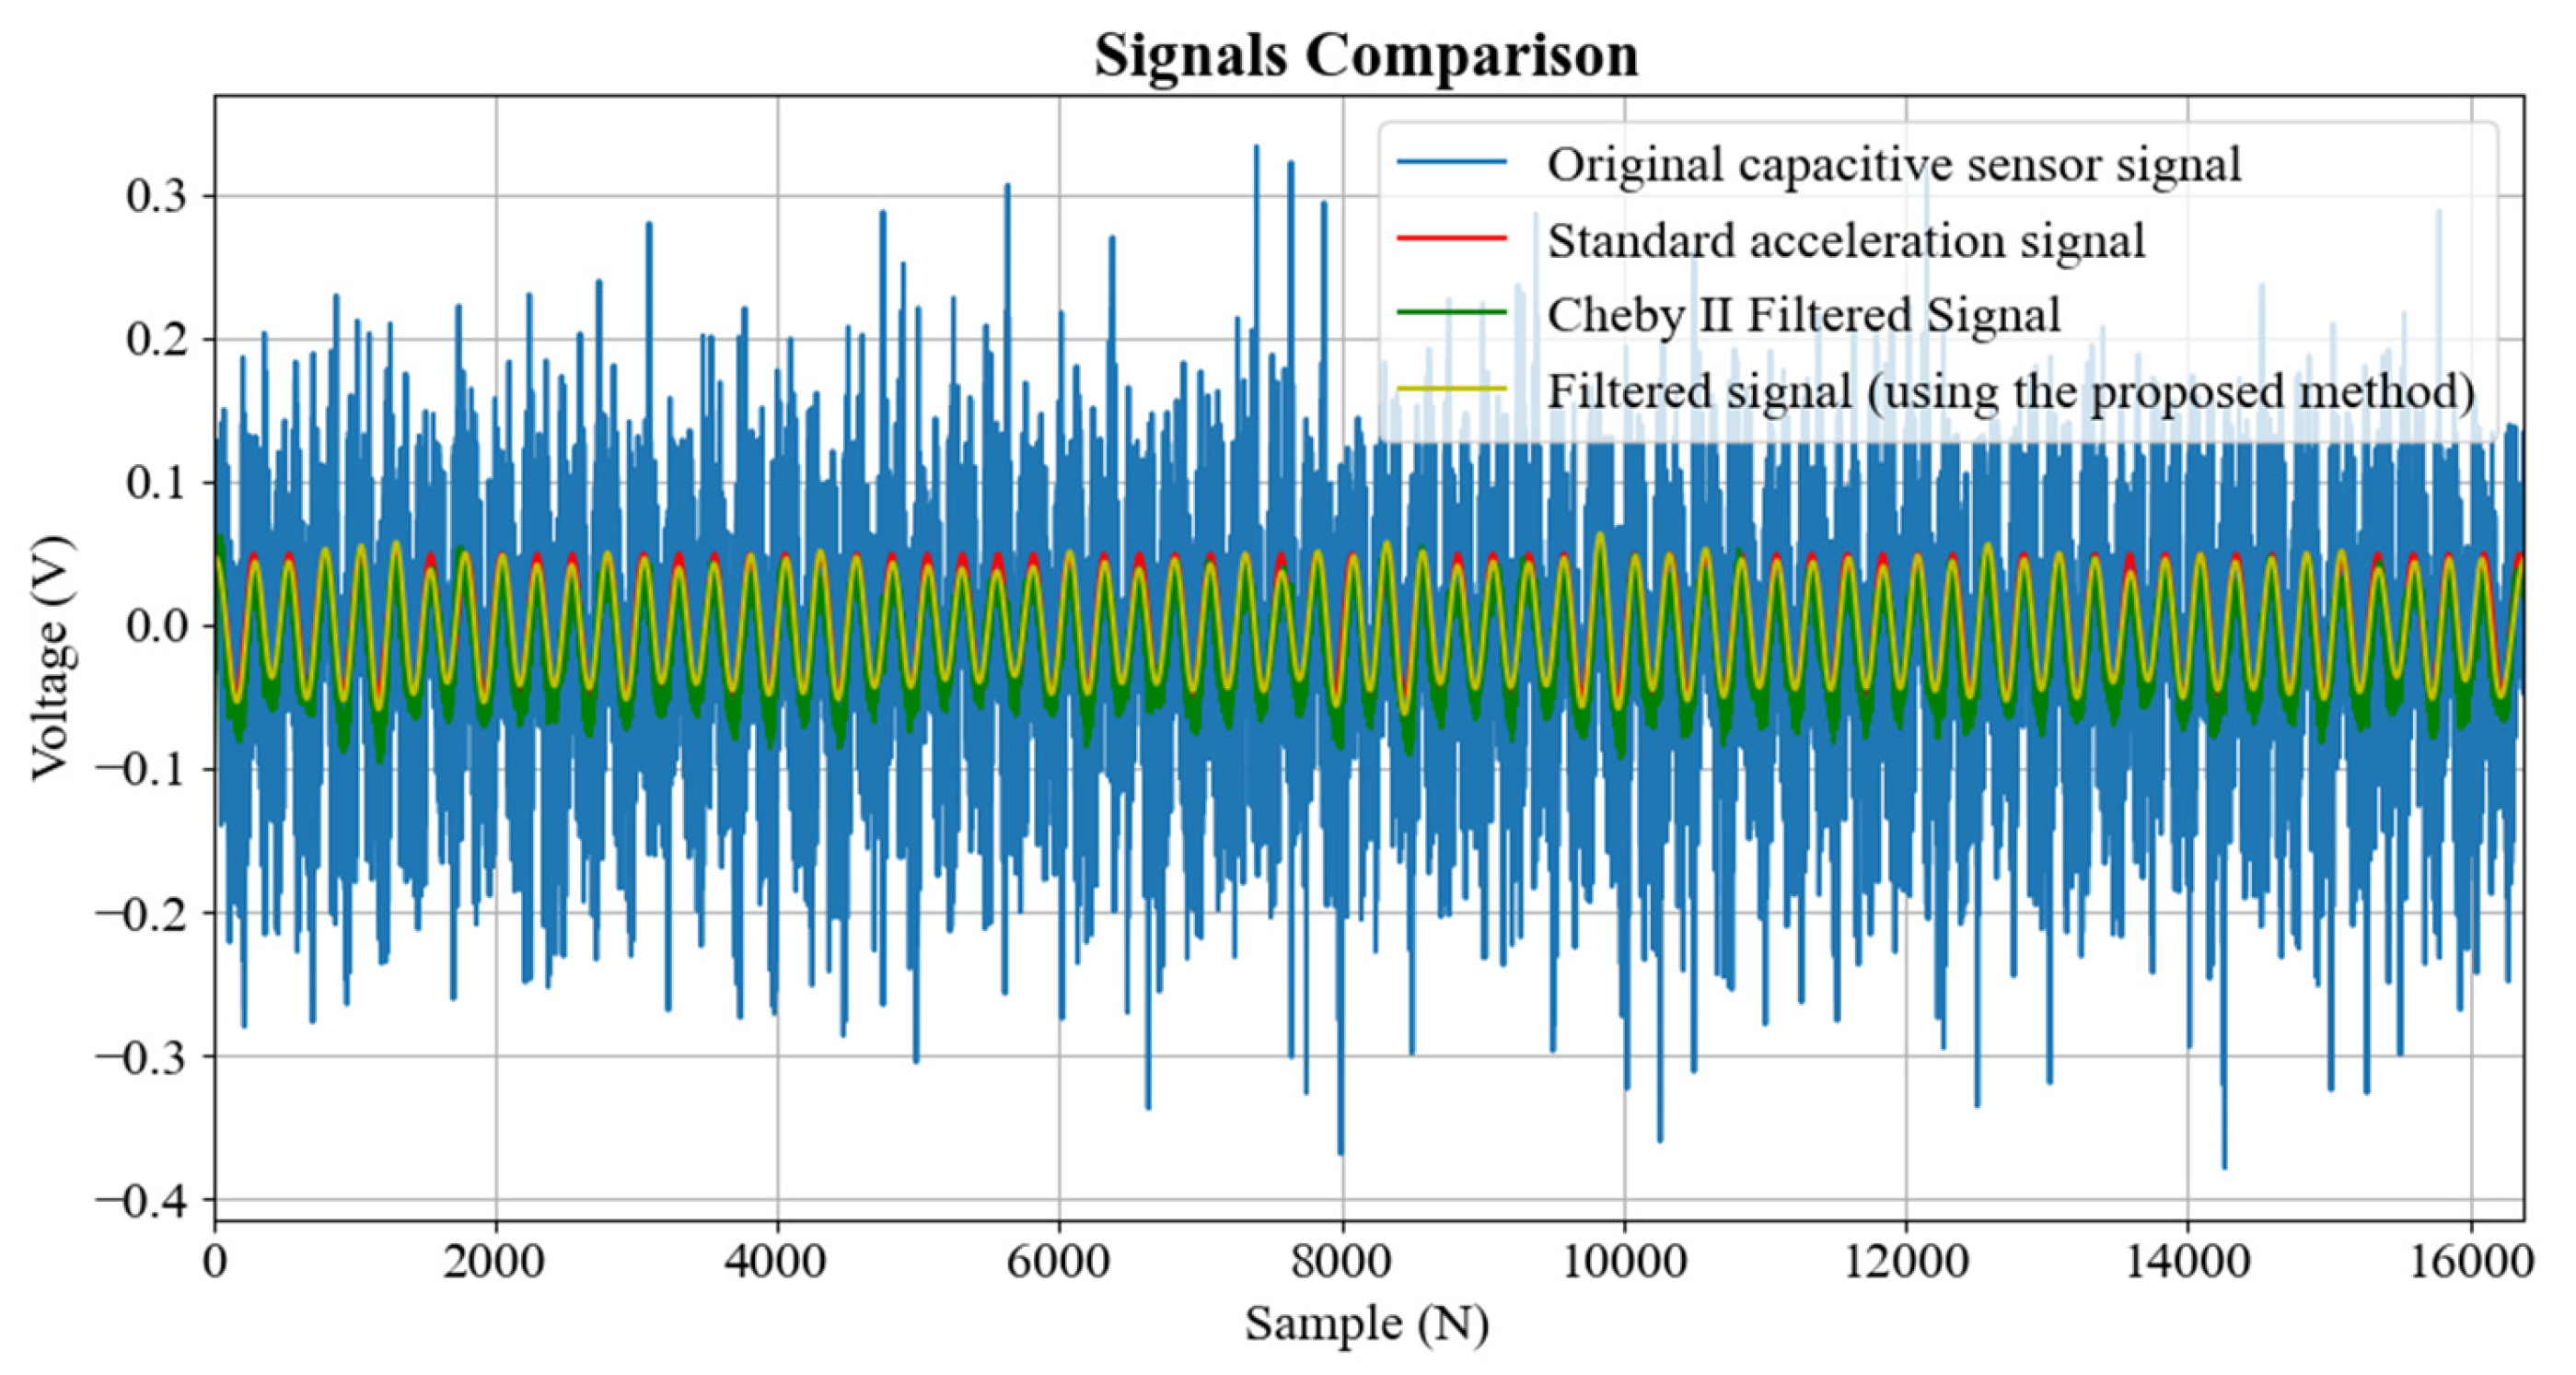
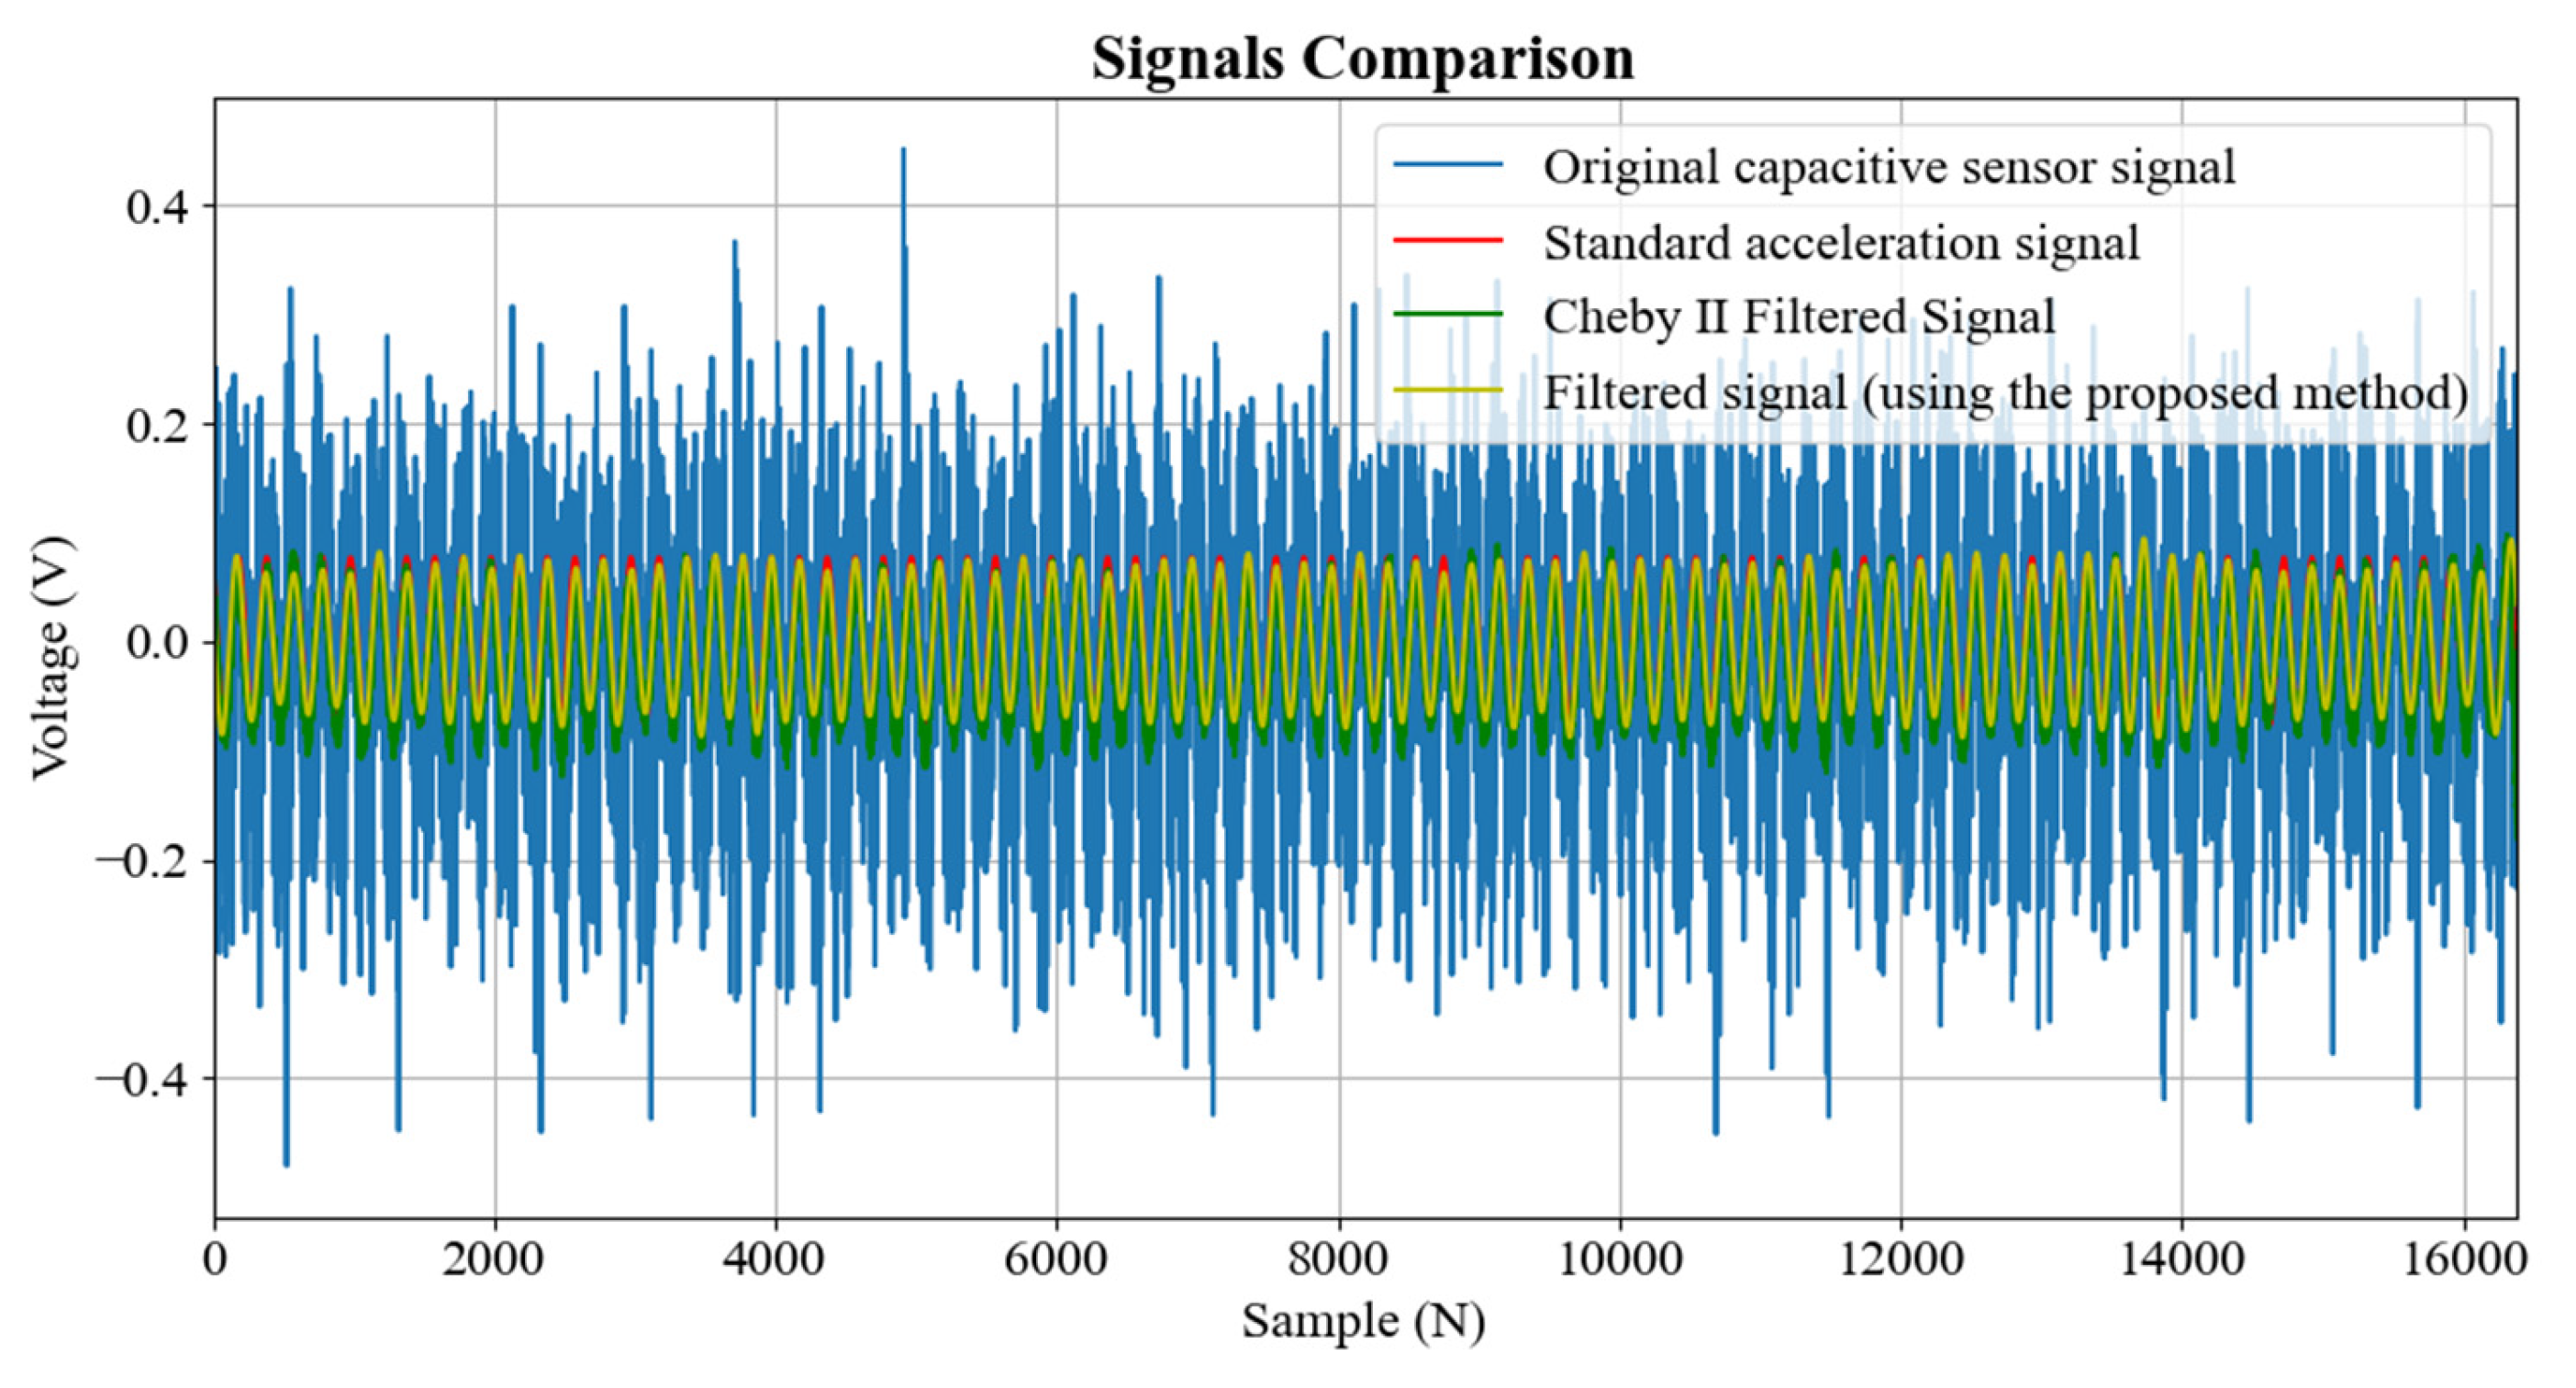
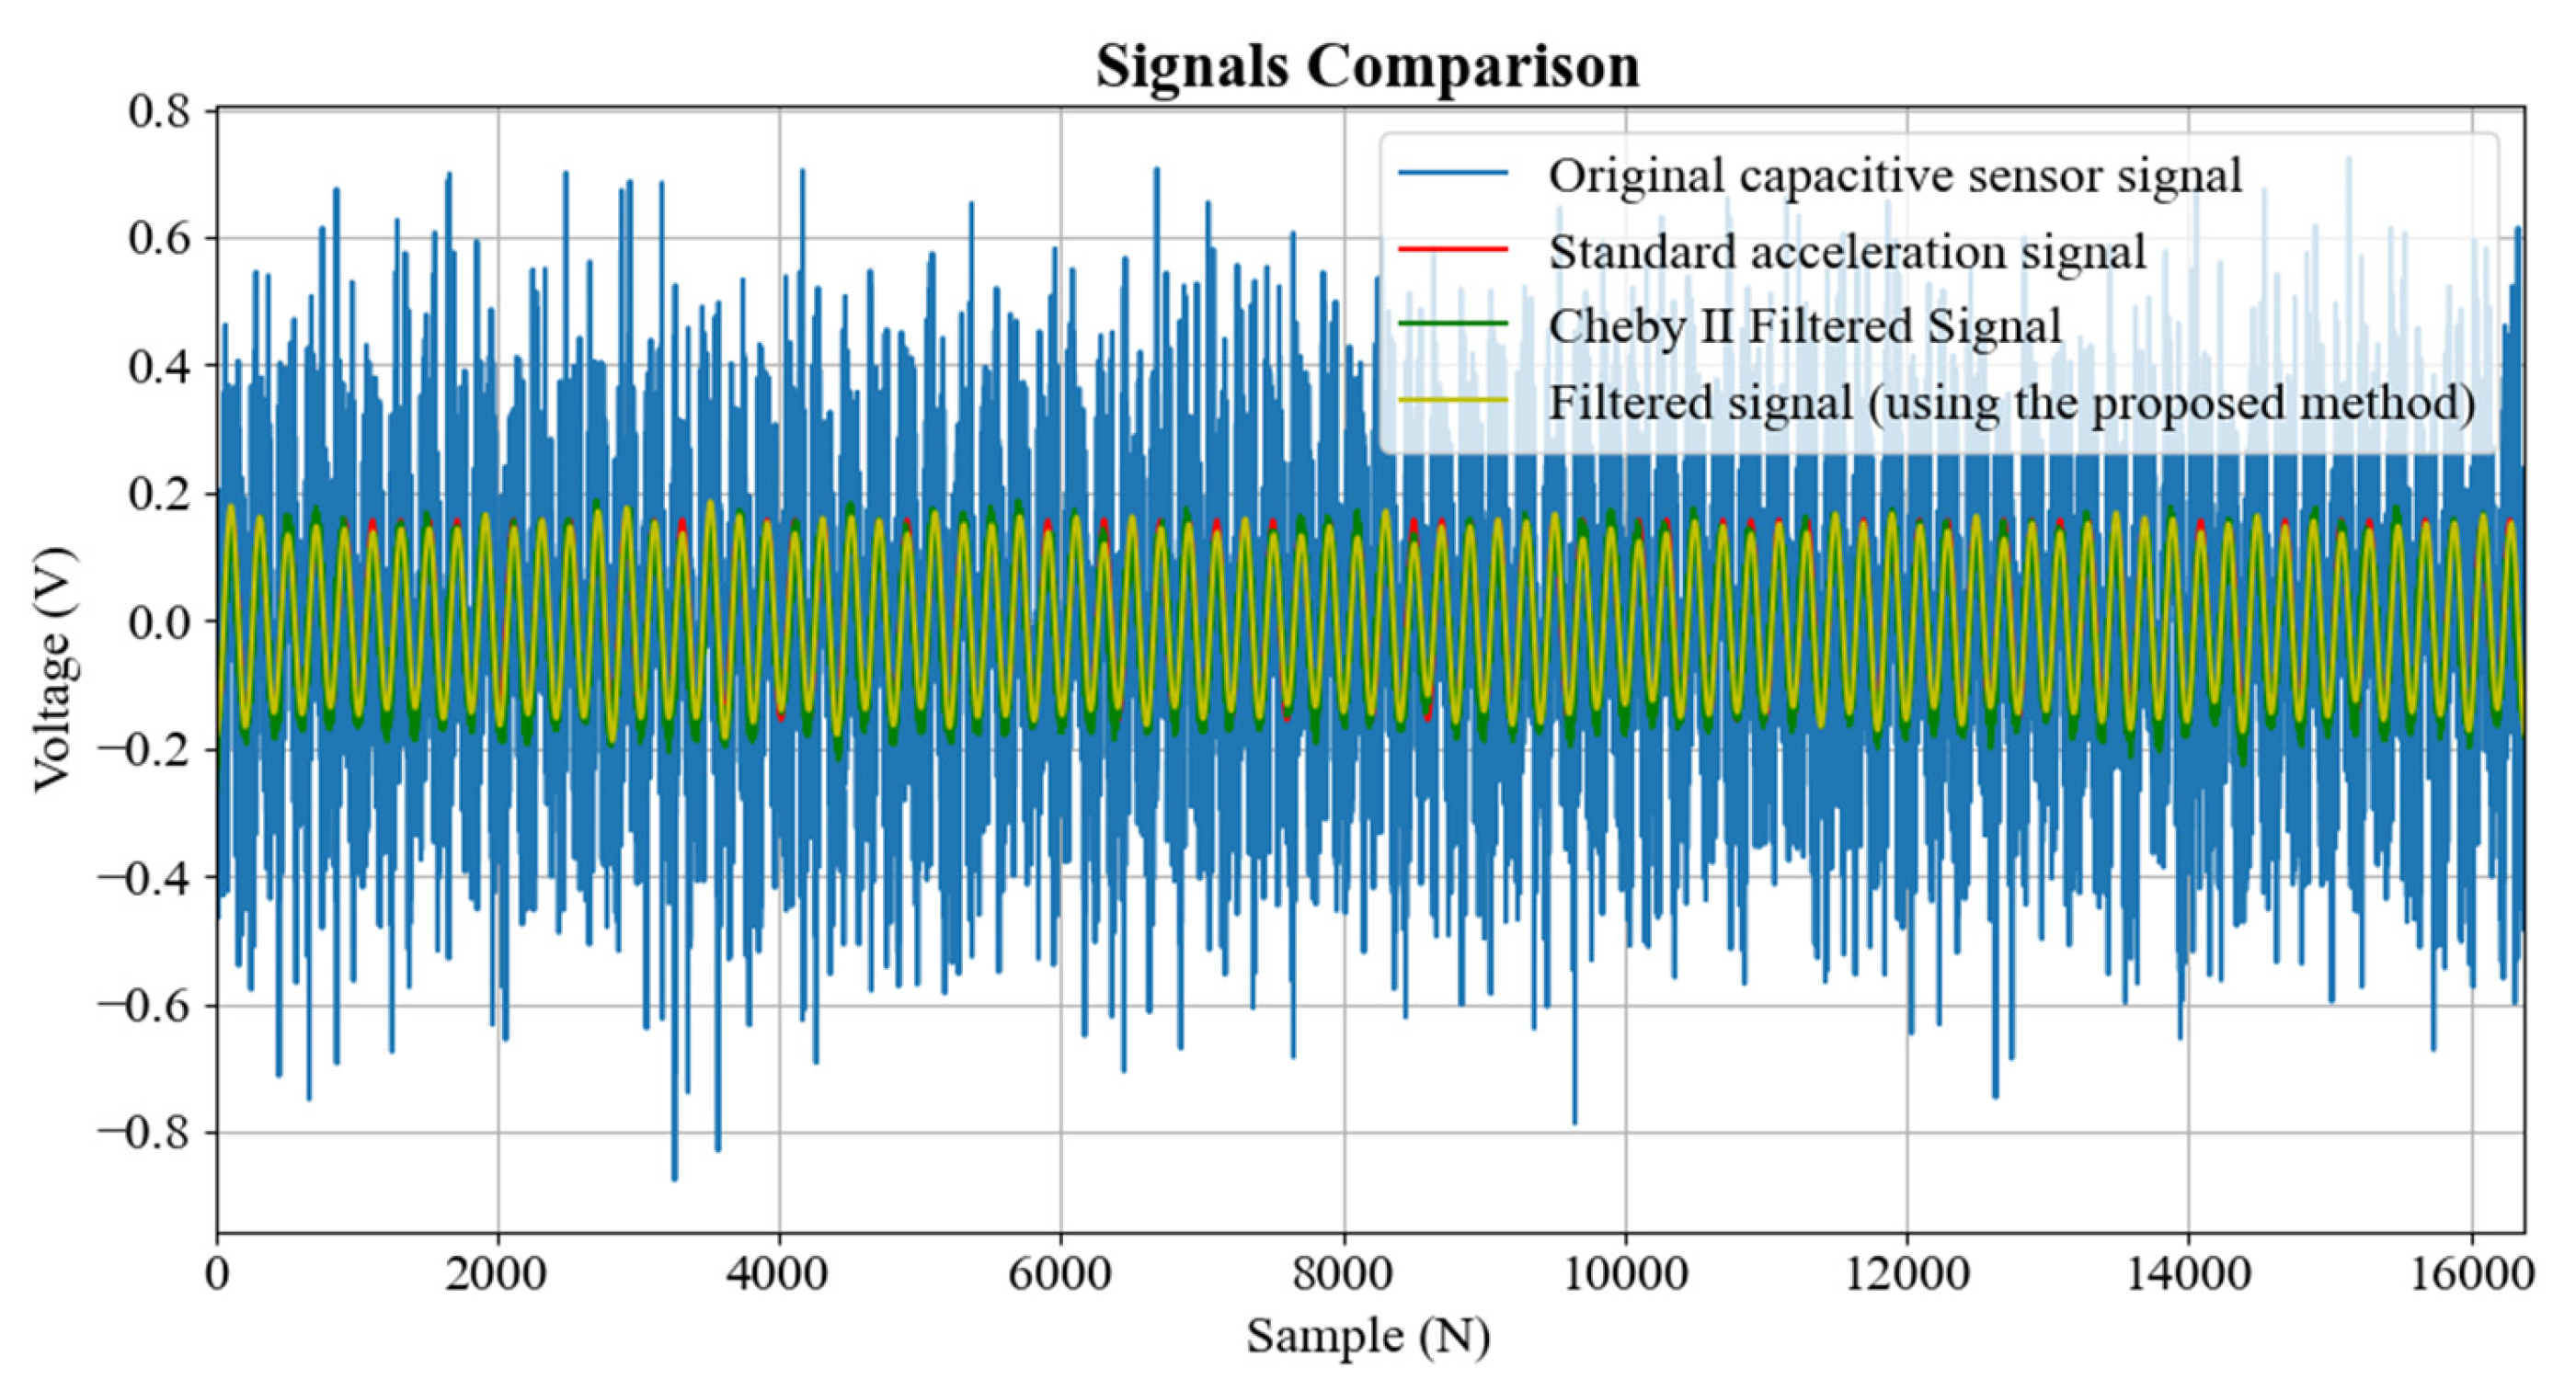
According to these quantitative indicators, we can see that the proposed method is significantly better than the Chebyshev II filter, especially in terms of signal noise suppression and accuracy retention and can better meet the needs of practical applications. In order to see the filtering performance of the proposed method in acceleration signals of different frequencies and amplitudes in more detail, we show the filtering results of different frequencies [0.2 Hz, 0.3 Hz, 0.4 Hz, 0.5 Hz] and different amplitudes [±75 mm, ±100 mm, ±150 mm], as shown in Figure 11, Figure 12, Figure 13, Figure 14, Figure 15, Figure 16, Figure 17, Figure 18, Figure 19, Figure 20 and Figure 21.
The filtering results of acceleration signals with different frequencies and amplitudes uniformly use MSE and correlation coefficient as performance indicators. The results are shown in Table 4. The formula for MSE (Mean Squared Error) is as follows:
M S E = 1 N i = 1 N ( y i y ^ i ) 2
where
N is the number of sample points.
y i is the standard signal.
y ^ i is the filtered signal.
The Chebyshev II filter plays a role in signal noise suppression, but the filtering effect is poor when processing ultra-low frequency and small amplitude signals (such as 0.2 Hz/±75 mm). The signal after Chebyshev II filtering still has a lot of noise, resulting in a high MSE and a low correlation coefficient. Although the Chebyshev II filter can effectively smooth the signal, its accuracy and noise suppression capabilities are difficult to meet the highly precise requirements in ultra-low frequency signals. Especially in areas that require strict precision control such as ocean engineering measurement and control, its application has certain limitations.
The proposed filtering method shows better performance than the Chebyshev II filter under all frequency and amplitude conditions. This method can effectively reduce the noise in the signal, especially in ultra-low frequency and small amplitude signals. The filtered signal is almost the same as the standard signal, the MSE is close to zero, and the correlation coefficient is close to 1. Even under high-amplitude signal conditions (such as ±150 mm), this method can still maintain a low MSE and a high correlation coefficient, showing strong accuracy retention and noise suppression capabilities. Therefore, the proposed filtering method has higher applicability and advantages in application scenarios with high accuracy requirements, especially in acceleration signal processing, measurement and control in the ocean engineering field.

5. Results and Discussion

This paper proposes a low-frequency component filtering method for heave acceleration signal of marine ships, and the theme revolves around how to filter the low-frequency acceleration signal of a ship. Starting from the P–M spectrum, the article roughly determines the frequency range of the ship heave motion according to the wave main frequency range. It explains why the low-frequency components in the ship heave acceleration signal should be filtered. Then, various types of classic filters and their frequency responses are listed and introduced, and the defects of the filters in phase error and peak-to-peak error are pointed out. Next, a low-cost embedded data acquisition module is used, and based on its low sampling frequency, a low-frequency component filtering method for heave acceleration signal of marine ships is proposed. This method can not only filter out the low-frequency component of the ship acceleration signal but also collect the signal at a low sampling frequency.
The advantage of this method is that it can accurately collect low-frequency acceleration signals of ships and has a reliable filtering effect in the ultra-low frequency range of the 0.2 Hz to 0.5 Hz. Moreover, the cost of analog-to-digital conversion is greatly reduced through the embedded data acquisition module, but this will also cause the sampling frequency to drop to 100 Hz. Through digital frequency domain filtering, not only can eliminate the influence of low sampling frequency but can also avoid the phase error and peak-to-peak error in traditional filters.
The disadvantage of this method is that the large number of samples required for FFT is delayed in the calculation of the digital filtering step, which will introduce delays in the filtering process of real-time engineering signals. Moreover, this method has only been demonstrated in the laboratory, and we only use sine motion platform to simulate the motion of marine ships.
In future work, we will measure the six-degree-of-freedom composite motion signal and transfer the experimental environment to a ship in real sea conditions to measure the irregular wave motion of the ship. However, finding a verification standard in the ocean environment is still the biggest obstacle for us. Because the motion measurement of a ship in the ocean is an absolute measurement, it is difficult to find a reference for verification. We sincerely invite fellow scholars to email us and explore together.

6. Conclusions

This study proposes a low-frequency component filtering method for ship heave acceleration signals.
(1)
It can effectively process ultra-low frequency, small amplitude signals of 0.2 Hz–0.5 Hz and maintain high-precision acquisition under low sampling frequency conditions.
(2)
This method outperforms the traditional Chebyshev II filter in terms of filtering performance, mean square error (MSE) and correlation coefficient, especially in ultra-low frequency signals.
(3)
By using digital frequency domain filtering, the phase error and peak-to-peak error of the traditional filter are overcome, while the cost of analog-to-digital conversion is reduced.
It provides a feasible new method for low-frequency acceleration signal acquisition and filtering, which has important reference value for marine engineering measurement and control and similar high-precision, low-frequency signal processing scenarios, and has significant engineering application potential and promotion value.

Author Contributions

Conceptualization, D.S., C.H., X.H.; writing—original draft preparation, D.S., C.H.; writing—review and editing, D.S., X.H., X.C.; funding acquisition, D.S., X.H. All authors have read and agreed to the published version of the manuscript.

Funding

This research was funded by the National Natural Science Foundation of China, grant number 31300783.

Data Availability Statement

The data presented in this study is available on request from the corresponding author due to data sensitivity.

Conflicts of Interest

The authors declare no conflicts of interest.

Abbreviations

All abbreviations used in this article are listed in the following:
P-M spectrumPierson–Moskowitz spectrum
PCIPeripheral Component Interconnect
FFTFast Fourier Transform
DFTDiscrete Fourier Transform
TCPTransmission Control Protocol
MSEMean Squared Error

References

  1. Han, C.; Hu, X. An Absolute Displacement Measurement Method and Its Application in Ship Motion Measurement. J. Mar. Sci. Eng. 2023, 11, 931. [Google Scholar] [CrossRef]
  2. Han, C.; Hu, X.; Sun, D. The Influence of Ship Roll and Pitch on Absolute Measurement of Ship Heave Signals and Its Correction Method. Ocean Eng. 2025, 322, 120468. [Google Scholar] [CrossRef]
  3. Sawane, M.; Prasad, M. MEMS Piezoelectric Sensor for Self-Powered Devices: A Review. Mater. Sci. Semicond. Process. 2023, 158, 107324. [Google Scholar] [CrossRef]
  4. Preeti, M.; Guha, K.; Baishnab, K.L.; Sastry, A. Design and Analysis of a Capacitive MEMS Accelerometer as a Wearable Sensor in Identifying Low-Frequency Vibration Profiles. In Modern Techniques in Biosensors: Detection Methods and Commercial Aspects; Springer: Singapore, 2021; pp. 37–61. [Google Scholar]
  5. Singh, S.K.; Banerjee, B.P.; Lato, M.J.; Sammut, C.; Raval, S. Automated Rock Mass Discontinuity Set Characterisation Using Amplitude and Phase Decomposition of Point Cloud Data. Int. J. Rock Mech. Min. Sci. 2022, 152, 105072. [Google Scholar] [CrossRef]
  6. Liu, F.; Gao, S.; Chang, S. Displacement Estimation from Measured Acceleration for Fixed Offshore Structures. Appl. Ocean Res. 2021, 113, 102741. [Google Scholar] [CrossRef]
  7. Rahimi, H.; Nikkhah, A.A.; Hooshmandi, K. A Fast Alignment of Marine Strapdown Inertial Navigation System Based on Adaptive Unscented Kalman Filter. Trans. Inst. Meas. Control 2021, 43, 749–758. [Google Scholar] [CrossRef]
  8. Teodoro, M.F.; Pereira, C.; Henriques, P.; Canas, A. Prediction of Ship Movement Using a Kalman Filter Algorithm. Adv. Sci. Technol. 2024, 144, 93–100. [Google Scholar] [CrossRef]
  9. Song, K.-S.; Kim, S.-M.; Kwak, M.K.; Zhu, W. Development of a Control Algorithm for Active Control of Rolling Motion of a Ship Using a Gyrostabilizer. Ocean Eng. 2023, 280, 114669. [Google Scholar] [CrossRef]
  10. Majidiyan, H.; Enshaei, H.; Howe, D. Augmented Adaptive Filter for Real-Time Sea State Estimation Using Vessel Motions through Deep Learning. In Proceedings of the International Conference on Offshore Mechanics and Arctic Engineering, Melbourne, Australia, 11–15 June 2023; American Society of Mechanical Engineers: New York, NY, USA, 2023; Volume 86878, p. V005T06A069. [Google Scholar]
  11. Jakovlev, S.; Eglynas, T.; Voznak, M.; Jusis, M.; Partila, P.; Tovarek, J.; Jankunas, V. Detecting Shipping Container Impacts with Vertical Cell Guides inside Container Ships during Handling Operations. Sensors 2022, 22, 2752. [Google Scholar] [CrossRef] [PubMed]
  12. Bossau, J.C.; Bekker, A. Line Detection Techniques to Pinpoint Slamming Impulses in Time-Frequency Images of Hull Acceleration Measurements. Ocean Eng. 2022, 249, 110841. [Google Scholar] [CrossRef]
  13. Chen, X.; Wu, H.; Han, B.; Liu, W.; Montewka, J.; Liu, R.W. Orientation-aware ship detection via a rotation feature decoupling supported deep learning approach. Eng. Appl. Artif. Intell. 2023, 125, 106686. [Google Scholar] [CrossRef]
  14. Guo, R.; Xiao, G.; Zhang, C.; Li, Q. A study on influencing factors of port cargo throughput based on multi-scale geographically weighted regression. Front. Mar. Sci. 2025, 12, 1637660. [Google Scholar] [CrossRef]
  15. Xiao, G.; Amamoo-Otoo, C.; Wang, T.; Li, Q.; Biancardo, S.A. Evaluating the impact of ECA policy on sulfur emissions from the five busiest ports in America based on difference in difference model. Front. Mar. Sci. 2025, 12, 1609261. [Google Scholar] [CrossRef]
  16. Fossen, T.I. Line-of-Sight Path-Following Control Utilizing an Extended Kalman Filter for Estimation of Speed and Course over Ground from GNSS Positions. J. Mar. Sci. Technol. 2022, 27, 806–813. [Google Scholar] [CrossRef]
  17. Han, C.; Hu, X. A Prediction Method of Ship Motion Based on LSTM Neural Network with Variable Step-Variable Sampling Frequency Characteristics. J. Mar. Sci. Eng. 2023, 11, 919. [Google Scholar] [CrossRef]
  18. Han, H.; Jeon, S.; Kim, Y.; Lee, C.; Lee, D.; Lee, G.; Lee, S. Monitoring of the Cavitation Inception Speed and Sound Pressure Level of the Model Propeller Using Accelerometer Attached to the Model Ship in the Cavitation Tunnel. Ocean Eng. 2022, 266, 112906. [Google Scholar] [CrossRef]
  19. Jakovlev, S.; Voznak, M. Auto-Encoder-Enabled Anomaly Detection in Acceleration Data: Use Case Study in Container Handling Operations. Machines 2022, 10, 734. [Google Scholar] [CrossRef]
  20. Murgano, E.; Caponetto, R.; Pappalardo, G.; Cafiso, S.D.; Severino, A. A Novel Acceleration Signal Processing Procedure for Cycling Safety Assessment. Sensors 2021, 21, 4183. [Google Scholar] [CrossRef]
  21. Ma, Q.; Cui, M.; Li, F.; Zhou, L.; Ding, S. Towards Automatic Identification of Ship-Ice Contact Using Acceleration Measurement. Ocean Eng. 2024, 306, 118038. [Google Scholar] [CrossRef]
  22. Pierson, W.J., Jr.; Moskowitz, L. A Proposed Spectral Form for Fully Developed Wind Seas Based on the Similarity Theory of SA Kitaigorodskii. J. Geophys. Res. 1964, 69, 5181–5190. [Google Scholar] [CrossRef]
  23. Park, M.-H.; Yeo, S.; Choi, J.-H.; Lee, W.-J. Review of noise and vibration reduction technologies in marine machinery: Operational insights and engineering experience. Appl. Ocean Res. 2024, 152, 104195. [Google Scholar] [CrossRef]
  24. Ning, X.; Zhao, J.; Xu, J. The Heave Motion Estimation for Active Heave Compensation System in Offshore Crane. In Proceedings of the 2016 IEEE International Conference on Mechatronics and Automation, Harbin, China, 7–10 August 2016; IEEE: New York, NY, USA, 2016; pp. 1327–1332. [Google Scholar]
  25. Hu, Y.; Tao, L. Real-Time Zero Phase Filtering for Heave Measurement. In Proceedings of the 2013 IEEE 11th International Conference on Electronic Measurement & Instruments, Harbin, China, 16–19 August 2013; IEEE: New York, NY, USA, 2013; Volume 1, pp. 321–326. [Google Scholar]
  26. Ben, Y.; Gao, Q.; Wei, T.; Gong, S.; Li, Q. Real-Time Heave Motion Measurement by Adaptive Band-Pass Filter Based on Strapdown INS. Ocean Eng. 2022, 262, 112278. [Google Scholar] [CrossRef]
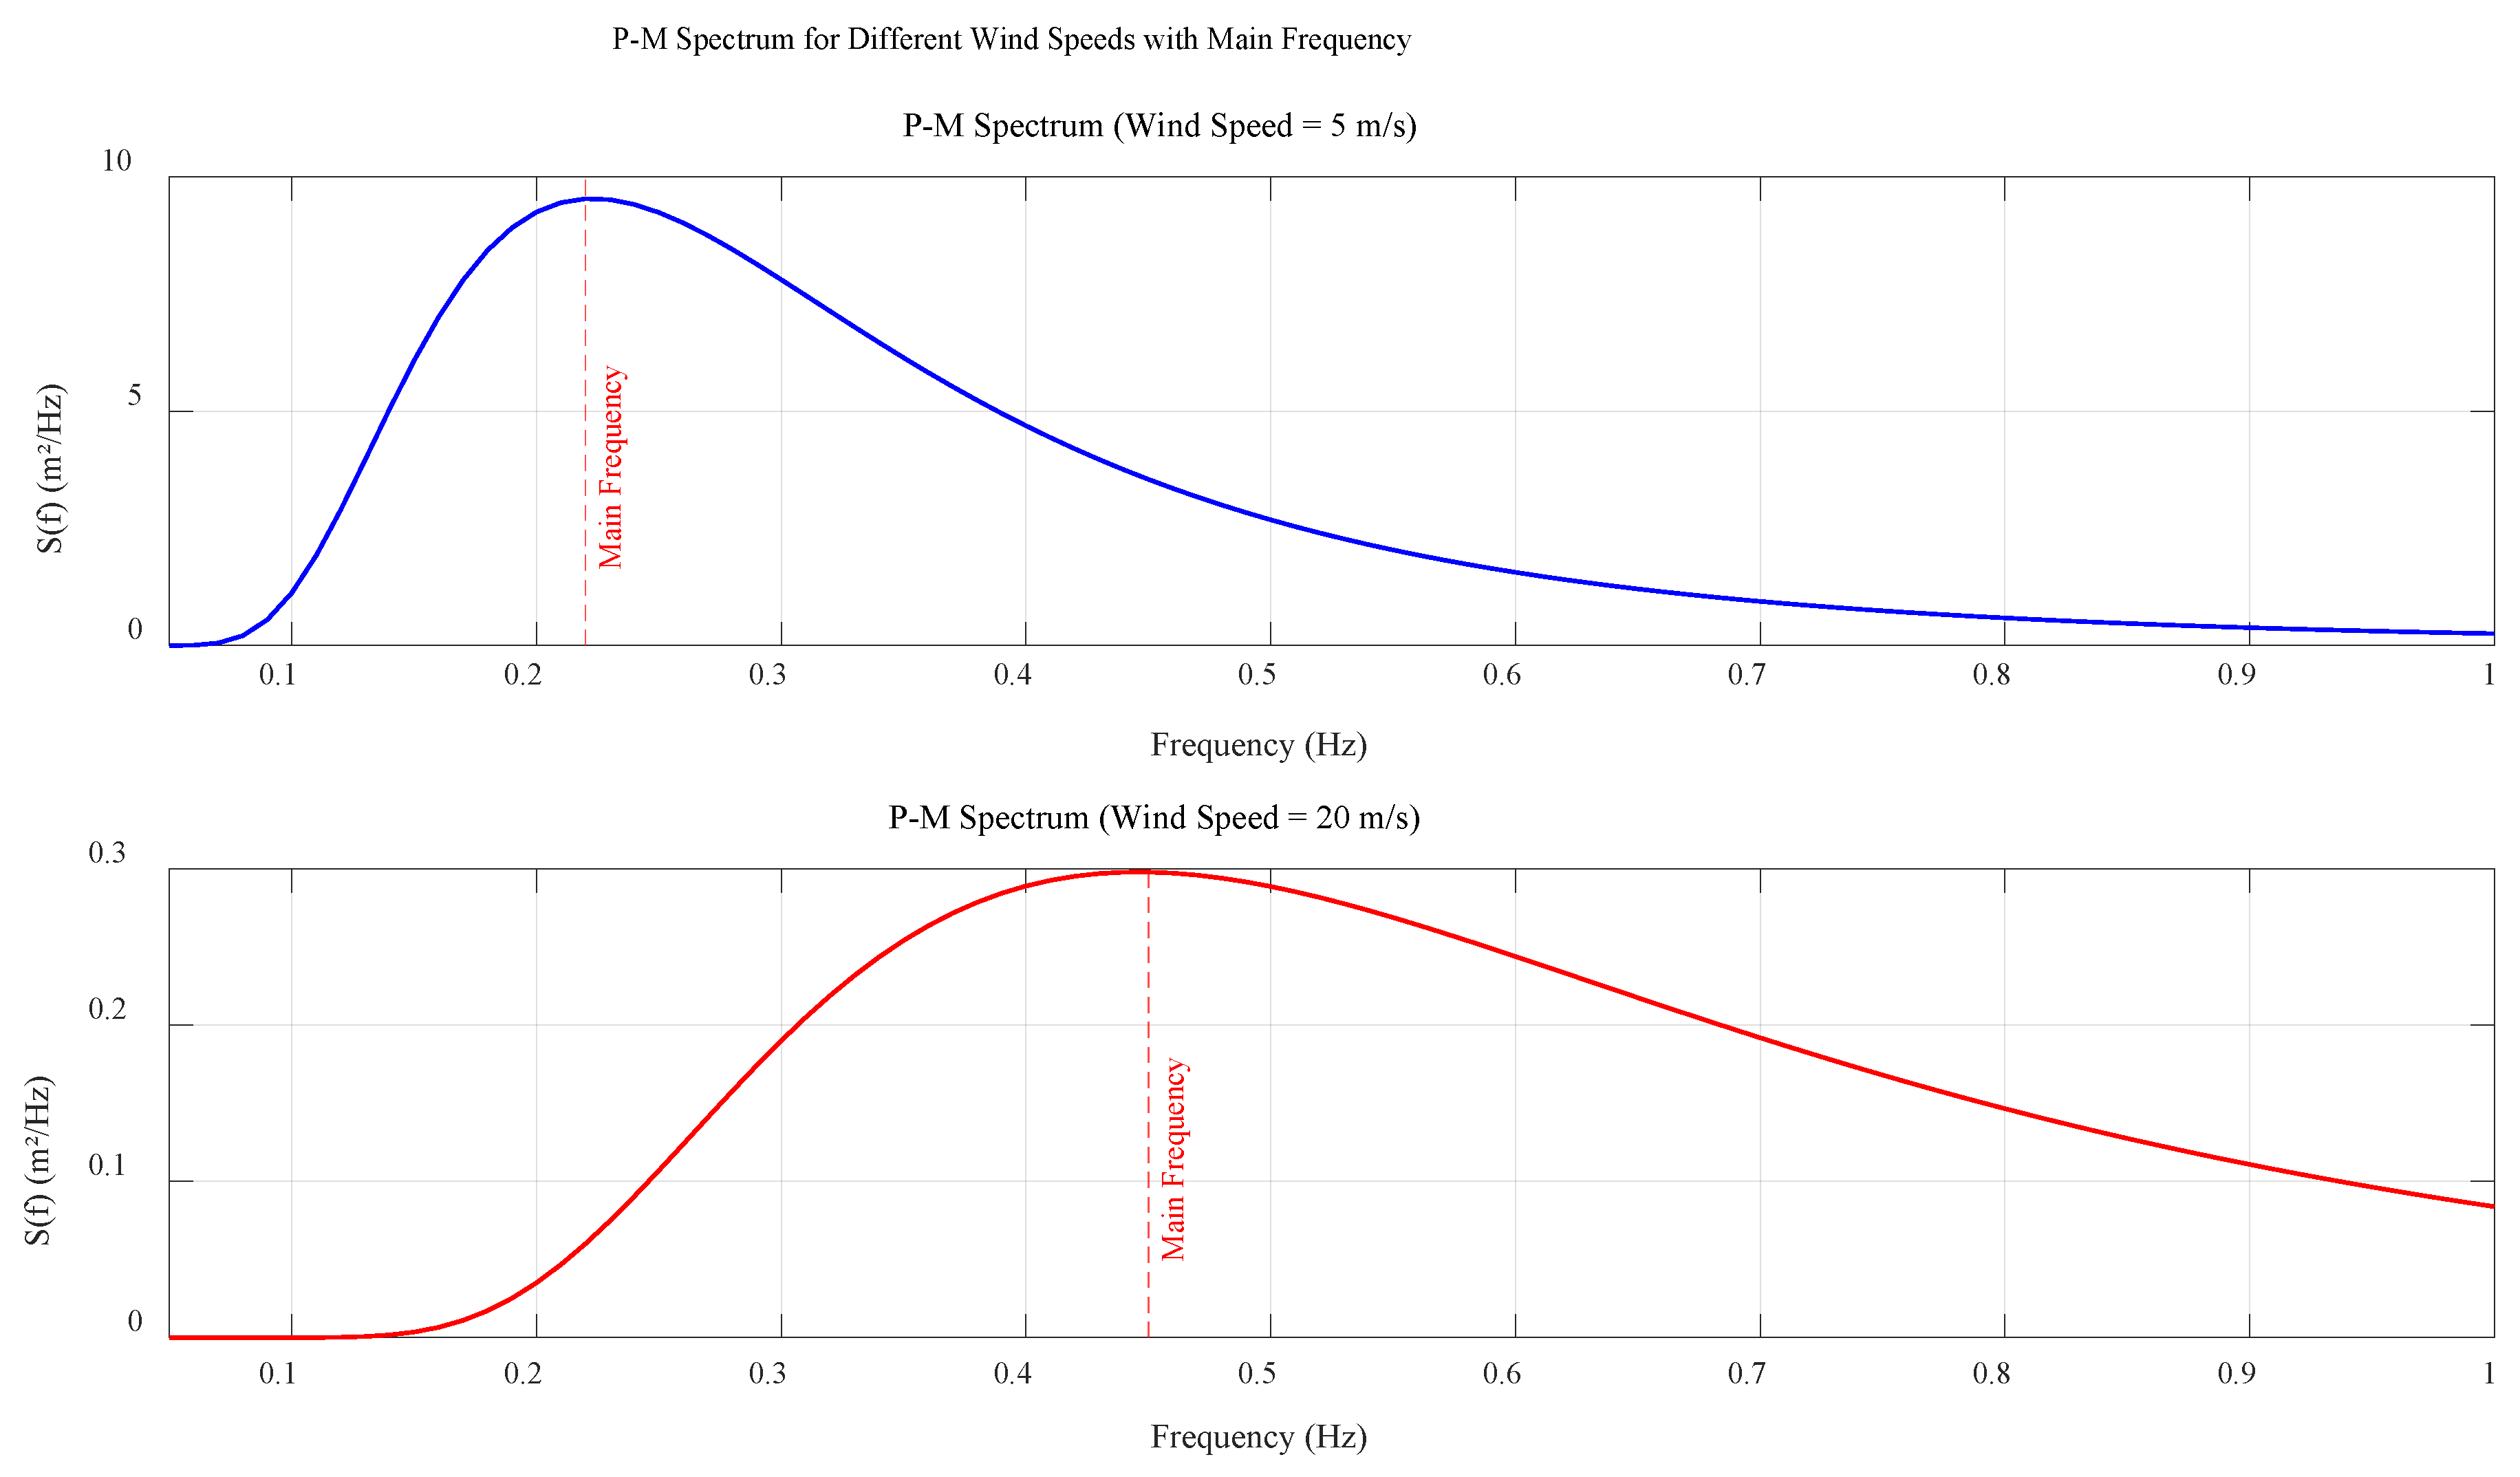
Figure 1. P–M spectrum.
Jmse 13 01919 g001
Figure 2. Frequency response characteristic of each filter.
Jmse 13 01919 g002
Figure 3. Flow chart of a low-frequency component filtering method (Red represents the electrical equipment for each function, and blue represents the steps of the method).
Jmse 13 01919 g003
Figure 4. Model 3711B122G acceleration sensor installation diagram.
Jmse 13 01919 g004
Figure 5. Mechanism schematic of the sine motion platform, the farthest point (a), midpoint (b), and closest point (c).
Jmse 13 01919 g005
Figure 6. Schematic diagram of the signal acquisition system.
Jmse 13 01919 g006
Figure 7. The unit conversion results of all signals collected by the acquisition module.
Jmse 13 01919 g007
Figure 8. The interception processing of the acceleration signal.
Jmse 13 01919 g008
Figure 9. The intercepted IFFT signal and the Kalman-filtered signal.
Jmse 13 01919 g009
Figure 10. The comparison results of filtering method.
Jmse 13 01919 g010
Figure 11. Comparison results of amplitude ±100 mm and frequency 0.2 Hz.
Jmse 13 01919 g011
Figure 12. Comparison results of amplitude ±150 mm and frequency 0.2 Hz.
Jmse 13 01919 g012
Figure 13. Comparison results of amplitude ±75 mm and frequency 0.3 Hz.
Jmse 13 01919 g013
Figure 14. Comparison results of amplitude ±100 mm and frequency 0.3 Hz.
Jmse 13 01919 g014
Figure 15. Comparison results of amplitude ±150 mm and frequency 0.3 Hz.
Jmse 13 01919 g015
Figure 16. Comparison results of amplitude ±75 mm and frequency 0.4 Hz.
Jmse 13 01919 g016
Figure 17. Comparison results of amplitude ±100 mm and frequency 0.4 Hz.
Jmse 13 01919 g017
Figure 18. Comparison results of amplitude ±150 mm and frequency 0.4 Hz.
Jmse 13 01919 g018
Figure 19. Comparison results of amplitude ±75 mm and frequency 0.5 Hz.
Jmse 13 01919 g019
Figure 20. Comparison results of amplitude ±100 mm and frequency 0.5 Hz.
Jmse 13 01919 g020
Figure 21. Comparison results of amplitude ±150 mm and frequency 0.5 Hz.
Jmse 13 01919 g021
Table 1. Model 3711B122G acceleration sensor performance parameter table.
PerformanceEnglishSI
Sensitivity (±5%)1000 mV/g101.9 mV/(m/s2)
Measurement Range±2 g pk+19.6 m/s2 pk
Frequency Range (±5%)0 to 250 Hz0 to 250 Hz
Frequency Range (+10%)0 to 350 Hz0 to 350 Hz
Resonant Frequency≥1.3 kHz≥1.3 kHz
Phase Response (10 Hz)<2.5°<2.5°
Broadband Resolution (0.5 to 100 Hz)0.25 mg rms0.0025 m/s2 rms
Non-Linearity≤1%≤1%
Transverse Sensitivity≤3%≤3%
Table 2. Motion parameters of the sine motion platform.
Motion ParametersRange
Amplitude A[±50 mm, ±150 mm]
Reciprocating frequency f[0.05 Hz, 1 Hz]
Table 3. Experimental equipment table.
EquipmentPurpose
sine motion platformSimulate the heave motion of ships
acceleration sensorMeasuring acceleration signals
ART data acquisition moduleAnalog-to-digital conversion
24 V DC powerPower supply for acquisition module
Wireless routerDigital signal wirelessly transmitted
Table 4. The filtering results of acceleration signals.
Frequency
/
Amplitude
Filtered Signal
(Using Chebyshev II)
Filtered Signal
(Using the Proposed Method)
MSECorrelation CoefficientMSECorrelation Coefficient
0.2 Hz/±75 mm0.000240120.803650280.000006460.95607133
0.2 Hz/±100 mm0.004108150.839075690.003861120.96365433
0.2 Hz/±150 mm0.009223870.829174770.008957780.95203325
0.3 Hz/±75 mm0.000277440.921735870.000015440.98315985
0.3 Hz/±100 mm0.000337310.908360910.000035940.97360001
0.3 Hz/±150 mm0.000465330.906997370.000077440.97523929
0.4 Hz/±75 mm0.000377300.936078220.000044780.98169825
0.4 Hz/±100 mm0.000456270.944009580.000079900.98140774
0.4 Hz/±150 mm0.000667280.948568870.000177950.98232436
0.5 Hz/±75 mm0.000416600.965366330.000110060.98145660
0.5 Hz/±100 mm0.000581840.965320770.000249930.97599686
0.5 Hz/±150 mm0.000833540.970825880.000259920.98946692
Disclaimer/Publisher’s Note: The statements, opinions and data contained in all publications are solely those of the individual author(s) and contributor(s) and not of MDPI and/or the editor(s). MDPI and/or the editor(s) disclaim responsibility for any injury to people or property resulting from any ideas, methods, instructions or products referred to in the content.