Article

Source-to-Sink Transport Processes of Floating Marine Macro-Litter in the Bohai Sea and Yellow Sea (BYS)

1
Key Laboratory of Sustainable Development of Marine Fisheries, Ministry of Agriculture and Rural Affairs, Yellow Sea Fisheries Research Institute, Chinese Academy of Fishery Sciences, Qingdao 266071, China
2
Shandong Changdao Fishery Resources National Field Observation and Research Station, Yantai 265800, China
3
First Institute of Oceanography, Ministry of Natural Resources, Qingdao 266100, China
4
Laboratory for Marine Fisheries Science and Food Production Processes, Qingdao Marine Science and Technology Center, Qingdao 266237, China
5
Rongcheng Marine Economic Development Center, Weihai 264300, China
*
Author to whom correspondence should be addressed.
These authors contributed equally to this work.
J. Mar. Sci. Eng. 2025, 13(10), 1887; https://doi.org/10.3390/jmse13101887
Submission received: 23 July 2025 / Revised: 20 September 2025 / Accepted: 26 September 2025 / Published: 1 October 2025
(This article belongs to the Section Marine Pollution)

Abstract

The accumulation of floating marine macro-litter (FMML) poses a major threat to coastal ecosystems, yet its transport dynamics in semi-enclosed seas remain poorly understood. This study establishes the first regional model to simulate the source-to-sink transport processes of FMML in the Bohai and Yellow Seas (BYS). By combining a high-resolution hydrodynamic model with Lagrangian particle tracking, we successfully reproduced observed spatiotemporal distribution patterns and accumulation hotspots. Our simulations reveal that the heterogeneity of FMML distribution is co-regulated by seasonal hydrodynamic variations and anthropogenic activities. We identified two major cross-regional transport pathways originating from Laizhou Bay and the northern Shandong Peninsula. Furthermore, backward particle tracking traced summer FMML hotspots to potential high-emission sources along the northern Jiangsu coast and the Yangtze River estuary. Despite limitations in emission inventories, this study provides a crucial mechanistic framework for FMML management in the BYS and a transferable methodology for other regional seas.

Graphical Abstract

1. Introduction

The proliferation of marine litter, particularly macro-litter, has become a pressing global environmental issue, significantly endangering marine ecosystems worldwide. This litter primarily consists of non-biodegradable materials such as plastics, metals, and glass, with plastics being the predominant form of marine litter due to their high production rates, diverse applications, and durability. Marine plastic litter adversely affects the marine environment, economic development, and human health. Macro plastic litter (macro-litter) can entangle marine organisms, disrupt seafloor habitats, damage tourism, and even jeopardize maritime navigation safety [1,2]. Under the influence of ultraviolet radiation and biodegradation, macro-litter gradually breaks down into smaller microplastics, impacting the health of marine ecosystems [3]. Furthermore, plastics may act as carriers of pollutants, introducing harmful substances into marine ecosystems. Hence, research on the migration and fate of macro-litter not only provides a scientific basis for its management and governance but also facilitates effective removal and recycling before it degrades into microplastics, thereby preventing the spread of thousands, tens of thousands, or even millions of microplastics [4].
The sources of marine litter are diverse, primarily categorized into land-based and sea-based sources. Land-based litter mainly originates from river transport, sewage systems, and tourism activities. River input serves as the main conduit for land-based litter to enter the marine environment [5,6]. Studies indicate that Asian rivers are the largest contributors of land-based litter globally, transporting 1.00 to 2.06 million tons of plastic litter to the ocean annually, which constitutes 86% of the global river transport volume [5]. Among these, the Yangtze and Pearl Rivers in China are regarded as the highest transporters of plastic litter in the world [5,6]. Additionally, sea-based litter primarily arises from maritime transport, fishing activities, and aquaculture, with abandoned fishing gear being a significant source of macro-litter [7].
The transport and source-sink processes of marine litter are influenced by various factors, including hydrodynamic conditions, atmospheric effects, river inputs, and the complex interactions of human activities. Ocean currents are the primary driving force controlling the distribution and accumulation of floating marine macro-litter (FMML), significantly impacting its spatial distribution through transport and aggregation mechanisms. For instance, the formation of the “Great Pacific Garbage Patch” is closely linked to the North Pacific Current, which concentrates plastic litter in relatively stagnant central areas, resulting in the development of a large-scale FMML patch [8]. Similarly, the North Atlantic Current leads to the accumulation of FMML in the subtropical gyre of the North Atlantic [9]. Additionally, monsoons can affect the transport pathways of FMML. The seasonal reversal of wind direction in the Bay of Bengal has a profound impact on the transport routes of FMML [10,11]. Consequently, the distribution of global FMML exhibits distinct regional and seasonal characteristics. Particularly in coastal regions and semi-enclosed seas, the density of marine litter tends to be significantly higher owing to their proximity to emissions and limited water circulation. Meanwhile, seasonal variations in human activities lead to significant differences in the sources of marine litter, directly influencing the spatiotemporal heterogeneity of litter distribution [11,12,13,14]. Therefore, this study aims to utilize a hydrodynamic model coupled with a particle tracking model to investigate the spatiotemporal distribution patterns of FMML in the Bohai Sea and Yellow Sea (BYS), analyze its transport processes, and explore the source-sink mechanisms of FMML hotspots. Despite the proliferation of FMML modeling studies in regions such as the Mediterranean [15] and the Gulf of Thailand [10], the BYS remains underrepresented in terms of mechanistic transport simulations. This system is characterized by strong seasonal monsoons, complex coastal currents, and intense anthropogenic pressures from riverine inputs and aquaculture—factors that collectively shape unique FMML dynamics not yet fully captured by existing models. To address this critical knowledge gap, we establish the first regional-scale FMML transport model for the BYS, integrating high-resolution hydrodynamics with Lagrangian particle tracking and validating the results with field surveys. Our work not only fills an important geographical gap but also advances methodological rigor through spatially explicit emission scenarios and backward tracing techniques. The research outcomes will provide a scientific foundation for advancing effective FMML management in semi-enclosed seas.

2. Materials and Methods

2.1. Field Observation of FMML

The field observation data of FMML were obtained using ship-based video observation methods. In short, the FMML images were recorded by the cameras on both sides of the research vessel during the transect survey of the comprehensive survey cruises. The survey points were strategically placed using the transect method, with sampling sections established across different regions of the BYS to ensure comprehensive coverage of the BYS (Figure 1). In this study, FMML images of summer and autumn in 2021 were selected as FMML observation data. For the specific method, see Teng et al. [13]. The field observation data of FMML were obtained through ship-based video transect surveys, following the methodology detailed in Teng et al. [13]. The survey points were strategically placed using the transect method, with sampling sections established across different regions of the BYS to ensure comprehensive coverage (32–40° N, 119–124.5° E) (Figure 1). Surveys were performed from R/V “Lanhai 101” at 6–7 knots. A fixed-width strip transect method was employed, with cameras (DS-2CD4212F-Z, HIKVISION Co. Ltd., Hangzhou, China) recording FMML items. The effective observation width, critical for density calculations, was set at 33 m during daytime (06:00–18:00) and 2 m at night (18:00–06:00) due to varying light and sea conditions. Data were recorded as items/min and integrated to items/hour to reduce autocorrelation.
The effective observation width was set at 33 m during daytime (06:00–18:00) and 2 m at night (18:00–06:00) due to varying light and sea conditions. FMML items were classified into categories (plastic, fabric, glass, etc.) and sources (domestic, fishery, other) based on visual characteristics (color, shape) according to established protocols [16,17]. To minimize annotation uncertainty, classifications were verified by two independent experts.

2.2. Numerical Model

2.2.1. Hydrodynamic Model

The hydrodynamic model was based on the unstructured-grid finite-volume community ocean model (FVCOM), which employs unstructured triangular grids in the horizontal direction and sigma coordinate transformations vertically [18]. FVCOM has been widely applied in studies of estuaries, coastal seas, and continental shelf studies [19,20,21,22].

2.2.2. FMML Transport Model and Pathway Simulation

The FMML transport equation is defined as:
d x d t = v x t , t
where x is the particle position at time t (s); d x d t is the rate of change of the litter position in time; and v x t , t is the 3D flow velocity (m/s).
To investigate the transport pathways and identify FMML hotspots sources in the BYS, six coastal regions, including Liaodong Bay, Bohai Bay, Laizhou Bay, northern Yellow Sea, southern Shandong Peninsula, and northern Jiangsu coastal areas, were designated as plastic discharge sources. Simulations were conducted to trace plastic litter transport from these regions and infer FMML hotspots in the BYS.

2.2.3. Model Configuration

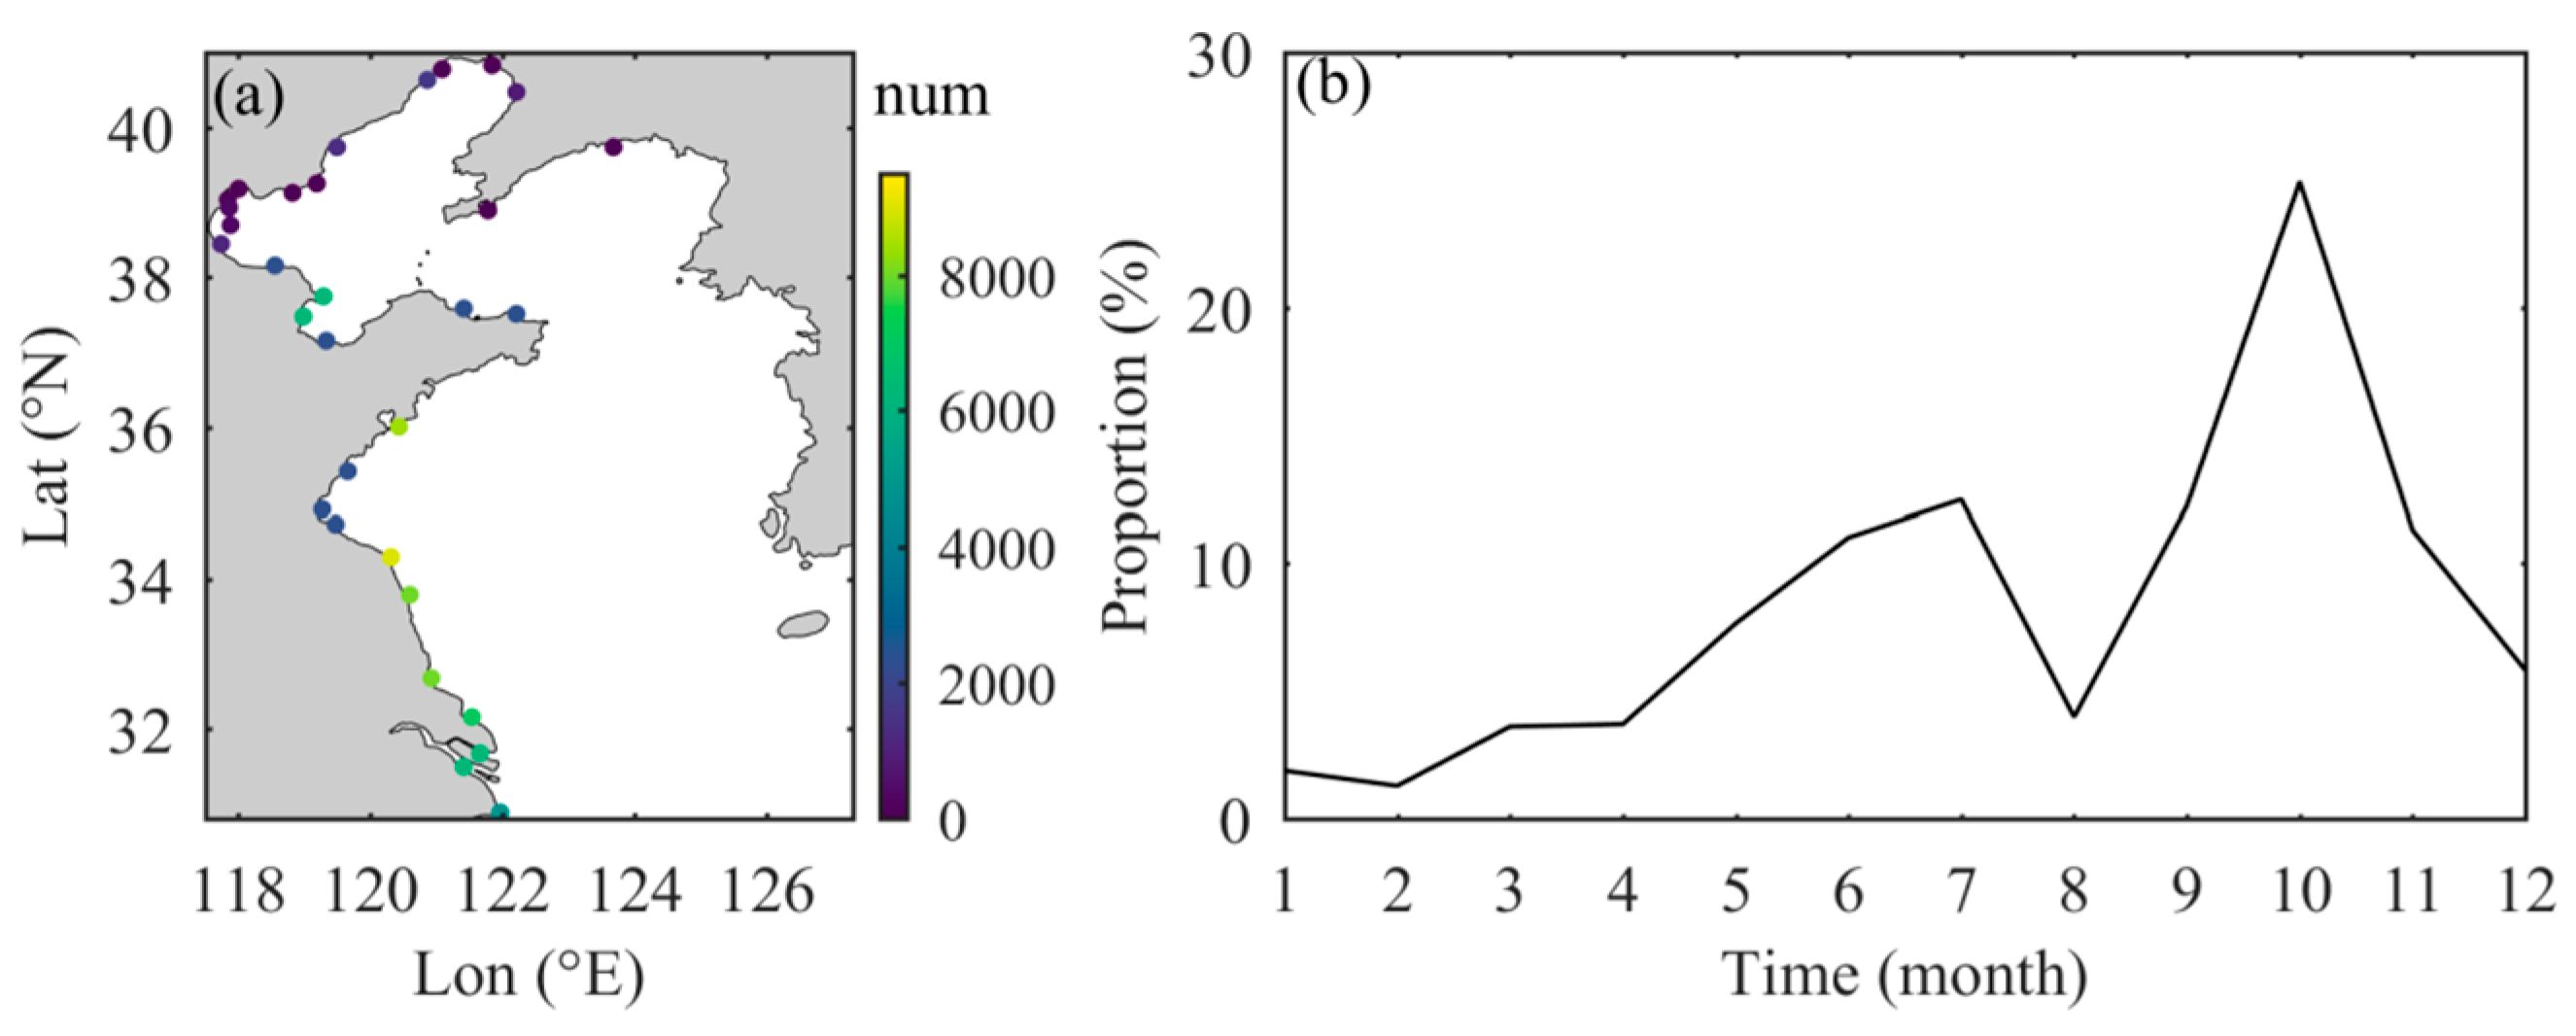
The model domain covers the BYS, East China Sea, and western Pacific. The mesh contained 23,006 nodes and 43,751 cells. The horizontal resolution of the mesh was approximately 1–2.5 km inside the Changjiang River estuary; about 2–5 km near the Subei coast; and around 9–20 km at the open boundary. Initial temperature and salinity data were sourced from the Copernicus Marine Environment Monitoring Service (CMEMS), which provides ocean monitoring indicators and reanalysis data at high horizontal resolution. The boundary conditions incorporated tidal forcing and circulation. Eight tidal constituents (M2, S2, O1, Q1, K1, P1, K2, and N2) were derived from the NAO.99b dataset, which has been utilized in previous studies to verify the accuracy of global ocean tidal models. Sea surface height (SSH), flow, temperature, and salinity were also based on CMEMS data, while surface meteorological conditions were obtained from the ERA5 dataset. Model grids, configurations, and parameters can be found in Zhong et al. [23,24]. The model was started on 1 January 2011, and the model results from 1 January 2021 to 1 January 2022 were used to drive the FMML transport model. Initial litter discharge location and total amount were informed by the 2021 coastal marine macro-litter monitoring data [25]. Monthly amounts of litter were allocated according to river runoff (Figure 2) [25]. Initially, most plastic materials float on water due to their low density; however, as biofouling occurs and microbial activity increases, the density of the plastics can rise, leading to them sinking [26]. Considering the seasonal variation characteristics of the biofouling process in the BYS, field observations of FMML distribution, and previous research findings, the model’s settling module initiated settling after 3 months, with the settling velocity set at 0.00001 m/s [27,28,29,30].

2.3. Model Validation

The model performance was rigorously evaluated using the coefficient of determination (R2) and RMSE. Flow data were obtained from the seabed-mounted site YSG in the YS. The locations of the flow measurement sites are depicted in Figure 1. Detailed information about site YSG can be referenced in Zhong et al. [23]. Validations for hydrodynamic simulations are provided in Figure S1 in the Supplementary Material. The model successfully simulated the semidiurnal tidal variation at site YSG. Additionally, modeled sea surface temperatures (SSTs) were compared with Level 2 SST products with a spatial resolution of 1 km from the MODIS satellite. Satellite-derived and modeled SSTs exhibited consistent spatial patterns across different phases (Figure S2 in the Supplementary Material). Detailed validation for the hydrodynamic model can be found in Zhong et al. [23,24]. The numerical model developed in this study provided a reliable representation of the hydrodynamics, establishing a robust foundation for subsequent investigations into FMML transport.
The FMML transport model’s results were compared with field observations in summer and autumn. Observation results indicate that the central North Yellow Sea and the region extending from the central South Yellow Sea to the offshore area of Jiangsu Province in summer and the northern Shandong Peninsula coastal waters in autumn are high-density areas of FMML (Figure 3a,c). The model accurately reproduces the distribution patterns of FMML high-density areas (Figure 3b,d). The FMML density in summer was higher than that in autumn based on observation and model. Additionally, model results show that the coastal waters in the Bohai Sea and the southern Shandong Peninsula, which are not covered by the observation stations, are also high-density areas of FMML.

2.4. Sensitivity of Settling Velocity in the FMML Transport Model

The settling velocity of litter plays a critical role in determining its spatial distribution over time. To evaluate the sensitivity of FMML transport simulations to settling velocity, three numerical experiments were conducted using different settling velocities: 0.00001, 0.00005, and 0.0001 m/s. The overall spatial patterns of FMML distribution across the three experiments were broadly similar (Figure 3, Figures S3 and S4). All three experiments successfully reproduced the three observed high-density areas of FMML during summer. However, in autumn, the elevated FMML concentration near the northern Shandong Peninsula was not captured when using settling velocities of 0.00005 m/s or 0.0001 m/s (Figures S3d and S4d). Considering the model’s ability to replicate both seasonal observations, a settling velocity of 0.00001 m/s appears to yield the most realistic representation and was therefore considered the optimal choice for the present modelling framework.

2.5. Backward Particle Tracking of FMML Hotspots in the BYS Formed During Summer

In order to pinpoint the origins of FMML hotspots within the BYS, establishing a reverse FMML tracking model to track litter sources becomes imperative. Owing to the impact of human activities, summer emerges as a peak season for litter emission (Figure 2). Coupled with increased terrestrial runoff, this period promotes the creation of marine litter hotspots, as referenced in studies by Pervez and Lai [31] and Teng et al. [13]. Consequently, this study focused on the summer (August) to conduct a backward particle tracking experiment aimed at identifying the sources of FMML hotspots in the BYS. According to the findings from the 2021 summer survey in the Bohai and Yellow Seas, the central North Yellow Sea, the central South Yellow Sea, and the offshore waters of northern Jiangsu were identified as typical hotspot areas (Figure 4) [13]. During the backward particle tracking experiment, FMML sinks were established in these three areas to perform source tracing simulations for FMML. In this study, the backward tracking model of FMML was established by reading the flow in reverse from the hydrodynamic results. In the backward tracking model, when litter particles reach the land boundary, they revert to their previous positions, thereby remaining near the boundary. This process enables the identification of these areas as potential FMML source areas.

3. Results and Discussion

3.1. Seasonal Variation of FMML Distribution

The distribution of FMML in the BYS exhibits pronounced seasonal variations (Figure 4a–d). In winter, the relatively low litter emission and short time since initial emission led to an overall low density of FMML on the BYS continental shelf (Figure 4a). In spring, the FMML density in the sporadic areas in the BYS gradually increases (Figure 4b). By summer, high-density FMML areas are dispersed across the shelf sea, with high-density FMML not only in the coastal waters of the Bohai Sea but also in the northern region of the North Yellow Sea, the central South Yellow Sea, and nearshore Qingdao region (Figure 4c). In autumn, the FMML distribution resembles that of summer, except the high-density area in the North Yellow Sea disappears (Figure 4d).
Similarly, the monthly mean current field simulated in the BYS also displays distinct seasonal variations (Figure 4e–h). Driven by the northwest winter monsoon, the powerful Lubei Coastal Current flows eastward along the Shandong Peninsula’s northern coast and subsequently extends southward, entering the South Yellow Sea. The direction of this current aligns well with the diffusion direction of FMML hotspots (Figure 4e and Figure 5f). During summer, the northward Korea Coastal Current and the westward Liaonan Coastal Current correspond well to the hotspots formed in the eastern and northern parts of the North Yellow Sea (Figure 4g). Additionally, the Lubei Coastal Current along the northern coast of the Shandong Peninsula persists stably across all seasons (Figure 4e–h), suggesting that this coastal current may serve as an important pathway for the transport of FMML from the Bohai Sea to the Yellow Sea, leading to the formation of FMML hotspots in the central South Yellow Sea.
This study reveals the spatiotemporal heterogeneity of FMML in the BYS, which is influenced by the seasonal fluctuations of human activities and hydrodynamic forces. Spatially, FMML aggregation hotspots are predominantly located in the northern Shandong Peninsula, the Bohai Strait, and the northern Yellow Sea, areas influenced by complex ocean current transport and topographic convergence effects. The formation of high-density areas of FMML is closely related to the retention effect of nearshore current systems on materials [32]. Temporally, the FMML flux exhibits a seasonal coupling pattern influenced by both human activities and natural processes. During the summer tourism peak, the proportion of plastic litter on beaches significantly increases and is transformed into FMML through tidal action [11,31]; simultaneously, major rivers such as the Yellow River and Yangtze River can transport a large amount of land-based litter due to the coupling of strong runoff input and human activities [5,33,34]. Therefore, the spatiotemporal heterogeneity of FMML is essentially the result of the nonlinear superposition of human activity intensity and natural hydrological pulses (runoff/ocean currents). The periodic fluctuations of land-based input intensity and the spatiotemporal differentiation of marine dynamic transport paths jointly shape the migration and aggregation patterns of FMML in the BYS. This finding provides process-based evidence for understanding the coupling mechanism of macro-litter transport at the land–sea interface.

3.2. FMML Transport from Different Sources

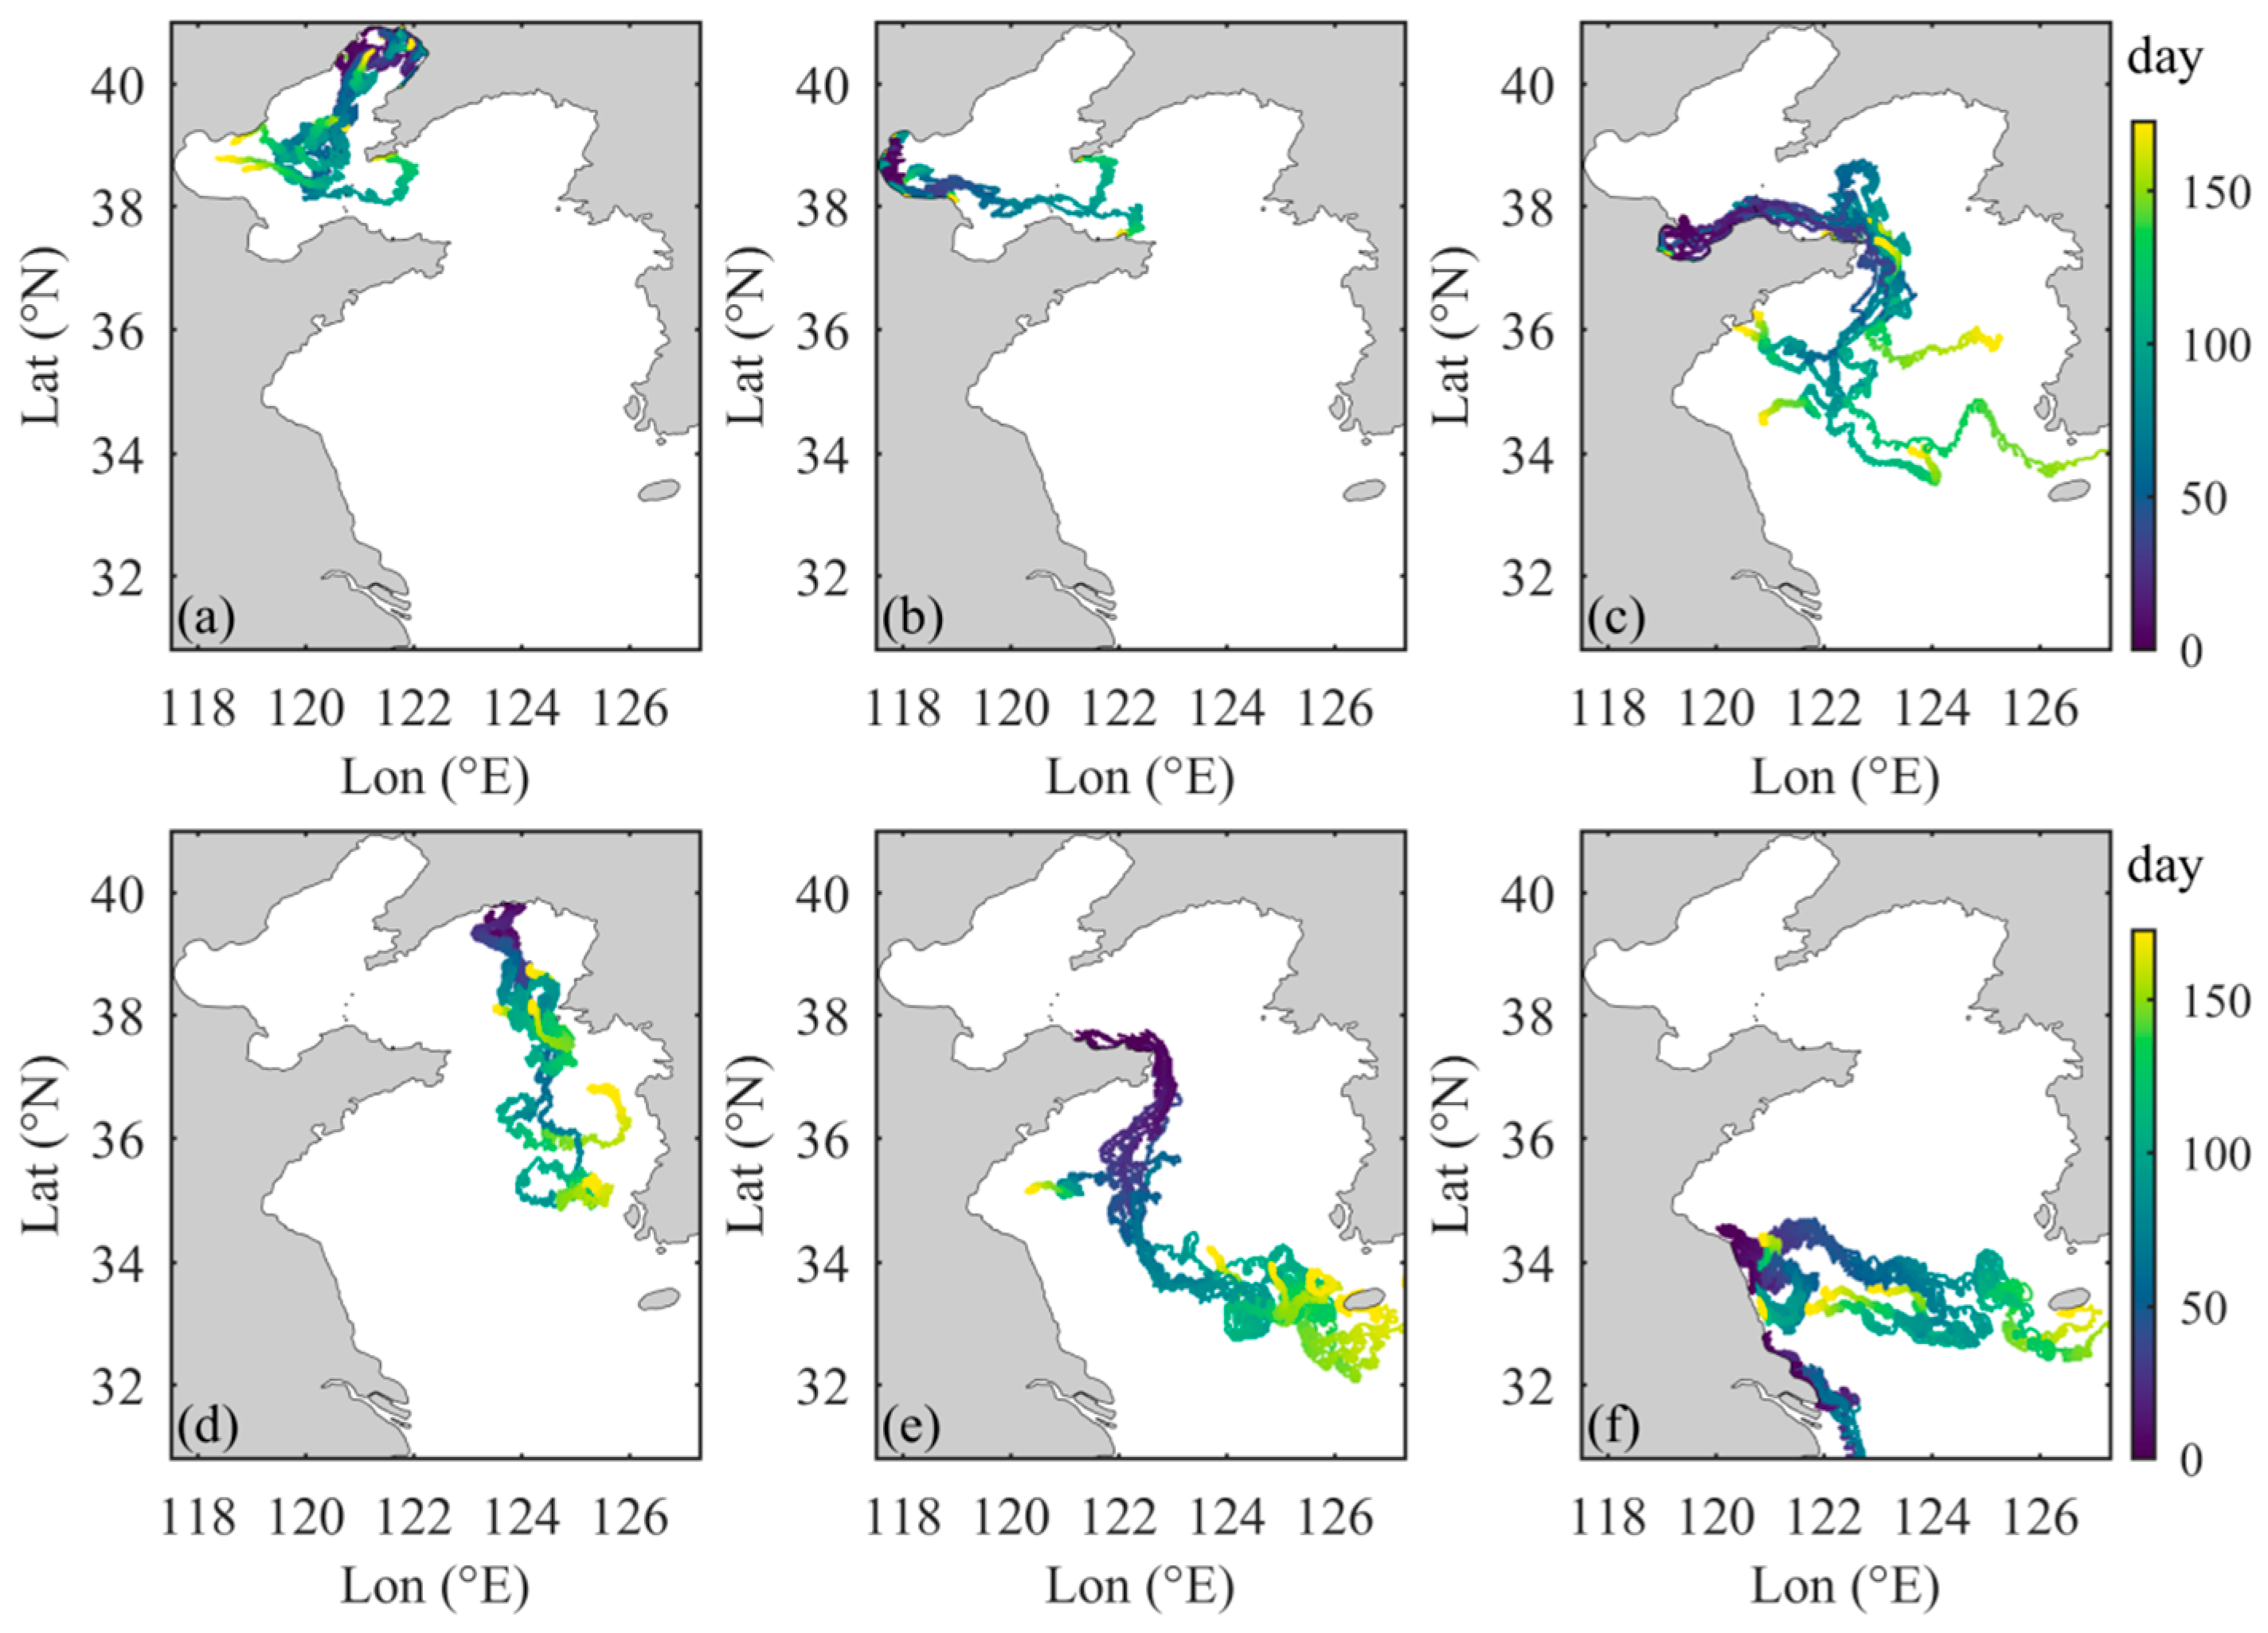
The transport characteristics of FMML released from different source regions in the BYS area exhibit distinct variations (Figure 5a–f). FMML discharged from Liaodong Bay exhibits predominant southward transport; however, under the influence of local circulatory patterns, the FMML is largely constrained and retained within the northern Bohai Sea (Figure 5a). FMML from Bohai Bay primarily flows eastward, with most accumulating in the southern Bohai Sea; only a small fraction crosses the Bohai Strait to enter the Yellow Sea (Figure 5b). Laizhou Bay FMML moves eastward, bypassing Chengshan Cape and entering the South Yellow Sea, with some reaching as far as Jeju Island (Figure 5c). FMML originating from the northern coastal region of the North Yellow Sea also moves southward into the South Yellow Sea (Figure 5d). The transport characteristics of FMML from the northern coast of the Shandong Peninsula are similar to those of the FMML from Laizhou Bay (Figure 5e). Parts of the FMML from the northern coastal area are transported southward across the Yangtze River Estuary, while another part moves eastward toward Jeju Island. A small amount of the eastward-transported FMML can subsequently be advected westward back to the coastal waters off northern Jiangsu (Figure 5f). This indicates that the FMML from Laizhou Bay and the northern coast of the Shandong Peninsula has the potential for cross-regional or long-distance transport, with a transport distance longer than 1000 km, while the diffusion range of FMML from the Bohai Sea is relatively limited. The transport distances of FMML are usually not longer than 400 km. This result confirms the strong retention effect of BYS on material, highlighting the necessity of implementing refined control over local land-based emissions, especially for source regions with weak diffusion capabilities [32,35,36].

3.3. Source Tracking of FMML Hotspots in the BYS in Summer

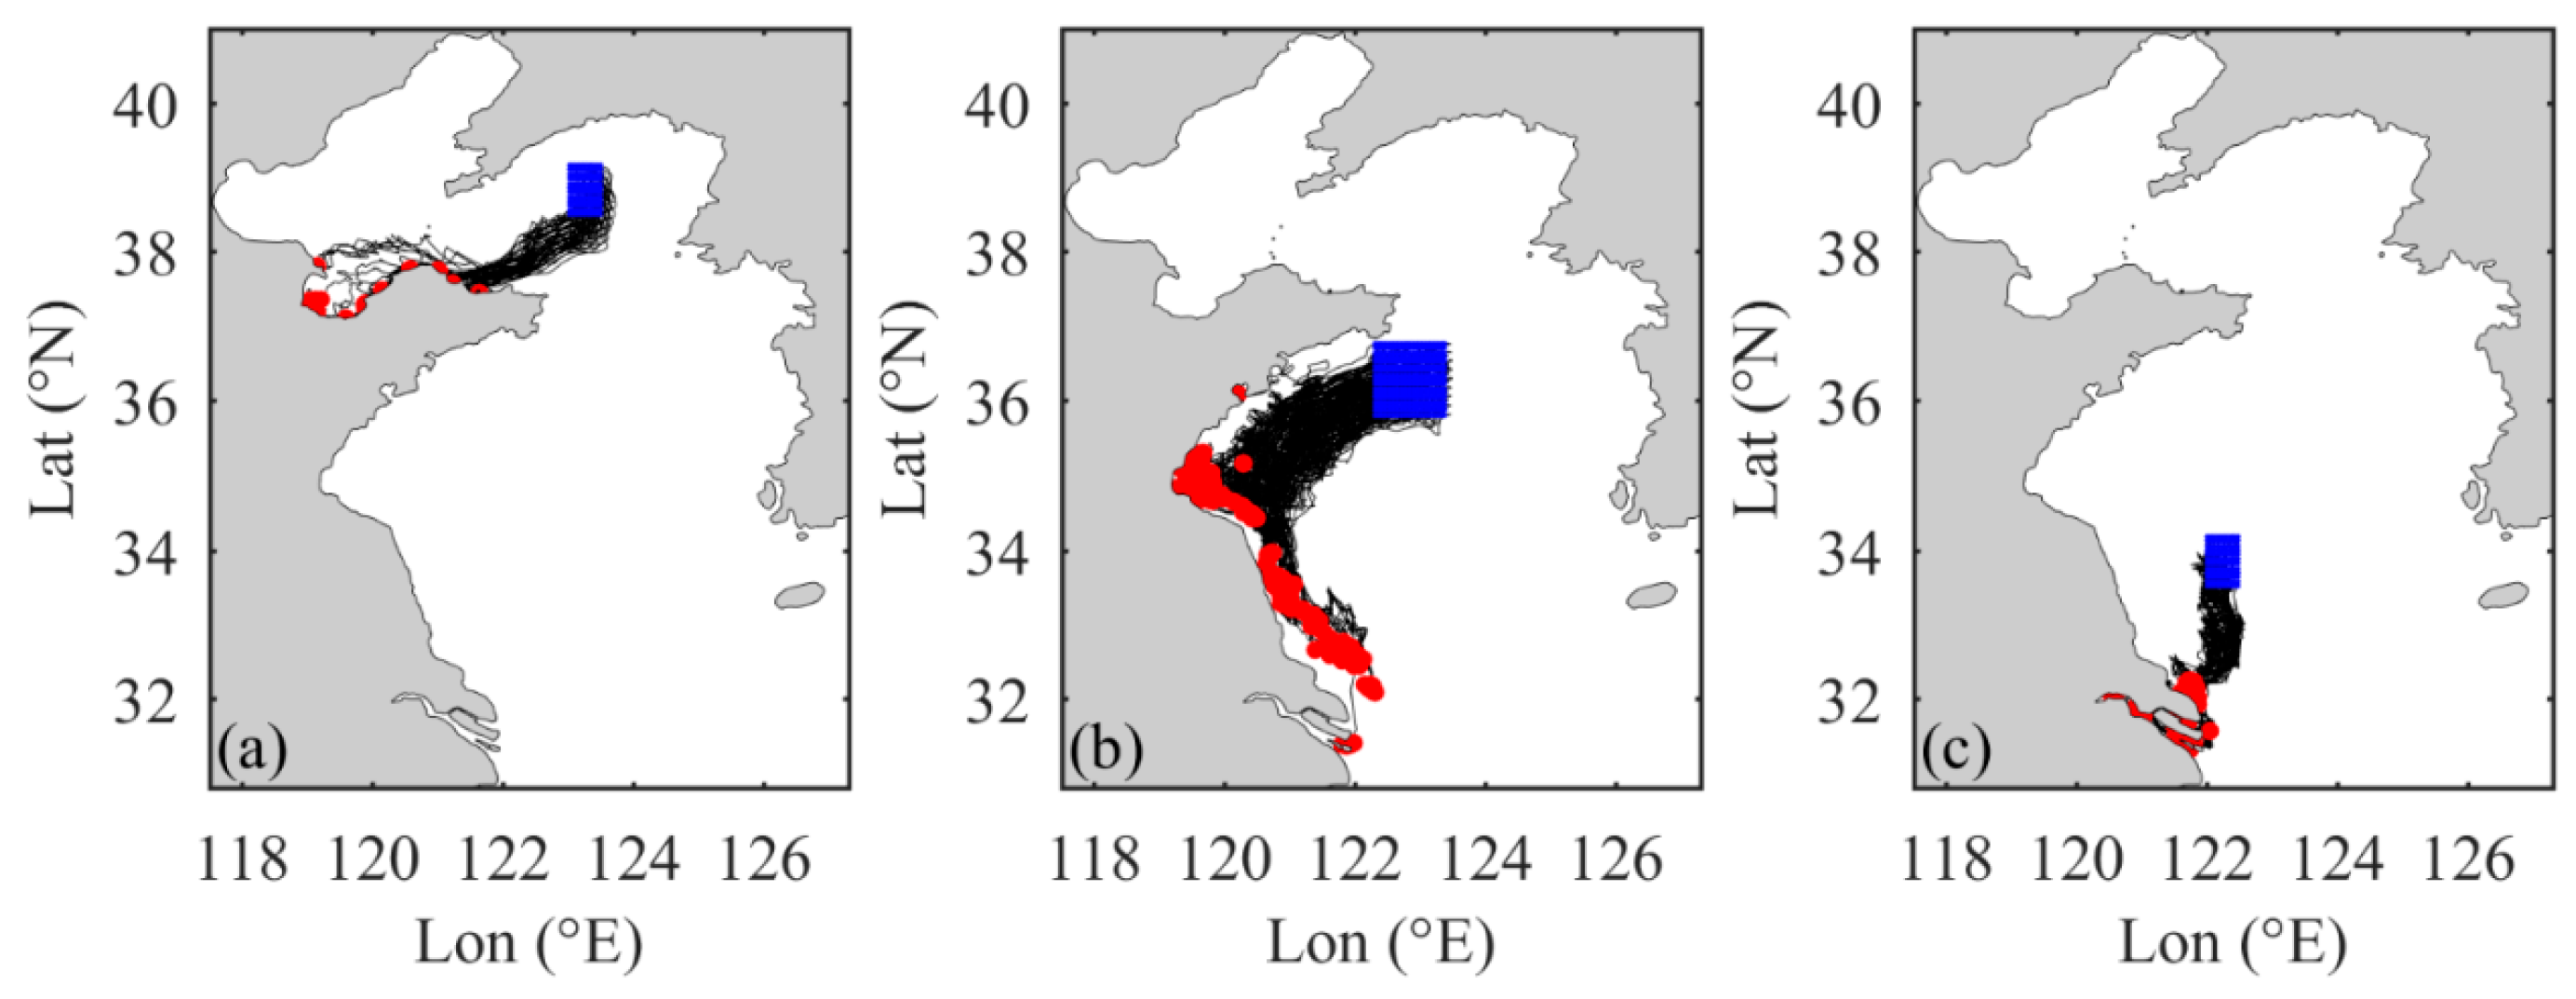
The backward particle tracking model was employed to identify the sources of observed FMML hotspots in the central North Yellow Sea, central South Yellow Sea, and the offshore waters of northern Jiangsu during the summer of 2021 (Figure 6). The hotspot in the central North Yellow Sea was primarily influenced by discharges from the Yellow River Estuary, Laizhou Bay, and the northern Shandong Peninsula (Figure 6a). Among them, FMML from the northern Shandong Peninsula accounted for approximately 70%, and FMML from the Yellow River Estuary and Laizhou Bay accounted for approximately 9% and 21%, respectively. The hotspot in the southeast of Chengshan Cape originated predominantly from Jiangsu coastal areas (Figure 6b). Approximately 60% of the FMML originated from the northern region, and 40% of the FMML originated from the southern region. The offshore hotspot of Jiangsu Province was closely associated with inputs from the Yangtze River Estuary (Figure 6c). It is worth noting that the differences between the forward transport pathway (particles released in January) and the backward source tracing (traced back in August with a trace-back period of approximately half a month) are due to the mismatch in spatio-temporal coupling. Specifically, the forward pathways simulate the transport of particles released in January, a period dominated by the powerful East Asian Winter Monsoon. This season drives strong, southward-flowing coastal currents (e.g., the Lubei Coastal Current), which effectively constrain particle movement along the coast (as seen in Figure 6). In contrast, the backward analysis traces the origin of particles constituting the August hotspots under the prevailing summer hydrodynamic conditions. During summer, the wind field weakens and shifts to southeasterly, leading to a markedly different circulation pattern characterized by weaker currents, regional gyres, and enhanced tidal mixing [32,36]. The hydrodynamic connectivity between sources and sinks is therefore fundamentally different between these two seasons. Consequently, the backward tracking results do not identify the sources of particles released in winter, but rather the potential source regions that are hydrologically connected to the sink under the specific summer circulation patterns. From a management perspective, the high contribution of the Jiangsu coast and Yangtze River Estuary identified through backward source tracking suggests that actual emission intensities may exceed current monitoring estimates [25]. This implies the necessity of enhancing dynamic monitoring and recalibrating emission inventories in these regions.

4. Limitations and Recommendations

The modeling and source-tracking of macro-litter face critical limitations rooted in data scarcity, oversimplified assumptions, and incomplete representation of cross-boundary transport mechanisms. First, current emission inventories primarily rely on land-based data sources and are heavily dependent on low-frequency, spatially sparse measurements. These not only fail to adequately capture seasonal variations but also overlook key marine sources such as fisheries, aquaculture, and abandoned, lost, or discarded fishing gear (ALDFG) [12,37]. A major limitation is the exclusion of sea-based emissions—including direct discharges from shipping and ALDFG—due to the extreme difficulty in quantifying these diffuse and often unreported sources. This omission likely explains the model’s systematic underestimation and spatial inaccuracies (e.g., the southward shift of the predicted hotspot in the North Yellow Sea in Figure 3), particularly given the high intensity of such activities in the region [12]. Future efforts should focus on integrating proxy data for sea-based emissions, such as fishing effort derived from vessel monitoring systems (VMS) [38], shipping lane density [39], and aquaculture distribution maps, following methodologies successfully applied in other basins [40].
Second, current models further oversimplify macro-litter as homogeneous particles [41,42], ignoring plastic material heterogeneity (e.g., polymer composition, density) and dynamic processes like biofouling and photodegradation [43,44,45]. In the BYS, where complex stratification and energetic tidal mixing coexist, processes like biofouling—which shows strong seasonal patterns—can drastically alter the buoyancy and fate of plastics [34,45]. Notably, biofilms alter surface roughness and settling velocities [46,47], yet such interactions remain poorly quantified. However, existing models fail to resolve these spatiotemporal complexities, limiting predictions of macro-litter fate in semi-enclosed seas like the BYS. Addressing these gaps requires integration of multi-source monitoring data (including remote sensing, AI-driven image analysis, and spatially explicit emission metrics) combined with controlled experiments to optimize model parameterization of biophysical processes [48,49,50].
The third challenge involves the insufficient integration of multiple environmental drivers during the model construction process. Macro-litter is continuously exchanged across environmental interfaces, including the ocean surface, water column, and seafloor, under the combined influence of hydrodynamic forces (e.g., ocean currents, wind, and waves) and riverine inputs [51,52]. Beaches and the seafloor function as dynamic source-sink systems, where their behavior is regulated by tidal cycles and seasonal fluid dynamics, leading to processes such as litter retention, resuspension, and cross-interface transport [53]. The BYS, with its extensive shallow shelves and strong tidal forces, is characterized by significant sediment resuspension and cross-interface exchanges. Accurately quantifying the dynamic characteristics of these source-sink systems, including flux magnitudes, retention time scales, and cross-interface connectivity, is critical for predicting macro-litter pathways and prioritizing effective mitigation strategies.

5. Conclusions

This study conducts the first regional model for FMML transport in the BYS, basically reproducing spatiotemporal distribution trends and hotspots. It reveals that the spatiotemporal heterogeneity of FMML in the BYS is co-regulated by the seasonal variations of human activities and hydrodynamic forces. The FMML transport pathway simulations demonstrate that the Laizhou Bay and the northern coast of the Shandong Peninsula serve as significant release source areas, exhibiting a significant cross-regional transport potential. The backward particle tracking results for the FMML hotspots in the BYS during the summer of 2021 suggest that there may be sources with relatively high litter emission flux along the northern Jiangsu coast and Yangtze River estuary. Overall, due to the limitations of data sources, uncertainties in model parameters, and the presence of technical barriers, the simulation and source tracking of FMML still face challenges.

Supplementary Materials

The following supporting information can be downloaded at: https://www.mdpi.com/article/10.3390/jmse13101887/s1, Figure S1: Comparisons between the observed (upper panel) and modeled (lower panel) u and v flow velocity at site YSG (showed in Figure 1) in summer; Figure S2: SST validation. R2 and RMSE are shown in panel, and the same applies below; Figure S3: Comparison of FMML distribution patterns of a settling velocity of 0.00005 m/s in summer and autumn of 2021; Figure S4: Comparison of FMML distribution patterns of a settling velocity of 0.0001 m/s in summer and autumn of 2021.

Author Contributions

Conceptualization, G.T.; Methodology, G.T. and Y.Z.; Software, X.X.; Validation, X.X.; Formal analysis, G.T.; Investigation, X.X.; Resources, X.X.; Data curation, Y.Z.; Writing—original draft, G.T. and Y.Z.; Visualization, G.T. and Y.Z.; Supervision, X.S. and X.J.; Project administration, X.S. and X.J.; Funding acquisition, G.T. and X.S. All authors have read and agreed to the published version of the manuscript.

Funding

This work was supported by the Key R & D Program of Shandong Province (2022CXPT013), National Natural Science Foundation of China (42306183 and 42176151). The numerical model was carried out at the Marine Big Data Center of Institute for Advanced Ocean Study of Ocean University of China.

Data Availability Statement

The original contributions presented in this study are included in the article/Supplementary Material. Further inquiries can be directed to the corresponding author.

Acknowledgments

We thank the members of the Division of Fishery Resources and Ecosystem of the Yellow Sea Fisheries Research Institute, Chinese Academy of Fishery Sciences, and the crew of the R/V “Beidou” for sample collection. The authors also thank SuperComputing Network (SCNet) for their support during the development of the study.

Conflicts of Interest

The authors declare no conflict of interest.

References

  1. Gregory, M.R. Environmental implications of plastic debris in marine settings—Entanglement, ingestion, smothering, hangers-on, hitch-hiking and alien invasions. Philos. Trans. R. Soc. B Biol. Sci. 2009, 364, 2013–2025. [Google Scholar] [CrossRef]
  2. Praved, P.H.; Neethu, K.V.; Nandan, S.B.; Krishna, N.A.; Aneesh, B.P.; Sankar, N.D.; Antony, H.; Aravind, E.H. Multidimensional risk assessment of marine litter pollution in the ecologically fragile coral atolls of India. J. Environ. Manag. 2025, 376, 124578. [Google Scholar] [CrossRef] [PubMed]
  3. Galloway, T.S.; Cole, M.; Lewis, C. Interactions of microplastic debris throughout the marine ecosystem. Nat. Ecol. Evol. 2017, 1, 0116. [Google Scholar] [CrossRef]
  4. González-Fernández, D.; Cózar, A.; Hanke, G.; Viejo, J.; Morales-Caselles, C.; Bakiu, R.; Barceló, D.; Bessa, F.; Bruge, A.; Cabrera, M.; et al. Floating macrolitter leaked from Europe into the ocean. Nat. Sustain. 2021, 4, 474–483. [Google Scholar] [CrossRef]
  5. Lebreton, L.C.; van der Zwet, J.; Damsteeg, J.W.; Slat, B.; Andrady, A.; Reisser, J. River plastic emissions to the world’s oceans. Nat. Commun. 2017, 8, 15611. [Google Scholar] [CrossRef] [PubMed]
  6. Schmidt, C.; Krauth, T.; Wagner, S. Export of plastic debris by rivers into the sea. Environ. Sci. Technol. 2017, 51, 12246–12253. [Google Scholar] [CrossRef]
  7. Wilcox, C.; Van Sebille, E.; Hardesty, B.D. Threat of plastic pollution to seabirds is global, pervasive, and increasing. Proc. Natl. Acad. Sci. USA 2016, 113, 290–295. [Google Scholar] [CrossRef]
  8. Lebreton, L.; Slat, B.; Ferrari, F.; Sainte-Rose, B.; Aitken, J.; Marthouse, R.; Hajbane, S.; Cunsolo, S.; Schwarz, A.; Levivier, A.; et al. Evidence that the great pacific garbage patch is rapidly accumulating plastic. Sci. Rep. 2018, 8, 4666. [Google Scholar] [CrossRef]
  9. Law, K.L.; Morét-Ferguson, S.; Maximenko, N.A.; Proskurowski, G.; Peacock, E.E.; Hafner, J.; Reddy, C.M. Plastic accumulation in the North Atlantic subtropical gyre. Science 2010, 329, 1185–1188. [Google Scholar] [CrossRef]
  10. Phattananuruch, K.; Pokavanich, T. Monsoon-Driven dispersal of river-sourced floating marine debris in tropical semi-enclosed waters: A case study in the gulf of Thailand. J. Mar. Sci. Eng. 2024, 12, 2258. [Google Scholar] [CrossRef]
  11. Monchanin, C.; Desmolles, M.; Rivetta, K.; Saramul, S.; Charoenpong, C.; Mehrotra, R. Spatiotemporal variations in marine macro-litter pollution along the shoreline of Koh Mun Nai, an uninhabited island in the Gulf of Thailand. Environ. Pollut. 2024, 352, 124098. [Google Scholar] [CrossRef] [PubMed]
  12. Teng, G.; Shan, X.; Jin, X.; Yang, T. Marine litter on the seafloors of the Bohai Sea, Yellow Sea and northern East China Sea. Mar. Pollut. Bull. 2021, 169, 112516. [Google Scholar] [CrossRef]
  13. Teng, G.; Chen, W.; Shan, X.; Shi, Y.; Jin, X. Temporal and spatial distribution of floating marine macro litter in the offshore waters of the Bohai Sea and Yellow Sea (BYS). Mar. Pollut. Bull. 2024, 209, 117232. [Google Scholar] [CrossRef]
  14. Liao, Z.; Zou, Q.; Vinh, V.D.; Pan, Z.; Kaiser, M.J. Seasonal change in fate and transport of plastics from Red River to the coast of Vietnam. Mar. Pollut. Bull. 2024, 208, 116923. [Google Scholar] [CrossRef]
  15. Mansui, J.; Molcard, A.; Ourmieres, Y. Modelling the transport and accumulation of floating marine debris in the Mediterranean basin. Mar. Pollut. Bull. 2015, 91, 249–257. [Google Scholar] [CrossRef]
  16. Fleet, D.; Vlachogianni, T.; Hanke, G. A Joint List of Litter Categories for Marine Macrolitter Monitoring; EUR 30348 EN, JRC121708; Publications Office of the European Union: Luxembourg, 2021; ISBN 978-92-76-21445-8. [Google Scholar] [CrossRef]
  17. Vighi, M.; Ruiz-Orejón, L.F.; Hanke, G. Monitoring of Floating Marine Macro Litter—State of the Art and Literature Overview; EUR 31073 EN, JRC129261; Publications Office of the European Union: Luxembourg, 2022; ISBN 978-92-76-52436-6. [Google Scholar] [CrossRef]
  18. Chen, C.S.; Beardsley, R.C.; Cowles, G. An unstructured grid, finite-volume coastal ocean model (FVCOM) system. Oceanography 2006, 19, 78–89. [Google Scholar] [CrossRef]
  19. Weisberg, R.H.; Zheng, L. Circulation of Tampa Bay driven by buoyancy, tides, and winds, as simulated using a finite volume coastal ocean model. J. Geophys. Res. Oceans 2006, 111, C01005. [Google Scholar] [CrossRef]
  20. Ge, J.; Torres, R.; Chen, C.; Liu, J.; Xu, Y.; Bellerby, R.; Shen, F.; Bruggeman, J.; Ding, P. Influence of suspended sediment front on nutrients and phytoplankton dynamics off the Changjiang Estuary: A FVCOM-ERSEM coupled model experiment. J. Mar. Syst. 2020, 204, 103292. [Google Scholar] [CrossRef]
  21. Rutherford, K.; Bianucci, L.; Floyd, W. A simple approach to represent precipitation-derived freshwater fluxes into nearshore ocean models: An FVCOM4.1 case study of Quatsino Sound, British Columbia. Geosci. Model Dev. 2024, 17, 6083–6104. [Google Scholar] [CrossRef]
  22. Premathilake, L.; Khangaonkar, T.; West, J.; O’Neill, S.; Harding, L.; James, C.A.; Yun, S.; Bogue, K. Integrated modeling framework (FVCOM-ICM/Toxi) to simulate the fate and transport of polychlorinated biphenyls in urban estuaries—Case study for Puget Sound, WA. Ecol. Model. 2025, 500, 110959. [Google Scholar] [CrossRef]
  23. Zhong, Y.; Qiao, L.; Song, D.; Ding, Y.; Xu, J.; Xue, W.; Xue, C. Impact of cold water mass on suspended sediment transport in the South Yellow Sea. Mar. Geol. 2020, 428, 106244. [Google Scholar] [CrossRef]
  24. Zhong, Y.; Du, J.; Song, D.; Ding, Y.; Qiao, L.; Wang, Y.; Liu, X.; Yan, W.; Li, P.; Xu, G. Sediment dynamic responses to a severe typhoon in a stratified continental shelf sea. Ocean Model. 2025, 196, 102541. [Google Scholar] [CrossRef]
  25. Ministry of Ecology and Environment of China. China Marine Ecological Environment Quality Bulletin. Beijing, China. 2021. Available online: https://www.mee.gov.cn/hjzl/sthjzk/jagb/ (accessed on 27 May 2022).
  26. De Tender Caroline, A.; Annelies, H.; Sara, M.; Tom, R.; Peter, D. Bacterial community profiling of plastic litter in the Belgian part of the North Sea. Environ. Sci. Technol. 2015, 49, 9629–9638. [Google Scholar] [CrossRef]
  27. Chen, T. Formation of Biofilm on Microplastics and Its Influences on Physicochemical Properties of Microplastics in the Coastal Sea; University of Chinese Academy of Sciences: Bejing, China, 2018. [Google Scholar]
  28. Sun, Y.C.; Cao, L.; Wang, Y.T.; Chen, W.; Li, Y.; Zhao, X.Z. Sources and distribution of microplastics in the East China Sea under a three-dimensional numerical modelling. Environ. Pollut. 2022, 311, 119910. [Google Scholar] [CrossRef]
  29. Baudena, A.; Ser-Giacomi, E.; Jalón-Rojas, I.; Galgani, F.; Pedrotti, M.L. The streaming of plastic in the Mediterranean Sea. Nat. Commun. 2022, 13, 2981. [Google Scholar] [CrossRef]
  30. Baudena, A.; Kiko, R.; Jalón-Rojas, I.; Pedrotti, M.L. Low-density plastic debris dispersion beneath the Mediterranean Sea surface. Environ. Sci. Technol. 2023, 57, 7503–7515. [Google Scholar] [CrossRef] [PubMed]
  31. Pervez, R.; Lai, Z. Spatio-temporal variations of litter on Qingdao tourist beaches in China. Environ. Pollut. 2022, 303, 119060. [Google Scholar] [CrossRef] [PubMed]
  32. Bian, C.; Jiang, W.; Greatbatch, R.J. An exploratory model study of sediment transport sources and deposits in the Bohai Sea, Yellow Sea, and East China Sea. J. Geophys. Res. Oceans 2013, 118, 5908–5923. [Google Scholar] [CrossRef]
  33. Zhang, W.; Zhang, S.; Zhao, Q.; Qu, L.; Ma, D.; Wang, J. Spatio-temporal distribution of plastic and microplastic debris in the surface water of the Bohai Sea, China. Mar. Pollut. Bull. 2020, 158, 111343. [Google Scholar] [CrossRef]
  34. Zhang, M.; Lin, Y.; Booth, A.M.; Song, X.; Cui, Y.; Xia, B.; Gu, Z.; Li, Y.; Liu, F.; Cai, M. Fate, source and mass budget of sedimentary microplastics in the Bohai Sea and the Yellow Sea. Environ. Pollut. 2022, 294, 118640. [Google Scholar] [CrossRef]
  35. Qiao, S.; Shi, X.; Wang, G.; Zhou, L.; Hu, B.; Hu, L.; Yang, G.; Liu, Y.; Yao, Z.; Liu, S. Sediment accumulation and budget in the Bohai Sea, Yellow Sea and East China Sea. Mar. Geol. 2017, 390, 270–281. [Google Scholar] [CrossRef]
  36. Luo, C.; Lin, L.; Shi, J.; Liu, Z.; Cai, Z.; Guo, X.; Gao, H. Seasonal variations in the water residence time in the Bohai Sea using 3D hydrodynamic model study and the adjoint method. Ocean Dyn. 2021, 71, 157–173. [Google Scholar] [CrossRef]
  37. He, M.; Tian, F.; Zhai, X.; Zhou, K.; Zhang, L.; Guo, X.; Tang, Z.; Chen, H. Distribution and typologies of anthropogenic seafloor litter in the Pearl River Estuary and adjacent coastal waters, China. Mar. Pollut. Bull. 2024, 203, 116505. [Google Scholar] [CrossRef]
  38. Russo, T.; D’andrea, L.; Parisi, A.; Martinelli, M.; Belardinelli, A.; Boccoli, F.; Cignini, I.; Tordoni, M.; Cataudella, S. Assessing the fishing footprint using data integrated from different tracking devices: Issues and opportunities. Ecol. Indic. 2016, 69, 818–827. [Google Scholar] [CrossRef]
  39. Halpern, B.S.; Walbridge, S.; Selkoe, K.A.; Kappel, C.V.; Micheli, F.; d’Agrosa, C.; Bruno, J.F.; Casey, K.S.; Ebert, C.; Fox, H.E.; et al. A global map of human impact on marine ecosystems. Science 2008, 1979, 948–952. [Google Scholar] [CrossRef]
  40. Cau, A.; Sbrana, A.; Franceschini, S.; Fiorentino, F.; Follesa, M.C.; Galgani, F.; Garofalo, G.; Gerigny, O.; Profeta, A.; Rinelli, P.; et al. What, where, and when: Spatial-temporal distribution of macro-litter on the seafloor of the western and central Mediterranean sea. Environ. Pollut. 2024, 342, 123028. [Google Scholar] [CrossRef]
  41. Canals, M.; Pham, C.K.; Bergmann, M.; Gutow, L.; Hanke, G.; Van Sebille, E.; Angiolillo, M.; Buhl-Mortensen, L.; Cau, A.; Ioakeimidis, C.; et al. The quest for seafloor macrolitter: A critical review of background knowledge, current methods and future prospects. Environ. Res. Lett. 2021, 16, 023001. [Google Scholar] [CrossRef]
  42. Li, J.; Shan, E.; Zhao, J.; Teng, J.; Wang, Q. The factors influencing the vertical transport of microplastics in marine environment: A review. Sci. Total Environ. 2023, 870, 161893. [Google Scholar] [CrossRef]
  43. Amaral-Zettler, L.A.; Zettler, E.R.; Mincer, T.J. Ecology of the plastisphere. Nat. Rev. Microbiol. 2020, 18, 139–151. [Google Scholar] [CrossRef]
  44. Liro, M.; Zielonka, A.; van Emmerik, T.H.M. Macroplastic fragmentation in rivers. Environ. Int. 2023, 180, 108186. [Google Scholar] [CrossRef] [PubMed]
  45. Ji, C.; Zhang, J.; Liu, G.; Zhang, Q.; Shen, X. A settling velocity formula for irregular shaped microplastic fragments based on new shape factor: Influence of secondary motions. Sci. Total Environ. 2024, 955, 176857. [Google Scholar] [CrossRef]
  46. Fazey, F.M.C.; Ryan, P.G. Biofouling on buoyant marine plastics: An experimental study into the effect of size on surface longevity. Environ. Pollut. 2016, 210, 354–360. [Google Scholar] [CrossRef]
  47. Meng, D.Z.; Li, Y.Z. Assessing the settling velocity of biofilm-encrusted microplastics: Accounting for biofilms as an equivalent to surface roughness. Environ. Sci. Technol. 2024, 58, 1329–1337. [Google Scholar] [CrossRef] [PubMed]
  48. Critchell, K.; Lambrechts, J. Modelling accumulation of marine plastics in the coastal zone; what are the dominant physical processes? Estuar. Coast. Shelf Sci. 2016, 171, 111–122. [Google Scholar] [CrossRef]
  49. Shen, X.; Lin, M.; Chong, H.; Zhang, J.; Li, X.; Robins, P.; Bi, Q.; Zhu, Y.; Zhang, Y.; Chen, Q. Settling and rising velocities of microplastics: Laboratory experiments and lattice Boltzmann modeling. Environ. Pollut. 2024, 363, 125107. [Google Scholar] [CrossRef]
  50. Ji, C.; Zhang, J.; Liu, G.; Zhang, Q.; Xing, E. Towards better predicting the settling velocity of film-shaped microplastics based on experiment and simulation data. Mar. Pollut. Bull. 2024, 203, 116493. [Google Scholar] [CrossRef]
  51. Zhang, Z.; Wu, H.; Peng, G.; Xu, P.; Li, D. Coastal ocean dynamics reduce the export of microplastics to the open ocean. Sci. Total Environ. 2020, 713, 136634. [Google Scholar] [CrossRef] [PubMed]
  52. Turrell, W.R. How litter moves along a macrotidal mid-latitude coast exposed to a coastal current. Mar. Pollut. Bull. 2020, 160, 111600. [Google Scholar] [CrossRef]
  53. Chen, Z.; Bowen, M.; Li, G.Y.; Coco, G.; Hall, B. Retention and dispersion of buoyant plastic debris in a well-mixed estuary from drifter observations. Mar. Pollut. Bull. 2022, 180, 113793. [Google Scholar] [CrossRef] [PubMed]
Figure 1. Sampling sites in the Bohai Sea and Yellow Sea.
Jmse 13 01887 g001
Figure 2. Litter discharge location, annual total amount (a), and monthly allocations (b).
Jmse 13 01887 g002
Figure 3. Comparison of FMML distribution patterns in summer and autumn in 2021. (a) field observation numbers in summer; (b) simulated densities in summer; (c) field observation numbers in autumn; (d) simulated densities in autumn. The red boxes represent FMML hotspots from observation and model.
Jmse 13 01887 g003
Figure 4. Seasonal variation of FMML distribution (top) and monthly mean current field (bottom) in the BYS.
Jmse 13 01887 g004
Figure 5. FMML transport pathways from source areas: (a) Liaodong Bay, (b) Bohai Bay, (c) Laizhou Bay, (d) northern Yellow Sea, (e) northern Shandong Peninsula coastal waters, and (f) northern Jiangsu coastal waters.
Jmse 13 01887 g005
Figure 6. Source tracking of three typical FMML hotspots in the BYS in summer 2021 (FMML hotspots in the central of the North Yellow Sea (a), the southeastern of Chengshan Cape (b), and the offshore waters of northern Jiangsu (c); among them, the red dots represent the sources of FMML, and the blue dots represent the hotspots where FMML sinks.
Jmse 13 01887 g006
Disclaimer/Publisher’s Note: The statements, opinions and data contained in all publications are solely those of the individual author(s) and contributor(s) and not of MDPI and/or the editor(s). MDPI and/or the editor(s) disclaim responsibility for any injury to people or property resulting from any ideas, methods, instructions or products referred to in the content.