Abstract
Tidal inlets regulate the exchange of water and sediment between the open sea and adjacent basins. In many locations, engineering interventions combined with coastal protections and polders have intensified erosion and scouring. This study reports on a three-year monitoring program following the implementation of a Nature-based Solution (NbS) at a previous engineering tidal inlet in the Zwin, located along the Belgian–Dutch coast. In 2019, large-scale modifications to the intertidal zone and the opening of a dyke doubled the surface area of the tidal inlet and its associated tidal marsh. Results revealed rapid and substantial morphological adjustments: the main channel deepened, widened, and migrated eastward. Sediment balance analyses showed stability at the inlet entrance but material loss further inland. Tidal prism and cross-sectional measurements indicated a fourfold increase in tidal prism immediately after NbS implementation, triggering strong channel responses. Within a year, the channel cross-sectional area reached a new equilibrium, which remained stable in the following years. These patterns highlight active sediment transport driven by coupled hydrodynamic and morphodynamic processes. Using an extensive data set, a conceptual model is presented to illustrate how the NbS influenced tidal inlet dynamics through the interaction of flow and sedimentation processes.
1. Introduction
The tidal inlets are common systems, acting as a conduct to exchange water and sediment between the sea and the inland water basins. Primary tidal inlet systems are present along many sandy coastlines chains of barrier islands, e.g., [1,2,3]. The morphodynamics of these systems have been studied extensively [4,5,6] and many empirical relationships have been found, e.g., [2,4,7]. This contrasts with the limited studies on secondary tidal inlet systems. They typically occur in breached sandbank systems or along dune areas with low-lying former beach plains that function as back-barrier basins [8]. These systems are connected to the sea by a small channel, often bordered by tidal marshes. Breached sandbank inlets are generally short-lived, persisting for only a few years, whereas breaches through foredunes may remain open for decades or longer. Secondary tidal inlets are usually only a few meters wide and long, with tidal prisms ranging from 105 to 106 m3 [9]. The bed level in both the back-barrier basin and the inlet itself is relatively elevated, which creates large variations in the wet basin area between fair-weather and storm conditions and leads to the truncation of the tidal signal [10]. These distinctive morphological features strongly influence the morphodynamic evolution of secondary tidal inlet systems. Their size and controlling processes are closely linked to those of ephemeral inlets (intermittently open/closed inlets) and washover systems [11,12].
Throughout their development from formation, maintenance, to eventual degeneration, three hydrodynamic forcings are dominant: tidal currents, waves, and storm surges [4]. However, these natural processes can be strongly influenced by human activities. For engineering inlets, characterized by hard engineering structures such as dykes, jetties, and breakwaters, the hydrodynamic processes are constrained, limiting the evolution of the cross-sectional area to vertical adjustment in bed elevation. The fixed boundaries at both sides of the inlet constrict and accelerate the flow, leading to the scouring of the order of tens of meters high, and generally preventing the formation of shoals and multiple channels [13]. The environmental and economic importance of tidal inlets makes it crucial to protect this environment. Today, Nature-based Solutions (NbS), inspired and supported by nature, are increasingly being promoted as effective approaches to address the growing vulnerability of coastal areas to erosion and flooding risks [14]. These approaches harness the natural functions of ecosystems to help reduce the impacts of coastal hazards. The implementation of NbS in engineering tidal inlets poses major challenges with respect to navigation channel maintenance, coastline stability, and inland flooding.
The Belgian coast has been marked by recurring cycles of barrier breaching and storm surge-induced intrusions, leading to coastal plain flooding, inlet scouring, silting of inundated areas, reduced tidal flow, and eventual inlet closure through spit formation. Over the past millennium, these natural cycles have been increasingly accelerated by human interventions, primarily through two key mechanisms: (1) artificial land reclamation, which reduces the tidal prism associated with an inlet more rapidly than it would occur under natural conditions, and (2) drainage of reclaimed or silted-up areas through networks of ditches to improve agricultural usability. In peat-rich areas, this drainage causes significant volume reduction due to peat oxidation and compaction, leading to land subsidence. A notable side effect of land reclamation is the inhibition of natural surface aggradation through sediment deposition during flood events. A clear example is the Zwin tidal inlet, the last active tidal inlet along the Belgian coast, where the marsh surface now stands approximately 1 m higher than the surrounding polder landscape [15]. In modern times, the surface area of the Zwin has been progressively reduced to accommodate expanding agricultural demands, leading to a decline in the ecological services provided by the tidal inlet. Additionally, continuous sediment deposition has occurred due to local tidal asymmetry, characterized by a shorter, faster flood phase and a longer, slower ebb phase. This asymmetry promotes net sediment import, leading to excessive sedimentation, which threatens the local biological diversity. To restore its ecological function and mitigate the excessive sedimentation, a NbS was implemented at a secondary tidal inlet within the Zwin (Figure 1).
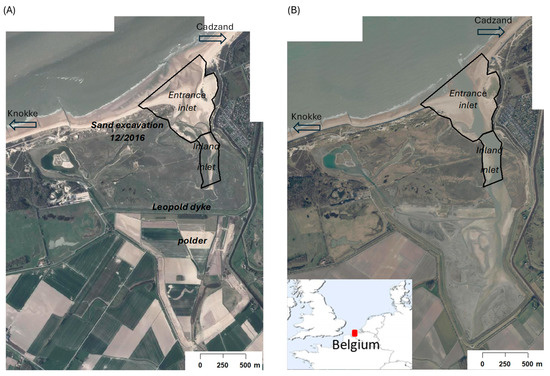
Figure 1.
Study site (A) before and (B) after the opening of the dyke.
At the beginning of the millennium, the Zwin inlet covered a much larger surface area, but successive human interventions aimed at expanding agricultural land led to a significant reduction in its size. Large scale intervention works took place in the Zwin from August 2016 to February 2019 (Table 1), aiming to increase the tidal prism by enabling more and faster seawater flow in and out of the channel in order to reduce the silting process. Specifically, the intention of the channel extension was to allow three times as much seawater to flow in and out by increasing the tidal prism up to 1 million m3. In preparation for the intertidal expansion of the Zwin, important excavation works were carried out in the channel and the dunes located west of the channel mouth in 2016–2017. This intervention involved a total estimated removal of about 426,400 m3 sediments. The intertidal area of about 150 ha was doubled to about 333 ha by depoldering the Leopold polder. Then, the actual expansion took place on 4 February 2019 when a large breach was dug in the Leopold dyke, separating the existing intertidal area from the newly floodable area (Figure 2). The goal of this NbS implementation is to support nature in order to simultaneously provide environmental, social, and economic benefits and help build coastal resilience.

Table 1.
Timeline of the intervention and the LiDAR surveys at the study site.
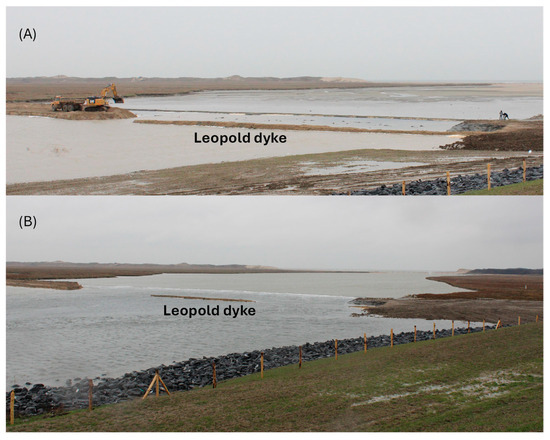
Figure 2.
Opening of the dyke on 4 February 2019. (A) During the beaching of the dyke; and (B) few hours later. Figure 1 displays the location.
The implementation of NbS in the Zwin aimed to develop sustainable nature management by enhancing the natural dynamism of the inlet system and restoring several important types of habitats. Extensive topographic monitoring was carried out before and after the extension of the intertidal area over a three-year period during which significant morphological evolution was anticipated. These data enabled the evaluation of whether the interventions met their intended objectives and provided insight into the morphological response of the system. The aim of the present study is to improve understanding of the temporal evolution of secondary tidal inlet system such as the Zwin. For the first time, morphological changes are reported following the implementation of NbS measures.
2. Materials and Methods
2.1. Study Site
The Zwin inlet is composed of a main channel exceeding 1.3 km in length from the seaward entrance to the most inland branches of the inlet (Figure 3). It is a macrotidal system with a tidal range from 3.5 at neap tides to 5 m at spring tides, dominated by the semi-diurnal component of the tide. The Zwin tidal inlet intersects the beach plain backed by the Belgian and Dutch coastal dunes. The sand flat is characterized by dynamic sandy bedforms and rimmed by tidal flats backed by tidal marshes above 4 m TAW (vertical reference datum corresponding to the low spring tide in Ostend) at the western side of the inlet, while an intertidal beach with dunes is present at the eastward side. The entrance inlet unit, controlled by both waves and tides, has a main tidal channel which is approximately 200 m wide and oriented 170–350° (SSE-NNW). Its bed elevation is around 1.2 m TAW in the seaward part while it is slightly shallower in the more landward part of the inlet. The sandy bedforms consisting of banks and bars as well as secondary channels give the main channel a morphologically meandering and dynamic character. The inland inlet unit, controlled just by tides, includes the inland continuation of the tidal channel oriented 140–320° in the seaward part, while in the landward part its orientation is 180–360°. The channel is generally less than 100 m wide, with an average bed elevation of 2 m TAW. It undergoes multiple bifurcations, creating a complex network of small meandering channels and tidal flats. This results in temporal and spatial variability in channel width. The inlet is mainly characterized by sand with a D50 ranging from 360 to 650 µm. There is no other fresh water input except for precipitations.
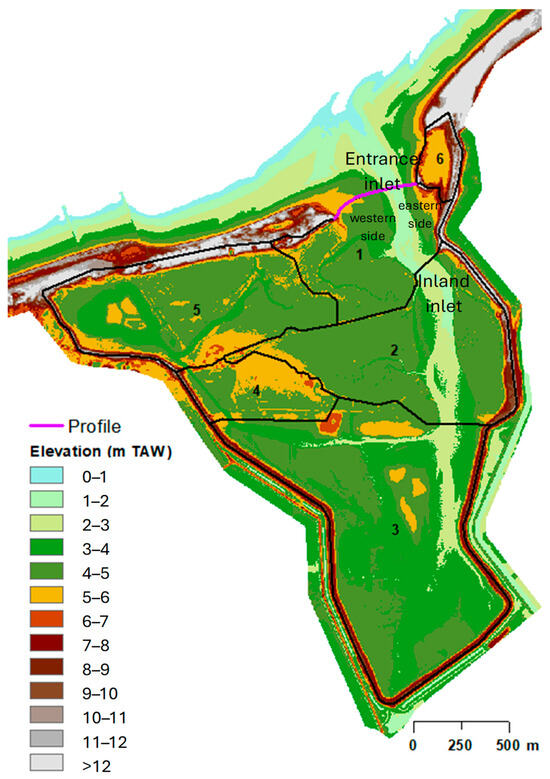
Figure 3.
Topography from the LiDAR DEM on 23 February 2022 with the delimited zones of the tidal prism calculation.
2.2. LiDAR Survey Acquisition and Processing
Airborne topographic LiDAR surveys were commissioned along the entire coast by the Coastal Division. The required specification of the commission of the LiDAR surveys was to measure the topography from the dunes to the low water line along the entire Belgian coast. The required point density was a minimum of 8 pts/m2, evenly distributed over the terrain surface, with four returns registered per pulse. Additionally, a maximum water level of +0.75 m TAW during flight was specified. Finally, an altimetric accuracy better than 0.05 m on hard or unvegetated surfaces, and a horizontal accuracy better than 0.10 m, were required. Data therefore belongs to this governmental authority. Surveys were usually carried out at low tide (Table 1). However, some small areas do not drain completely at low tide. Here, no signal from the ground surface was obtained. For each survey, the elevation point clouds (x, y, z), corresponding to the ground points, with a density of ≥5 points/m2 were used to generate a Triangulated Irregular Network (TIN). This was then converted to a Digital Elevation Model (DEM) with 2 m cell size in 2016 and 1 m cell size for the recent surveys resulting from the point density. Then, DEMs of difference were calculated from the DEMs, by subtracting the elevations in each grid, on a cell-by-cell basis, in order to visualize the morphological changes. The survey error (root-mean-square) is below 0.03 m based on 225 ground check points.
2.3. Calculation of the Tidal Prism and Cross-Sectional Area
The tidal prism of the Zwin inlet was calculated from the LiDAR DEMs on an ArcGIS system. Based on the morphology derived from the surveys performed at low water, six distinct areas were defined, corresponding to parts of the intertidal basin that are successively flooded during the rising tide (Figure 3). Zones 2, 3, 4, and 5 were progressively flooded through the tide cycle while Zone 6 remained mainly dry due to the presence of high dunes. The contributions of all partial areas were aggregated to calculate the tidal prism for two key cross-sections: one at the inlet entrance and another at the boundary between Zone 1 and Zone 2. This calculation was performed for water levels ranging from 3 to 6 m TAW, using a vertical resolution of 0.1 m. The method used for tidal prism estimation is illustrated in Figure 4. It was applied across all LiDAR surveys, enabling the assessment of tidal prism variation with water level for each data set.
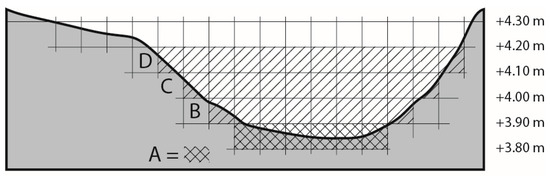
Figure 4.
Principle of calculating the tidal prism; cross-sectional area (A), and elevation (B, C, D) of a tidal inlet channel.
The stability condition is applied to tidal inlets with the relationship between the cross-sectional area, A (m2), of a tidal inlet channel in equilibrium and the tidal prism, P (m3), which is the volume of water flowing with each tidal cycle through it [8,16]. It is reported that a part of the alongshore transport operating in the elevation range of the tidal channel mouth tends to choke and fill the channel. If sufficiently strong, the ebb currents flowing out of the inlet can remove the sand and keep the channel open. A dynamic equilibrium relationship between A and P is assumed to exist at the narrowest part of the tidal channel through the action of the current strength in the channel that is controlled by P and in turns controls A. For a given area, the transport capacity in the channel due to the ebb current equals the relevant part of the coastal longitudinal transport, and the inlet channel is in dynamic equilibrium. Both the cross-sectional area and the tidal prism are usually taken at mean spring tide level. The relationship that links the tidal prism (P) and the minimum cross-sectional area (A) was determined, based on the form [8]:
where c and q are empirical coefficients.
A = cPq
The equilibrium is dynamic because at an event time scale, morphological changes can occur, but an average state can be observed over a time scale of months.
3. Results
3.1. Morphological Evolution
3.1.1. Large-Scale Dynamics of the Inlet
Following the opening of the dyke, significant morphological changes exceeding 2 m in elevation occurred along the channel banks at the yearly scale. However, the changes remain within +/− 0.5 m in most of the area (Figure 5). After 5.5 months (November 2018 to April 2019), the inland inlet experienced a sediment volume loss of approximately −19,040 m3 corresponding to an average elevation decrease of about 0.18 m. During the same period, the sediment volume in the entrance inlet did not significantly change. The sand balance of the inlet area changed after this first period (2019–2020). Between November 2018 and April 2020, the sediment losses reached approximately 36,340 m3 in the entrance inlet and 45,300 m3 in the inland inlet, significantly exceeding the losses observed during the first six months following the dyke opening. Noteworthy, sediment accretion in the entrance inlet dominated in 2022, whereas the inland inlet was still losing sand material. Therefore, sediment loss occurred in the inlet area during the period of 2.2 years after the opening of the dyke, while it was much lower over the period from 2021 to 2022. One contributing factor is likely the sand supply from the coastal nourishments on the adjacent coasts of Knokke and Cadzand. These nourishments resulted in the formation of a large accretion area, approximately 400 m long and 190 m wide on the western side of the entrance inland within the tidal area.
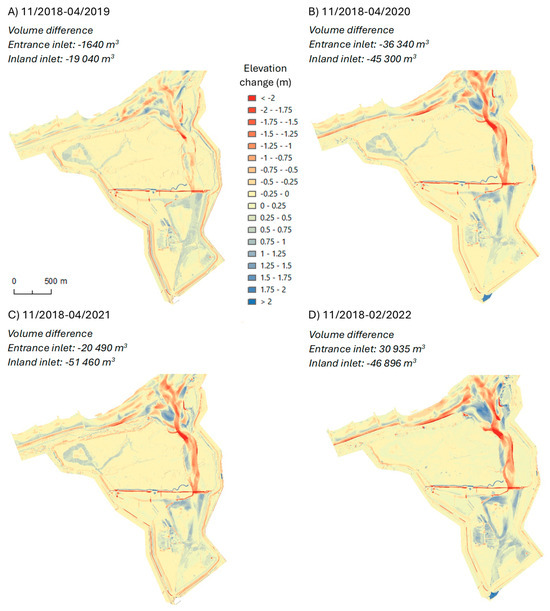
Figure 5.
Morphological evolution of the tidal inlet based on LiDAR DEMs of difference between the pre-opening period of the dyke opening in November 2018 and the recent surveys. Uncertainty for the entrance inlet and inlet is +/− 31,270 m3 and 7530 m3, respectively.
Three years after the large-scale interventions (November 2018 to February 2022), the sediment loss in the inland inlet exceeded 46,890 m3 corresponding to an average bed elevation reduction of 0.58 m over the monitoring period. In contrast, the entrance inlet showed a net sediment gain of 30,940 m3. Significant morphological changes occurred in the main channel which became both deeper and wider. A clear eastward shift in the main channel was observed ranging from 4 to 45 m by February 2022 compared to the pre-opening configuration in November 2018, with an average migration rate of 4 m/year. Additionally, westward channel migration at the border of the entrance inlet and the inland inlet took place, at around 600 m from the seaward entrance. This shift coincided with a decrease in height of the sandbank located along the westward edge. Spatial dynamic variation also occurred in the entrance inlet with alternating zones of accretion and erosion developing parallel to the coast as well as on the edge of the tidal marsh and dune line. This pattern is indicative of the alongshore migration of three-dimensional sandy bedforms likely driven by the littoral drift. In the inland inlet, erosion dominantly along the east side of the channel suggests deepening associated with eastward migration, while the western side of the inland inlet is subject to minor accretion along the edge of the marsh.
3.1.2. Entrance of the Inlet
On 23 February 2022, the survey recorded the lowest channel elevation at 1.3 m TAW, compared to 1.7 m TAW before the dyke opening, indicating a deepening of 0.4 m. A large difference in elevation up to 2.3 m occurred between April 2019 and October 2020 in the center of the channel primarily due to eastward migration of the channel (Figure 6), while subsequent periods saw smaller elevation changes, below 1.3 m. A slightly lower depth in the channel is observed in the later surveys. From 2021 to 2022, the channel migrated approximately 30 m eastward, most likely influenced by the presence of the westward sandbank. Channel width changed over time, expanding from 322 m before the opening to 358 m in April 2021, before decreasing in 2022. Overall, the channel has widened by an average of 40 m since the dyke opening until 2022.
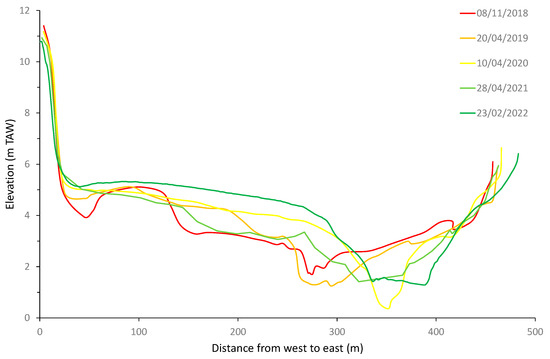
Figure 6.
Cross-channel profiles from November 2018 (pre-opening) to February 2022. Figure 3 displays the location of the profile.
3.2. Evolution of the Tidal Prism
The tidal prism increased gradually with water levels up to approximately +4.7 m TAW, above which flooding of the tidal flats and marshes caused a rapid increase in tidal prism (Figure 7). From the level +5.2 m TAW, the contribution of higher elevation classes remains equal, and therefore there is no extra area to flood, and the contribution is equal to the rise in water level. It can be seen that the tidal prism at water level of +5 m TAW multiplied by about 2.5 when the intertidal area was expanded in February 2019. The proportional increase in the lower elevation classes was even larger. The tidal prism remained relatively stable over the first three years after the expansion, with a maximum recorded in 2020, although the deviation from the other post-expansion surveys was less than 1%.
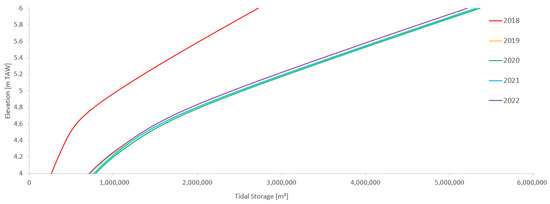
Figure 7.
Evolution of the tidal prism in the entire tidal basin as a function of water level through time.
Both the tidal prism and cross-sectional area at the border of Zone 1 and 2 increased significantly two months after the expansion of the intertidal area (Table 1). The tidal prism nearly quadrupled and then remained stable over the first two years after the expansion. The cross-sectional area first increased by about 25% in April 2019 and by 70% in April 2020, before decreasing to about 66% in April 2021. Although the tidal prism changes post-expansion are within the estimated measurement accuracy, they exhibited a consistent pattern of a slight increase until 2020, followed by a modest decline (Figure 8).
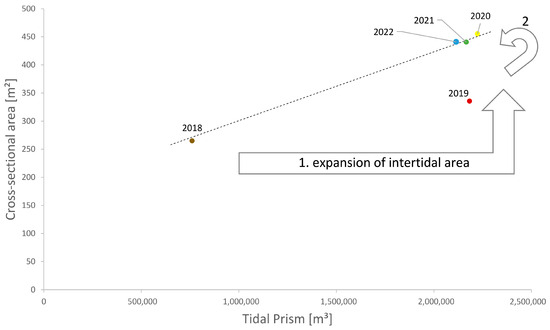
Figure 8.
Cross-sectional area A versus tidal prism P for the successive available surveys in the entire tidal basin.
Following the expansion of the tidal inlet, the channel responded with a clear increase in the cross-section, completing this adjustment by 2020–2021. The morphological change in the considered cross-section was minor, but numerous sandbanks of about 2 km long and parallel to the main channel migrated landward, indicating a net sediment import into the area. This indicates that sediment storage decreased in the lowest part of the main channel, thereby reducing the available accommodation space in this area.
4. Discussion
4.1. Morphological Behavior of the Entrance and Inland Inlet
Hydrodynamic forcings control the direction and magnitude of sediment transport and its divergence, leading to patterns of erosion and accretion, and ultimately shaping the morphology of the topography and coastline [7,17]. Three years after the dyke’s opening in February 2019, significant morphological changes occurred in the entrance inlet. Spatial and temporal morphological changes were observed with alternating accretion and erosion zones either situated parallel to the coast or near to the edge of the tidal marsh and dune line. This footprint was typical of a three-dimensional pattern migration with a complex interplay between sandy bedforms near and inside the inlet channel. Topographic cross-shore profiles (Figure 6) show the channel deepened by nearly 0.4 m at its center, up to 40 m wider. Also, its thalweg moved eastward in 2022 compared to the pre-opening period. In the entrance inlet, the average channel migration rate to the east was 4 m/year which is undoubtfully driven by the eastward longshore drift. Migrating tidal inlets tend to be shallow when they remain open and are subjected to wave and tidal processes, and are controlled by a dominant longshore transport direction [2]. Also, the authors reported that the antecedent topography strongly affects the location of tidal inlets and its dynamics.
The combination of wave-induced and tidal currents are the main forcing factors driving morphological changes in the entrance inlet as reported previously in [18] (Figure 9). A regime of ebb-dominance was found in the channel center, and to a lower degree at its eastern side, while the western side was flood-dominated. Typically, the ebb phase lasts twice as long as the flood phase [19]. Despite high spatial and temporal variability in bedform mobility, sediment volumes in the entrance inlet showed no clear trend since dyke opening. This likely reflects a balance between wave-driven sediment input from the Belgian and Dutch coast as evidenced by the formation of sand spits on both sides and the tidally driven material exported from the entrance inlet. The absence of a developed ebb delta at the Zwin inlet entrance suggests exported sediment is transported offshore or deposited further inland, such as in marshes or tidal accretion zones like the former Leopold polder to the south.
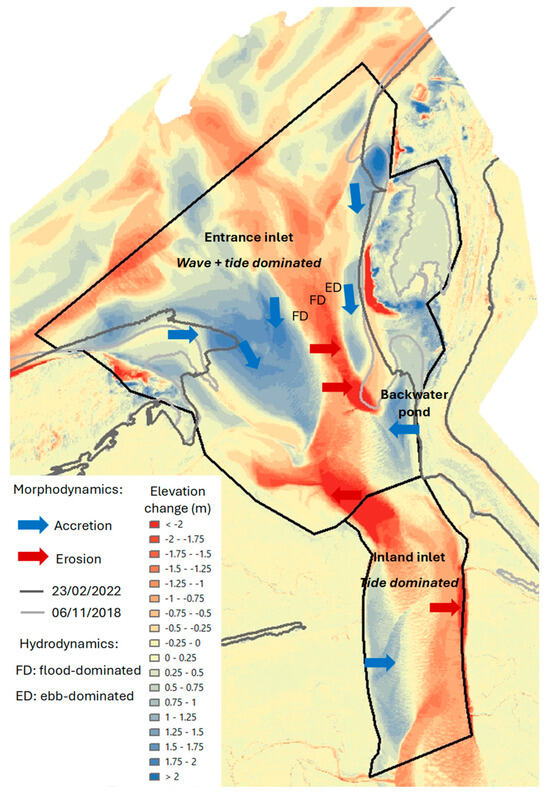
Figure 9.
Conceptual model of the morphological changes and hydrodynamics under calm weather conditions at the Zwin inlet. Arrows indicate the direction of movement of morphology based on successive DEMs. The gray contour lines correspond to 5 m TAW.
The dominant littoral drift has driven the long-term trend of eastward migration for the Zwin channel. The significant erosion in the south-east part of the entrance inlet reflected these dynamics. However, local sand supply from the north, along the Dutch coast, also drove the growth of a spit at the east side of the channel entrance. The combined dynamics of spits and secondary meanders cut off an area along the Dutch basalt dyke which functioned as a backwater pond (Figure 9). Suspended sediment deposited in this area is referred to as the backwater pond effect when water still remains after complete draining of the tidal marsh. Further important morphological changes shaping the inland inlet occurred after the dyke’s opening in 2019. Two opposite morphodynamic trends were observed in the inland inlet: sediment gains at the western side, while erosion dominated the central and east of the inland inlet where a net eastward shifting of the channel has occurred (Figure 5). Approximately 71% of the area that is defined as inland inlet experiences erosion, resulting in an average bed level elevation reduction of 0.44 m over the monitoring period.
Morphodynamic changes within the inland inlet were spatially heterogeneous. As observed in the entrance inlet, the channel deepened up to 1.36 m at multiple locations, where it increased its width and constantly migrated eastward. The eastern side of the inland inlet experienced the highest erosion rates during the first year, with rates decreasing substantially in the next two years. Subsequently, the channel exhibited limited net migration, oscillating laterally in a pattern indicative of a transition toward dynamic equilibrium.
The combination of a narrow channel width and increased discharge post-intervention likely enhanced peak tidal current velocities, thereby accelerating bed erosion and contributing to large-scale channel adjustments, including its progressive eastward shift. Along the channel’s longitudinal profile, erosion and deposition alternated along the banks. While some tendency toward meandering was observed, lateral channel development on the Dutch side was constrained by the presence of a basalt dyke. Therefore, erosion and deposition alternated along the channel banks, with meandering limited on the Dutch side by the basalt dyke. In contrast, the western side of the inland inlet is accreting with sandbanks development. This development, observed since 2019, was likely fed by sediment from the entrance inlet, suggesting a strong interaction between the entrance and inland inlet units. This is in agreement with the observation of the secondary tidal inlet of Slufter (The Netherlands) where the high dynamics seaward end of the channel is strongly connected to the evolution of its landward side [10].
The development of sandbanks and other local topographic bedforms such as meanders and small bars shifting between tidal cycles reflects an active and continuous local bed transport. These secondary features represent localized expression of processes that, over longer periods, shape the overall channel behavior. It was reported [18,20] that the interactions between topography and tidal hydraulics lead to a spatial complexity of the channel and bedforms in the Zwin inlet with a textural trend ranging from coarse sediment and shell deposits in the entrance to fine sediment in the inland inlet. The net sediment input was mainly caused by tidal asymmetry. Additionally, the alongshore coastal sand transport contributes to the long-term trend of the entrance channel eastward shift. This rate was on average 23 m/year before human interventions in the 1980s [19].
4.2. Relationship Between Tidal Prism and Cross-Sectional Area
Just after the opening of the dyke, the channel was not yet in a morphodynamic equilibrium, but this was attained in 2020. In this study, an exponential relationship (Figure 9) was found between the tidal prism (P) and the cross-sectional area (A) for a generic tidal inlet, which was equal to A = 0.52P0.46 (r2 = 0.993). The general A–P relationship and coefficients for inlet channel stability were not confirmed for the Zwin inlet. This is in agreement with [20]. An aspect that may have been overlooked so far is the effect of sediment entering the inlet, although it is indirectly considered through changes in the tidal prism. Existing equilibrium models for inlet channels only consider the balance between sediment infilling driven by longshore transport and sediment removal due to ebb-tidal discharge, without explicitly incorporating external sediment supply. In the Zwin tidal inlet, sediment was also transported by the flood currents from the channel entrance to the tidal marsh. This is a condition that probably arises in nearly all inlets, as they all tend to attract sediment from the marine environment. The changes in time of the A–P relationship observed for the Zwin tidal inlet nevertheless showed a clear and consistent pattern. Sediment transport patterns and directions are important with respect to tidal inlet development, stability, and evolution [7,17,21]. In addition, tidal range and tidal prism as well as sediment supply shape the morphology of the inlets and their relationships with sandy bedforms [2,22].
As expected after the tidal expansion in 2019, the entire inlet changed, responding to both hydrodynamic and morphological feedbacks. Driven by the increasing tidal prism, the access channel adjusted by widening and deepening to accommodate the exchange of larger water volumes. The results show that the intertidal water volume that enters into the Zwin during a tidal cycle strongly depends on the tidal amplitude. In a similar secondary tidal inlet system such as Slufter, ref. [10] reported that the evolution of the secondary tidal system during storms was primarily driven by flooding of the beach plain at the mouth and the tidal marsh areas within the back-barrier basin. This resulted in highly non-uniform flow patterns through the inlet. Furthermore, the maximum water levels reached during storm events were identified as a key factor in understanding the system’s morphological evolution.
Analysis of the tidal prism and cross-sectional indicates that the tidal expansion in 2019 led to a nearly fourfold increase in tidal prism, prompting a rapid and pronounced response in the entrance channel. A large sandbank was rapidly cleared during the first year after expansion. As a result of this, the channel cross-sectional area attained a new equilibrium around 450 m2 in April 2020. Both tidal prism and cross-sectional areas at the border of Zones 1 and 2 significantly increased at the moment of expansion, with the tidal prism remaining stable during the first two years that followed. The entrance channel responded rapidly and significantly followed the opening of the dyke. This indicates that the implementation of NbS in the Zwin through the extension of the tidal inlet and the opening of the dyke can be considered successful three years after its execution.
5. Conclusions
This study presents the first assessment of a NbS applied to a previously engineered tidal inlet in a macrotidal, semi-diurnal setting. In February 2019, the Zwin tidal inlet, located along the Belgian–Dutch coast, underwent major modifications with the removal of the inland dyke, extending the intertidal area. This intervention triggered rapid and significant morphological changes during the first year, after which the system reached a dynamic equilibrium over the next two years.
The morphodynamics of the entrance inlet reflected the combined influence of waves, tidal hydrodynamics, and sediment supply, with sand input playing a key role. The main channel deepened considerably at its center, widened noticeably, and its thalweg shifted eastward. Despite marked spatial and temporal variability, sediment volume in the entrance inlet remained relatively stable since the dyke’s opening. This stability is likely the result of a balance between sediment inputs from the Belgian and Dutch coasts as observed by the formation of sand spits on both sides and the material exporting more inland from the entrance area. In contrast, the inland inlet experienced overall erosion, with substantial deepening, channel widening, and eastward migration. Strong tidal currents in and near the channel maintained its openness, but the area showed a net loss of sediment volume, expressed as general bed lowering. These changes were uneven in both space and time. The increased tidal storage capacity following the NbS implementation drove widening and deepening of the access channel to accommodate greater tidal exchange. Immediately after the intervention, the tidal prism and channel cross-sectional area increased sharply. The tidal prism quadrupled and remained stable during the first two years, while the cross-sectional area grew by 70% within one year. The entrance channel thus responded quickly and strongly to the dyke removal. Three years post-extension, the tidal channel operates as designed, achieving more than the targeted threefold increase in water exchange.
Each tidal cycle now supplies sufficient water to maintain the wetland character of the Zwin inlet, confirming the NbS as a successful intervention. Nonetheless, given the strong tidal asymmetry and associated currents, medium- to long-term sedimentation within the inlet remains possible. Periodic monitoring is recommended to detect eventual trends in cumulative sediment deposition, enabling early intervention to restore equilibrium.
The proposed conceptual model integrates hydrodynamic and sedimentation processes to explain the inlet’s response, and it offers a practical framework for applying NbS approaches to similar tidal environments.
Author Contributions
Conceptualization, A.-L.M. and S.D.; methodology, A.-L.M. and R.H.; validation, A.-L.M. and R.H.; formal analysis, A.-L.M. and R.H.; investigation, A.-L.M.; writing—original draft preparation, A.-L.M.; writing—review and editing, A.-L.M., S.D., R.H. and T.V.; visualization, A.-L.M. and R.H.; project administration, funding acquisition, S.D. All authors have read and agreed to the published version of the manuscript.
Funding
The research was internally funded by the Flemish Government, through the joint support of MDK Coastal Division and Flanders Hydraulics.
Data Availability Statement
The original contributions presented in this study are included in the article. Further inquiries can be directed to the corresponding author.
Acknowledgments
The authors acknowledge the Agency for Maritime and Coastal Services, Coastal Division and Flanders Hydraulics for funding the monitoring project and providing data access. The data supporting this study are available upon request.
Conflicts of Interest
Author Anne-Lise Montreuil was employed by the company Antea Group Belgium. Author Rik Houthuys was employed by the company Geoconsultant. The remaining authors declare that the research was conducted in the absence of any commercial or financial relationships that could be construed as a potential conflict of interest.
References
- Hubbard, D.K.; Oertel, G.F.; Nummedal, D. The role of waves and tidal currents in the development of tidal-inlet sedimentological structures and sand body geometry: Examples from North Carolina, South Carolina and Georgia. J. Sediment. Petrol. 1979, 49, 1073–1093. [Google Scholar]
- Fitzgerald, D. Understanding Physical Processes at Tidal Inlets: Based on Contributions by Panel on Scoping Field and Laboratory Investigations in Coastal Inlet Research. J. Coast. Res. 1996, 23, 47–71. [Google Scholar]
- Robin, N.; Levoy, F.; Monfort, O. Bar morphodynamic behaviour on the ebb delta of a macrotidal inlet (Normandy, France). J. Coast. Res. 2007, 23, 1370–1378. [Google Scholar] [CrossRef]
- De Swart, H.E.; Zimmerman, J.T.F. Morhodynamics of tidal inlet systems. Annu. Rev. Fluid Mech. 2009, 41, 203–229. [Google Scholar] [CrossRef]
- Pearson, S.G.; Elias, E.P.; van Prooijen, B.C.; van der Vegt, H.; van der Spek, A.J.; Wang, Z.B. A novel approach to mapping ebb-tidal delta morphodynamics and stratigraphy. Geomorphology 2022, 405, 108185. [Google Scholar] [CrossRef]
- Duong, T.M.; Ranasinghe, R.; Walstra, D.; Roelvink, D. Assessing climate change impacts on the stability of small tidal inlets: Why and how? Erath Sci. Rev. 2016, 154, 369–380. [Google Scholar] [CrossRef]
- O’Brien, M.P. Estuary tidal prism related to entrance area. Civ. Eng. 1931, 1, 738–739. [Google Scholar]
- Bruun, P. Stability of Tidal Inlets, Theory and Engineering; Elsevier Scientific Publishing Company: Amsterdam, The Netherlands, 1978; p. 376. [Google Scholar]
- Bruun, P.; Gerritsen, F. Stability of Coastal Inlets; North-Holland Publisher: Amsterdam, The Netherlands, 1960; p. 140. [Google Scholar]
- Van Bohemen, H.D. Environmentally friendly coasts: Dune breaches and tidal inlets in the foredunes. Environmental engineering and coastal management: A case study from the Netherlands. Landsc. Urban Plan. 1996, 34, 197–2313. [Google Scholar] [CrossRef]
- Van der Vegt, M.; Hoekstra, P. Morphodynamics of a storm-dominated, shallow tidal inlet: The Slufter, the Netherlands. Neth. J. Geosci. 2012, 91, 325–339. [Google Scholar] [CrossRef]
- Lincoln, J.M.; FitzGerald, D.M. Tidal distortions and flood dominance at five small tidal inlets in southern Maine. Mar. Geol. 1988, 82, 133–148. [Google Scholar] [CrossRef]
- Cooper, J.A.G. Geomorphological variability among microtidal estuaries from the wave-dominated South African coast. Geomorphology 2001, 40, 99–122. [Google Scholar] [CrossRef]
- Donnelly, C.; Kraus, N.M.; Larson, M. State of knowledge on measurement and modelling of coastal overwash. J. Coast. Res. 2006, 22, 965–991. [Google Scholar] [CrossRef]
- Broekema, Y.B.; Labeur, R.J.; Uijttewaal, W.S.J. Observations and analysis of the horizontal structure of a tidal jet at deep scour holes. J. Geophys. Res. Earth Surf. 2018, 123, 3162–3189. [Google Scholar] [CrossRef]
- Louarn, A.; Meur-Ferec, C.; Hervé-Fournereau, N. The concept of ‘nature-based solutions’ applied to urban coastal risks: A bibliometric and content analysis review. Ocean. Coast. Manag. 2025, 261, 107530. [Google Scholar] [CrossRef]
- Stive, M.J.F.; Van de Kreeke, J.; Lam, N.T.; Tung, T.T.; Ranasinghi, R. Empirical relationships between inlet cross-section and tidal prism: A review. Proc. Coast. Dyn. 2009, 1–10. [Google Scholar] [CrossRef]
- Davis, R.A.; Hayes, M.O. What is a wave-dominated coast? Mar. Geol. 1984, 60, 313–329. [Google Scholar] [CrossRef]
- Trouw, K.; Zimmermann, N.; Wang, L.i.; De Maerschalck, B.; Delgado, R.; Verwaest, T.; Mostaert, F. Scientific Support Regarding Hydrodynamics and Sand Transport in the Coastal Zone: Literature and Data Review Coastal Zone Zeebrugge—Zwin; Version 4_0. WL Rapporten, 12_107; Flanders Hydraulics Research: Antwerp, Belgium, 2015; p. 75. [Google Scholar]
- Montreuil, A.-L.; Dan, S.; Verwaest, T.; Mostaert, F. Monitoring the Morphodynamics of the Zwin Inlet: Interim Report: 3 Years After the Works; Version 0.1. FHR Reports, 16_089_3; Flanders Hydraulics Research: Antwerp, Belgium, 2022; p. 59. [Google Scholar]
- Bouwman, D. Morphodynamics of stagnating Zwin inlet, the Netherlands. Sediment. Geol. 1993, 84, 219–239. [Google Scholar] [CrossRef]
- O’Brien, M.P.; Dean, R.G. Hydraulics and sedimentary stability of coastal inlets. Coast. Eng. 1971, 11, 761–779. [Google Scholar]
Disclaimer/Publisher’s Note: The statements, opinions and data contained in all publications are solely those of the individual author(s) and contributor(s) and not of MDPI and/or the editor(s). MDPI and/or the editor(s) disclaim responsibility for any injury to people or property resulting from any ideas, methods, instructions or products referred to in the content. |
© 2025 by the authors. Licensee MDPI, Basel, Switzerland. This article is an open access article distributed under the terms and conditions of the Creative Commons Attribution (CC BY) license (https://creativecommons.org/licenses/by/4.0/).