Article

A Pipeline Hoop Stress Measurement Method Based on Propagation Path Correction of LCR Waves

1
School of Materials Science and Engineering, Southwest Jiaotong University, Chengdu 610031, China
2
Northwest Branch of PipeChina, Xi’an 710018, China
*
Authors to whom correspondence should be addressed.
J. Mar. Sci. Eng. 2025, 13(10), 1845; https://doi.org/10.3390/jmse13101845
Submission received: 27 August 2025 / Revised: 19 September 2025 / Accepted: 21 September 2025 / Published: 24 September 2025
(This article belongs to the Special Issue Offshore Pipes and Energy Equipment)

Abstract

Pipelines are extensively used in offshore equipment. Accurate and non-destructive measurement of hoop stress conditions within pipes is critical for ensuring the integrity of offshore structures. However, the existing technology to measure the hoop stress of the pipeline needs to planarize the surface of the pipeline, which greatly limits the detection efficiency. This study proposes a method for pipeline hoop stress measurement using a planar longitudinal critically refracted (LCR) probe, based on correcting LCR wave-propagation paths, which solves the problem of pipeline planarization in pipeline hoop stress measurement. First, a linear relationship between stress variations and ultrasonic time-of-flight changes in the material was established based on the acoustoelastic effect. Finite element analysis was then used to construct an acoustic simulation model for the hoop direction of the pipeline. Simulation results showed that LCR waves propagated within a wedge as quasi-plane waves and, upon oblique incidence into the pipeline, traveled along the chordal direction. Furthermore, using ray tracing methods, a mapping relationship between the pipeline geometry and the ultrasonic propagation path was established. Based on this, the LCR pipeline hoop stress measurement (LCR-HS) method was proposed. Finally, a C-shaped ring was employed to verify the measurement accuracy of the LCR-HS method. Experimental results indicated that the measurement error decreased with increasing pipe diameter and fell below 8% when the diameter exceeded 400 mm. This method enables precise measurement of hoop stress on curved surfaces by revealing the hoop propagation behavior of LCR waves in pipelines. The findings provide a technical reference for evaluating pipeline stress states, which is of significant importance for assessment of pipeline integrity.

1. Introduction

Pipeline transportation is one of the primary methods for delivering energy resources such as oil and natural gas worldwide [1,2]. Among the key factors affecting the safe operation of oil and gas pipelines, stress plays a crucial role [3,4,5], and stress measurement has gradually become an important approach for pipeline integrity evaluation [6,7,8]. Current non-destructive characterization methods for pipeline stress mainly include the X-ray diffraction method, the indentation technique, the electromagnetic technology, and the ultrasonic method. While comprehensive in coverage, each method exhibits significant limitations that constrain its practical application:
  • The X-ray diffraction method [9,10,11], despite its high accuracy, is fundamentally limited by inherent radiation hazards, slow measurement speed, and stringent surface preparation requirements. These constraints severely restrict its viability for large-scale field applications.
  • The indentation technique [12,13], though semi-destructive, shares similar practical limitations regarding surface preparation and operational efficiency. Critically, their localized damage compromises structural integrity during assessment.
  • Electromagnetic technology [14,15], while effective for identifying stress concentration zones, is fundamentally restricted to qualitative characterization due to low measurement accuracy and an inability to quantify stress magnitudes.
In contrast, the ultrasonic method [16,17,18] is widely employed for stress evaluation in pipeline welds due to its advantages of high measurement speed, good accuracy, and safety for human operators. Notably, the longitudinal critically refracted (LCR) wave technique has emerged as the predominant ultrasonic approach, largely overcoming the field-applicability constraints of alternative methods.
The LCR wave enables inference of the internal stress distribution of materials by measuring their ultrasonic time-of-flight. Existing research has primarily concentrated on the influencing factors [19,20], the signal processing methods [21,22], the depth-direction stress measurement [23], and the plane stress measurement [24]. For example, Li et al. [25] proposed the use of the lifting scheme wavelet packet transform (LSWPT) for denoising LCR wave signals to address the problem of noise suppression. Wang et al. [26] developed a depth-gradient stress measurement model that considers the energy dissipation mechanism at different frequencies during LCR wave propagation, providing a technical reference for ultrasound-based stress measurement in the depth direction. Sun et al. [27] proposed a plane stress measurement method based on arrayed LCR waves, where experimental results indicated that in the range of 0–160 MPa, the measurement errors for stress and angle were less than 8.96 MPa and 6.87°, respectively, with the standard deviations of repeatability below 4.95 MPa and 2.99°. However, conventional LCR wave stress measurement methods typically assume planar geometries, leading to significant inaccuracies when applied to curved surface conditions due to variations in acoustic coupling and refraction of the ultrasonic propagation path.
Petrochemical pipelines generally possess curved surface features, and hoop welds are subject to both axial and hoop stresses. Existing stress measurement techniques are inadequate for adapting to the curved surface condition during pipeline hoop stress measurement. In engineering practice, it is common to use hot grinding to flatten the measurement area in order to meet the planarity requirements of stress measurement. As shown in Figure 1, such surface preparation is typically required for pipeline hoop stress measurement. However, hot grinding introduces operational risks, may damage the component, and can induce additional residual stress, thereby affecting the accuracy of stress measurements. Javadi et al. [28] and Li et al. [29] implemented curved-surface transducer designs to enable stress measurement without surface flattening. Nevertheless, such methods require transducers with specific curvatures tailored to different pipe diameters, lacking versatility and limiting their applicability in field settings. Therefore, there is an urgent need for a pipeline hoop stress measurement method that can adapt to pipes of varying diameters without surface flattening.
In this study, an acoustic simulation model of hoop LCR wave propagation in pipelines using a flat transducer was established to investigate the propagation behavior of LCR waves along the hoop direction. The propagation path and dynamic characteristics of hoop LCR waves in pipelines were clarified. Based on this and the unique geometry of pipelines, a pipeline hoop stress measurement model was developed. It incorporated propagation path correction. This correction calculated ultrasonic propagation paths and time delays using ray tracing. This model effectively compensated for measurement errors caused by the curved surface condition of pipelines. Finally, the measurement accuracy of the proposed model was validated using a C-shaped ring.
In this study, we address the critical limitation of curved-surface adaptability in pipeline stress measurement by establishing an acoustic simulation model for hoop LCR wave propagation using standard flat transducers (unlike the curved transducers [28,29]). The key innovations include: (i) Clarifying the propagation path and acoustic characteristics of hoop LCR waves in pipelines through advanced acoustic modeling and (ii) developing a novel hoop stress measurement model incorporating ray-tracing-based propagation path correction, which universally adapts to varying pipe diameters without surface flattening. The model solves the problem of poor universality of curved transducers (iii) effectively compensating for curvature-induced measurement errors that plague conventional planar-assumption methods [24,25,26,27]. Unlike prior LCR techniques requiring planar grinding, the approach eliminates operational risks and residual stress release while maintaining high accuracy.

2. Measurement Theory

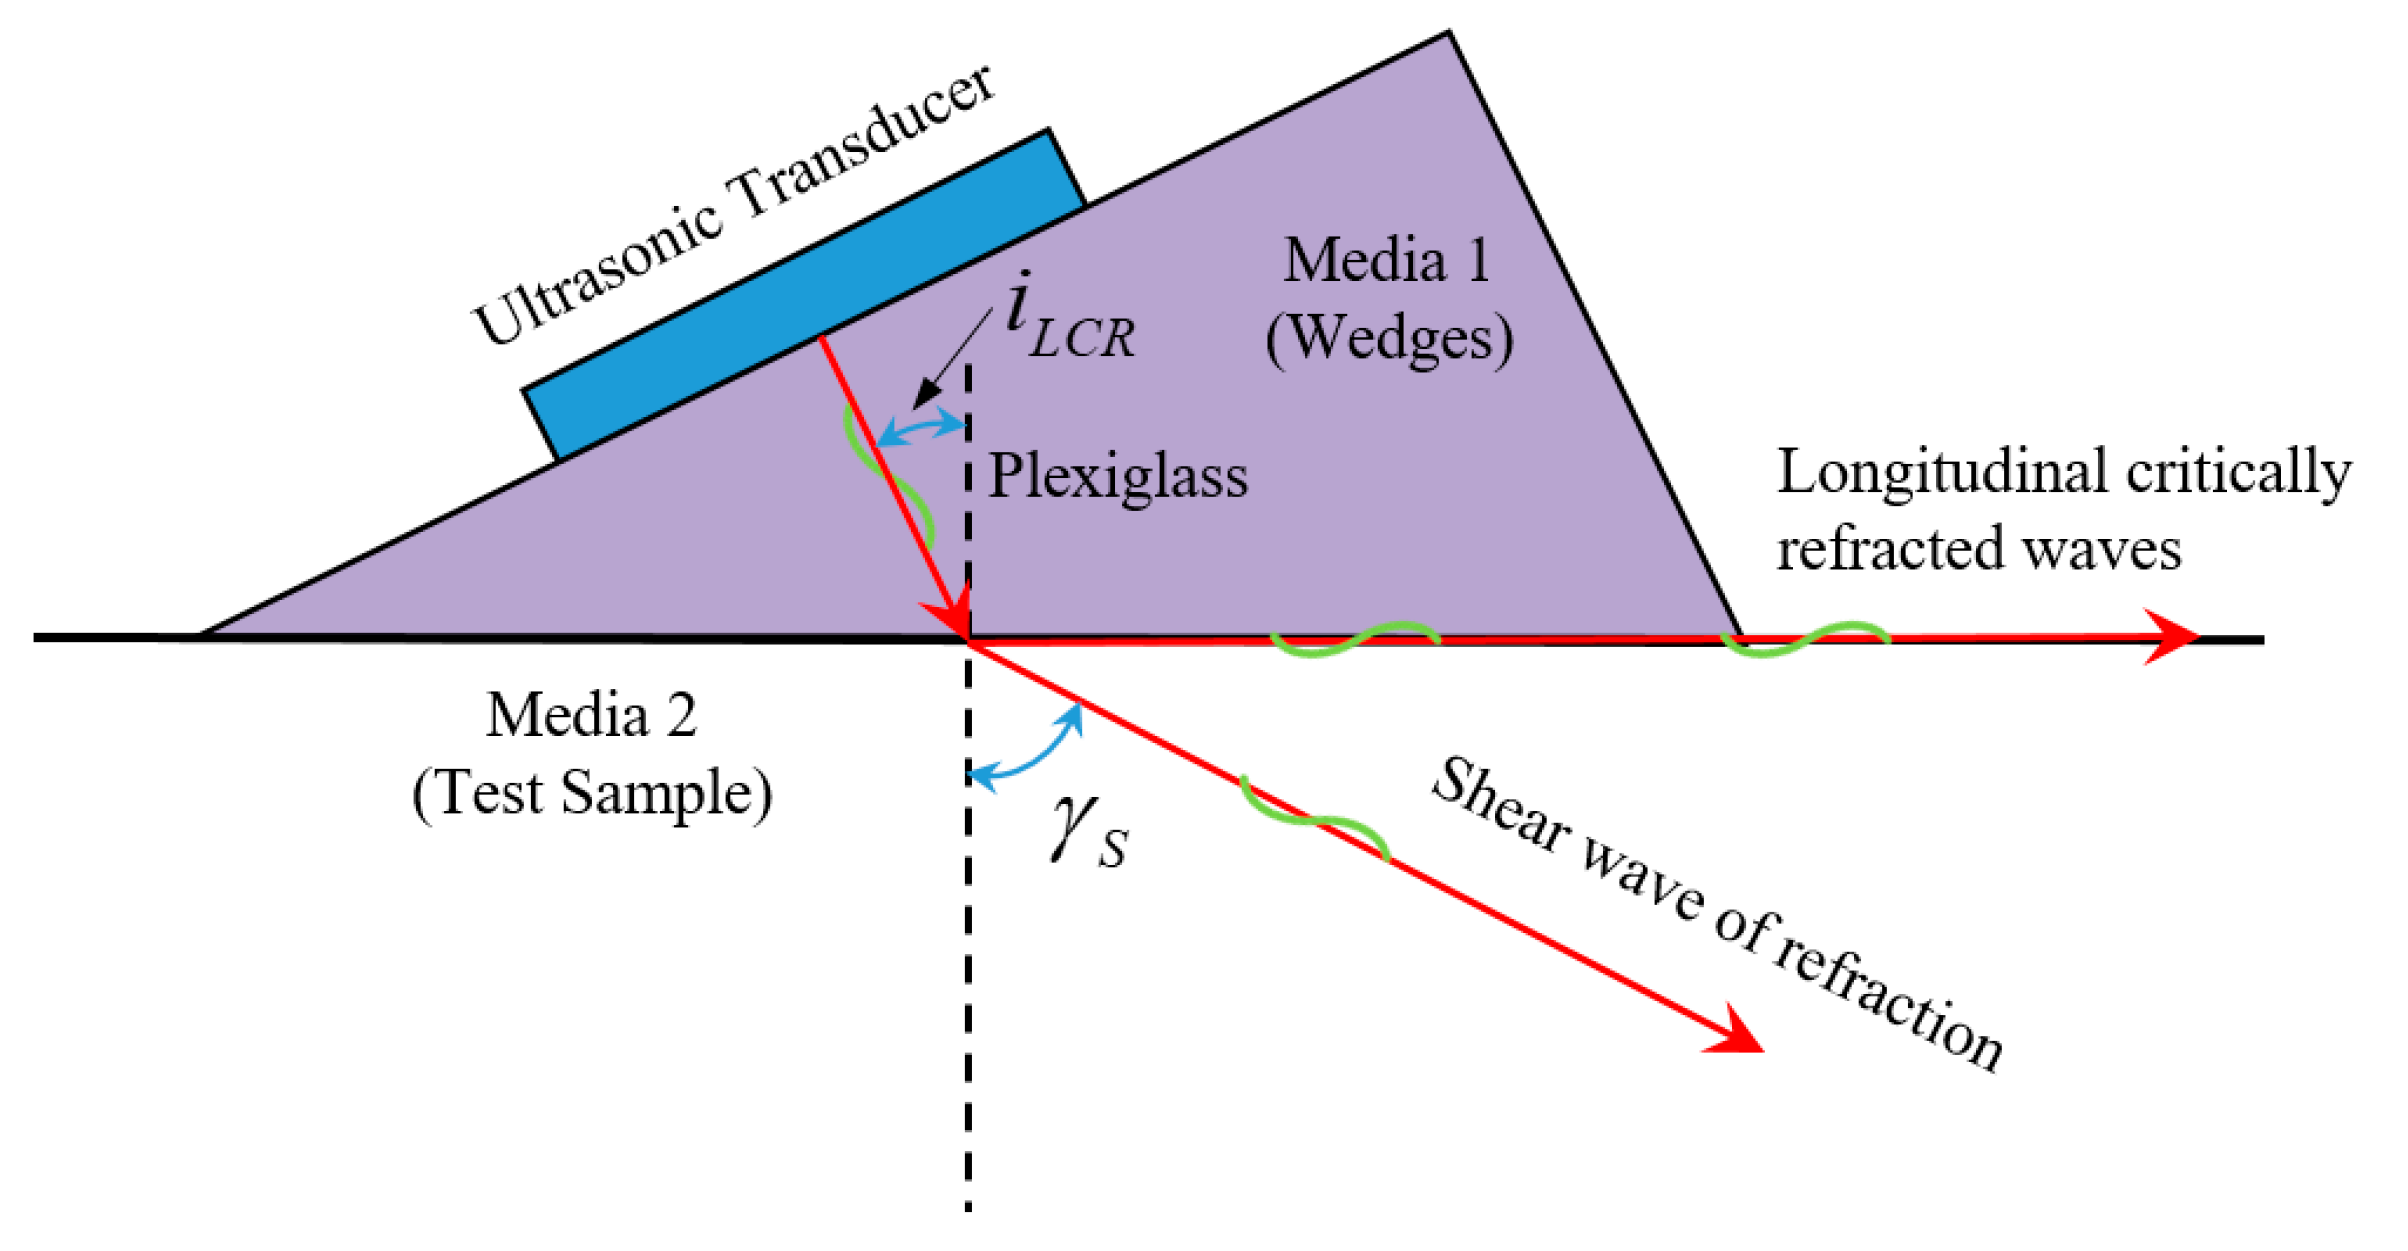
Within the elastic limit, ultrasonic stress evaluation technique relies on the linear relationship between stress and sound wave travel time, i.e., the acoustoelastic effect. Egle et al. [30] established the ultrasonic sensitivity to stress in tensile and compressive loading tests on steel. They proved that the sensitivity of LCR waves to stress is higher than that of other types of ultrasonic waves. The LCR wave propagates parallel to the surface at a certain depth, as shown in Figure 2. The first critical angle can be calculated with the following equation:
i L C R = sin 1 ( V 1 / V 2 )
where V1 and V2 are the propagating velocity in media 1 and 2, iLCR is the first critical angle, and γS is the shear angle of refraction.
The velocities of the longitudinal waves (L-waves) traveling parallel to load can be related to the stress by the following equation [30]:
ρ 0 V 11 2 = λ + 2 μ + σ 3 λ + 2 μ × λ + μ μ 4 λ + 10 μ + 4 m + λ + 2 l
where V11 is the velocity of waves in the direction of media 1 with particle displacement in the direction of media 1; ρ0 is the initial density of material without stress; λ and μ are the second-order elastic constants (Lame’s constants); l and m are the third-order elastic constants (Murnaghan’s constants); σ is the stress.
In the natural state, the sound velocity of the sample can be expressed as:
V 0 = λ + 2 μ ρ 0
Substituting Equation (3) into Equation (2):
V 2 = V 0 2 ( k 1 σ + 1 )
where k1 is the acoustoelastic coefficient. Because Lame’s constants and Murnaghan’s constants of the body hardly change under elastic conditions, k1 can be approximated as a constant using the following equation:
k 1 = 4 λ + 10 μ + 4 m μ ( 3 λ + 2 μ ) + 2 l 3 λ 10 μ 4 m ( λ + 2 μ ) ( 3 λ + 2 μ )
In Equation (4), taking the derivative of V with respect to stress σ gives:
V V 0 2 d V d σ = k 1 2
Stress-induced changes in ultrasonic wave velocity are minimal at low stress levels, supporting the approximation V/V0 ≈ 1. Equation (6) can be simplified to:
d σ = 2 k 1 V 0 d V
Assuming the acoustic path length of the LCR wave in the workpiece is L and its propagation time is t, the derivative of its velocity V with respect to t is expressed as:
d V = L t 2 d t
Substituting Equation (8) into Equation (7):
d σ = 2 L k 1 V 0 t 2 d t
Since the acoustoelastic effect is negligible, tt0 can be assumed, and Equation (9) can be further simplified to:
d σ = K d t
where K is the stress coefficient of the work piece:
K = 2 V 0 3 λ + 2 μ k 1 L
The relationship between stress and acoustic time difference can thus be obtained through Equation (10).

3. Simulation Analysis

An acoustic simulation model for pipeline hoop stress is established using COMSOL Multiphysics 6.1, as shown in Figure 3. The acoustic simulation model uses the DG-FEM method with a grid size of 1/2 wavelength. The boundary conditions of the model are absorbing boundary and free boundary. The location of the absorbing boundary is shown in Figure 3, and the other boundaries are free boundary. The test component is a 30° arc with an outer diameter of 80 mm and a thickness of 10 mm. Water was used as the coupling layer. The material parameters used in the simulation are listed in Table 1.
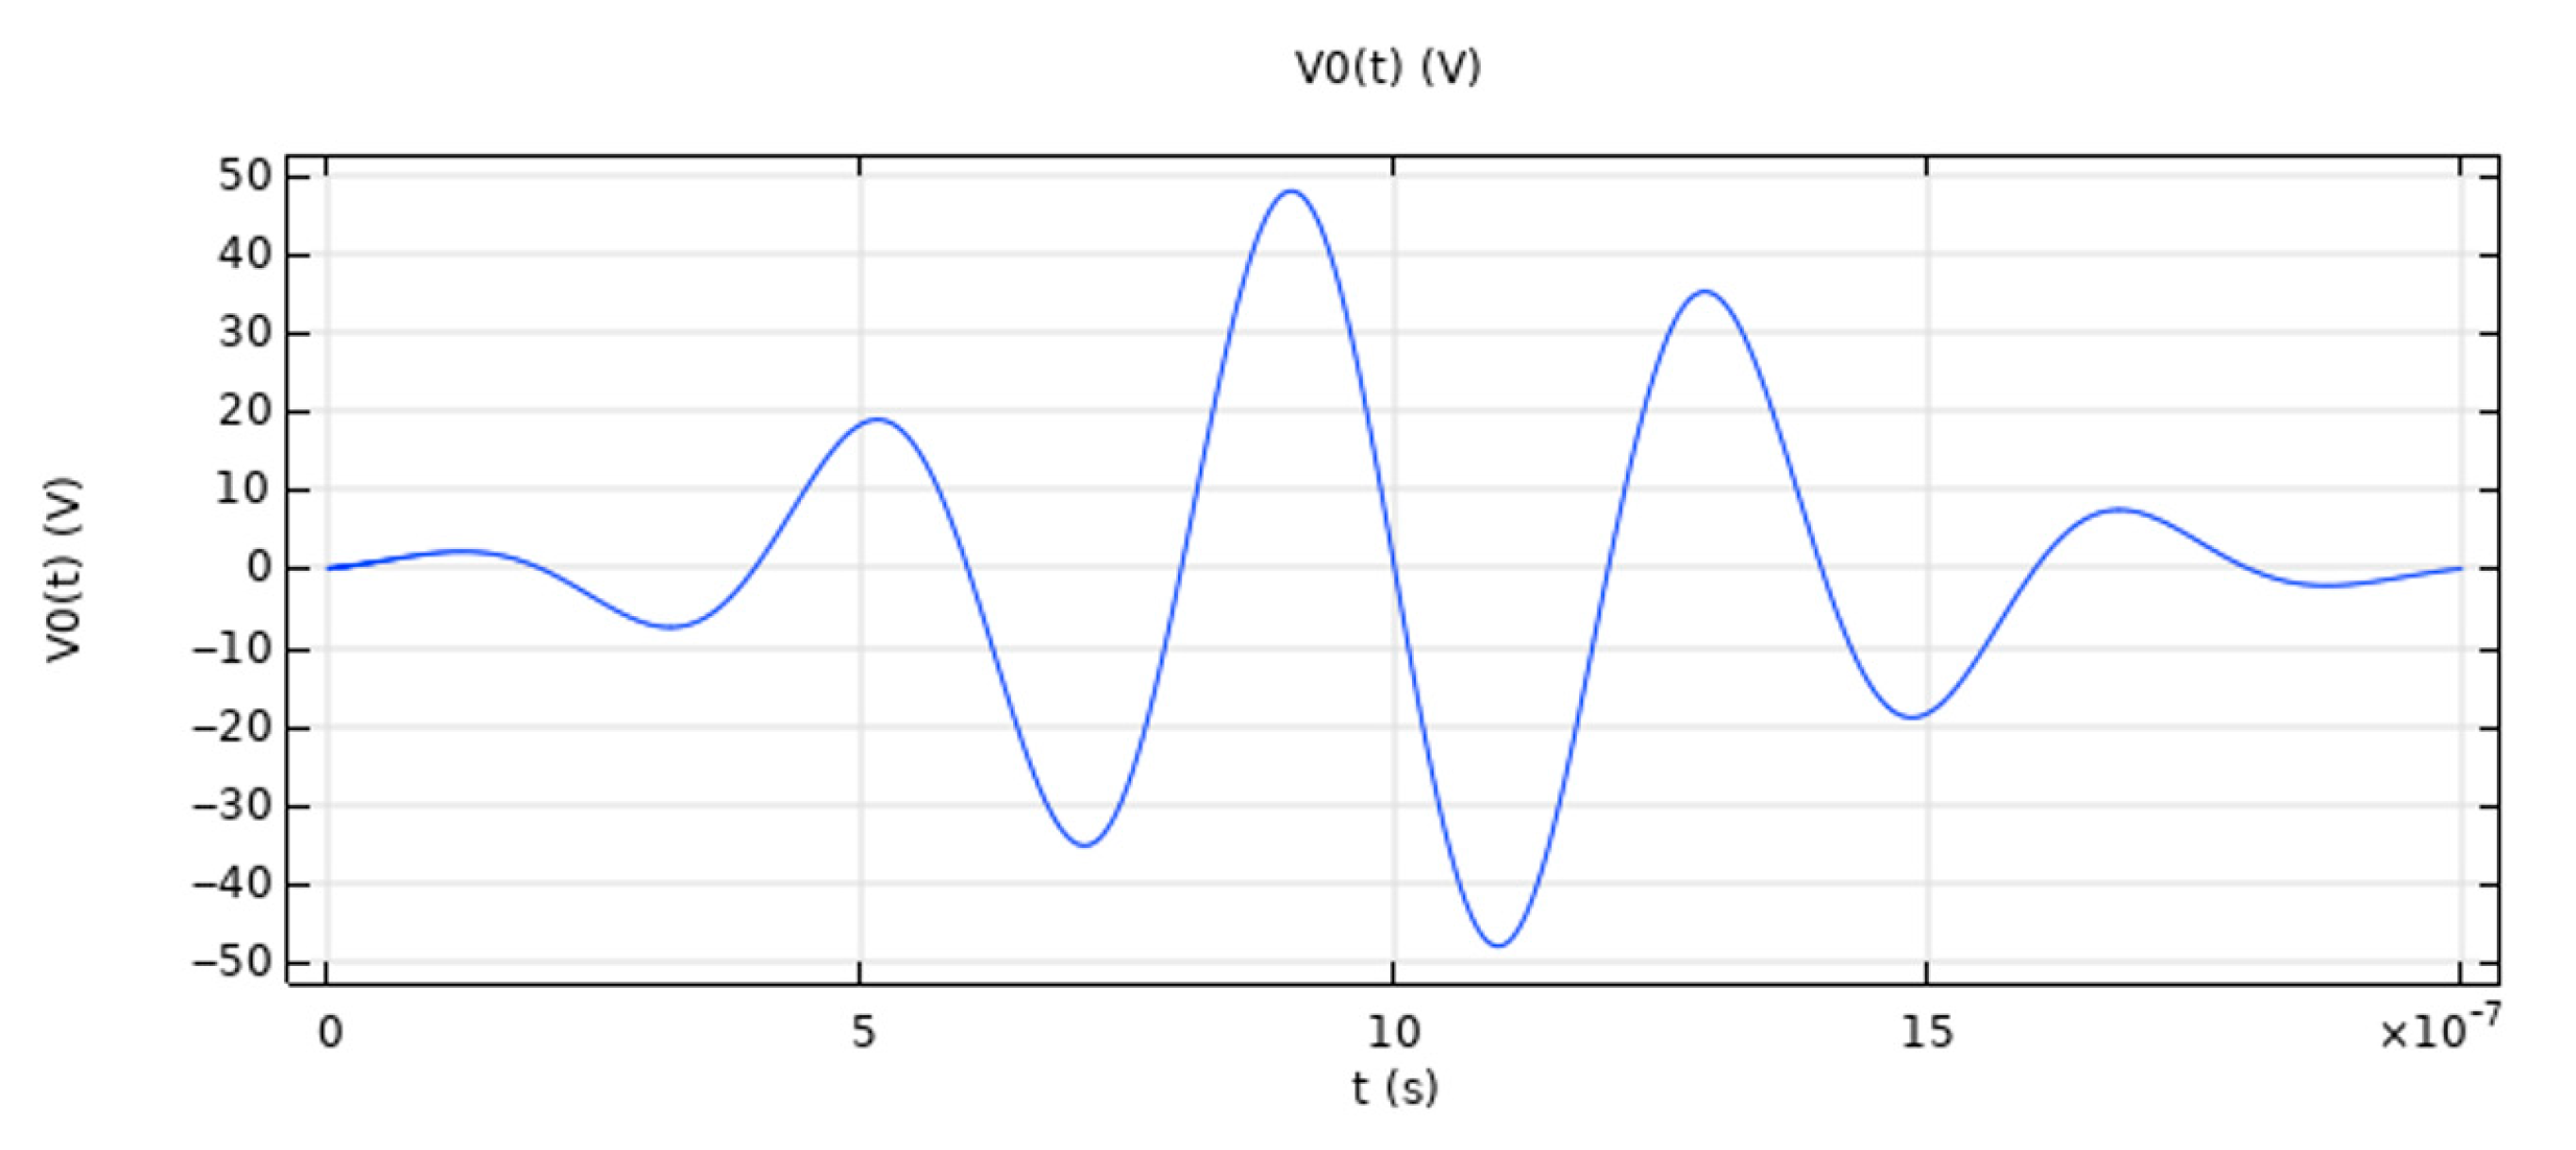
The excitation signal adopts a Hanning-window-modulated pulse signal, defined by the following equation:
F t = A × exp 16 N f 0 / 2 - t f 0 2 N 2 × sin ( 2 π f 0 t ) , t < N / f 0 0 t N / f 0
where A is the excitation amplitude, f0 is the ultrasonic frequency, N is the number of excitation cycles, and t is the time variable. When A = 50 V, f0 = 2.5 MHz, and N = 5, the waveform of the excitation signal is shown in Figure 4.
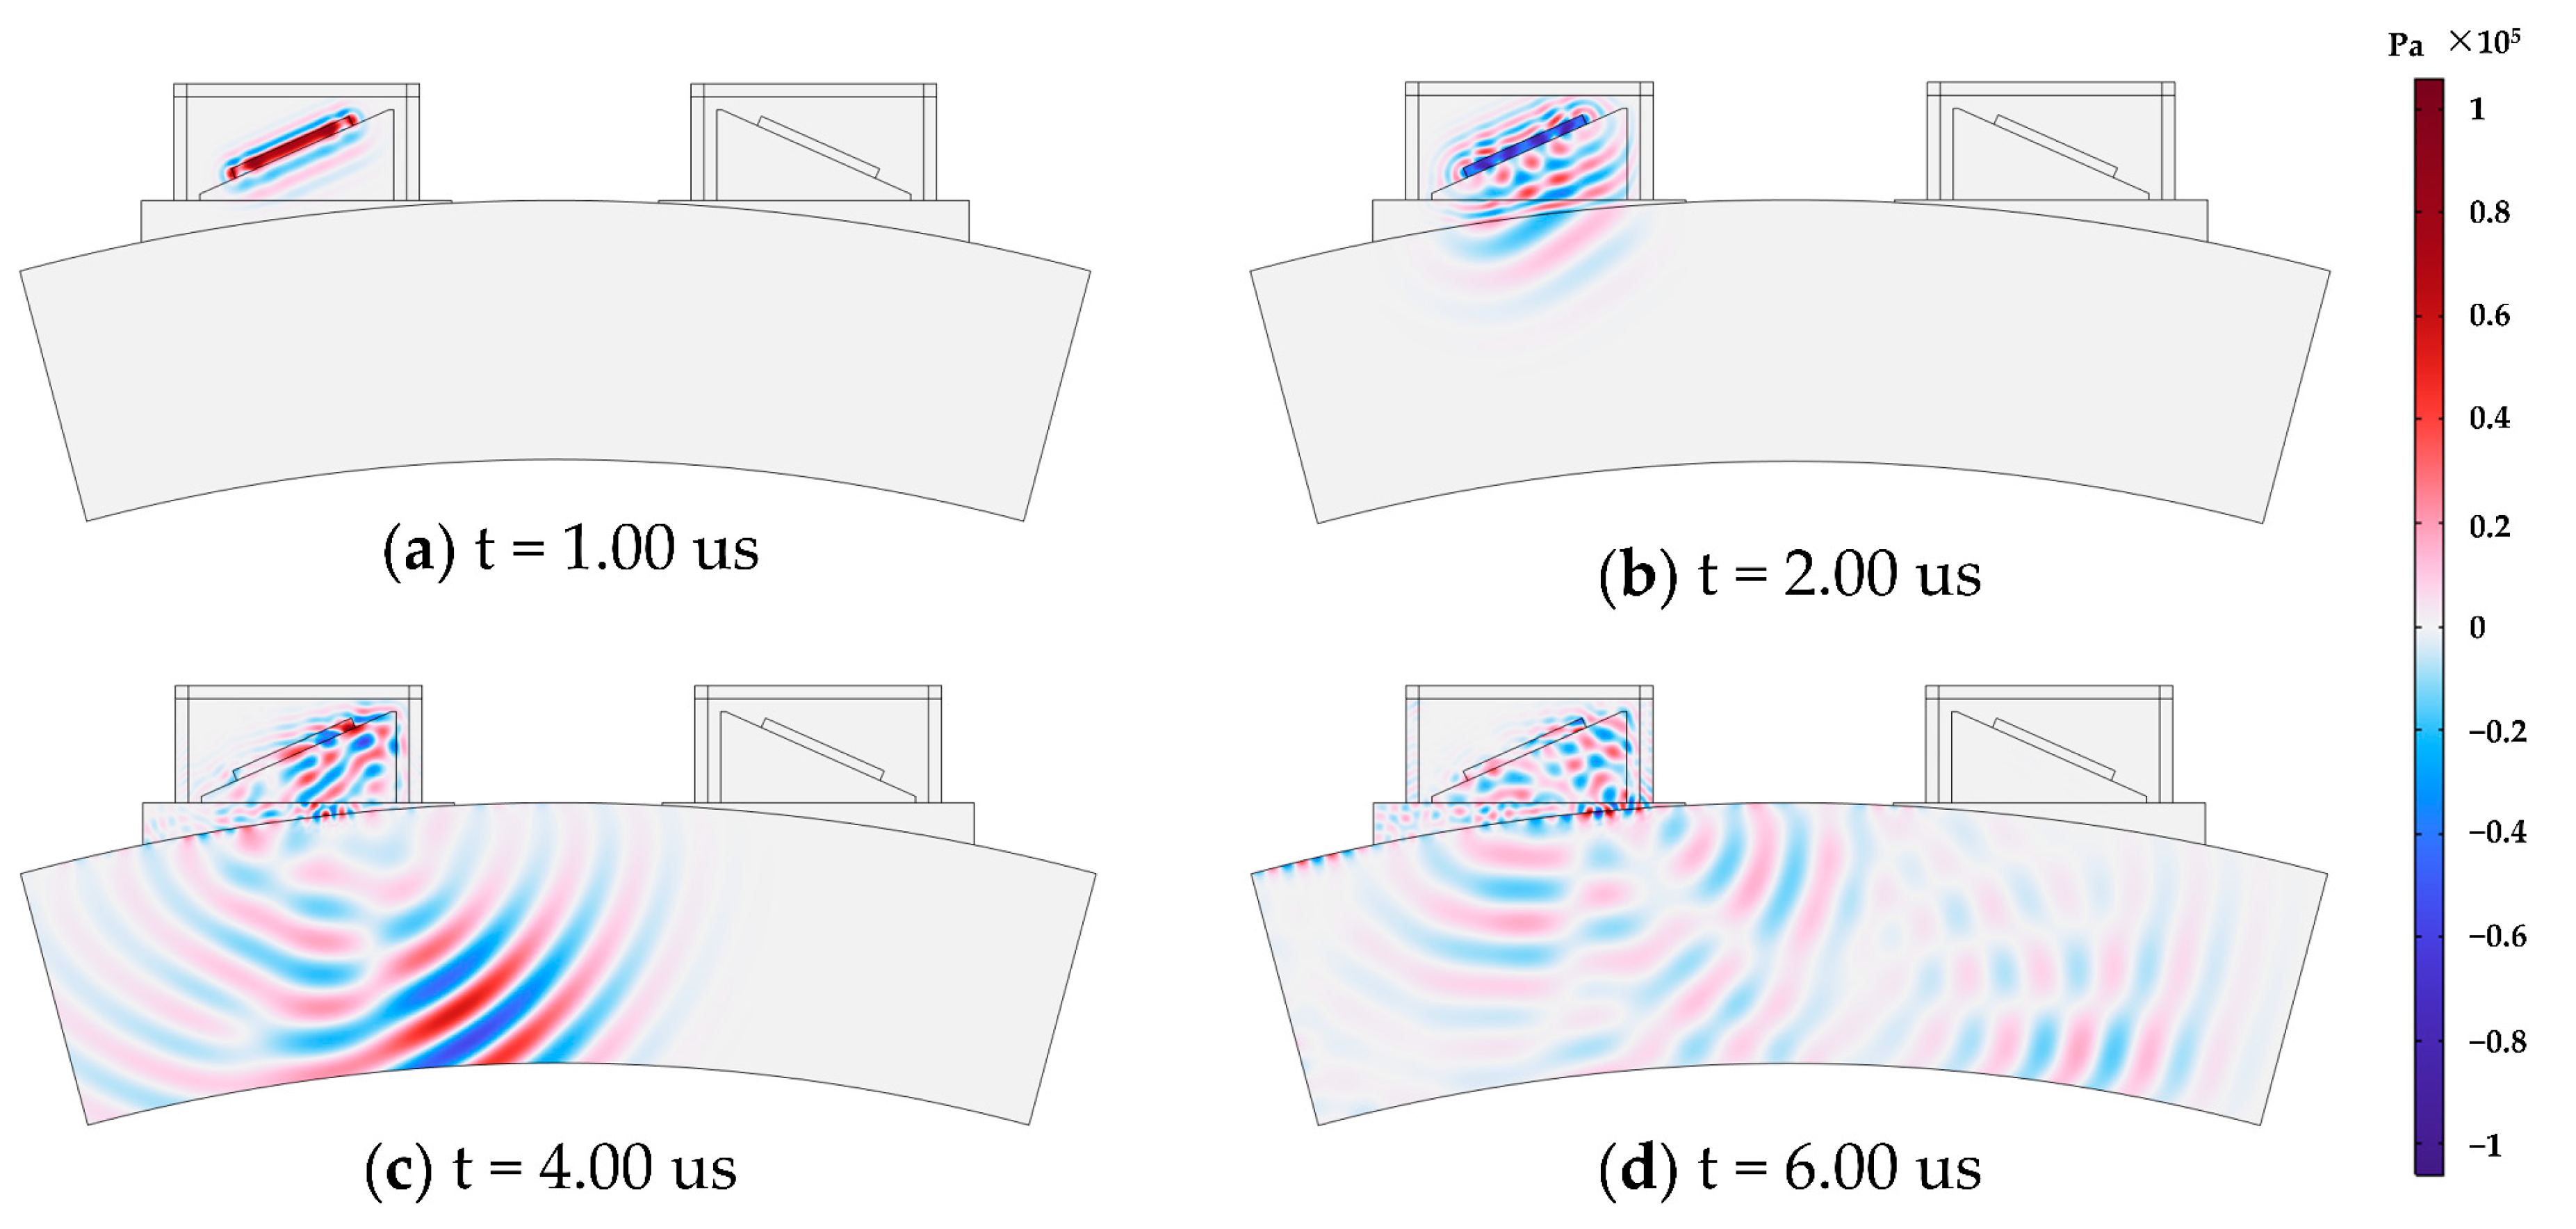
Figure 5 presents pressure contour plots inside the pipeline at different time points, corresponding to an excitation frequency of 2.5 MHz, an excitation duration of 5 cycles, and an incident angle of 30°.
As shown in Figure 5a, the acoustic wave propagates in the wedge in the form of a quasi-plane wave. This is due to the small size of the ultrasonic wedge, which results in a short propagation path within the wedge. In this simulation, the ultrasonic propagation distance inside the wedge is approximately 5 mm, while the near-field length of the sound source is about 11.3 mm. Therefore, the wedge lies within the near-field region of the sound field, causing the acoustic wave to propagate as a quasi-plane wave without diffraction.
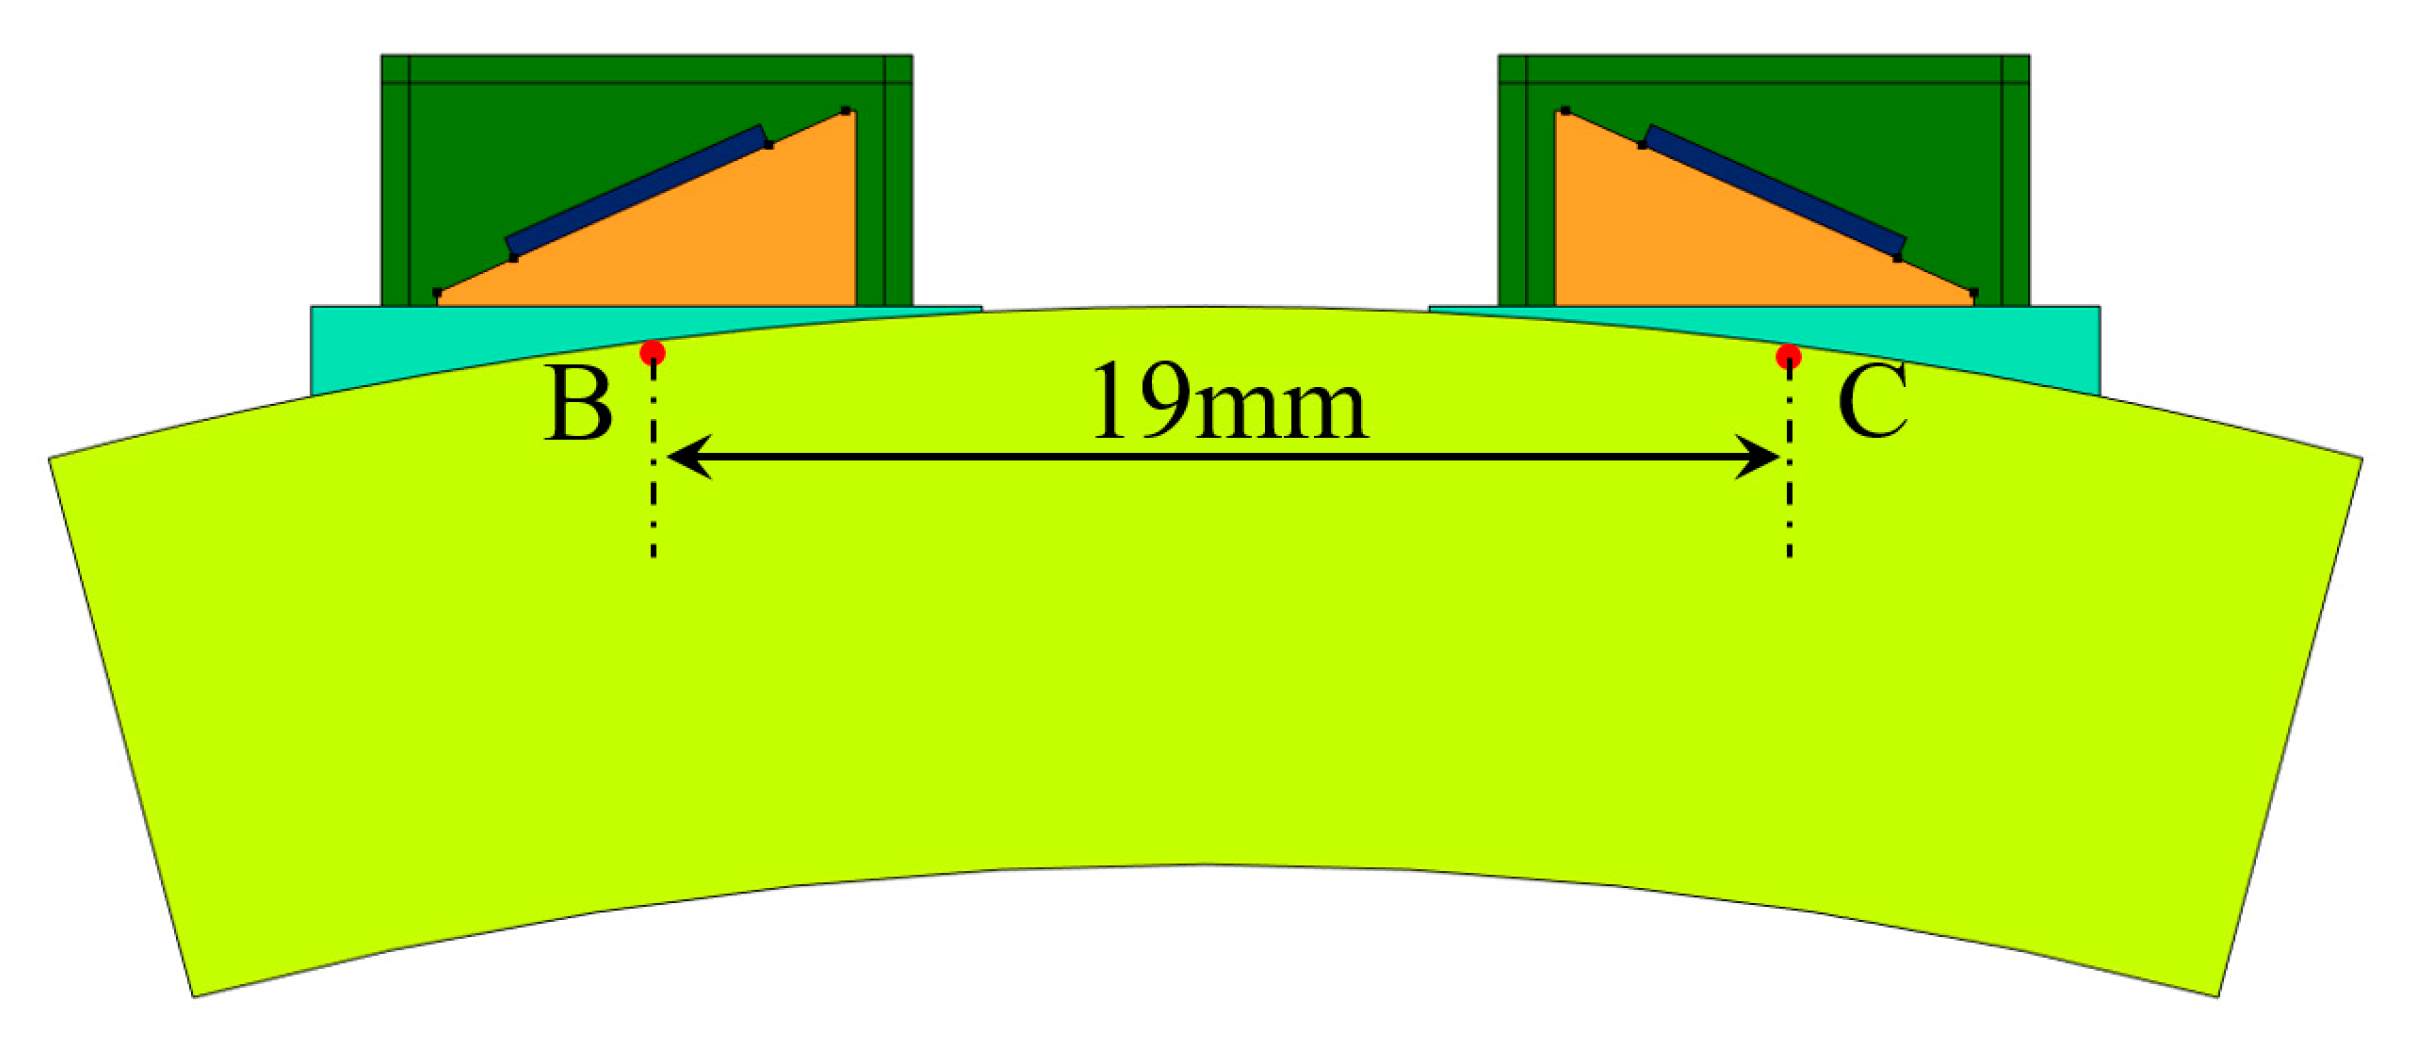
To determine the propagation path of the LCR wave within the workpiece, two symmetric points, B and C, are selected on the pipeline surface, as illustrated in Figure 6. The straight-line distance between points B and C is 19 mm. Given that the radius of the pipeline component is 80 mm, the arc length of segment BC can be calculated as approximately 19.0449 mm.
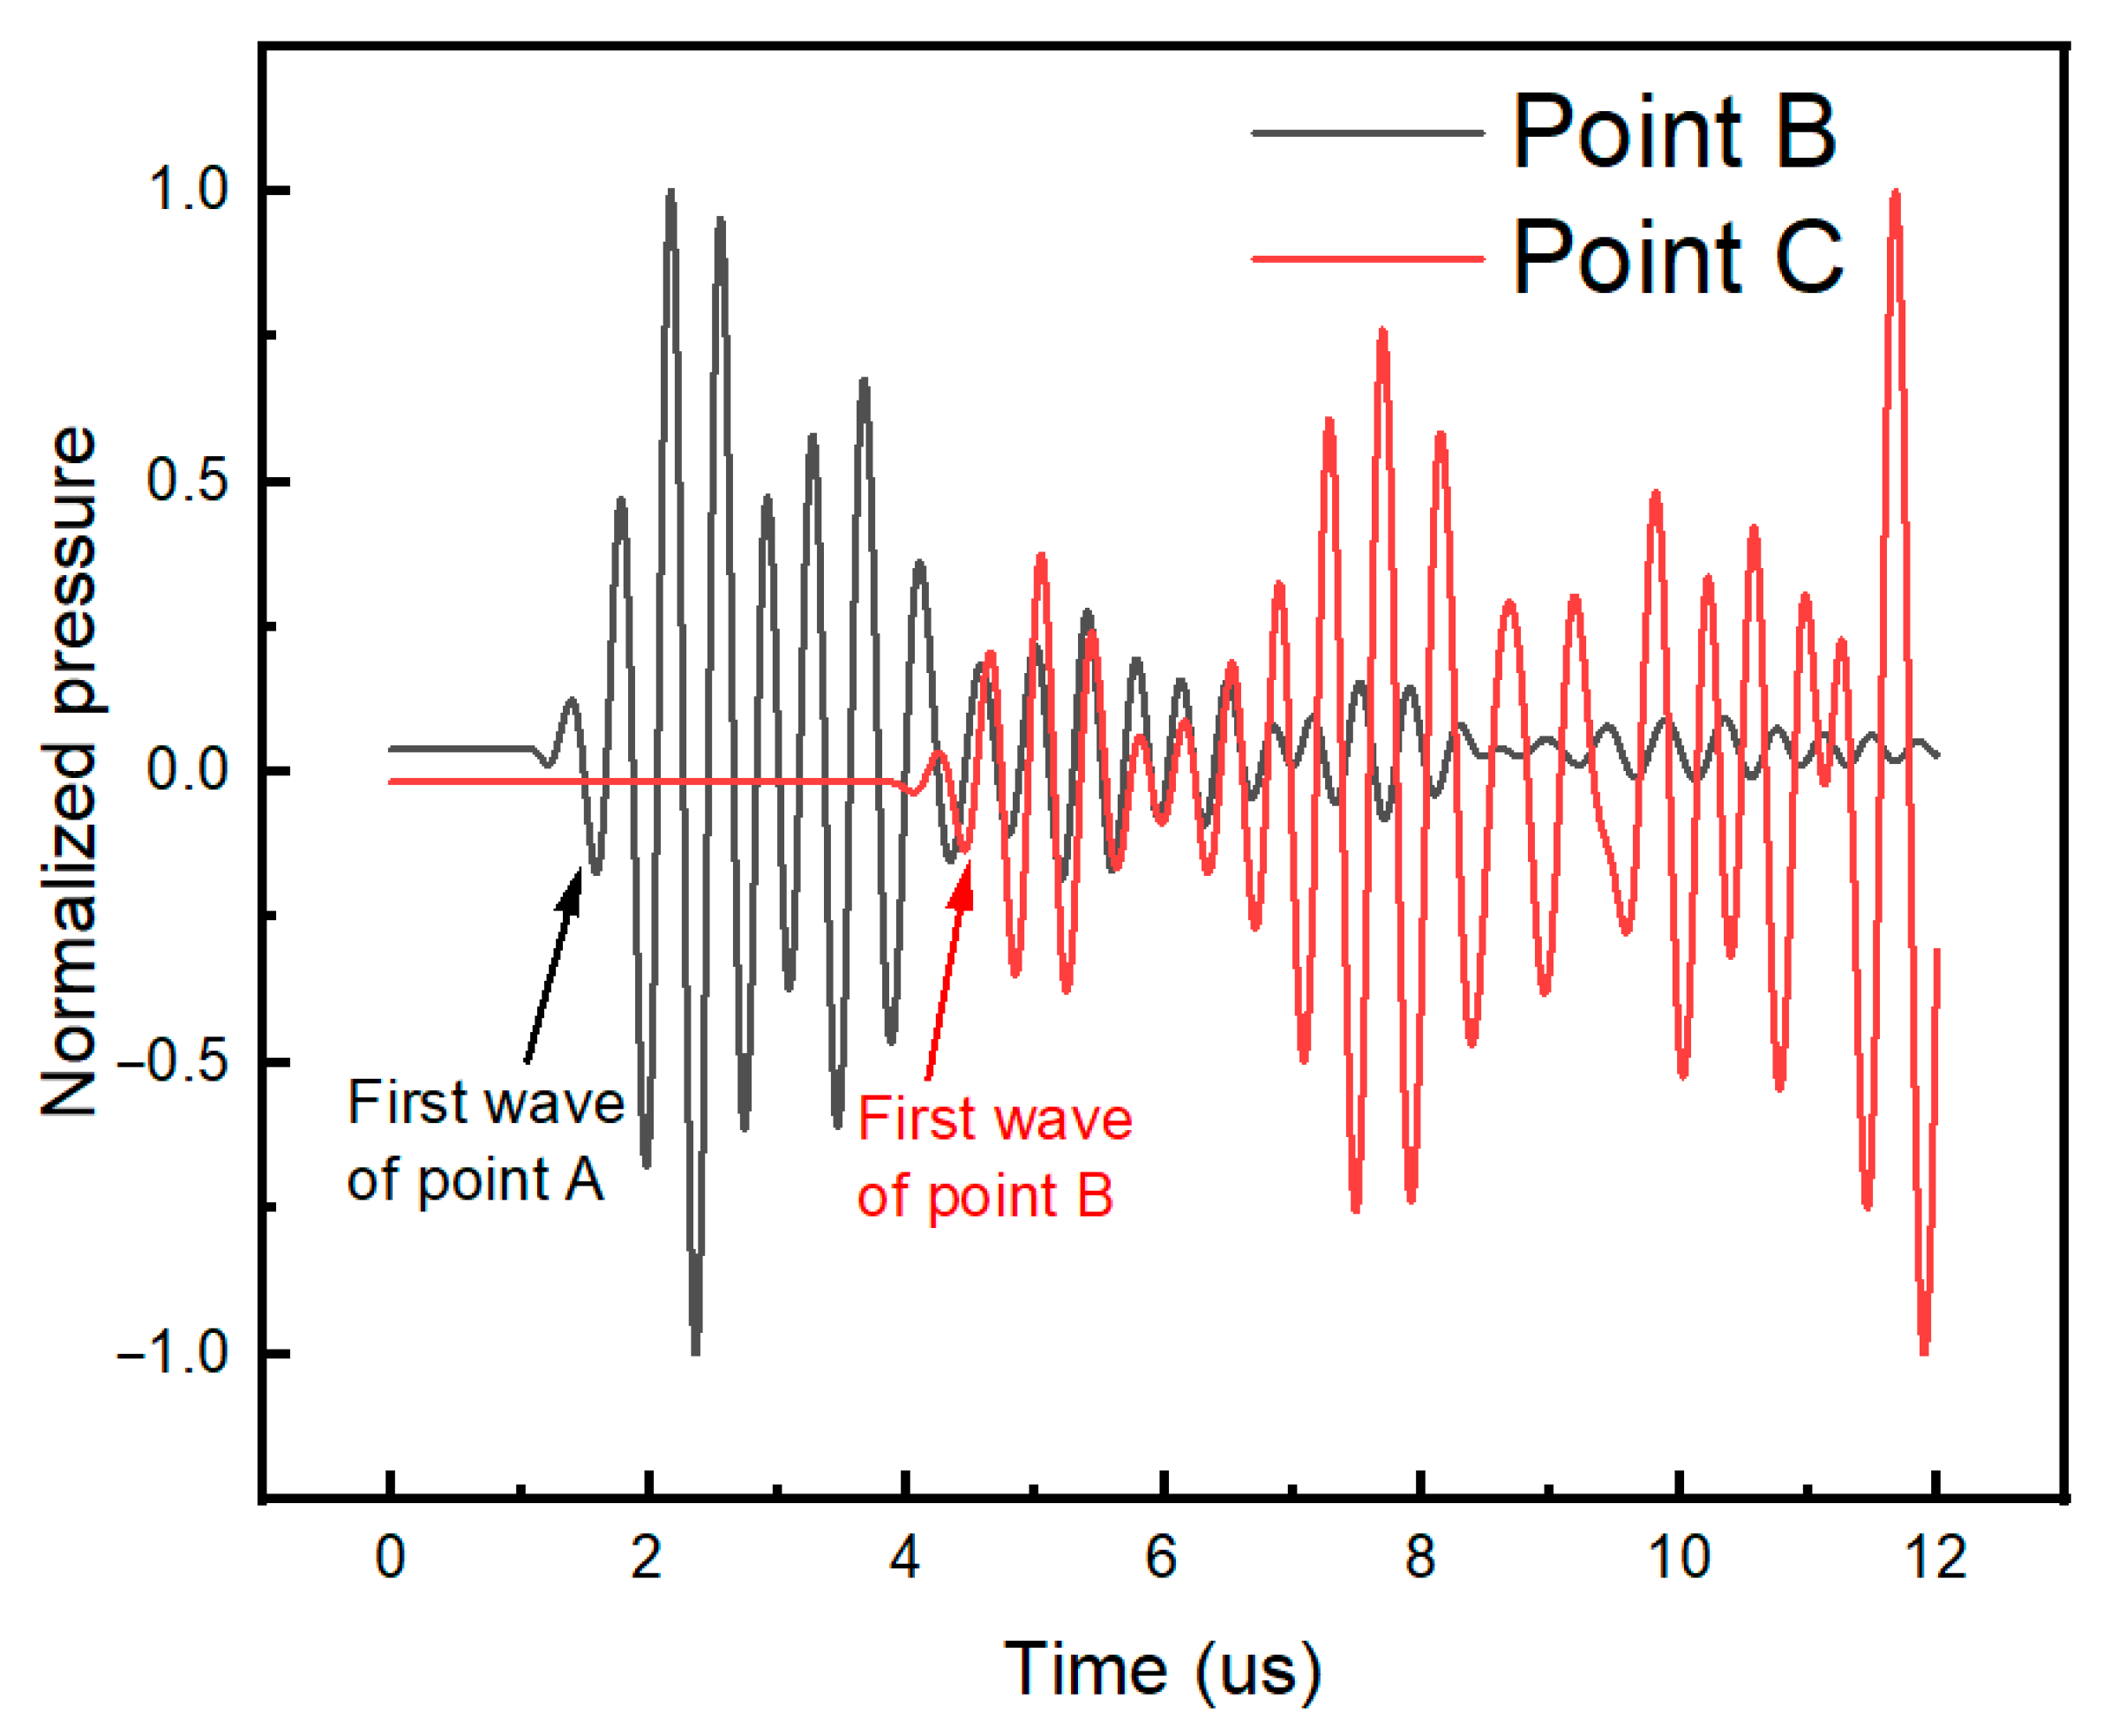
The acoustic pressure signals at points B and C are normalized and compared, as shown in Figure 7. Since the LCR wave is essentially a longitudinal wave, with its propagation direction aligned with the particle vibration direction, and since longitudinal waves travel fastest, the LCR wave typically corresponds to the first received wave. Therefore, the first peak observed in the acoustic pressure curves at points B and C is identified as the LCR wave.
According to Figure 7, the propagation delay of the first wave between points B and C is calculated to be 3014.93 ns. If the LCR wave propagates along the arc BC, the corresponding wave velocity is calculated to be 6316.86 m/s. If it propagates along the chord BC, the calculated wave velocity is 6301.20 m/s. Clearly, the velocity calculated based on chordal propagation is closer to the preset value of 6300 m/s. Therefore, it can be concluded that after oblique incidence through the coupling layer, the LCR wave propagates along the chordal direction of the pipeline.

4. Model Building

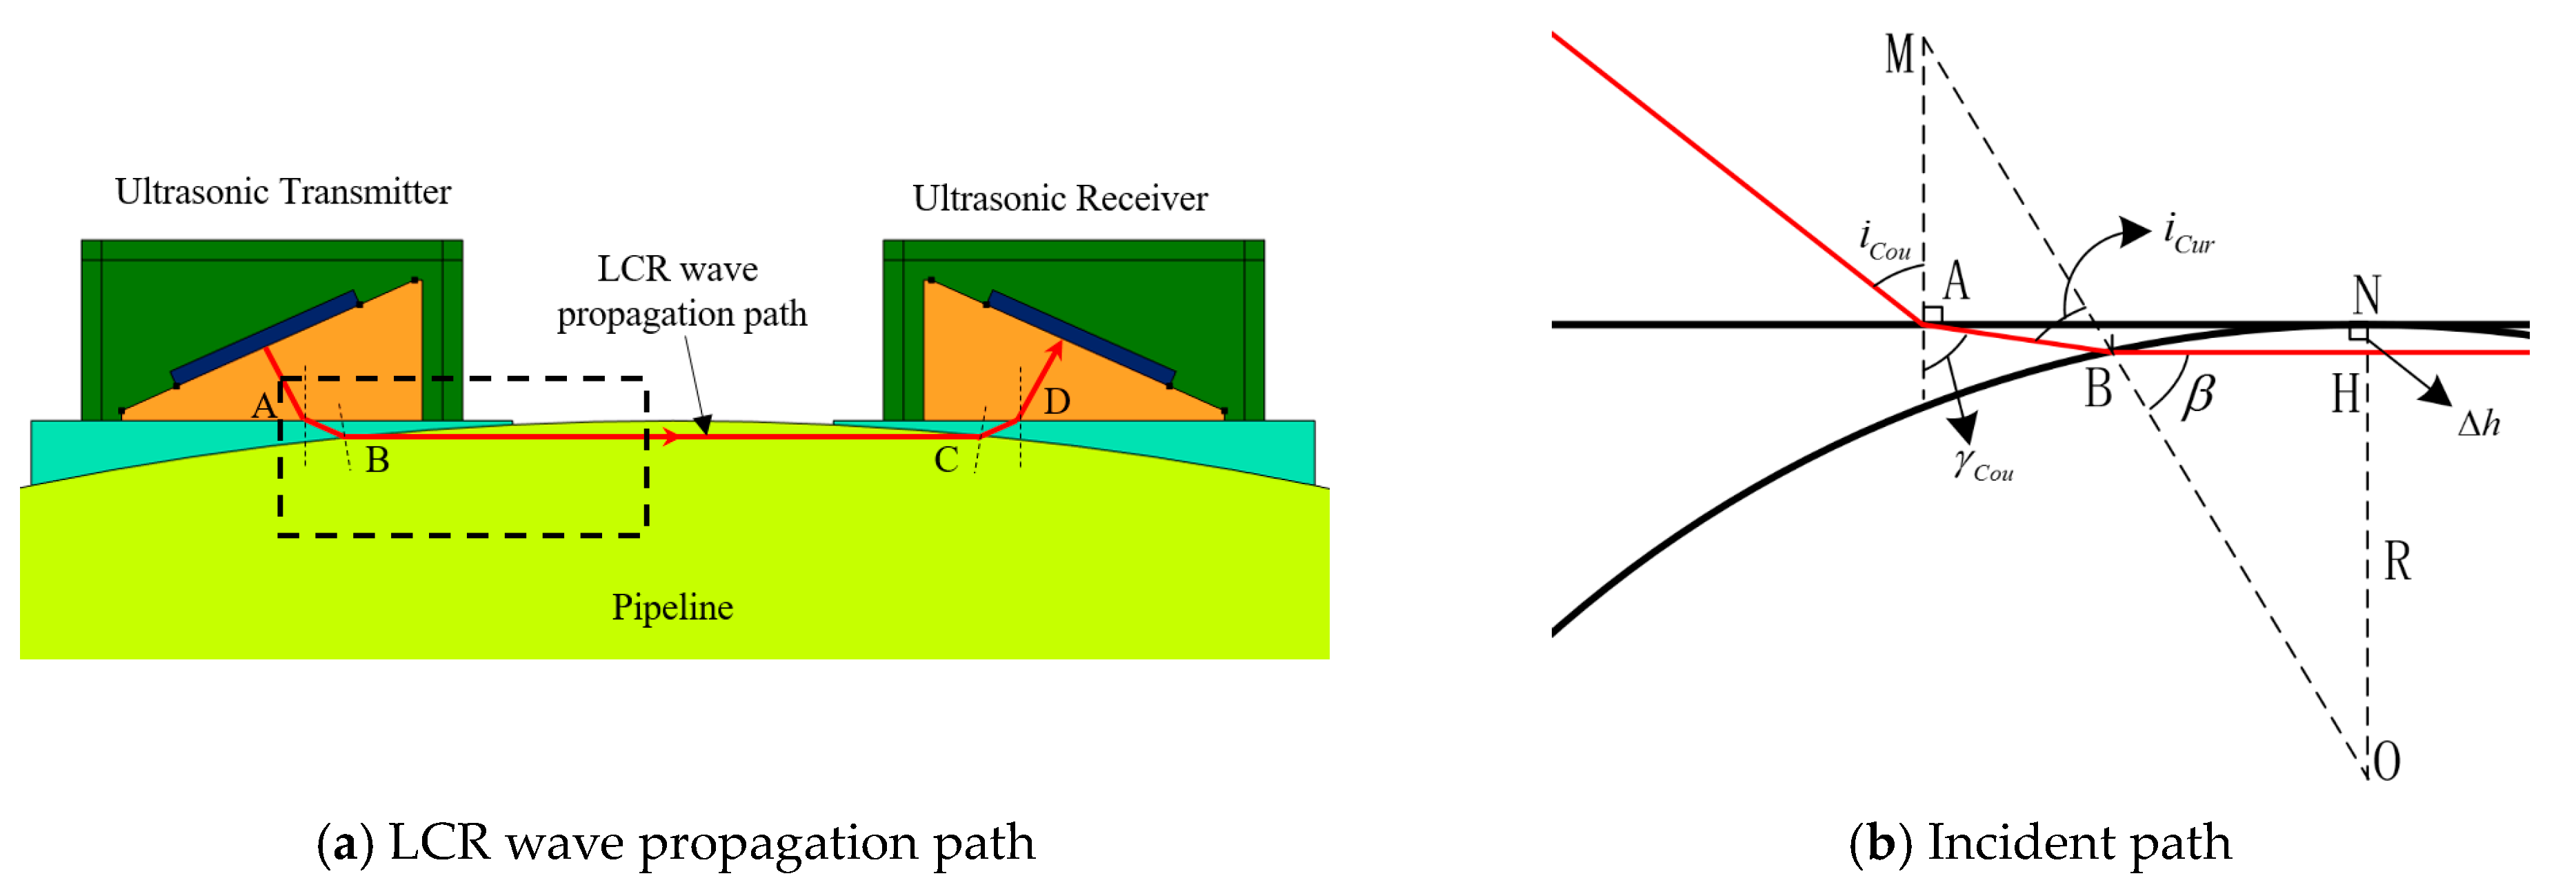
Based on the preceding simulation analysis, it is evident that after oblique incidence through the coupling layer, the ultrasonic wave propagates as a plane wave within the wedge and travels along the chordal direction in the specimen. Therefore, the ray tracing method can be employed to analyze the ultrasonic propagation behavior in the pipeline, as illustrated in Figure 8a. During pipeline hoop stress measurement, the ultrasonic wave is emitted from the excitation transducer and propagates in the form of a plane wave. It enters the coupling layer at point A and undergoes refraction. The wave continues to propagate within the coupling layer until it reaches point B, where it is assumed to refract again and subsequently propagate in the horizontal (i.e., chordal) direction. As a result, during pipeline hoop stress measurement, the propagation path of the LCR wave in the workpiece is BC, with a presumed length of LCur. For analytical clarity, the black boxed region in Figure 8 is enlarged and shown in Figure 8b.
According to Snell’s law, the following relationships can be derived:
sin i C o u / sin γ C o u = V W e d g e / V C o u
sin i C u r / sin β = V C o u / V C ur
where iCou is the incidence angle of the transducer, γS is the refraction angle of the LCR wave in the coupling layer, iCur is the incidence angle of the LCR wave at the pipeline surface, β is the refraction angle in the pipeline, VWedge is the longitudinal wave velocity in the wedge, VCou is the longitudinal wave velocity in the couplant, and VCur is the longitudinal wave velocity in the pipeline.
In △ABM, the following geometric relationship holds:
i C u r + 90 ° = γ C o u + β
By combining Equations (13)–(15), the refraction angle β satisfies the following equation:
arcsin β V C o u / V C u r + 90 ° = arcsin sin i C o u V C o u / V W e d g e + β
Equation (16) is a typical non-linear equation. The value of β can be obtained through iterative numerical solution using the Newton-bisection method. In △BHO, the following geometric relationship also holds:
L C u r = 2 R cos β
where R is the curvature radius of the curved pipeline component.
In practical measurements, to ensure that the test component and the zero-stress reference specimen are as similar as possible, waveforms from regions with approximately zero stress (e.g., the parallel section of the pipeline far from the weld) are often selected as the reference. Therefore, the influence of acoustic time difference caused by geometric structure can be neglected in reference measurements. However, since the stress coefficient K depends not only on higher-order elastic constants but also on the propagation distance L, this factor must be accounted for in the modeling. During pipeline hoop stress measurement, the propagation distance of the ultrasonic wave in the pipeline LCur is no longer equal to that in a planar specimen LPla. Consequently, the pipeline hoop stress coefficient KCur differs from that of the planar specimen KPla. In practice, it is difficult to calibrate KCur, while KPla is more easily obtained. Therefore, a correction of the stress coefficient is necessary in pipeline hoop stress measurement. For a given material, its higher-order elastic constants do not change with the shape of the specimen. According to Equation (11), the stress coefficient K is inversely proportional to the propagation distance L, hence:
K P l a L C u r = K C u r L P l a
By substituting Equation (18) into the LCR-wave stress measurement formula (Equation (10)), the correction formula for the LCR-wave pipeline hoop stress measurement method (LCR-HS method) can be obtained as:
σ h o o p = L C u r L P l a K P l a Δ t C u r
where ΔtCur is the relative time delay under different hoop stress states, and σhoop is the hoop stress. Based on the above, the procedure for the LCR-HS method can be summarized as shown in Table 2.

5. Experimental Setup

5.1. C-Ring Device

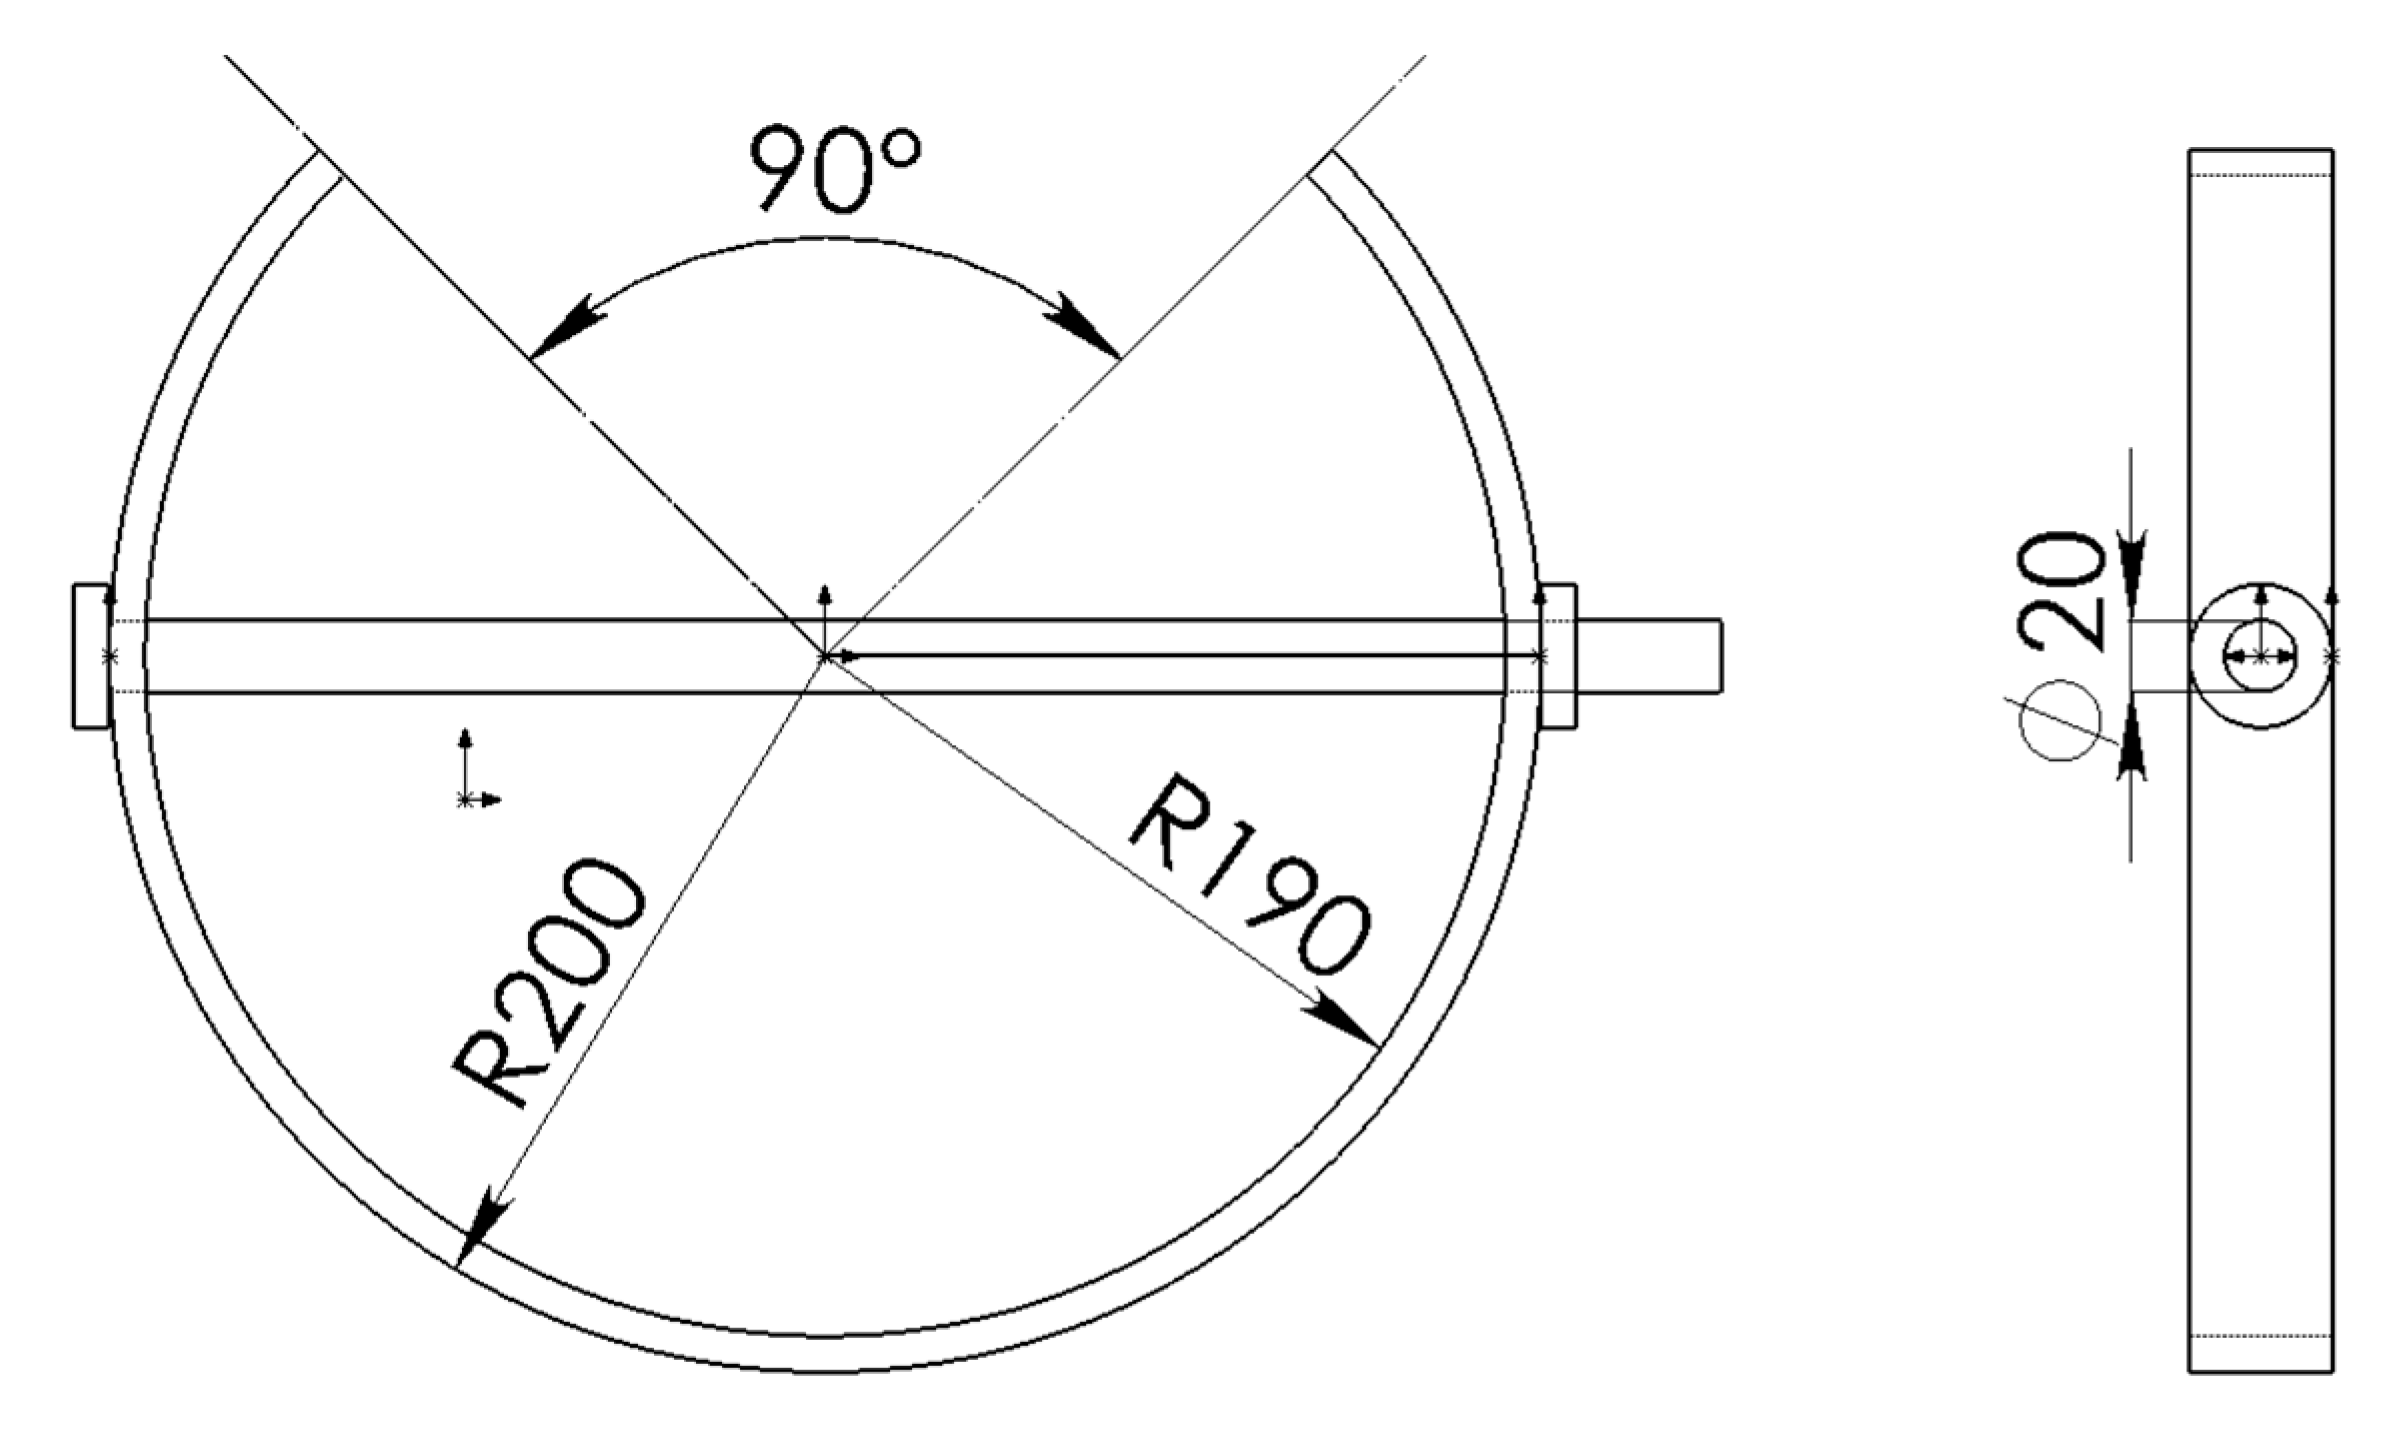
To verify the accuracy of the pipeline hoop stress measurement model, a C-shaped ring was used as the test specimen. Its dimensions are shown in Figure 9.
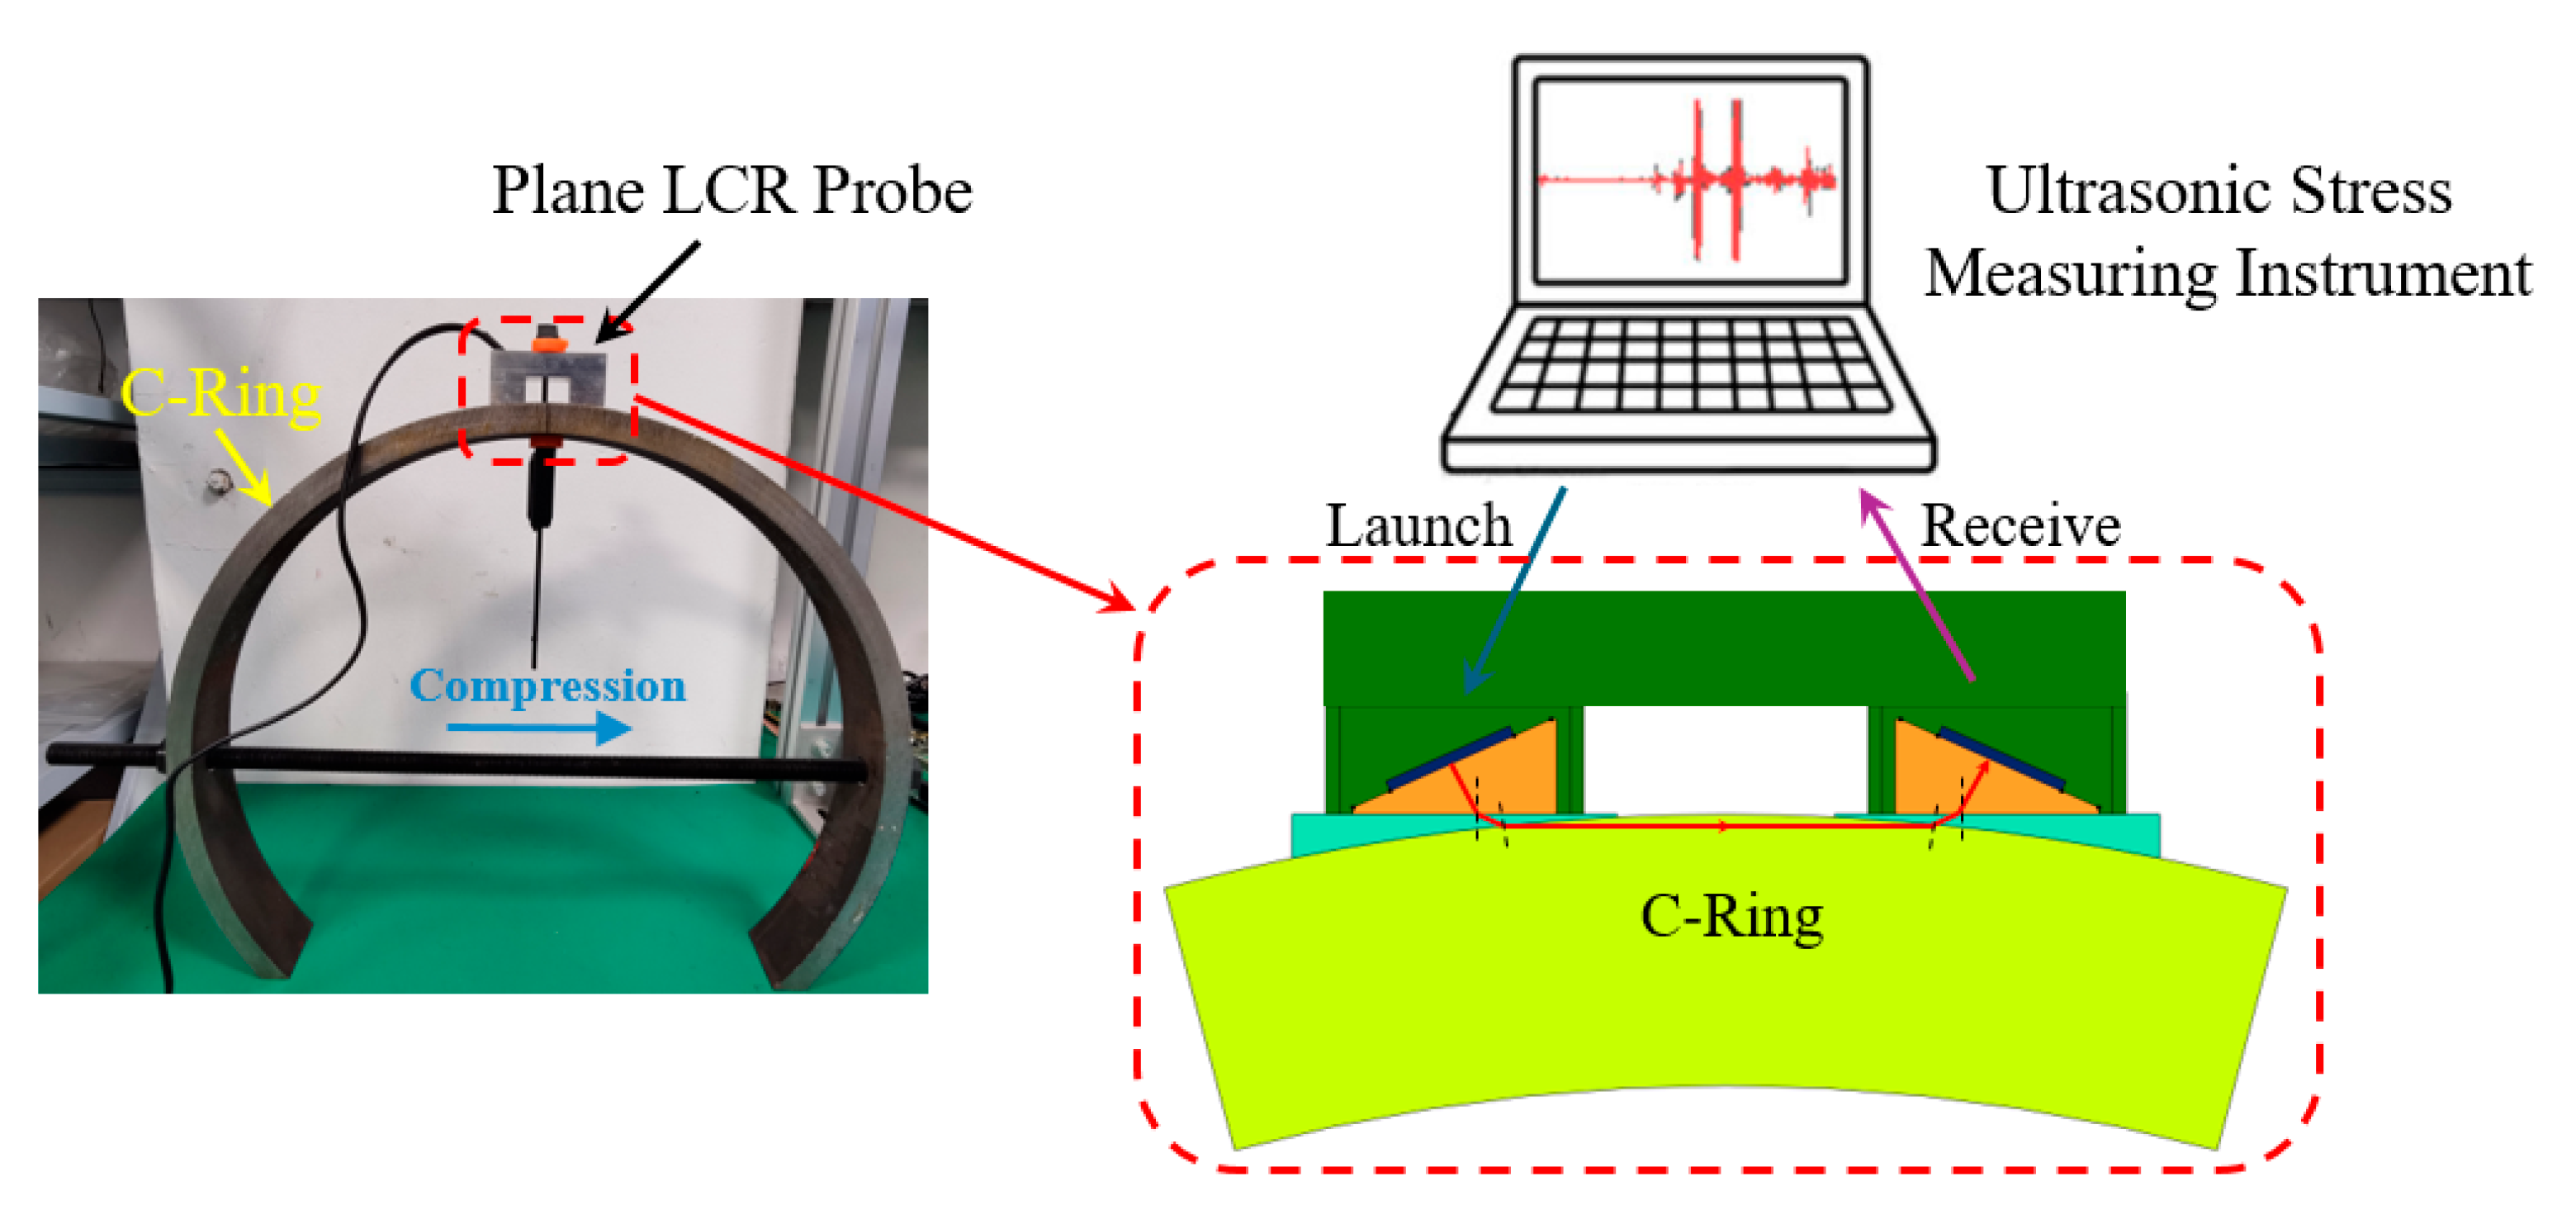
Figure 10 shows the C-ring test device used in this experiment. The LCR wave signals were collected using an ultrasonic stress measurement instrument (STUS300, STTech, Chengdu, China). By tightening the locking bolts of the C-ring, different levels of hoop stress were generated on the upper surface of the ring. A micrometer was used to measure the compression amount, and the corresponding hoop stress under different compression levels was calculated. To ensure a stable coupling layer, water immersion testing was adopted. In the experiment, the compression step was approximately 2 mm, and the maximum compression did not exceed 10 mm (corresponding to a maximum surface stress of approximately 260 MPa), to prevent the C-ring from yielding. The C-ring was made of 20# steel. A tensile test was performed to calibrate the stress coefficient, and the resulting plane stress coefficient was KPla = 9.7691 MPa/ns.

5.2. C-Ring Hoop Stress Correction

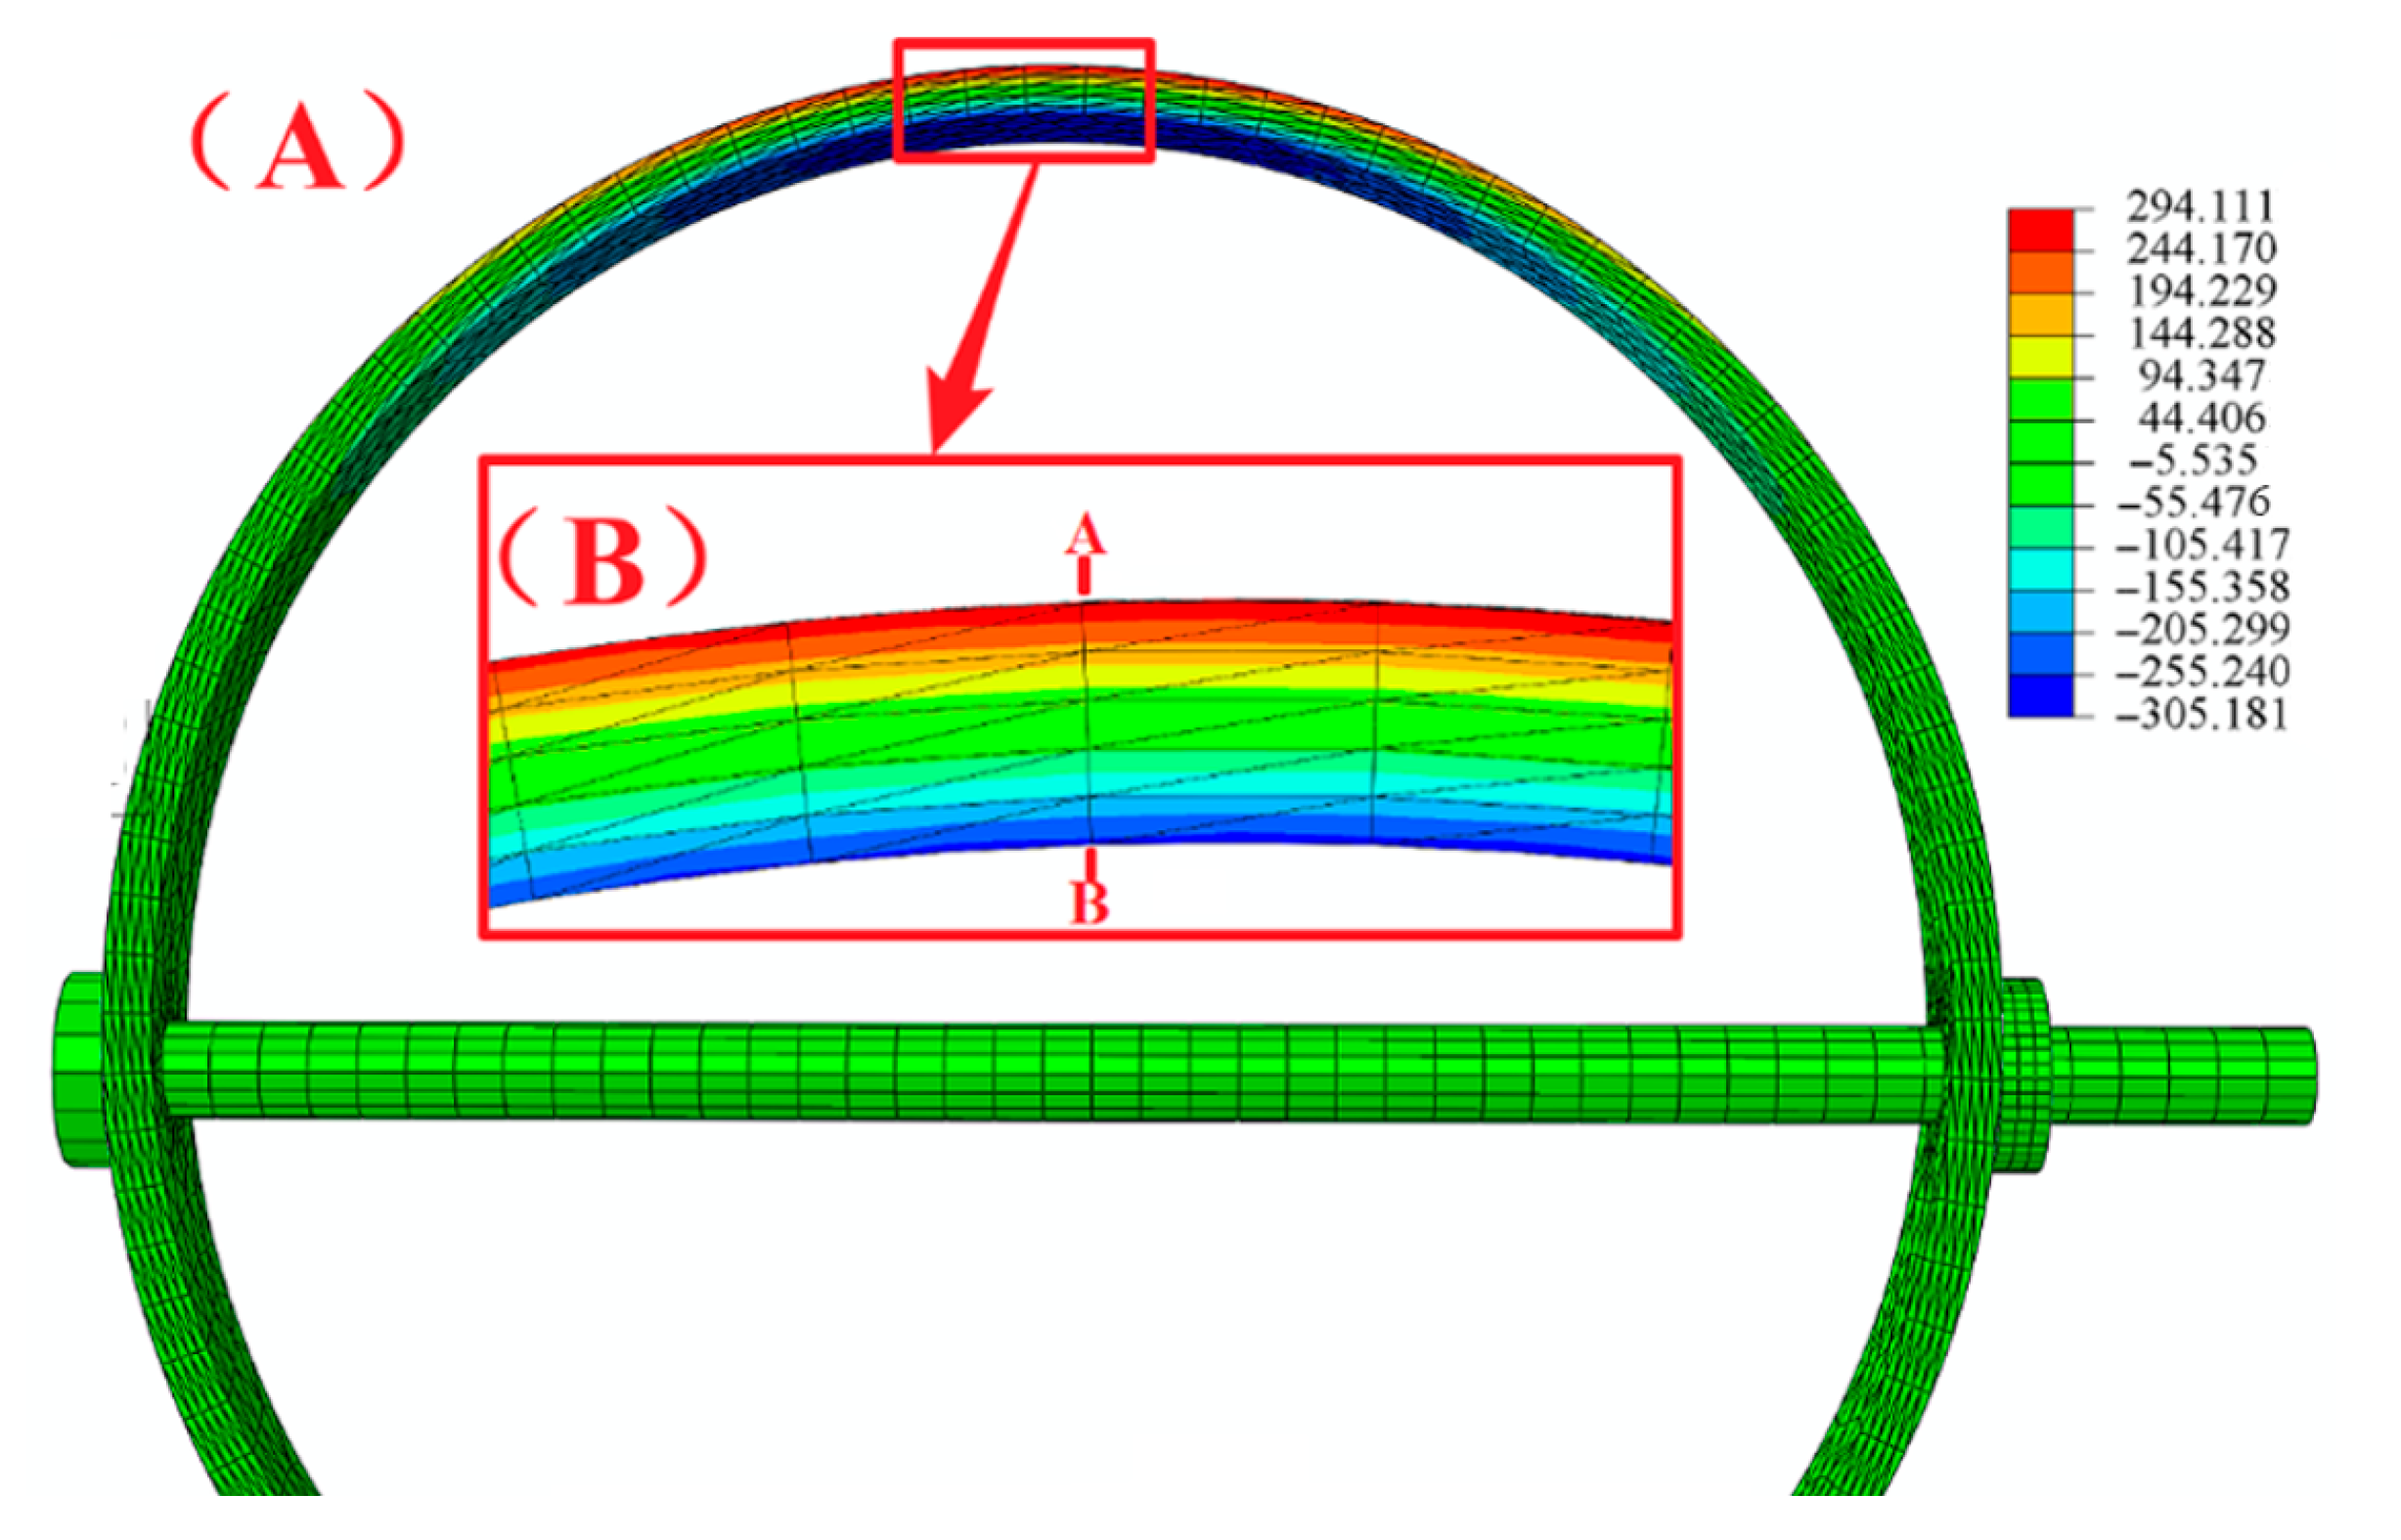
Figure 11 shows the stress contour map of a C-ring with an outer diameter of 400 mm when compressed by 15 mm along the diameter direction.
As shown in Figure 11, when the 400 mm diameter C-ring is compressed by 15 mm, the maximum tensile stress appears on the outer surface, approximately 294 MPa, while the maximum compressive stress appears on the inner surface, approximately −305 MPa. Along the hoop direction, the stress decreases from around 300 MPa to nearly zero over a distance of approximately one-quarter of the ring (about 157 mm), indicating a relatively small stress gradient in the hoop direction. However, along the radial direction, the stress varies significantly from 294 MPa to −305 MPa, indicating a large stress gradient. A neutral layer exists at the center of the C-ring where the stress remains zero. On both sides of this layer, the stress is opposite in sign. According to the principles of elasticity, the stress is expected to vary linearly along the radial direction. Moreover, for a C-ring, the maximum tensile and compressive stresses are equal in magnitude. The maximum surface stress of a C-ring is given by [31]:
σ m a x = 4 t E / π δ ( δ t ) Δ D
In the above equation, σmax represents the maximum surface stress; ΔD is the compression amount along the diameter; E is the elastic modulus; t is the wall thickness; δ is the original inner diameter; Z is the curved beam correction factor. Since a certain stress gradient exists along the radial direction of the C-ring and the stress varies linearly across the radial direction, the gradient can be expressed as:
σ R = 2 σ m a x t
where σ R represents the radial stress gradient, with units of MPa/mm. Since ultrasonic stress measurement reflects the average stress over a certain region and depth, in order to compare the hoop stress measured by the LCR-HS method with the theoretical stress calculated for the C-ring, the stress along the thickness direction of the C-ring must be integrated and averaged based on the ultrasonic detection depth. The corrected C-ring stress formula considering ultrasonic measurement depth is given as:
σ = t Δ h t 4 t E / π δ ( δ t ) Δ D
where Δh is the ultrasonic detection depth. In this study, the LCR wave frequency is set to 5 MHz, corresponding to a detection depth of approximately 1.12 mm.

6. Results and Discussion

6.1. C-Ring Measurement

Figure 12a shows the received LCR waveforms of the C-ring under different deflections. Figure 12b presents the ultrasonic time-of-flight differences in the first wave (LCR wave) under different compression amounts, relative to the initial diameter.
As shown in Figure 12a, the first wave shifts to the right with increasing compression. This is due to changes in ultrasonic velocity under stress. By calculating the LCR wave time delay, the relationship shown in Figure 12b is obtained, which indicates a good linear correlation between compression amount and time delay. Using the LCR-HS method, the measured waveforms of the C-ring were analyzed to obtain the corresponding stress values. A comparison with uncorrected measurement results is shown in Figure 13 and Table 3.
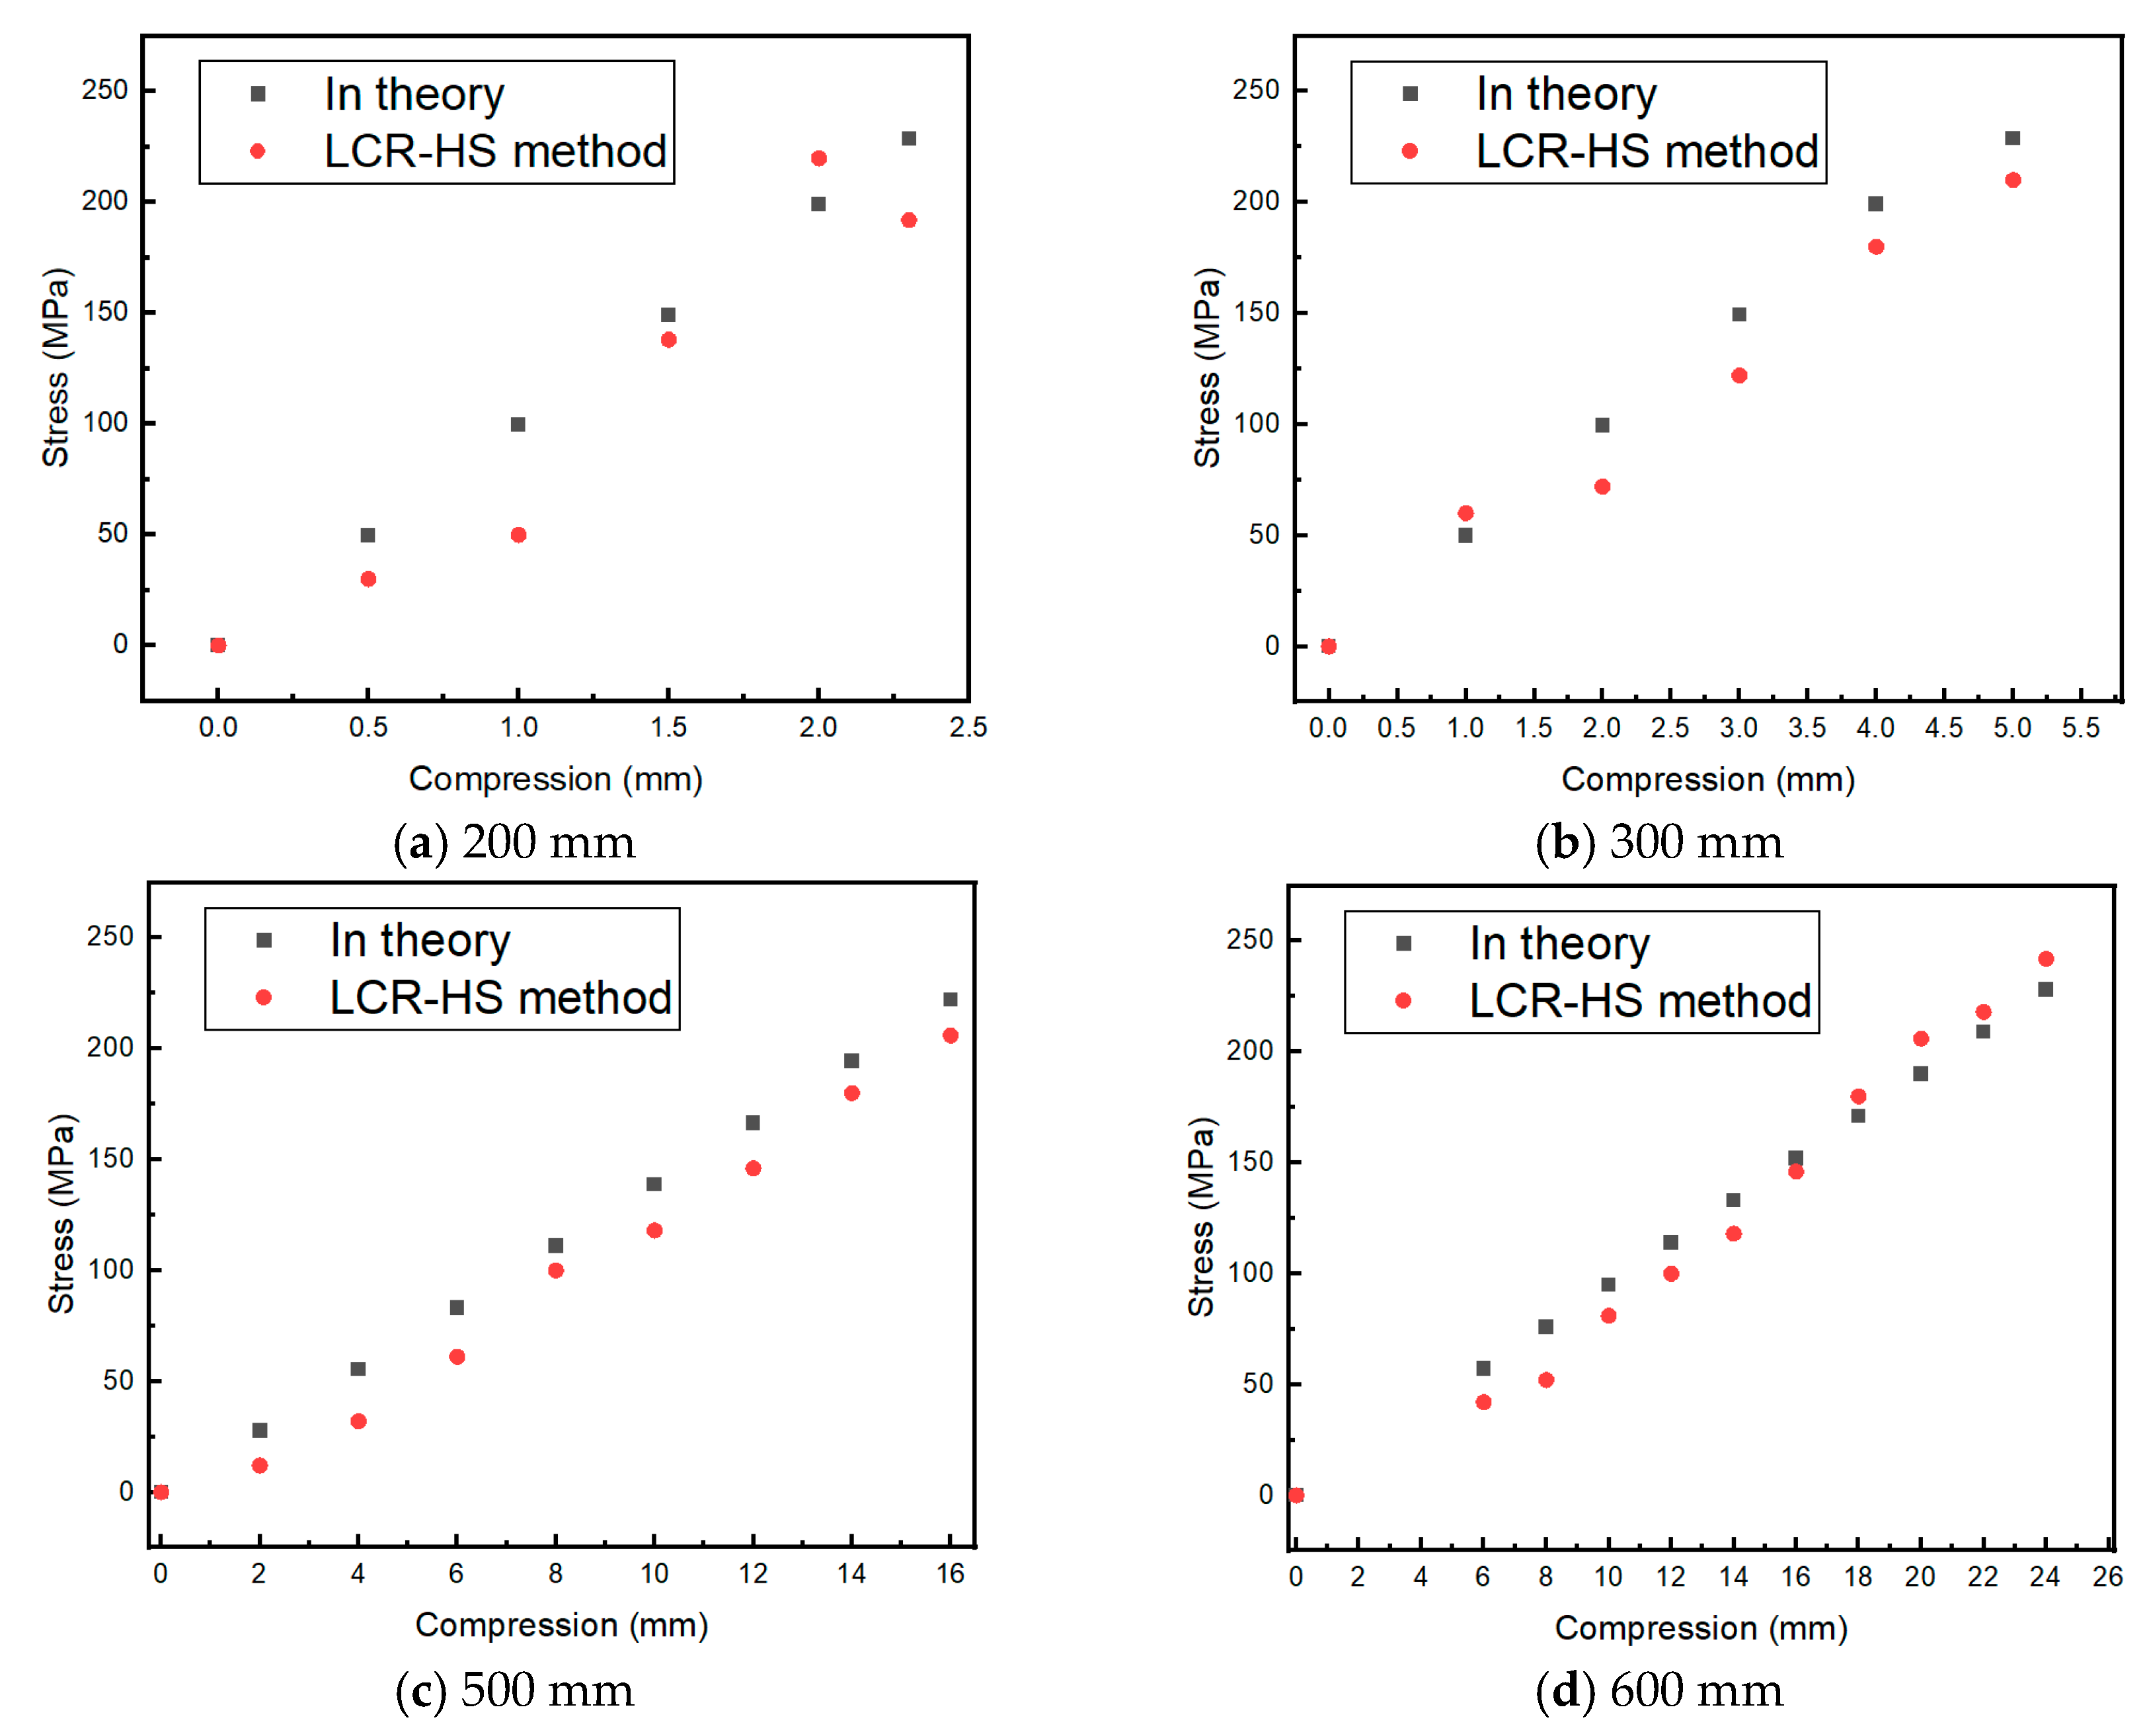
As shown in Figure 13 and Table 3, if no correction is applied and the hoop stress of the C-ring is calculated directly using the planar specimen formula, the measurement error remains above 50%, which renders the results unsuitable for engineering applications. However, after applying the LCR-HS correction method, the overall measurement error is reduced to approximately 15%. Notably, in the high-stress range above 150 MPa, the maximum measurement error is only 6.11%. To further validate the effectiveness of the proposed measurement method, C-rings with pipe diameters of 200 mm, 300 mm, 500 mm, and 600 mm were tested. The experimental results and theoretical values are shown in Figure 14.
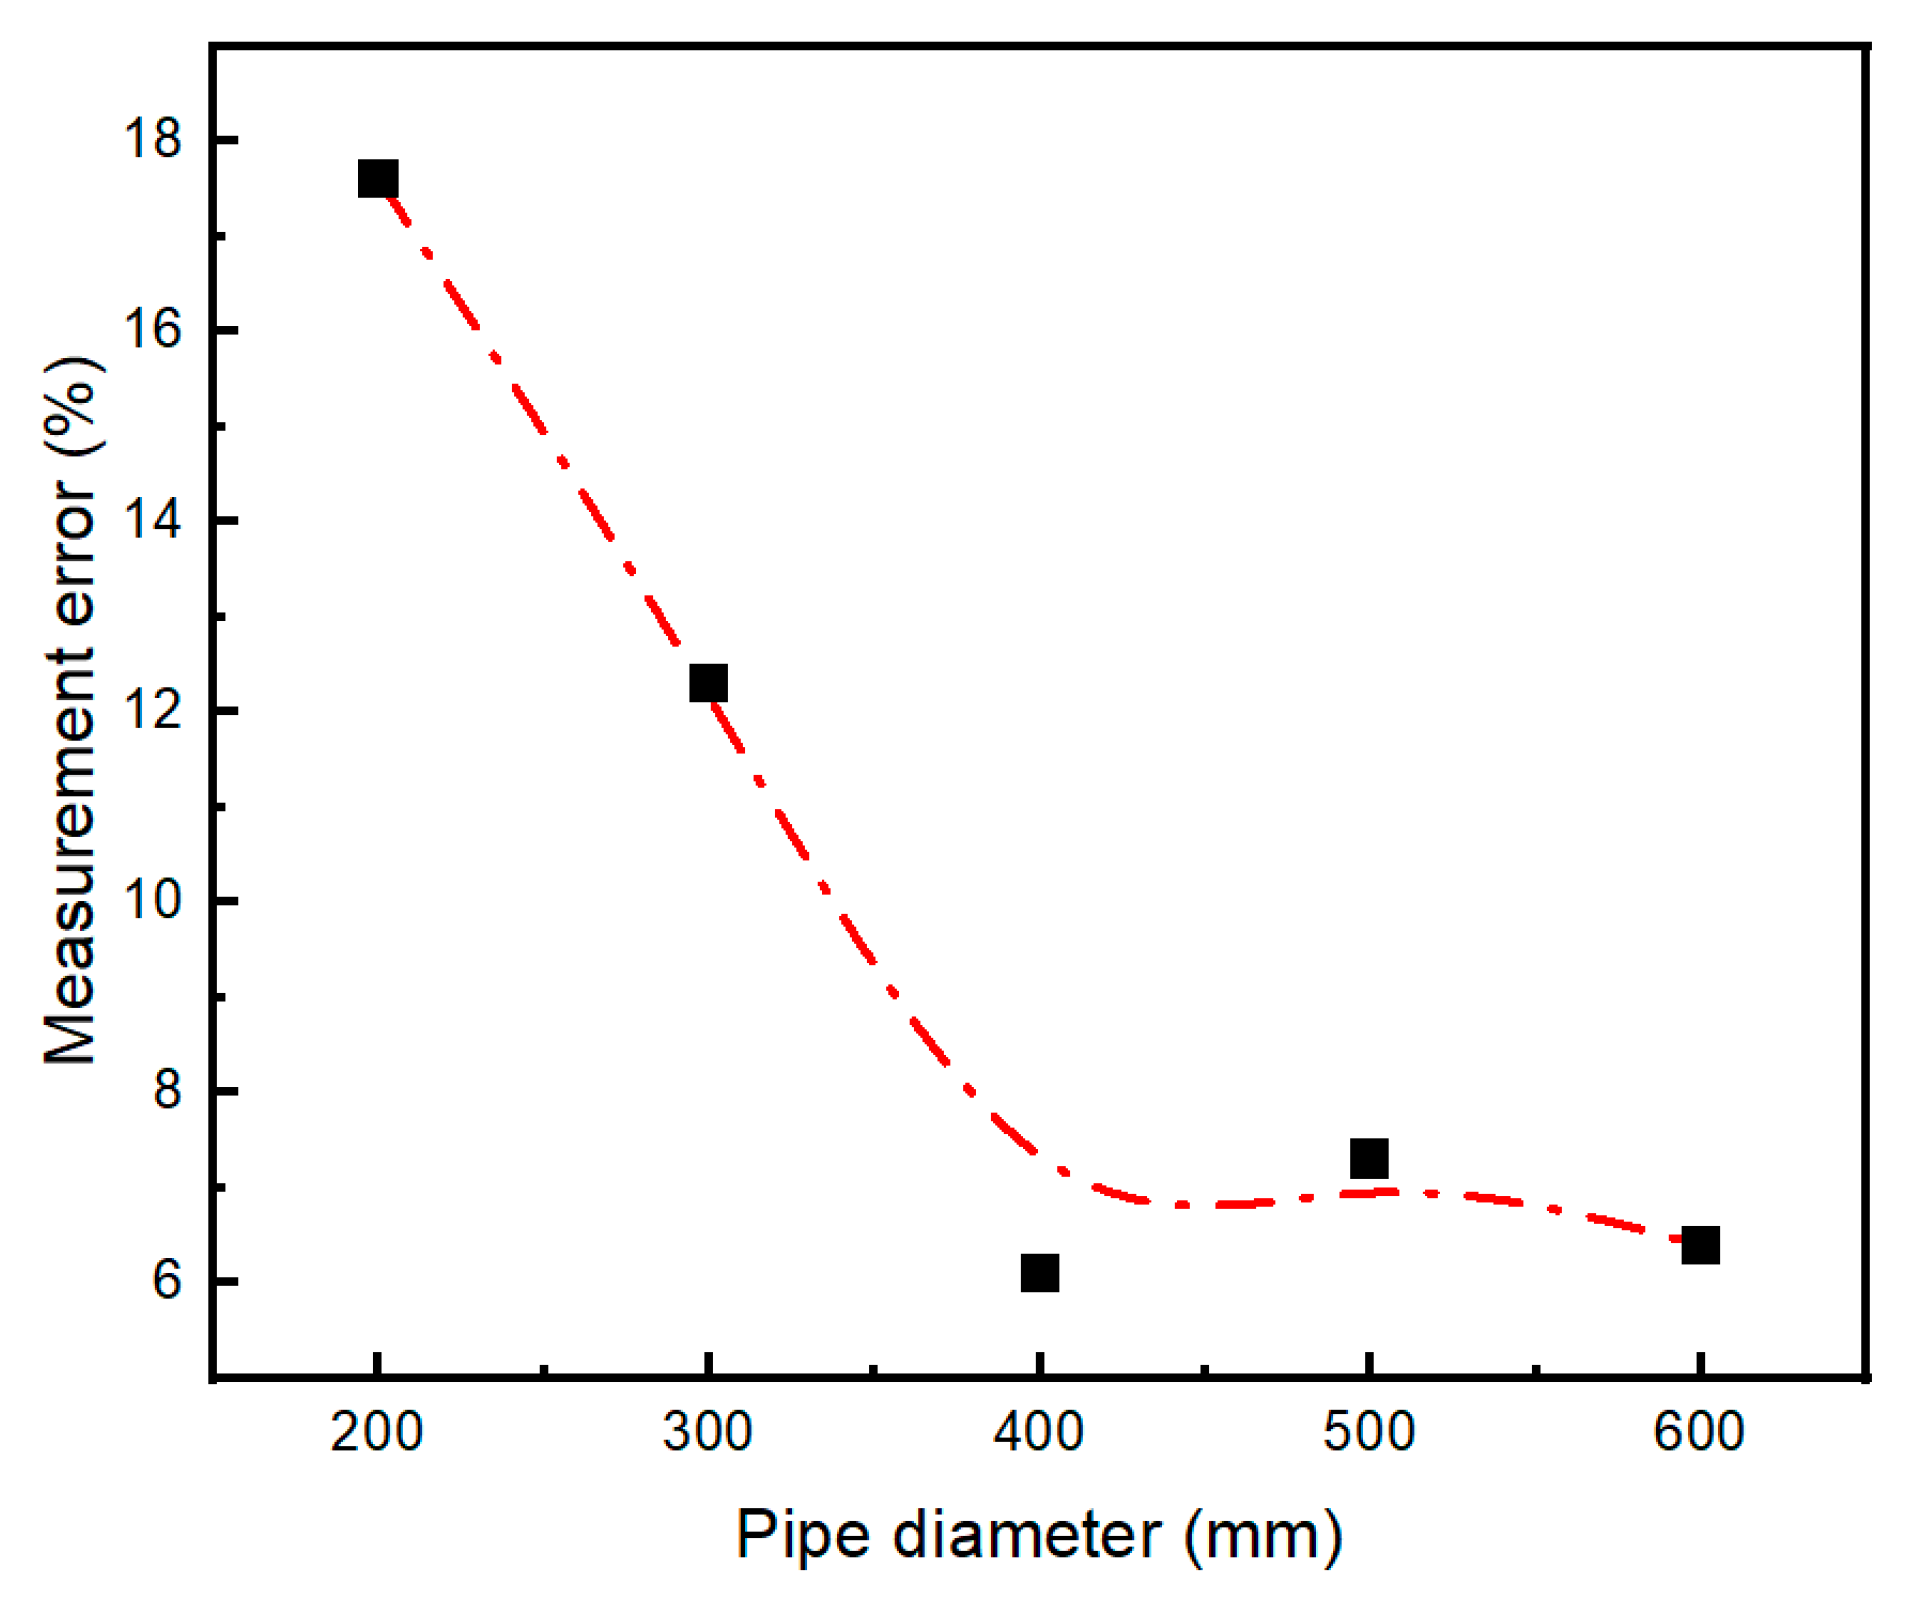
As shown in Figure 14, the measurement error of the LCR-HS method decreases with increasing C-ring radius. To present this trend more intuitively, the maximum measurement error in the high-stress range (150 MPa) for C-rings of different radii was extracted. The resulting error curve of the LCR-HS method for C-rings with different pipe diameters is shown in Figure 15.
It can be observed that when the pipe diameter of the C-ring is 200 mm, the measurement error reaches 17.6%, which does not meet the engineering requirement of 10% measurement accuracy. This is because smaller pipe diameters result in more coupling agents being filled between the transducer and the specimen, thereby increasing the measurement error. However, as the pipe diameter continues to increase, the measurement error decreases rapidly. When the diameter exceeds 338 mm, the error falls below 10%. Once the diameter exceeds 400 mm, the error drops below 8% and gradually stabilizes.
Figure 16 is the repeatability curve of pipe diameter 400 mm at different stress levels. Table 4 shows the repeatability for different pipe diameters and stress levels. It can be observed that for pipes of identical diameter, the repeatability of the LCR-HS method exhibits less variation with changing stress levels. As the pipe diameter increases, the repeatability progressively improves, converging to a consistent value within 12.5 MPa beyond 400 mm. This is primarily attributed to the decreasing thickness of the coupling layer between the probe and the pipe wall as the diameter increases, which reduces stochastic errors and consequently enhances detection accuracy.

6.2. Case Study

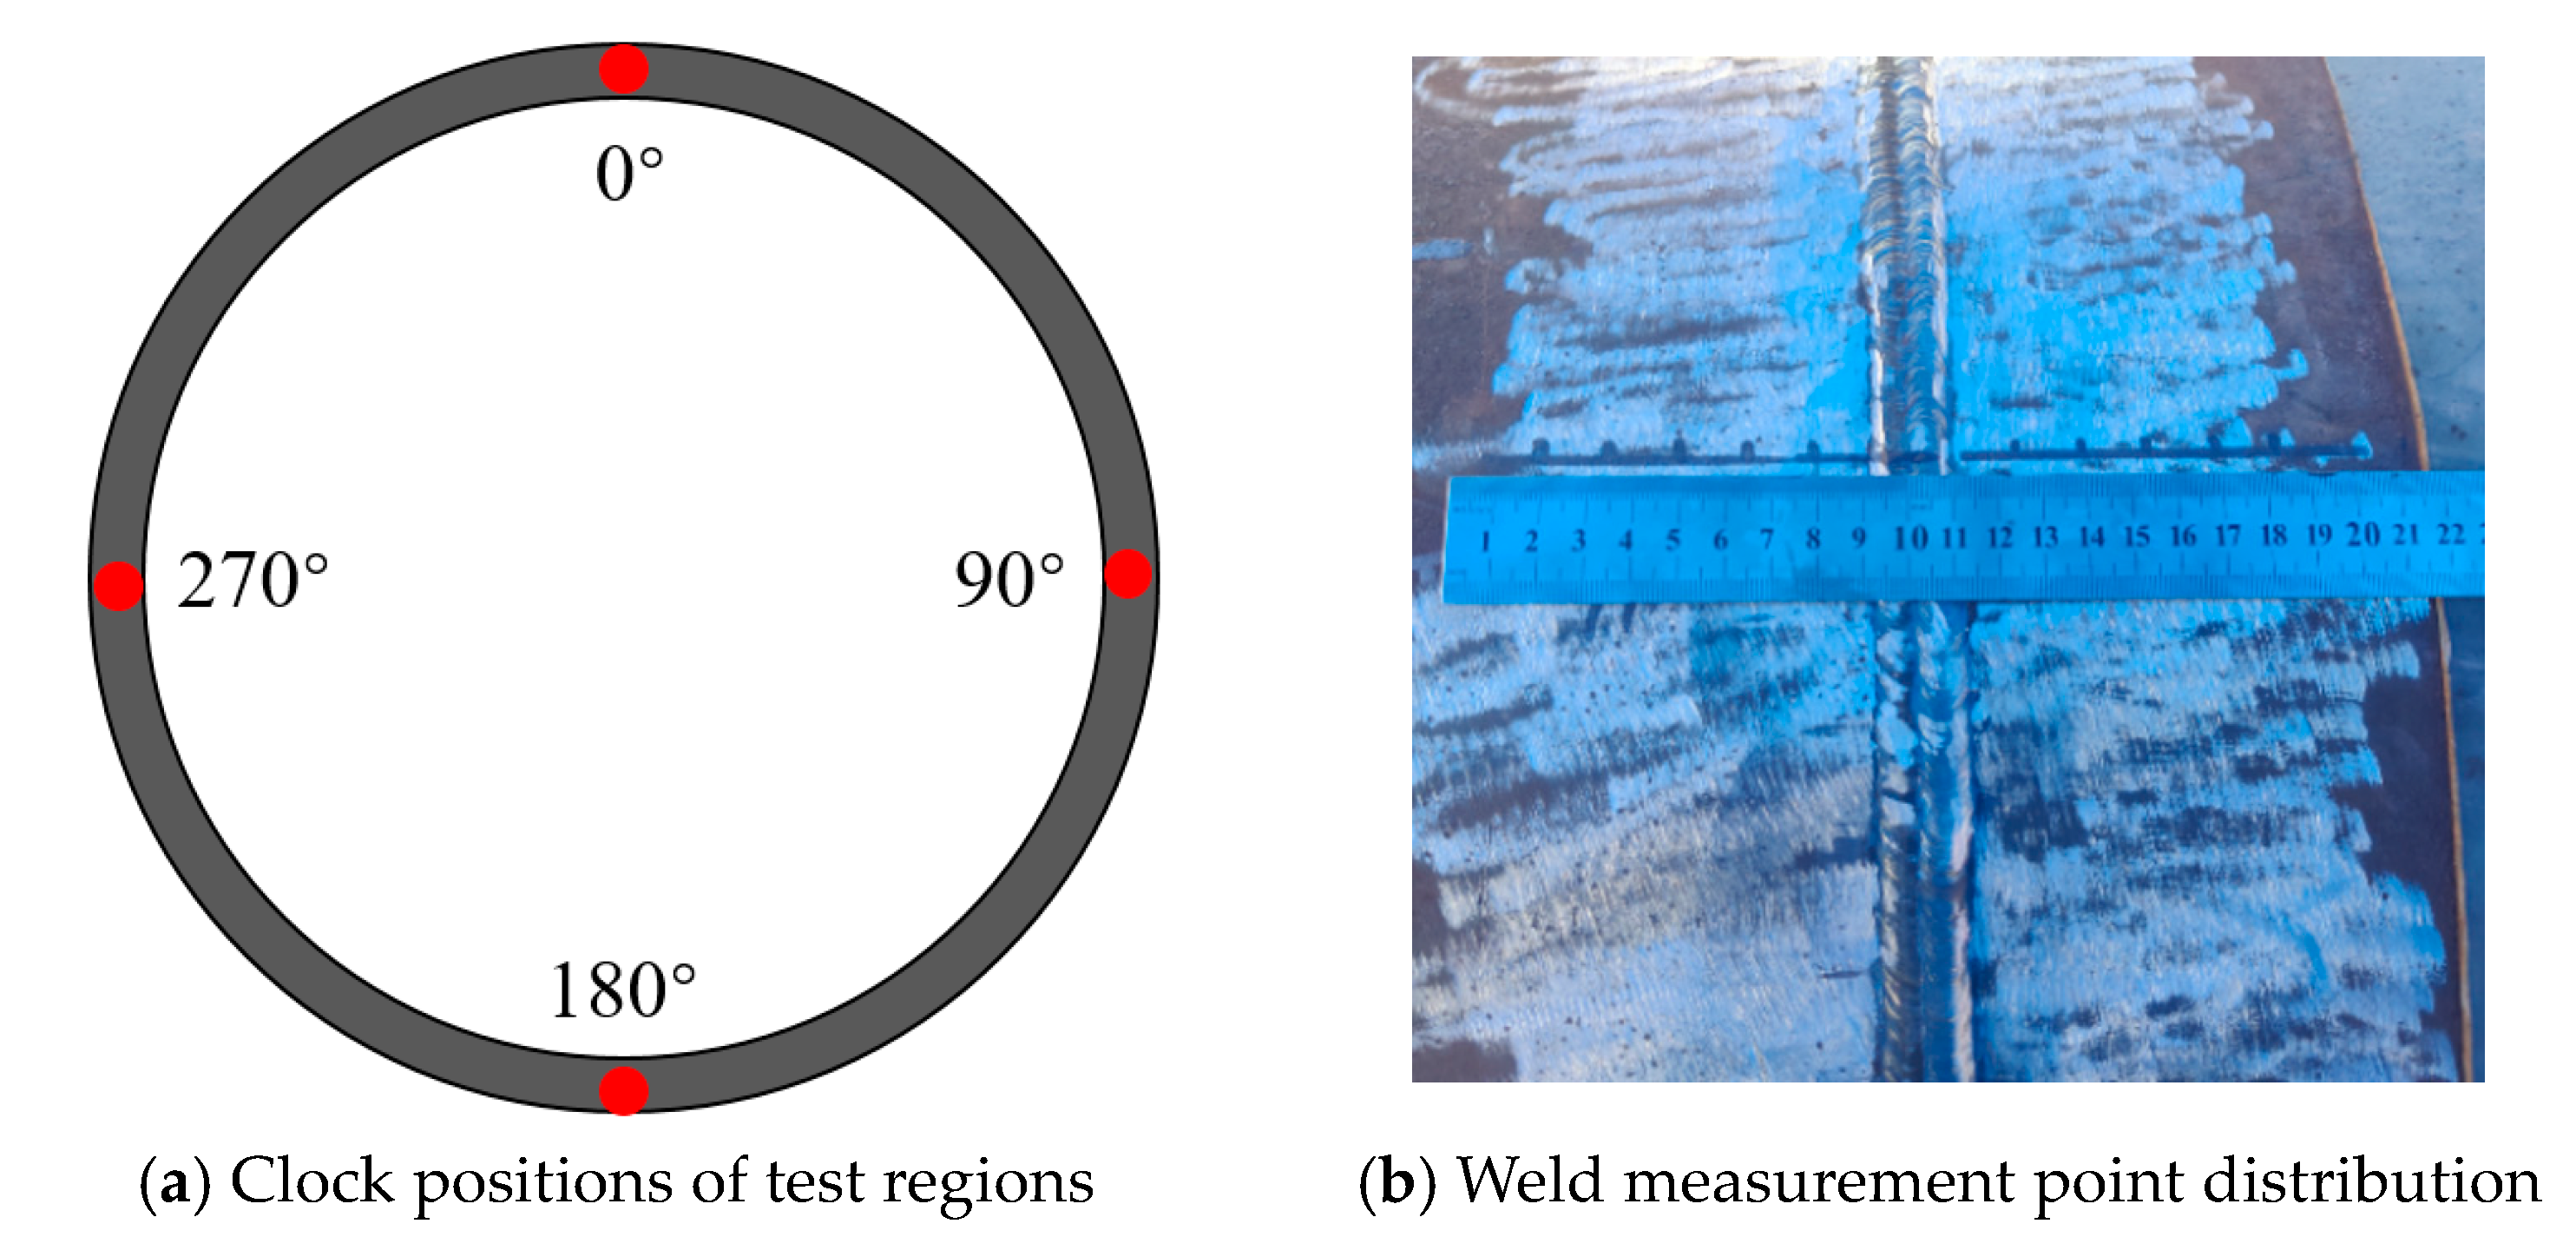
As shown in Figure 17a, four hoop positions (0°, 90°, 180°, and 270°) are selected for testing in the weld area. The distribution of measurement points along the weld is shown in Figure 17b, with a spacing of 15 mm between adjacent points. The measurement range covers both the heat-affected zone (HAZ) and the base metal. Additionally, the hoop stress distribution in the pipeline girth weld was obtained using the SYSWELD 2022.0. Table 5 is the welding technology. The results of the LCR-HS method and the simulation are presented in Figure 18.
As shown in Figure 18, the peak stress occurs at the weld toe locations ± 10 mm from the weld centerline. Subsequently, the stress decreases sharply, displaying compressive stresses within the HAZ. In the base metal zone, the stress changes into tensile stress and gradually decreases to a stress-free state. The simulation results are consistent with findings reported in the literature [32,33,34], demonstrating the validity of the testing in this study.
A strong correlation is observed between the X-ray test and simulation results. The LCR-HS measured stress values are lower than the simulated results and X-ray test. This is because ultrasonic testing provides the average stress over a finite region, which causes peak stress values to be averaged and thus reduced. However, the trends in the simulation and LCR-HS measurement results are consistent, and the stress levels in regions far from the weld agree well with the simulation, further validating the accuracy of the ultrasonic measurement method.

7. Conclusions

Based on the acoustic simulation model of pipeline hoop stress, the propagation behavior of hoop LCR waves in pipelines was clarified. A correction technique for ultrasonic measurement of pipeline hoop stress was proposed, addressing the issue of surface milling that is typically required for such measurements. This method enables hoop stress measurement without the need for surface flattening. The main conclusions are as follows:
(1)
Ultrasonic waves propagated in the near-field region within the wedge and exhibited quasi-plane wave characteristics without diffusion. After oblique incidence through the coupling layer into the pipeline, the LCR wave propagated along the chordal direction.
(2)
Based on the ray tracing method, a mapping relationship between the geometric structure of the pipeline and the ultrasonic propagation path was established. A correction algorithm for pipeline hoop stress measurement, referred to as the LCR-HS method, was developed.
(3)
Validation experiments using C-rings demonstrated that the measurement error decreased with increasing pipe diameter. When the diameter exceeds 338 mm, the error falls below 10%, and when it exceeds 400 mm, the error drops below 8% and gradually stabilized. Furthermore, a case study was conducted using the proposed method. Hoop stresses at the pipeline girth welds were obtained through both measurement and simulation, and the experimental results showed good agreement with the simulated data. The effectiveness and practicality of the proposed method were thus validated.
This study provides a solution for the non-planar measurement of the hoop stress of the pipeline and provides a guarantee for further improving the integrity of the pipeline.
The developed acoustic simulation model is predicated on the assumption of material isotropy. Consequently, the ray-tracing correction model may exhibit limited applicability to steels with varying anisotropy or composite materials. Moreover, ultrasonic stress measurement theories remain largely predicated on isotropic material assumptions. Consequently, extending these techniques to steels with varying anisotropy and composites represents a question requiring substantive investigation. In addition, improving the accuracy of pipe diameters less than 400 mm is also worthy of further study.

Author Contributions

Conceptualization, B.C.; Methodology, B.C., F.Q. and J.C.; Software, B.C., F.Q. and J.C.; Validation, B.C., F.Q. and J.C.; Formal analysis, B.C., F.Q. and J.C.; Investigation, B.C. and F.Q.; Resources, B.C., F.Q. and C.L.; Data curation, B.C., B.W., F.Q. and C.L.; Writing—original draft, B.C. and C.L.; Writing—review & editing, B.C.; Visualization, B.W. and G.G.; Supervision, B.W. and G.G.; Project administration, B.W. and G.G.; Funding acquisition, B.W. and G.G. All authors have read and agreed to the published version of the manuscript.

Funding

This research was funded by the Key Research and Development Plan of Sichuan Province grant number 25GJHZ0239 and The APC was funded by the Key Research and Development Plan of Sichuan Province grant number 25GJHZ0239.

Data Availability Statement

Data is contained within the article. Further inquiries can be directed to the corresponding authors.

Conflicts of Interest

Author Binbin Wang was employed by the company Northwest Branch of PipeChina. The remaining authors declare that the research was conducted in the absence of any commercial or financial relationships that could be construed as a potential conflict of interest.

References

  1. Wang, Q.; Song, Y.; Zhang, X.; Dong, L.; Xi, Y.; Zeng, D.; Liu, Q.; Zhang, H.; Zhang, Z.; Yan, R.; et al. Evolution of corrosion prediction models for oil and gas pipelines: From empirical-driven to data-driven. Eng. Fail. Anal. 2023, 146, 107097. [Google Scholar] [CrossRef]
  2. Wasim, M.; Djukic, M.B. External corrosion of oil and gas pipelines: A review of failure mechanisms and predictive preventions. J. Nat. Gas Sci. Eng. 2022, 100, 104467. [Google Scholar] [CrossRef]
  3. Mondal, B.C.; Dhar, A.S. Burst pressure of corroded pipelines considering combined axial forces and bending moments. Eng. Struct. 2019, 186, 43–51. [Google Scholar] [CrossRef]
  4. Ozkan, I.F.; Mohareb, M. Testing and analysis of steel pipes under bending, tension, and internal pressure. J. Struct. Eng. 2009, 135, 187–197. [Google Scholar] [CrossRef]
  5. Mirzaee-Sisan, A.; Wu, G. Residual stress in pipeline girth welds- a review of recent data and modelling. Int. J. Press. Vessel. Pip. 2019, 169, 142–152. [Google Scholar] [CrossRef]
  6. Sun, M.; Fang, H.; Wang, N.; Du, X.; Zhao, H.; Zhai, K.-J. Limit state equation and failure pressure prediction model of pipeline with complex loading. Nat. Commun. 2024, 15, 4473. [Google Scholar] [CrossRef]
  7. Sun, M.; Fang, H.; Du, X.; Wang, W.; Li, X. Study on evaluation method of failure pressure for pipeline with axially adjacent defects. China Ocean Eng. 2023, 37, 598–612. [Google Scholar] [CrossRef]
  8. Arumugam, T.; Kumar, S.D.V.; Karuppanan, S.; Ovinis, M. The influence of axial compressive stress and internal pressure on a pipeline network: A review. Appl. Sci. 2023, 13, 3799. [Google Scholar] [CrossRef]
  9. Gou, R.; Zhang, Y.; Xu, X.; Sun, L.; Yang, Y. Residual stress measurement of new and in-service X70 pipelines by X-ray diffraction method. NDT E Int. 2011, 44, 387–393. [Google Scholar] [CrossRef]
  10. Same, S.A.; Khan, K.; Smyth, N.A. Comparison between a predicted and an experimentally measured residual stress field generated by side-punching of API X65 steel. Int. J. Press. Vessel. Pip. 2023, 203, 104943. [Google Scholar] [CrossRef]
  11. Damjanović, D.; Kozak, D.; Milinović, A.; Stojšić, J. Estimation of residual stresses in pipe-ring specimens by incremental hole drilling and X-ray diffraction method. Exp. Tech. 2024, 48, 129–139. [Google Scholar] [CrossRef]
  12. Peng, W.; Jiang, W.; Sun, G.; Yang, B.; Shao, X.; Tu, S.-T. Biaxial residual stress measurement by indentation energy difference method: Theoretical and experimental study. Int. J. Press. Vessel. Pip. 2022, 195, 104573. [Google Scholar] [CrossRef]
  13. Zhang, Y.; Xue, H.; Yang, Y.; Wang, S.; Wang, Z.; Wu, J.; Yang, C. Nondestructive testing method of residual stresses in metallic materials based on knoop indentation technique. Nondestruct. Test. Eval. 2025, 40, 188–205. [Google Scholar] [CrossRef]
  14. Liu, B.; Tian, R.; Yu, H.; He, L.; Yang, L.; Wang, F.; Geng, H.; Tian, Y. Research on the characteristics of weak magnetic internal detection signals for critical damage in pipeline stress based on density functional theory. Eng. Fail. Anal. 2024, 159, 108145. [Google Scholar] [CrossRef]
  15. He, G.; He, T.; Liao, K.; Deng, S.; Chen, D. Experimental and numerical analysis of non-contact magnetic detecting signal of girth welds on steel pipelines. ISA Trans. 2022, 125, 681–698. [Google Scholar] [CrossRef]
  16. Huang, Z.; Li, J.; Wang, L.; Lei, L.; Huang, X.; Yin, Z. Welding residual stress analysis of the X80 pipeline: Simulation and validation. Mech. Sci. 2024, 15, 305–314. [Google Scholar] [CrossRef]
  17. Song, W.; Pan, Q.; Xu, C.; Li, X.; Jin, X.; Li, H.; Liu, S. Residual stress nondestructive testing for pipe component based on ultrasonic method. In Proceedings of the 2014 IEEE Far East Forum on Nondestructive Evaluation/Testing, Chengdu, China, 20–23 June 2014; pp. 163–167. [Google Scholar] [CrossRef]
  18. Luo, C.; Chen, B.; Xia, L.; Xu, L.; Liu, X.; Zou, S.; Peng, D.; Gou, G. Residual stress measurement using EMAT for X80 pipeline steel: Effects of coating thickness and surface roughness under low surface preparation requirements. Materials 2024, 17, 5799. [Google Scholar] [CrossRef]
  19. Zhu, Z.; Gou, G.; Zhang, Z.; Ma, C.; Gao, W. Evaluate welding residual of 6082-T6 aluminum alloy welded plate by using ultrasonic method. Int. J. Mod. Phys. B 2019, 33, 1940038. [Google Scholar] [CrossRef]
  20. Zhu, Q.; Chen, J.; Gou, G.; Chen, H.; Li, P.; Gao, W. Residual stress measurement and calibration for A7N01 aluminum alloy welded joints by using longitudinal critically refracted (LCR) wave transmission method. J. Mater. Eng. Perform. 2016, 25, 4181–4189. [Google Scholar] [CrossRef]
  21. Guo, M.; Gou, G.; Chen, B.; Qiu, F.; Zhu, Z.; Jin, J.; Wu, X.; Gao, W.; Sun, S. Ultrasonic correction measurement for residual stress in 5083 aluminum alloy welded component of high-speed train. Metals 2023, 13, 137. [Google Scholar] [CrossRef]
  22. Zhu, Q.; Chen, J.; Gou, G.; Chen, H.; Li, P. Ameliorated longitudinal critically refracted—Attenuation velocity method for welding residual stress measurement. J. Mater. Process. Technol. 2017, 246, 267–275. [Google Scholar] [CrossRef]
  23. Gonçalves, V.V.; dos Santos, A.A., Jr. Effect of non-uniformity on time-of-flight measurement of critically refracted longitudinal waves for stress evaluations of carbon composite materials. Exp. Tech. 2022, 46, 1–15. [Google Scholar] [CrossRef]
  24. Liu, E.; Liu, Y.; Tan, J.; Gu, W.; Zheng, J.; Deng, S. Ultrasonic measurement method for three-dimensional assembly stress of aero-engine rotors. Mech. Syst. Signal Process. 2025, 222, 111796. [Google Scholar] [CrossRef]
  25. Li, P.; Xu, C.; Pan, Q.; Lu, Y.; Li, S. Denoising of LCR wave signal of residual stress for rail surface based on lifting scheme wavelet packet transform. Coatings 2021, 11, 496. [Google Scholar] [CrossRef]
  26. Wang, Y.; Zhao, Z.; Qiao, M.; Ding, W.; Su, H. A depth gradient residual stress measurement method based on energy attenuation of LCR waves. IEEE Trans. Instrum. Meas. 2025, 74, 6003209. [Google Scholar] [CrossRef]
  27. Sun, L.; Shi, W.; Tian, X.; Li, J.; Zhao, B.; Wang, S.; Tan, J. A plane stress measurement method for CFRP material based on array LCR waves. NDT E Int. 2025, 151, 103318. [Google Scholar] [CrossRef]
  28. Javadi, Y.; Hloch, S. Evaluation of hoop residual stress variations in the thickness of dissimilar welded pipes by using the LCR ultrasonic waves. Teh. Vjesn. 2016, 23, 329–335. [Google Scholar] [CrossRef]
  29. Li, Y.; Li, S.; Zhou, Y.; Wan, W.; Guo, H.; Zhou, S.; Sun, L. Research on method for measuring two-dimensional stress in curved surface components using ultrasonic LCR waves. In Proceedings of the 2024 18th Symposium on Piezoelectricity, Acoustic Waves, and Device Applications (SPAWDA), Dongguan, China, 8–11 November 2024; pp. 405–409. [Google Scholar] [CrossRef]
  30. Egle, D.M.; Bray, D.E. Measurement of acoustoelastic and third-order elastic constants for rail steel. J. Acoust. Soc. Am. 1976, 60, 741–744. [Google Scholar] [CrossRef]
  31. ANSI/NACE TM0177-2016; Laboratory Testing of Metals for Resistance to Sulfide Stress Cracking and Stress Corrosion Cracking in H2S Environments. ANSI: Washington, DC, USA, 2016.
  32. Perić, M.; Garašić, I.; Gubeljak, N.; Tonković, Z.; Nižetić, S.; Osman, K. Numerical simulation and experimental measurement of residual stresses in a thick-walled buried-arc welded pipe structure. Metals 2022, 12, 1102. [Google Scholar] [CrossRef]
  33. Deng, D.; Kiyoshima, S. FEM prediction of welding residual stresses in a SUS304 girth-welded pipe with emphasis on stress distribution near weld start/end location. Comput. Mater. Sci. 2010, 50, 612–621. [Google Scholar] [CrossRef]
  34. Akbari, D.; Sattari-Far, I. Effect of the welding heat input on residual stresses in butt-welds of dissimilar pipe joints. Int. J. Press. Vessel. Pip. 2009, 86, 769–776. [Google Scholar] [CrossRef]
Figure 1. Surface grinding requirements for pipeline hoop stress measurement.
Jmse 13 01845 g001
Figure 2. Sketch to show the LCR waves.
Jmse 13 01845 g002
Figure 3. Acoustic simulation model for pipeline hoop stress.
Jmse 13 01845 g003
Figure 4. Excitation signal waveform.
Jmse 13 01845 g004
Figure 5. Acoustic pressure distribution in the pipeline at different times.
Jmse 13 01845 g005
Figure 6. Measurement point distribution on the curved component.
Jmse 13 01845 g006
Figure 7. Normalized acoustic pressure-time curves at points B and C.
Jmse 13 01845 g007
Figure 8. Schematic diagram of LCR wave propagation path in pipeline hoop stress measurement.
Jmse 13 01845 g008
Figure 9. Dimensions of the C-ring (outer diameter: 400 mm).
Jmse 13 01845 g009
Figure 10. C-ring test setup.
Jmse 13 01845 g010
Figure 11. Stress distribution in the C-ring (15 mm compression). (B) is an enlarged view of the red boxed area in (A).
Jmse 13 01845 g011
Figure 12. LCR waveforms and time delay curves of the C-ring under different compression amounts.
Jmse 13 01845 g012
Figure 13. Comparison between stress measured by the LCR-HS method and theoretical values (pipe diameter: 400 mm).
Jmse 13 01845 g013
Figure 14. Experimental results for C-rings with different pipe diameters.
Jmse 13 01845 g014
Figure 15. Measurement error curve of the LCR-HS method for C-rings with different pipe diameters.
Jmse 13 01845 g015
Figure 16. Repeatability curve of pipe diameter 400 mm.
Jmse 13 01845 g016
Figure 17. Distribution of stress measurement points.
Jmse 13 01845 g017
Figure 18. Hoop stress distribution in pipeline girth weld.
Jmse 13 01845 g018
Table 1. Material parameters used in the simulation.
ComponentDensity (kg/m3)L-Wave Velocity (m/s)Shear Wave Velocity (m/s)Damping Ratio
Curved component2700630030800.5 × 10−2
Wedge 1190270013401 × 10−2
Piezoelectric wafer750046201750/
Absorbing layer6580150077520 × 10−2
Table 2. Pseudocode for the implementation process of ultrasonic stress measurement.
Algorithm: An LCR-Wave Pipeline Hoop Stress Measurement Method
Input:Pipe diameter R, incident angle of ultrasonic transducer iCou,
ultrasonic velocity of wedge VWedge, ultrasonic velocity of pipe VCur,
ultrasonic velocity of coupling gel VCou, coefficient of plane stress KPla,
detection distance of plane probe LPla
Begin:
1Initialize all parameters of the model
2Assign values to input parameters
//Confirm parameters based on material properties and ultrasonic characteristics
3Angle of refraction in pipe β, is calculated by solving
arcsin(βVCou/VCur) + 90° = arcsin(siniCou VCou/VWedge) + β
4Calculate effective distance of pipeline stress detection LCur = 2Rcosβ
//Establishing ultrasonic stress measurement system
5Collect data from the receiving probe
6Obtain LCR wave propagation time t1
7Calculate time of flight difference ΔtCur= t1t0
8Calculate hoop stress σhoop
Output:Hoop stress values σhoop
Table 3. Comparison of stress measurement errors using the LCR-HS method for the C-ring.
Compression (mm)Theoretical Stress (MPa)LCR-HS MethodUncorrected Planar Method
Measured (MPa)Error (%)Measured (MPa)Error (%)
2.5655.59 45.99 17.28 24.23 56.42
4.5799.24 94.94 4.34 50.02 49.60
6.46140.28 156.50 11.56 82.45 41.22
8.62187.19 195.81 4.60 103.16 44.89
10.44226.71212.876.11112.1550.53
Table 4. The repeatability for different pipe diameters and stress levels.
Pipe Diameter200 mm300 mm400 mm500 mm600 mm
Repeatability100 MPa30.9 MPa20.7 MPa10.2 MPa10.1 MPa8.9 MPa
150 MPa42.6 MPa22.8 MPa12.5 MPa11.8 MPa9.7 MPa
200 MPa38.7 MPa21.4 MPa11.8 MPa11.4 MPa10.7 MPa
Average37.4 MPa21.6 MPa11.5 MPa11.1 MPa9.8 MPa
Table 5. The welding technology.
Welding TechnologyWelding MaterialsPipe Dimensions
Root WeldingFill and Cover
GMAW-STT-FCAW-SER50-6CHW-50C6E81T8-Ni2JHOBART FabshieldD1016 × 12
Disclaimer/Publisher’s Note: The statements, opinions and data contained in all publications are solely those of the individual author(s) and contributor(s) and not of MDPI and/or the editor(s). MDPI and/or the editor(s) disclaim responsibility for any injury to people or property resulting from any ideas, methods, instructions or products referred to in the content.