Article

Status and Evolving Characteristics of Marine Spatial Resources in the Hangzhou Bay Area of Zhejiang Province, China

1
Marine Academy of Zhejiang Province, Hangzhou 310012, China
2
Key Laboratory of Ocean Space Resource Management Technology, Hangzhou 310012, China
3
College of Geography and Environmental Sciences, Zhejiang Normal University, Jinhua 321004, China
4
National Marine Environmental Monitoring Center, Dalian 116023, China
5
GeoInformatic Unit, Geography Section, School of Humanities, University Sains Malaysia, George Town 11800, USM, Malaysia
6
Environmental and Atmospheric Sciences Research Group, Scientific Research Center, Al-Ayen University, Nasiriyah 64001, Thi-Qar, Iraq
7
Department of Earth Sciences, The University of Memphis, Memphis, TN 38152, USA
8
College of Geography and Remote Sensing Sciences, Xinjiang University, Urumqi 830017, China
*
Author to whom correspondence should be addressed.
J. Mar. Sci. Eng. 2025, 13(1), 98; https://doi.org/10.3390/jmse13010098
Submission received: 25 December 2024 / Revised: 5 January 2025 / Accepted: 6 January 2025 / Published: 7 January 2025
(This article belongs to the Section Coastal Engineering)

Abstract

:
The 20th Party Congress initiated efforts to strengthen maritime power and advance marine ecological civilization, which is essential for promoting sustainable development. To achieve this goal, this study combines field measurements, drone imagery, and high-resolution remote sensing data, using GIS technology to analyze changes in marine resources in Hangzhou Bay and assess marine area usage, intertidal zone area changes, and coastline erosion. The key findings show that the industrial sector accounts for the largest usage of marine area, with the industrial sea area growing by 110.3% from 2018 to 2020. The diversity index for marine area usage in Hangzhou Bay has remained stable, consistently at 0.6 and above over the past five years. The continental coastline of Hangzhou Bay has shown a decreasing trend in recent years from 2018 and 2021, with a total intertidal area of Hangzhou Bay decreased by 73.44 km2, where the overall shoal pattern in Hangzhou Bay remained relatively stable from 2008 to 2016. Erosion has been the predominant force, with maximum erosion surpassing 3 m and causing significant spatial changes. Between 2012 and 2016, the total erosion volume reached 192,473.74 × 106 m3, with an average annual erosion rate of 48,118.44 × 106 m3. This process has led to a gradual reduction in the size of affected areas over the period from 2001 to 2021. This research provides valuable insights for authorities to make informed decisions regarding the management of marine spatial resources in Hangzhou Bay.

1. Introduction

In response to the maritime power strengthen initiatives proposed by the 20th National Congress of the Communist Party of China, Zhejiang Province, has formulated and released the “Zhejiang Greater Bay Area Development Action Plan” to advance marine ecological civilization [1,2], create a beautiful ocean, and promote harmony between humans and the sea. This plan focuses on constructing an a comprehensive layout for the bay area characterized by “one ring, one belt, and one channel” (the global development strategy proposed by China aims to promote economic cooperation, infrastructure construction and cultural exchange among countries and regions along the route, fostering interconnectedness in the global economy; https://www.piie.com/sites/default/files/documents/belt_and_road_report_-_final_chinese.pdf (accessed on 4 January 2025)) along with an industrial structure that combines specific points with broader development clusters. Coordinated efforts encompass bay area protection and development [3], improved infrastructure interconnectivity, strengthening of bay-related industries, and the construction of new urban areas within the bay. The goal is to establish a new growth hub for marine economic development [4]. The bay area, consisting of interconnected bays, harbors, and nearby islands, forms a unique urban space specific to coastal cities. It serves as an essential component of the coastal zone, offering rich resources and unique geographical, ecological, cultural, and economic value [5]. Bay area economies, characterized by their distinctive spatial organization and economic forms [6], hold a prominent position in the global economic landscape due to their openness, efficiency, vitality, and strong innovation. The advantageous geographical conditions and rich marine spatial resources serve as the foundational elements for bay area economic development. Rational utilization of marine spatial resources is essential in ensuring the sustainable development of the bay area [7,8].
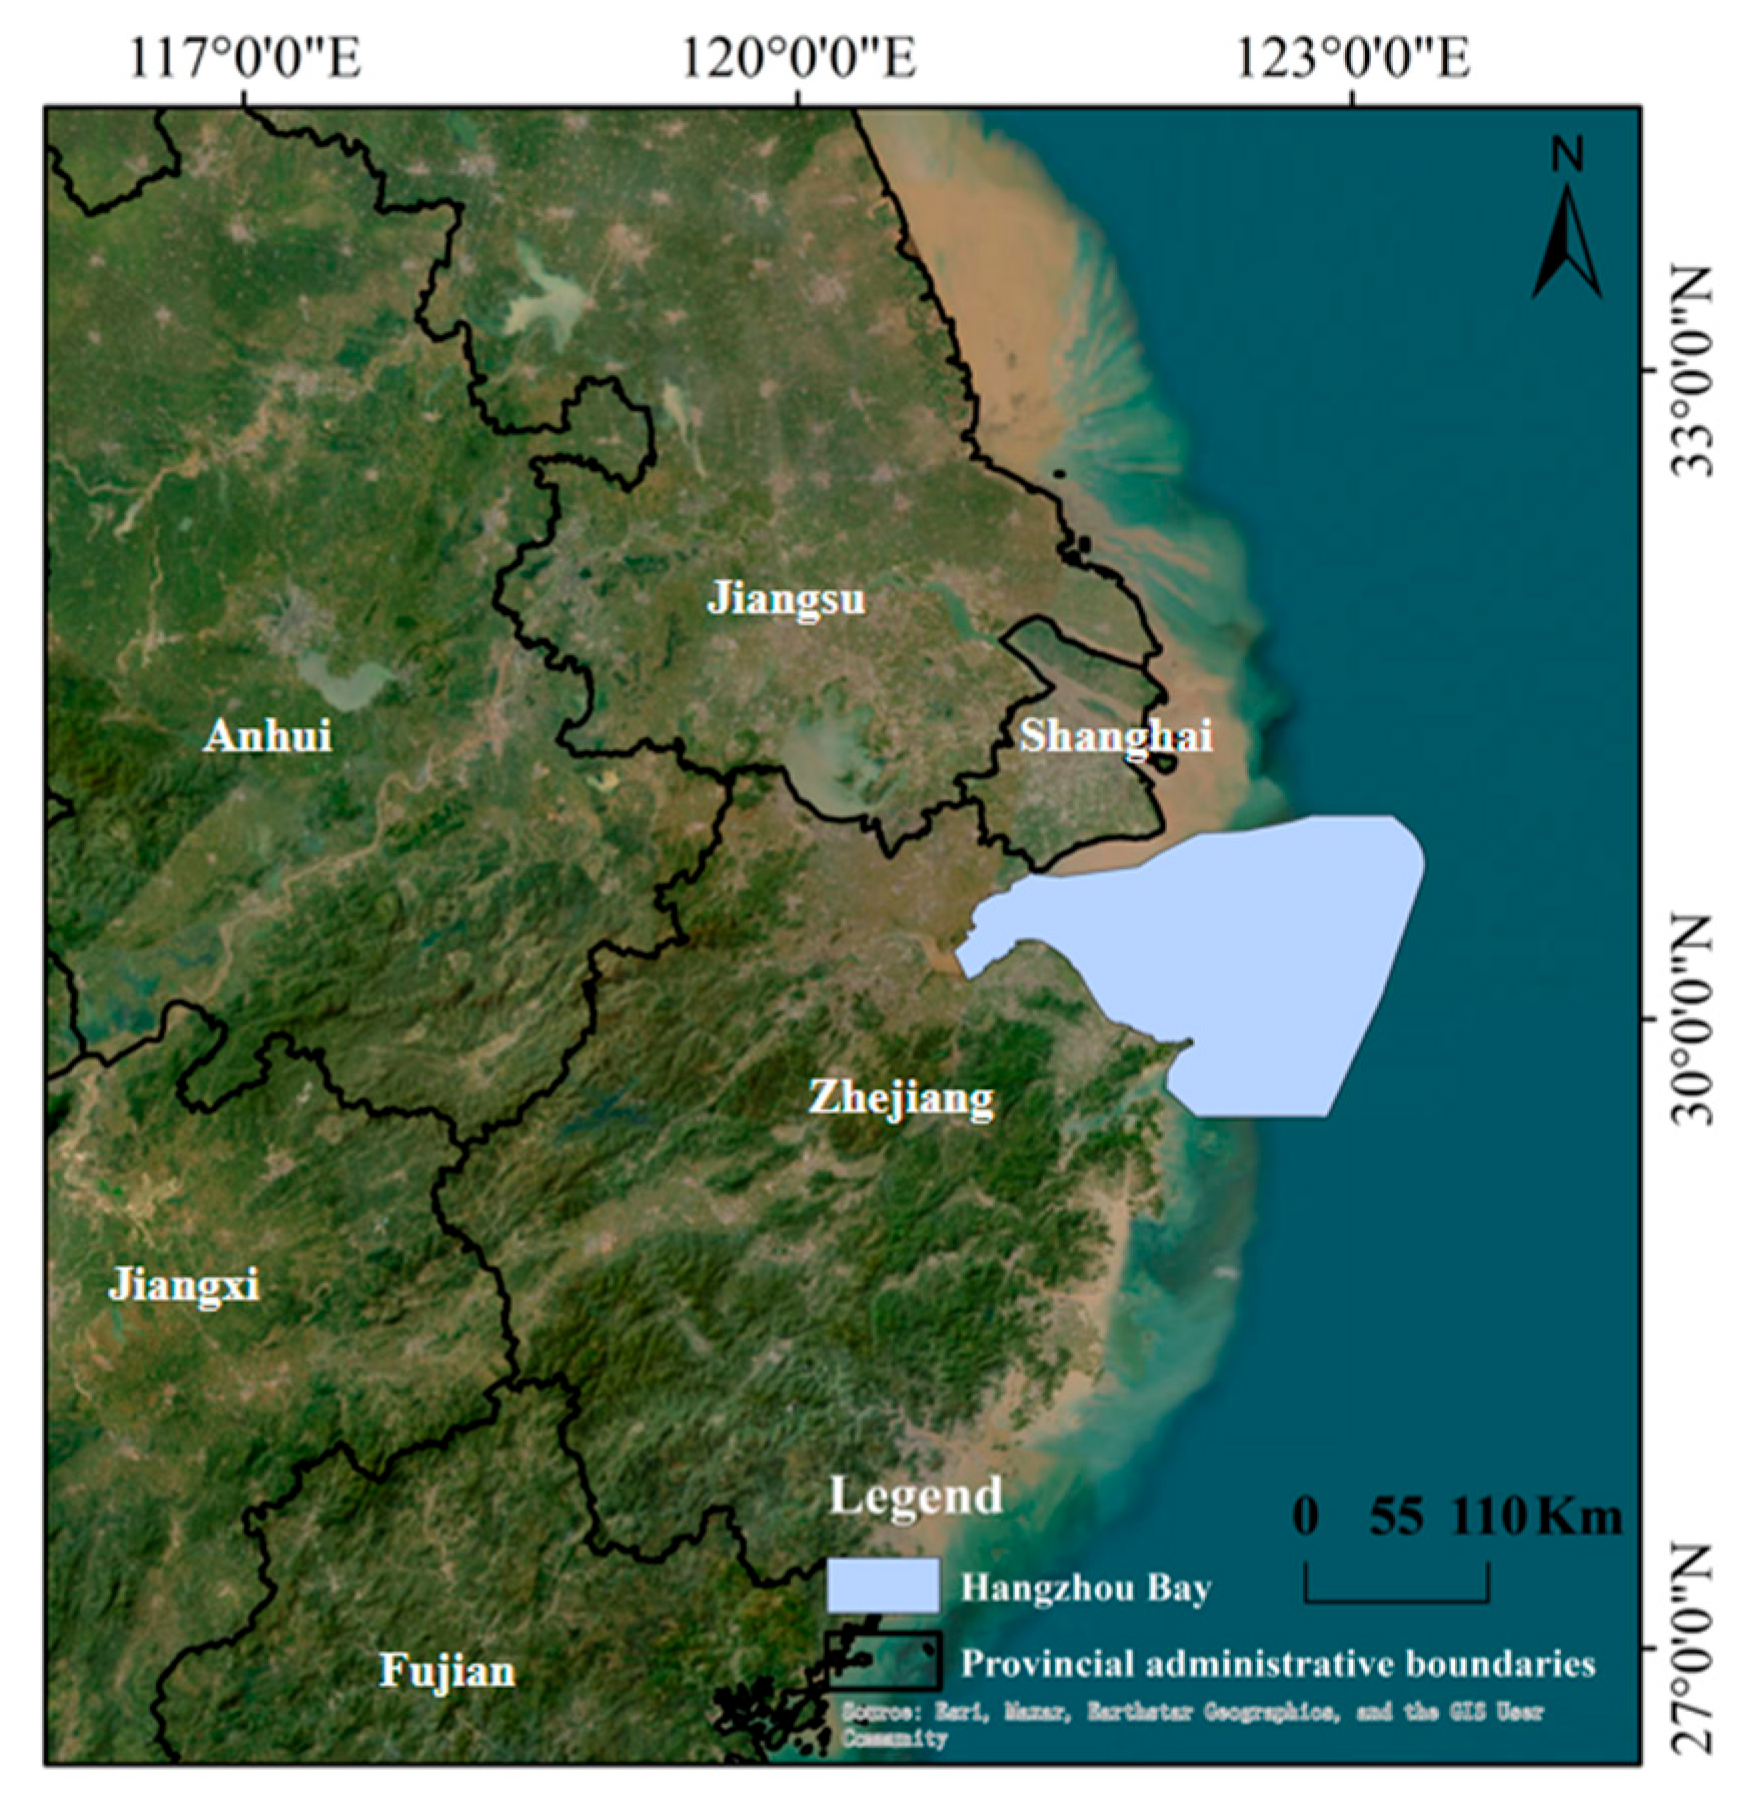
Zhejiang Province, known for its long coastline and numerous islands, ranks as the first in China in terms of total coastline length and number of islands. The six major bay areas along the coast, from north to south, including Hangzhou Bay, Xiangshan Port, Sanmen Bay, Taizhou Bay, Yueqing Bay, and Wenzhou Bay, are crucial for the development of the province’s marine economy development and the protection of its marine ecological environment. The 13th Five-Year Plan for Zhejiang proposes the implementation of the Blue Bay Remediation Action, emphasizing the vigorous development of bay area economies. The plan aims to coordinate the protection and development of bay areas. It also promotes integrated bay area infrastructure, industrial enhancement along the coast, and the construction of new bay area cities to foster a new growth pole for marine economic development. In May 2018, the Zhejiang Provincial Party Committee and Government officially issued the Zhejiang Great Bay Area Construction Action Plan, focusing on the core economic zone of Hangzhou Bay. Hangzhou Bay, situated in the southeast coast, is an important part of the Yangtze River estuary and the Zhejiang coastal marine economic zone. The outline of China’s National Marine Economic Development Plan states that “the Yangtze River Estuary and Hangzhou Bay area possess a strong foundation and advanced level of Marine development, making it one of the most potential areas for Marine economic development in China”. This highlights Hangzhou Bay’s significant role in national marine strategic development [9]. Over time, the abundant marine spatial resources have provided vital strategic support for the province’s socioeconomic development. However, the growing demand for maritime use and the limitations of available resources have led to increasingly prominent conflicts between development and resource conservation. The irrational layout of marine space has adverse effects on the natural environment and ecosystems of the bay areas [10]. Scientific utilization and effective protection of the marine spatial resources in the six major bay estuaries are urgent and critical to achieve sustainable economic development in the bay areas. A comprehensive analysis of the resource and environment carrying capacity of Hangzhou Bay is both urgent and critical for achieving sustainable economic development in the bay areas. It also provides a foundation for future high-quality development and high-level protection for the bay areas.
Improving economic efficiency in the use of marine space resources is an important step toward building a strong maritime nation. Changes in marine spatial resources directly influence the regional economic structure. Through rational development, economic transformation can be facilitated, resource utilization efficiency can be improved, and sustainable regional economic growth can be promoted. Scientific marine spatial planning and management are crucial for coordinating various marine activities, preventing resources over-exploitation and avoiding environmental degradation [11]. The ecological changes in Hangzhou Bay create heightened demands for the sustainable utilization of marine resources, emphasizing the need to maintain marine ecological balance and promote the harmonious development of the marine economy and environmental protection. Hangzhou Bay, located at the core of China’s “T-shaped” economic belt and the world-class Yangtze River Delta urban agglomeration, serves as an essential hub for inland and maritime transportation [12]. It acts as a vital link between the Bohai Bay Economic Zone and the Pearl River Delta Economic Zone. Moreover, it occupies a pivotal position in China’s “Belt and Road” initiative and is strategically adjacent to international shipping routes, which strengthens the position of Hangzhou Bay in global trade and promotes regional economic openness and cooperation. The Hangzhou Bay marine area, as a breeding and migratory zone for various marine economic organisms, plays a crucial role [13,14]. It boasts abundant intertidal wetlands and ecological landscapes. Additionally, as a key maritime gateway for industrial growth and transportation to economically dynamic cities like Ningbo and Jiaxing, Hangzhou Bay plays a vital role in supporting industrial transformation within the region. Its excellent port facilities and shipping conditions attract numerous businesses, driving local economic development. With the growing demand for marine development and utilization, the scale of sea use is expanding, and the limited nature of marine spatial resources puts forward higher requirements for spatial utilization efficiency, so it is extremely important to study the use of marine spatial resources, the attributes of marine spatial resources, and the characteristics of change in the Hangzhou Bay area. Data from the Ministry of Natural Resources (https://www.hangyan.co/charts/3275355674229344130 (accessed on 4 January 2025)) show that new marine engineering projects in China have continued to increase between 2018 and 2021, with new marine projects reaching 861 in 2022 and expected to reach 868 in 2023 and showing a trend toward larger scale. With the development and utilization of marine resources, there is a need to balance the relationship between economic development and ecological protection. Responses to these questions are imminent.
Objectively describing changes in marine bay areas and scientifically assessing the development and utilization of marine bay areas are essential for guiding rational bay and coastal zone planning and achieving the United Nations Sustainable Development Goals (SDG 14). Studies of marine bay areas usually focus on three areas including associated coastline changes [15], coastal land use [16,17], and reclamation [18,19]. Shoreline change monitoring has been extensively conducted using remote sensing techniques over multi-decadal timescales [20,21,22]. As the dividing line between land and sea, changes in the nature of the coastline reflect the spatial and temporal differences in coastal development [23]. Therefore, the study of changes in the coastline, especially changes in its nature, is an effective method for portraying changes in the coastal environment. Shorelines are mainly properties designated by adjacent land use types, which can be classified into natural and artificial categories or more detailed types according to the characteristics of different study areas [24,25], and this classification method can reflect the current development status of the coastal zone to a certain extent. Scholars have also used mathematical models to quantify the extent of development and utilization of the coastal zone, among which the ecological risk assessment method based on landscape ecology is widely used [26].
Many existing studies tend to focus on specific resource types or individual functional areas. In contrast, this research examines the diversity and changing characteristics of overall spatial resources. It encompasses various resource types, including marine usage structures, continental coastlines, and tidal flat systems, along with their spatiotemporal evolution. The aim of this study is to provide a more comprehensive perspective. Additionally, this study integrates multiple data sources, utilizing high-resolution remote sensing images and field survey data to capture dynamic changes in marine resources at a finer scale. It aims to address gaps in existing research concerning the comprehensiveness of marine spatial resource changes, data accuracy, policy effectiveness, and social interactions, providing scientific support for the sustainable use of resources in the Hangzhou Bay area. These innovative approaches contribute to advancing both theoretical research and practical applications in resource management for the region. This study is conducted based on existing research and aims to comprehensively assess the current status and utilization of marine spatial resources in the Hangzhou Bay area. The aims of this study include the following: (1) through on-site supplementary surveys and high-resolution remote sensing monitoring, the study investigates the marine areas, continental coastlines, intertidal zones, tidal flats, and overall seabed sediment dynamics; (2) the study investigates the changing trends of marine spatial resources in the Hangzhou Bay area and explores their underlying reasons. By gaining a deeper understanding of marine spatial resources, this research provides a scientific basis for sustainable development, ecological conservation, and resource utilization. Additionally, it offers valuable experience and insights for spatial planning and management in other coastal regions, promoting improved marine resource management and sustainable development. Through the localized study of Hangzhou Bay, the research can be expanded to a global application of marine resource management, which can provide practical and feasible references for other regions and promote sustainable development and management for global marine resources.

2. Overview of the Study Area

Hangzhou Bay, located between latitude 30°14′ to 30°35′ north and longitude 120°56′ to 121°17′ east, is a funnel-shaped inlet in the East China Sea. It is bordered by the province of Zhejiang and the municipality of Shanghai, which lies to the north of the bay. The bay extends from the East China Sea to its head at the city of Hangzhou, from which its name is derived. At Hangzhou, the Qiantang River flows into the bay, providing freshwater from the west while seawater enters from the east. As a result, Hangzhou Bay, especially its western end, is sometimes referred to as the Qiantang River Estuary (Figure 1) in the scientific literature. Located in the northern subtropical zone and the prevalent monsoon zone of East Asia, with an average temperature ranging from 15.4 to 16.4 °C and an average annual precipitation ranging from 879.9 to 1620.0 mm, Hangzhou Bay’s continental coastline has a total length of 171.97 km, and there are a variety of types of sea use in Hangzhou Bay (Figure 2), including industrial use, seabed engineering, transportation, tourism and recreational use, sewage dumping, and other uses and special use of the sea. There are eight primary categories and 11 secondary categories of sea use for land reclamation projects.

3. Data Sources and Research Methodology

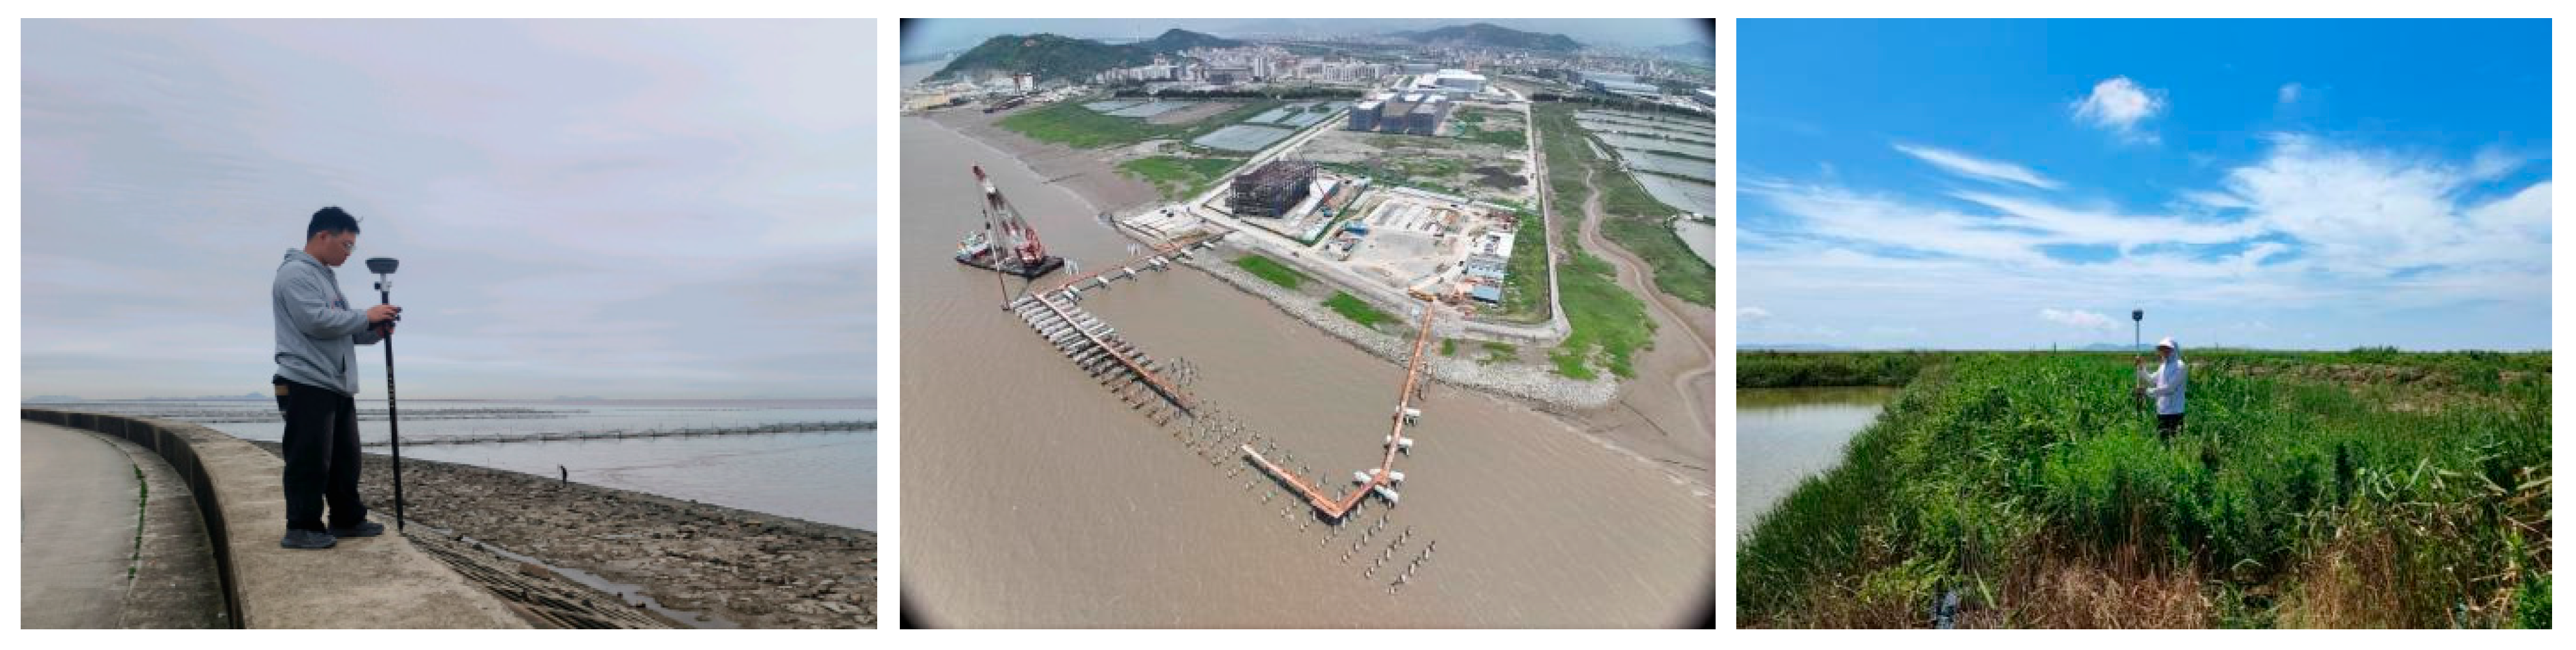
In this study, we collect data on sea area rights in Zhejiang Province from 2018 to 2023. The boundary was delineated based on the scope with Zhejiang Province’s marine functional zoning and the outer boundary of the harbor area. The overview of sea area use was statistically classified using the Classification of Sea Area Use (HY/T 123-2009). The coastline data were generated from continental coastline surveillance and monitoring in 2018 and the data of Zhejiang Province’s coastline repair and measurement in 2021; the scale of the survey was 1:5000. The 0 m line uses the latest mapping results provided by the Department of Natural Resources of Zhejiang Province. In addition, we collected the “Monitoring and Evaluation of Marine Spatial Resources in Hangzhou Bay Area” and the “Technical Report on Coastline Repair and Survey of Zhejiang Province”, and used the topographic survey data of Hangzhou Bay in 2008, 2012, and 2016. The data came from two sources: one was the electronic navigational charts published by the Maritime Administration of the People’s Republic of China in different periods, and the other was the measured data by single beam echo sounding in 2016. The measurement position and measurement line are shown in Figure 3. Another field survey is shown in Figure 4.
The data preprocessing steps are as follows. (1) Data Cleaning: the collected remote sensing data were filtered to remove incomplete or inaccurate measurement data. (2) Coordinate System Transformation: data from different sources were standardized into a uniform coordinate system to ensure consistency. (3) Data Integration: data from electronic navigational charts and single beam echo sounding were combined to create a more complete marine topographic model. For data analysis, marine feature extraction was conducted using GIS software (ArcGIS 10.8/QGIS 3.16) to analyze features such as terrain and depth in the marine area from generated seabed topographic maps. Next, trend analysis of marine spatial resources was implemented by comparing marine data from different time periods.
Coastline data are primarily obtained through manual field measurements, where survey teams conduct on-site surveys along the coastline to record its position. In areas that are difficult to access, drones are used to capture coastline imagery. The most recent results from coastline repair and measurement projects in Zhejiang Province are used to supplement and validate the data obtained from manual and drone surveys. The detailed steps of drone imagery preprocessing, including image correction, denoising, and stitching, were performed by using ArcGIS’s Spatial Analyst and 3D Analyst extensions for raster data analysis, seabed 3D modeling, and spatial analysis, which can utilize built-in algorithms to extract terrain features and depth information of the marine area. Additionally, the GDAL toolset in QGIS was used for data format conversion and image fusion processing while the Processing Toolbox plugin optimized the data processing workflow and enhanced spatial analysis capabilities. The coastline data in this study are scaled at 1:5000, ensuring high spatial accuracy and positional precision. By cross-validating data from various sources, the reliability of the data is enhanced, ensuring the credibility of the analysis results. The referenced “Monitoring and Evaluation of Marine Spatial Resources in Hangzhou Bay Area” and “Technical Report on Coastline Repair and Survey of Zhejiang Province” provide the background information that further supports the validity and authority of the data.
We selected Landsat images in 2001, 2006, 2011, 2016, and 2021 to discuss the spatial change characteristics of the bay area by using the relevant technologies such as RS and GIS. Taking into account the number of types of sea use and the area of each type of marine use, the diversification index of the Gibbs–Martin equation [27] was applied to measure the diversification of marine use activities. The diversity index is a metric that was used to assess the utilization of marine areas and evaluate the distribution and proportion of various marine activities (such as fisheries, shipping, tourism, and protected areas). Its significance lies in the reflection of the balance and sustainability of marine resource use, providing a scientific basis for optimizing marine spatial planning. A higher index reflects a more balanced distribution of various activities, increased diversification in marine utilization, decreased reliance on individual resources, and enhanced efforts to support ecosystem health and sustainable development, and the formula is as follows:
G m = 1 i = 1 n x i 2 ( i = 1 n x i ) 2
where Gm is the diversity index of marine area use; Xi is the area of the ith marine area use type; and n is the number of types of marine area use in the evaluation area (secondary category). (In this study, “secondary category” refers to the secondary classification of marine area use types, which is a more detailed categorization of different marine use types). The formula comprehensively considers the number of types of marine use and the area of various types of marine use. When Gm < 1 and the larger the value, it indicates that the diversity of marine use types is better. The diversity index Gm, ranges from 0 to 1. When i = 1, i.e., there is only one type of marine-use activity in the study area, the value of Gm is 0; when the number of marine-use types increases or the scale of each type of marine-use activity is similar, the value of Gm increases accordingly and tends to be 1.

4. Results and Analysis

4.1. Changes in the Structure of Sea Area Use and Diversity of Types

The hydrological conditions of Hangzhou Bay, particularly tidal effects and changes in flow velocity, play an important role in the structural changes in sea area utilization. Tidal fluctuations not only affect the distribution of marine ecosystems but also directly impact human activities. For example, changes in sea surface area and water depth during tidal fluctuations influence the viability of activities such as fisheries and shipping. As the tides rise and fall, the usable area of the sea changes cyclically, leading to differences in the spatial distribution of sea area utilization at different times. These variations in hydrological conditions directly affect the diversity of sea area utilization types, especially in intertidal and shallow sea zones, where areas of varying depths are suitable for different types of activities [28].
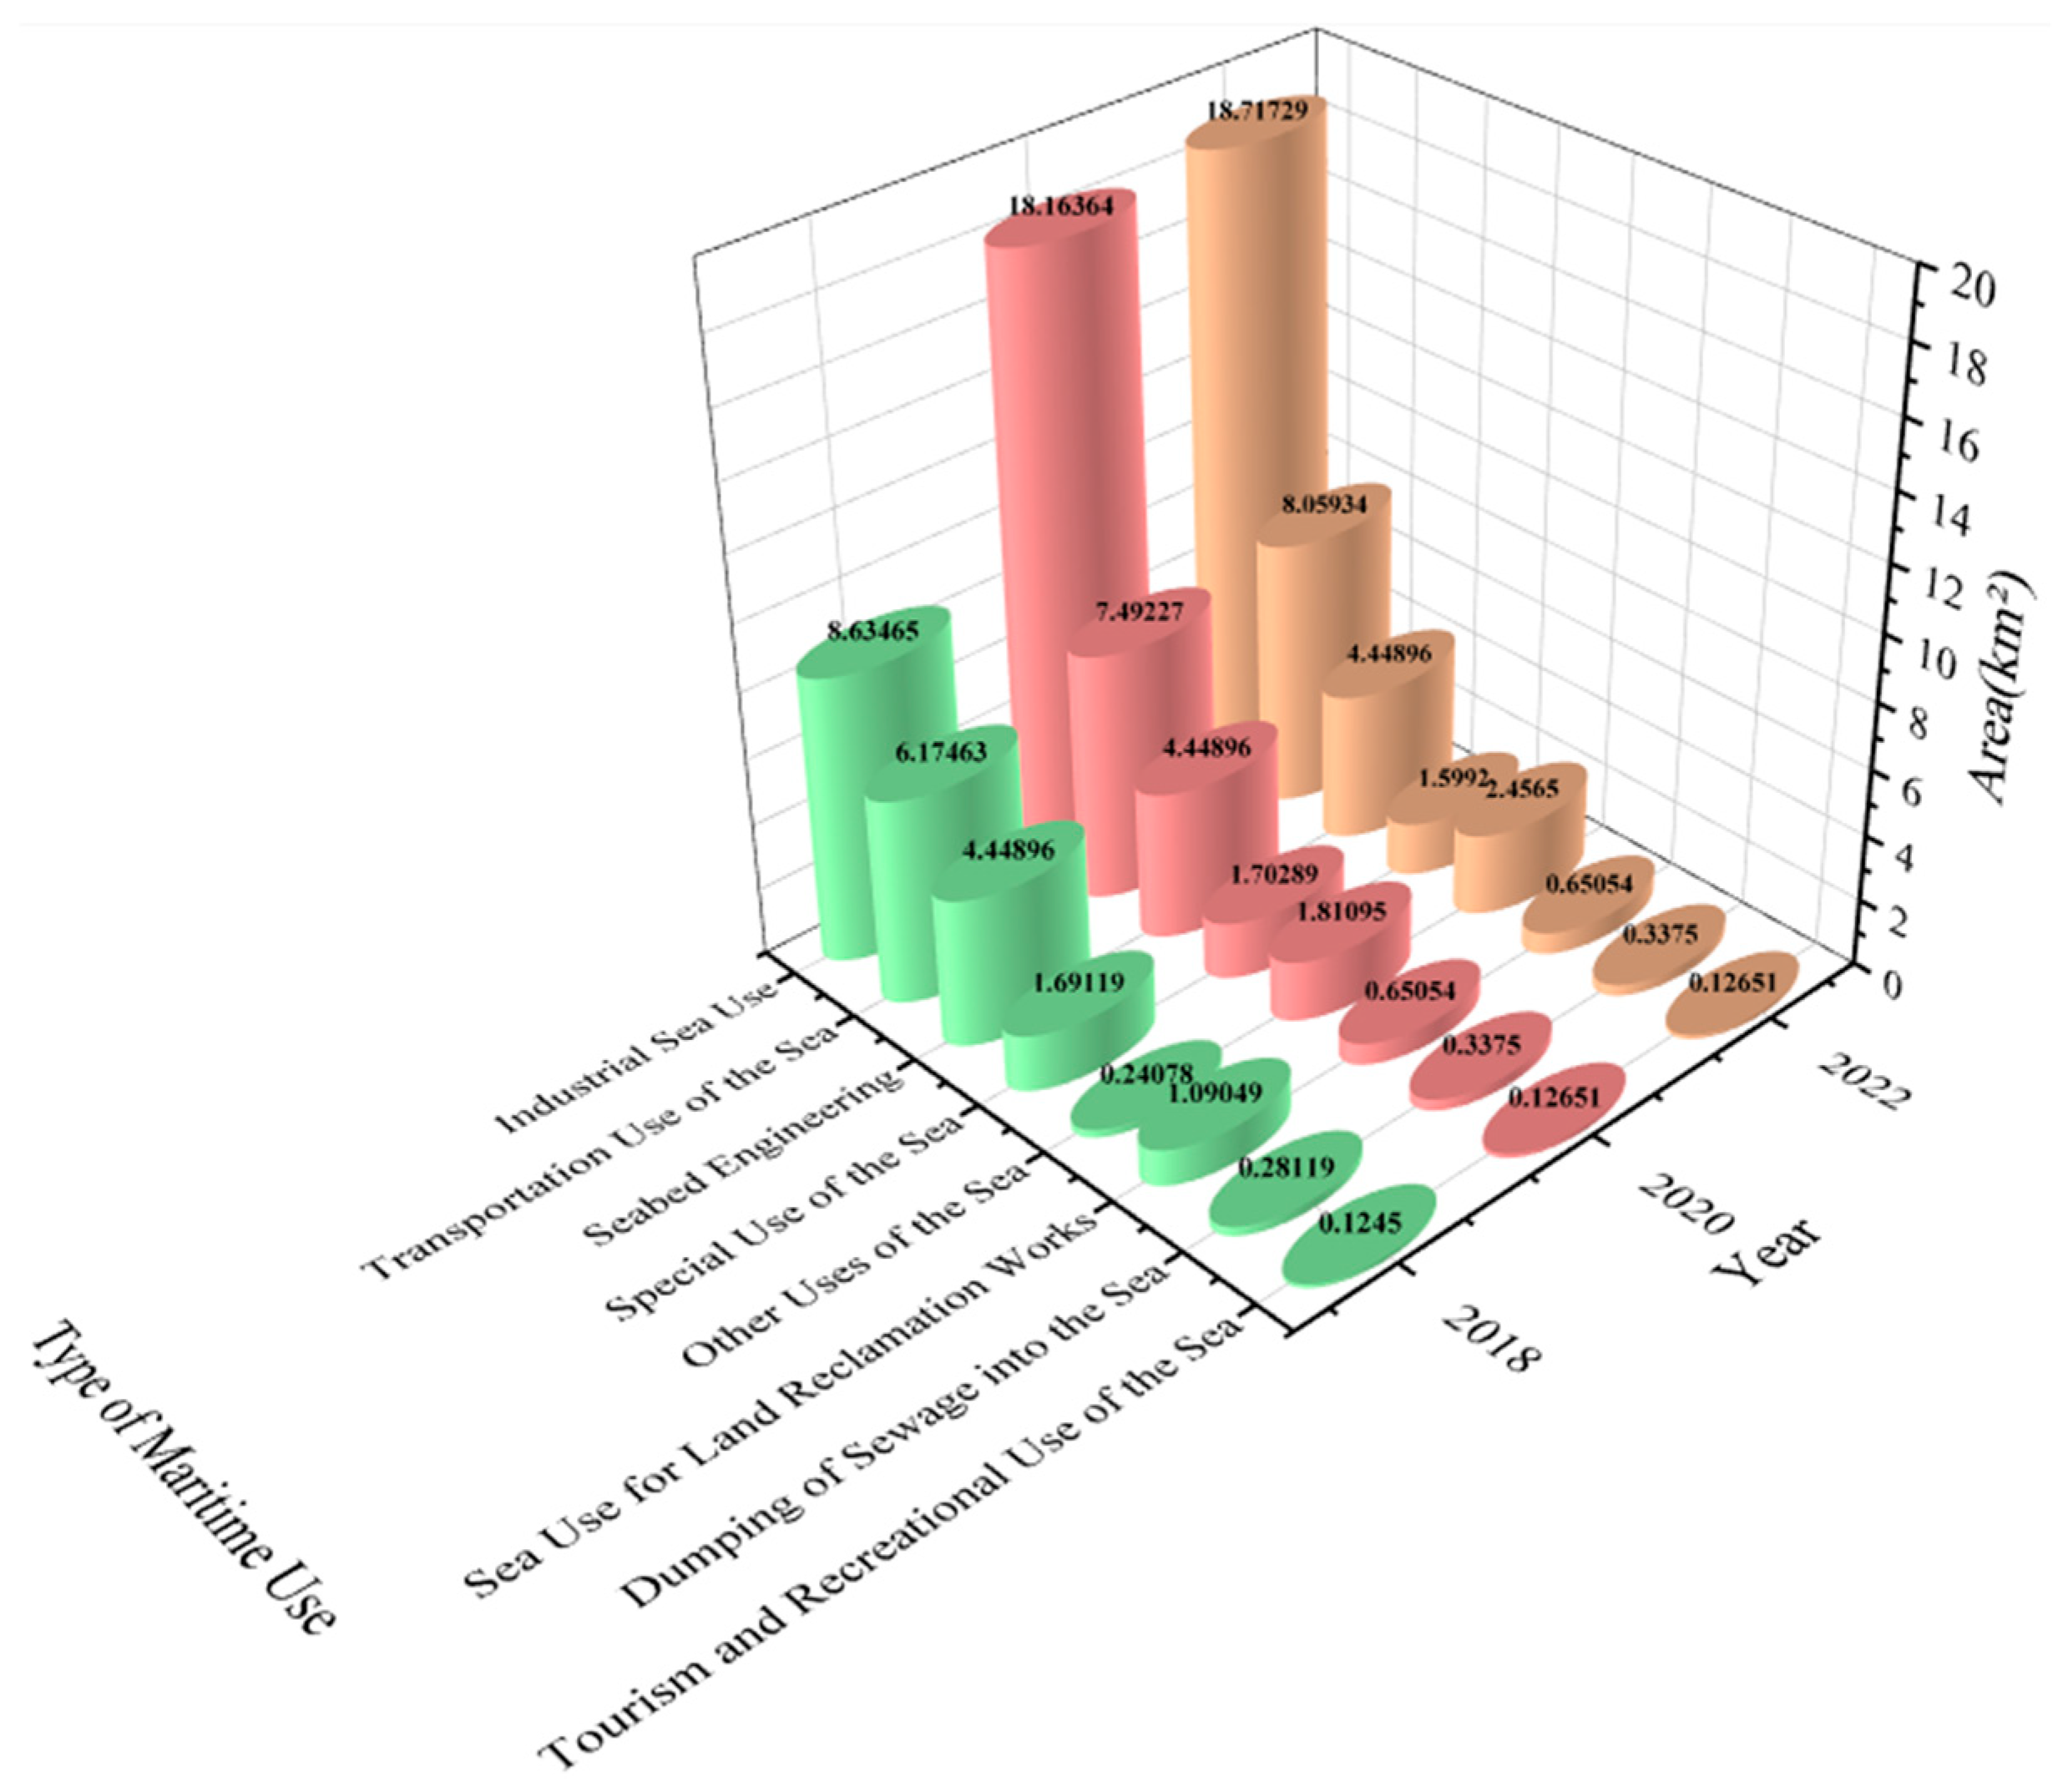
Based on the actual measurement data, see Table 1, an analysis of the Hangzhou Bay marine usage area that reveals the following trends (Figure 5). At the end of 2018, the total marine usage area in Hangzhou Bay reached 22.69 km2. The largest portion was allocated to industrial use, covering 8.63 km2, followed by transportation use with a total area of 6.17 km2. By the end of December 2020, the total marine usage area had expanded to 34.73 km2. Notably, industrial use increased significantly by 110.30%, reaching 18.16 km2. Transportation use expanded by 21.34%, reaching 7.49 km2. However, the sea use for land reclamation works decreased by 40.34% compared to 2018. In January 2022, the total marine usage area stood at 36.40 km2. When compared to 2020, the sea areas allocated for seabed engineering, tourism and recreational, dumping of sewage, and land reclamation works remained unchanged. Industrial use and transportation use experienced slight increases, growing by 3.05% and 7.5%, respectively. The area designated for special uses slightly decreased by 6.09%. These changes reflect the dynamic nature of Hangzhou Bay’s coastal management and its diverse utilization patterns.
The rapid growth of industrial marine areas has positively driven regional economic development but has also exerted considerable pressure on marine ecosystems. The discharge of wastewater and chemical pollutants from industrial activities into the sea has resulted in water quality deterioration, threatening aquatic life [29]. The extensive use of coastal areas for the construction of industrial facilities such as ports, factories, and processing plants has altered the natural structure of intertidal zones and coastal wetlands, destroyed the habitats of many marine species, and reduced ecosystem diversity. The discharge of the wastewater and chemical pollutants from industrial activities has led to a water quality deterioration, negatively affecting aquatic life. Pollutants such as heavy metals, chemicals, and nutrients accumulate in the marine ecosystem, causing eutrophication and hypoxia, which further stress marine organisms and alter food webs. The expansion of industrial marine areas often conflicts with other vital marine uses, such as fisheries and tourism, and encroaches upon ecologically sensitive areas such as breeding grounds and migration corridors. As industrial use increases, the ecological functions of these areas may be weakened, and their capacity of supporting both economic and environmental goals diminishes. While industrial marine use drives economic growth and strengthens infrastructure, these benefits come at the expense of marine ecosystems. This trade-off involves balancing economic and ecological priorities, where unchecked industrial expansion may compromise the sustainability of marine environments, affecting fisheries, tourism, and the overall health of ecosystems in the long run [30]. To achieve a balance between economic development and ecological protection, governments and managers must develop and implement scientifically based strategies. This includes establishing a comprehensive marine environmental monitoring system to regularly assess water quality and ecosystem health, with a particular emphasis on the ecological status of industrial marine areas. When planning industrial marine use, it is essential to consider ecological protection zones and sensitive areas. Industrial development should be concentrated, avoiding large-scale projects in sensitive areas, and ensuring ecological protection zones are separated from industrial regions to preserve critical ecosystems and habitats. Governments should encourage the development of green and low-carbon industries, promote circular economy practices and adopt clean production methods. Reducing resource dependence and minimizing environmental impacts during industrial production, alongside undertaking restoration efforts in damaged ecological areas, will help mitigate the negative effects of industrial activities on the environment.
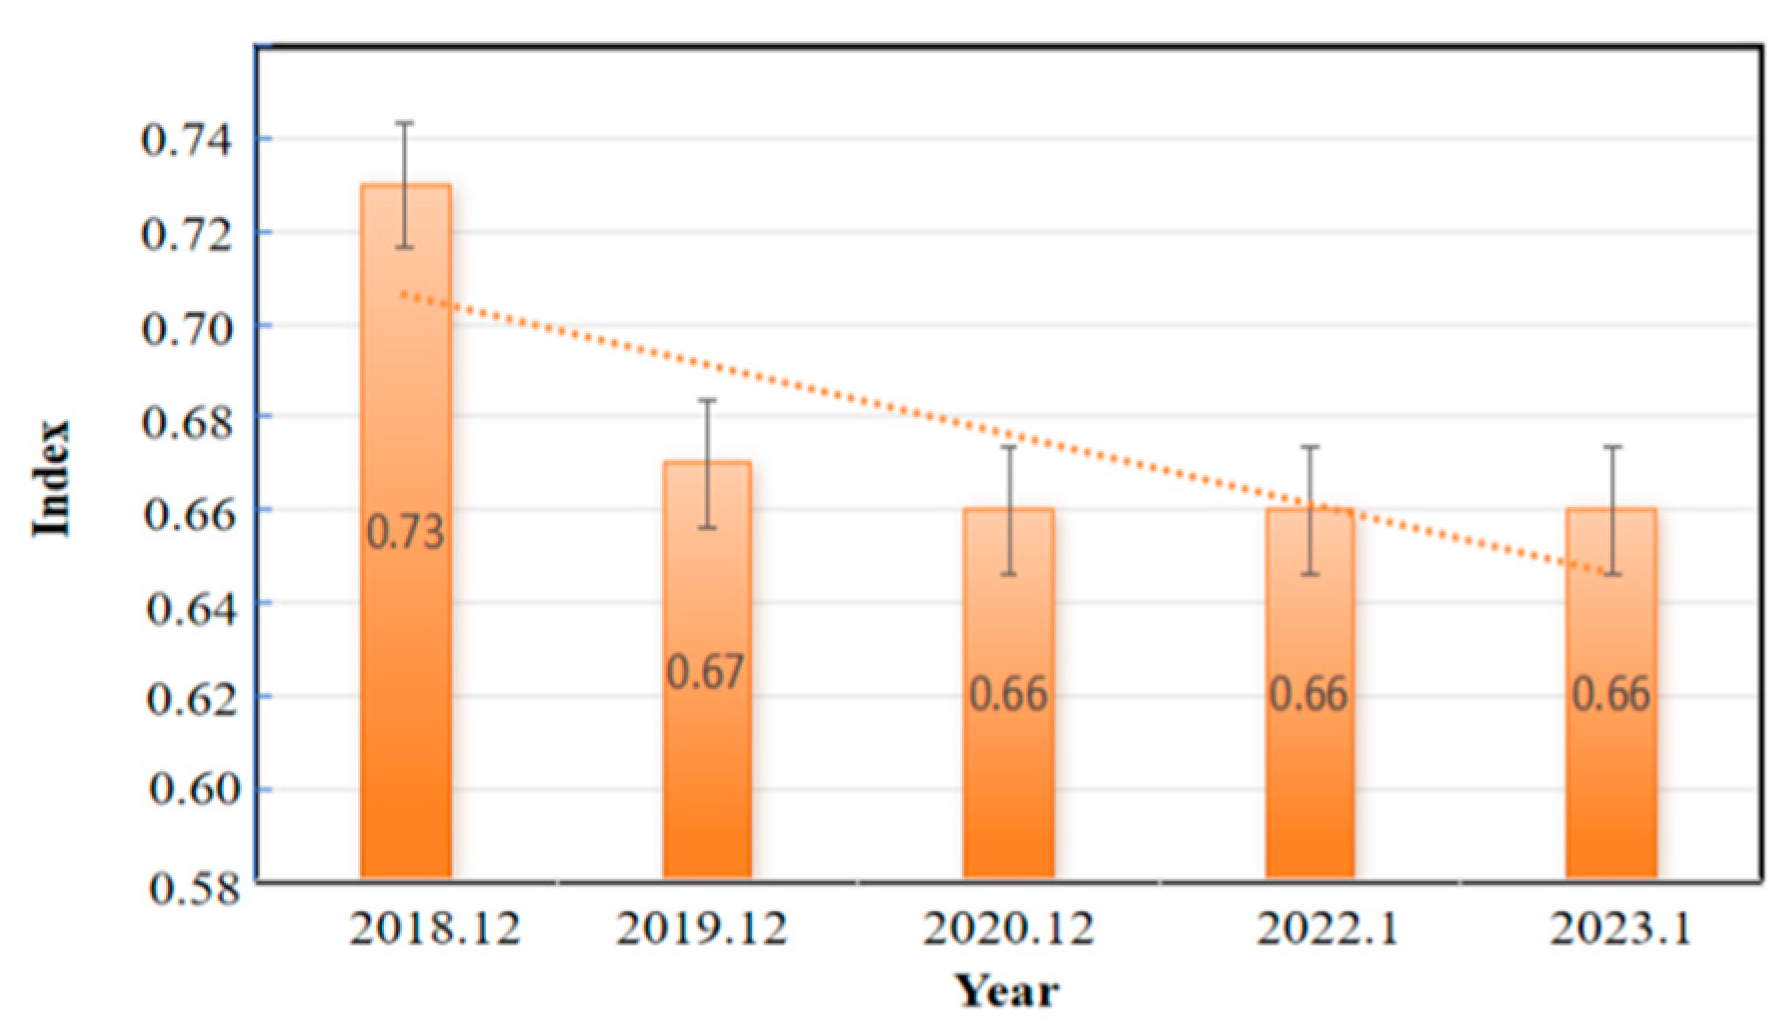
Figure 6 reflects the changes in the diversity index of sea use in Hangzhou Bay from 2018 to 2023. It can be seen that the diversity index of sea area use in Hangzhou Bay is relatively stable, and the diversity index has remained steadily above 0.6 in the past five years. Changes in the diversity index show that the structure of sea use in Hangzhou Bay basically tended to stabilize from 2020 onwards. Between 2018 and 2019, the Hangzhou Bay area underwent industrial structural adjustments. During this period, the proportion of aquaculture and industrial sea use grew rapidly, occupying parts of ecological sea use or other smaller-scale sea use types, leading to a decline in diversity. Additionally, during the intertidal zone restoration process of the Cixi Shoal and the southern coast of Hangzhou Bay, some sea areas were temporarily reallocated for single-use purposes, reducing other types of sea use. This transitional phase of concentrated sea use likely contributed to the decline in the diversity index. Furthermore, the gradual implementation of the outline of the Yangtze River Delta Regional Integrated Development Plan increased the demand for sea use in the Hangzhou Bay area, resulting in more concentrated utilization. Several types of sea use that account for a relatively large proportion of the total have basically remained unchanged in recent years.

4.2. Characterization of Changes in the Continental Coastline

The changes in the mainland coastline are closely related to water flow, tides, and ocean waves. The tidal effects in Hangzhou Bay have intensified the erosion and sedimentation processes along the coastline, particularly in areas with strong tidal fluctuations. The intensity, direction, and seasonal variations in water flow impact the stability and evolution of the coastline. For example, along the northern coast of Hangzhou Bay, between Jinshan and Ganpu, the combined effects of tides and water flow have accelerated coastline erosion, causing coastline retreat. Variations in hydrological conditions, especially changes in tidal effects and water flow direction, result in significant differences in coastline changes over time, further affecting the spatial distribution and utilization patterns of the coastal zone [28].
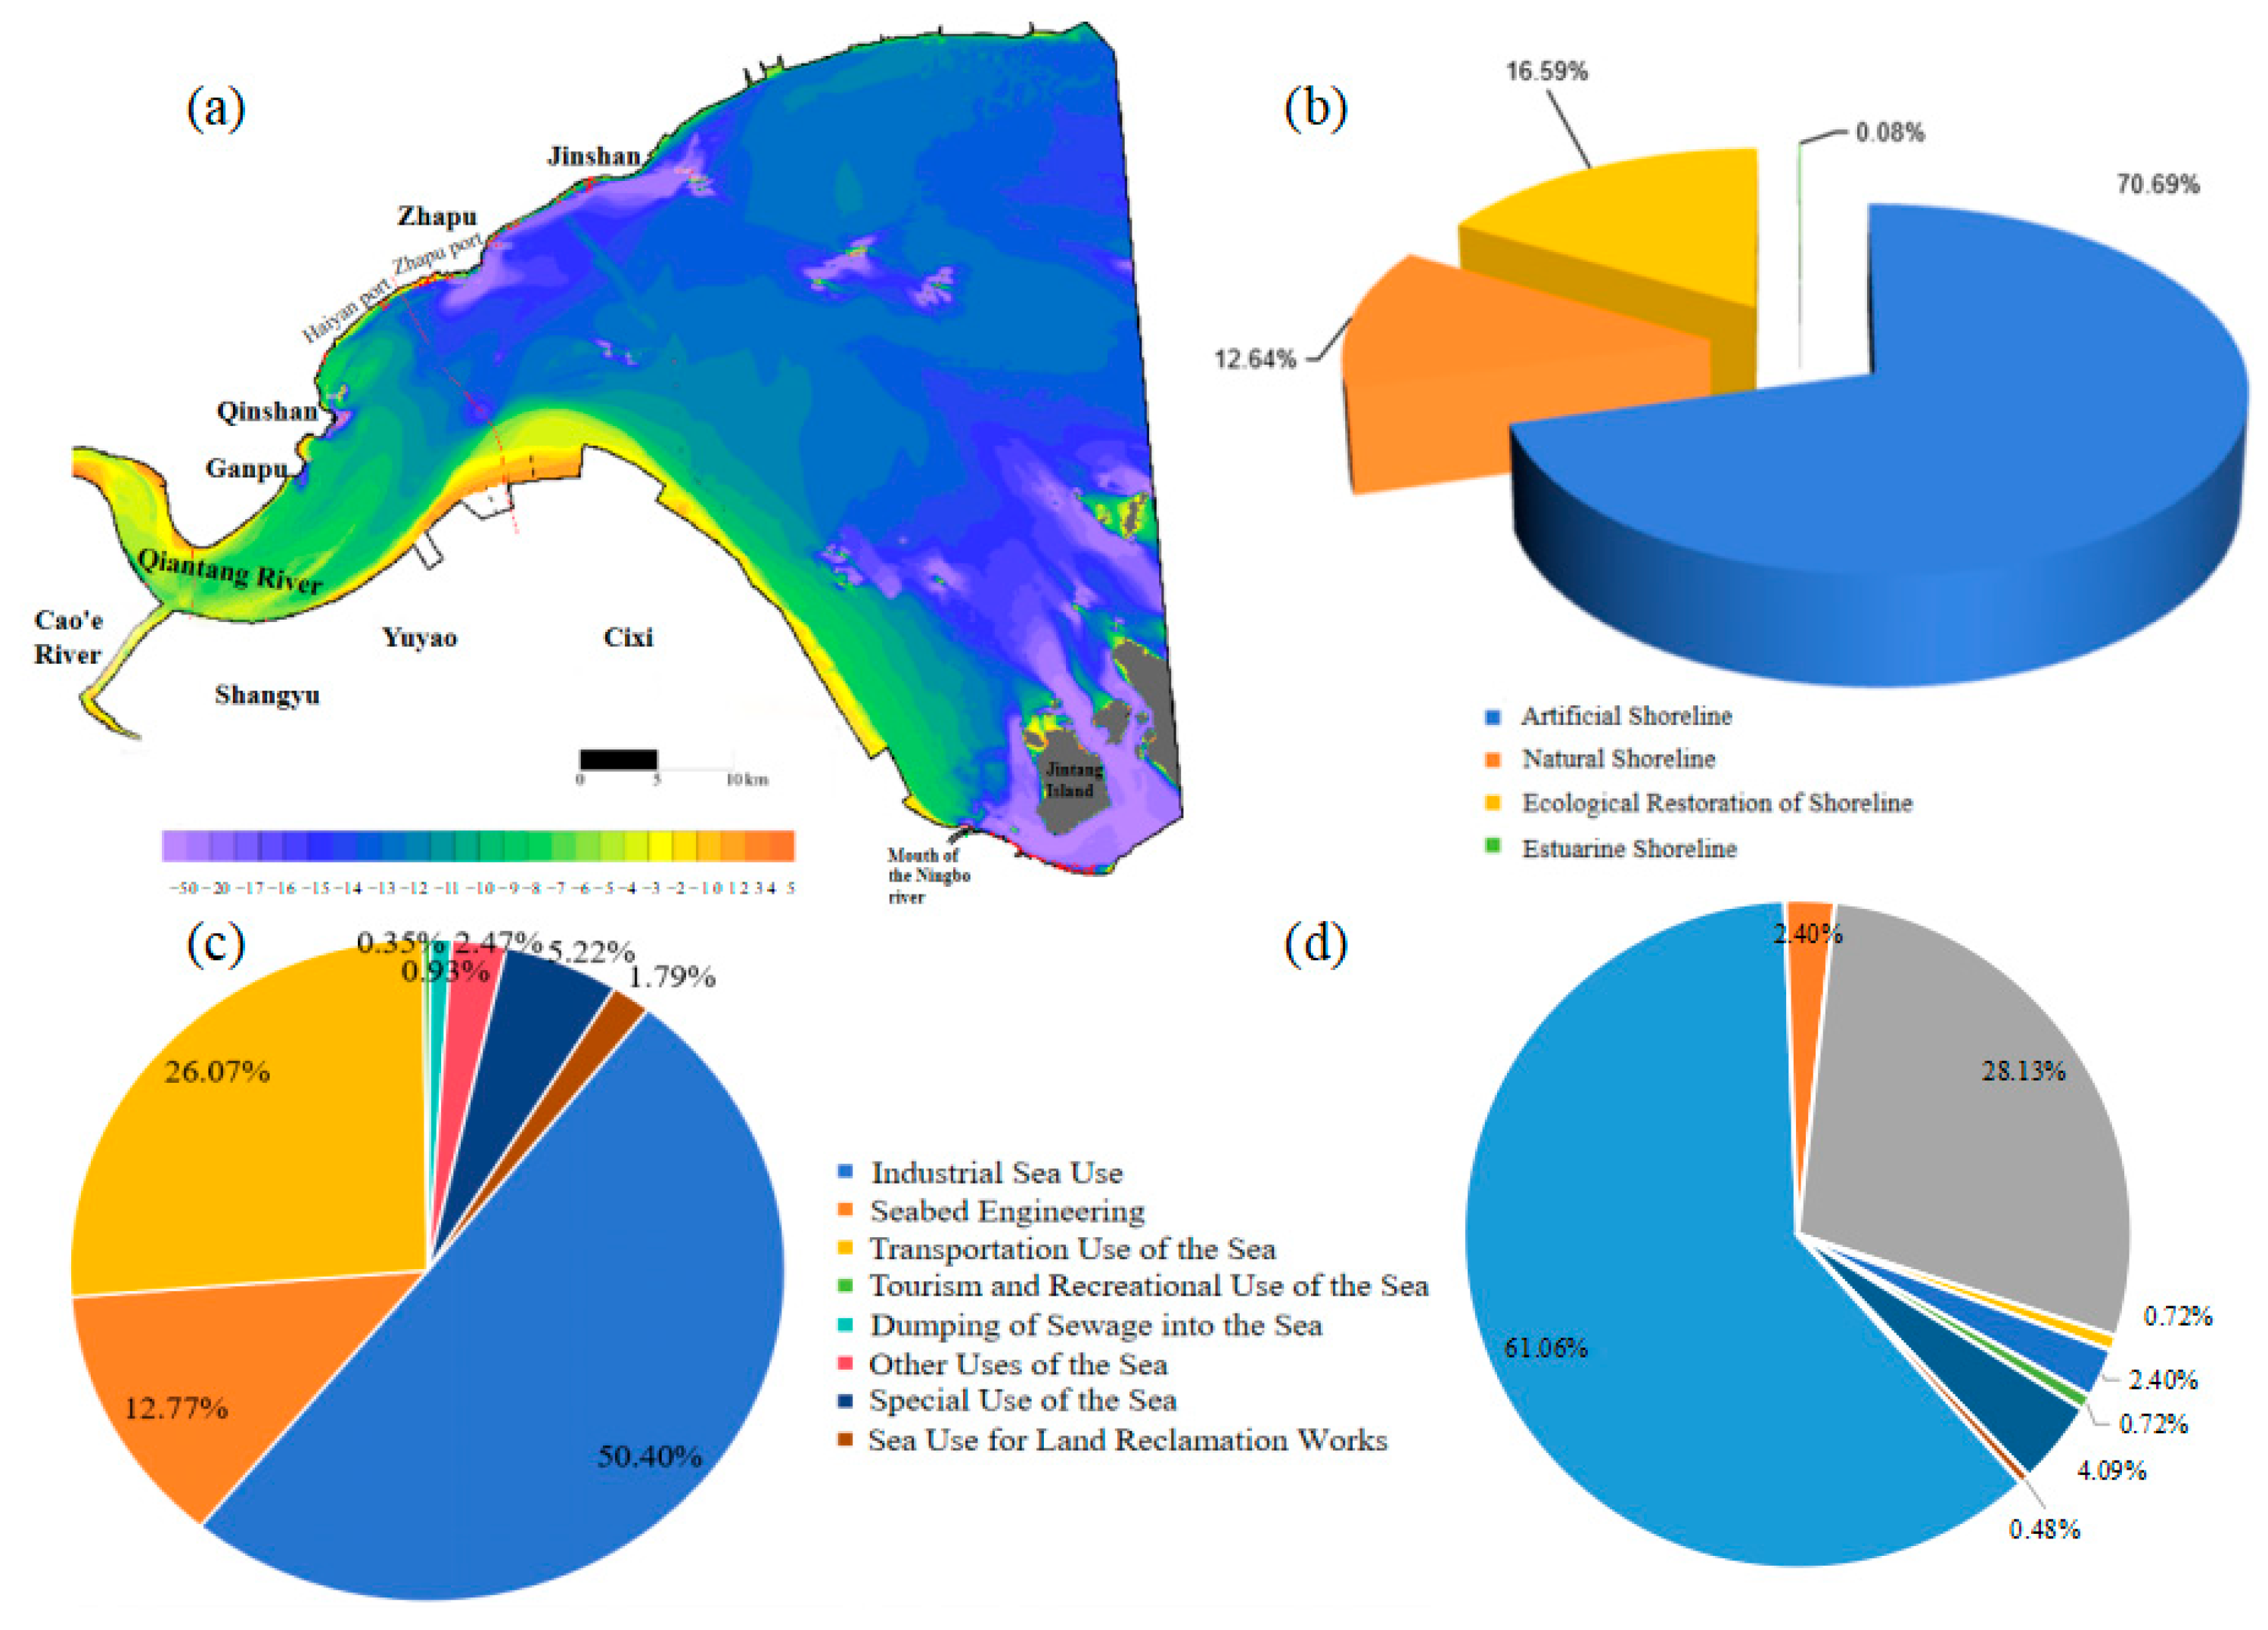
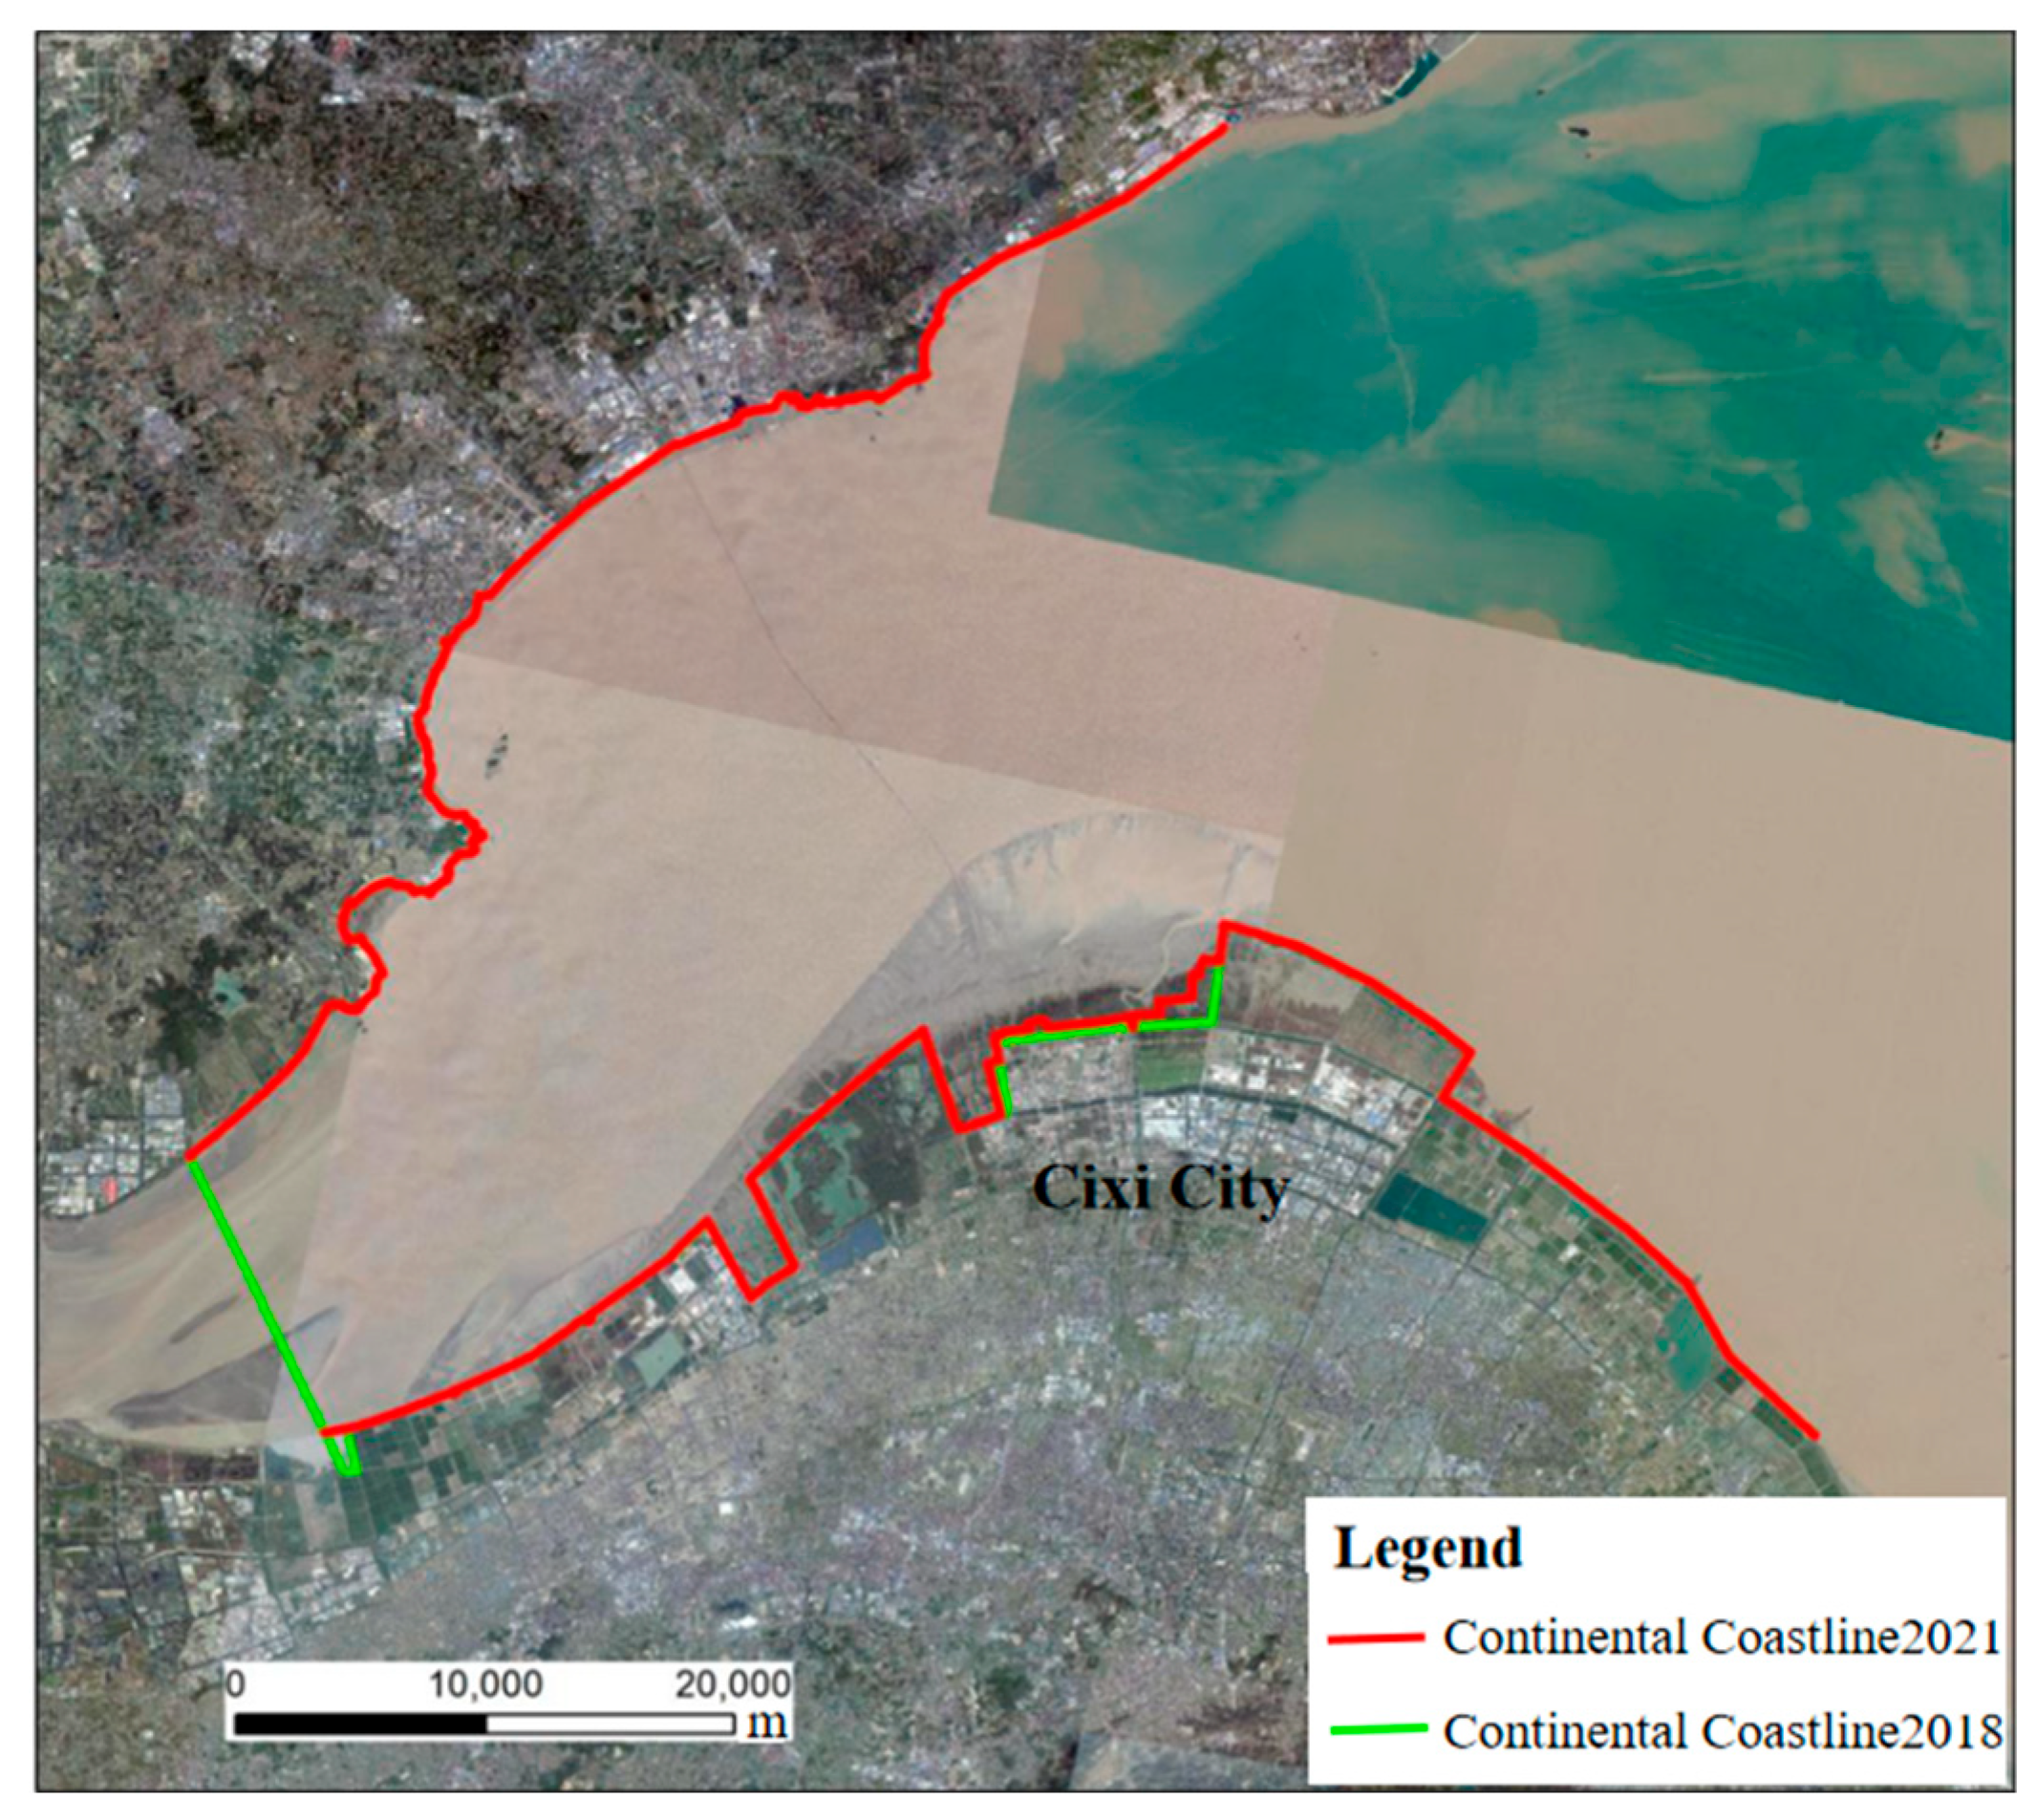
The total length of the continental coastline of Hangzhou Bay is 185.13 km, of which 7.55 km of the native natural coastline accounts for 4.08% of the total length of the coastline, 147.12 km of artificial coastline accounts for 79.46%, 16.32 km of ecological restoration of coastline accounts for 8.82%, and 14.14 km of estuarine coastline accounts for 7.64%. As shown in Table 2, the continental coastline of Hangzhou Bay decreased by 13.17 km, of which the muddy coastline increased by 14.98 km, the bedrock coastline decreased by 0.79 km, the ecological restoration coastline increased by 12.20 km, the estuarine coastline decreased by 14.00 km, and the artificial coastline decreased by 25.56 km, compared to the continental coastline in 2018. The comparison between the continental coastline comparisons is shown in Figure 7.
The coastline of Hangzhou Bay has undergone notable changes, particularly in the estuarine and Cixi Shoal areas. The southern coastline, which was historically shaped by significant sediment deposition, has shifted seaward in many locations due to natural accretion. In 2021, much of the coastline moved toward the sea, primarily as a result of sediment accumulation, especially in the Hangzhou Bay estuarine region. Artificial coastlines were reclassified as ecological restoration coastlines, a trend that reflects the region’s growing focus on ecological protection. Despite these changes, human activities such as land reclamation and infrastructure construction continue to drive significant alterations in the coastline. Port expansions, deep-water terminals, and cross-sea bridges have required the expansion of coastal land, directly affecting the shape and position of the coastline. The construction of these infrastructures exacerbates coastal erosion, resulting in the retreat of natural shorelines and the shrinkage of important coastal habitats, including wetlands and intertidal zones. These habitat losses have significantly impacted biodiversity, with a decrease in the living space for birds, fish, and benthic species. In addition to the ecological challenges, coastal erosion has increased the risk of soil and water loss, particularly during extreme weather events like typhoons. The retreat of natural coastlines has weakened the ability of these areas to buffer tides, purify water, and protect biodiversity, further destabilizing the regional ecosystem. Furthermore, the waste generated from land reclamation projects has contributed to increased water pollution, placing further stress on the coastal environment and marine life.
To address these challenges, ongoing efforts to restore coastal wetlands and vegetation, as well as strengthening the resilience of the coastline to erosion, are critical. Effective policy measures, such as limiting land reclamation and reducing harmful activities like sand mining and fishing, will be essential to mitigate the impacts of coastline retreat.

4.3. Changes in Intertidal Area

Loss of intertidal habitat and degradation of important biological habitats are important factors affecting the sustainable use of nearshore resources and are major contributors to the poor health of nearshore marine ecosystems. The intertidal zone is defined as the area covered by seawater located between the high and low mean high tide, i.e., the area between the coastline and the 0-m line (theoretical depth benchmark). The intertidal zone is divided into three categories, tide pool, beaches, and rocky beach, using the classification scheme of the Technical Procedures for Monitoring and Evaluation of Mudflats (Intertidal Zone) Resources in Zhejiang Province. Rocky beach refers to the rocky platforms in the intertidal zone formed by marine erosion and gently sloping to the sea; beach refers to the sandy and gravelly accumulations in the intertidal zone formed by wave action and gently sloping to the sea; and tide pool refers to the gently and broadly sloping silt powder–sand accumulations in the intertidal zone formed by tidal action. The changes in the intertidal zone are closely linked to hydrological conditions. The rise and fall of tides directly affect water depth, sediments resuspension, and deposition in this area. In Hangzhou Bay, the intertidal zone experiences periodic changes in water depth, with seawater coverage expanding during high tide and large mudflats exposed during low tide. This process directly influences the distribution and diversity of the intertidal ecosystem, thereby affecting land use and landscape changes in the region. Specifically, the Andong Shoal experienced sediment accumulation and shoal expansion due to hydrological conditions. The combined effects of water flow speed, tidal fluctuations, and wind waves have shaped the ecological changes in this area.
According to the survey data from 2018 to 2021, the area change in intertidal zone types within Hangzhou Bay is shown in Table 3. Between 2018 and 2021, the total area of the intertidal zone in Hangzhou Bay decreased by 73.44 km2, of which tidal flats decreased by 69.52 km2, beaches decreased by 4.07 km2, and rocky beaches increased by 0.15 km2. Except for the small increase in rocky beaches, tide pool and beaches decreased to varying degrees, especially tide pool, which had a larger decrease.
As shown in Figure 8, the 2021 coastline was established based on the latest survey approved by the Ministry of Natural Resources. Compared to the 2018 coastline, the changes are relatively minor and are limited to specific areas, particularly the Andong Shoal, where land reclamation has caused the coastline to advance seaward by a distance ranging from 300 to 1000 m. The primary reason for the reduction in the intertidal zone area was the change in the 0-m depth line. The area of change was mainly in the estuarine area at the top of the bay, with a reduced extent of shallow flats or sandbars in the bay. Additionally, there was little variation in the intertidal zone on the northern coast, while the southern coast exhibited change in different areas, primarily characterized by a decrease in range.

4.4. Evolution of the Beach Tank System Landscape

The evolution of the tidal flat system is closely related to its interaction with hydrological conditions. The development of the tidal flats in Hangzhou Bay is primarily influenced by tides, with tidal flow playing a key role in transporting and depositing sediments. Tides cyclically alter the water depth and flow speed of the tidal flats, causing the landscape to exhibit different characteristics at various times and seasons. During high tide, the tidal flat areas may become submerged, and the increased water flow facilitates sediment transport. Conversely, during low tide, the tidal flats are exposed, allowing sediments to accumulate. Changes in hydrological conditions drive the dynamic evolution of the tidal flat landscape, affecting the area, shape, and the distribution of ecosystems within these flats [
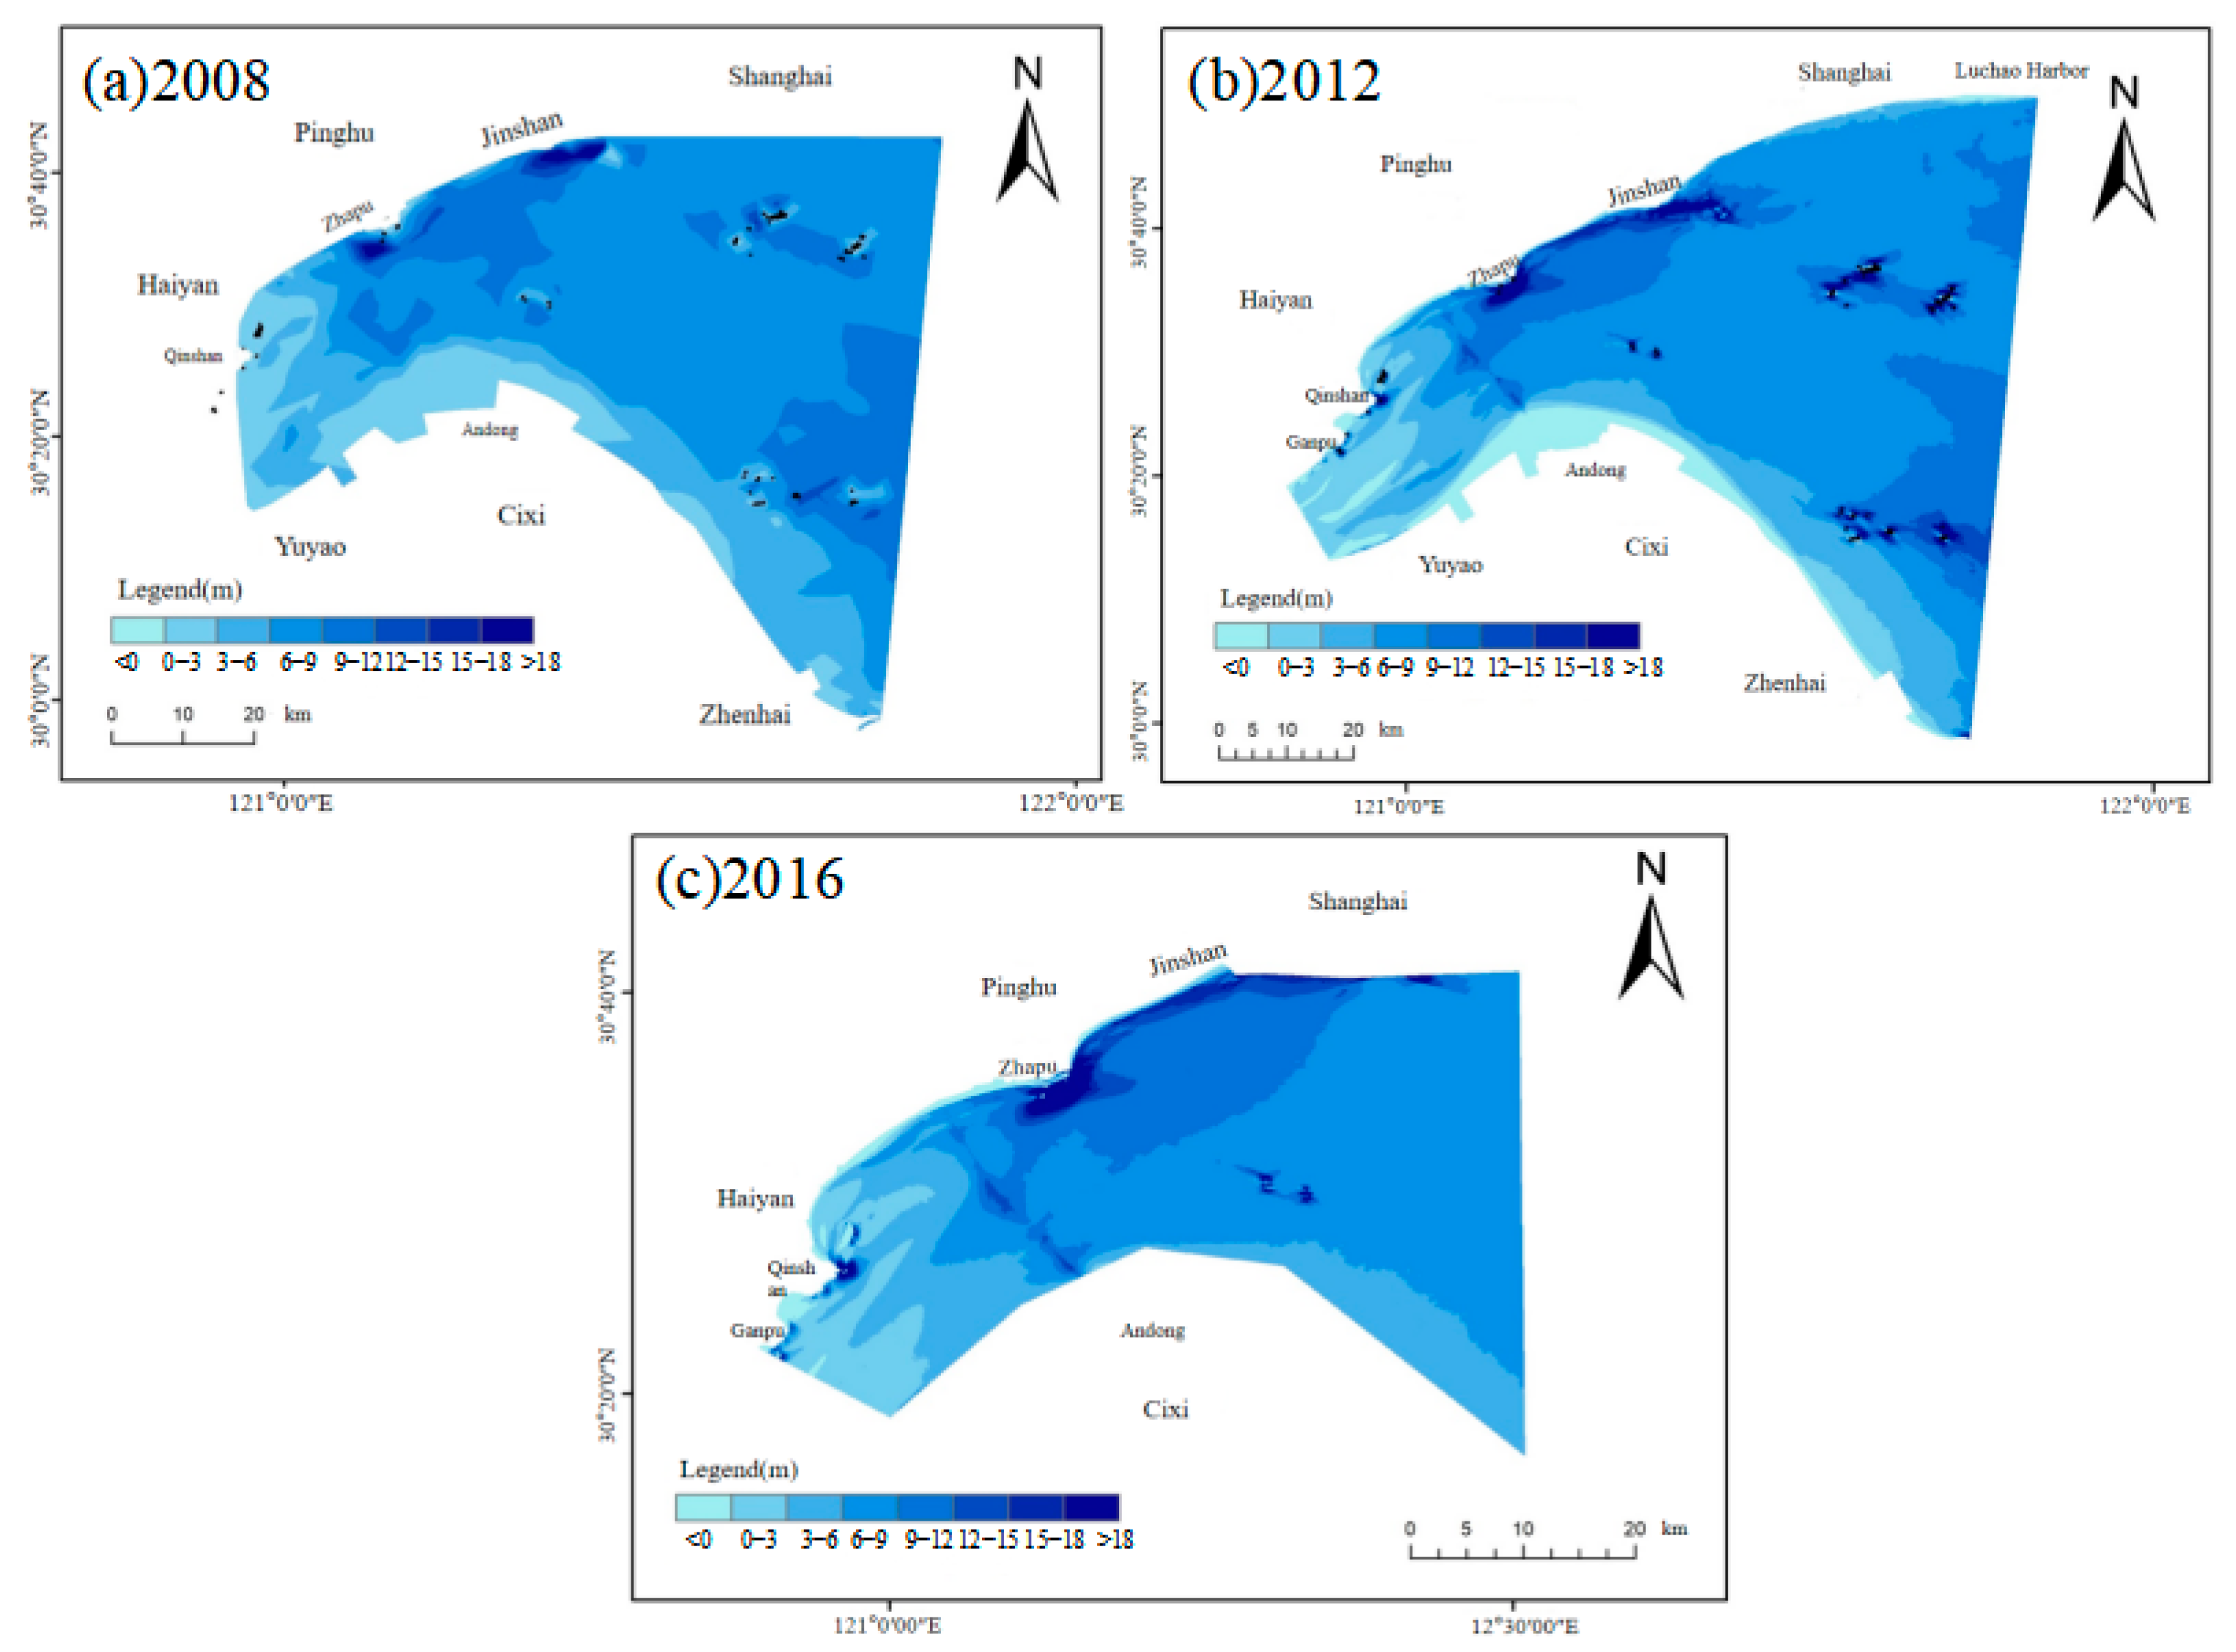
28]. The water depths in Hangzhou Bay for the years 2008, 2012, and 2016 are depicted in Figure 9. Overall, the general pattern of shoals and troughs remained relatively stable from 2008 to 2016. Notable changes include further erosion along the northern coast near Jinshan and Ganpu, while the southern coast experienced sediment accumulation at the front edge and flanks of the Andong Shoal. Within the bay, certain areas of the islands exhibited significant variations in sediment deposition and erosion.
(1)
Evolution of the deep trough on the north coast
As shown in 
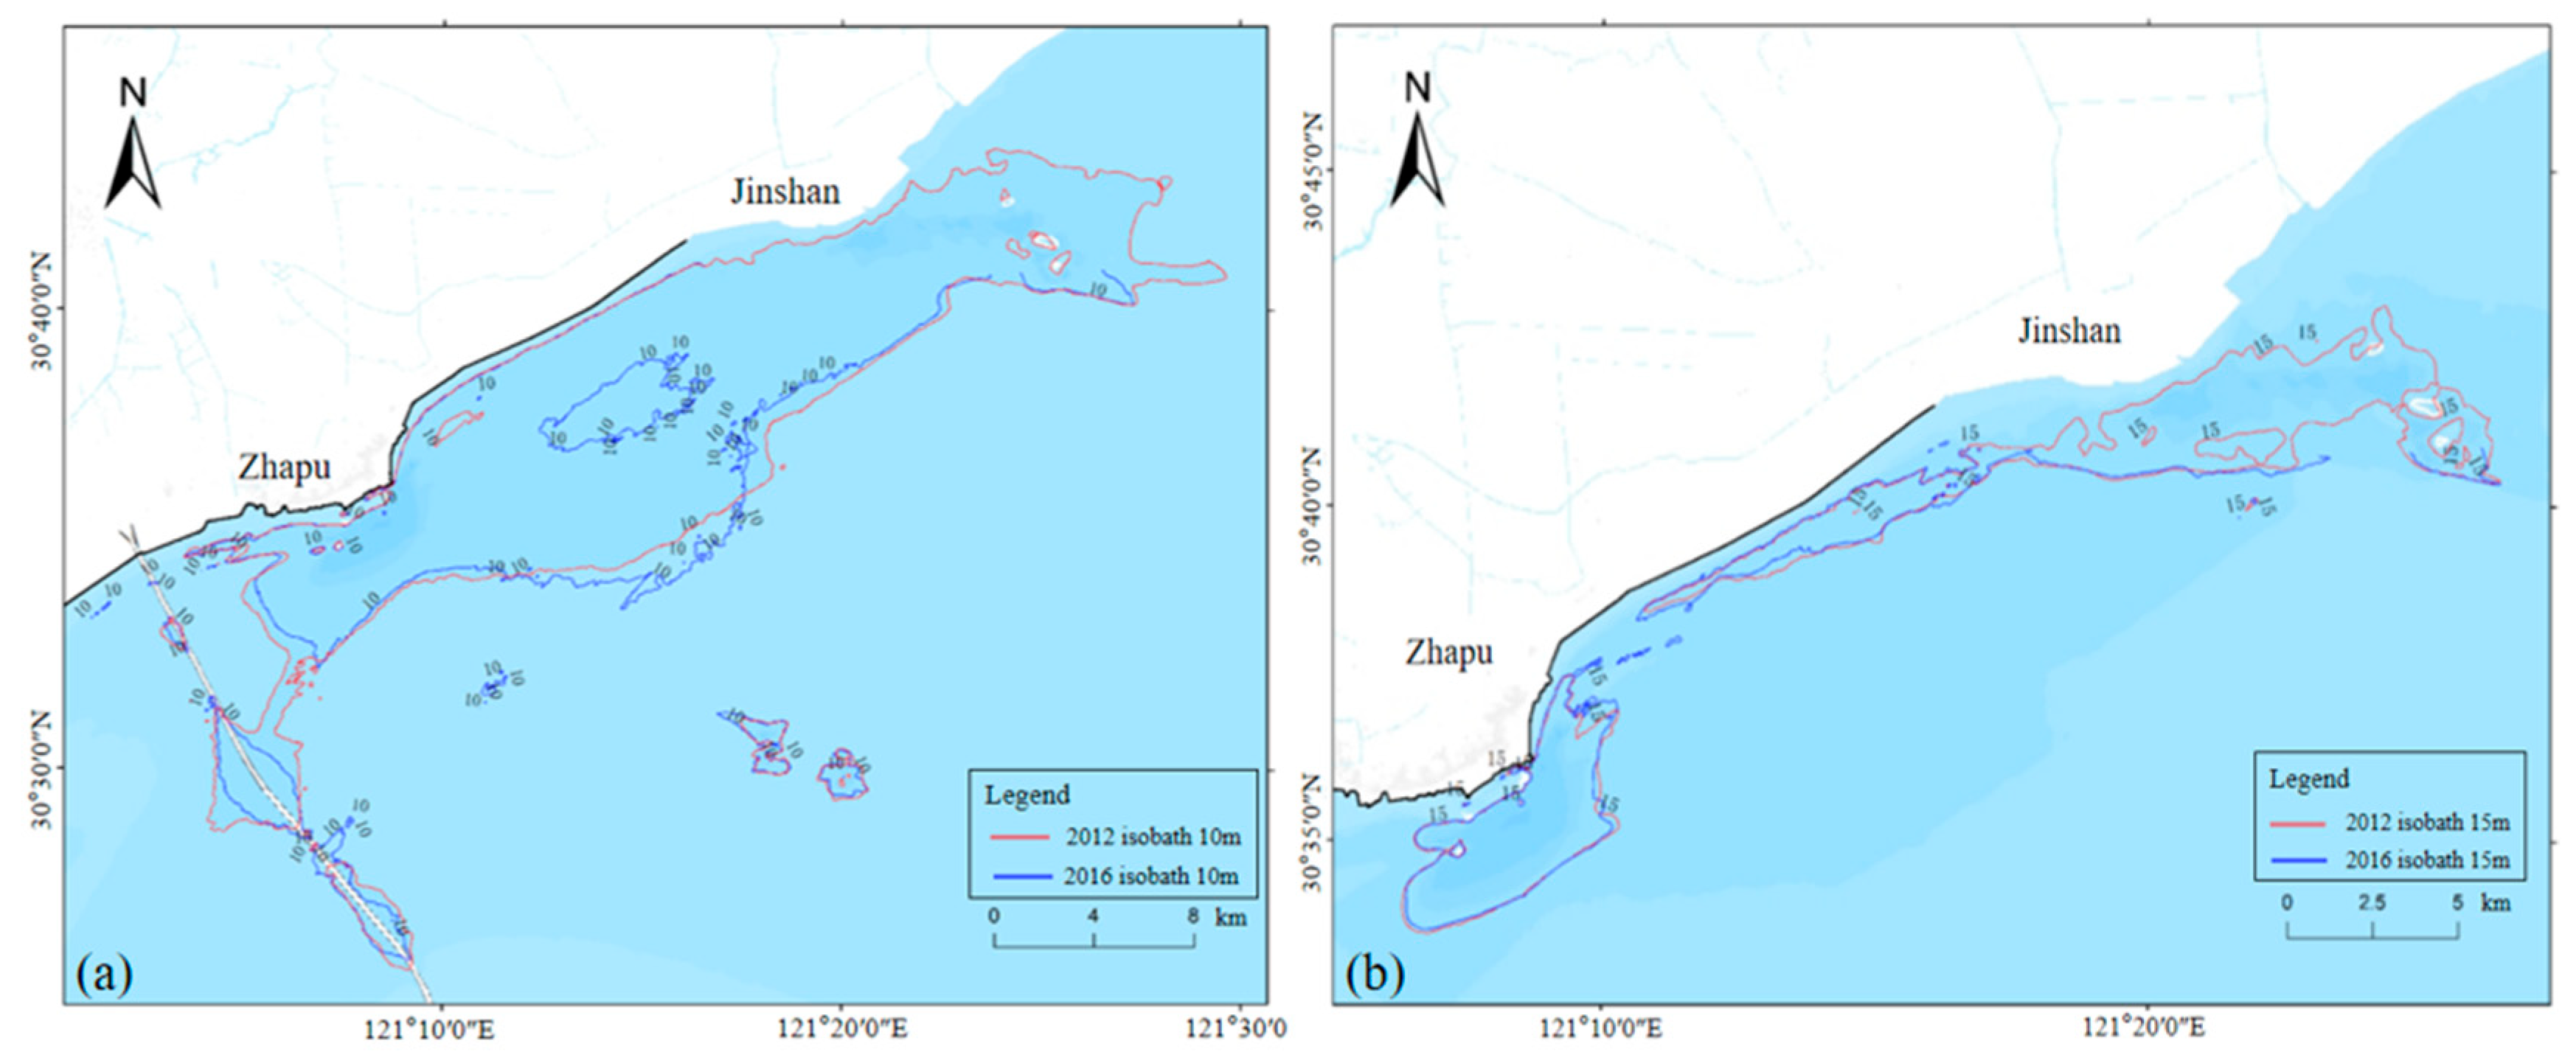
Figure 10, scouring is more pronounced in the area between Jinshan and Zhapu between 2012 and 2016, resulting in the widening of the deep trough in the north–south direction. When comparing the 10 m and 15 m depth lines in the Jinshan–Zhapu sea area, we observed that while the 10 m depth line in the central region of Jinshan–Zhapu expanded approximately 2 km southward, the range of the 15 m depth line remained relatively unchanged, indicating stability in the deep trough area. Additionally, the 10 m depth line near the Hangzhou Bay cross-sea bridge experienced a slight reduction, suggesting gradual recovery from erosion around the bridge.
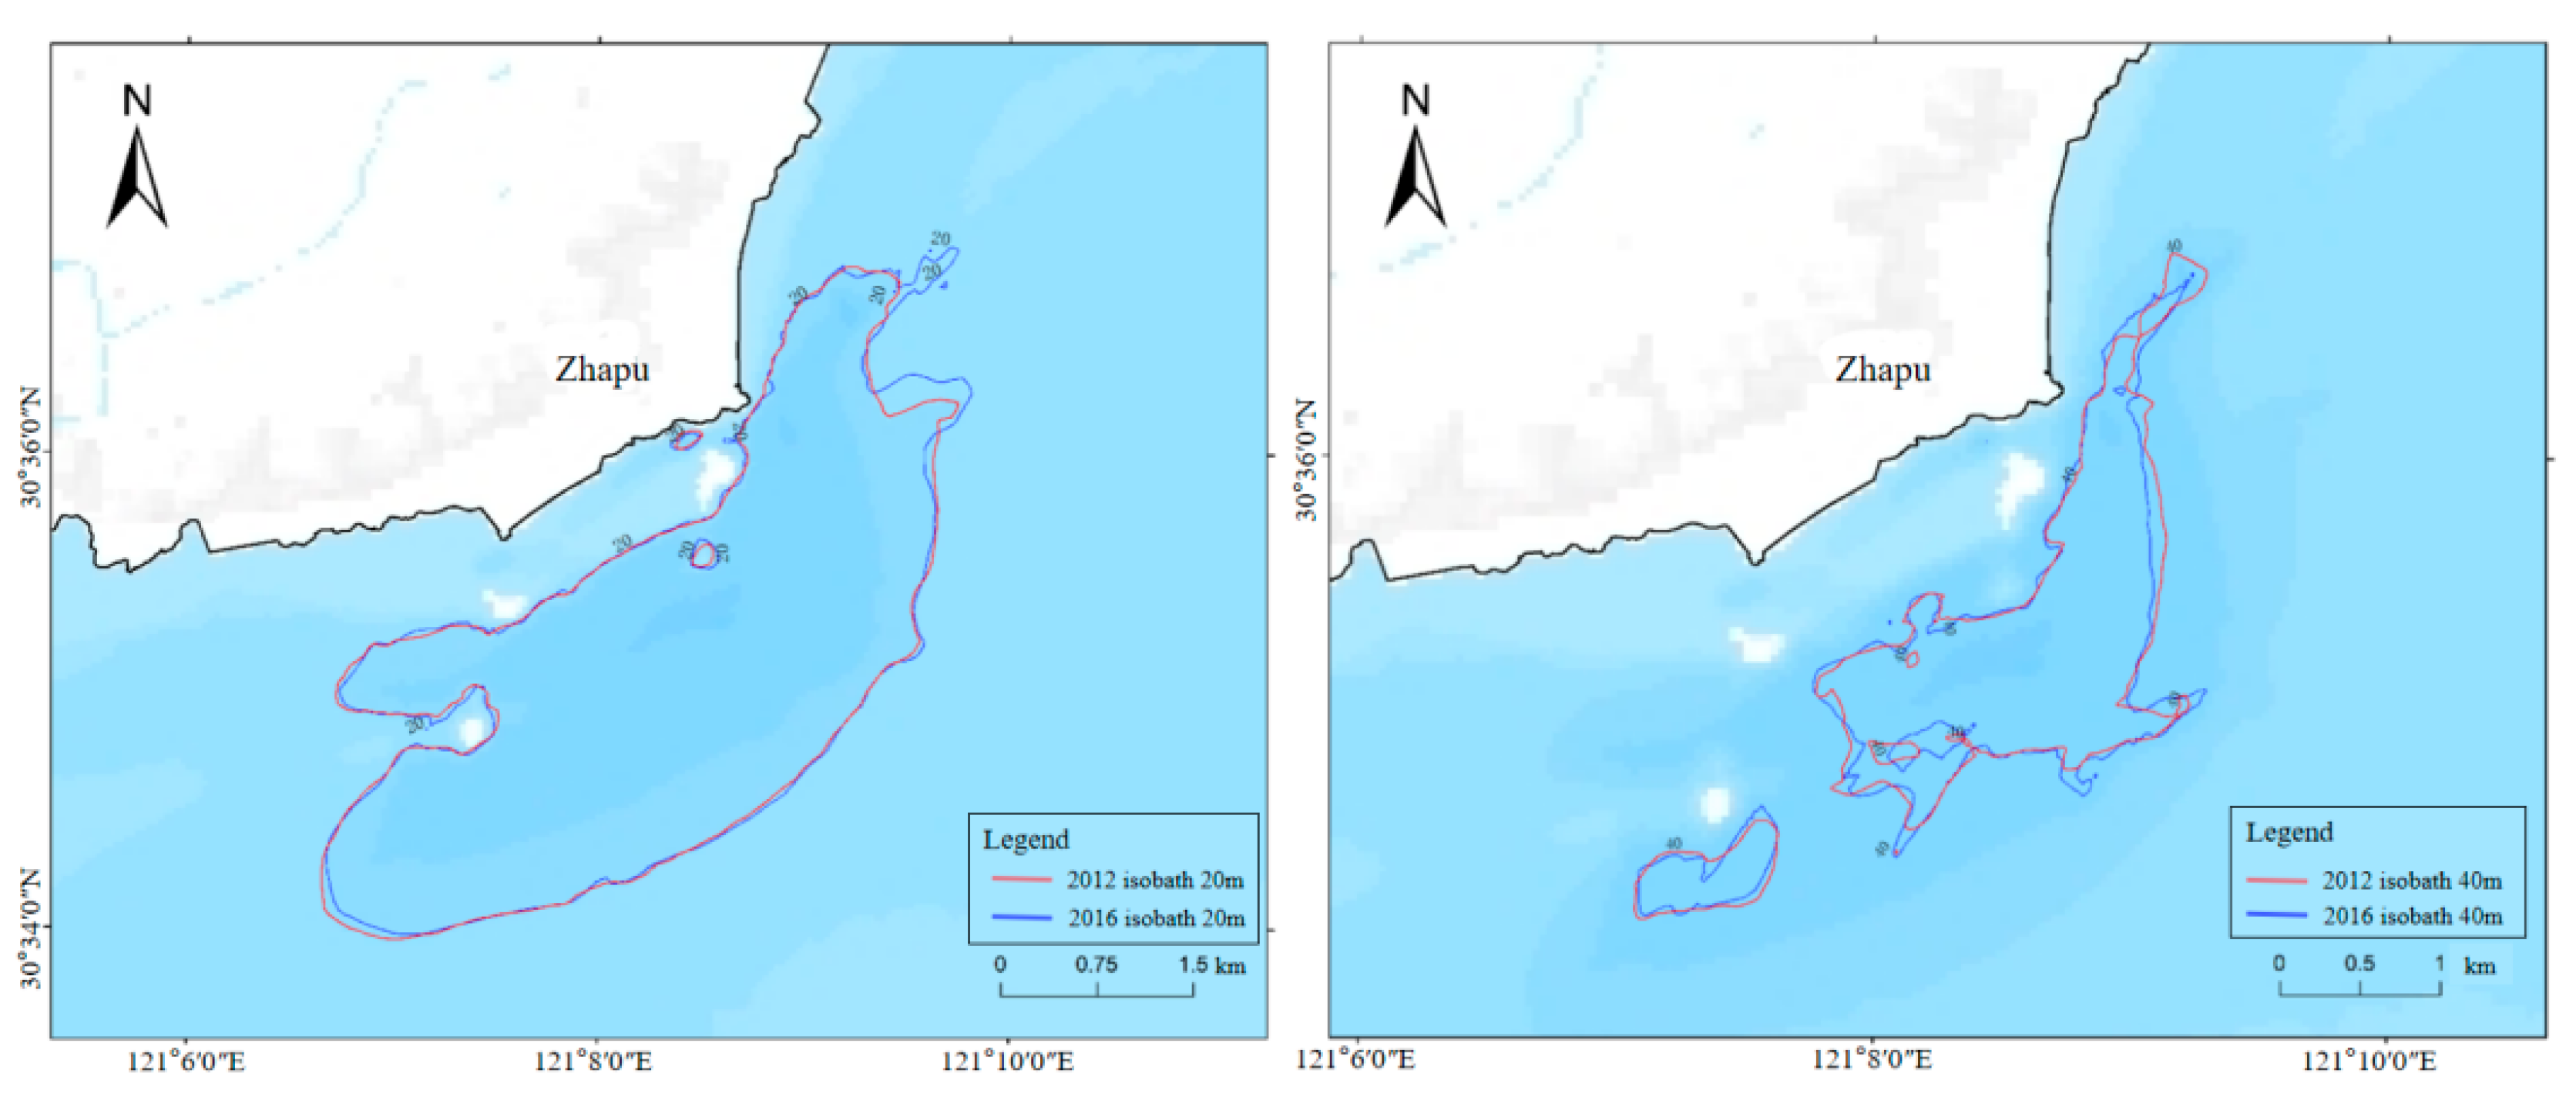
To further quantify the topographic changes in the deep trough, we compared the 20 m and 40 m depth lines in the Zhapu sea area between 2012 and 2016, which is shown in Figure 11. During this period, the coverage area of the 20 m depth line near Zhapu extended northeastward. Upon comparison, the 20 m depth zone in this region expanded from 11.544 km2 in 2012 to 11.653 km2 in 2016. However, the coverage area of the 40 m depth line experienced a slight reduction, decreasing from 3.020 km2 in 2012 to 2.945 km2 in 2016. This indicates that the Zhapu deep trough is expanding in terms of coverage, but its depth is gradually shallowing.
(2)
Evolution of the South Bank Andong Shoal
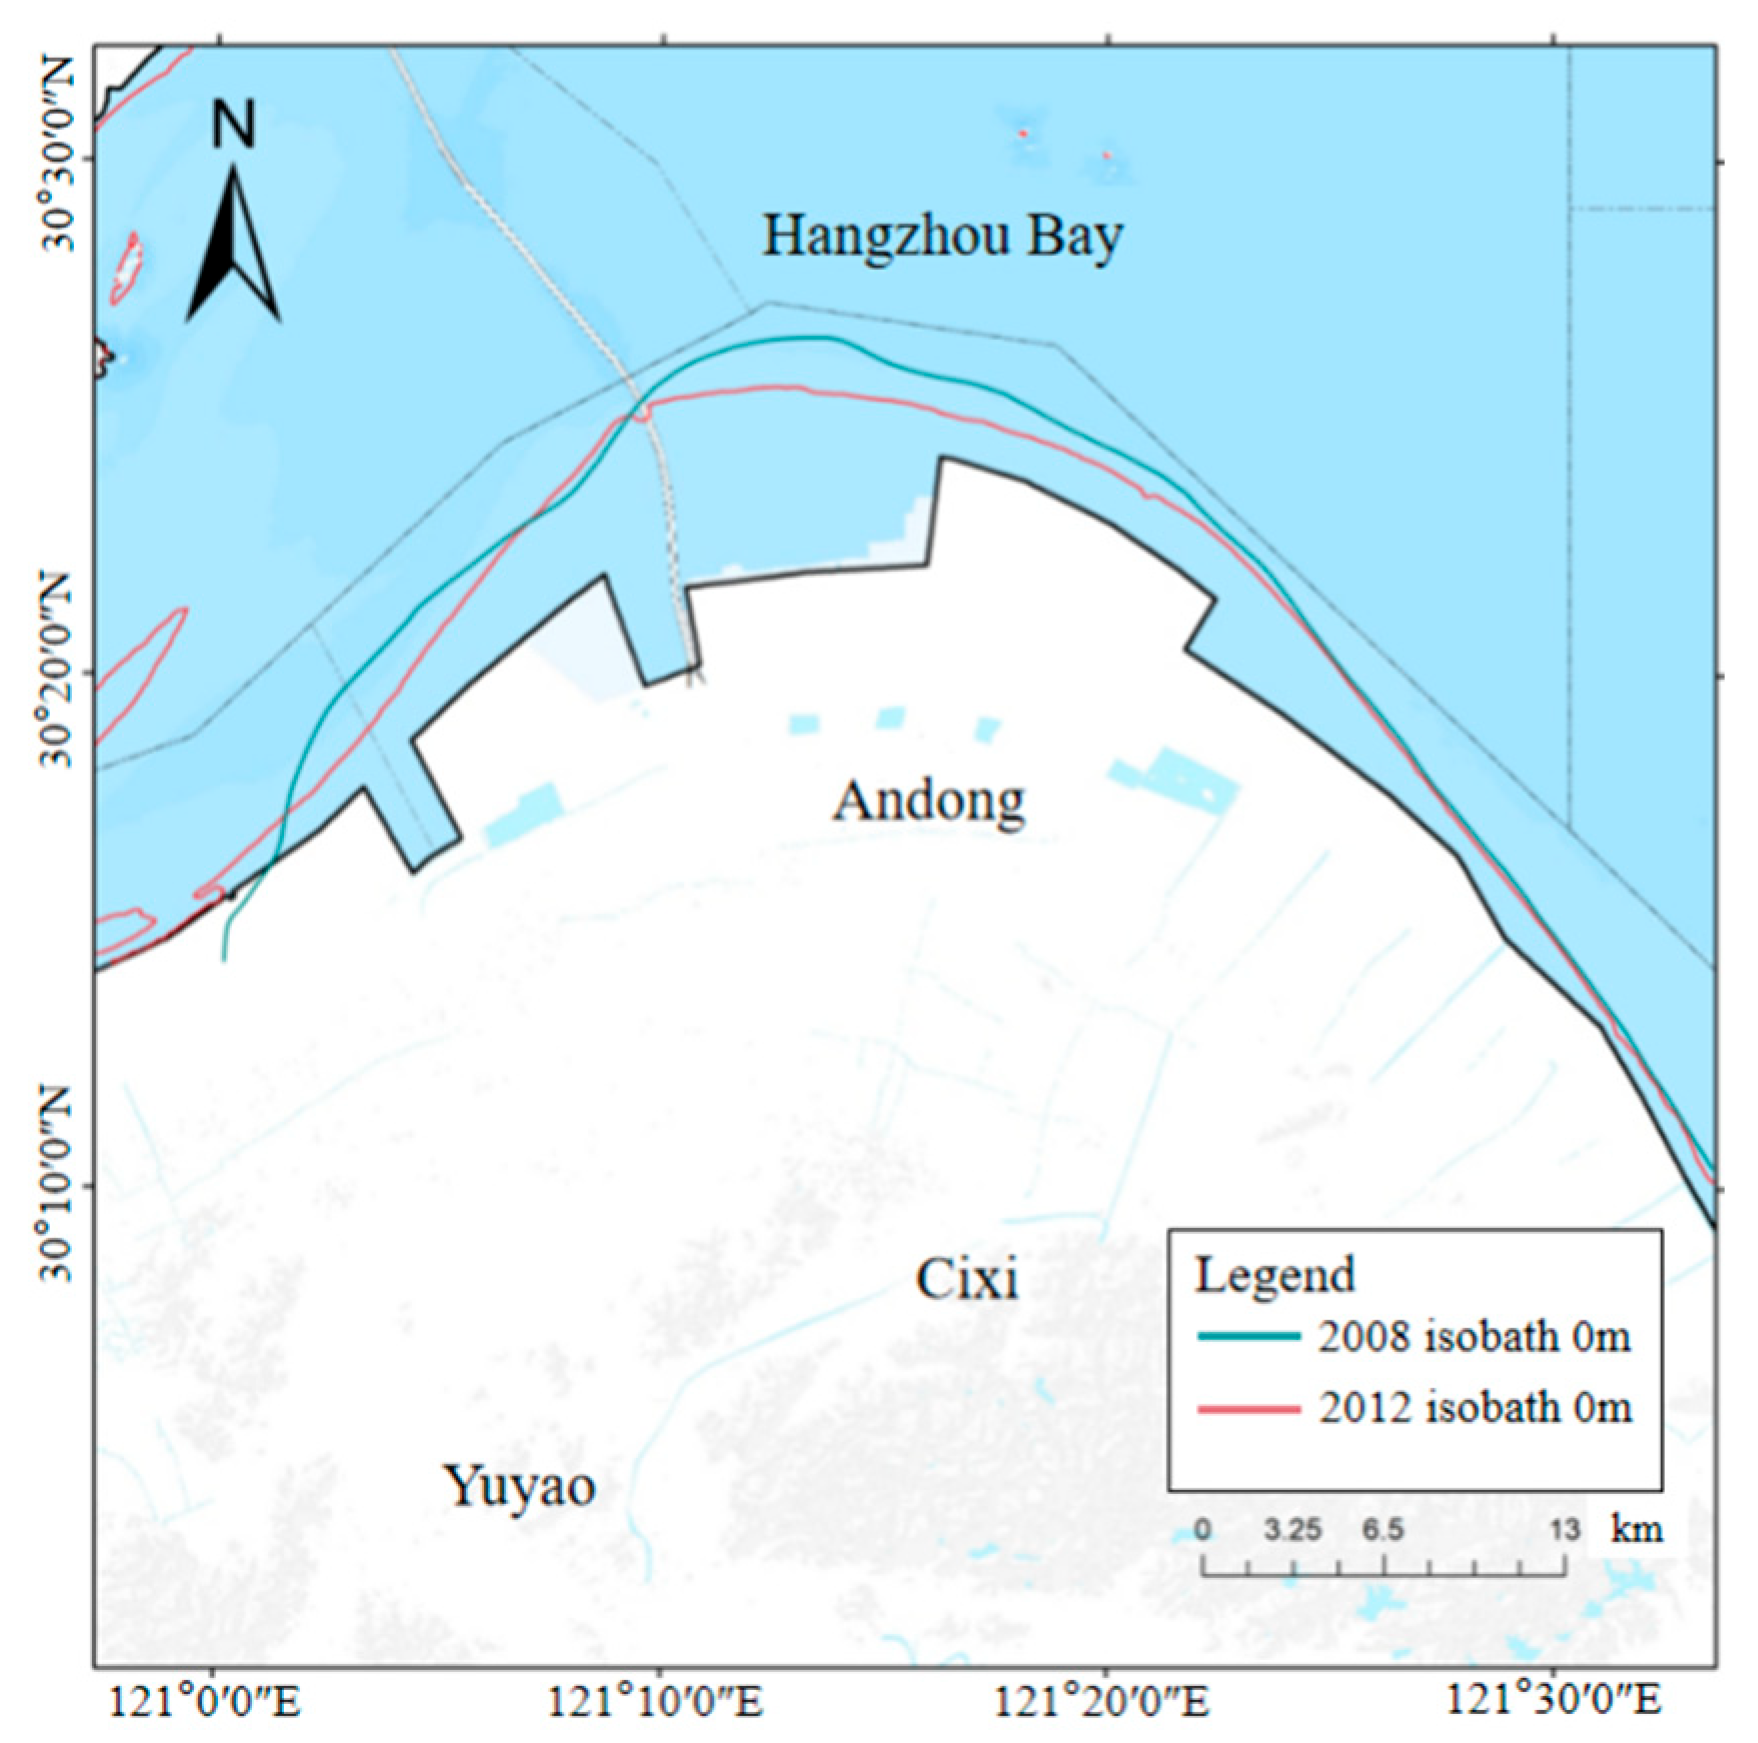
The Andong Shoal is a protruding bank on the southern coast of Hangzhou Bay. Its subtidal zone consists of a shallow slope with water depths of up to 5 m, while the intertidal zone covers an area of approximately 30 km2. The expansion of Andong Shoal’s area continued from the 1930s to the 1980s. With the development of the South Bank River Treatment and Reclamation Project, the outer slope of Andong Shoal has narrowed the width of the entire water passage. In Figure 12 (where the depicted shoreline corresponds to the year 2012), the 0 m isobaths in the western and central parts have retreated approximately 3 km landward. The shoal surface above the theoretical lowest tide level has accumulated sediment, while the subtidal seabed below experiences erosion, resulting in steeper seabed slopes. Notably, the eastern wing has not undergone significant changes.

4.5. Changes in Overall Seabed Siltation

Due to the missing depth data for the southern coast and bay entrance of Hangzhou Bay in 2016, the changes in sedimentation and erosion within the bay were compared by using topographic data from 2012 to 2016. For the area with missing data from 2016, a comparison was made using data from 2008 to 2012. The distribution of sedimentation and erosion during these two periods is shown in Figure 13. From Figure 13a, we observed that between 2012 and 2016, erosion dominates the changes in the depicted area. Notably, there was significant localized erosion in the central parts of the bay and at the bay’s top, with maximum erosion depths exceeding 3 m. On the southwestern side of Zhapu and along the southern coast of the bay’s top, sedimentation depths reached more than 4 m. The northern coast near Zhapu, the Qinshan sea area, and the islands within the bay experienced both sedimentation and erosion. Figure 13b reveals that during the period from 2008 to 2012, the primary sedimentation areas along the southern coast of Hangzhou Bay included the Andong Shoal and its eastern counterpart, Zhenhai Shoal. The maximum sedimentation depth in the Andong Shoal area exceeded 4 m, while north of Andong Shoal there lies an erosion zone with maximum depths exceeding 3 m. Jinshan to the Luchao Harbor section of the sea had scouring and siltation, in which some of the small islands in the bay, such as Tanhushan Island and Dabaishan Island, etc., around the occurrence of more obvious scouring, had scouring amplitudes of more than 3 m. The scouring of the island was very obvious.
Hydrological conditions play a crucial role in changes in seabed sedimentation, particularly tidal flow and water flow intensity. In Hangzhou Bay, tidal flows and variations in flow velocity directly impact the transport and deposition of seabed sediments. Our study indicates that the seabed in Hangzhou Bay has experienced varying degrees of sedimentation, with areas experiencing stronger tidal influence accumulating sediments at a faster rate. The effects of these hydrological conditions have accelerated sedimentation in certain seabeds, particularly in shallow waters and intertidal zones, where slower water flow leads to greater sediment accumulation [28]. To visually represent the sedimentation and erosion changes in Hangzhou Bay in recent years, the sedimentation and erosion volumes and rates for each region during the two specified periods were calculated. Between 2012 and 2016, as shown in Figure 11 (right), the overall trend in the main bay area was erosion. The total erosion volume amounted to 192,473.74 × 106 m3, with an annual erosion rate of 48,118.44 × 106 m3. The average erosion depth within the region was approximately 21.80 cm, corresponding to an annual average erosion depth of 5.45 cm. During the period from 2008 to 2012, as depicted in Figure 11 (right) for the southern coast and bay entrance area, the overall trend was sedimentation. The total sedimentation volume reached 10,459.89 × 106 m3, with an annual sedimentation rate of 2614.97 × 106 m3. The average sedimentation depth within the region was approximately 3.09 cm, corresponding to an annual average sedimentation depth of 0.77 cm (Table 4).
The flow of the Qiantang River carries a large number of suspended solids and sediments into the bay, particularly near the river mouth, where these sediments can affect the bathymetric features of the bay. Under the interaction of monsoon and tidal forces, the river sediments accelerate deposition in certain areas such as the river mouth region, while other areas (such as those farther from the river mouth) may experience erosion. The flow of the Qiantang River fluctuates significantly between seasons, particularly during the flood and dry seasons, which affects the sedimentation and erosion processes at the bay’s bottom. Since the data collected for this study did not capture the seasonal fluctuations of the Qiantang River basin, a detailed analysis of this aspect is not provided here.

4.6. Characterization of the Spatial and Temporal Evolution

The hydrological conditions of Hangzhou Bay have a profound impact on the temporal and spatial evolution of the entire sea area. Changes in factors such as tides, flow velocity, and river runoff lead to notable variations in sedimentation and erosion processes within the sea area. Throughout different seasons and tidal cycles, water depth, sediment distribution, and the ecological environment in the bay undergo changes that affect spatial patterns and landscape features. For example, during low tide, some shallow areas may be exposed, while during high tide, the seawater coverage expands, and certain areas may experience sediment resuspension [
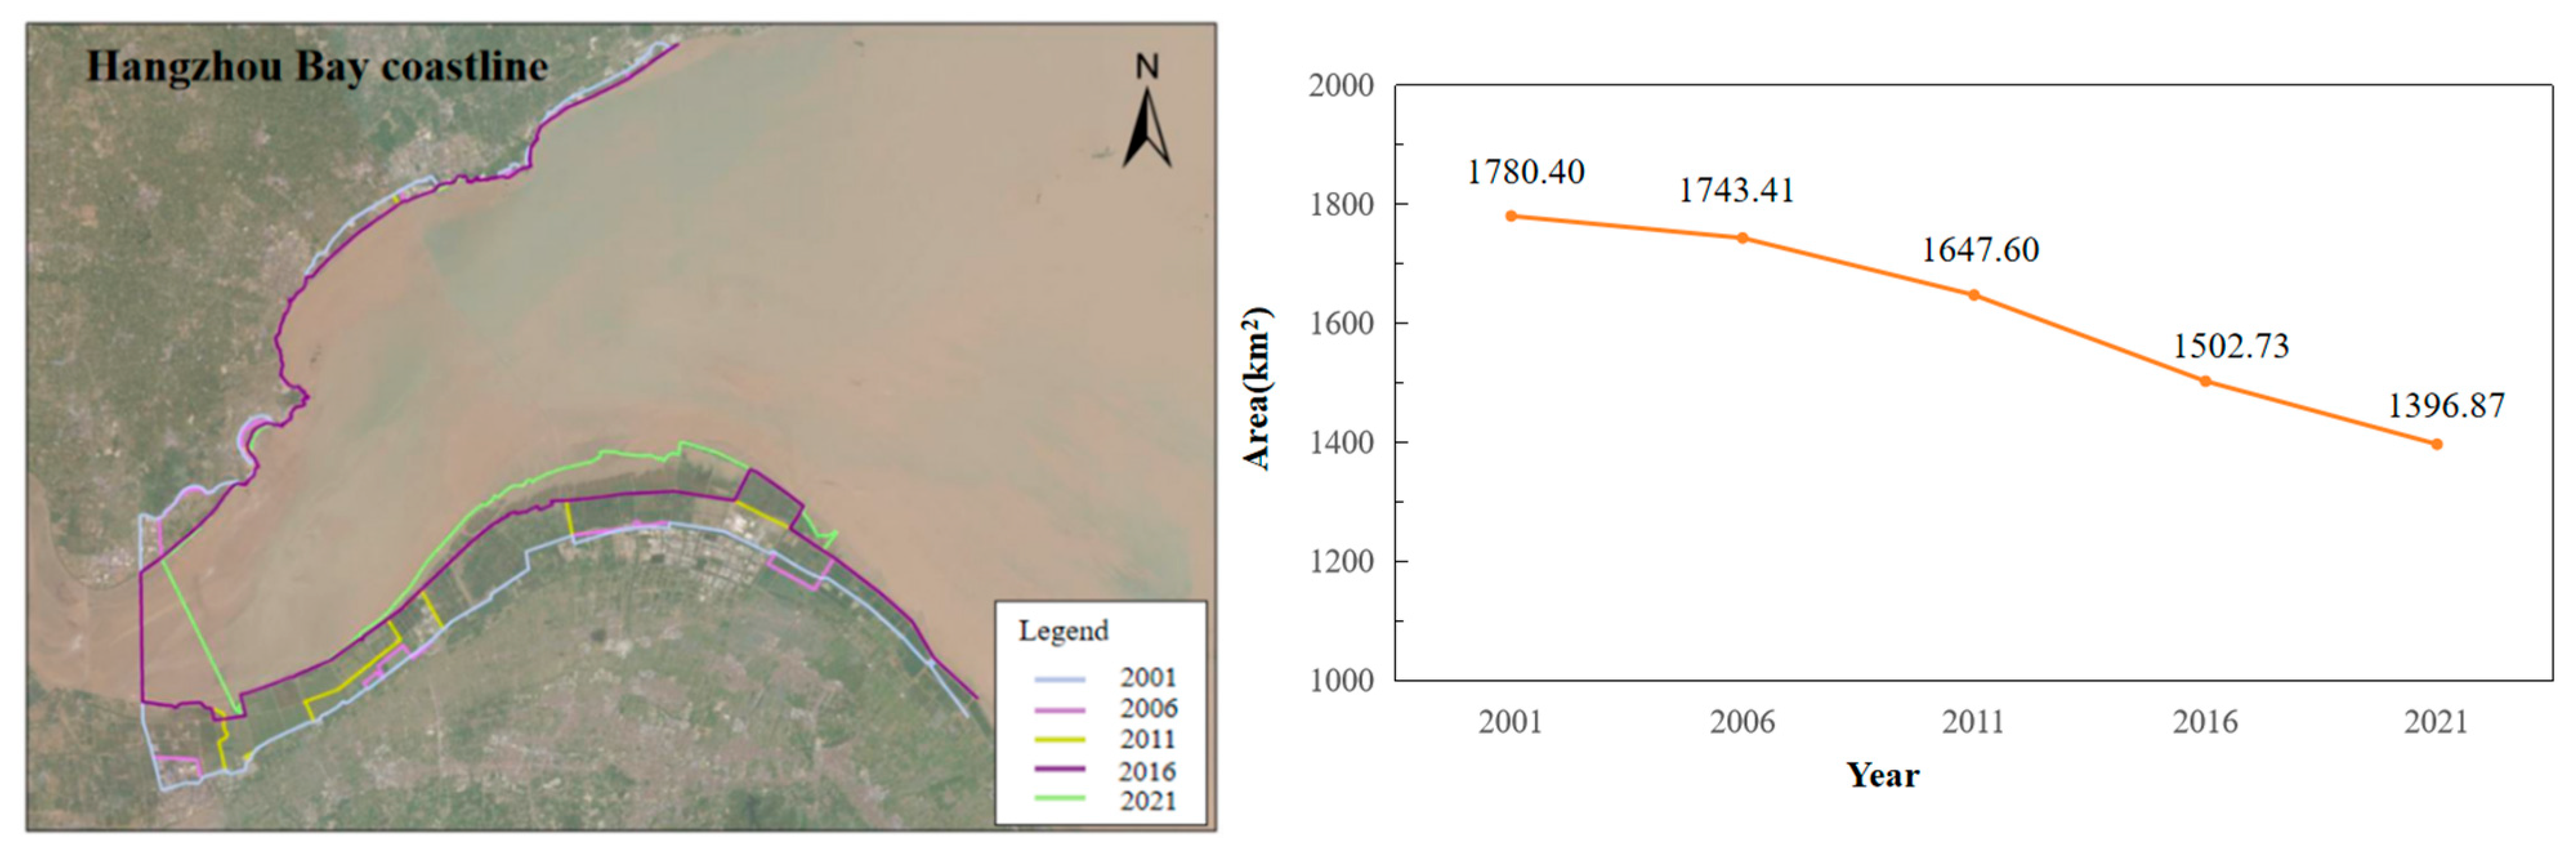
28]. These dynamic changes shape the complex temporal and spatial evolution characteristics of Hangzhou Bay. Based on the outer boundaries of the bay area, the characteristics of bay area changes were analyzed across five stages. Over the past 20 years, there has been a noticeable spatial transformation in the bay area. From 2001 to 2021, the bay area gradually shrunk (as shown in Figure 14). This reduction in area is related to the intensified development and utilization of coastlines and sea areas, as well as the expansion of reclaimed land. The formation of Hangzhou Bay has been a lengthy developmental process. Evolution involves complex interactions between the morphology and dynamics of the boundaries (including coastlines and seabeds) and sediment transport. The overall trend of this process is reflected in both longitudinal (east–west) and transverse (north–south) variations. For centuries, after artificial reinforcement of the northern coast, the bay experienced accumulation exceeding erosion. Accumulation is primarily concentrated along the southern coast of Hangzhou Bay, while erosion occurs on the northern coast. Due to human-made coastal reinforcement, the northern coast of Hangzhou Bay reached approximately its present position in the 12th century. The southern coast has consistently exhibited an overall trend of accumulation up to the present day.

5. Discussion

5.1. Analysis of the Current Situation and Problems of the Resource Environment in Hangzhou Bay

Hangzhou Bay is spacious and boasts abundant spatial resources. In the Hangzhou Bay maritime area (excluding protected zones), the area utilized accounts for 1.1%. The unused length of the continental coastline constitutes 12.63%, while the unused length of island coastlines reaches 95.21%. Overall, the utilization intensity of Hangzhou Bay’s spatial resources remains moderate, with ample reserve space although the utilization intensity of the continental coastline leans toward the higher end. Within Hangzhou Bay’s continental coastline, the proportion of natural coastlines accounts for a mere 12.63%, while artificial coastlines make up a staggering 70.64%. Specifically, in Jiaxing City, the natural coastline (primarily consisting of rocky coastlines) accounts for only 8.8% of the city’s total coastline length. The situation is slightly better in Ningbo City, where the natural coastline represents 15.72% of the city’s coastline length. However, the overall preservation rate of natural coastlines in Hangzhou Bay is quite low, and the situation is exacerbated by the significant artificialization of coastlines due to land reclamation [31], which has caused the coastline to shift seaward [32]. Hangzhou Bay features flat terrain on both sides, making it ideal for land reclamation due to the low flow rate of rivers entering the sea and its natural ability to carry large amounts of sediment. Furthermore, the reclaimed land is fertile and can be converted into high-quality agricultural land, significantly alleviating the pressure between population growth and available land. As a result, the area has seen extensive development. The rapid economic development in coastal areas poses an increasing threat to environmental safety and regional sustainability. Existing management plans, such as marine functional zoning, struggle to achieve the desired balance between protection and development [33]. Along the coast of Hangzhou Bay, functional zones primarily include port and navigation areas, industrial and urban coastal areas, and reserved zones. Surprisingly, there is only one designated tourism and leisure area within the bay: the Jiulongshan Tourism and Leisure Area in Pinghu City, Jiaxing. Unfortunately, this area covers a mere 0.6% of the bay’s total area. Notably, Ningbo City lacks any designated tourism and leisure zones. Overall, the tourism and leisure functions in Hangzhou Bay, especially in the maritime areas near Ningbo, are somewhat lacking, leaving room for improvement in terms of seaside recreational spaces.
Hangzhou Bay has emerged as a key area for marine economic development, with its coastline undergoing significant changes in recent years. The coastline changes, particularly in the estuarine region and the Cixi Shoal area along the southern coast, have garnered increasing attention. These changes primarily involve the conversion of artificial coastlines into ecological restoration areas, driven by natural processes like sediment accumulation and anthropogenic activities such as land reclamation and infrastructure construction. The rapid economic growth in surrounding areas, along with Hangzhou Bay’s strategic location and transportation advantages, has positioned it as an important transportation hub [14]. Projects like port expansions, deep-water terminals, and cross-sea bridges have further accelerated the transformation of the coastline. Additionally, population growth has increased the demand for land, exacerbating the issue. The interaction of natural processes, human interventions, and ecological considerations has shaped the dynamic changes along Hangzhou Bay’s coastline. These transformations have had significant impacts on the region’s coastal ecosystems and biodiversity, leading to issues such as habitat loss, coastal erosion, and ecological imbalance. In response to these issues, this study aims to address the balance between coastal development and ecological protection, proposing strategies for the sustainable development of the Hangzhou Bay area while mitigating the negative impacts of coastline retreat and ecological degradation.

5.2. Recommendations for Marine Ecological Restoration

The diversity of marine spatial use reflects the multiple functions and demands placed on marine resources, involving the development of industries, fisheries, tourism, and transportation [34,35]. In response to these evolving characteristics, management policies should designate marine areas into functional zones based on their usage, setting specific resource utilization standards and environmental management indicators for each functional zone [36]. For instance, industrial zones should adhere to strict pollutant discharge standards, while tourism areas should focus on protecting marine ecological resources. For areas already heavily developed, measures to control development density should be implemented. By promoting eco-friendly projects, the pressure on marine spatial resources can be reduced. For enterprises and projects with high resource consumption, incentive policies should encourage the adoption of circular economy models, such as wastewater treatment and waste recycling, to improve resource efficiency. Given the risk coastal retreat poses to ecosystems and coastal communities, research shows that coastline changes are strongly influenced by land reclamation, industrial development, and coastal erosion [37,38]. Management policies should mitigate the negative effects of coastline changes, such as establishing ecological buffer zones along coastlines to limit the scope of development and strengthen shoreline resilience.
For areas that have already experienced erosion and damage, ecological restoration projects should be implemented to restore vegetation and wetland that can prevent further erosion, thereby protecting coastal ecosystems [39]. Changes in intertidal zones directly affect the biodiversity and abundance of biological resources in marine ecosystems. Management policies should be based on intertidal zone changes, limiting development activities in these areas, particularly those involving land reclamation and sand mining, which can harm the intertidal zone [40]. Legislative measures should be enacted to protect the ecological diversity of intertidal zones. In degraded areas, vegetation restoration, artificial reefs, and wetland restoration projects should be introduced to enhance ecological functions [41]. While protecting intertidal zones, moderate development of eco-tourism and environmentally friendly fisheries can be permitted, providing economic growth without damaging the ecological environment. Changes in the pattern of tidal channel systems affect hydrodynamic processes in marine basins and the distribution of coastal sediments, altering the local ecological environment. Therefore, policymakers should consider the hydrological and topographical characteristics of tidal channel systems to scientifically plan the layout of ports and industrial facilities, avoiding frequently eroded areas as much as possible to reduce the negative impact of tidal channel systems on marine resources.
In regions experiencing significant changes in tidal channel patterns, appropriate ecological restoration projects should be implemented to restore biological habitats, supporting the stability of local ecosystems [42]. Overall changes in the seabed due to sedimentation and erosion impact the stability of the marine environment and affect the living conditions of marine organisms [43]. Sand mining activities are a major factor contributing to seabed changes, and managers should enforce strict regulations on sand mining to ensure that it does not exceed the carrying capacity of marine ecosystems to avoid exacerbating sedimentation issues [44]. Sediments should be managed and utilized in a sustainable manner. The spatial–temporal evolution of Hangzhou Bay is highly dynamic. To address these complex changes [45], policymakers should utilize spatiotemporal evolution models to guide management efforts, providing data support and a decision-making basis for long-term marine development and ecological protection. Based on the different characteristics of regional evolution, tailored management strategies should be adopted, establishing clear guidelines for areas undergoing significant changes, such as implementing ecological protection and development restrictions.
The economic development in the Hangzhou Bay area, particularly in industries, transportation, and land development, has placed significant pressure on the protection of the natural ecological environment. Economic activities often prioritize short-term economic benefits, neglecting long-term ecological sustainability. This has led to potential conflicts between traditional ecological protection policies such as ecological restoration projects, and local economic development strategies. Therefore, it is necessary to integrate ecological protection with economic development by promoting green, low-carbon development and the concept of “green GDP”. This approach encourages the transformation of the economic structure, reduces resource consumption, and minimizes pollution emissions [46]. For example, South Korea’s Green Growth Initiative, through the large-scale investments in green technologies and energy efficiency, has not only promoted economic development but also achieved effective control of carbon emissions [47]. The European Union’s Green Deal, on the other hand, has set the goal of achieving carbon neutrality by 2050, driving the transformation into a green economy and mitigating environmental degradation [48]. In the Hangzhou Bay area, green GDP can demonstrate significant dual benefits for both the environment and the economy. The economic benefits and ecological value associated with green GDP can be measured using specific metrics, such as reductions in carbon emissions, the economic value of preserved ecosystems, and the costs avoided through preventing environmental degradation [49]. At the same time, the introduction of an “ecological compensation” mechanism should be considered. This mechanism would require development areas or stakeholders to bear the costs of environmental protection, such as establishing dedicated ecological protection funds and encouraging joint investment from enterprises and the government in ecological restoration [50]. The introduction of an “ecological compensation” mechanism would require development areas or stakeholders to bear the costs of environmental protection by establishing ecological protection funds and encouraging joint investments from enterprises and the government. The government can further support it by offering special funds or guiding social capital into ecological restoration. Enterprises with high resource consumption and ecological influences could contribute through “green taxes” or “environmental pollution compensation”, while public donations and non-profit organizations can mobilize additional resources. Following the “polluter pay” principle, developers or polluters, such as real estate developers and industrial enterprises, can be held accountable for restoration costs. Successful cases provide valuable insights into implementing this mechanism. China’s Ecological Redlining Policy in the Yangtze River Delta, for instance, protects key ecological areas by imposing strict development restrictions and establishing preservation funds for restoring wetlands and critical ecosystems, achieving a balance between conservation and economic growth [51]. Costa Rica’s Payments for Ecosystem Services (PES) program compensates landowners for protecting forests and water resources using taxes on fossil fuels and water use, leading to significant forest restoration and biodiversity improvement [52]. Similarly, Indonesia’s Mangrove Restoration Programs tackled coastal erosion and biodiversity loss by engaging local communities and private enterprises, leveraging investments to combine ecological restoration with socioeconomic benefits like increased fishery yields and tourism [53]. These examples underscore the effectiveness of ecological redlining, tailored compensation plans, and differentiated measures for industries, such as tiered payment systems or incentives for green technologies. Quantitative indicators, such as the area of restored ecosystems (wetlands, forests, mangroves), biodiversity improvements (species richness, habitat restoration), and reduced ecological risks (flood damage, soil erosion), can evaluate the mechanism’s effectiveness. By adopting these approaches and drawing lessons from proven models, ecological compensation mechanisms can obtain tangible ecological and economic benefits [54].

5.3. Limitations and Prospects

In this study, the current status and changing characteristics of marine spatial resources in Hangzhou Bay area are analyzed by collecting and measuring data and information, supplemented by remote sensing images. In the study of the current situation of coastline development and utilization in the Bay Area, this paper is only limited to the continental coastline and does not elaborate on the current situation and changes in the coastline of the inhabited islands [55] and the coastline of the uninhabited islands [56]. In addition, in the acquisition of data sources, unmanned aerial monitoring [57] means can be added to analyze the sea area near Hangzhou Bay. Finally, in the analysis of the characteristics of changes in marine spatial resources in this paper, the changes in island resources are not taken into account, and the changes in the number and area of islands and their reasons can be investigated in future research to explore the changes in marine resources in various aspects. The simple change in coastline length mentioned in this study may not fully reflect the evolution of the tidal flat. Therefore, a comprehensive analysis of erosion and accretion rates is crucial for understanding the long-term dynamic changes in the coastal zone.
In the Hangzhou Bay area, climate change is primarily reflected in rising temperatures, shifting in precipitation patterns, and sea level rise. According to existing climate scenarios (such as SSP and RCP scenarios), the region is likely to experience a continued increase in temperature, enhanced seasonal fluctuations in precipitation, and particularly an increase in the frequency of extreme weather events, such as heavy rainfall [58]. Additionally, sea level rise will impact coastal land use, especially intensifying risks in low-lying areas. The impacts of climate change occur on different spatial and temporal scales. In coastal areas like Hangzhou Bay, short-term effects may mainly include localized hydrological changes (such as the impact of tides and the intensification of storm surges), while in the medium to long term, more significant sea level rise and changes in climatic conditions (such as worsening droughts or floods) may occur. The effects of climate change on the bay’s seabed sediments, ecosystems, and land use will also vary depending on the specific geographical location [59].
To further investigate the utilization and evolving characteristics of marine spatial resources in the Hangzhou Bay area, future research could focus on a few aspects. First, strengthening the integration of multi-source data and high-precision dynamic monitoring, where local authorities should employ dynamic monitoring technologies, such as unmanned vessel marine detection systems and sensor networks, to achieve real-time monitoring of coastlines, intertidal zones, and tidal channel systems. These technologies can capture the rapidly changing characteristics of marine resources. By building a long series database of marine resources, researchers can better understand marine spatial change trends and predict future resource changes [60,61]. Secondly, researchers can use historical marine spatial data to construct comprehensive models, such as CA-Markov [62], PLUS [63], and InVEST [64], to simulate marine spatial resource utilization under different future scenarios and assess the effects of policy interventions. Integrating SSP (Shared Socioeconomic Pathways) and RCP (Representative Concentration Pathways) climate change scenarios into the modeling will help predict the impacts of sea level rise and extreme weather events on the marine ecosystem and resource utilization in Hangzhou Bay [65]. Third, environmental scientists should assess the ecosystem service values of key ecological areas, including intertidal zones, wetlands, and tidal channel systems, focusing on aspects such as habitats, carbon sinks, and water quality purification. This assessment provides a balanced basis for resource utilization and conservation planning, weighing both economic and ecological benefits [66]. Fourth, researchers should explore how socioeconomic factors, such as population growth, industrial development, and transportation infrastructure construction, influence changes in the structure of marine resource utilization. This includes exploring the relationship between economic activities and marine ecological resources, identifying and analyzing the needs and conflicts of interest among key stakeholders such as coastal communities, enterprises, and government to understand their perspectives on marine resource utilization and protection, providing a basis for formulating comprehensive management policies. Lastly, by leveraging international best practices in marine spatial planning and integrated coastal zone management, policymakers should develop a marine spatial resource management framework suitable for the Hangzhou Bay region to improve the overall effectiveness of resource utilization management [67].

5.4. Policy Proposal

Field investigations reveal an increasing proportion of artificial shorelines in the bay areas, suggesting that the government should enhance the protection of natural shoreline and regulate the intensity of coastline development and utilization [68]. Through an analysis of the resource and environmental carrying capacity, this study indicates that the bay areas are overstressed, offering valuable data for the future development decisions, such as the site selection and planning of sea-related projects. Innovative policies such as “centralized continuous review, zoning and block transfer” for reclaimed sea areas should be piloted to provide ideas for future policies formulation and implementation in Zhejiang and other regions.

6. Conclusions

Taking Hangzhou Bay as the study area, this paper analyzes the characteristics of marine spatial resource evolution and the reasons for changes in Hangzhou Bay through an on-site supplementary investigation and high-resolution remote sensing monitoring, discusses the marine spatial planning of Hangzhou Bay, the current situation of the resources and environment of Hangzhou Bay and the problems, and puts forward countermeasures for high-quality development of the resources and environment of Hangzhou Bay and suggestions for marine ecological restoration. Through the study, it is concluded as follows:
(1) The structure of sea area uses accounts for the largest proportion of the industrial sea, and the growth rate of the industrial sea area in 2020 is 110.30% compared with that in 2018. The diversity index of sea area use in Hangzhou Bay has been steadily maintained above 0.6 for the past five years.
(2) Compared with the continental coastline in 2018, the continental coastline of Hangzhou Bay decreased by 13.17 km. Between 2018 and 2021, the total intertidal area of Hangzhou Bay decreased by 73.44 km2. The overall pattern of the beach trough in Hangzhou Bay was relatively stable from 2008 to 2016.
(3) Between 2012 and 2016, the regional scouring and siltation changes were dominated by scouring, with a maximum scouring amplitude of more than 3 m. Between 2008 and 2012, the Andong Shoal on the south shore of Hangzhou Bay and the Zhenhai Shoal on the east side of Hangzhou Bay were the main siltation areas, with the maximum silting amplitude. The maximum siltation amplitude reached more than 4 m.
(4) In the past 20 years, the spatial change in the bay area is obvious, and the area of the bay area gradually shrank from 2001 to 2021.
Therefore, in the future development and planning of Hangzhou Bay Area, efforts should be made to optimize the marine spatial structure, maximize the use of marine spatial resources, build a scientific and reasonable shoreline pattern, achieve high-quality development of Hangzhou Bay’s resources and environment, and strengthen ecological restoration to achieve the harmonious development of people and the sea. They should also safeguard national maritime rights and interests, vigorously promote the construction of marine ecological civilization, protect the ecosystems of islands and their surrounding waters, and fully implement national strategies such as the “Belt and Road” and the Yangtze River Economic Belt.

Author Contributions

Conceptualization, X.L. (Xingwen Lin); methodology, P.W., M.L.T., J.Z. and X.M.; software, K.Z. and X.Y.; validation, X.L. (Xia Lin), P.W. and M.L.T.; formal analysis, X.M.; investigation, J.Z.; resources, P.W.; data curation, J.Z.; writing—original draft preparation, J.Z.; writing—review and editing, M.L.T., J.S. and F.Z.; visualization, J.Z.; supervision, J.S.; project administration, F.Z.; funding acquisition, F.Z. All authors have read and agreed to the published version of the manuscript.

Funding

This research was carried out with the Monitoring and evaluation of ocean space resource in six major bay areas of Zhejiang Province, Department of Natural Resources of Zhejiang Province (No. 330000200100313013010).

Institutional Review Board Statement

Not applicable.

Informed Consent Statement

Not applicable.

Data Availability Statement

Some or all of the data that support the findings of this study are available from the corresponding author upon reasonable request.

Acknowledgments

We appreciate the anonymous reviewers and editors for appraising our manuscript and for offering constructive comments. Special thanks to Universiti Sains Malaysia for Internationalization Incentive Scheme (R502-KR-ARP004-00AUPRM003-K134).

Conflicts of Interest

The authors declare no conflict of interest.

References

  1. Zhang, K.C.; Yu, J.; Wan, X.L.; Tian, S.Z.; Wu, J.L.; Liu, N.; Wang, D. Data-driven decision-making of marine ecological civilization construction in island county of China. Ocean Coast. Manag. 2023, 240, 106631. [Google Scholar] [CrossRef]
  2. Lin, Y.; Yang, Y.Q.; Li, P.L.; Feng, C.C.; Ding, J.Q.; Zhou, J.Y.; Jiang, Q.; Ye, G. Spatial-temporal evaluation of marine ecological civilization of Zhejiang Province, China. Mar. Policy 2021, 135, 104835. [Google Scholar] [CrossRef]
  3. Zhai, T.L.; Wang, J.; Fang, Y.; Qin, Y.; Huang, L.Y.; Chen, Y. Assessing ecological risks caused by human activities in rapid urbanization coastal areas: Towards an integrated approach to determining key areas of terrestrial-oceanic ecosystems preservation and restoration. Sci. Total Environ. 2020, 708, 135153. [Google Scholar] [CrossRef] [PubMed]
  4. Sun, C.Z.; Wang, L.J.; Zou, W.; Zhai, X.Q. The high-quality development level assessment of marine economy in China based on a “2+6+4” framework. Ocean Coast. Manag. 2023, 244, 106822. [Google Scholar] [CrossRef]
  5. Hu, Y.K.; Yu, Z.F.; Zhou, B.; Li, Y.; Yin, S.J.; He, X.Q.; Peng, X.; Shum, C. Tidal-driven variation of suspended sediment in Hangzhou Bay based on GOCI data. Int. J. Appl. Earth Obs. Geoinf. 2019, 82, 101920. [Google Scholar] [CrossRef]
  6. Huo, Y. Study on Coupling and Coordinated Development of Ecological Environment-Energy Consumption-Regional Economic Growth in Greater Bay Area around Hangzhou Bay. Math. Probl. Eng. 2022, 2022, 7738240. [Google Scholar] [CrossRef]
  7. Teng, X.; Zhao, Q.W.; Zhang, P.P.; Liu, L.; Dong, Y.E.; Hu, H.; Yue, Q.; Ou, L.; Xu, W. Implementing marine functional zoning in China. Mar. Policy 2022, 132, 103484. [Google Scholar] [CrossRef]
  8. Yang, L.J.; Wu, L.L.; Yan, S.Q. Market-based sea use management in China: Features and countermeasures. Mar. Policy 2020, 120, 104091. [Google Scholar] [CrossRef]
  9. Yu, L.L.; Lu, S.S.; Zhang, J.B.; Yang, B.; Xu, M. Effects of tide-surge interactions on the temporal distribution of the peak residual in Hangzhou Bay, China. Ocean Eng. 2022, 266, 2. [Google Scholar] [CrossRef]
  10. Shi, Y.M.; Huang, C.Q.; Shi, S.; Gong, J.Y. Tracking of Land Reclamation Activities Using Landsat Observations—An Example in Shanghai and Hangzhou Bay. Remote Sens. 2022, 14, 464. [Google Scholar] [CrossRef]
  11. Wang, S.H.; Li, W.Y.; Xing, L. A Review on Marine Economics and Management: How to Exploit the Ocean Well. Water 2022, 14, 2626. [Google Scholar] [CrossRef]
  12. Tang, D.Z.; Deng, T.; Lin, S.Y. Research on the Water Environment Governance of Hangzhou Bay Based on the DEA–Tobit Model. Water 2023, 15, 4021. [Google Scholar] [CrossRef]
  13. Meng, Z.; Han, Q.X.; Wang, X.B. Distribution pattern of macrobenthic composition, diversity and secondary production in Hangzhou Bay, northern East China Sea. Reg. Stud. Mar. Sci. 2021, 47, 101956. [Google Scholar] [CrossRef]
  14. Mao, Y.X.; Yang, D.S.; Zeng, A.N.; Zhao, X.Y. Research on the Change of Coastline on the South Coast of Hangzhou Bay Based on Multi-temporal Remote Sensing Images. IOP Conf. Ser. Earth Environ. Sci. 2021, 769, 022024. [Google Scholar] [CrossRef]
  15. Cao, W.T.; Zhou, Y.Y.; Li, R.; Li, X.C. Mapping changes in coastlines and tidal flats in developing islands using the full time series of Landsat images. Remote Sens. Environ. 2020, 239, 111665. [Google Scholar] [CrossRef]
  16. Shalaby, A.; Tateishi, R. Remote sensing and GIS for mapping and monitoring land cover and land-use changes in the Northwestern coastal zone of Egypt. Appl. Geogr. 2007, 27, 28–41. [Google Scholar] [CrossRef]
  17. Wang, L.; Tian, H.; Zhao, Z.C.; Feng, T.; Chen, P.; Jiang, Y.L. Research on a new technology of the control system in the intelligent energy station. Planners 2022, 38, 121–127. [Google Scholar]
  18. Huang, C.; Zhang, C.C.; Liu, Q.S.; Wang, Z.H.; Li, H.; Liu, G.H. Land reclamation and risk assessment in the coastal zone of China from 2000 to 2010. Reg. Stud. Mar. Sci. 2020, 39, 101422. [Google Scholar] [CrossRef]
  19. Zhang, Y.Z.; Chen, R.S.; Wang, Y. Tendency of land reclamation in coastal areas of Shanghai from 1998 to 2015. Land Use Policy 2020, 91, 104370. [Google Scholar] [CrossRef]
  20. Liu, Q.X.; Trinder, J.C.; Turner, I.L. Automatic super-resolution shoreline change monitoring using Landsat archival data: A case study at Narrabeen–Collaroy Beach, Australia. J. Appl. Remote Sens. 2017, 11, 16036. [Google Scholar] [CrossRef]
  21. Bishop-Taylor, R.; Nanson, R.; Sagar, S.; Lymburner, L. Mapping Australia’s dynamic coastline at mean sea level using three decades of Landsat imagery. Remote Sens. Environ. 2021, 267, 112734. [Google Scholar] [CrossRef]
  22. Wu, W.T.; Gao, Y.W.; Chen, C.P.; Sun, Y.; Su, H. Framework for Assessing the Dynamic Coastlines Induced by Urbanization Using Remote Sensing Data: A Case Study in Fujian, China. Remote Sens. 2022, 14, 2911. [Google Scholar] [CrossRef]
  23. Wu, T.; Hou, X.Y.; Xu, X.L. Spatio-temporal characteristics of the mainland coastline utilization degree over the last 70 years in China. Ocean Coast. Manag. 2014, 98, 150–157. [Google Scholar] [CrossRef]
  24. Li, K.X.; Zhang, L.; Chen, B.W.; Zuo, J.; Yang, F.; Li, L. Analysis of China’s Coastline Changes during 1990–2020. Remote Sens. 2023, 15, 981. [Google Scholar] [CrossRef]
  25. Yan, F.Q.; Wang, X.G.; Huang, C.; Zhang, J.J.; Su, Z.F.; Zhao, Y.F.; Lyne, V. Sea Reclamation in Mainland China: Process, Pattern, and Management. Land Use Policy 2023, 127, 106555. [Google Scholar] [CrossRef]
  26. Liu, C.; Yang, M.H.; Hou, Y.T.; Xue, X.Z. Ecosystem service multifunctionality assessment and coupling coordination analysis with land use and land cover change in China’s coastal zones. Sci. Total Environ. 2021, 797, 149033. [Google Scholar] [CrossRef] [PubMed]
  27. Vani, N.R.; Pavithra, R.H. Evaluation of parameters of crop diversification in Sidlaghatta taluk. Int. J. Innov. Res. Multidiscip. Field 2021, 12, 7. [Google Scholar]
  28. Xie, D.F.; Chen, Y.W.; Pan, C.H.; Zhang, S.Y.; Wei, W.; Wang, Z.B.; Gu, J.; Duan, W. Response of suspended sediment dynamics to human activities in the transitional zone between Changjiang Estuary and Hangzhou Bay. Front. Mar. Sci. 2024, 11, 1440754. [Google Scholar] [CrossRef]
  29. Fang, Z.; Feng, T.; Qin, G.R.; Meng, Y.J.H.; Zhao, S.Y.; Yang, G.; Wang, L.; Sun, W. Simulations of water pollutants in the Hangzhou Bay, China: Hydrodynamics, characteristics, and sources. Mar. Pollut. Bull. 2024, 200, 116140. [Google Scholar] [CrossRef] [PubMed]
  30. Gissi, E.; Manea, E.; Mazaris, A.D.; Fraschetti, S.; Almpanidou, V.; Bevilacqua, S.; Coll, M.; Guarnieri, G.; Lloret-Lloret, E.; Pascual, M.; et al. A review of the combined effects of climate change and other local human stressors on the marine environment. Sci. Total Environ. 2021, 755, 142564. [Google Scholar] [CrossRef] [PubMed]
  31. Wang, X.G.; Yan, F.Q.; Su, F.Z. Changes in coastline and coastal reclamation in the three most developed areas of China, 1980~2018. Ocean Coast. Manag. 2021, 204, 105542. [Google Scholar] [CrossRef]
  32. Gou, X.X.; Liang, H.D.; Cai, T.L.; Wang, X.K.; Chen, Y.N.; Xia, X.M. The Impact of Coastline and Bathymetry Changes on the Storm Tides in Zhejiang Coasts. J. Mar. Sci. Eng. 2023, 11, 1832. [Google Scholar] [CrossRef]
  33. Wang, C.Y.; Delu, P. Zoning of Hangzhou Bay ecological red line using GIS-based multi-criteria decision analysis. Ocean Coast. Manag. 2017, 139, 42–50. [Google Scholar]
  34. Levine, A.S.; Richmond, L.; Lopez-Carr, D. Marine resource management: Culture, livelihoods, and governance. Appl. Geogr. 2015, 59, 56–59. [Google Scholar] [CrossRef]
  35. Gao, S.; Sun, H.H.; Liu, J.F.; Liu, W. Comprehensive audit evaluation and driving force analysis of various types of marine resources development. Environ. Dev. Sustain. 2022, 24, 4371–4386. [Google Scholar] [CrossRef]
  36. Maina, J.M.; Gamoyo, M.; Adams, V.M.; D’Agata, S.; Bosire, J.; Francis, J.; Waruinge, D. Aligning marine spatial conservation priorities with functional connectivity across maritime jurisdictions. Conserv. Sci. Pract. 2020, 2, 2. [Google Scholar] [CrossRef]
  37. Ouyang, Y.R.; Wu, L.; Dai, J.J.; Wu, Y.J.; Cai, L.; Li, Q.S.; Wu, J.; Jiang, S. Technical methodologies for the assessment of the impacts of reclamation projects on marine ecology. Environ. Sci. Pollut. Res. 2022, 29, 7595–7603. [Google Scholar] [CrossRef] [PubMed]
  38. Ford, M. Shoreline Changes on an Urban Atoll in the Central Pacific Ocean: Majuro Atoll, Marshall Islands. J. Coast. Res. 2012, 28, 11–22. [Google Scholar] [CrossRef]
  39. Kuenzer, C.; Ottinger, M.; Liu, G.H.; Sun, B.; Baumhauer, R.; Dech, S. Earth observation-based coastal zone monitoring of the Yellow River Delta: Dynamics in China’s second largest oil producing region over four decades. Appl. Geogr. 2015, 55, 92–107. [Google Scholar] [CrossRef]
  40. Zheng, J.H.; Xu, W.; Tao, A.F.; Fan, J.; Xing, J.Y.; Wang, G. Synergy between coastal ecology and disaster mitigation in China: Policies, practices, and prospects. Ocean Coast. Manag. 2023, 245, 106866. [Google Scholar] [CrossRef]
  41. Nordlund, L.M.; de la Torre-Castro, M.; Erlandsson, J.; Conand, C.; Muthiga, N.; Jiddawi, N.; Gullström, M. Intertidal Zone Management in the Western Indian Ocean: Assessing Current Status and Future Possibilities Using Expert Opinions. Ambio 2014, 43, 1006–1019. [Google Scholar] [CrossRef] [PubMed]
  42. Hood, W.G. Applying tidal landform scaling to habitat restoration planning, design, and monitoring. Estuar. Coast. Shelf Sci. 2020, 244, 106060. [Google Scholar] [CrossRef]
  43. Depountis, N.; Apostolopoulos, D.; Boumpoulis, V.; Christodoulou, D.; Dimas, A.; Fakiris, E.; Leftheriotis, G.; Menegatos, A.; Nikolakopoulos, K.; Papatheodorou, G.; et al. Coastal Erosion Identification and Monitoring in the Patras Gulf (Greece) Using Multi-Discipline Approaches. J. Mar. Sci. Eng. 2023, 11, 654. [Google Scholar] [CrossRef]
  44. Deng, M.M.; Li, Q.Y.; Li, W.Y.; Lai, G.Y.; Pan, Y. Impacts of Sand Mining Activities on the Wetland Ecosystem of Poyang Lake (China). Land 2022, 11, 1364. [Google Scholar] [CrossRef]
  45. Li, N.; Li, L.W.; Lu, D.S.; Zhang, Y.L.; Wu, M. Detection of coastal wetland change in China: A case study in Hangzhou Bay. Wetl. Ecol. Manag. 2019, 27, 103–124. [Google Scholar] [CrossRef]
  46. Qiu, L.F.; Zhang, M.; Zhou, B.B.; Cui, Y.Z.; Yu, Z.L.; Liu, T.; Wu, S. Economic and ecological trade-offs of coastal reclamation in the Hangzhou Bay, China. Ecol. Indic. 2021, 125, 107477. [Google Scholar] [CrossRef]
  47. Kim, C. A review of the deployment programs, impact, and barriers of renewable energy policies in Korea. Renew. Sustain. Energy Rev. 2021, 144, 110870. [Google Scholar] [CrossRef]
  48. Eckert, E.; Kovalevska, O. Sustainability in the European Union: Analyzing the Discourse of the European Green Deal. J. Risk Financ. Manag. 2021, 14, 80. [Google Scholar] [CrossRef]
  49. Yanan Ge, Y.N.; Ma, Y.Q.; Wang, Z.H. Adaptation and Feasibility Study of Green GDP Accounting System in China. Manag. Innov. 2023, 1, 1. [Google Scholar]
  50. Li, W.; Yue, Q.; Hu, H.; Liu, L. Current status of ecological compensation for Bohai Sea reclamation and management countermeasures. Mar. Policy 2023, 155, 105778. [Google Scholar] [CrossRef]
  51. Ma, X.W.; Xu, B. Optimization and management of the connectivity of ecological red lines at regional scale: A case study of Yangtze River Delta. J. Nat. Resour. 2022, 37, 3088–3101. (In Chinese) [Google Scholar] [CrossRef]
  52. Kolinjivadi, V.; Van Hecken, G.; Merlet, P. Fifteen years of research on payments for ecosystem services (PES): Piercing the bubble of success as defined by a Northern-driven agenda. Glob. Environ. Chang. 2023, 83, 102758. [Google Scholar] [CrossRef]
  53. Damastuti, E.; van Wesenbeeck, B.K.; Leemans, R.; de Groot, R.S.; Silvius, M.J. Effectiveness of community-based mangrove management for coastal protection: A case study from Central Java, Indonesia. Ocean Coast. Manag. 2023, 238, 106498. [Google Scholar] [CrossRef]
  54. Zhai, T.L.; Zhang, D.; Zhao, C.C. How to optimize ecological compensation to alleviate environmental injustice in different cities in the Yellow River Basin? A case of integrating ecosystem service supply, demand and flow. Sustain. Cities Soc. 2021, 75, 103341. [Google Scholar] [CrossRef]
  55. Zhang, X.P.; Pan, D.L.; Chen, J.Y.; Zhao, J.H.; Zhu, Q.K.; Huang, H.Q. Evaluation of Coastline Changes under Human Intervention Using Multi-Temporal High-Resolution Images: A Case Study of the Zhoushan Islands, China. Remote Sens. 2014, 6, 9930–9950. [Google Scholar] [CrossRef]
  56. Bera, R.; Maiti, R. An assessment of coastal vulnerability using geospatial techniques. Environ. Earth Sci. 2021, 80, 306. [Google Scholar] [CrossRef]
  57. Hayes, M.C.; Gray, P.C.; Harris, G.; Sedgwick, W.C.; Crawford, V.D.; Chazal, N.; Crofts, S.; Johnston, D.W. Drones and deep learning produce accurate and efficient monitoring of large-scale seabird colonies. Ornithol. Appl. 2021, 123, 3. [Google Scholar] [CrossRef]
  58. Solecki, W.; Roberts, D.; Seto, K.C. Strategies to improve the impact of the IPCC Special Report on Climate Change and Cities. Nat. Clim. Chang. 2024, 14, 685–691. [Google Scholar] [CrossRef]
  59. Chen, F.; Wu, M.W.; Dong, M.Y.; Yu, B. Comparison of the Impacts of Topography and Urbanization on an Extreme Rainfall Event in the Hangzhou Bay Region. J. Geophys. Res. Atmos. 2022, 127, 15. [Google Scholar] [CrossRef]
  60. Weeks, E.; Robinson, M.E.; Li, C.Y. Quantifying cold front induced water transport of a bay with in situ observations using manned and unmanned boats. Acta Oceanol. Sin. 2018, 37, 1–7. [Google Scholar] [CrossRef]
  61. Dewi, R.S.; Bijker, W. Dynamics of shoreline changes in the coastal region of Sayung, Indonesia. Egypt. J. Remote Sens. Space Sci. 2020, 23, 181–193. [Google Scholar] [CrossRef]
  62. Wu, H.; Li, Z.; Clarke, K.C.; Shi, W.Z.; Fang, L.C.; Lin, A.Q.; Zhou, J. Examining the sensitivity of spatial scale in cellular automata Markov chain simulation of land use change. Int. J. Geogr. Inf. Sci. 2019, 33, 1040–1061. [Google Scholar] [CrossRef]
  63. Xu, L.F.; Liu, X.; Tong, D.; Liu, Z.X.; Yin, L.R.; Zheng, W.F. Forecasting Urban Land Use Change Based on Cellular Automata and the PLUS Model. Land 2022, 11, 652. [Google Scholar] [CrossRef]
  64. Yang, D.; Liu, W.; Tang, L.Y.; Chen, L.; Li, X.Z.; Xu, X.L. Estimation of water provision service for monsoon catchments of South China: Applicability of the InVEST model. Landsc. Urban Plan. 2019, 182, 133–143. [Google Scholar] [CrossRef]
  65. Chen, G.Z.; Li, X.; Liu, X.P. Global land projection based on plant functional types with a 1-km resolution under socio-climatic scenarios. Sci. Data 2022, 9, 1. [Google Scholar] [CrossRef]
  66. Armoškaitė, A.; Puriņa, I.; Aigars, J.; Strāķe, S.; Pakalniete, K.; Frederiksen, P.; Schrøder, L.; Hansen, H.S. Establishing the links between marine ecosystem components, functions and services: An ecosystem service assessment tool. Ocean Coast. Manag. 2020, 193, 105229. [Google Scholar] [CrossRef]
  67. Lin, Y.H.; Huang, F.M.; Zhang, Y.; Wang, Q.; Huang, J.L.; Chen, Q.M.; Xue, X. An Improved Framework of Marine Major Function-Oriented Zoning in Advancing Ecosystem-Based Management. J. Mar. Sci. Eng. 2022, 10, 684. [Google Scholar] [CrossRef]
  68. Tierolf, L.; Haer, T.; Athanasiou, P.; Luijendijk, A.P.; Botzen, W.J.W.; Aerts, J.C.J.H. Coastal adaptation and migration dynamics under future shoreline changes. Sci. Total Environ. 2024, 917, 170239. [Google Scholar] [CrossRef]
Figure 1. Geographic location of Hangzhou Bay (Source: Esri, Maxar, Earthstar Geographics, and the GIS User Community).
Jmse 13 00098 g001
Figure 2. Current status of the sea area in Hangzhou Bay area. (a) Overall topography and geomorphology of Hangzhou Bay. (b) Types and proportions of continental coastline in Hangzhou Bay. (c) Distribution of sea use types (Class I) for sea area in Hangzhou Bay. (d) Distribution of sea use types (Class I) for sea use types for the number of sea use projects in Hangzhou Bay. (a) Source: The electronic navigational charts published by the Maritime Administration of the People’s Republic of China. (bd) Source: actual measurement and manage department statistics).
Jmse 13 00098 g002
Figure 3. The measurement position and measurement line of single beam echo sounding.
Jmse 13 00098 g003
Figure 4. Field survey (the left is a survey of continental coastline, the middle is the structure of sea area use (taken in April 2023), and the right is the beach tank system landscape). Note: the fieldwork tasks originate from the Zhejiang Province Six Major Bay Area Marine Spatial Resource Monitoring and Evaluation Project, with the approving authority for on-site measurement being the Zhejiang Provincial Department of Natural Resources.
Jmse 13 00098 g004
Figure 5. Changes in the structure of maritime use in 2018, 2020, and 2022.
Jmse 13 00098 g005
Figure 6. Schematic diagram of the change in the diversity index of sea use in Hangzhou Bay.
Jmse 13 00098 g006
Figure 7. Comparison of continental coastlines in Hangzhou Bay (source: Esri, Maxar, Earthstar Geographics, and the GIS User Community).
Jmse 13 00098 g007
Figure 8. Changes in the extent of the intertidal zone in Hangzhou Bay, 2018–2021.
Jmse 13 00098 g008
Figure 9. Bathymetric map of Hangzhou Bay in (a) 2008, (b) 2012, and (c) 2016.
Jmse 13 00098 g009
Figure 10. Changes of 10 m (a) and 15 m (b) isobaths in Jinshan–Zhapu from 2012 to 2016.
Jmse 13 00098 g010
Figure 11. Change of 20 m (left) and 40 m (right) isobaths in Zhapu from 2012 to 2016.
Jmse 13 00098 g011
Figure 12. Changes in 0 m isobaths in Andong Shoal.
Jmse 13 00098 g012
Figure 13. Distribution of seabed scouring and siltation in Hangzhou Bay ((a) 2012 to 2016; (b) 2008 to 2012).
Jmse 13 00098 g013
Figure 14. Changes in the coastline of Hangzhou Bay and schematic diagram of changes in the area of Hangzhou Bay.
Jmse 13 00098 g014
Table 1. Actual measurement data table. Unit: km2.
Year201820202022
Industrial sea use8.6318.1618.72
Seabed engineering4.454.454.45
Transportation use of the sea6.177.498.06
Tourism and recreational use of the sea0.130.130.13
Dumping of sewage into the sea0.280.340.34
Other uses of the sea0.241.812.45
Special uses of the sea1.701.701.60
Sea use for land reclamation works1.090.650.65
Total22.6934.7336.40
Percentage Change (2018–2020)--+110.30%+3.09%
Percentage Change (2020–2022)----+4.81%
Table 2. Statistical table of changes in the continental coastline between 2018 and 2021. Unit: km.
Type of CoastlineLength of CoastlineTotal
natural coastlinebedrock coastline−0.7914.19
muddy coastline14.98
other coastlinesecological restoration of coastlines12.2012.20
estuarine coastline−14.00−14.00
artificial coastline−25.56−25.56
total−13.17−13.17
Note: positive values indicate an increase in shoreline and negative values a decrease compared to 2018 coastline ratios.
Table 3. Changes in intertidal type and area (km2).
Type of Intertidal Zone20182021Value of Change in Area
tide pool308.53239.00−69.52
beaches4.880.81−4.07
rocky beach0.550.700.15
Total313.96240.51−73.44
Table 4. Calculated statistics of seabed flushing and siltation (“−” flushing “+” siltation) in Hangzhou Bay subzone.
YearTotal Amount of Silt Flushed
(×106 m3)
Annual Siltation
(×106 m3/a)
Average Extent of Siltation (cm)Average Annual Siltation (cm/a)
2012–2016−192,473.74−48,118.44−21.80−5.45
2008–201210,459.892614.973.090.77
Disclaimer/Publisher’s Note: The statements, opinions and data contained in all publications are solely those of the individual author(s) and contributor(s) and not of MDPI and/or the editor(s). MDPI and/or the editor(s) disclaim responsibility for any injury to people or property resulting from any ideas, methods, instructions or products referred to in the content.

