Article

An Analysis of the Effect of Cavitation on Rotor–Stator Interaction in a Bidirectional Bulb Tubular Pump

1
School of Electrical Engineering, Yancheng Institute of Technology, Yancheng 224000, China
2
Engineering Research Center of High-Efficiency and Energy-Saving Large Axial Flow Pumping Station, Yangzhou University, Yangzhou 225009, China
3
The Hongze Lake Water Conservancy Engineering Management Office, Huaian 223001, China
4
Nanjing Water Planning and Designing Institute Corp. Ltd., Nanjing 210022, China
*
Authors to whom correspondence should be addressed.
J. Mar. Sci. Eng. 2025, 13(1), 138; https://doi.org/10.3390/jmse13010138
Submission received: 11 November 2024 / Revised: 8 January 2025 / Accepted: 13 January 2025 / Published: 14 January 2025
(This article belongs to the Section Ocean Engineering)

Abstract

:
This study delves into rotor–stator interaction within a bidirectional bulb tubular pump under cavitation conditions. Using pressure pulsation tests on a model pump and numerical simulations performed with ANSYS CFX software, we analyzed pressure pulsation and flow field data across three distinct flow rates and multiple cavitation numbers. Both time-domain and frequency-domain analyses were conducted to examine the patterns of pressure pulsation influenced by flow rates and cavitation numbers at various monitoring locations. A numerical flow field analysis further validated the findings. The results reveal that rotor–stator interaction manifests in the vaneless spaces of the pump during cavitation. The onset of cavitation alters the amplitudes of dominant frequencies at different flow rates. Near the guide vane and impeller, the dominant frequencies shift toward the impeller frequency and guide vane frequency, respectively. Under low-flow conditions, the rotor–stator interaction effect is more conspicuous due to the deteriorated flow pattern. Pressure pulsations are more strongly influenced in the front vaneless space (FVP) than in the rear vaneless space (RVP). This difference arises because the front guide vane destabilizes rather than stabilizes the flow pattern, worsening the rotor–stator interaction. Additionally, the FVP is less affected by the impeller than the RVP, further amplifying the influence of rotor–stator interaction on pressure pulsation. These findings provide a theoretical foundation for mitigating the effects of rotor–stator interaction on the operational stability and efficiency of bidirectional bulb tubular pumps.

1. Introduction

Axial flow pumps, particularly those of the bidirectional bulb-type, are widely used due to their distinctive attributes, including low head, high flow capacity, and ease of maintenance [1]. These pumps can operate bidirectionally, facilitating water extraction and irrigation based on practical requirements [2]. However, the unique flow path of axial flow pumps introduces a degree of hydraulic instability during operation, potentially compromising unit efficiency and stability [3]. This complexity is further amplified in bidirectional bulb-type pumps. Among the numerous factors affecting the operational stability and efficiency of these pumps, cavitation is a significant contributor to performance degradation [4]. The onset and subsequent collapse of cavitation exacerbate other hydraulic phenomena, including dynamic and static interferences between guide vanes and the impeller [5,6,7,8,9].
Extensive research has focused on cavitation in various axial flow pump configurations. Xie et al. [10] examined the energy and cavitation performance of high-ratio axial flow pumps, while Fei et al. [11] focused on the implications of cavitation on energy performance and flow characteristics within hydraulic machinery. By analyzing flow in impeller blade systems, Zharkovskii, A et al. [12] determined the ratio between the NPSH required to prevent erosion and the NPSH3 at which pump failure occurs. Al-Obaidi et al. [13] evaluated detection techniques for cavitation in axial pumps using vibration and acoustic signal analysis. They employed cost-effective sensors and data acquisition systems, including embedded accelerometer sensors and smartphone-based microphones, to capture these signals.
Despite substantial research on cavitation phenomena in axial flow pumps, most studies have focused on cavitation itself and its behavior under different operating conditions, with limited exploration of its effects on other hydraulic phenomena such as vibration, noise, and dynamic/static interferences.
Dynamic and static interferences have been central to investigations into the factors influencing the stability and efficiency of axial flow pumps [14]. The intricate spatial configuration of axial flow pump blades results in complex force conditions under varying operations, making it challenging to directly observe the impact of cavitation on pump stability and dynamic/static interferences. Measuring and analyzing pressure pulsations has become a widely recognized method for studying hydraulic phenomena during pump operation. Using numerical simulation methods, Chalghoum et al. [15] demonstrated that pressure pulsation in the dynamic–static interference regions of centrifugal pumps and its effects on the volute are influenced by secondary flows near the tongue region. Asim T et al. [16] found that secondary flow features in the near-tongue regions, caused by blade interactions, significantly affect flow characteristics within the volute. Cheng et al. [17] studied the effects of dynamic and static disturbances on flow, vibration, and noise characteristics, optimizing the vibration and noise performances of marine centrifugal pumps.
Given the high costs and extended timelines associated with pressure pulsation and flow field tests [18], this study adopted a combined approach using experiments and numerical simulations to examine the effects of cavitation on dynamic and static interferences during the operation of bidirectional bulb axial flow pumps. First, a model pump, based on a prototype bidirectional bulb axial flow pump, was established, and hydraulic characteristic tests were conducted under forward operation using a high-precision hydraulic machinery test bench. Four monitoring points were strategically placed, with pressure pulsation sensors measuring pulsations across a range of flow rates, including low, design, and high flow rates, and under cavitation, cavitation inception, and non-cavitating conditions. Based on the experimental results, the Fourier transform and a comparative analysis were employed to identify cases influenced by cavitation-induced dynamic and static interferences. Subsequently, ANSYS CFX software was utilized for unsteady simulations under specific operating conditions, incorporating cavitation. Through pressure pulsation and flow field analyses, this study investigates the influence of cavitation on dynamic and static interferences between the impeller and guide vanes. The research aims to provide guidance for improving the efficiency and stability of bidirectional bulb axial flow pump operation, demonstrating both scientific significance and practical value.

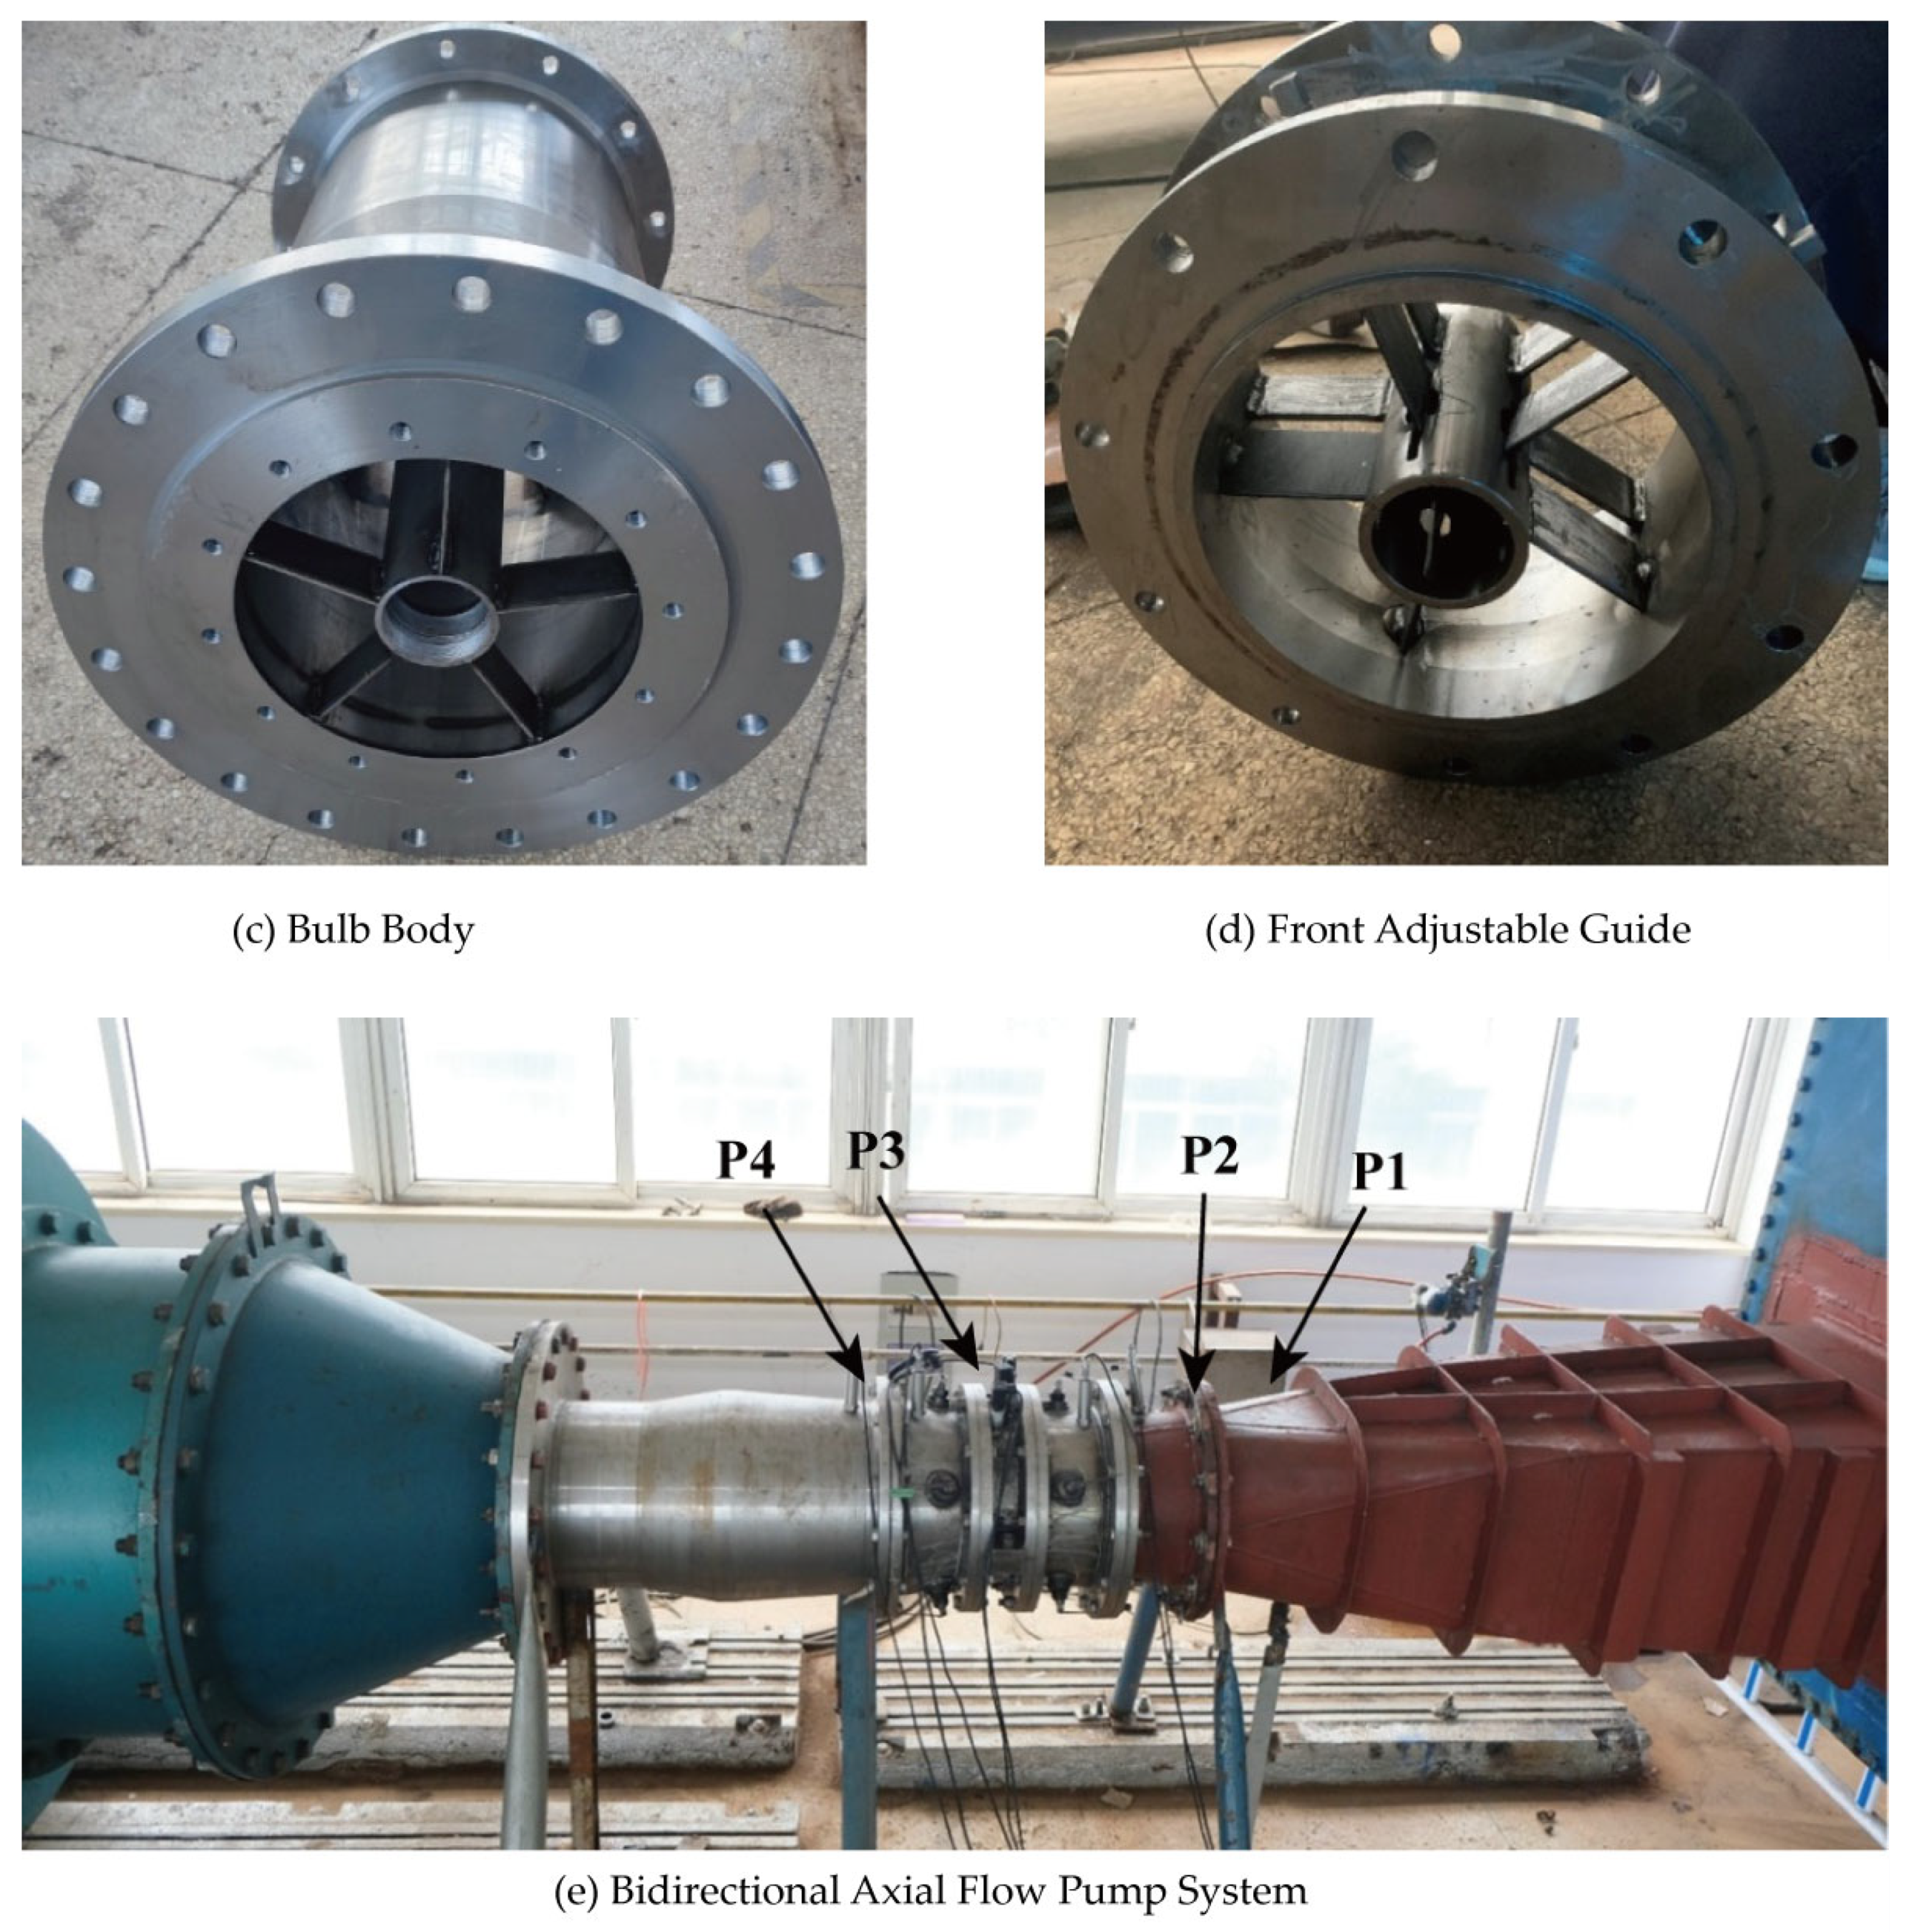
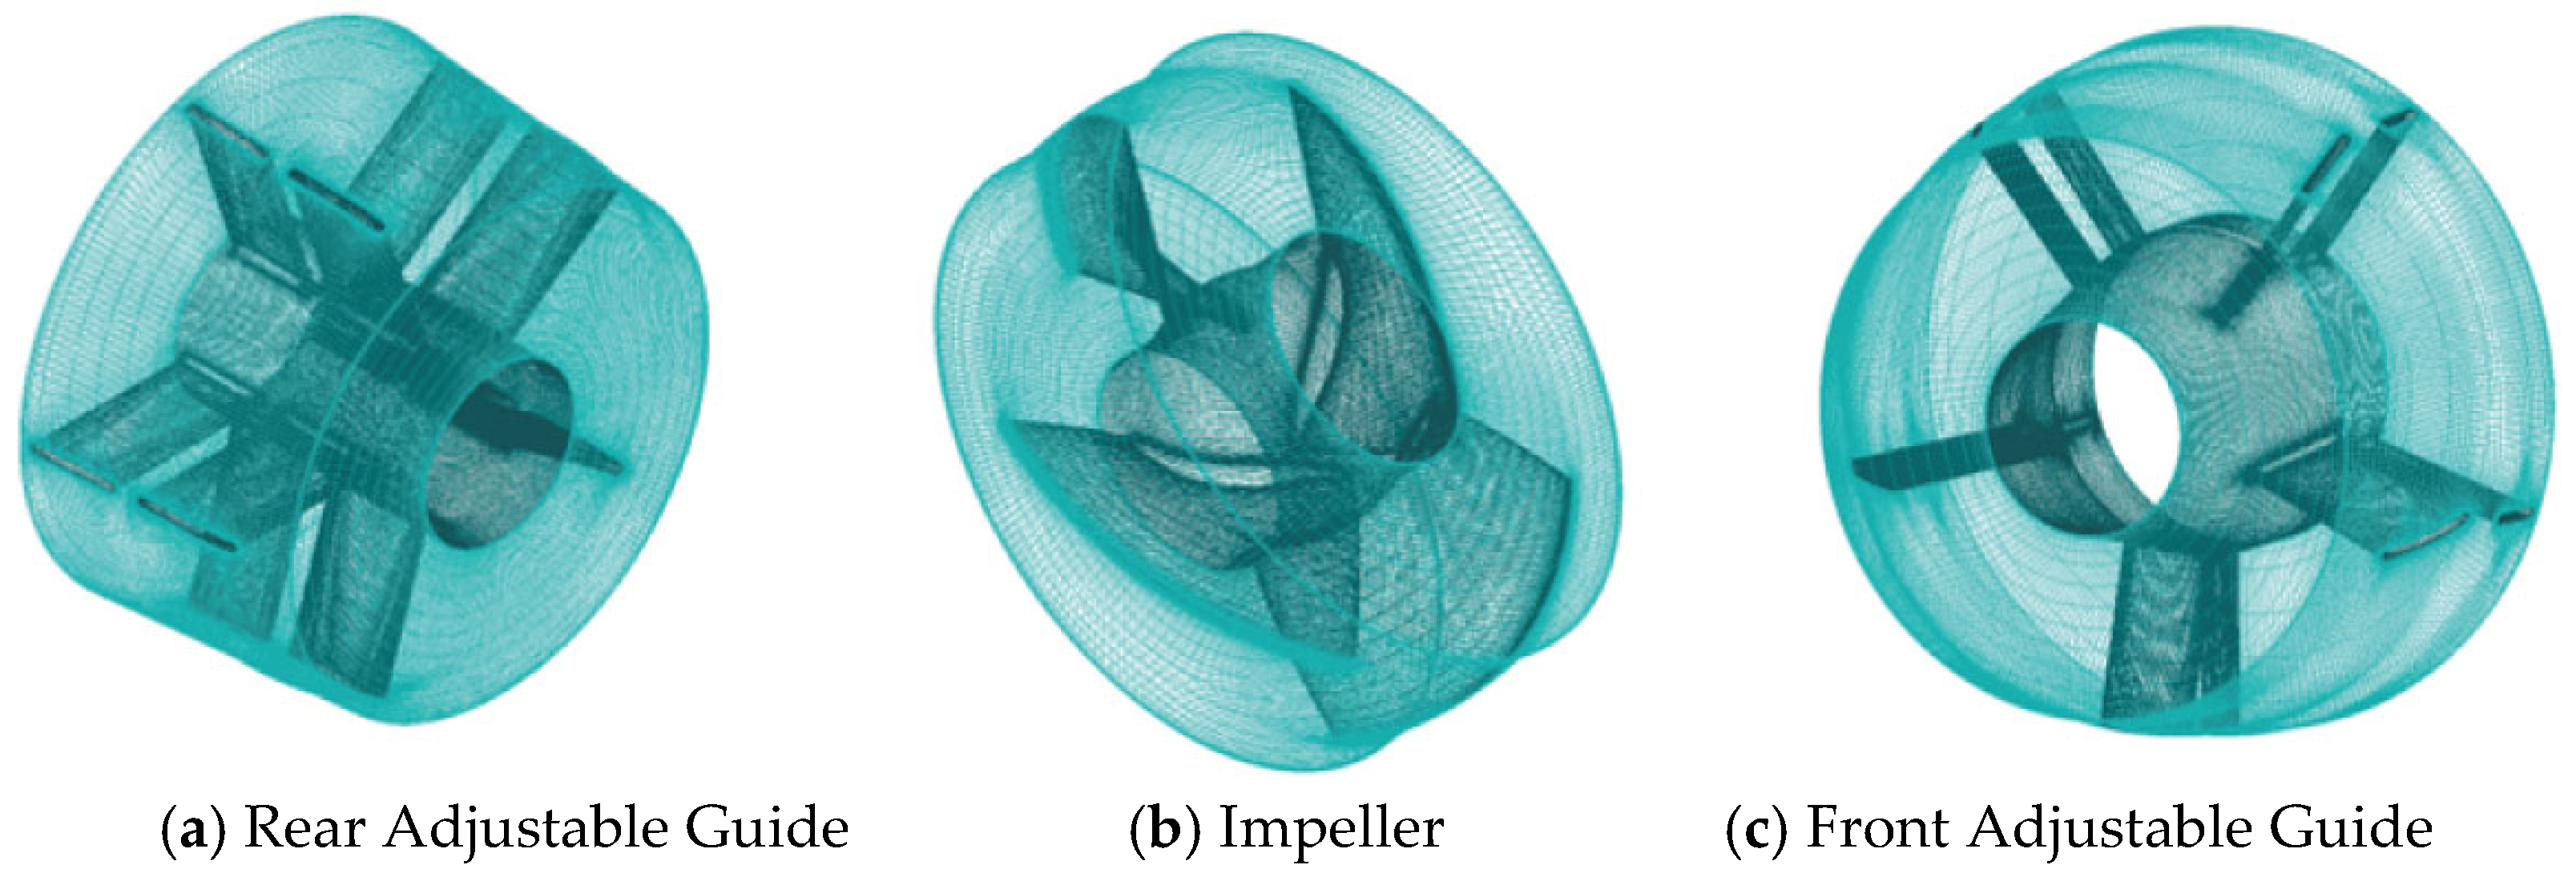
2. Experimental Setup

In this study, a bidirectional submersible axial flow pump was the focus of investigation. The prototype has an impeller diameter of 2400 mm, with a discharge rotation speed of 158 r/min and a designed discharge head of 2.84 m. For intake, it rotates at 127 r/min with a designed head of 1.05 m. The pump is equipped with four impeller blades and five guide vanes. During forward operation, the blade and guide vane angles are set at 0° and 20°, respectively. In reverse operation, these angles are adjusted to −2° and 12°.
Based on the prototype, a scaled model pump was designed. The model features an impeller diameter (D) of 300 mm and a scale ratio of 1:7.67. Table 1 showcases the parameters of the model pump, axial flow pump, and centrifugal pump.
The impeller blades of the model were crafted from brass material. This experiment compares the hydraulic performance of two configurations: one with a front-mounted motor (located on the intake side) and one with a rear-mounted motor (located on the discharge side). The guide vanes on both sides of the impeller are adjustable, as illustrated in Figure 1b,c, and were constructed by welding steel material. The inlet and outlet flow passages were also fabricated by welding steel plates, while the motor section was precisely machined based on CAD dimensions.
The model pump features a tip clearance of less than 0.15 mm, an axial runout of 0.10 mm between the guide vanes and impeller positioning surfaces, and a radial runout of 0.08 mm on the hub’s outer surface. Figure 1e illustrates the configuration of the pump device model and the monitoring points. The model pump structure, from left to right, consists of the following components: outlet flow passage, bulb body, rear adjustable guide vanes, impeller, front adjustable guide vanes, and inlet flow passage. Four pressure pulsation monitoring points were set up: Point 1 (P1)—at the inlet of the front guide vanes; Point 2 (P2)—at the inlet of the impeller; Point 3 (P3)—at the outlet of the impeller; and Point 4 (P4)—at the outlet of the rear guide vanes.
After numerous improvements, installations, and commissioning adjustments, the pump achieved stable operation, closely matching the actual pump conditions. When the pump’s operating direction is changed, the identical dimensions of the inlet and outlet flow passages allow the pump to switch to a front-mounted configuration simply by reversing the motor direction.

3. Numerical Simulation Setup

The numerical simulation focuses on the test section of the bidirectional axial flow pump used in the physical model experiment, conducting three-dimensional steady-state calculations for the entire flow field. The computational domain includes the inlet straight pipe section, front guide vanes, impeller, rear guide vanes, outlet elbow section, and outlet straight pipe section. The numerical model was constructed based on the bidirectional bulb axial flow pump test model. The impeller speed was set to 1264 r/min, and the design flow rate was 285 L/s for the numerical simulation.

3.1. Governing Equations

Continuity Equation under Cavitation Conditions [21]:
ρ m t + ( ρ m u j ) x j = 0
Momentum Equation under Cavitation Conditions:
( ρ m u j ) t + ( ρ m u i u j ) x j = p x j + x j μ m + μ t u i x j + u j x j 2 3 u i x j δ i j
ρ m = ρ v α v + ρ l l α v
μ m = μ v α v + μ l l α v
In the above equation, u i and u j represent velocity and pressure, respectively; ρ m and μ m denote the density and viscosity of the water–vapor mixture phase; and α v represents the gas volume fraction.

3.2. Turbulence Model

The SBES (Stress-Blended Eddy Simulation) turbulence model offers significant advantages in computational fluid dynamics. This model uses a shielding function that reduces the influence of grid resolution on the RANS (Reynolds-Averaged Navier–Stokes) solver, particularly within the boundary layer. One of the key strengths of the SBES is its ability to facilitate a rapid and reliable transition between the RANS and LES (Large Eddy Simulation) approaches. To achieve the explicit transition between the two different models, a shielding function (fSBES) is introduced. Meanwhile, the dissipation term in the equation for turbulence kinetic energy in the SBES model is modified as follows [22]:
ρ k t + · ρ U k = · μ + μ t σ k k + P k ρ β * k ω F S B E S
F S B E S = m a x L t C S B E S S B E S 1 f S B E S , 1
L t = k 2 β * ω , S B E S = m a x 3 V c e l l , 0.2 m a x , m a x = m a x x , y , z
where P k is the periodic kinetic energy, C S B E S is the coefficient in the SBES shielding function, L t   is the turbulence scale, m a x is the maximum mesh length-scale (m), V c e l l is the volume of mesh cell, and S B E S is the mesh length-scale in the SBES model (m). In the near-wall region, a low-Reynolds-number model is employed to improve the capture of flow separation phenomena. The rotating component, specifically the impeller, is configured as a rotating part, while all other components are designated as stationary. The interaction between moving and stationary interfaces is managed using an “interface” method to facilitate the transfer of information. This comprehensive approach allows for improved accuracy in simulating complex turbulent flows.

3.3. Cavitation Model

The selection of cavitation models is crucial for the numerical solution of cavitation within pumps. Various cavitation models, such as the Schnerr and Singhal cavitation models, can be derived based on the homogeneous flow assumption and transport equations. According to relevant research [23,24], the ZGB cavitation model, which is based on the simplified Rayleigh–Plesset equation, exhibits good compatibility with various turbulence models and offers high prediction accuracy. It is also more convenient for observing the trajectory of cavitation bubbles, thus making it well suited for predicting cavitation within axial flow pumps. Therefore, this paper selected the ZGB cavitation model to numerically simulate the cavitation conditions of the model pump. The model is formulated as follows [25]:
ρ v α v t + ρ v α v u j x j = m ˙ + m ˙
where m ˙ + and m ˙ represent the evaporation and condensation source terms of the cavitation model, respectively. The corresponding transport equations are as follows:
m ˙ + = F v a p 3 ρ v α n u c 1 α v R b 2 3 p v p ρ l , i f p < p v m ˙ = F c o n d 3 ρ v α v R b 2 3 p p v ρ l ,               i f p > p v
α n u c represents the volume fraction with a value of 5 × 10 4 ; R b is the bubble radius at the nucleation site, set at 10 6   m ; F v a p and F c o n d denote the evaporation and condensation coefficients of vapor, respectively, taken as 50 and 0.01; and p v is the saturation vapor pressure corresponding to the local temperature. The saturation vapor pressure was determined to be 5033.5 Pa based on the temperature T = 35 °C measured by a temperature sensor during the experiment. Considering the influence of pulsating pressure in the flow field on cavitation calculations, the pulsating pressure p t u r b is introduced to correct p v . This correction is implemented through a custom formula embedded using the secondary development functionality of CFX. The corrected formula is as follows:
p v , = p v + p t u r b 2
p t u r b = 0.39 ρ m k
where k represents the local turbulent kinetic energy, and ρ m denotes the gas–liquid mixture density.

3.4. Numerical Simulation Calculation Setup

ANSYS CFX computational software was employed to solve and calculate the internal three-dimensional flow field of the vertical axial flow pump device model. The model conditions were set as follows: the inlet of the model was given a mass flow rate, while the outlet was set to total pressure. All solid wall boundaries were defined as smooth, no-slip boundaries. The impeller body was designated as the rotating domain, while the remaining parts formed the stationary domain. The interfaces between the impeller and the inlet cone support, as well as between the impeller and the guide vanes, were defined as rotor–stator interfaces, utilizing the Frozen-rotor interface for data transfer.

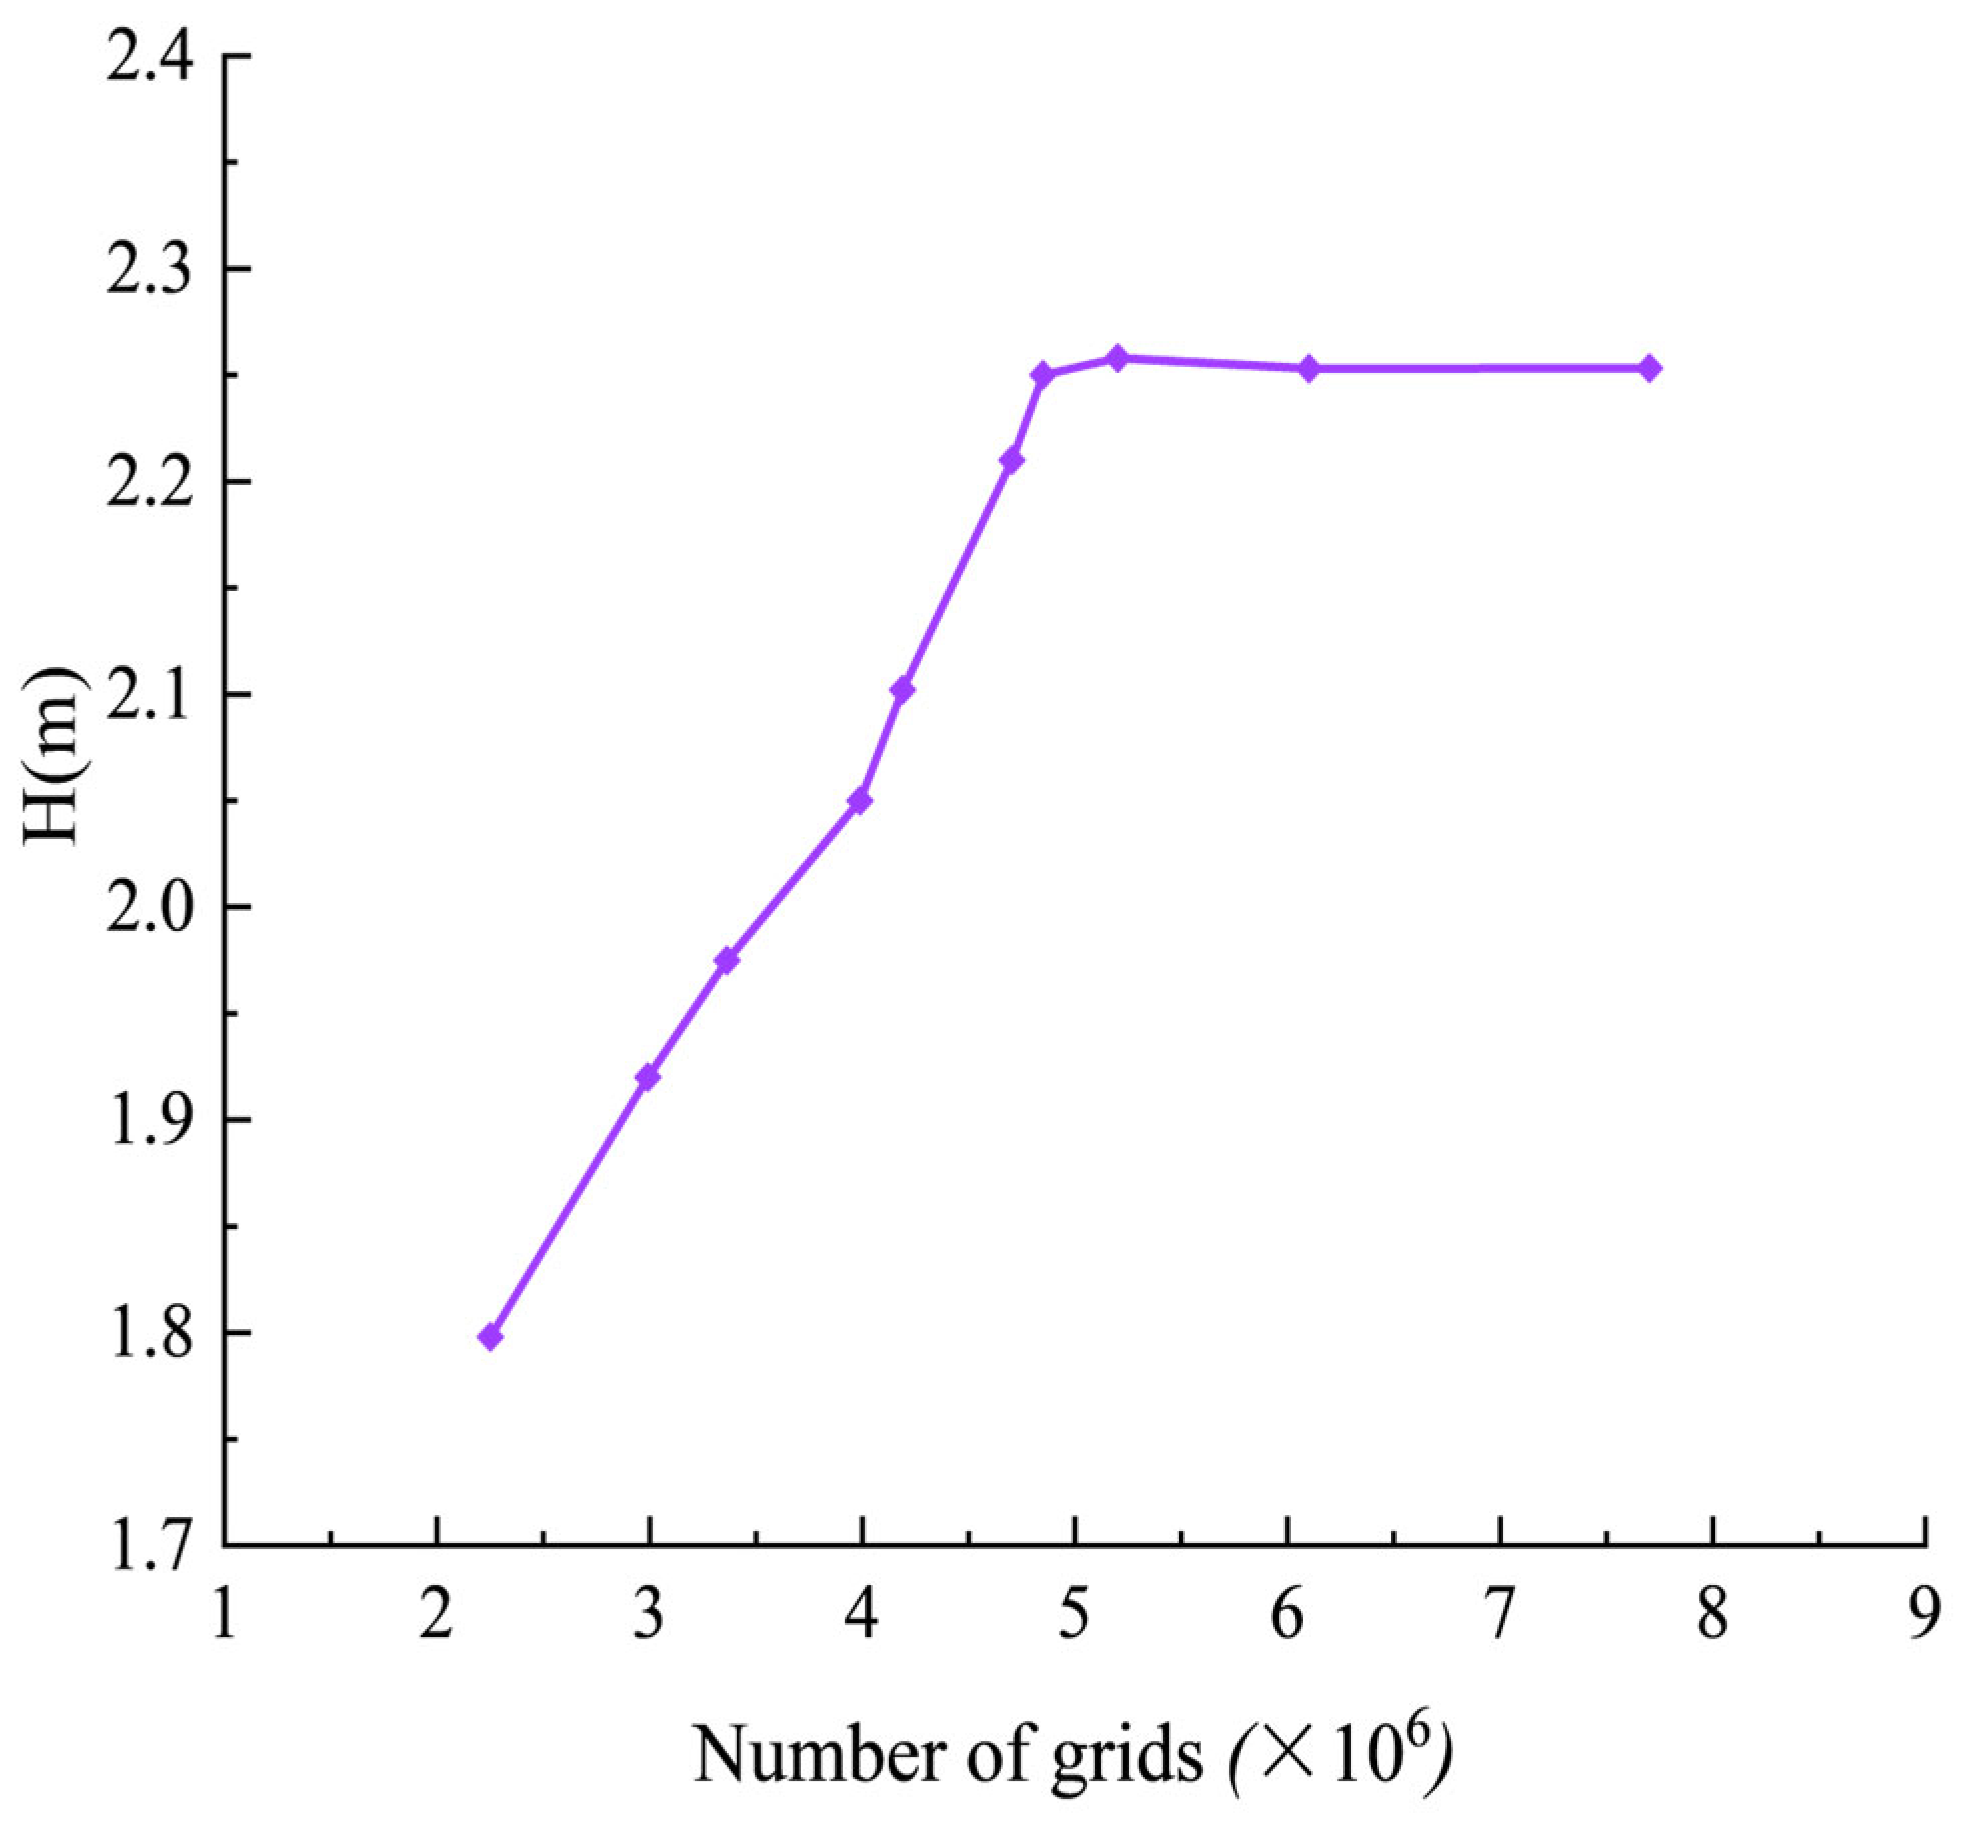
3.5. Grid Independence Analysis

In this study, a fully hexahedral structured grid was employed for the bidirectional bulb tubular pump system. The inlet and outlet flow passages of the straight pipe and the bulb body were meshed using ICEM-CFD software with a grid quality maintained above 0.5, The straight pipe inlet and outlet flow passages, along with the bulb body, are shown in Figure 2. The guide vane and impeller sections were meshed using Turbo-Grid, ensuring that the grid quality met the computational accuracy requirements. The typical guide vane and impeller mesh diagrams are shown in Figure 3. In order to accurately calculate the flow near the boundary layer, the Blasius formula was adopted to calculate the height of the first mesh layer near the wall surface within the fluid domain:
y = 6 y + L r e f 2 1 8 ρ V r e f μ 7 8
In the above equation, y is the height of the first mesh layer near the wall surface, m; y + denotes dimensionless mesh evaluation parameters;
L r e f is the reference length, m; V r e f is the characteristic reference speed, m/s;
ρ is the liquid density, kg/m3; and μ is the dynamic viscosity of the liquid, Pa·s.
With the grid quality kept essentially unchanged, an initial grid count of 2.35 million was chosen for the baseline case, and a grid independence analysis was conducted at the design flow rate of 285 L/s. Ten different grid schemes were utilized for the numerical calculations of the pump system until the pump head stabilized, as shown in Figure 4. This figure illustrates the relationship between the grid count and H, representing the hydraulic head. When the grid count increases from 5.46 million to 7.96 million, the pump head fluctuates by approximately 1%. Considering both computational accuracy and efficiency, the final grid count for both steady and unsteady calculations was set at 5.46 million.

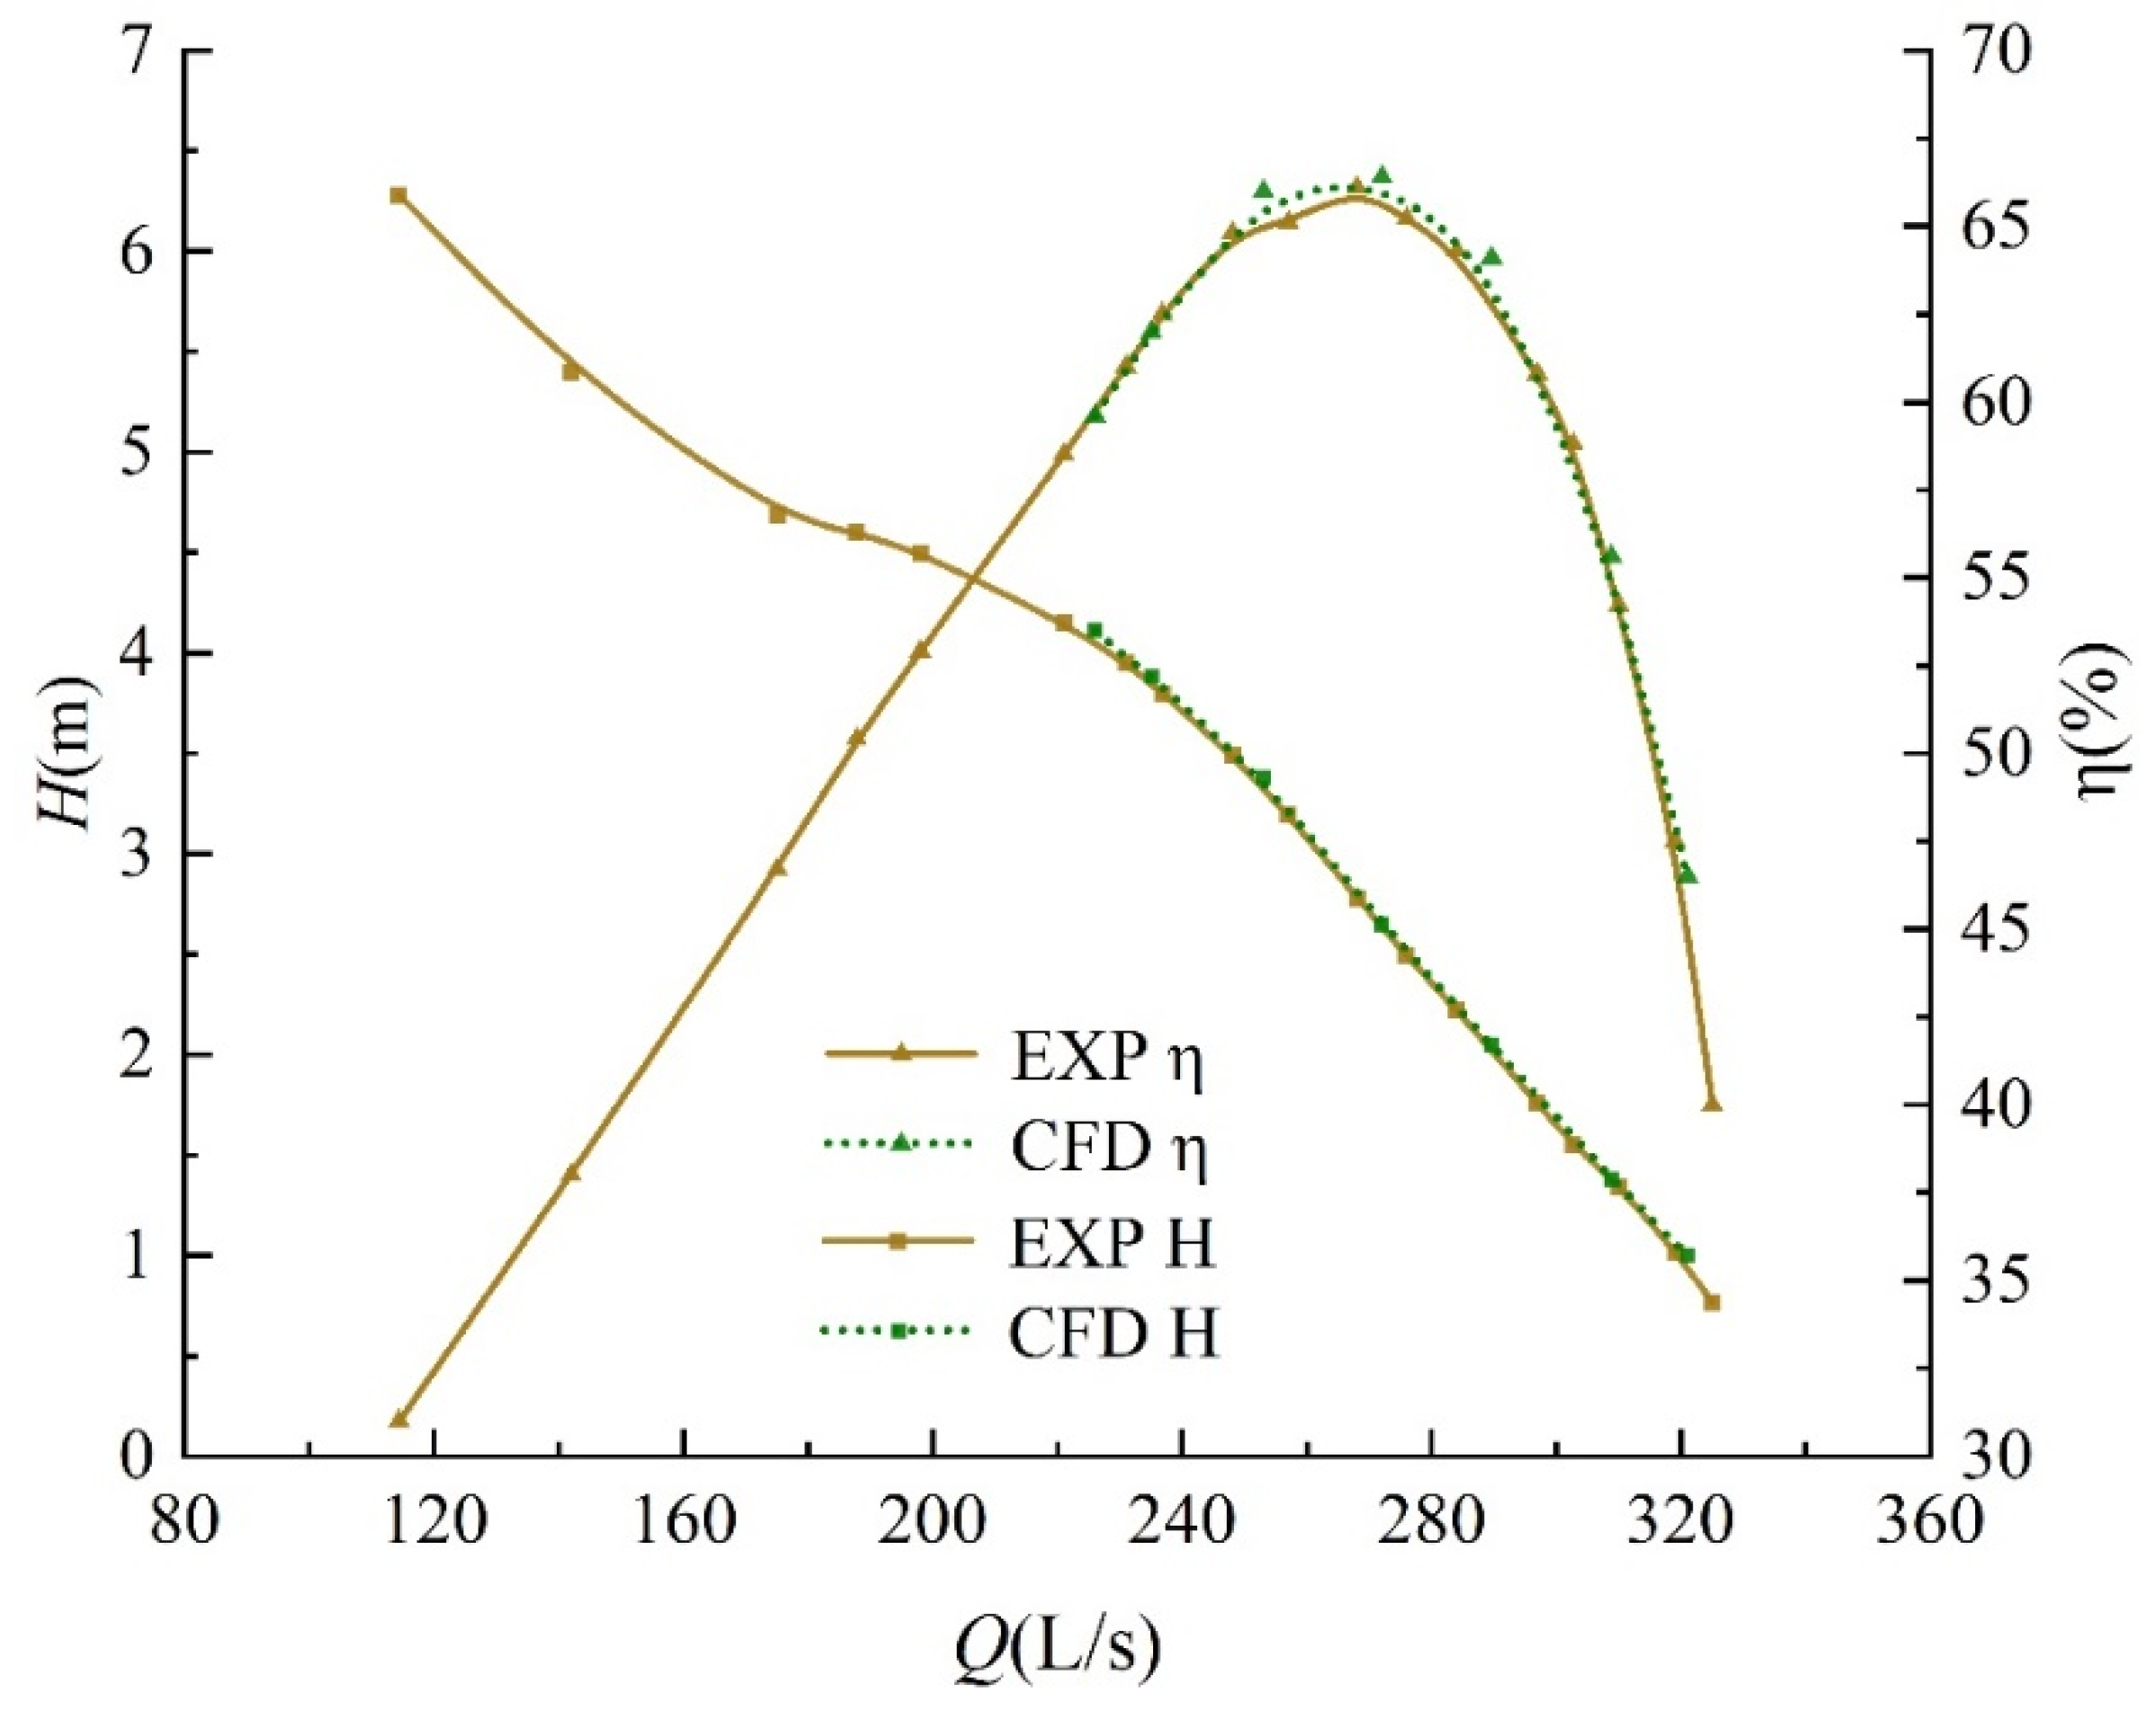
3.6. Verification of the Accuracy of External Characteristic Curves and Numerical Simulations

When the pump system operates in the forward direction, a comparison of the head curves in Figure 5 shows that the numerical simulation results are slightly higher than the experimental results. Under low-flow-rate and high-flow-rate conditions, the model test and numerical simulation results are basically in agreement. Through comparisons of the efficiency curves, it is found that under design-flow-rate and high-flow-rate conditions, the numerical simulation results are slightly higher than the experimental results; under low-flow-rate conditions, the efficiencies of both are basically the same. In design conditions, the experimental efficiency is above 65.5%, and the numerical simulation efficiency is slightly higher than the experimental value by approximately 0.5%. Overall, there is a high degree of agreement between the two, with differences in head and efficiency within 3%, meeting the requirements for calculation accuracy.

4. Results and Analysis

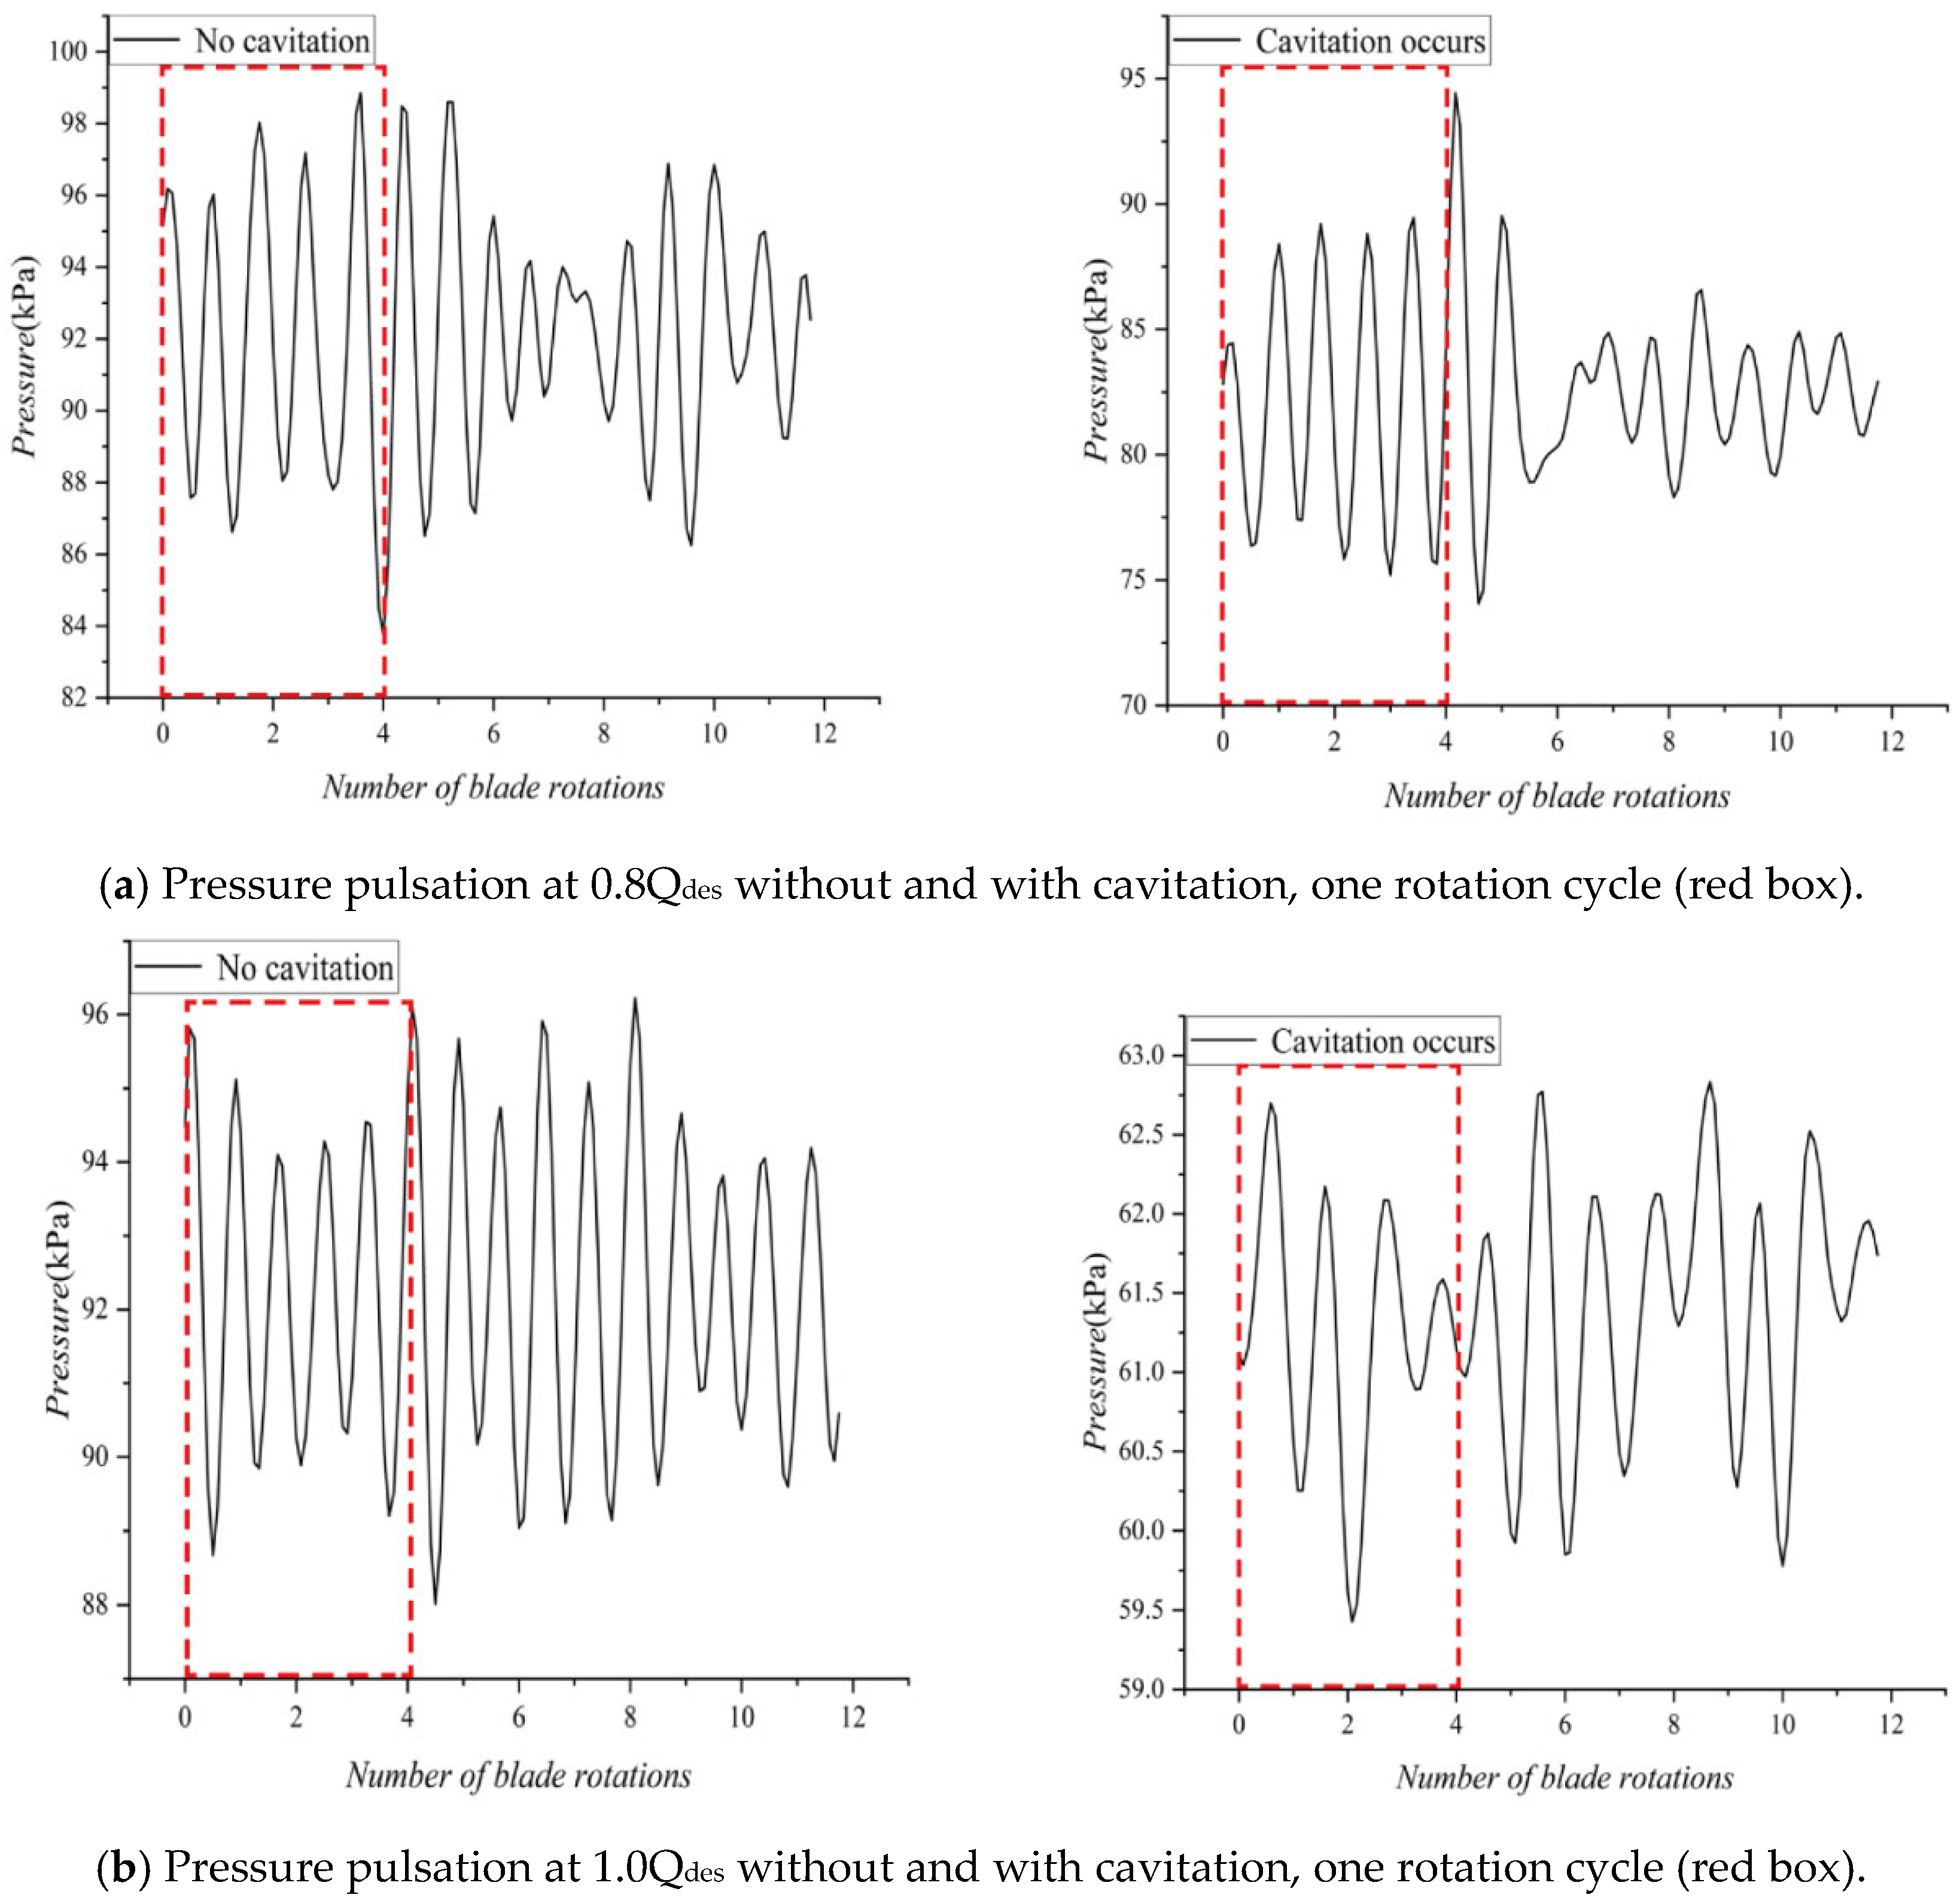
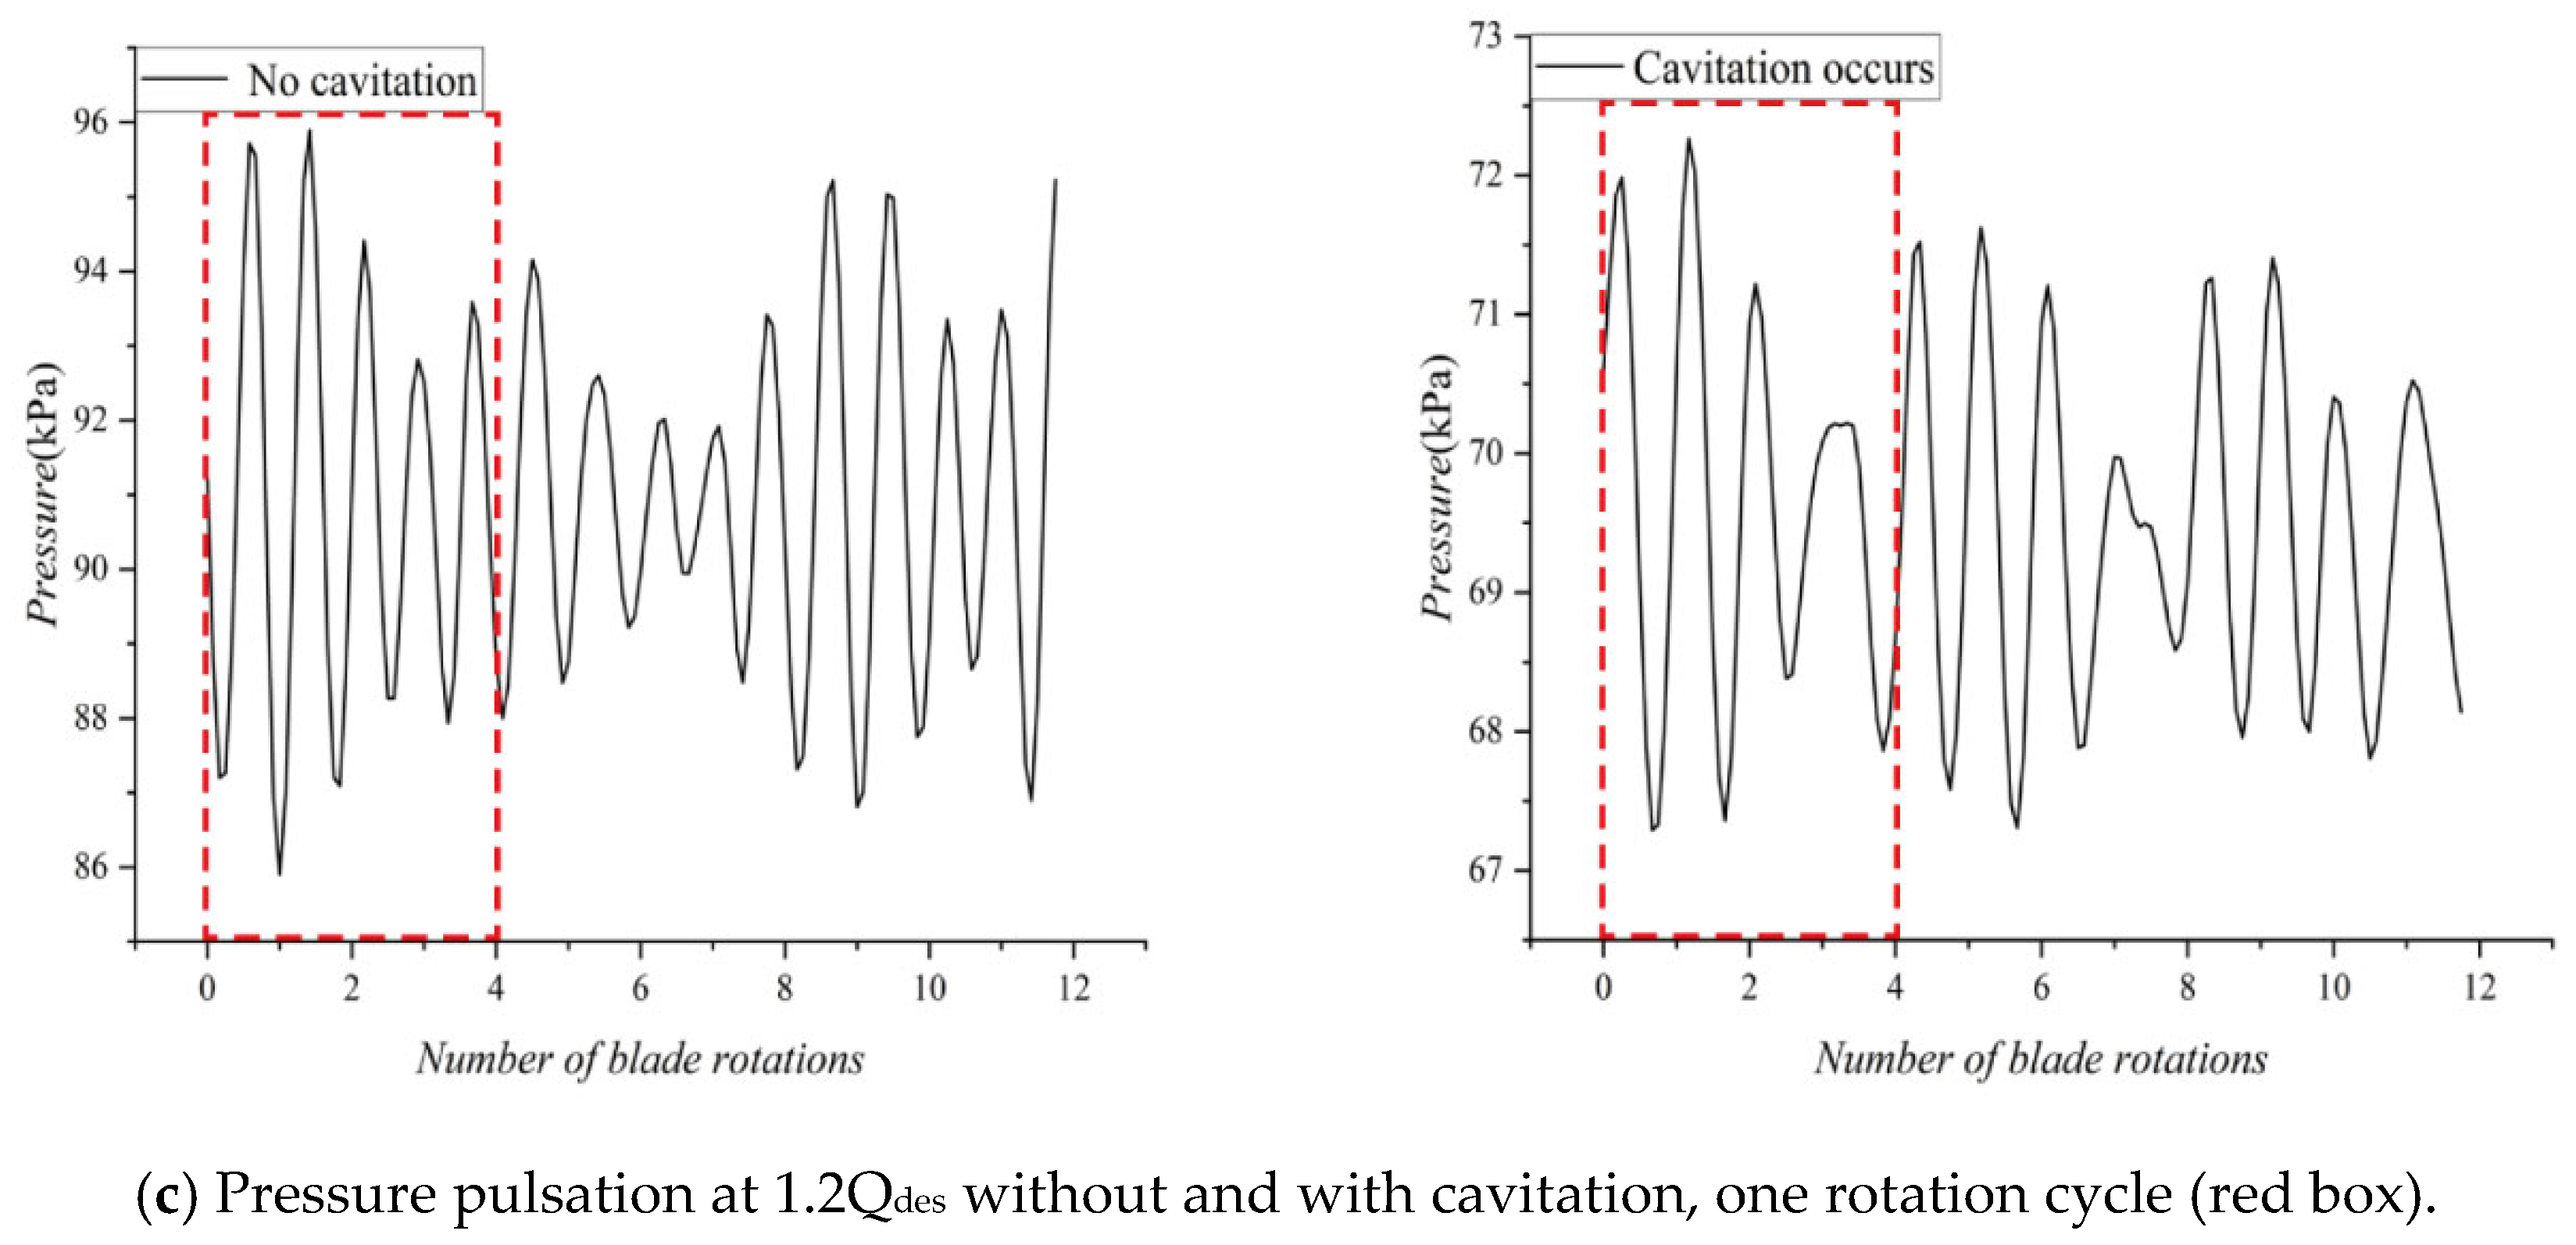
4.1. Time-Domain Analysis of Pressure Pulsation

When cavitation occurs within the impeller of an axial flow pump, there should theoretically be significant differences in the time domain of pressure pulsation. In Table 2, the experimental parameters for selected cavitation and non-cavitation conditions are presented. Figure 6 illustrates the time domain of pressure pulsation under different flow rates for two cavitation states. In the captions of Figure 6a–c, Qdes stands for the design-flow condition, while 0.8Qdes and 1.2Qdes represent the low-flow and high-flow conditions. The impeller speed is 1264 r/min, with a time duration of approximately 0.04747 s, and the number of blades is four, implying that every four waves constitute one cycle.
As shown in Figure 6, under non-cavitating conditions, the time-domain signals of pressure pulsation exhibit five peaks within one rotation cycle across three different flow rates, with consistent waveforms and a maximum difference between peaks not exceeding 5 kPa.
When cavitation occurs, the number of peaks within one cycle of time-domain pressure pulsation changes from five to four across the three flow rates, indicating an enhancement of pressure pulsation induced by the impeller and a reduction in pressure pulsation caused by the front guide vane, suggesting the presence of rotor–stator interaction. Additionally, the overall peak values of pressure pulsation decrease after cavitation occurs compared to those without cavitation. At lower flow rates, the pressure pulsation signal remains stable. At the design flow rate, there is little variation between peaks; at high flow rates, the signal no longer exhibits periodicity.
Figure 6 shows that based on the observation of pressure pulsation in the time domain, it is evident that cavitation within the pump leads to rotor–stator interaction, which affects pressure pulsation. However, it is challenging to clearly distinguish the individual effects of cavitation and rotor–stator interaction on pressure pulsation solely from the time-domain plots. Therefore, to accurately assess the impacts of cavitation and rotor–stator interaction on pressure pulsation, we conducted a frequency-domain analysis on pressure pulsation data collected at four positions.

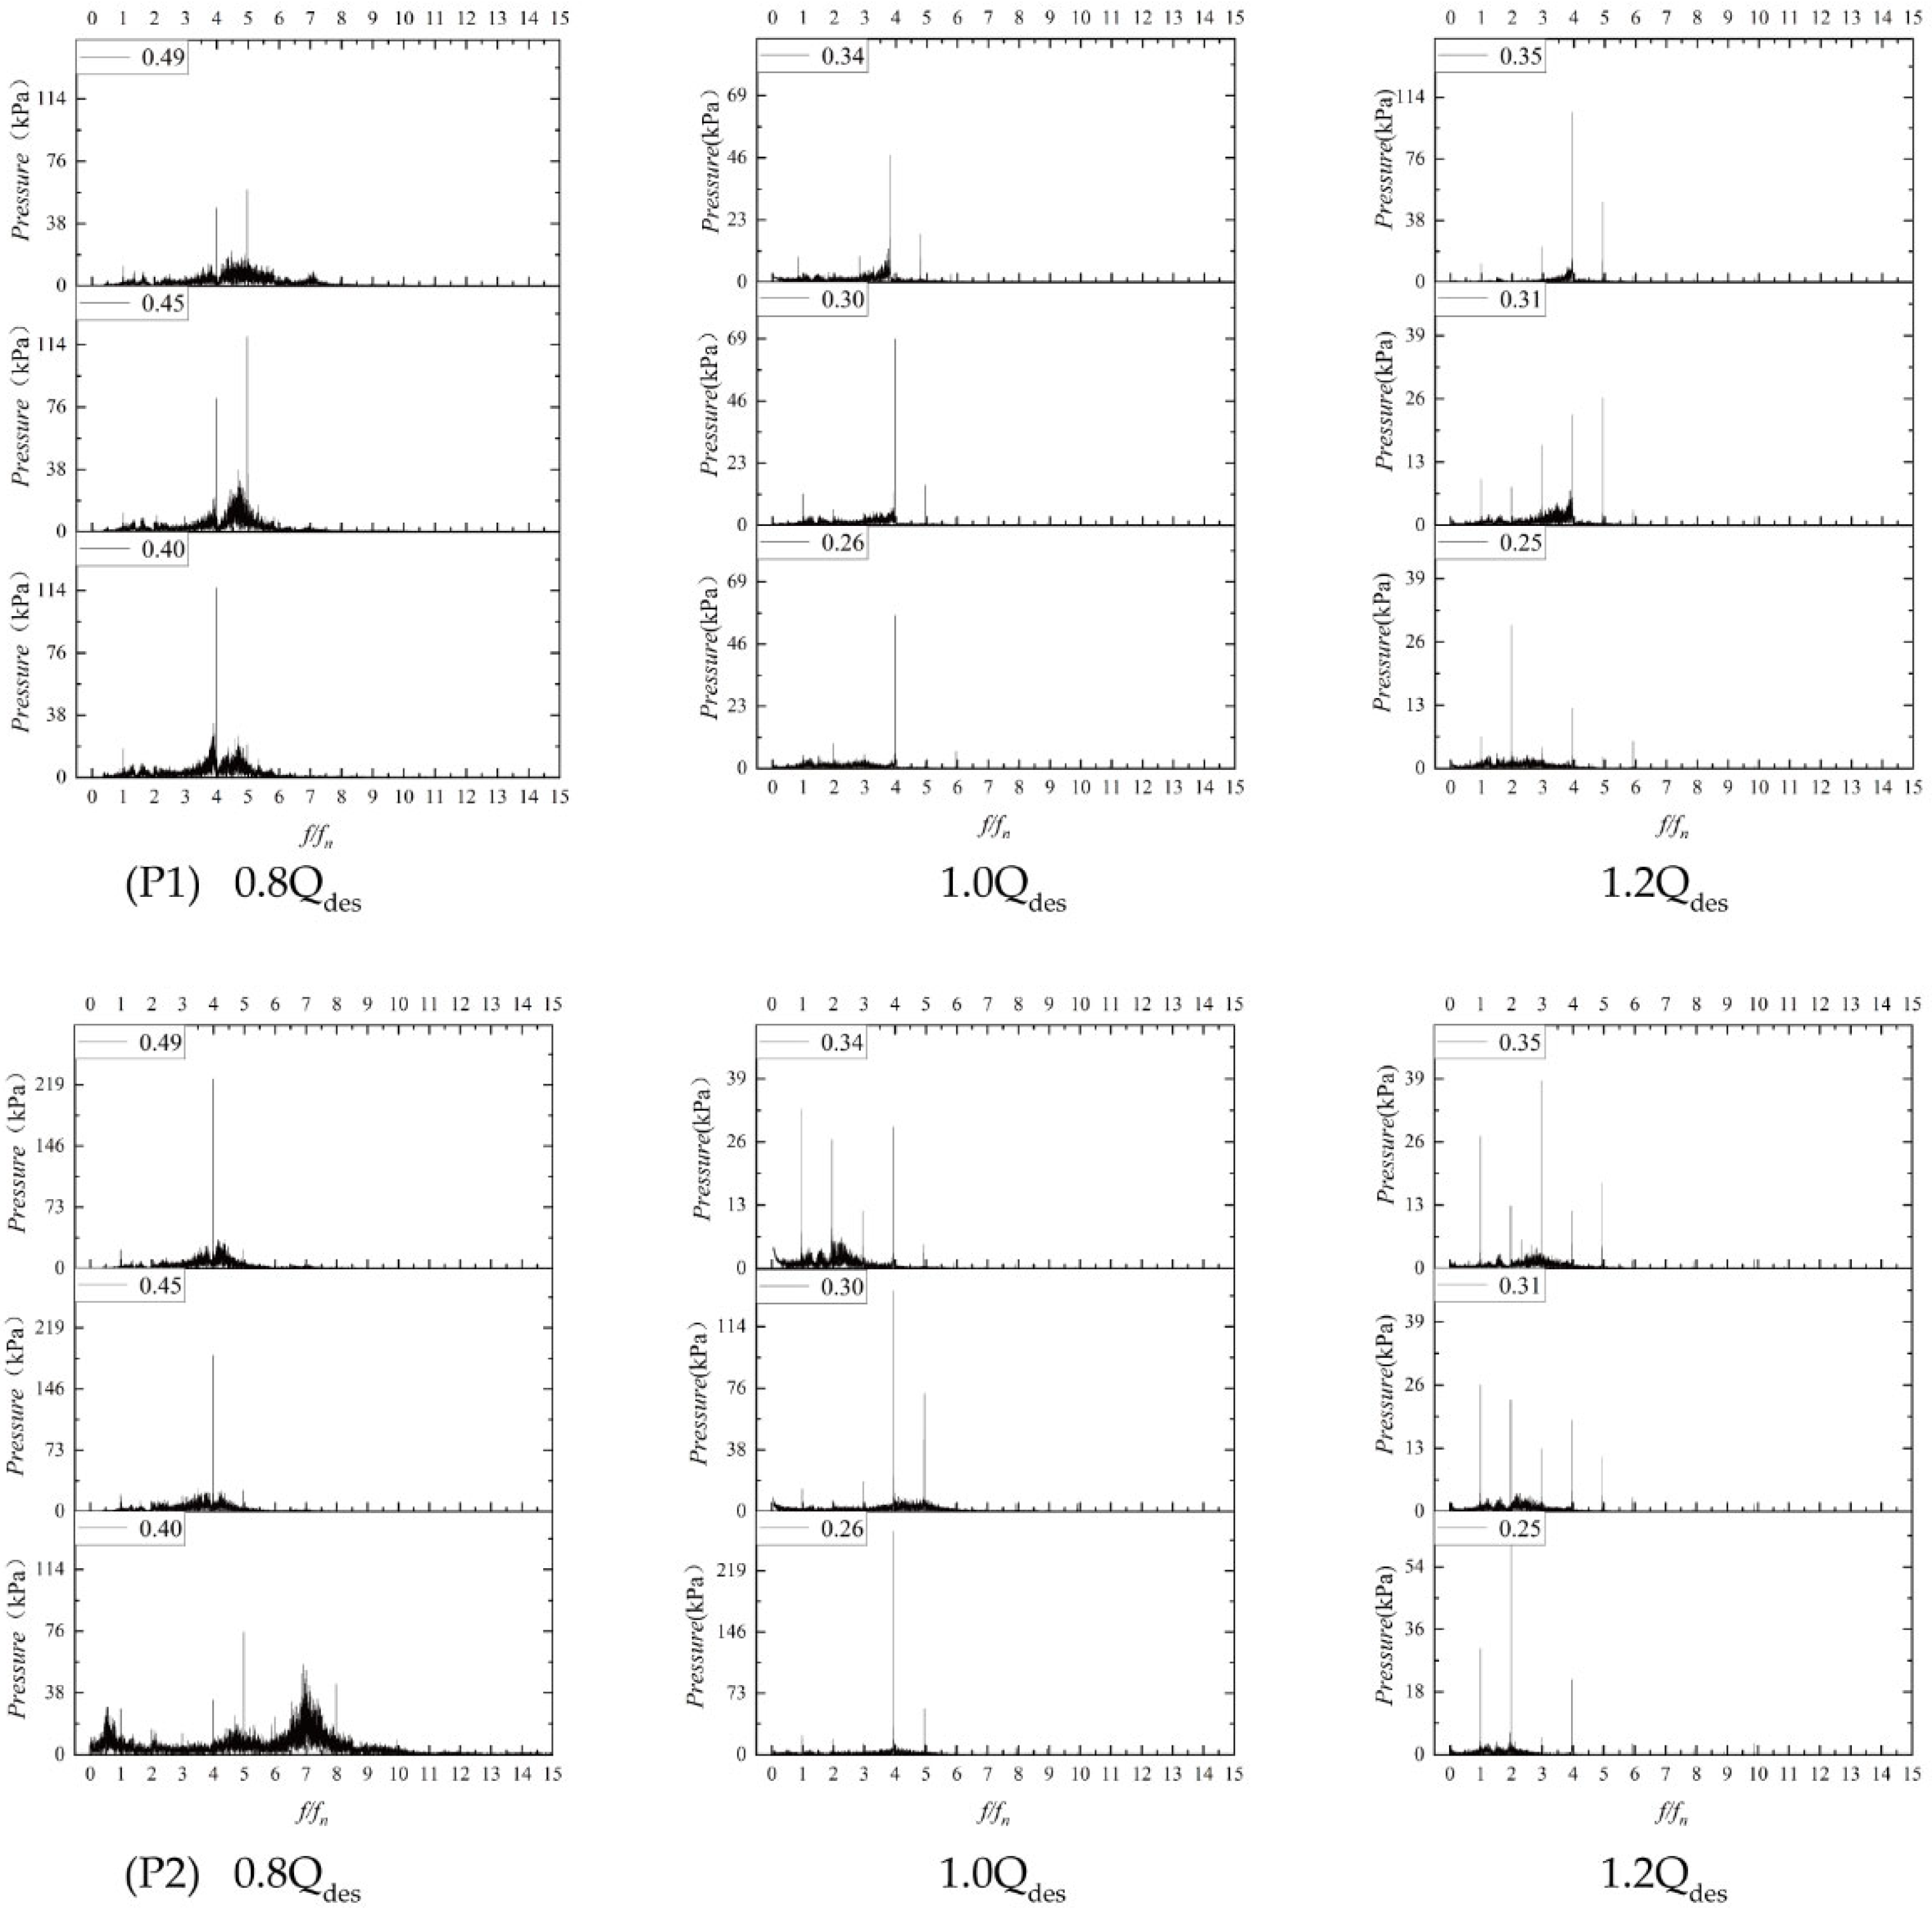
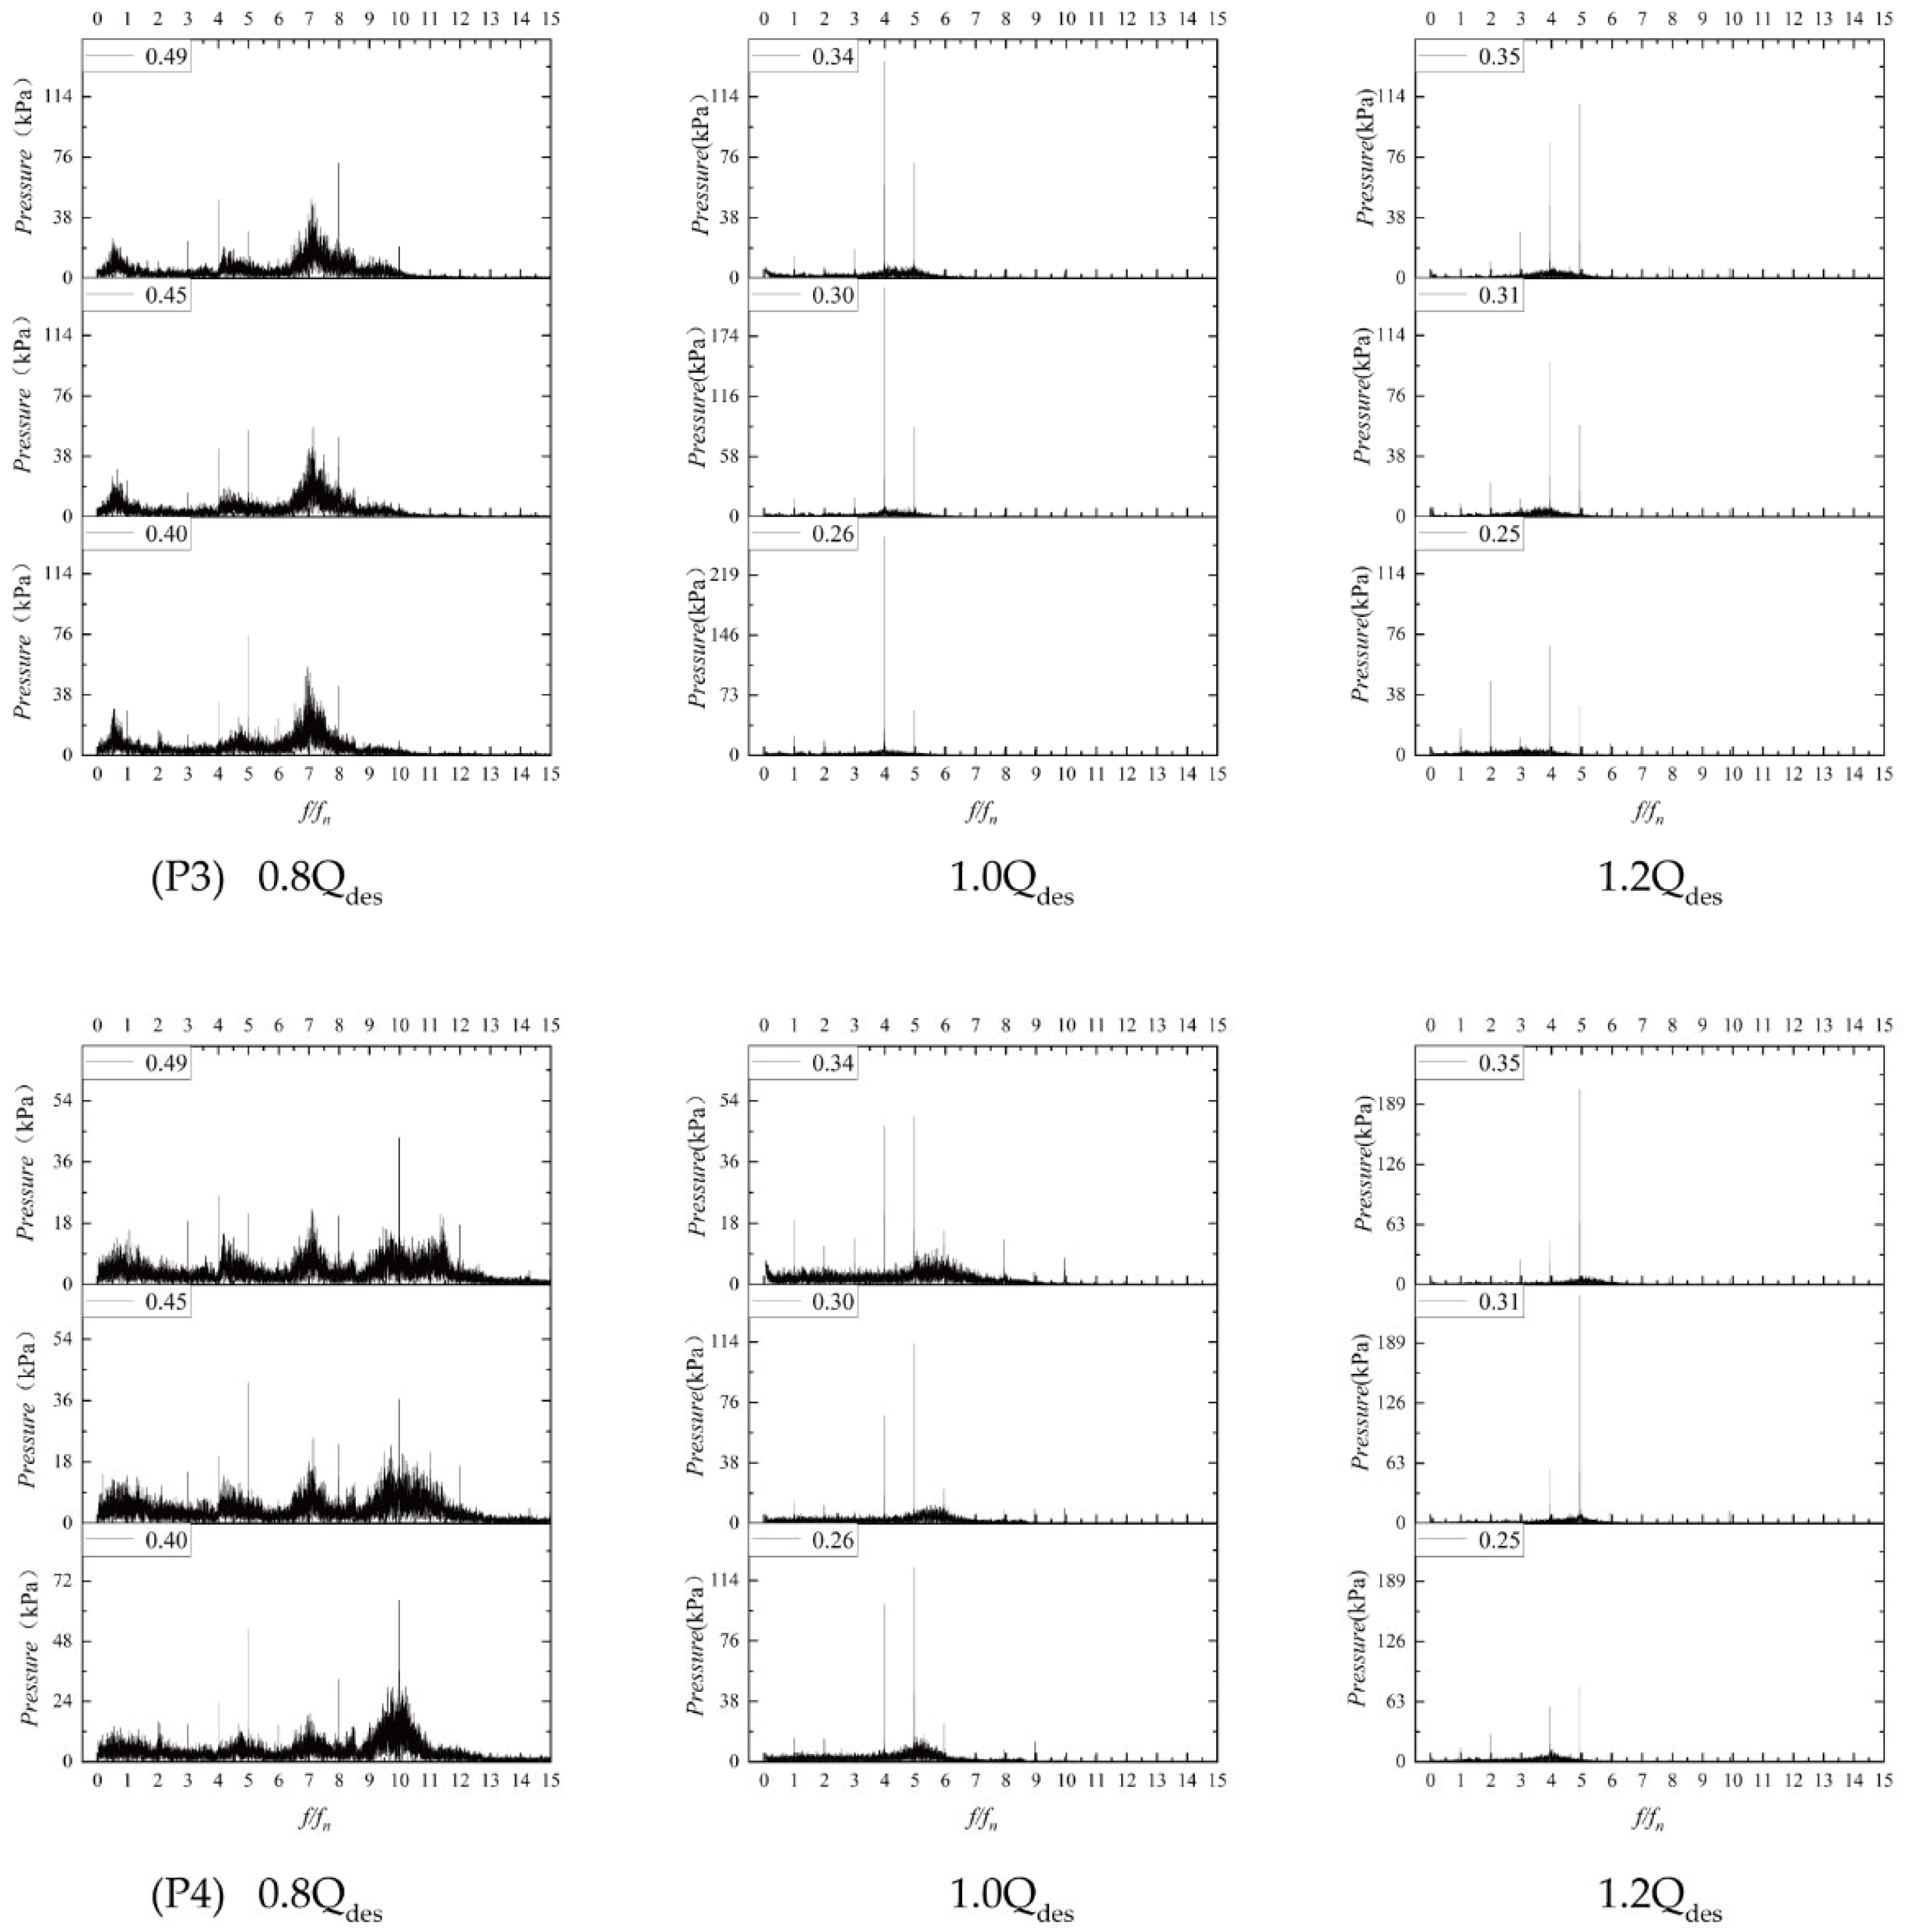
4.2. Analysis of Pressure Pulsation

Through the utilization of pressure sensors, pressure pulsations at various monitoring points under different cavitation numbers were collected. Specifically, Monitoring Point 1 is located at the inlet of the guide vane, Monitoring Point 2 at the inlet of the impeller, Monitoring Point 3 at the outlet of the impeller, and Monitoring Point 4 at the outlet of the rear guide vane. After the inlet head data were obtained, the cavitation number was derived through the following formula:
σ = P 0 P v 0.5 ρ v 0 2
where P 0 is the inlet pressure (Pa), P v is the cavitation pressure of water at 25 °C (Pa), and v 0 is the linear velocity of the impeller.
Given the pump’s rotational speed of 1264 r/min, the rotational frequency is 21 Hz. After the frequencies are non-dimensionalized, one unit in the figures represents one multiple of the rotational frequency. Figure 4 and Figure 5 present the frequency-domain diagrams of four monitoring points for a bidirectional axial flow pump with a guide vane angle of 20°, a blade angle of 0°, and a design flow rate of 285 L/s operating in the forward direction under varying flow rates. In combination with the above-mentioned figures, it is evident that the dominant frequency of pressure pulsation corresponds to the blade passing frequency, with the secondary frequency being its multiple.
It can be observed that Monitoring Point 1 in Figure 7, located at the inlet of the front guide vane and unaffected by the impeller, should theoretically have the five guide vane rotational frequency (5fBPF = 105 Hz, where BPF denotes blade passing frequency) as the dominant frequency. However, under all three flow conditions, the occurrence of cavitation leads to a significant reduction in the amplitude of the 5fBPF, which is either the dominant or secondary frequency, and the 2fBPF or 4fBPF becomes the dominant one. This phenomenon is particularly evident under lower-flow conditions. At Point 1, when the cavitation number decreases from 0.45 to 0.40, the amplitude of the originally dominant 5fBPF almost disappears, and the 4fBPF becomes the dominant one. Meanwhile, at Point 2, located at the impeller inlet under low-flow conditions, the dominant frequency should be the impeller frequency (4fBPF). However, as the cavitation number decreases, the dominant frequency shifts to the guide vane frequency (5fBPF). The exchange of dominant frequencies at Points 1 and 2 after the onset of cavitation indicates a rotor–stator interaction phenomenon occurring in the FVP between the front guide vane and the impeller, leading to a mutual transformation of the dominant frequencies at these two points and affecting the operational stability.
Under design-flow conditions, the phenomenon caused by rotor–stator interaction is less pronounced compared to low-flow conditions. This is because the flow pattern is relatively stable under design-flow conditions, reducing the influence of the guide vane frequency (5fBPF) on pressure pulsations. Under high-flow conditions, Points 1 and 2 exhibit significant pressure pulsation amplitudes at low frequencies. This may be attributed to more severe cavitation on each blade of the impeller under high-flow conditions, generating stronger pressure pulsations. As the impeller rotates and each blade passes the monitoring points, these pulsations are detected, resulting in a large number of low-frequency components.
It can be observed from Figure 8 that the overall pressure pulsation amplitudes at Points 3 and 4 increase under low-flow conditions, due to the axial velocity of the fluid decreasing while the convective velocity remains constant under lower-flow conditions according to the velocity triangle. As a result, the flow attack angle of the impeller increases. The fluid cannot flow in without impact, causing the fluid within the impeller to collide with the back of the blades and generating significant velocity circulation at the impeller outlet. This leads to the deterioration of the internal flow field of the pump. Additionally, as cavitation intensifies under low-flow conditions, the dominant and secondary frequencies of pressure pulsations at Point 3 shift from 4fBPF and 8fBPF rotational frequencies to 5fBPF, indicating the presence of rotor–stator interaction in the RVP between the impeller and the rear guide vane. In contrast, the dominant and secondary frequencies at Point 4 remain at 5fBPF and 10fBPF rotational frequencies, as the rear guide vane stabilizes the flow field exiting the impeller, mitigating the impact of rotor–stator interaction.
Under design-flow conditions, RVP is influenced by the impeller’s rotating outlet, with the dominant frequency remaining at 4fBPF, while the outlet of the rear guide vane is affected by the rear guide vane, with the dominant frequency at 5fBPF. This suggests that rotor–stator interaction has a minimal impact on pressure pulsations under design-flow conditions. Under high-flow conditions, rotor–stator interaction has little effect on the amplitude of the dominant frequency. However, as the cavitation number decreases, the amplitude of the dominant frequency also decreases. The reduction in amplitude may result from severe cavitation enveloping the blades under high-flow conditions, making it difficult for pressure pulsations to dissipate.
Based on a comprehensive analysis of Figure 7 and Figure 8, both the FVP and RVP exhibit rotor–stator interaction as the cavitation number decreases. The amplitude of their dominant frequencies is affected to varying degrees. The impact of rotor–stator interaction on pressure pulsations is more significant in the FVP, likely because the front guide vane does not stabilize the flow field but rather contributes to its deterioration. Furthermore, since the FVP is less influenced by the impeller compared to the RVP, the effect of rotor–stator interaction on pressure pulsations becomes more prominent. Simultaneously, due to the effect of dynamic–static interference, the pressure fluctuation formed in the vaneless zone of the pump propagates in two directions: when it propagates downstream toward the subsequent guide vane along the flow direction, it does not result in a significant increase in abnormal amplitudes of pressure fluctuation; however, when it propagates upstream from the impeller to the front guide vane against the flow direction, it causes an increase in pressure fluctuation in the upstream region. To verify the explanation for the more significant impact of rotor–stator interaction in the FVP under lower-flow conditions, this study conducted unsteady computations on the pump at a 0.8Qdes flow rate and at cavitation numbers of 0.45 and 0.40, analyzing the flow field and cavitation.

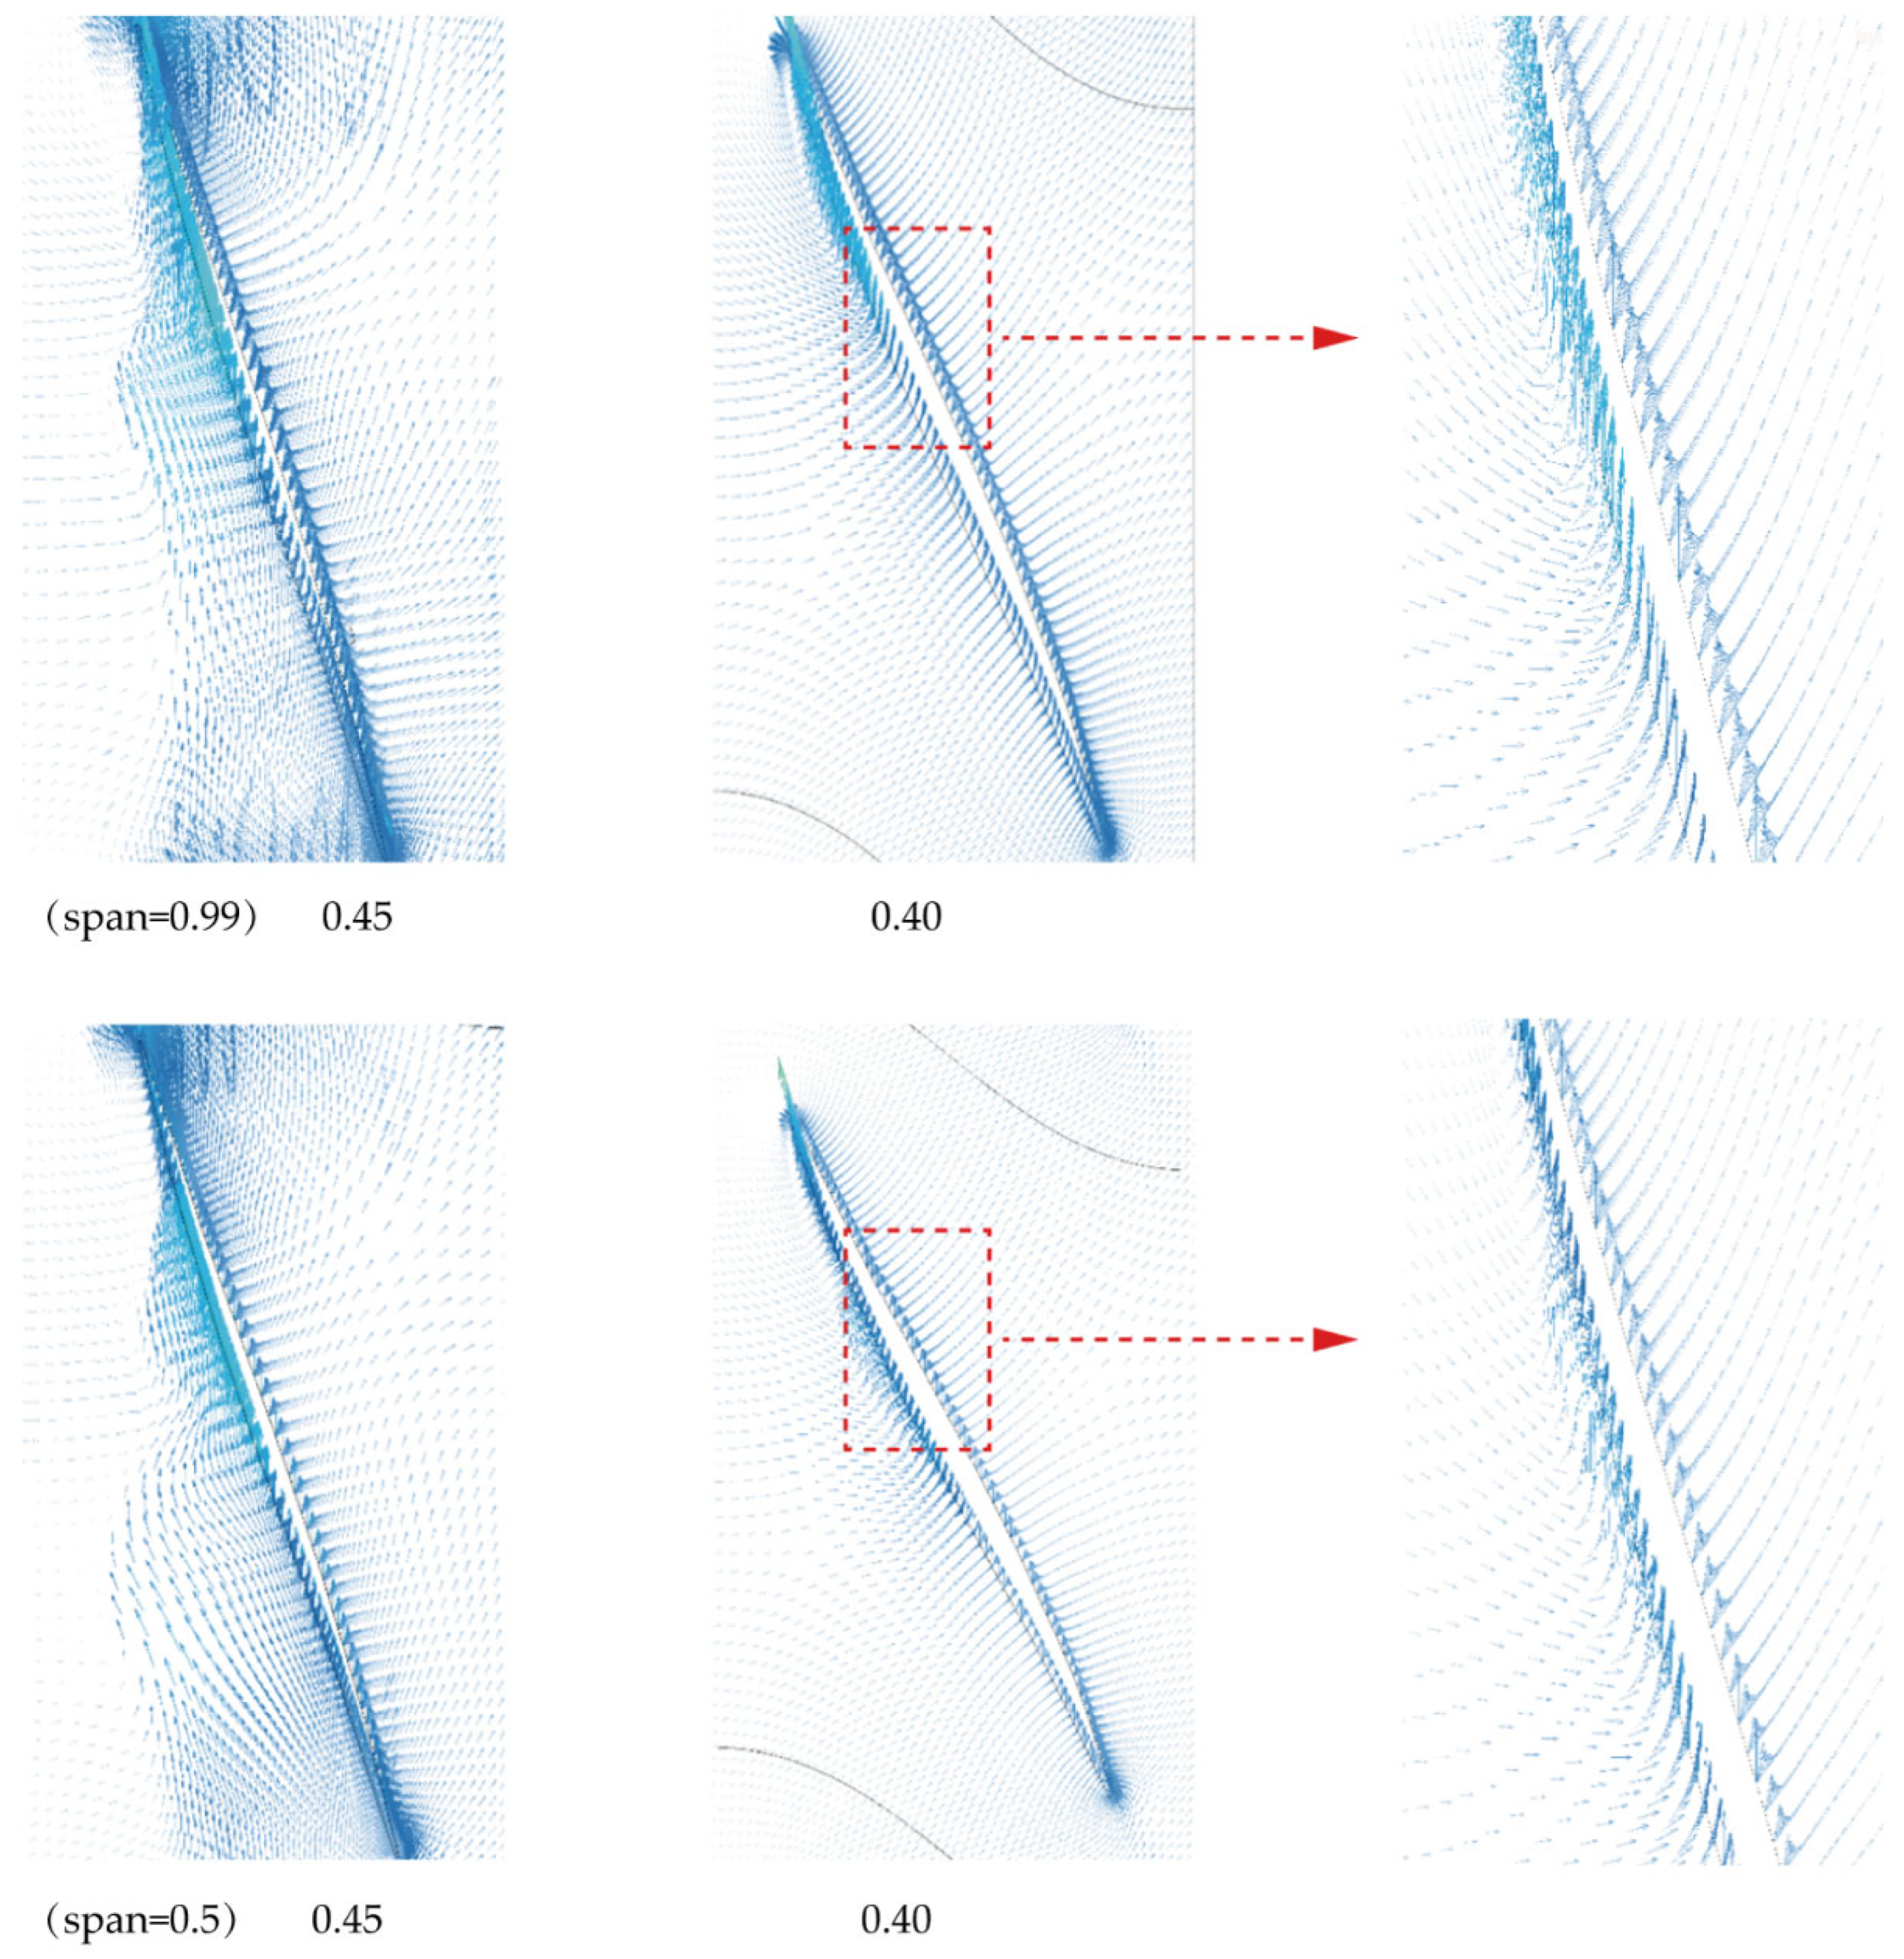
4.3. Analysis of Flow Field at Low Flow Rates

There is a close correlation between the pressure pulsation and the internal flow field characteristics of the bidirectional axial flow pump. To further analyze the impact of the inlet guide vane on the internal flow field of the tubular pump, the developed views of the impeller and the inlet guide vane at cavitation numbers of 0.45 and 0.40 were extracted for analysis in Figure 9 and Figure 10. In Figure 10, “span” represents the proportional distance from the hub.
The water flow within the tubular pump is expected to enter the impeller in a straight and smooth manner from the inlet passage. However, after passing through the inlet guide vane, both the flow fields with and without cavitation exhibit deflection and curvature as shown in Figure 9, indicating that the flow field is disturbed by the inlet guide vane. This disturbance results in the streamline direction undergoing deflection, preventing the fluid from entering the impeller smoothly. In Figure 10, at the impeller hub, after the onset of cavitation, the flow lines entering the back of the impeller change from the original three-segment inflow to a two-segment inflow, suggesting that the flow field after cavitation is more dramatically altered compared to the non-cavitating flow. The flow pattern deteriorates upon cavitation, with significant backflow and vortices emerging. In Figure 10, at the mid-section of the blade, the streamlines in the non-cavitating flow field appear highly regular. However, after the onset of cavitation, the flow field within the red box in Figure 10 exhibits deflection within a certain range, indicating the partial deterioration of the flow field due to the generation and detachment of cavitation. The analysis of the flow field corroborates the reason why rotor–stator interaction within the FVP has a more significant impact on pressure pulsation, as discussed in the previous section.
As shown in Figure 11, when the cavitation number is 0.45, cavities first appear on the suction side of the blade near the hub, occupying approximately one-quarter of the entire blade area. At this stage, the cavity shape resembles a triangle, with a higher volume fraction of cavities observed at the blade tip. As cavitation intensifies, the cavities rapidly expand to cover half of the blade area, widening toward both the hub and the shroud, and transitioning from a triangular to a trapezoidal distribution. The volume fraction of cavities increases significantly and shifts from the core region toward the outlet. During this process, cavities near the hub remain relatively stable and attached to the blade, while those at the shroud continuously form and detach, resulting in a serrated edge. This phenomenon corresponds to the disordered flow field lines within the impeller, as shown in Figure 10 (span = 0.5).

5. Conclusions

This paper employed a combined approach of experimental testing and numerical simulation to analyze the pressure pulsations of a bidirectional submerged axial flow pump under various operating conditions. Through time–frequency-domain analysis and flow field analysis, the influence of cavitation on dynamic–static interaction was investigated. The main conclusions are as follows:
(1)
Through the analysis of pressure pulsation data obtained from experiments at different locations before and after cavitation, it is observed that the emergence of cavitation enhances the rotor–stator interaction effect. Under certain operating conditions, the dominant and secondary frequencies observed before cavitation may switch under the influence of rotor–stator interaction after cavitation occurs;
(2)
As indicated by an analysis of the amplitude of the dominant frequency in the pressure pulsation frequency domain, rotor–stator interaction occurs in both the FVP and RVP. It has a more pronounced effect on pressure pulsation in the FVP compared to the RVP, particularly under low-flow conditions.
(3)
Through numerical simulation of the flow field, the presence of the front guide vanes in a bidirectional submerged tubular pump causes a certain deviation in the flow field during forward operation, resulting in unstable and non-smooth flow into the impeller, which exacerbates rotor–stator interaction within the FVP.
The analysis of pressure pulsations reveals that the impact of dynamic–static interaction on the dominant frequency of pressure pulsations is less significant under high-flow conditions compared to low-flow conditions, and a substantial amount of low-frequency components are observed in the FFT power spectrum. Further flow field analysis or numerical simulations are required to delve deeper into the pressure pulsations and flow characteristics within high-flow conditions in future research. The analysis of pressure pulsations under high-flow conditions reveals that the impact of dynamic–static interference on the amplitude of the dominant frequency is relatively insignificant. Additionally, as the cavitation number decreases, the amplitude of the dominant frequency diminishes, and a phenomenon emerges where the low-frequency components become the dominant ones. In future work, a high-speed camera will be utilized to capture the cavitation flow phenomena around the blades with high frequency and high resolution. This will enable the analysis of cavitation in different forms around the blades. Simultaneously, numerical simulations will be conducted to study the pressure contours on the impeller blades and the nearby flow field.

Author Contributions

Methodology, W.D.; Software, H.L. and S.Y.; Investigation, S.Y.; Resources, D.S.; Data curation, X.Y.; Writing—review & editing, Y.Z.; Visualization, J.H. All authors have read and agreed to the published version of the manuscript.

Funding

This research was funded by Engineering Research Center of High-efficiency and Energy-saving Large Axial Flow Pumping Station grant number ECHEAP002 and 2023 Jiangsu Graduate Research and Practical Innovation Project grant number 1867. The APC was funded by Wenyong Duan.

Institutional Review Board Statement

Not applicable.

Informed Consent Statement

Not applicable.

Data Availability Statement

The data in this article cannot be shared.

Conflicts of Interest

Shikai Yan was employed by the company Nanjing Water Planning and Designing Institute Corp. The remaining authors declare that the research was conducted in the absence of any commercial or financial relationships that could be construed as a potential conflict of interest.

References

  1. Adu, D.; Jianguo, D.; Darko, R.O.; Boamah, K.B.; Emmanuel, A. Investigating the state of renewable energy and concept of pump as turbine for energy generation development. Energy Rep. 2020, 6 (Suppl. S6), 60–66. [Google Scholar] [CrossRef]
  2. Chen, J.; Huang, W. Risk and countermeasures of across river basins and long distance water transfer project. China Water Resour. 2006, 24, 11–14. [Google Scholar]
  3. Cavazzini, G.; Houdeline, J.B.; Pavesi, G.; Teller, O.; Ardizzon, G. Unstable behaviour of pump-turbines and its effects on power regulation capacity of pumped-hydro energy storage plants. Renew. Sustain. Energy Rev. 2018, 94, 399–409. [Google Scholar] [CrossRef]
  4. Feng, W.; Cheng, Q.; Guo, Z.; Qian, Z. Simulation of cavitation performance of an axial flow pump with inlet guide vanes. Adv. Mech. Eng. 2016, 8, 1–8. [Google Scholar] [CrossRef]
  5. Lu, J.; Yuan, S.; Parameswaran, S.; Yuan, J.; Ren, X.; Si, Q. Investigation on the vibration and flow instabilities induced by cavitation in a centrifugal pump. Adv. Mech. Eng. 2017, 9, 1–11. [Google Scholar] [CrossRef]
  6. Pavesi, G.; Cavazzini, G.; Ardizzon, G. Time-frequency characterization of rotating instabilities in a centrifugal pump with a vaned diffuser. Int. J. Rotating Mach. 2008, 2008, 202179. [Google Scholar] [CrossRef]
  7. Pavesi, G.; Cavazzini, G.; Ardizzon, G. Time–frequency characterization of the unsteady phenomena in a centrifugal pump. Int. J. Heat Fluid Flow 2008, 29, 1527–1540. [Google Scholar] [CrossRef]
  8. Khalifa, A.E.; Al-Qutub, A.M.; Ben-Mansour, R. Study of pressure fluctuations and induced vibration at blade-passing frequencies of a double volute pump. Arab. J. Sci. Eng. 2011, 36, 1333–1345. [Google Scholar] [CrossRef]
  9. Chalghoum, I.; Elaoud, S.; Kanfoudi, H.; Akrout, M. The effects of the rotor-stator interaction on unsteady pressure pulsation and radial force in a centrifugal pump. J. Hydrodyn. 2018, 30, 672–681. [Google Scholar] [CrossRef]
  10. Xie, C.; Zhang, C.; Fu, T.; Zhang, T.; Feng, A.; Jin, Y. Numerical analysis and model test verification of energy and cavitation characteristics of axial flow pumps. Water 2022, 14, 2853. [Google Scholar] [CrossRef]
  11. Fei, Z.; Zhang, R.; Xu, H.; Feng, J.; Mu, T.; Chen, Y. Energy performance and flow characteristics of a slanted axial-flow pump under cavitation conditions. Phys. Fluids 2022, 34, 035121. [Google Scholar] [CrossRef]
  12. Zharkovskii, A.; Svoboda, D.; Borshchev, I.; Klyuyev, A.; Ivanov, E.; Shutsky, S. Axial-Flow Pump with Enhanced Cavitation Erosion Resistance. Energies 2023, 16, 1344. [Google Scholar] [CrossRef]
  13. Al-Obaidi, A.R.; Alhamid, J. Experimental Investigation to Utilize Low-cost Sensors of Early Cavitation Prediction in Axial Pump Based on Acoustic and Vibration Approaches. J. Appl. Fluid Mech. 2024, 18, 16–31. [Google Scholar]
  14. Pei, J.; Meng, F.; Li, Y.; Yuan, S.; Chen, J. Effects of distance between impeller and guide vane on losses in a low head pump by entropy production analysis. Adv. Mech. Eng. 2016, 8, 1–11. [Google Scholar] [CrossRef]
  15. Chalghoum, I.; Kanfoudi, H.; Elaoud, S.; Akrout, M.; Zgolli, R. Numerical modeling of the flow inside a centrifugal pump: Influence of impeller–volute interaction on velocity and pressure fields. Arab. J. Sci. Eng. 2016, 41, 4463–4476. [Google Scholar] [CrossRef]
  16. Asim, T.; Mishra, R. Large-Eddy-Simulation-based analysis of complex flow structures within the volute of a vaneless centrifugal pump. Sādhanā 2017, 42, 505–516. [Google Scholar] [CrossRef]
  17. Cheng, Z.; Ma, Q.; Liu, H.; Dong, L.; Pan, Q. Influence of dynamic and static interference on the internal flow and vibration and noise characteristics of marine centrifugal pump. J. Appl. Fluid Mech. 2023, 16, 1989–2001. [Google Scholar]
  18. Ran, H.; Luo, X.; Zhu, L.; Zhang, Y.; Wang, X.; Xu, H. Experimental study of the pressure fluctuations in a pump turbine at large partial flow conditions. Chin. J. Mech. Eng. 2012, 25, 1205–1209. [Google Scholar] [CrossRef]
  19. Zhang, X.; Tang, F. Investigation on hydrodynamic characteristics of coastal axial flow pump system model under full working condition of forward rotation based on experiment and CFD method. Ocean. Eng. 2022, 253, 111286. [Google Scholar] [CrossRef]
  20. Wang, C.; Chen, X.; Ge, J.; Cao, W.; Zhang, Q.; Zhu, Y.; Chang, H. Internal flow characteristics of high-specific-speed centrifugal pumps with different number of impeller blades under large flow conditions. Machines 2023, 11, 138. [Google Scholar] [CrossRef]
  21. Zhang, H.; Wang, J.; Zhang, D.; Shi, W.; Zang, J. Numerical Analysis of the Effect of Cavitation on the Tip Leakage Vortex in an Axial-Flow Pump. J. Mar. Sci. Eng. 2021, 9, 775. [Google Scholar] [CrossRef]
  22. Menter, F. Stress-Blended Eddy Simulation (SBES)—A New Paradigm in Hybrid RANS-LES Modeling. In Progress in Hybrid RANS-LES Modelling, Papers Contributed to the 6th Symposium on Hybrid RANS-LES Methods, Strasbourg, France, 26–28 September 2016; Springer International Publishing: Cham, Switzerland, 2018; pp. 27–37. [Google Scholar]
  23. Huang, R.; Ji, B.; Luo, X.; Zhai, Z.; Zhou, J. Numerical investigation of cavitation-vortex interaction in a mixed-flow waterjet pump. J. Mech. Sci. Technol. 2015, 29, 3707–3716. [Google Scholar] [CrossRef]
  24. Zheng, X.; Liu, L.; Guo, P.; Hong, F. Numerical investigation of three dimensional cavitating performance of NACA66 hydrofoil base on different cavitation models. Chin. J. Hydrodyn. 2018, 33, 199–206. [Google Scholar]
  25. Zwart, P.J.; Gerber, A.G.; Belamri, T. A two-phase flow model for predicting cavitation dynamics. In Proceedings of the 5th International Conference on Multiphase Flow, Yokohama, Japan, 30 May–4 June 2004. [Google Scholar]
Figure 1. Model pump system.
Jmse 13 00138 g001aJmse 13 00138 g001b
Figure 2. Grid diagram of inlet and outlet flow passages with bulb body.
Jmse 13 00138 g002
Figure 3. Grid diagram of typical guide vanes and impeller.
Jmse 13 00138 g003
Figure 4. Grid independence analysis.
Jmse 13 00138 g004
Figure 5. Comparison of external characteristic curves between experiments and numerical simulations.
Jmse 13 00138 g005
Figure 6. Time-domain signals of pressure pulsation under non-cavitating and cavitating conditions at different flow rates.
Jmse 13 00138 g006aJmse 13 00138 g006b
Figure 7. Frequency-domain signals of P1 and P2 influenced by different cavitation numbers at various flow rates.
Jmse 13 00138 g007
Figure 8. Frequency-domain signals of P3 and P4 influenced by different cavitation numbers at various flow rates.
Jmse 13 00138 g008
Figure 9. Guide vane unfolding diagram.
Jmse 13 00138 g009
Figure 10. Unfolding chart of impeller under different cavitation numbers.
Jmse 13 00138 g010
Figure 11. Cavitation bubble distribution on blade surface under different cavitation numbers.
Jmse 13 00138 g011
Table 1. Comparison of parameters during forward operation between bidirectional bulb tubular pump and other pump types.
Bidirectional Bulb Tubular PumpAxial Flow Pump [19]Centrifugal Pump [20]
Design Flow Rate (L/s)2852032.78
Design Head/m2.842.0120
Rotational Speed (r/min)12641000980
Diameter of Impeller (mm)300300425
Table 2. The research parameters for the no-cavitation and cavitation-occurs conditions.
No CavitationCavitation Occurs
Inlet Pressure/atm0.930.83
Flow Rate/(L⋅s−1)228228
Cavitation Number0.490.45
Disclaimer/Publisher’s Note: The statements, opinions and data contained in all publications are solely those of the individual author(s) and contributor(s) and not of MDPI and/or the editor(s). MDPI and/or the editor(s) disclaim responsibility for any injury to people or property resulting from any ideas, methods, instructions or products referred to in the content.

