Article

Investigation of North Atlantic Salinity Long-Term Trends Based on Historical Datasets

1
Institute of Natural and Technical Systems, 299011 Sevastopol, Russia
2
Marchuk Institute of Numerical Mathematics, Russian Academy of Sciences, 119333 Moscow, Russia
3
Zubov State Oceanographic Institute, Roshydromet, 119034 Moscow, Russia
4
Shirshov Institute of Oceanology, Russian Academy of Sciences, 117997 Moscow, Russia
5
Faculty of Physics, Lomonosov Moscow State University, 119991 Moscow, Russia
*
Author to whom correspondence should be addressed.
J. Mar. Sci. Eng. 2024, 12(8), 1404; https://doi.org/10.3390/jmse12081404
Submission received: 28 June 2024 / Revised: 8 August 2024 / Accepted: 14 August 2024 / Published: 15 August 2024
(This article belongs to the Section Physical Oceanography)

Abstract

:
In contrast to fairly good knowledge of seasonal and interannual variability in North Atlantic salinity, its long-term historical changes remain poorly characterized, making it difficult to assess the current state and possible future changes. To fill this gap, we present the results of applying a non-parametric method of regression analysis (quantile regression) to assess long-term changes in North Atlantic salinity (0°–70° N, 8°–80° W) based on multiple datasets. The features of quantile trends in monthly salinity for a median value in two periods (1948–2018 and 1961–2011) are considered. In 1948–2018, salinization was generally detected in North Atlantic tropical and subtropical latitudes, while desalination was found in subpolar latitudes. For the 71-year period under consideration, the median monthly salinity in subtropical latitudes increased by 0.07 ± 0.02 PSU. Over the period 1961–2011, pronounced long-term changes in the North Atlantic salinity are difficult to identify based on the datasets used. A consistency analysis of significant salinity trends across the most used datasets allowed us to detect five small areas with pronounced positive trends in the upper ocean salinity. These include the Guiana Current, the vicinity of 12° N, 48° W, the Canary upwelling area, the region of the Gulf Stream transition to the North Atlantic Current and the western part of the North Atlantic Subpolar Gyre. In these areas, over a 51-year period, salinity in the 10–400 m layer increased by an average of 0.10 ± 0.04 PSU.

1. Introduction

Salinity is a fundamental property of ocean waters, and its long-term changes have significant consequences for the global climate system. Through its influence on boundary layer processes, salinity plays a role in modulating interactions between the atmospheric surface layer and the upper ocean, including the exchange of heat and C O 2 fluxes. Salinity is an important ocean parameter that, by influencing density, determines a number of processes, such as thermohaline circulation [1,2] and subduction [3]. Warmer water masses sink to deep ocean due to higher salinity, resulting in greater heat absorption [4]. Changes in surface salinity further influence sea level changes [5] and upper ocean stratification [6,7]. Rearrangement of water column stratification caused by salinity changes can also influence ecosystems [8,9]. Thus, changes in salinity can have significant consequences for a wide range of ocean processes. Despite this importance, historically, there have been fewer observations of salinity than of temperature. Therefore, it is important to study multi-scale, especially long-term, variability of salinity in order to understand its role in climate change.
The seasonal cycle of salinity in the upper North Atlantic (NA) has been described in a number of papers [10,11,12,13,14]. It has been shown that seasonal changes in ocean salinity are reliably detected from the surface to a depth of 350 m, and, in some regions of the World Ocean (WO), seasonal changes can be detected at a depth of 2000 m [14]. The largest amplitude of seasonal variations in sea surface salinity (SSS) is found in the Northwest Atlantic [12,14].
Climatic mean and variability of ocean salinity have changed in recent years under the influence of global warming, with areas of high SSS becoming saltier and areas of low SSS becoming fresher [15,16,17,18]. Analysis of global SSS using climatological 1960–1989 data from the 2005 WO Database and Argo float data for the period 2003–2007 has shown even lower salinities in fresher regions and higher ones in salinated areas in recent times [19]. These authors link changes in salinity to an intensification of the global hydrological cycle. Analysis of the salinity balance using SODA v2.2.4 reanalysis data for the period 1950–2010 showed that, at subtropical salinity maxima in all ocean basins, salinity increases in the upper mixed layer due to increased evaporation from the ocean surface and decreases at depths greater than 200 m [20]. Therefore, it is necessary to analyze the change in the ocean salinity under a changing climate, focusing on the change in salinity vertical structure and the differences amongst available data from different sources.
Observed historical data indicate the presence of high-amplitude decadal variability of ocean salinity. Dessier and Donguy [10] analyzed SSS measurements from ships of opportunity and research vessels and found a low-frequency decadal-like variability in the northern part of the Tropical Atlantic during 1977–1989. Dickson et al. [21] described a “great salinity anomaly” in the northern NA, where salinity anomalies advected around the basin from the late 1960s to the early 1980s. Grodsky et al. [22] analyzed a 40-year time series in the Equatorial Atlantic, observing SSS increase from 1965 to 1985 and a decrease from 1995 to 2005. An analysis of global salinity changes also confirms that subtropical surface waters are becoming more saline, while waters at high latitudes are becoming fresher. These results are obtained using the least squares method for the periods 1948–1996 [23] and 1957–1996 [15]. An analysis of salinity changes for the entire Atlantic Basin over the periods 1955–1969 and 1985–1999 also showed increased salinity in evaporation-dominated subtropical regions between 25° S and 35° N [24]. In the 1970s to mid-1990s, there was a decrease in the SSS in the NA Subpolar Gyre (SPG) [25]. From the mid-1990s to late 2000s, there was an increase in salinity in the Subpolar Atlantic, which coincided with the accumulation of fresh water in the Arctic Ocean (AO) [26,27]. Based on Atlantic SSS data (30° S–50° N) for the period 1977–2002, a positive linear salinity trend was obtained, especially pronounced between 20° and 45° N [11]. The authors explain this trend by westward expansion of the subtropical region with maximum salinity. In the Atlantic upper thermocline waters, salinity increased by 0.17 ± 0.09 PSU from 1970 to 2005 [28]. Several datasets for the period 2005–2015 revealed a pronounced SSS decrease from the NA SPG to 35° N and in the Labrador Sea [29]. Salinity variability at the ocean surface and within the two depth intervals (0–700 and 700–2000 m) is studied based on five ocean objective analyses based on Argo measurements for the period 2005–2015 [30]. It has been shown that the NA SSS decreases for the period. According to the authors, it is due to an increase in the freshwater input from the AO (e.g., [29,31]). The authors of the cited paper associate the salinization of the Subtropical Atlantic in the 0–700 m layer with the changes in the Mediterranean outflow that have been occurring since 2005 [32]. In the 700–2000 m layer, according to the results of [30], Atlantic desalination is reliably recorded. The above results highlight the possibility of superimposing decadal variability in ocean salinity into longer-term changes over different periods.
For long-term salinity trends, their amplitude agrees well with the standard deviation of decadal climatological salinity data, suggesting that it remains difficult to obtain statistically significant estimates of long-term trends from the existing WO database [33]. These authors found that upper ocean salinity trends estimated for the period 1960–2010 based on the four reanalysis (GECCO3, GFDL, ORAS4 and SODA v2.2.4) show the opposite sign in many regions compared to trends estimated from observations for the period 2004–2017. This indicates a high amplitude of decadal variability and, thus, the dependence of any long-term trend analysis on the period under consideration. Salinity long-term changes for the period 1950–2008 were analyzed in [34]. It was shown that changes in surface salinity over this period are statistically significant at the level of 99% on 43.8% of the WO area. Subtropical Gyres (STGs), which are dominated by evaporation, show a consistent increase in salinity in all oceans. In the Subtropical Atlantic (40° N, 48° W), these values exceed 0.45 ± 0.12 PSU/50 year. In the regions where precipitation predominated, strong freshening occurred. In the Atlantic, the region beneath the Intertropical Convergence Zone is desalinated, but is bordered to the north and south by areas of very strongly increasing salinity. The global change in surface salinity is small (0.0024 ± 0.051 PSU/50 year), while the basin-average change in salinity in the Atlantic is 0.078 ± 0.095 PSU/50 year. The long-term trend obtained from the pentadal salinity anomaly for the periods 1955–1959 to 2002–2006 showed that the upper 700 m of the subpolar NA is becoming cooler and fresher, whereas the subtropical NA is becoming warmer and saltier [35]. Average salinity for the period 1990–2009 was greater than that for the period 1950–1990 over most of the Atlantic Ocean except along the eastern U.S., in the central equatorial region, and south of 30° S [36]. Estimates obtained based on new global gridded ocean salinity dataset showed that the Atlantic has seen a dramatic increase in the 0–2000 m salinity of 0.024 ± 0.013 PSU per century since 1960 [37]. Cheng et al. [38] showed that the reconstructed salinity averaged over the top 2000 m has been sharply increasing in the Atlantic basin (35° S–75° N) since the 1990s. Key features include a freshening trend in the Subpolar Atlantic that contrasts with positive trends elsewhere in the basin. Over much of the high-latitude NA, except for the southwest and part of the eastern boundary, a negative surface salinity trend has been detected over the last 120 years [39,40]. Thus, the estimates of long-term trends in the NA salinity obtained from different datasets of different durations have inconsistencies and are difficult to interpret.
The description of salinity changes and its variability is largely determined by existing (available) ocean datasets. Since 2010, satellite SSS observations have been available [41]. Despite the existence of some errors in remote sensing salinity [42], new satellite SSS products have a great potential for studying salinity variability and related processes [43,44,45]. In addition, numerical ocean models and data assimilation methods are constantly evolving. This tool is becoming increasingly helpful for reconstructing the history of ocean evolution, which, in the form of retrospective analysis, can partially compensate for the shortcomings of observational data. Some studies have shown that reanalysis data with assimilated observed salinity can provide more accurate initial ocean states for dynamic models by reducing imbalance between temperature and salinity, which, in turn, can improve seasonal–interannual forecasts [46,47]. However, reanalysis products from different models differ in methods, resolutions and error correction strategies, which can lead to significant differences in data quality. In regions with strong ocean fronts, ocean salinity data based on reanalysis datasets have low reliability [48]. Most reanalysis datasets indicate a positive trend in global upper ocean salinity (0 to 300 m) and a negative trend below (down to 1500 m) [48]. Stammer et al. [33] confirmed these results and showed that the salinity trend averaged over the upper 300 m is positive, whereas the one averaged over the upper 700 m is negative. Thus, a comparison of regional and global long-term salinity variability amongst all available salinity products still remains an important issue in salinity research.
Based on multiple long-term datasets, we quantify long-term salinity trends in the northern part of the Atlantic. We explore the extent to which salinity trends can be reliably determined by using existing available datasets. Unlike previous studies that have looked at the SSS changes, for which the sampling is denser than the subsurface, our focus will be on analyzing changes in salinity from the surface to the bottom over the two periods: 1948–2018 and 1961–2011. The choice of the first period is associated with the need to analyze the longest-term changes in the NA salinity using available historical data, while the choice of the second one is due to the need to compare the longest time series across the largest number of datasets.

2. Data and Methods

The data used in this paper are monthly mean fields of ocean salinity from objective analysis datasets, such as EN.4.2.2 (EN4, Jan 1945–Dec 2020, 1° × 1°, 42 levels) [49] with a set of corrections by Gouretski and Reseghetti [50], the Institute of Atmospheric Physics (IAP) gridded product (IAP, Jan 1948–Dec 2018, 1° × 1°, 41 levels) [51] and ISHII (ISHII, Jan 1945–Dec 2012, 1° × 1°, 24 levels) [52], as well as ocean reanalysis datasets, including the Estimated State of the global Ocean for Climate Research version 05a (ESTOC, Jan 1957–Dec 2016, model: MOM3-based, 1°× 1°, 45 levels, assimilation method: 4D-VAR adjoint) [53], German contribution of the Estimating the Circulation and Climate of the Ocean project version 3S6m (GECCO3, Jan 1948–Dec 2018, model: MITgcm, 1° × 1°, 40 levels, assimilation method: 4D-VAR adjoint) [54], Geophysical Fluid Dynamics Laboratory reanalysis (GFDL, Jan 1961–Dec 2015, model: GFDLs Ensemble Coupled Data Assimilation system, 1° × 1°, 50 levels, assimilation method: Ensemble Kalman Filter) [55], the Ocean Reanalysis System 3 (ORA-S3, Jan 1959–Dec 2011, model: HOPE, 1° × 1° with equatorial refinement 0.3° × 1°, 29 levels, assimilation method: multivariate optimal interpolation + bias correction) [56], and Ocean Reanalysis System 4 (ORAS4, Jan 1958–Dec 2014, model: NEMO v3.0, 1° × 1° with equatorial refinement 0.3° × 1°, 42 levels, assimilation method: 3D-VAR + bias correction) [57]. Note that the IAP (ISHII) product covers the upper 2000 m (1500 m) only; GFDL is an oceanic component of a coupled ocean–atmosphere model. Since the used datasets on ocean salinity were obtained from different sources, they can be considered as independent ones. The region under study is limited by the coordinates 0°–70° N, 8°–80° W.
As a quantitative indicator of long-term changes in climatic conditions, estimates of linear trends in median ocean salinity values were used. The quantile regression method was first proposed by R. Koenker and G. Bassett [58]. Quantile regression is a procedure for estimating regression parameters (usually linear) for any of the quantiles of the interval from 0 to 1 for the values of the dependent variable. Applicability limitations of the least squares method and the advantages of quantile regression analysis are discussed in a number of studies (e.g., [59,60]).
It is known that, for random variable Y with probability distribution function F ( y ) = P r o b ( Y y ) , the τ -th quantile is the inverse function Q ( τ ) = inf { y : F ( y ) τ } , where 0 < τ < 1 . In particular, the median is Q ( 1 / 2 ) .
The idea of using the quantile regression method for a linear model implies that, for an arbitrary quantile value 0 < τ < 1 , one can introduce the concept of a linear conditional function Q ( τ | X = x ) = x β ( τ ) for any value τ ( 0 , 1 ) . This function was found by solving the following optimization problem:
β ( τ ) = a r g m i n i : y i x i β τ | y i x i β | + i : y i < x i β ( 1 τ ) | y i x i β | .
Here, y i and x i are the given values of the dependent and independent variables at the i-th grid point, respectively.
It is impossible to determine the value of β ( τ ) referred to as a linear quantile regression coefficient corresponding to a certain value of τ analytically, but it is possible using linear programming. In the particular case with τ = 1 / 2 , the minimization of Equation (1) reduces to searching β , which is the solution of the optimization problem β ( 1 / 2 ) = a r g m i n i = 1 n | y i x i β | , that is, the sum of absolute deviations is minimized, which corresponds to regression based on the median of absolute deviations.
The standard errors of quantile regression coefficients were determined using the bootstrap method [59], on the basis of which the most realistic estimates for the significance of linear trends can be obtained [61]. A random test was used to generate 1000 subsamples, each representing a time series in which, compared to the original time series, there were no approximately 30% randomly excluded values. For each sample, trends were calculated using the quantile regression method for the 0.5 quantile value. The significance assessment for trend coefficient values was chosen at a confidence level of α = 0.05 .
Calculations were carried out separately for each dataset in each grid point at all available levels from the surface to the bottom for the two time intervals: 1948–2018 and 1961–2011. Then, the coefficients of ocean salinity linear trends were averaged zonally and in the layer 10–400 m. The lower boundary of this layer was chosen by the results of the analysis of average zonal trends. This layer reveals seasonal changes in ocean salinity [14].
To analyze the most long-term trends in the NA salinity, calculations were carried out over the 71 year period 1948–2018 using the three datasets: objective analyses EN.4.2.2, IAP, and ocean reanalysis GECCO3. Calculations were also carried out for the total 51-year period 1961–2011 for all datasets used.

3. Results

3.1. 1948–2018

Consider the spatial structure of the average salinity of the NA upper layer according to EN4, GECCO3 and IAP data for the period 1948–2018. The values in the 10–400 m layer according to these data generally coincide and correspond to its climatic distribution (Figure 1, bottom). There are subtropical salinity maxima, a decrease in salinity in tropical and subpolar latitudes, and high horizontal salinity gradients in the Gulf Stream—NA Current system. However, there are some differences between these datasets. The area of high-salinity region in subtropical latitudes (>37 PSU) is maximum according to IAP data and minimum according to GECCO3 data. The area of the region with salinity lower than 35.5 PSU in tropical latitudes is maximum according to GECCO3 data and minimum according to IAP data.
Zonally averaged salinity trends of the NA for the period 1948–2018 obtained from EN4 and IAP data show that, in the upper 150 m layer in equatorial latitudes (0°–10° N) and in the upper 400 m layer in the latitudinal band 10°–45° N, generally salinization is detected (Figure 1, top). Quantile trend coefficients in this layer exceed 0.01 PSU/10 year. According to these data, in the upper 100 m layer at the equator and in the 30–170 m layer in the latitudinal band 41°–44° N quantile trend coefficients exceed 0.02 PSU/10 year. In the upper 100 m layer, north of 65° N, for all datasets under consideration, negative coefficients of the quantile trend of ocean salinity were found (lower than −0.01 PSU/10 year, with the values less than −0.03 PSU/10 year according to EN4 data). No significant trends in ocean salinity changes in the layer below 1 km were detected according to the datasets used.
However, there are some differences between the long-term trends in the datasets used. According to EN4 data, in the upper 170 m layer, in the vicinity of 60° N, salinization is found at a rate of 0.01 PSU/10 year (in the upper 50 m layer, the quantile trend coefficient here exceeds 0.02 PSU/10 year), but, according to GECCO3 and IAP data, this is not detected. Long-term trends in salinity changes for the period under study in some regions of the NA obtained from the GECCO3 reanalysis data are not confirmed by the other two datasets. For example, near-zero quantile trend coefficients in the equatorial zone, negative trends in the layer 20–420 m in the latitudinal band 12°–25° N (with a quantile trend coefficient of lower than −0.02 PSU/10 year at the level 100 m in the vicinity of 20° N) and in the 0–560 m layer in the latitudinal band 41°–45° N (with a quantile trend coefficient of lower than −0.02 PSU/10 year in the layer 0–150 m) and positive trends at the level 1000 m in the vicinity of 30° N (the quantile trend coefficient here exceeds 0.02 PSU/10 year).
For the period 1948–2018, long-term trends in salinity in the 10–400 m layer over most of the Tropical and Subtropical Atlantic (0°–45°N) according to EN4 and IAP data are positive (Figure 1, bottom). According to these data, in the area after the Gulf Stream separated from the continental slope and in the area between Greenland and North America, the quantile trend coefficients are positive and their values exceed 0.02 PSU/10 year. In the central and eastern parts of the SPG and in the area between Greenland and Iceland, negative quantile trend coefficients with values lower than −0.01 PSU/10 year are detected. According to GECCO3 data, the sign of salinity long-term trends for the period under consideration in the area 0°–10° N, 40°–50° W, Canary upwelling and in the area between Greenland and Iceland coincides with the sign of salinity trends in these regions according to EN4 and IAP data, but the magnitudes of the quantile trend coefficients are overestimated. In turn, long-term trends in salinity changes obtained from GECCO3 data in the subtropical maximum salinity, the region after the Gulf Stream has separated from the continental slope and in the NA Current contradict the trends in salinity obtained in these regions from EN4 and IAP data.

3.2. 1961–2011

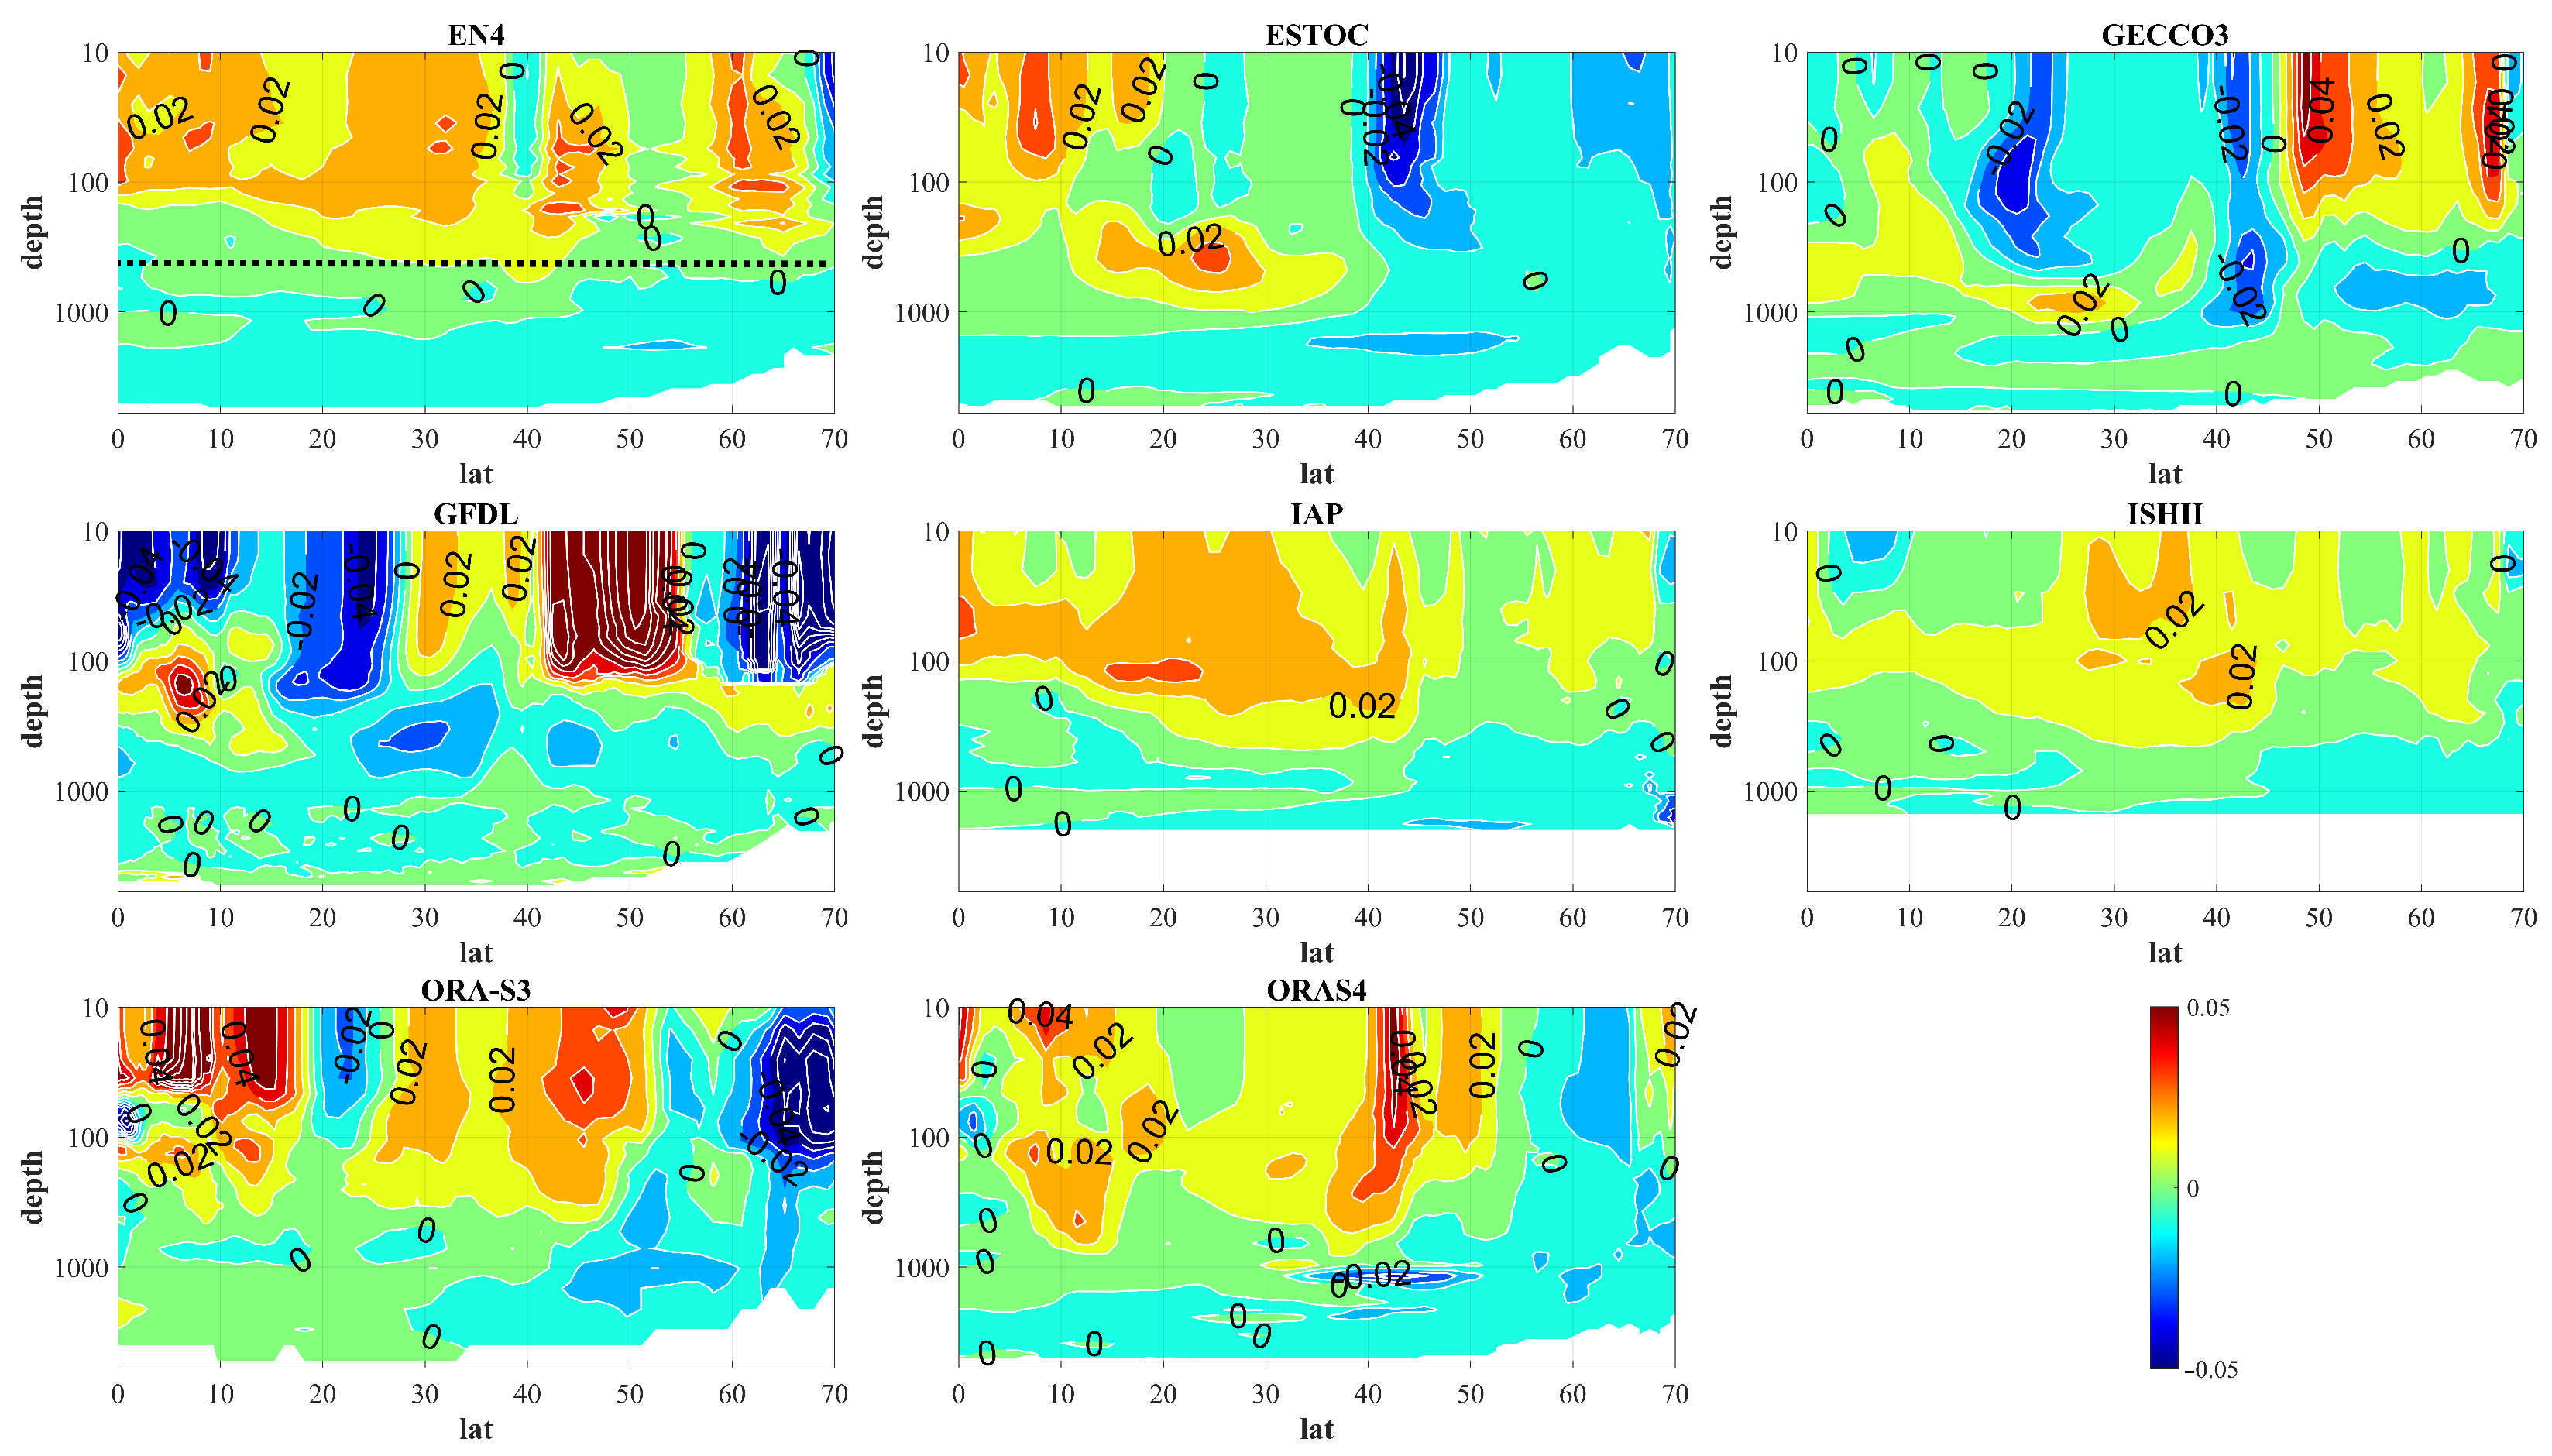
Zonally averaged salinity trends of the NA Ocean for the period 1961–2011 are shown in Figure 2. The highest values of the quantile trend coefficients are concentrated in the upper 1000 m layer. Below 1000 m, long-term salinity trends are mostly not pronounced. The exception is the negative quantile salinity trend at 40° N according to ORAS4 (GECCO3) data at a depth of 1000 m with values of about −0.03 (–0.02) PSU/10 year. In the latitudinal band 0°–65° N in the layer 10–400 m, according to EN4, IAP, ISHII and ORAS4 data, in general, predominantly positive average zonal trends in salinity changes are detected. In the latitudinal band 0°–15° N in the layer 10–100 m, positive coefficients of the quantile salinity trend were obtained according to EN4, IAP, ESTOC, ORA-S3 and ORAS4 data; almost null ones according to ISHII and GECCO3 data; and negative ones according to GFDL data. In the latitudinal band 20°–30° N in the layer 10–400 m, positive coefficients of the quantile salinity trend were obtained according to EN4, IAP, ISHII and ORAS4 data, almost null ones according to ESTOC data and negative ones according to GECCO3 and GFDL data. According to ORA-S3 data, negative coefficients of the quantile trend are noted in the latitudinal band 20°–25° N and positive ones in the latitudinal band 25°–30° N. In the latitudinal band 40°–50° N in the layer 10–400 m, as a whole, according to EN4, GFDL, IAP, ISHII, ORA-S3 and ORAS4 data, positive coefficients of the quantile salinity trend were obtained. The highest positive salinity quantile trend coefficients correspond to GFDL data (with values of about 0.1 PSU/10 year). According to ESTOC data, negative quantile trend coefficients are noted with values lower than −0.05 PSU/10 year. According to GECCO3 data in the latitudinal band 40°–45° N, negative coefficients of the quantile trend are noted and, in the latitude band, 45°–50° N positive coefficients are found. In the latitudinal band north of 60° N in the layer 10–400 m, as a whole, according to EN4, GECCO3, IAP and ISHII data, positive coefficients of the quantile salinity trend were obtained with values in the range of 0.01–0.03 PSU/10 year. Negative quantile trend coefficients are found according to ESTOC and ORAS4 data (with values lower than −0.01 PSU/10 year) and according to GFDL and ORA-S3 data (with values lower than −0.05 PSU/10 year).
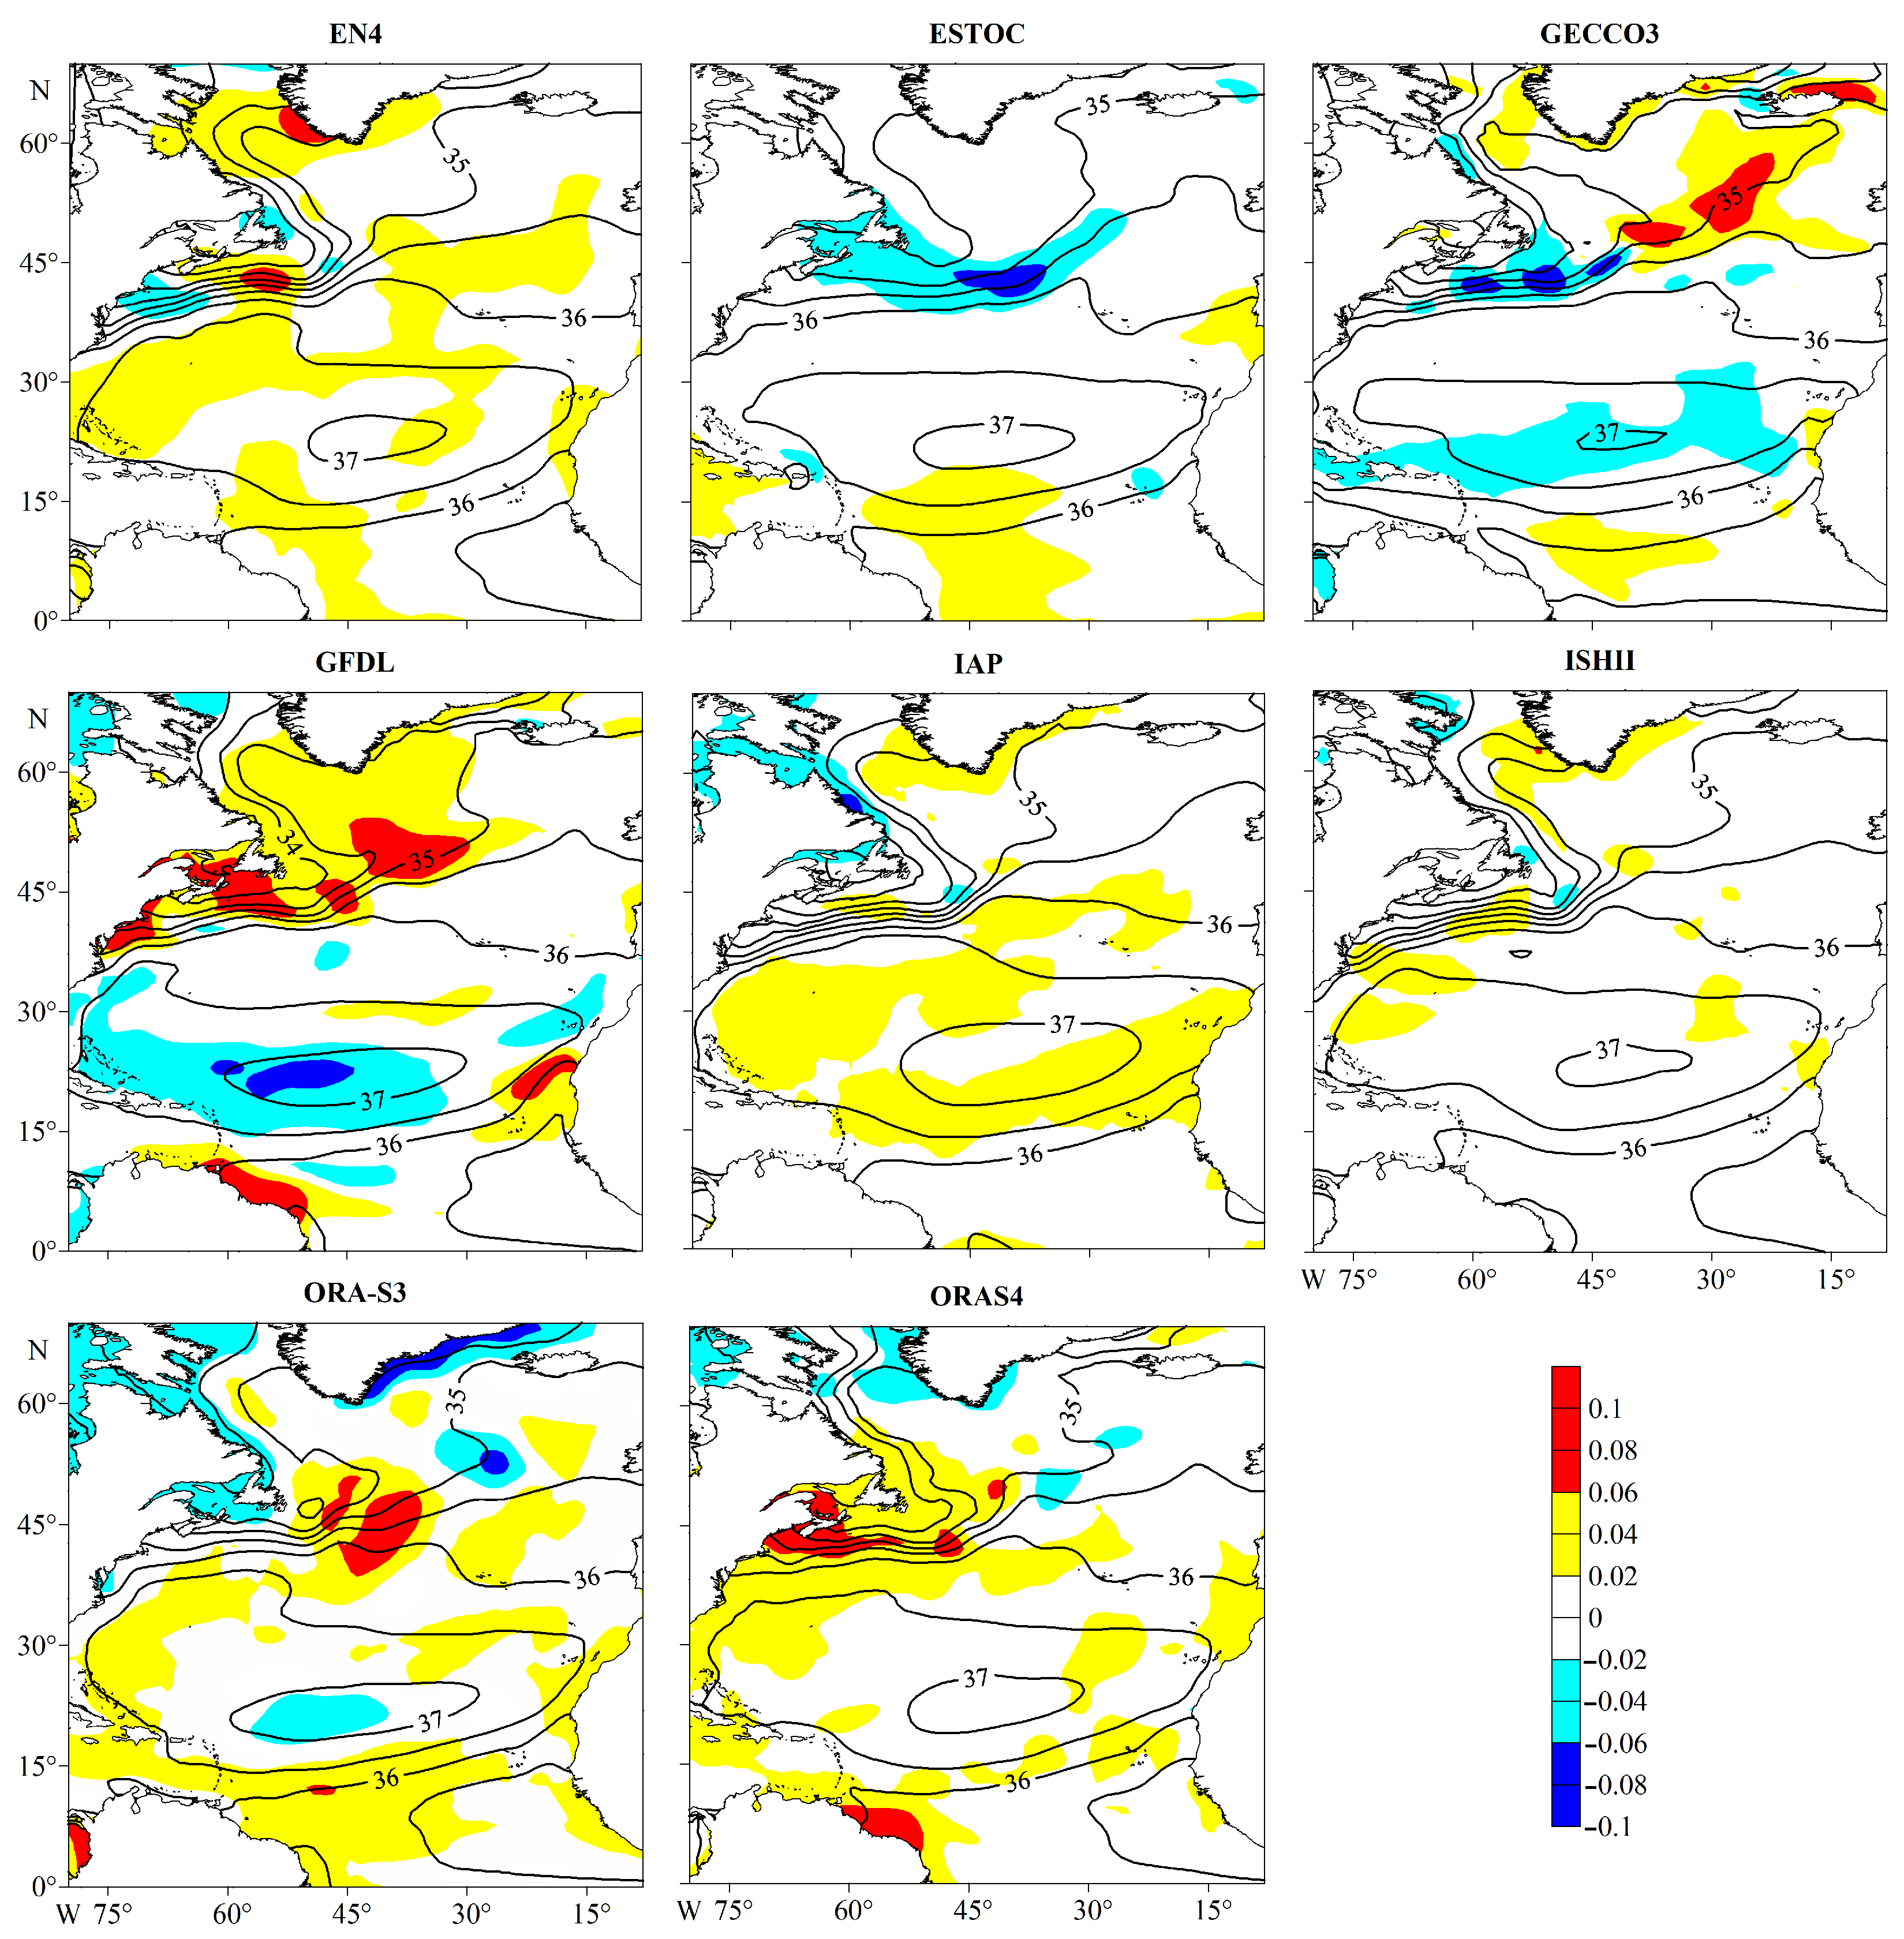
The spatial distribution of the average in the 10–400 m layer NA salinity for the period 1961–2011 according to datasets used has a pronounced subtropical maximum (Figure 3). The area of the region with salinity greater than 37 PSU is minimum according to GECCO3 data and maximum according to IAP data. South of 15° N, the area with salinity lower than 35.5 PSU is located east of 30° W according to EN4, GFDL, ISHII, ORA-S3 and ORAS4 data. A large-scale area with such salinity is absent in this latitudinal band according to ESTOC and IAP data and occupies the entire latitudinal band from Africa almost to South America according to GECCO3 data. In the SPG, the average salinity in the upper 400 m layer decreases from east to west, reaching lower than 34 PSU in the Labrador Current. In general, we can conclude that the climatological salinity averaged in the 10–400 m layer is well represented in all datasets used. This gives a reason for obtaining an adequate assessment of long-term trends.
Long-term trends of salinity changes in the 10–400 m layer for the period 1961–2011 in the NA are shown in Figure 3. In the Guiana Current, positive coefficients of the quantile salinity trend are noted according to GFDL, ORA-S3 and ORAS4 data. According to GFDL and ORAS4 data, the values of the quantile trend coefficients here exceed 0.06 PSU/10 year. For the remaining datasets used, no significant coefficients of the quantile salinity trend were found in the current under consideration. In the inner part of the STG (the location of the subtropical maximum salinity is ∼20°–30° N), positive coefficients of the quantile trend of salinity (with values greater than 0.02 PSU/10 year) were obtained according to EN4 and IAP data; about zero coefficients according to ESTOC, ISHII and ORAS4 data; and negative coefficients (with values lower than −0.02 PSU/10 year) according to GECCO3, GFDL and ORA-S3 data. In the Canary upwelling, positive salinity quantile trend coefficients are detected for all datasets used (with values of about 0.02 PSU/10 year), with the exception of the reanalyses ESTOC and ORAS4. The highest salinity quantile trend coefficients were obtained from GFDL data (values greater than 0.06 PSU/10 year). In the area of transition of the Gulf Stream to the NA Current, there are negative coefficients of the quantile salinity trend according to ESTOC and GECCO3 data (with values lower than −0.06 PSU/10 year) and positive coefficients of the quantile salinity trend according to GFDL, ORA-S3 and ORAS4 data (with values greater than 0.06 PSU/10 year). According to the objective analyses of EN4, IAP and ISHII, significant quantile trend coefficients were not found in the area under consideration. In the NA Current (east of 40° W), positive salinity quantile trend coefficients are detected according to GECCO3 and GFDL data, and negative ones according to ORA-S3 and ORAS4 data (east of 30° W). At the southern tip of Greenland, positive coefficients of the quantile salinity trend were found according to the objective analyses EN4, IAP and ISHII and reanalyses GECCO3 and GFDL. According to EN4 data, the values of the quantile trend coefficients here exceed 0.06 PSU/10 year. In this area, negative coefficients of the quantile salinity trend were found according to reanalyses the ORA-S3 and ORAS4. According to ORA-S3 data, the values of the quantile trend coefficients here are lower than −0.06 PSU/10 year. In the area under consideration, no significant coefficients of the quantile salinity trend were found according to the ESTOC reanalysis data.

3.3. Generalized Analysis for 1961–2011

Many studies use simple criteria, such as the ratio between the spread across models (measured as one or two standard deviations) compared to the ensemble mean (see, e.g., [62]). We adapted an alternative method from [63]. The conceptual idea of this method is as follows. If multiple data sources based on different but plausible assumptions, simplifications and parameterizations show the same trends, then there is greater confidence than if the long-term trend was obtained from a single data source or if data from different sources indicated opposite trends. This way of displaying changes and agreement between datasets allows us to clearly separate the absence of a signal (in our case, the absence of a significant long-term trend) from the lack of information due to the disagreement of datasets (i.e., the presence of significant but opposite trends).
Figure 4 shows areas in which significant long-term salinity trends in NA are reliably recorded or absent, and areas for which salinity trends cannot be unambiguously determined from the datasets used. Long-term trend in salinity for the period 1961–2011 reliably recorded/not determined/missing if out of eight datasets used, six or more/three, four and five datasets/two or fewer datasets indicate the presence of a trend significant at the confidence level α = 0.05 .
Only three datasets are available for the period 1948–2018. Although a generalized analysis can be performed, adding another dataset (the fourth one) to the analysis can greatly changes the resulting pattern. This will not allow us to make conclusions of the satisfactory reliability.
The differences in zonally averaged salinity trends based on the datasets used are so great that, for a given level of statistical significance ( α = 0.05 ), it is impossible to reliably determine the pattern of long-term variability (Figure 4, left panel). In general, below 200 m, significant zonally averaged salinity trends are not expressed according to most datasets. In the upper 200 m layer, significant long-term trends in salinity are noted, but their sign is not determined. At the two grid points (32°N, 55 m and 42° N, 135 m), six of the eight datasets used show positive zonally averaged salinity trends.
As for the median trend coefficients averaged in the layer 10–400 m, for most of the NA (75% of one-degree grid points—green grid points in Figure 4, right panel), there are no salinity trends according to most datasets. The sign of the significant long-term salinity trend is not determined for 24% of one-degree grid points (gray grid points in Figure 4, right panel). In 1% of one-degree grid points, positive salinity trends are reliably detected in the layer 10–400 m. These grid points are grouped in five areas. In the four areas (in the vicinity of the Guiana Current (from 5° N, 45° W to 8° N, 50° W), in the vicinity of 12° N, 48° W, in the Canary upwelling area (25° N, 18° W) and in the SPG western part (59° N, 56° W), six of the eight datasets used show salinization. In the area of the Gulf Stream transition to the NA Current (centered at 49° N, 40° W), seven of the eight datasets used, with the exception of ESTOC, show positive median salinity trends.

4. Discussion

Spatial distribution of salinity reflects the large-scale long-term balance between components of surface freshwater flux and processes of horizontal advection and mixing in the ocean (see, e.g., [14,28,34]). The corresponding response to changes in the hydrological cycle can be seen in the form of salinity long-term trends. In addition, the variability of one of the major climate signals in the NA, the North Atlantic Oscillation (NAO) [64], is closely related to changes in NA salinity. For example, decadal-scale variations in the atmospheric forcing associated with NAO can explain up to a third of salinity changes in the Subtropical Atlantic [65] and up to two-thirds of the salinity changes at the intermediate and deep levels in the Subpolar Atlantic [66]. These changes, superimposed on the secular component of salinity change (see Introduction), form a complex picture of long-term salinity change. This study does not seek to determine the most reliable salinity dataset. Instead, we attempt to determine the spatial pattern of long-term NA salinity variation using multiple independent datasets over as long a period available as possible. It was found that several different datasets obtained using different methods show similar results.
In the period 1948–2018, the spatial structure of salinity trends in the 10–400 m layer obtained from EN4 and IAP datasets is qualitatively consistent with each other (Figure 1). This does not contradict the conditions of global hydrological cycle intensification, when spatial contrasts in upper ocean layer salinity changes become more acute. With accelerating global warming of the atmosphere and oceans, large-scale warming and moistening of the atmosphere is continuously occurring. As noted in the Introduction, the intensification of these processes is accompanied by salinity increase in areas with a predominance of evaporation over precipitation (subtropical regions) and decrease in areas with an opposite process (high-latitude regions), which is also visible in Figure 1 for the upper ocean layer salinity.
In the period 1961–2011, the values of the NA salinity linear trend coefficients obtained from the datasets used are in a wide range: from high (e.g., GFDL) to low (e.g., ISHII). Significant differences between the considered datasets do not allow us to identify a single large-scale pattern of long-term changes in the upper ocean salinity. A generalized analysis for the period under consideration shows the absence of significant long-term changes in salinity over most of the NA. However, this also made it possible to identify regional features of accelerated changes in salinity in terms of the current warming phase, which do not depend on a specific dataset. Significant salinization of some NA regions over this 51-year period is consistent with most datasets used. In contrast to the global scale, ocean dynamics and local factors can also play a controlling role in changes in the upper ocean salinity, ensuring its regional balance.

5. Conclusions

The results of applying a non-parametric method of regression analysis (quantile regression) to assess long-term trends in North Atlantic (NA) salinity (0°–70° N, 8°–80° W) based on several datasets of reanalyses and objective analyses are presented. Using multiple datasets provides reliable estimates of long-term trends in the NA salinity for the second-half of the 20th century. The results obtained do not depend on a specific dataset. The features of quantile trends in monthly salinity for a median value in the two periods (1948–2018 and 1961–2011) are considered. In different time intervals, the pattern of long-term trends in the NA salinity is different.
In 1948–2018, salinization was generally detected in tropical and subtropical latitudes of the NA, and desalination was found in subpolar latitudes. For this 71-year period, median monthly salinity in subtropical latitudes increased by 0.07 ± 0.02 PSU (the median trend coefficient is 0.01 PSU/10 year). The signs of long-term trends in salinity in some NA regions obtained based on the GECCO3 reanalysis coincide with the sign of the trends in salinity from EN4 and IAP datasets, but the values of the quantile trend coefficients from the reanalysis data are overestimated.
In 1961–2011, pronounced long-term trends in NA salinity are difficult to identify from the datasets used. The highest absolute values of the quantile trend coefficients are concentrated in the upper 1000 m layer. Below 1000 m, long-term trends in salinity are almost not pronounced. In the latitudinal band 0°–15° N in the layer 10–100 m, predominantly positive trends in salinity are found. In the latitudinal band 40°–50° N, some datasets indicate salinization in the layer 10–400 m, although significant negative quantile trend coefficients were obtained from ESTOC and GECCO3 data. Over this 51-year period, in the vicinity of the Canary upwelling, salinization in the layer 10–400 m is 0.1 PSU (the median trend coefficient is 0.02 PSU/10 year) and is detected in almost all the datasets used, with the exception of the ESTOC and ORAS4 reanalyses.
A generalized analysis of the obtained salinity trends in the NA in 1961–2011 showed that the general pattern of long-term trends in salinity for zonally averaged trends is difficult to reliably determine. In the 10–400 m layer, according to most of the datasets used, there are no significant trends in salinity for three-quarters of the considered water area. In a quarter of the NA, long-term trends in salinity averaged in the layer 10–400 m have not been determined. Five small areas with pronounced positive salinity trends are identified, in which significant salinity trends coincide in most of the datasets used.

Author Contributions

Conceptualization, P.S. and N.D.; methodology, N.D.; software, A.G.; validation, P.S. and A.G.; formal analysis, P.S. and N.D.; investigation, P.S.; resources, P.S.; data curation, P.S.; writing—original draft preparation, P.S.; writing—review and editing, A.G.; visualization, P.S. and A.G. All authors have read and agreed to the published version of the manuscript.

Funding

The research was funded by the Russian Science Foundation (grant no. 23-77-01054).

Institutional Review Board Statement

Not applicable.

Informed Consent Statement

Not applicable.

Data Availability Statement

Acknowledgments

The authors express gratitude to anonymous reviewers for a number of useful comments, which undoubtedly contributed to the improvement of the manuscript. The authors are grateful to the editorial team for professional editing of the work. As well, the authors thank providers of the datasets used.

Conflicts of Interest

The authors declare no conflicts of interest.

Abbreviations

The following abbreviations are used in this manuscript:
3D-VAR/4D-VARThree- and Four-Dimensional VARiational assimilation
AOArctic Ocean
EN4Version 4 of datasets EN (originated from projets ENACT and ENSEMBLES)
ESTOCEstimated State of the global Ocean for Climate research
GECCO3German contribution of the Estimating the Circulation and Climate of the
Ocean, version 3
GFDLGeophysical Fluid Dynamics Laboratory
HOPEHamburg Ocean Primitive Equation model
IAPInstitute of Atmospheric Physics
MITgcmMassachusetts Institute of Technology General Circulation Model
MOM3Modular Ocean Model version 3
NANorth Atlantic
NEMONucleus for European Modelling of the Ocean
NAONorth Atlantic Oscillation
ORA-S3Ocean Reanalysis System 3
ORAS4Ocean Reanalysis System 4
PSUPractical Salinity Unit
SODASimple Ocean Data Assimilation
SPGSubPolar Gyre
STGSubTropical Gyre
SSSSea Surface Salinity
WOWorld Ocean

References

  1. Huang, R.; Luyten, J.; Stommel, H. Multiple equilibrium states in combined thermal and saline circulation. J. Phys. Oceanogr. 1992, 22, 231–246. [Google Scholar] [CrossRef]
  2. Rahmstorf, S. Bifurcations of the Atlantic thermohaline circulation in response to changes in the hydrological cycle. Nature 1995, 378, 145–149. [Google Scholar] [CrossRef]
  3. Fedorov, A.; Pacanowski, R.; Philander, S.; Boccaletti, G. The effect of salinity on the wind-driven circulation and the thermal structure of the upper ocean. J. Phys. Oceanogr. 2004, 34, 1949–1966. [Google Scholar] [CrossRef]
  4. Mauritzen, C.; Melsom, A.; Sutton, R. Importance of density-compensated temperature change for deep North Atlantic Ocean heat uptake. Nat. Geosci. 2012, 5, 905–910. [Google Scholar] [CrossRef]
  5. Durack, P.; Wijffels, S.; Gleckler, P. Long-term sea-level change revisited: The role of salinity. Environ. Res. Lett. 2014, 9, 114017. [Google Scholar] [CrossRef]
  6. Yamaguchi, R.; Suga, T. Trend and variability in global upper-ocean stratification since the 1960s. J. Geophys. Res. Oceans 2019, 124, 8933–8948. [Google Scholar] [CrossRef]
  7. Li, G.; Cheng, L.; Zhu, J.; Trenberth, K.; Mann, M.; Abraham, J. Increasing ocean stratification over the past half-century. Nat. Clim. Chang. 2020, 10, 1116–1123. [Google Scholar] [CrossRef]
  8. Greene, C.; Monger, B.; McGarry, L.; Connelly, M.; Schnepf, N.; Pershing, A.; Belkin, I.; Fratantoni, P.; Mountain, D.; Pickart, R.; et al. Recent Arctic climate change and its remote forcing of Northwest Atlantic shelf ecosystems. Oceanography 2012, 25, 208–213. [Google Scholar] [CrossRef]
  9. Li, Y.; Fratantoni, P.; Chen, C.; Hare, J.; Sun, Y.; Beardsley, R.; Ji, R. Spatio-temporal patterns of stratification on the Northwest Atlantic shelf. Progr. Oceanogr. 2015, 134, 123–137. [Google Scholar] [CrossRef]
  10. Dessier, A.; Donguy, J. The sea surface salinity in the tropical Atlantic between 10° S and 30° N—seasonal and interannual variations (1977–1989). Deep Sea Res. Part I Oceanogr. Res. Pap. 1994, 41, 81–100. [Google Scholar] [CrossRef]
  11. Reverdin, G.; Kestenare, E.; Frankignoul, C.; Delcroix, T. Surface salinity in the Atlantic Ocean (30° S–50° N). Progr. Oceanogr. 2007, 73, 311–340. [Google Scholar] [CrossRef]
  12. Foltz, G.; McPhaden, M. Seasonal mixed layer salinity balance of the tropical North Atlantic Ocean. J. Geophys. Res. Ocean. 2008, 113, C02013. [Google Scholar] [CrossRef]
  13. Bingham, F.; Foltz, G.; McPhaden, M. Characteristics of the seasonal cycle of surface layer salinity in the global ocean. Ocean Sci. 2012, 8, 915–929. [Google Scholar] [CrossRef]
  14. Liu, Y.; Cheng, L.; Pan, Y.; Abraham, J.; Zhang, B.; Zhu, J.; Song, J. Climatological seasonal variation of the upper ocean salinity. Int. J. Climatol. 2022, 42, 3477–3498. [Google Scholar] [CrossRef]
  15. Boyer, T.; Levitus, S.; Antonov, J.; Locarnini, R.; Garcia, H. Linear trends in salinity for the World Ocean, 1955–1998. Geophys. Res. Lett. 2005, 32, L01604. [Google Scholar] [CrossRef]
  16. Durack, P.; Wijffels, S.; Matear, R. Ocean salinities reveal strong global water cycle intensification during 1950 to 2000. Science 2012, 336, 455–458. [Google Scholar] [CrossRef]
  17. Durack, P. Ocean salinity and the global water cycle. Oceanography 2015, 28, 20–31. [Google Scholar] [CrossRef]
  18. Sathyanarayanan, A.; Köhl, A.; Stammer, D. Ocean salinity changes in the global ocean under global warming conditions. Part I: Mechanisms in a strong warming scenario. J. Clim. 2021, 34, 8219–8236. [Google Scholar] [CrossRef]
  19. Hosoda, S.; Suga, T.; Shikama, N.; Mizuno, K. Global surface layer salinity change detected by Argo and its implication for hydrological cycle intensification. J. Oceanogr. 2009, 65, 579–586. [Google Scholar] [CrossRef]
  20. Melzer, B.; Subrahmanyam, B. Decadal changes in salinity in the oceanic subtropical gyres. J. Geophys. Res. Ocean. 2017, 122, 336–354. [Google Scholar] [CrossRef]
  21. Dickson, R.; Meincke, J.; Malmberg, S.A.; Lee, A. The “great salinity anomaly” in the Northern North Atlantic 1968–1982. Progr. Oceanogr. 1988, 20, 103–151. [Google Scholar] [CrossRef]
  22. Grodsky, S.; Carton, J.; Bingham, F. Low frequency variation of sea surface salinity in the tropical Atlantic. Geophys. Res. Lett. 2006, 33, L14604. [Google Scholar] [CrossRef]
  23. Antonov, J.; Levitus, S.; Boyer, T. Steric sea level variations during 1957–1994: Importance of salinity. J. Geophys. Res. Ocean. 2002, 107, 8013. [Google Scholar] [CrossRef]
  24. Curry, R.; Dickson, B.; Yashayaev, I. A change in the freshwater balance of the Atlantic Ocean over the past four decades. Nature 2003, 426, 826–829. [Google Scholar] [CrossRef]
  25. Reverdin, G.; Durand, F.; Mortensen, J.; Schott, F.; Valdimarsson, H.; Zenk, W. Recent changes in the surface salinity of the North Atlantic subpolar gyre. J. Geophys. Res. Ocean. 2002, 107, 8010. [Google Scholar] [CrossRef]
  26. Polyakov, I.; Bhatt, U.; Walsh, J.; Abrahamsen, E.; Pnyushkov, A.; Wassmann, P. Recent oceanic changes in the Arctic in the context of long-term observations. Ecol. Appl. 2013, 23, 1745–1764. [Google Scholar] [CrossRef]
  27. Rabe, B.; Karcher, M.; Kauker, F.; Schauer, U.; Toole, J.; Krishfield, R.; Pisarev, S.; Kikuchi, T.; Su, J. Arctic Ocean basin liquid freshwater storage trend 1992–2012. Geophys. Res. Lett. 2014, 41, 961–968. [Google Scholar] [CrossRef]
  28. Helm, K.; Bindoff, N.; Church, J. Changes in the global hydrological-cycle inferred from ocean salinity. Geophys. Res. Lett. 2010, 37, L18701. [Google Scholar] [CrossRef]
  29. Tesdal, J.E.; Abernathey, R.; Goes, J.; Gordon, A.; Haine, T. Salinity trends within the upper layers of the subpolar North Atlantic. J. Clim. 2018, 31, 2675–2698. [Google Scholar] [CrossRef]
  30. Liu, C.; Liang, X.; Chambers, D.; Ponte, R. Global patterns of spatial and temporal variability in salinity from multiple gridded Argo products. J. Clim. 2020, 33, 8751–8766. [Google Scholar] [CrossRef]
  31. Proshutinsky, A.; Krishfield, R.; Timmermans, M.L.; Toole, J.; Carmack, E.; McLaughlin, F.; Williams, W.; Zimmermann, S.; Itoh, M.; Shimada, K. Beaufort Gyre freshwater reservoir: State and variability from observations. J. Geophys. Res. Ocean. 2009, 114, C00A10. [Google Scholar] [CrossRef]
  32. Schroeder, K.; Chiggiato, J.; Bryden, H.; Borghini, M.; Ben Ismail, S. Abrupt climate shift in the Western Mediterranean Sea. Sci. Rep. 2016, 6, 23009. [Google Scholar] [CrossRef]
  33. Stammer, D.; Martins, M.; Köhler, J.; Köhl, A. How well do we know ocean salinity and its changes? Progr. Oceanogr. 2021, 190, 102478. [Google Scholar] [CrossRef]
  34. Durack, P.; Wijffels, S. Fifty-year trends in global ocean salinities and their relationship to broad-scale warming. J. Clim. 2010, 23, 4342–4362. [Google Scholar] [CrossRef]
  35. Wang, C.; Dong, S.; Munoz, E. Seawater density variations in the North Atlantic and the Atlantic meridional overturning circulation. Clim. Dyn. 2010, 34, 953–968. [Google Scholar] [CrossRef]
  36. Aretxabaleta, A.; Smith, K.; Kalra, T. Regime changes in global sea surface salinity trend. J. Mar. Sci. Eng. 2017, 5, 57. [Google Scholar] [CrossRef]
  37. Li, G.; Cheng, L.; Pan, Y.; Wang, G.; Liu, H.; Zhu, J.; Zhang, B.; Ren, H.; Wang, X. A global gridded ocean salinity dataset with 0.5° horizontal resolution since 1960 for the upper 2000 m. Front. Mar. Sci. 2023, 10, 1108919. [Google Scholar] [CrossRef]
  38. Cheng, L.; Trenberth, K.; Gruber, N.; Abraham, J.; Fasullo, J.; Li, G.; Mann, M.; Zhao, X.; Zhu, J. Improved estimates of changes in upper ocean salinity and the hydrological cycle. J. Clim. 2020, 33, 10357–10381. [Google Scholar] [CrossRef]
  39. Friedman, A.; Reverdin, G.; Khodri, M.; Gastineau, G. A new record of Atlantic sea surface salinity from 1896 to 2013 reveals the signatures of climate variability and long-term trends. Geophys. Res. Lett. 2017, 44, 1866–1876. [Google Scholar] [CrossRef]
  40. Reverdin, G.; Friedman, A.; Chafik, L.; Holliday, N.; Szekely, T.; Valdimarsson, H.; Yashayaev, I. North Atlantic extratropical and subpolar gyre variability during the last 120 years: A gridded dataset of surface temperature, salinity, and density. Part 1: Dataset validation and RMS variability. Ocean Dyn. 2019, 69, 385–403. [Google Scholar] [CrossRef]
  41. Vinogradova, N.; Lee, T.; Boutin, J.; Drushka, K.; Fournier, S.; Sabia, R.; Stammer, D.; Bayler, E.; Reul, N.; Gordon, A.; et al. Satellite salinity observing system: Recent discoveries and the way forward. Front. Mar. Sci. 2019, 6, 243. [Google Scholar] [CrossRef]
  42. Dinnat, E.; Le Vine, D.; Boutin, J.; Meissner, T.; Lagerloef, G. Remote sensing of sea surface salinity: Comparison of satellite and in situ observations and impact of retrieval parameters. Remote Sens. 2019, 11, 750. [Google Scholar] [CrossRef]
  43. Hernandez, O.; Boutin, J.; Kolodziejczyk, N.; Reverdin, G.; Martin, N.; Gaillard, F.; Reul, N.; Vergely, J. SMOS salinity in the subtropical North Atlantic salinity maximum: 1. Comparison with Aquarius and in situ salinity. J. Geophys. Res. Ocean. 2014, 119, 8878–8896. [Google Scholar] [CrossRef]
  44. Yu, L. Variability and uncertainty of satellite sea surface salinity in the subpolar North Atlantic (2010–2019). Remote Sens. 2020, 12, 2092. [Google Scholar] [CrossRef]
  45. Hu, R.; Zhao, J. Sea surface salinity variability in the western subpolar North Atlantic based on satellite observations. Remote Sens. Environ. 2022, 281, 113257. [Google Scholar] [CrossRef]
  46. Yang, S.C.; Rienecker, M.; Keppenne, C. The Impact of ocean data assimilation on seasonal-to-interannual forecasts: A case study of the 2006 El Niño Event. J. Clim. 2010, 23, 4080–4095. [Google Scholar] [CrossRef]
  47. Hackert, E.; Ballabrera-Poy, J.; Busalacchi, A.; Zhang, R.H.; Murtugudde, R. Impact of sea surface salinity assimilation on coupled forecasts in the tropical Pacific. J. Geophys. Res. Ocean. 2011, 116, C05009. [Google Scholar] [CrossRef]
  48. Shi, L.; Alves, O.; Wedd, R.; Balmaseda, M.A.; Chang, Y.; Chepurin, G.; Ferry, N.; Fujii, Y.; Gaillard, F.; Good, S.; et al. An assessment of upper ocean salinity content from the Ocean Reanalyses Intercomparison Project (ORA-IP). Clim. Dyn. 2017, 49, 1009–1029. [Google Scholar] [CrossRef]
  49. Good, S.; Martin, M.; Rayner, N. EN4: Quality controlled ocean temperature and salinity profiles and monthly objective analyses with uncertainty estimates. J. Geophys. Res. Ocean. 2013, 118, 6704–6716. [Google Scholar] [CrossRef]
  50. Gouretski, V.; Reseghetti, F. On depth and temperature biases in bathythermograph data: Development of a new correction scheme based on analysis of a global ocean database. Deep Sea Res. Part I Oceanogr. Res. Pap. 2010, 57, 812–833. [Google Scholar] [CrossRef]
  51. Cheng, L.; Zhu, J. Benefits of CMIP5 multimodel ensemble in reconstructing historical ocean subsurface temperature variations. J. Clim. 2016, 29, 5393–5416. [Google Scholar] [CrossRef]
  52. Ishii, M.; Kimoto, M.; Kachi, M. Historical ocean subsurface temperature analysis with error estimates. Mon. Weather Rev. 2003, 131, 51–73. [Google Scholar] [CrossRef]
  53. Osafune, S.; Masuda, S.; Sugiura, N.; Doi, T. Evaluation of the applicability of the Estimated State of the Global Ocean for Climate Research (ESTOC) data set. Geophys. Res. Lett. 2015, 42, 4903–4911. [Google Scholar] [CrossRef]
  54. Köhl, A. Evaluating the GECCO3 1948–2018 ocean synthesis—a configuration for initializing the MPI-ESM climate model. Q. J. R. Meteorol. Soc. 2020, 146, 2250–2273. [Google Scholar] [CrossRef]
  55. Chang, Y.S.; Zhang, S.; Rosati, A.; Delworth, T.; Stern, W. An assessment of oceanic variability for 1960–2010 from the GFDL ensemble coupled data assimilation. Clim. Dyn. 2013, 40, 775–803. [Google Scholar] [CrossRef]
  56. Balmaseda, M.; Vidard, A.; Anderson, D. The ECMWF ocean analysis system: ORA-S3. Mon. Weather Rev. 2008, 136, 3018–3034. [Google Scholar] [CrossRef]
  57. Balmaseda, M.; Mogensen, K.; Weaver, A. Evaluation of the ECMWF ocean reanalysis system ORAS4. Q. J. R. Meteorol. Soc. 2013, 139, 1132–1161. [Google Scholar] [CrossRef]
  58. Koenker, R.; Bassett, G. Regression Quantiles. Econometrica 1978, 46, 33–50. [Google Scholar] [CrossRef]
  59. Koenker, R. Quantile Regression; Econometric Society Monographs: Cambridge, UK, 2005; 349p. [Google Scholar]
  60. Timofeev, A.; Sterin, A. Using the quantile regression method to analyze changes in climate characteristics. Russ. Meteorol. Hydrol. 2010, 35, 310–319. [Google Scholar] [CrossRef]
  61. Kiktev, D.; Kryzhov, V. Comparison of several methods of assessment of statistical significance of linear trends. Russ. Meteorol. Hydrol. 2004, 11, 17–25. [Google Scholar]
  62. Deser, C.; Phillips, A.; Bourdette, V.; Teng, H. Uncertainty in climate change projections: The role of internal variability. Clim. Dyn. 2012, 38, 527–546. [Google Scholar] [CrossRef]
  63. Tebaldi, C.; Arblaster, J.; Knutti, R. Mapping model agreement on future climate projections. Geophys. Res. Lett. 2011, 38, L23701. [Google Scholar] [CrossRef]
  64. Marshall, J.; Kushnir, Y.; Battisti, D.; Chang, P.; Czaja, A.; Dickson, R.; Hurrell, J.; McCartney, M.; Saravanan, R.; Visbeck, M. North Atlantic climate variability: Phenomena, impacts and mechanisms. Int. J. Climatol. 2001, 21, 1863–1898. [Google Scholar] [CrossRef]
  65. Rosenheim, B.; Swart, P.; Thorrold, S.; Eisenhauer, A.; Willenz, P. Salinity change in the subtropical Atlantic: Secular increase and teleconnections to the North Atlantic Oscillation. Geophys. Res. Lett. 2005, 32, L02603. [Google Scholar] [CrossRef]
  66. Sarafanov, A. On the effect of the North Atlantic Oscillation on temperature and salinity of the subpolar North Atlantic intermediate and deep waters. ICES J. Mar. Sci. 2009, 66, 1448–1454. [Google Scholar] [CrossRef]
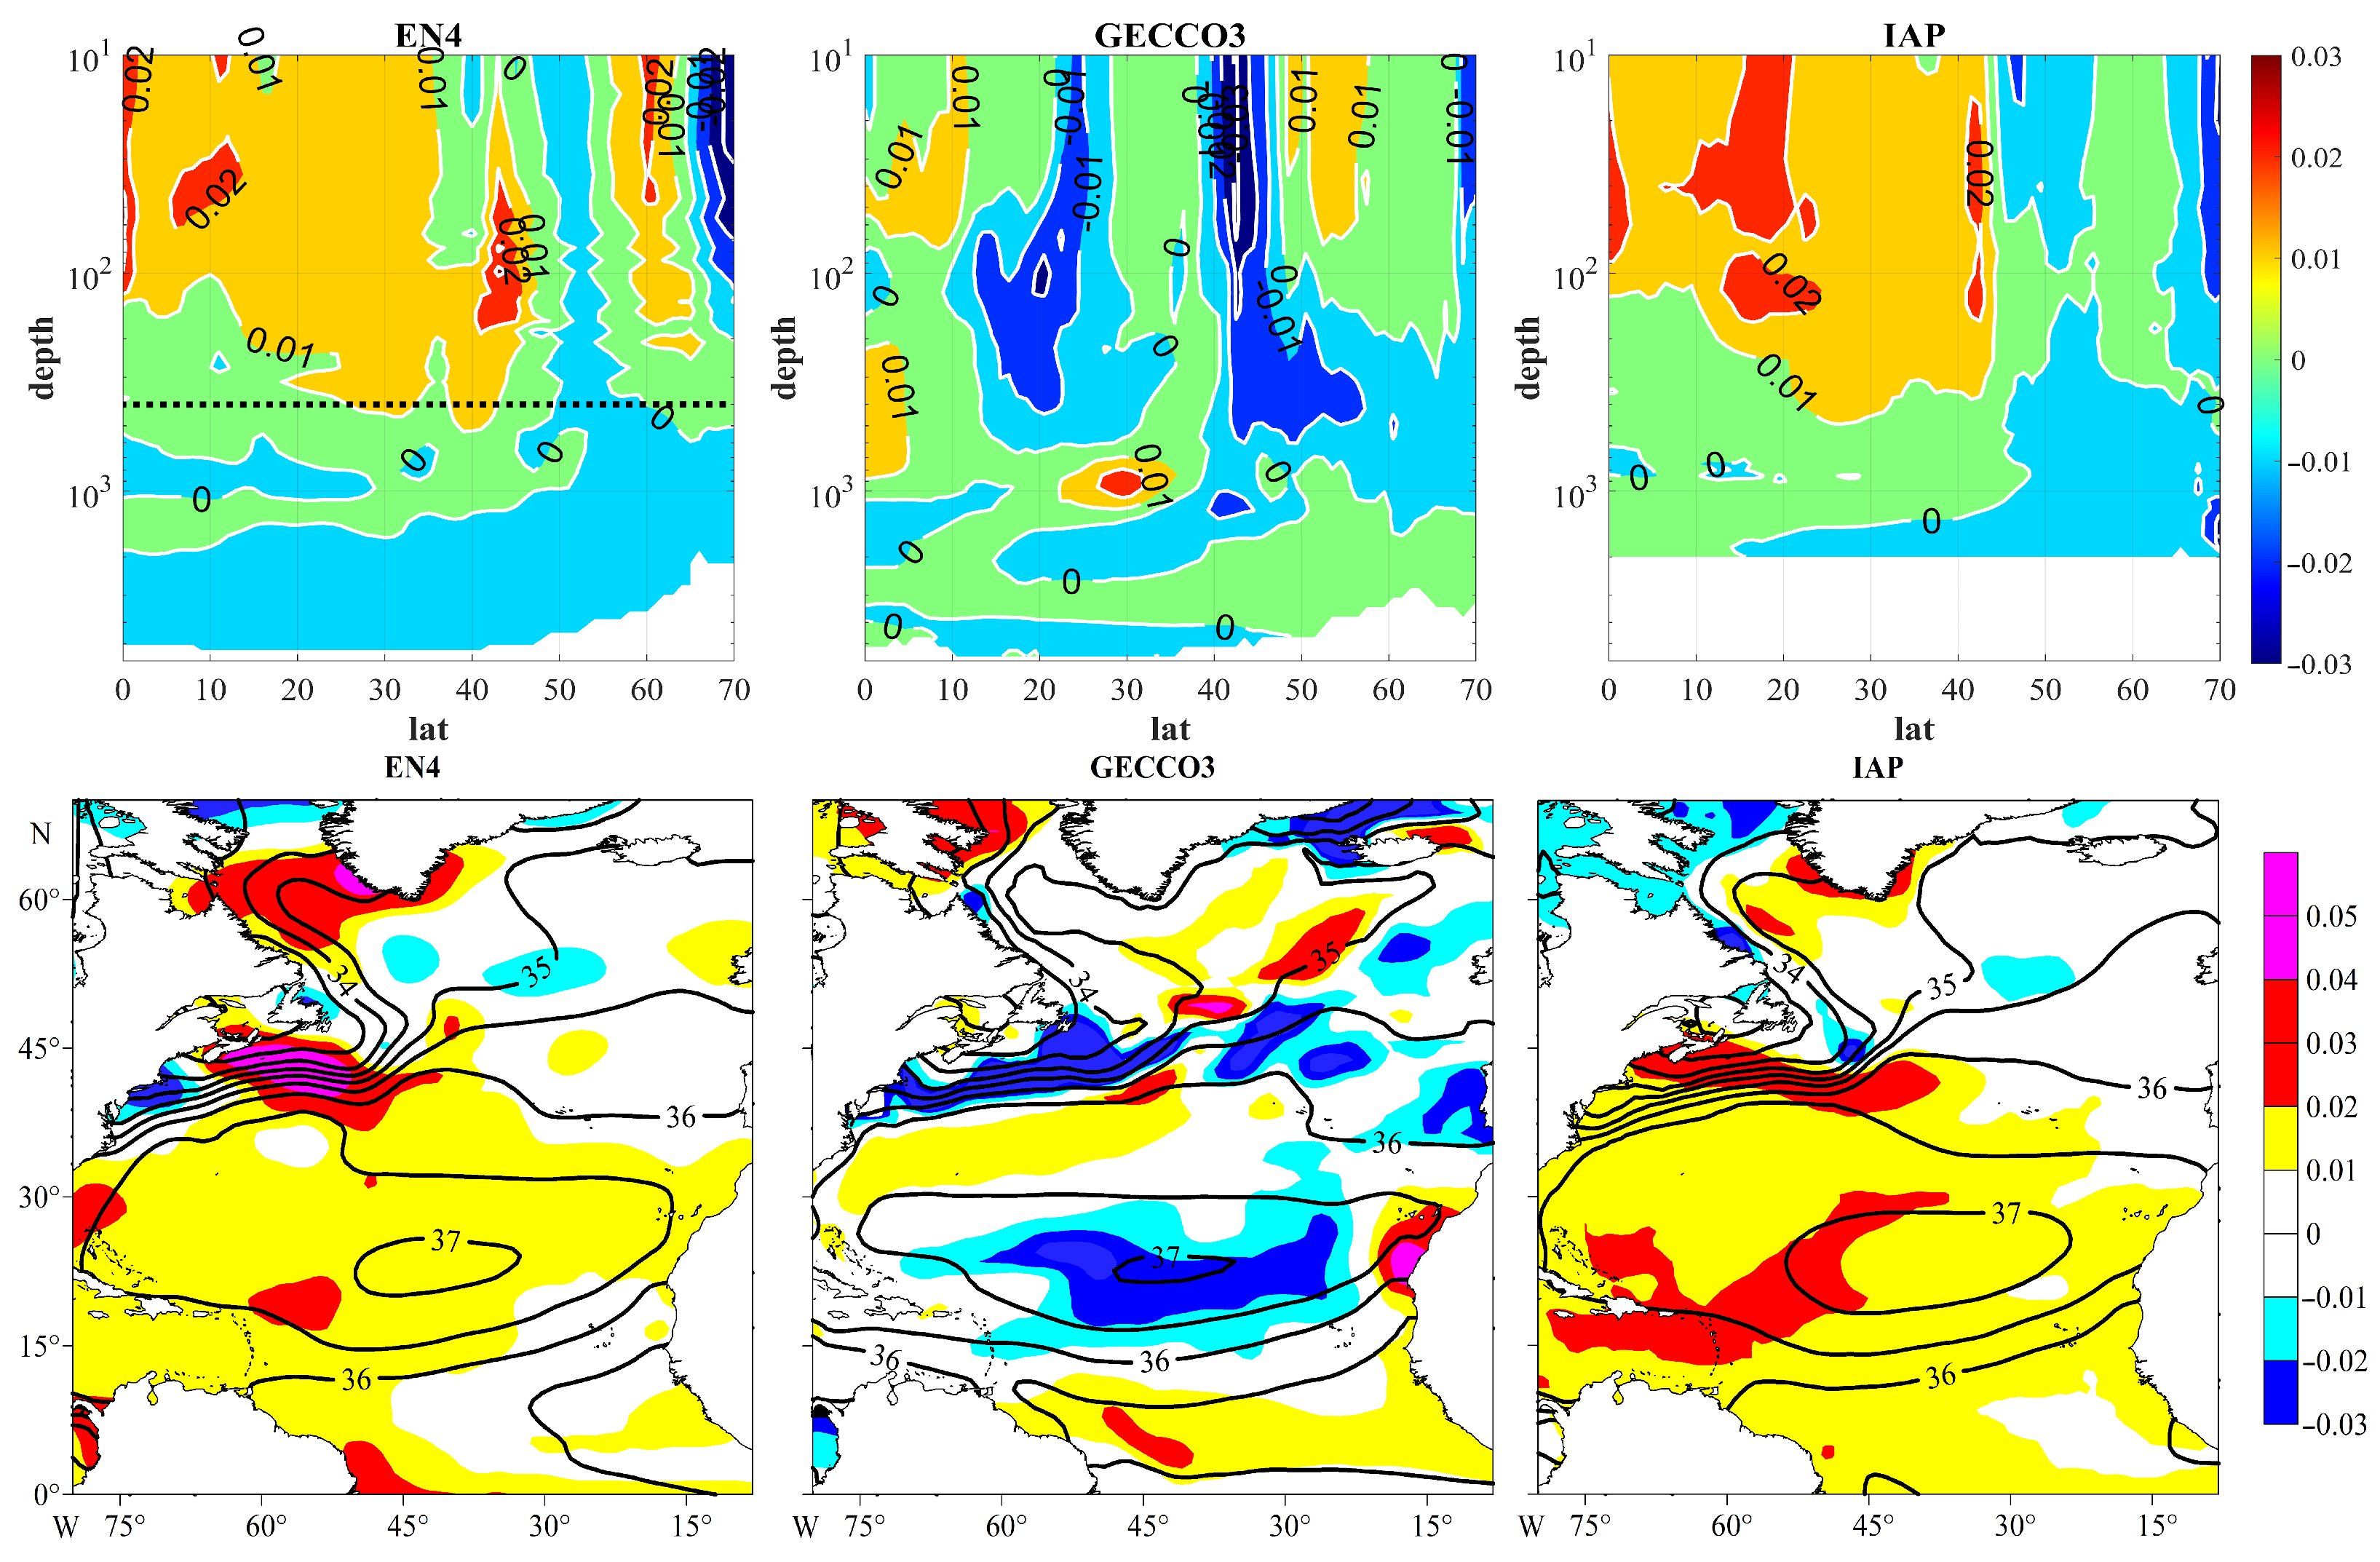
Figure 1. Zonally averaged coefficients of median ocean salinity trends (top panels) and coefficients of median ocean salinity trends averaged over 10–400 m (bottom panels) for the period 1948–2018 in the North Atlantic from EN4 (left), GECCO3 (center) and IAP (right) data. In the top panels, the vertical axis is in logarithmic scale and the contours are drawn via 0.01 PSU/10 year. In the bottom panels, bold black lines indicate an average in the 10–400 m layer salinity for the period 1948–2018. The black dotted line in the top left panel shows the 400 m level.
Jmse 12 01404 g001
Figure 2. Zonally averaged coefficients of median ocean salinity trends for the period 1961–2011 in the NA. The vertical axis is in logarithmic scale and the contours are drawn via 0.01 PSU/10 year. The black dotted line in the upper left figure shows the level 400 m.
Jmse 12 01404 g002
Figure 3. Median trend coefficients for NA salinity (PSU/10 year) for the period 1961–2011, averaged in the layer 10–400 m. Black contours show average salinity values in the layer 10–400 m for the period 1961–2011.
Jmse 12 01404 g003
Figure 4. Areas of the NA, where significant salinity trends are not identified (gray), where there are no significant salinity trends (green) and where the significant salinity trends are consistent (red) for the period 1961–2011 for zonally averaged median salinity trend coefficients (left panel) and median salinity trend coefficients averaged in the layer 10–400 m (right panel).
Jmse 12 01404 g004
Disclaimer/Publisher’s Note: The statements, opinions and data contained in all publications are solely those of the individual author(s) and contributor(s) and not of MDPI and/or the editor(s). MDPI and/or the editor(s) disclaim responsibility for any injury to people or property resulting from any ideas, methods, instructions or products referred to in the content.