Article

Spatiotemporal Distribution Characteristics and Influencing Factors of Dissolved Potentially Toxic Elements along Guangdong Coastal Water, South China

1
National Engineering Research Center of Port Hydraulic Construction Technology, Tianjin Research Institute for Water Transport Engineering, Ministry of Transport, Tianjin 300456, China
2
Tianjin Water Transportation Engineering Survey and Design Institute Co., Ltd., Tianjin 300456, China
*
Author to whom correspondence should be addressed.
J. Mar. Sci. Eng. 2024, 12(6), 896; https://doi.org/10.3390/jmse12060896
Submission received: 18 April 2024 / Revised: 25 May 2024 / Accepted: 25 May 2024 / Published: 28 May 2024

Abstract

:
In this study, five potentially toxic elements (PTEs) (Hg, Pb, As, Zn, and Cu) and five physicochemical factors (pH, dissolved oxygen, salinity, chlorophyll a, and chemical oxygen demand) relating to surface seawater were measured along the coast of Guangdong Province (GD), China, during three seasons in 2019. Comprehensive analyses were conducted to explore the distribution characteristics, pollution degrees, and influencing factors of PTE. The results showed that the concentrations of PTE varied spatially and seasonally due to these elements’ complex sources and behaviors. Pb was the most abundant toxic element, reaching considerable contamination levels. Overall, the average pollution degrees of Cu, As, and Zn were higher around the east coast of GD, while Hg and Pb levels were higher in the west coast region of GD. The correlation analysis showed that the variation of different physicochemical parameters had different degrees of influence on PTE transport and transformation. This study can help environmental managers gain deeper insight into the influence of complex factors on PTE and improve the efficiency of pollution control in this significant subtropical coastal area.

1. Introduction

Coastal ecosystems are among the most important ecosystems on earth, providing a wide range of ecological services and being of high economic value [1,2,3]. However, potentially toxic elements (PTEs) have accumulated rapidly in marine environments in recent decades due to intensive human activities conducted in coastal areas and upstream of estuaries [4,5,6]. PTE pose great potential threats to aquatic ecosystems because of their wide distribution, persistence, non-degradability, and toxicity [7,8,9]. Increasing pollution loads of PTE not only threaten the habitats of aquatic organisms but also affect human health and the structure and function of the entire ecosystem through accumulation and amplification in the food chain [10,11,12]. In estuaries and coasts, the interaction of tidal currents and runoff results in the exchange of freshwater from rivers with seawater of higher salinity. Dramatic changes in various physical elements (water flow, velocity, suspended particulate matter, etc.) and chemical elements (salinity, macronutrient ions, dissolved oxygen (DO), dissolved organic carbon, pH, etc.) in estuarine waters, as well as various complex biogeochemical interactions in these waters, affect the transport, migration, flocculation, and settling of floating particulate matter and its biological processes, resulting in the transport and transformation of PTE in and into various forms [13,14]. These processes affect the biogeochemical behavior of PTE distribution, transport, and accumulation in estuarine and coastal environments and have a direct impact on the self-purification of water bodies, the effects of pollution, and control measures [15,16]. Therefore, PTE pollution in estuaries and coasts has become an urgent worldwide concern [17,18,19].
Guangdong Province, located in the northern part of the South China Sea, is China’s largest economic province and one of the largest manufacturing bases worldwide [20,21]. The Guangdong–Hong Kong–Macao Greater Bay Area (GBA), the fourth largest bay area in the world, is located in the middle of the GD coast and by estuaries of the Pearl River Delta (PRD) [22,23]. In addition, as the province possessing the longest coastline in China, GD supports distinctive tropical marine ecosystems such as coral reefs, sea grass, and mangroves. The sources of PTE in the aquatic environment are natural release and anthropogenic pollution. Geophysical–chemical processes such as volcanic eruptions, forest fires, and rock weathering are the most common natural processes whereby PTE enters the environment [24,25]. Anthropogenic activities, especially those carried out in industrial and agricultural production such as fossil fuel combustion, metal mining and smelting, printing and dyeing, electroplating, mariculture, pesticide use, etc., have become the main source of PTE in the marine environment [26,27,28]. However, there is a wide range of petrochemical, electronic, hardware, and other industrial parks along the coast of GD, and these PTE-pollution-generating industries pose a major threat to the marine environment [29,30]. Once entering the ocean, the distribution and concentrations of PTE are influenced by complex factors such as salinity, DO, pH, chemical oxygen demand (COD), biology, and so on [31]. Moreover, PTE pollution may vary along coastlines with respect to local economic development, pollution sources, and geographical conditions [32,33]. Changes in the direction of monsoons and currents within a year may also affect the distribution of PTE [5,34].
Over the last few decades, many efforts have been devoted to assessing PTE pollution along the GD coast [11,35,36,37]. However, there has been less research on the dissolved PTE compared to the extensive work on sediments and organisms in this region. Zhang observed maximum seasonal concentrations of dissolved Cu, Pb, Cd, and As in the summer and revealed decreasing trends from inshore to offshore in PRD in 2009 [38]. Liu conducted a comprehensive survey over four seasons in Daya Bay (DYB) [39]. Luo measured PTE concentrations and physicochemical parameters in GBA coastal waters to analyze the spatial distribution characteristics, pollution degrees, and sources of PTE in 2019 [40]. Zhang analyzed the spatial and seasonal characteristics of dissolved PTE in the east and west GD coastal waters [41]. Most previous studies mainly concerning dissolved PTE were focused on the heavily urbanized coastal area of the GBA (including PRE and DYB) and other areas. These studies lacked a systematic analysis of the spatial and temporal variation in and influencing factors of PTE along the whole GD coast. Thus, it is of great significance to determine the spatiotemporal distribution characteristics of dissolved PTE along the GD coast in order to quickly gain a comprehensive understanding of the whole area and provide a reference for further research.
In this study, five PTE (Hg, Pb, As, Zn, and Cu) and five physicochemical factors (pH, DO, salinity, chlorophyll a (Chl a), and COD) were measured in surface seawater from 242 sites along the GD coast collected in three seasons to (1) assess the spatial and temporal variation characteristics of physicochemical factors; (2) examine the spatial and temporal distribution characteristics of PTE and their pollution degrees; (3) and investigate potential sources and controlling factors of PTE.

2. Materials and Methods
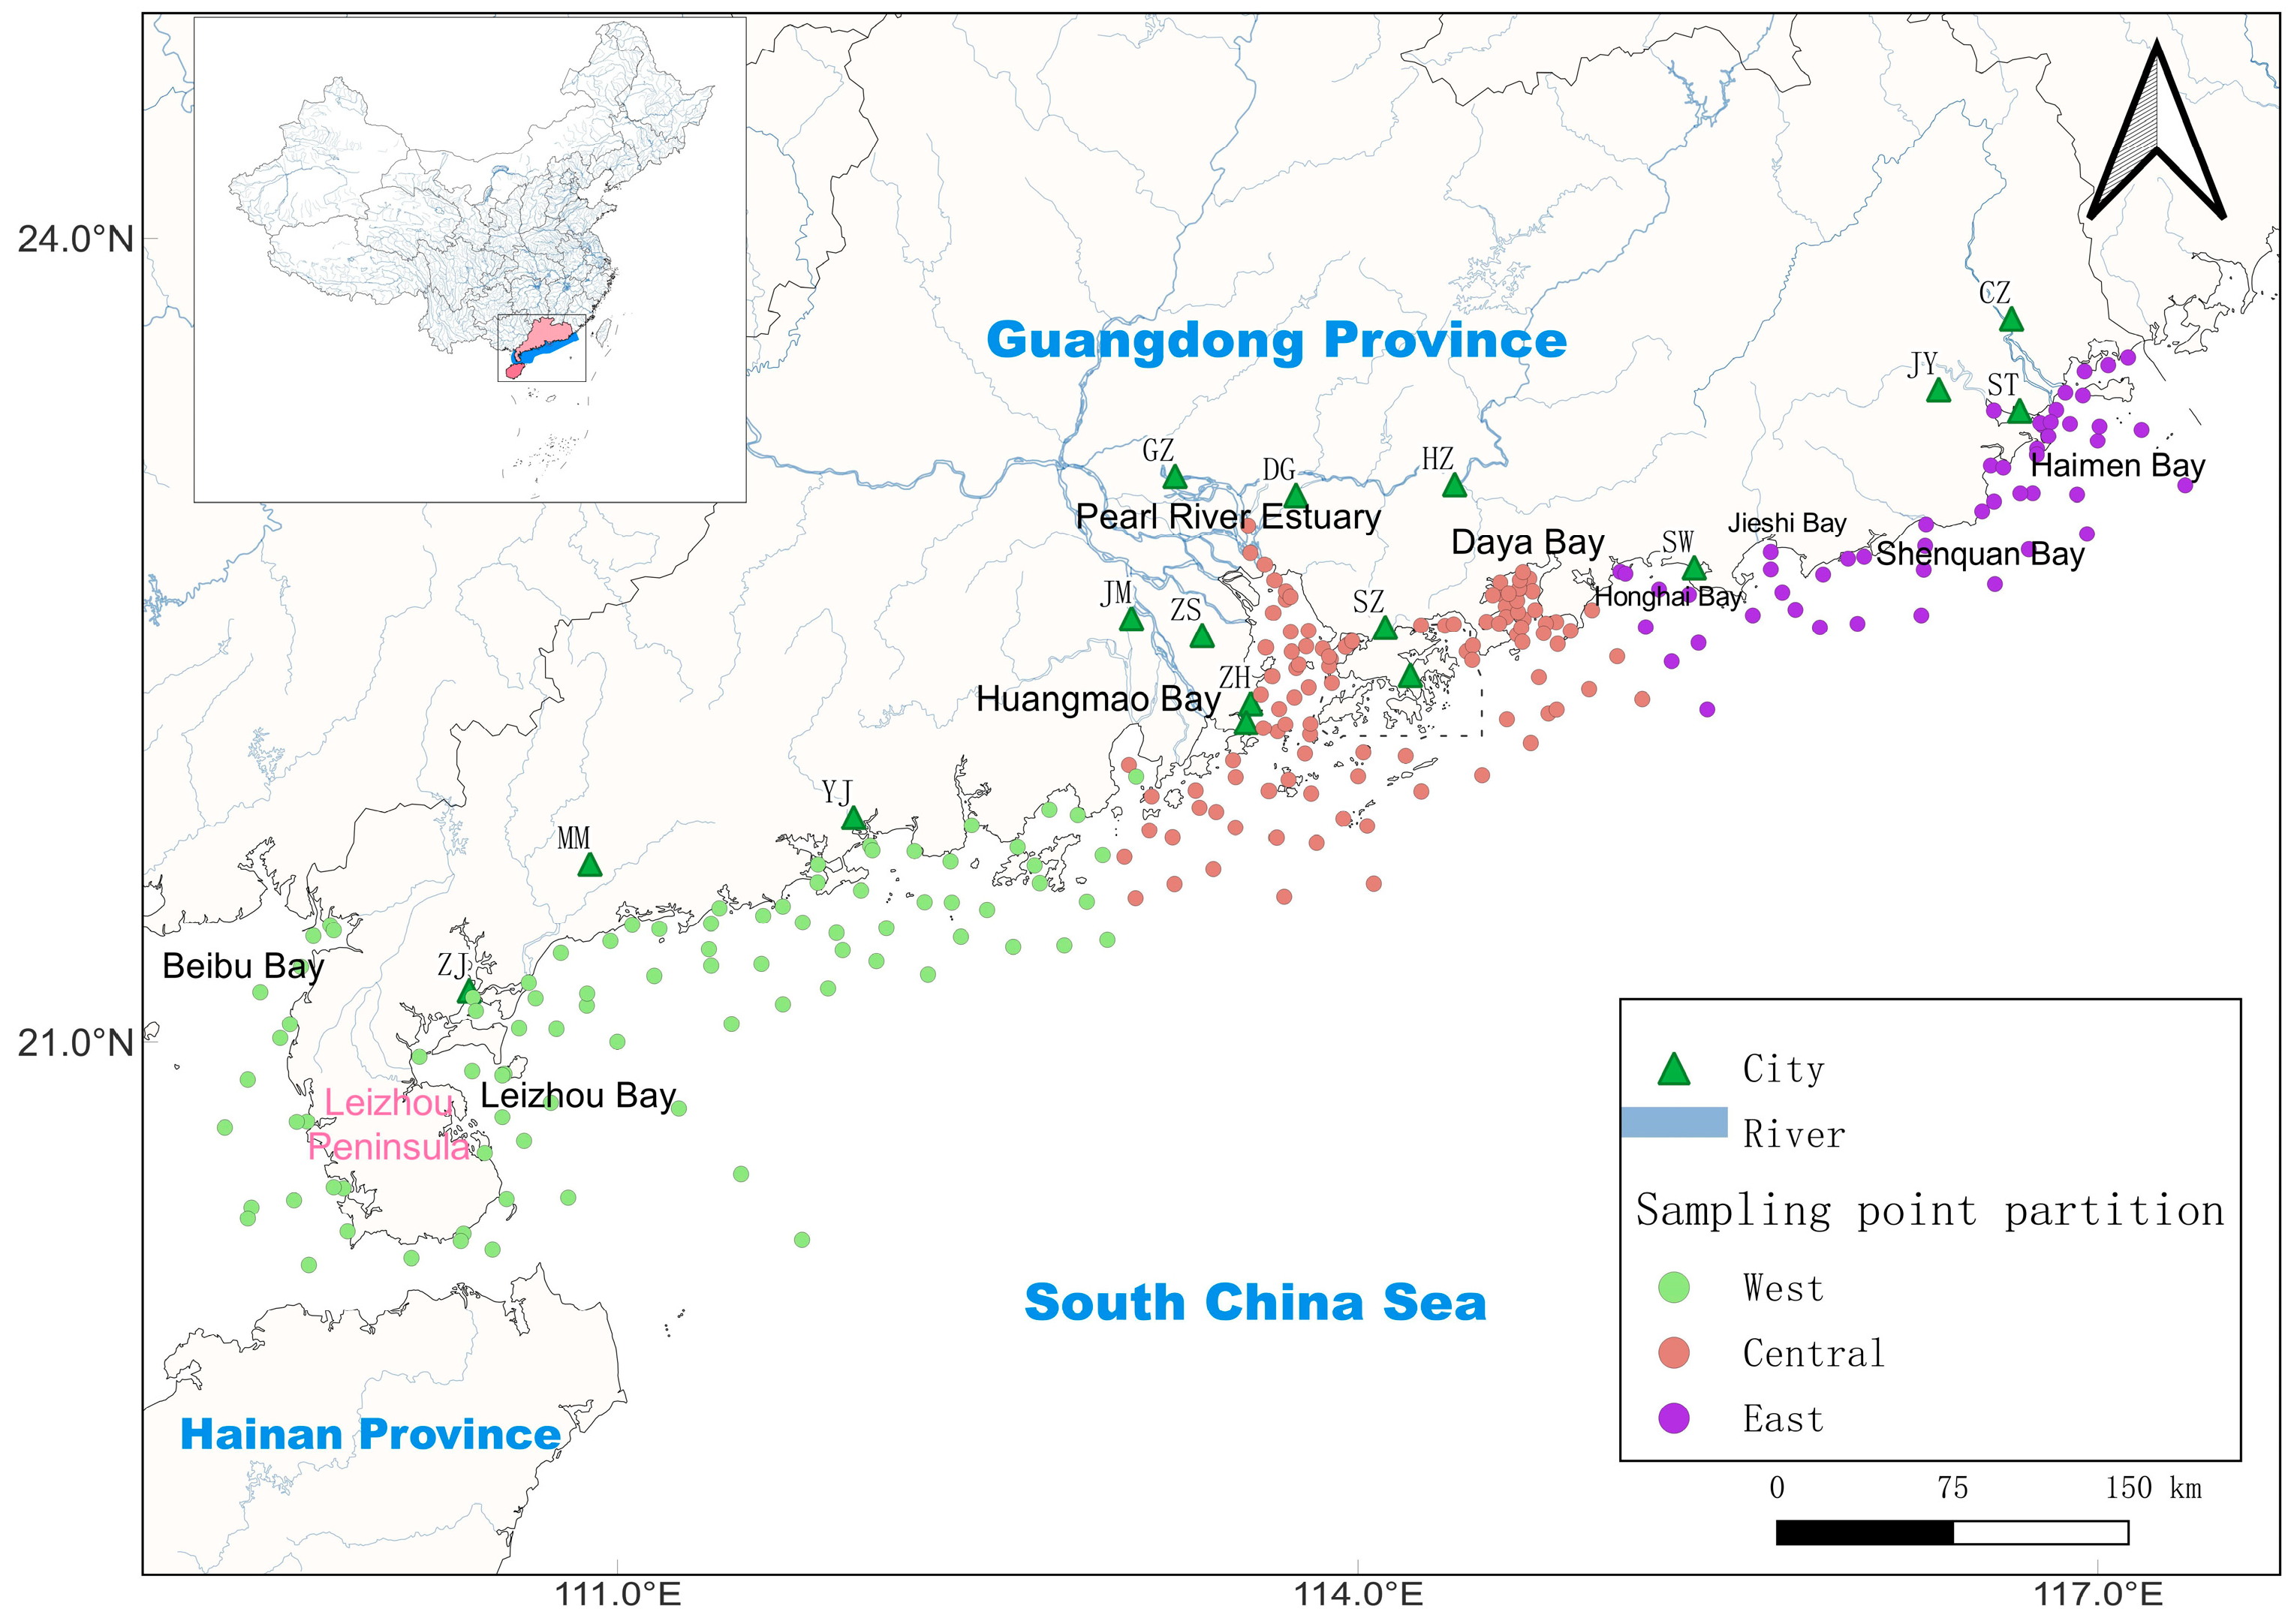
2.1. Study Sites

GD Province is in the southernmost part of mainland China and adjacent to the South China Sea, with a coastline of 3.37 × 10⁶ m. It has a subtropical maritime monsoon climate with a mean annual temperature of 22 °C and a mean annual precipitation of 1800 mm [40]. Rain and heat coincide in the same season, with precipitation mainly concentrated in April to September. Along the coastline from south to north, there are 14 cities in GD Province, namely ZhanJiang (ZJ), MaoMing (MM), YangJiang (YJ), JiangMen (JM), ZhuHai (ZH), ZhongShan (ZS), GuangZhou (GZ), DongGuan (DG), ShenZhen (SZ), HuiZhou (HZ), ShanWei (SW), JieYang (JY), ShanTou (ST), and ChaoZhou (CZ) City, as well as two Special Administrative Regions: Hong Kong and Macao. These 14 cities have distinct development patterns and account for more than 80% of GD’s GDP.
There are two major cross-provincial rivers along the coast that flow into the South China Sea. One is the Pearl River, a complex water system formed by the convergence of the Xijiang, Beijiang, Dongjiang and the rivers of the Pearl River Delta. It is the third-largest river in China and the largest water system flowing into the South China Sea. It has a total length of 2320 km, a basin area of 453,690 km2, and an annual runoff of more than 330 × 107 m3 [42]. The other is the Han River, with a main stream length of 470 km, a total catchment area of 30,112 km2, and a total annual runoff of 24.5 × 10⁷ m3.

2.2. Sampling and Analysis

Three campaigns were carried out in April (spring), August (summer), and October (autumn) of 2019 along the coast of GD Province. Surface water samples were collected from 242 stations. A spatial distribution map of the sampling points is provided in Figure 1. In this work, the study area was mainly divided into three parts: the west zone, central zone, and east zone.
The seawater samples were collected on board from 0.5 m below the water surface at each site using 5 L Niskin bottles and immediately filtered through a 0.45 μm cellulose acetate membrane. Additionally, the water samples were acidified to pH < 2 using nitric acid for Cu, Zn, and Pb and sulfuric acid for As and Hg. The filters and water samples were stored at −20 °C. The salinity, pH, and DO were measured onboard with respective meters.
Anodic stripping voltammetry (ASV) (797 VA, Metrohm, Herisau, Switzerland) was performed for Cu, Pb, and Zn analysis. ASV is the most commonly used technique known as the stripping electroanalytical method, which involves reconcentrating an analyte at the electrode surface in order to lower the detection limit for that analyte. The characteristic peak voltages used for Cu, Pb, and Zn were −0.30 V, −0.52 V, and −1.1 V, respectively. Atomic fluorescence spectrometry (AFS) (AFS-9562, Beijing Haiguang Instrument, Beijing, China) was performed to assess As and Hg. The samples were converted to gaseous atoms, and the element of interest was excited to a higher electronic energy level via a light source. Following excitation, the atoms were deactivated by the emission of a photon. The measured fluorescence stems from this emission process. The AFS negative high voltage and lamp current were 265 V and 28 mA for Hg detection and 275 V and 60 mA for As detection. To ensure the precision and accuracy of the analysis’s results, blanks, duplicate samples, and sample spikes were analyzed. The seawater-certified reference materials GBW(E)080040 (Second Institute of Oceanography, MNR) for Cu, Pb, and Zn; GBW(E)080042 (Second Institute of Oceanography, MNR) for Hg; and GBW(E)080117 (National Institute of Metrology, Beijing, China) for As were used for analysis validation. The relative standard deviation of duplicate samples was <11%, and the recovery rates of all the PTE varied from 88% to 105%. Chl a and COD were determined using spectrophotometry and alkalescent permanganate titration methods. The determination limits were 0.007 μg/L, 0.3 μg/L, 0.5 μg/L, 0.6 μg/L, 1.2 μg/L, and 0.11 μg/L for Hg, Pb, As, Cu, Zn, and Chl a, respectively. All the processes involved in pretreatment, preservation, and analysis were conducted according to the Code of Practice for Marine Monitoring Technology (GB 17378-2007) [43].

2.3. Pollution Assessment Methods

The Nemerow index has been widely used to evaluate environmental quality [44,45]. In this method, first, the signal factor pollution index (Pi) is calculated; it is the ratio between the measured concentration of each PTE and its background concentration and indicates the individual pollution degrees of different PTEs. Then, the average and maximum values of Pi were obtained to calculate the comprehensive water quality index (CWQI), which was used to reflect the total pollution degrees of 5 PTE at each site.
Pi = ci/cs
C W Q I = P i ¯ 2 + P i   m a x 2 2
where ci and cs are the measured concentrations and corresponding background values of each PTE, respectively; Pi is the signal-factor pollution index, which represents the exceeding multiple; CWQI is the comprehensive water quality index; and P i ¯ and P i   m a x represent the average and maximum Pi values of the 5 PTE, respectively. The grade-one seawater quality standard (GB 3097-1997) (Table S1) was used as the background value of the PTE [46]. Thus, the cs values of Hg, Pb, As, Cu, and Zn are 0.05, 1, 20, 5, and 20 μg/L, respectively. Coastal water pollution could be divided into 4 classes according to Pi: low pollution (Pi < 1), moderate pollution (1 < Pi < 3), considerable pollution (3 < Pi < 6), and very high pollution (Pi > 6). Based on the CWQI value, the water pollution situation could be divided into four levels: uncontaminated water (CWQI ≤ 1), minor contaminated water (1 < CWQI ≤ 2), moderately contaminated water (2 < CWQI ≤ 3), and heavily contaminated water (CWQI > 3).

2.4. Data Analysis

The spatial distribution of PTE in coastal water is directly related to the intensity of human activities along the coast and influenced by the geological and physical characteristics of seawater. The Kruskal–Wallis test, a non-parametric method, was used to explore the statistical differences among seasons and among areas. Spearman correlation analysis, principal component analysis (PCA), and two hierarchical cluster analyses were used to investigate the possible sources and explore the correlations among PTE and influencing factors. The normality and equal variance of the data were tested before further processing. The statistical analysis was conducted with the “SciPy” module in Python (Version: 3.9.12). Box plot was conducted with “seaborn” module in Python.

3. Results and Discussion

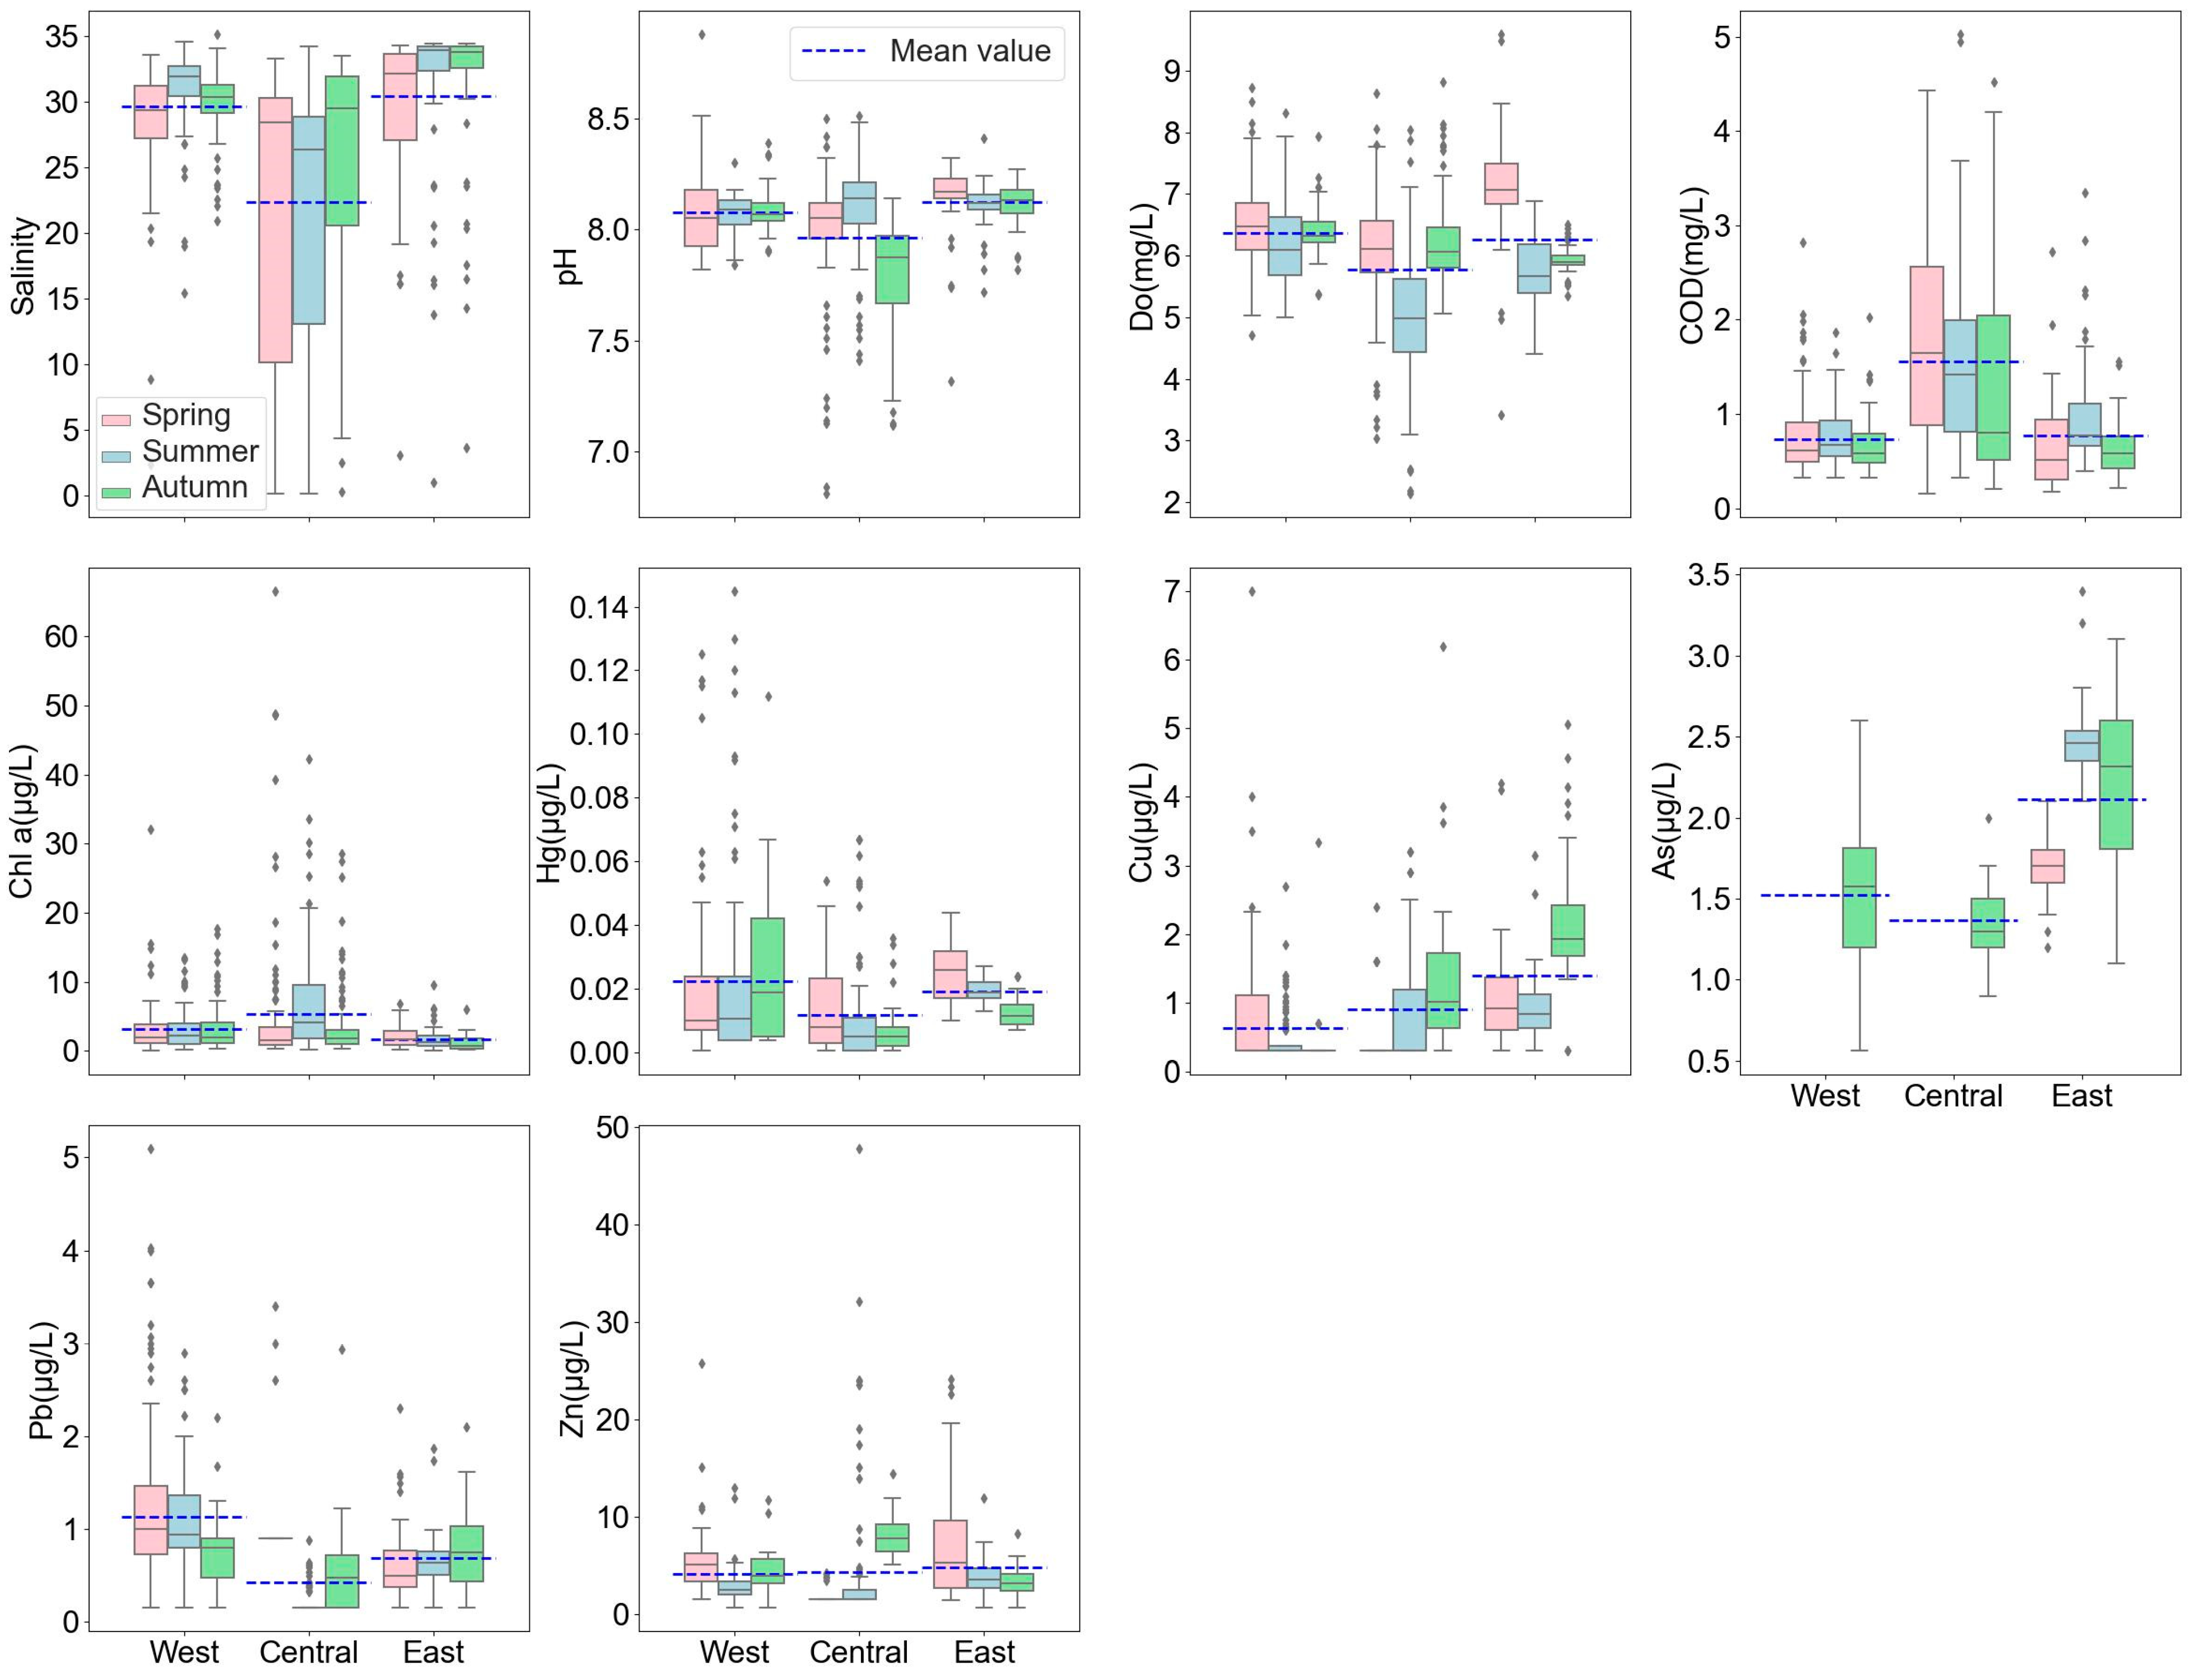
3.1. Spatial and Seasonal Distributions of Physicochemical Factors

Figure 2 exhibits the seasonal and regional variations in physicochemical factors. Figure S1 illustrates the spatial distributions of physicochemical factors over three seasons. Table S2 lists the p-value set for the Kruskal–Wallis test. The statistical data of physicochemical factors are shown in Table S3.
According to the results of the Kruskal–Wallis test, the differences among the three areas and among the three seasons were statistically significant for each physicochemical factor. The highest seasonal mean salinity was found in the west area (29.67), followed by the east area (27.49) and then the central zone (22.38). This difference was statistically significant. The lowest salinity occurred in the central area in the summer (20.78), and this may be due to the fact that the Pearl River has the greatest amount of runoff in the summer. The salinity of estuary waters in the central zone increased gradually along the river in the longitudinal direction, and the corresponding variance range is relatively high (from <0.1 to >34). Thus, salinity partly reflects the distance of the sampling point from the estuary in the central zone to some extent [47]. DO is an important parameter for evaluating seawater quality, which is influenced by temperature, biological and non-biological oxygen consumption [48], etc. In this study, DO showed a slight variation among the different seasons and areas. Several sampling sites in the narrow inner Pearl River Estuary had lower DO values (lower than 5), especially in the summer; this phenomenon can be attributed to the greater amount of dissolved oxygen being consumed by nutrient degradation in the Pearl River Estuary. Furthermore, the average dissolved oxygen content was lower than that in the other two seasons because of the high temperatures in the summer. Similarly, the central area had lower values and a higher variation in pH, with the lowest value occurring in the autumn (7.8). Higher mean pH levels were found in the east area, with the highest value occurring in the spring (8.15). The pH values of most sites range between 8 and 8.5.
COD is a comprehensive index reflecting the organic pollution status of water bodies, and it is more related to human activities than other physicochemical factors. The central area had the highest COD mean value (1.55 mg/L) compared with that of the west area (0.72 mg/L) and the east area (1.02 mg/L) in different seasons. In addition, the sites with higher COD values were mainly concentrated in the inner Pearl River estuary and Daya Bay, which are part of the central area (Figure S1). This phenomenon may be due to the heavy organic pollutants discharged from the large upstream watershed. However, this pollution had a limited influence on the offshore area due to the dilution and diffusion effects. In the central zone, COD corresponded to the following ranking: spring > summer > autumn; this result may be related to the continuous thunderstorms in the spring and drought in the autumn in 2019 [49]. Furthermore, it was found that the west and east zones had relatively high COD levels in the spring and summer, respectively. This may be highly affected by the seasonal patterns of the coastal ocean current near GD. The currents flow northeastward in the summer and southwestward in the spring and winter [50,51]. To an extent, the flow direction of a coastal current can influence the spread of the fresh water sourced from a river and the extent of pollution [34]. The highest mean Chl a level was 6.93 μg/L, which appeared in the central area during the summer. This may be due to the abundant nutrients from the upper Pearl River and higher temperatures, which promote phytoplankton growth in the summer. The variation range between different seasons in the central zone (from 0.2 to 66.6 μg/L) was more apparent than that in the other two areas. Additionally, the east area had the lowest Chl a (1.7 μg/L) compared to that of the central (5.36 μg/L) and west areas (3.2 μg/L).

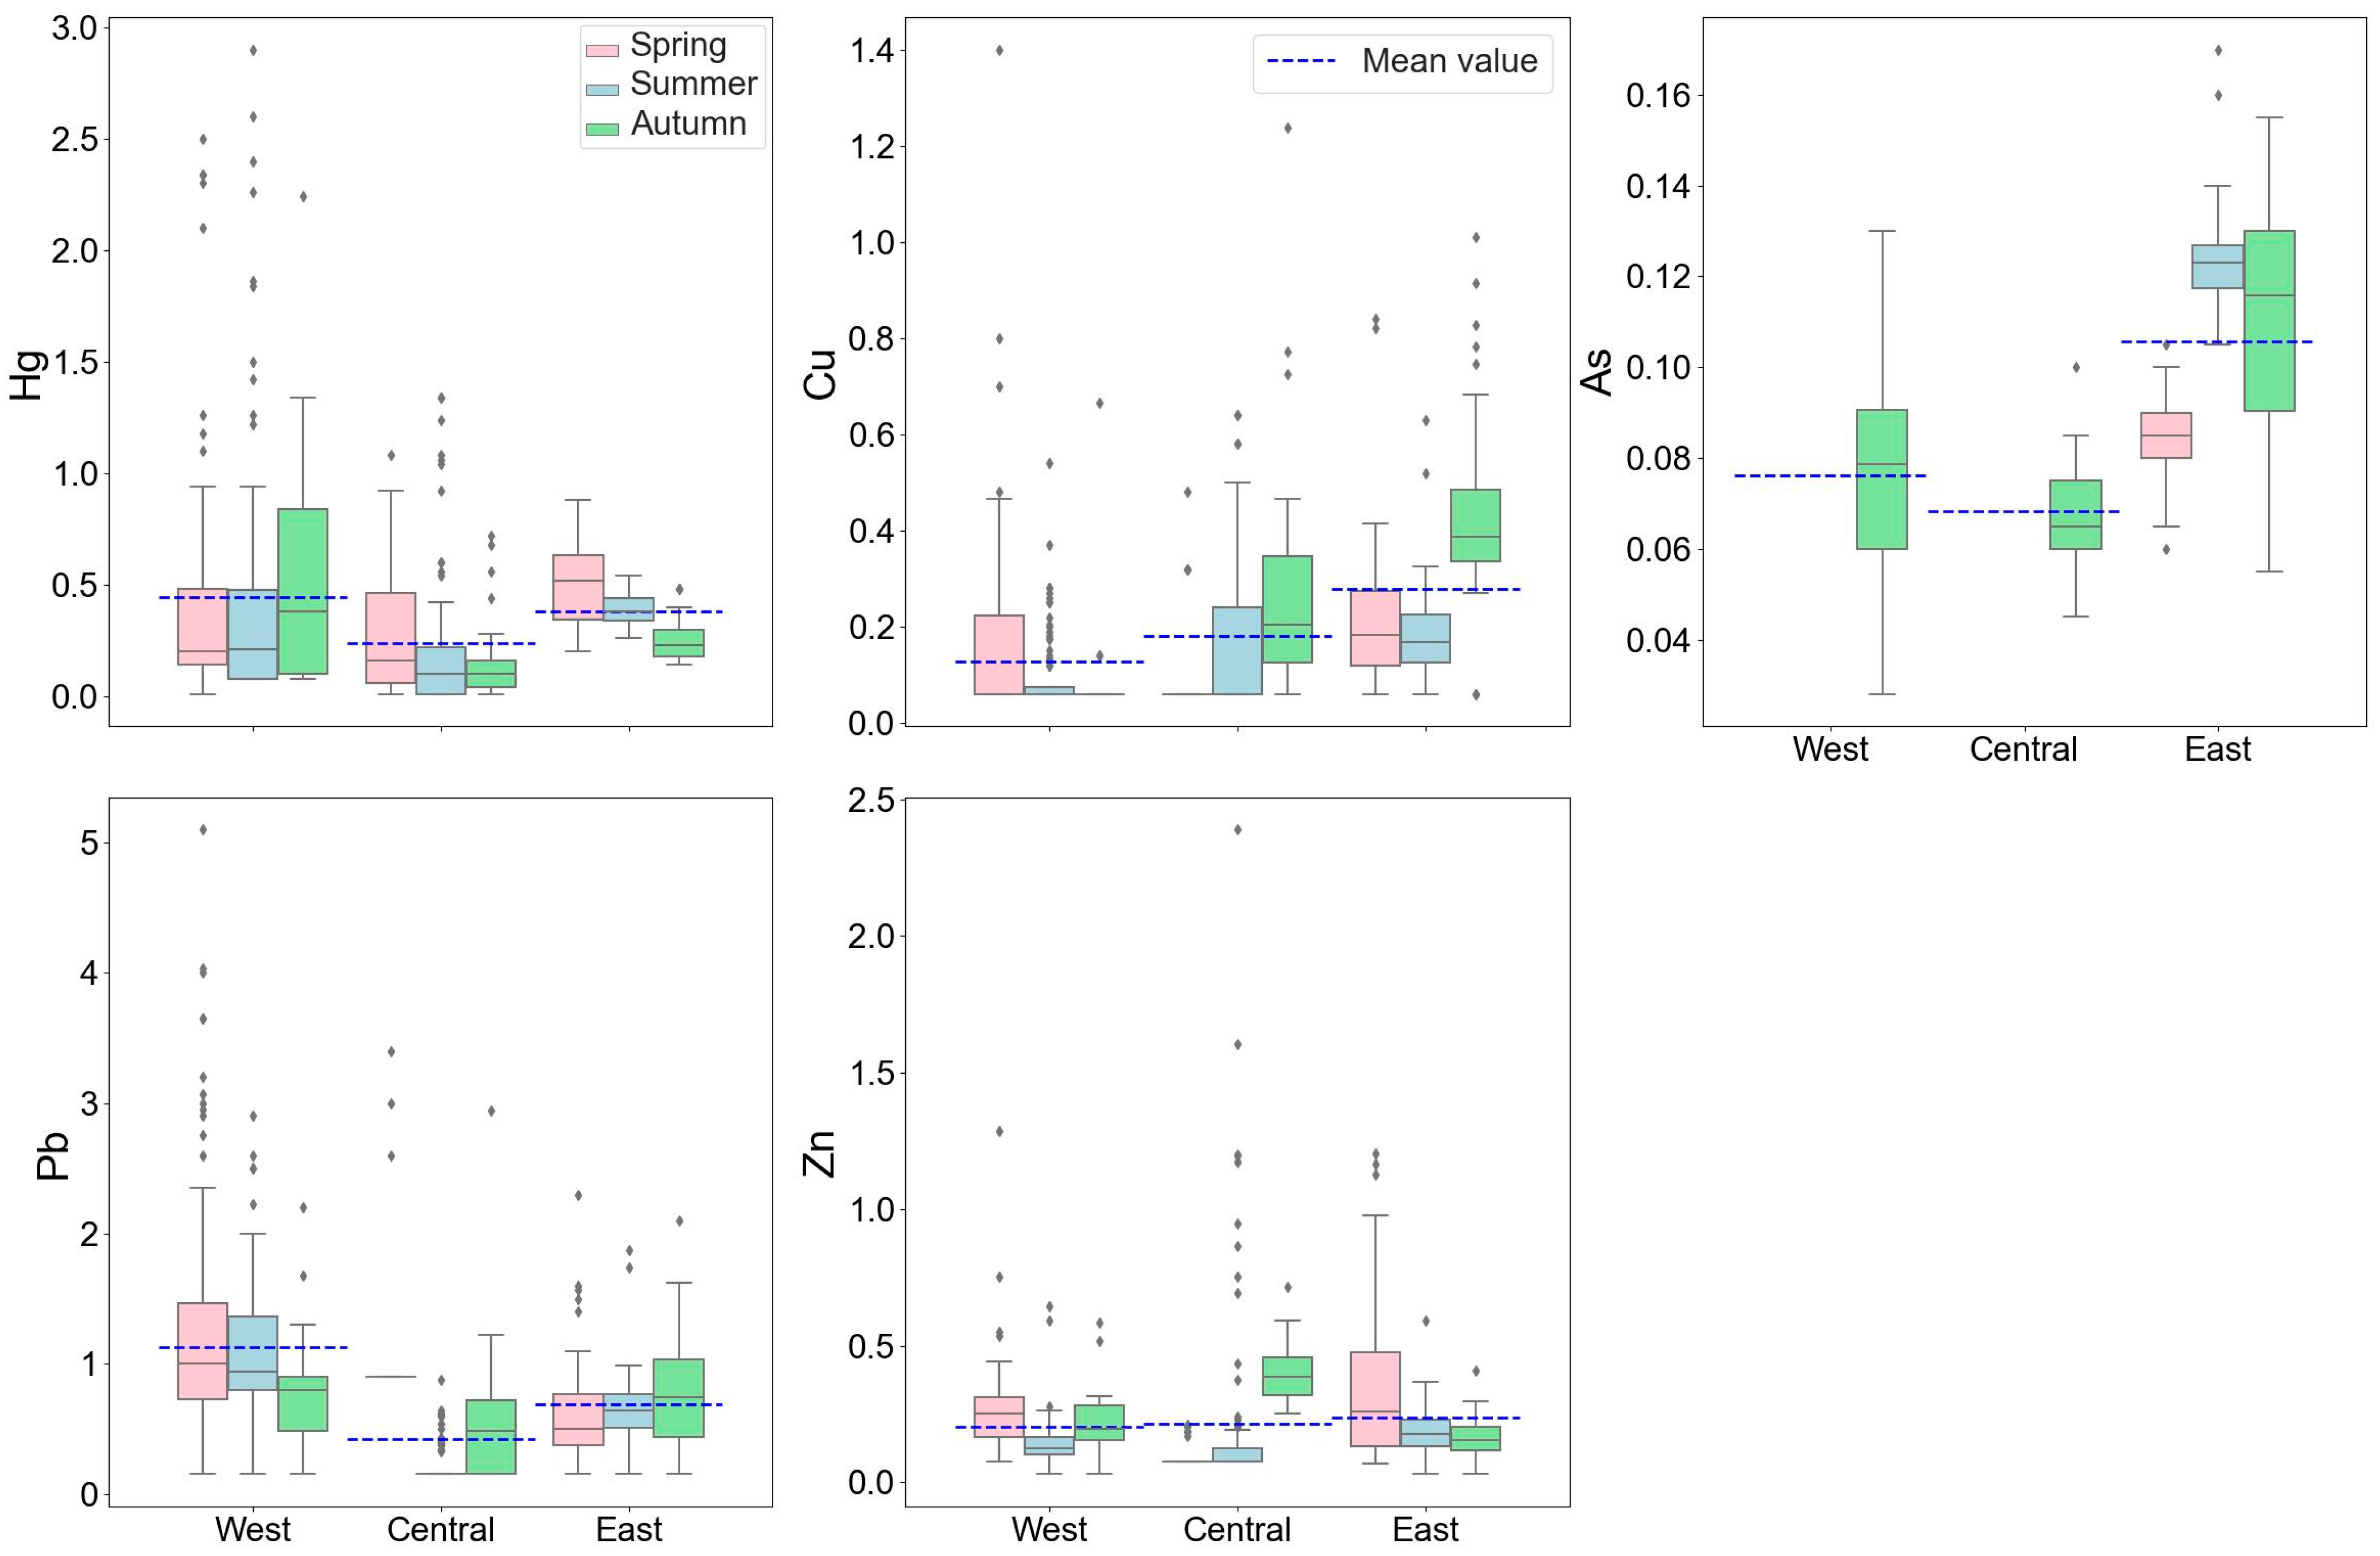
3.2. Spatial and Seasonal Distributions of PTE

Figure 2 exhibits the seasonal and regional variations in dissolved PTE. Table S2 lists the p-value set for the Kruskal–Wallis test, and Figure S2 illustrates the spatial distributions of PTE in the three seasons. The seasonal and regional statistical data on PTE are listed in Table S3.
According to the results of the Kruskal–Wallis test, the differences between the three areas and the three seasons were statistically significant for each PET. The spatial distribution of Hg exhibited a similar pattern throughout the seasons, with higher Hg values in the Leizhou peninsula, Daya Bay, and the east coast. The west zone had the highest mean value of Hg (0.024 μg/L), followed by the east zone (0.019 μg/L) and central zone (0.011 μg/L). In the spring and summer, the west zone had the highest Pb concentrations (1.33 μg/L and 1.08 μg/L), especially the area near YangJiang city and Leizhou peninsula, respectively. However, there was no clear pattern for Pb in the autumn. Compared with Hg and Pb, Cu had the highest values in the east zone (1.39 μg/L), followed by the central (0.96 μg/L) and west zones (0.61 μg/L). Relatively high Cu levels were present in the inner Pearl River Estuary in the summer, suggesting that the higher runoff of the Pearl River in the summer brought more Cu to the sea. Although the differences in the Zn mean value in each region were not large, they had obvious spatial distribution characteristics in the three seasons studied. Zn concentrations in the central region were low in the spring, but these values were higher in the summer and winter, and some extreme values were detected in the center zone during the summer. As levels were more evenly distributed spatially, with slightly higher concentrations in the east than in other regions in the autumn. The highest As concentration, 2.46 μg/L, was found in the east in the summer. In general, the average concentrations of Hg, Pb, Cu, Zn, and As in the whole study area were 0.018, 0.80, 0.99, 4.54, and 1.67 μg/L, corresponding to the following order: Zn > As > Cu > Pb > Hg.
Compared with the seawater quality standard (GB3097-1997) [46], nearly all the PTE measurement results did not exceed the Grade-II water quality standard, and most of them met the Grade-I water quality standard. For Hg, Pb, Cu, and Zn, about 94%, 77%, 99%, and 98% of all sampling sites, respectively, had concentrations lower than the Grade-I limit. Only one Pb measurement result was greater than the Grade-II limit. For As, the concentrations from all the sampling sites were lower than 20 μg/L, which is the Grade-I limit.
Figure 3 shows the Pi values of five PTEs, and detailed data are shown in Table S4. This heavy pollution was caused by Pb (max Pi:5.1), which reached considerable contamination levels. Although Zn was the most abundant element, its pollution degree reached moderate contamination levels like those of Hg and Cu. Hg had more sampling results classified as moderate contamination than Zn and Cu. In addition, since the Pi values for As were significantly lower than 1, As falls into the low-contamination range. Furthermore, the average Pi values of Cu, As, and Zn in the east area were generally higher, while those for Hg and Pb were higher in the west area; this may be due to the disparity of the industrial distribution characteristics of GD. The west area is rich in mineral resources, and the petrochemical and metal products industries are the major industries in this region. However, the most widely distributed industries in the eastern part of GD are the textile and electrical and electronic industries [29,52]. The average and seasonal spatial distributions of CWQI are shown in Figure S3. It can be observed that the majority of sites belonged to uncontaminated water (CWQI ≤ 1). Minor contaminated water was detected in the vicinity of Leizhou Peninsula during the spring and summer seasons (1 < CWQI ≤ 2). Moderately contaminated water was found in the west area during spring (2 < CWQI ≤ 3). And there was no instance of heavily contaminated water. Overall, the level of comprehensive PTE pollution in the coastal area of western GD was significantly higher than that in the other areas.
Furthermore, the current PTE data were compared with previously measured data and recent sampling results obtained from adjacent and global sea water bodies (Table 1). It is notable that the levels of Cu, Pb, Zn, and As were lower than the values observed 13 years ago, especially regarding Zn, and this phenomenon is probably related to the continuous strengthening of environmental protection in recent years [41]. Similarly, higher Cu, Zn, and As levels were detected in east GD, indicating that eastern GD has been more polluted by PTE than the west. In addition, the sorted order of the metals showed an analogous pattern: Zn > As > Cu > Pb > Hg. Compared with recent studies on GD’s coastal areas, the concentrations of PTE in this study were in the range of the values in the seawater along the GD coast. In Honghai Bay, the concentrations of Zn and Hg in 2017 were approximately twice the mean values observed in the eastern area of this study [53]. This could be attributed to the proximity of sampling sites to the coast in 2017, indicating a significant influence of land-based pollution on Zn and Hg levels. However, the concentration of As in this study was higher than that observed in 2017. In Daya Bay, Hg in 2020 was significantly higher than the mean value of the central area of this study [39]. This could be attributed to the fact that sampling sites were located within the bay in 2020 and there was an evident positive correlation between Hg and oil [39]. Considering the local economic composition, the petrochemical sewage, ship transportation and oil terminal contamination are likely to be the main sources of Hg in Daya Bay. In the Pearl River Estuary, previous studies have reported significantly higher levels of Zn compared to our findings [40]. The fluctuation in PTE results may be influenced by the sampling time, area, and statistical methods [39,40,53]. Compared with the reports from North China, the average levels of Cu, Pb, and Zn in GD were lower than those in Bohai Bay, the Shandong Peninsula, and the Yellow River Estuary [54,55]. The Luanhekou Estuary has lower Cu and Pb levels and higher Zn levels [54]. The lowest Cu, Pb, and Zn levels were found in the Yangtze River Estuary [56]. Compared with Beibu Gulf to the west of GD, the concentrations of Cu, Hg, and Zn were lower in GD, while the levels of As were higher [57]. Overall, the concentration levels of Cu, Pb, and Zn in the GD were at a low level compared to the results from other coastal waters studies conducted in China. Hg and As were present in moderate levels according to the listed concentrations. In addition, the average concentrations of PTE were lower than those in Tampamachoco in the Gulf of Mexico, the Gulf of Suez in Egypt, and the Meghna Estuary in Bangladesh, except with regard to Cu in Egypt [58,59,60]. Palk Bay in India had the lowest levels of Cu, Pb, and Zn [61].

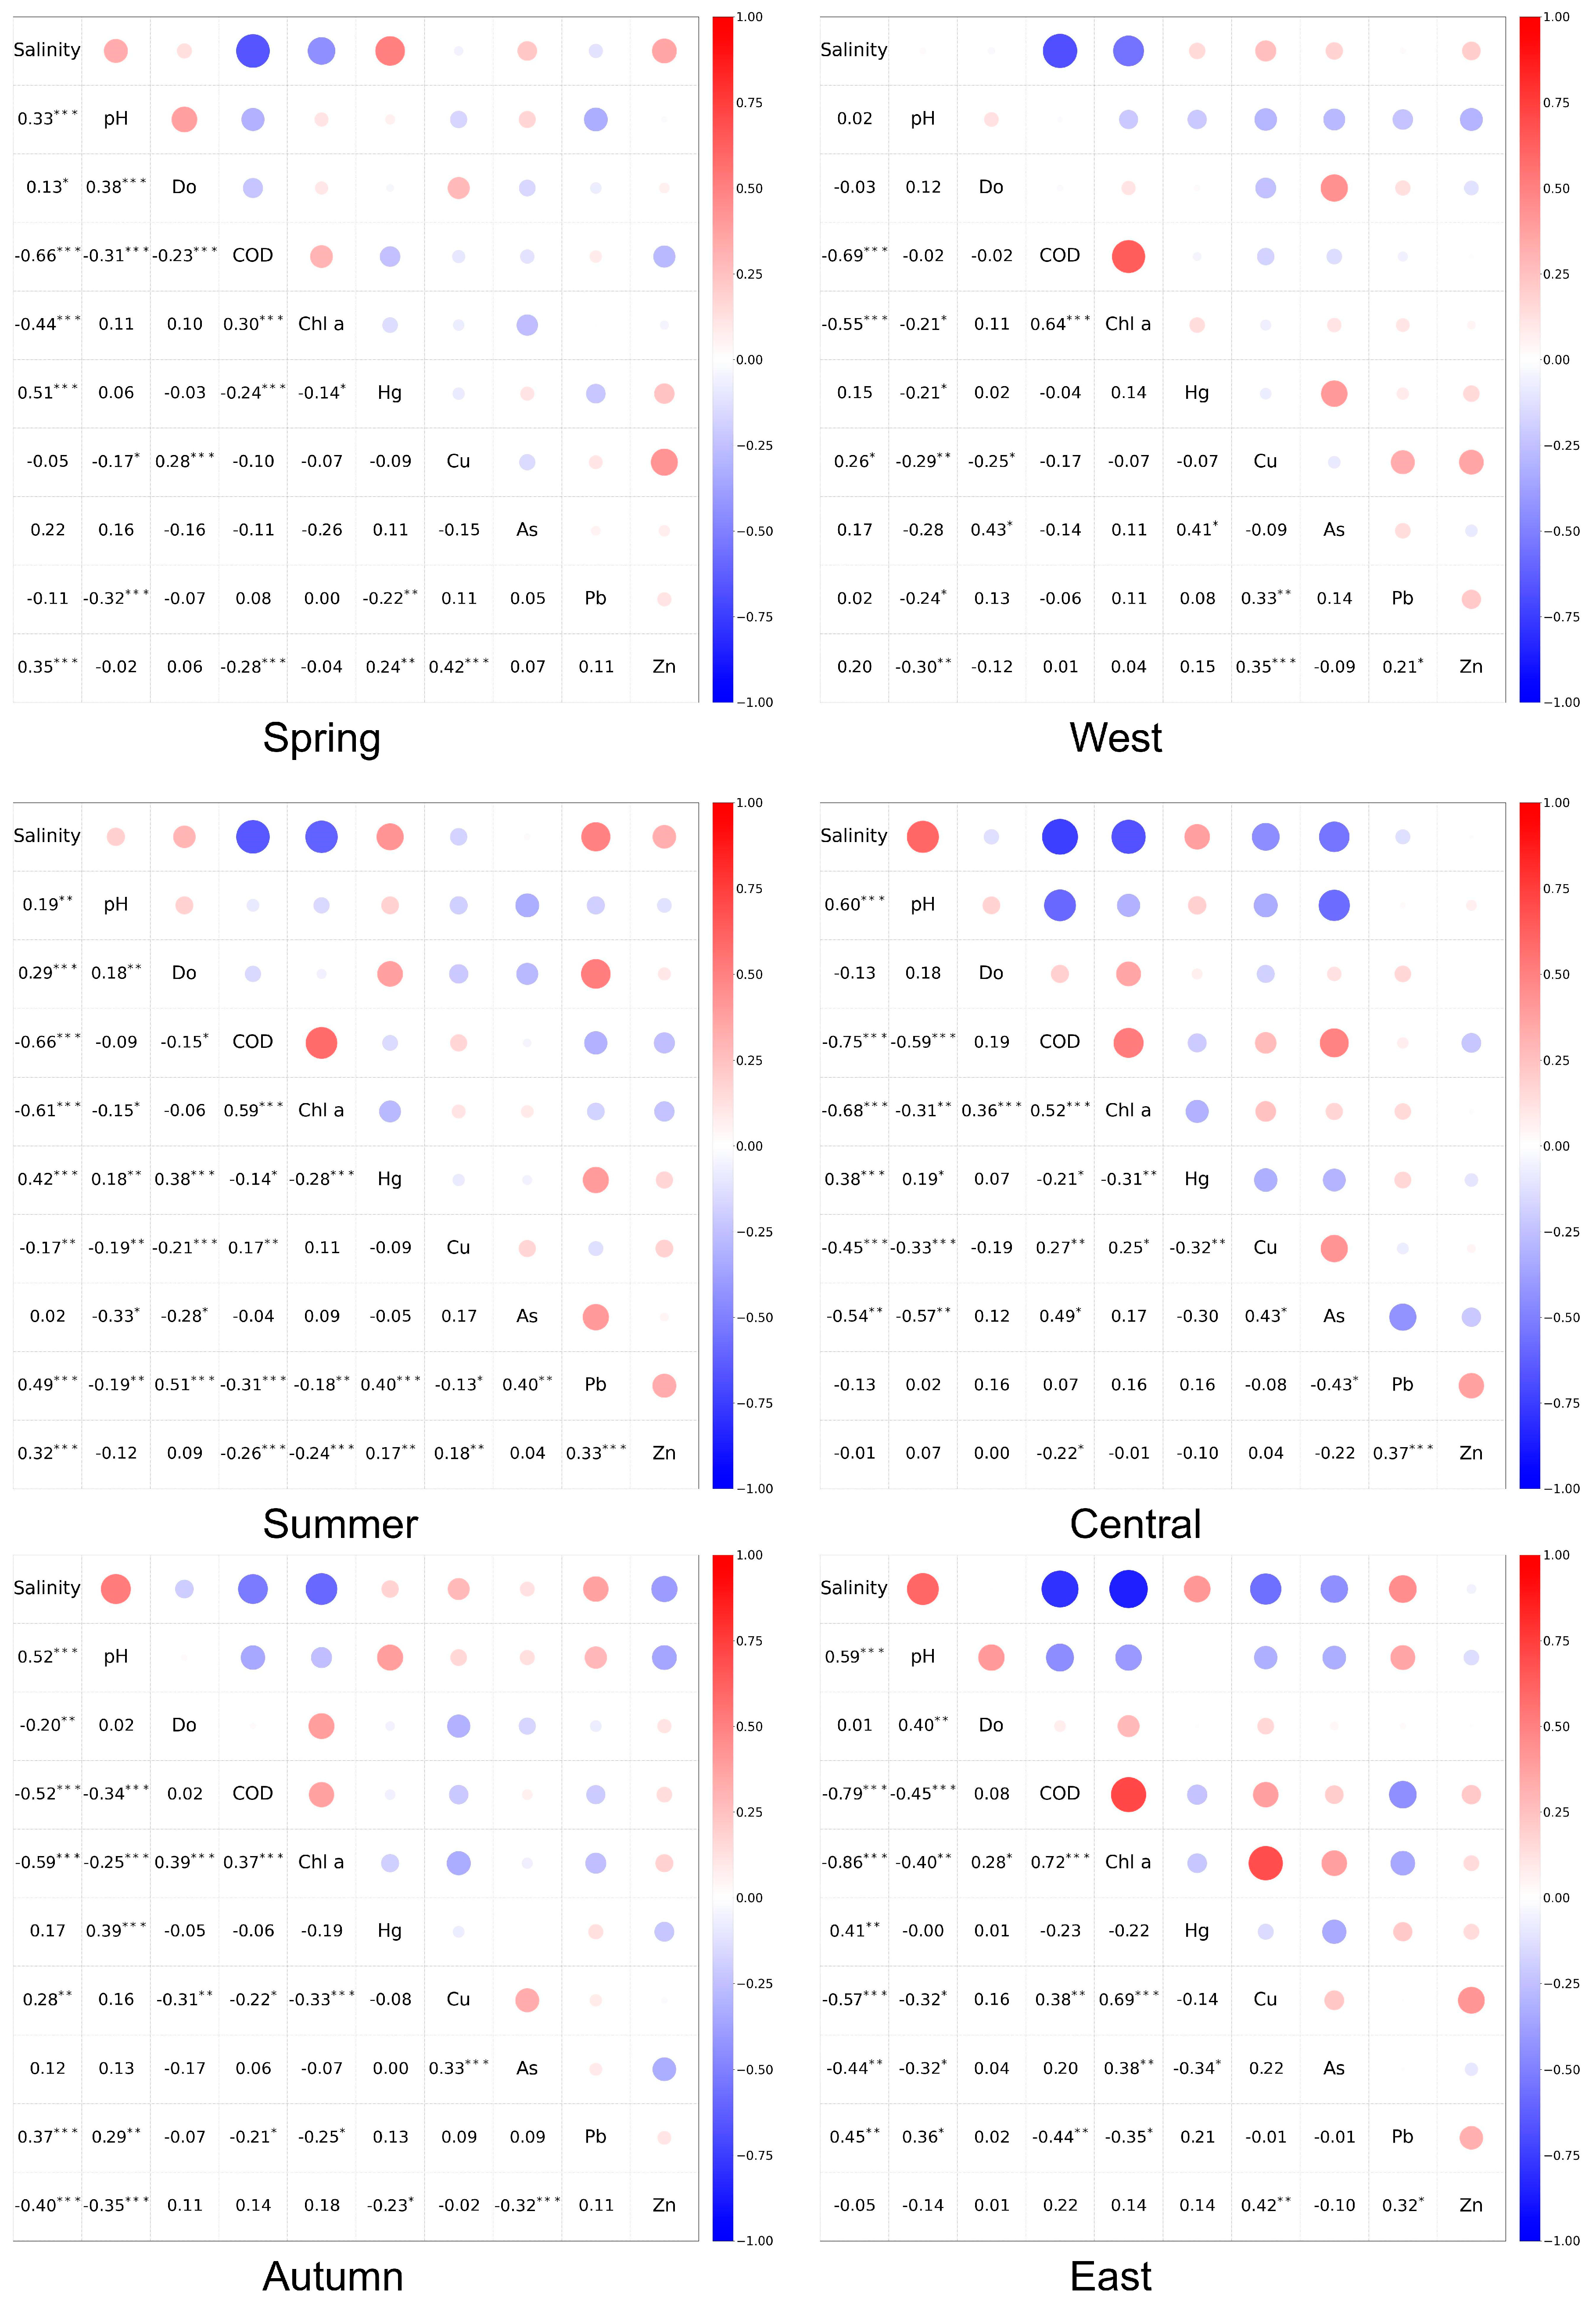
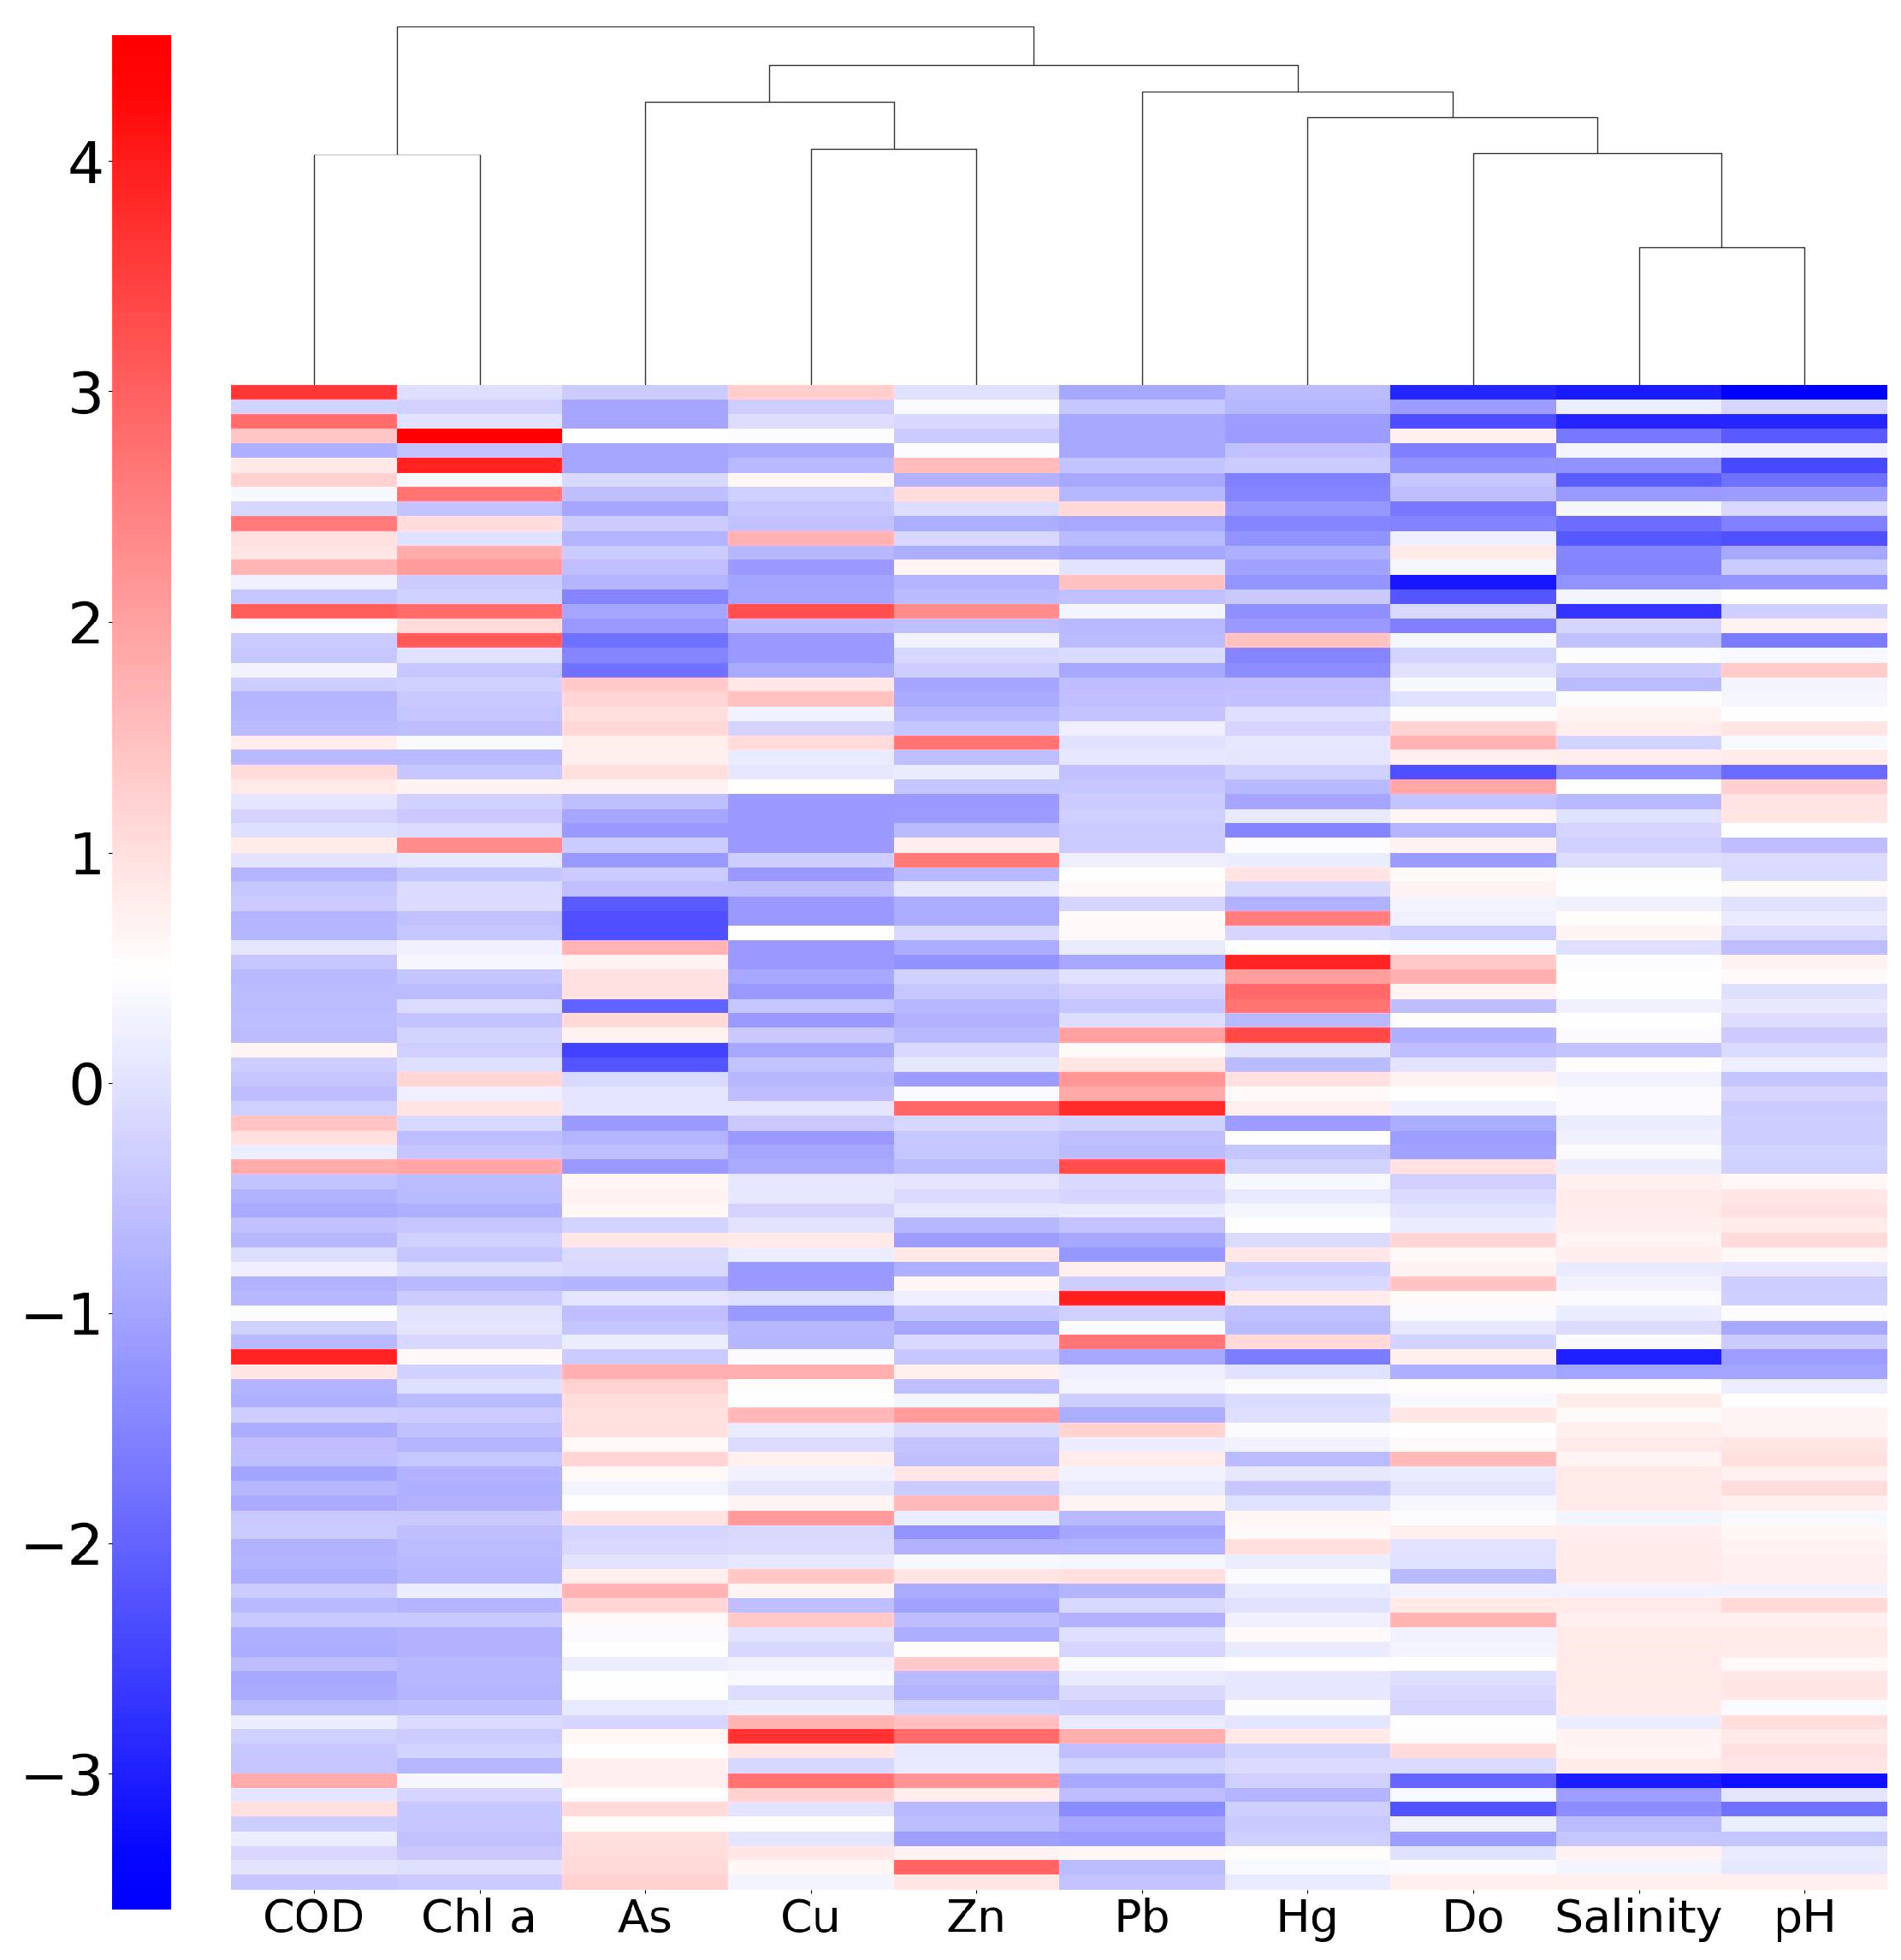
3.3. Statistical Analysis Results of Physicochemical Factors and PTE

Figure 4 presents the correlation coefficient and significance results between physicochemical factors and PTE concentrations. The correlations among physicochemical factors were similar among different seasons and areas. Salinity exhibited significant negative correlations with COD and Chl a in different seasons and areas but positive correlations with pH except in the west area. COD was positively correlated with Chl a. DO had weakly positive correlations with Chl a and pH and no significant correlations with salinity and COD.
Salinity, as a conservative factor, could reflect the behavior of PTE in the estuarine dilution-mixing process. Salinity was positively correlated with Hg, except in the autumn and in the west zone, and with Pb in the summer and autumn in the west zone, indicating that Hg and Pb were more influenced by the adsorption of suspended particles and atmospheric deposition. Leaded gasoline has been considered the most significant source of Pb pollution [62]. With the abolition of leaded gasoline usage, the major sources of Pb in the environment shifted to coal combustion and non-ferrous metal metallurgy. High amounts of salt water can inhibit the removal of Hg from seawater, enhancing the desorption effect of suspended particles, and resulting in the transformation of Hg from suspended particles to a dissolved state [63]. In addition, salinity had negative correlations with Cu and As in the central and east areas, indicating that the sources of Cu and As in this region were terrigenous.
COD is highly influenced by terrestrial pollution and discharged into the sea through rivers, and it can be used to indicate the contribution of upstream pollution. There were no significant correlations between COD and Hg, and the correlations between COD and Pb were negative in the east and in the summer, suggesting that terrestrial pollution might not be the major source of Hg and Pb. On the contrary, COD was positively correlated with Cu in the central and east areas and with As in the central zone.
Changes in the pH of seawater will affect the adsorption and desorption of PTE in suspended particulate matter. In general, the amount of PTE adsorbed by suspended particles in seawater increases with pH; conversely, hydrolytic desorption plays a dominant role, and the concentration of PTE in seawater increases [64]. PH was weakly negatively correlated with Cu except in the autumn, with As in the central and eastern regions in the summer, and with Zn in the west and in the autumn. The pH effects on Hg and Pb were temporally and spatially different.
The concentration of DO in water can affect this medium’s redox potential, thus affecting the migration and transformation of PTE in water. In general, PTE migrates more easily under aerobic conditions than anaerobic conditions [65]. DO has positive correlations with Hg and Pb in the summer and with As in the east area, while it has varied correlations with Cu. Zn has no correlations with Do. In general, the effect of redox on PTE was limited.
Chl a is an indicator of phytoplankton biomass in the ocean. Phytoplankton have different reactions to the physicochemical properties of different PTEs. Zn and Cu are essential elements for life and are involved in biophysiological metabolic processes [24]. As, as a trace element of the same main group as phosphorus, is absorbed by organisms as a phosphate analog in sea areas with low phosphorus content [66]. Furthermore, Pb and Hg are highly biotoxic. Chl a levels were weakly negatively correlated with Hg in the central area in the summer, with Pb in the east area in the summer and autumn, and with Zn in the summer, indicating the biological effects on the distribution of these PTE. On the contrary, Chl a showed positive correlations with Cu and As in the east area.
Table 2 lists the results of the PCA for physicochemical factors and PTE. The Kaiser–Meyer–Olkin (KMO) test was used to ensure the applicability of PCA analysis. The KMO statistics value was 0.668 and the significance probabilities of Bartlett’s spherical test were less than 0.05, verifying the adequacy of PCA analysis. The analysis yielded three principal components (PCs) that accounted for a total of 65.63% variance. PC1, PC2, and PC3 explained 35.95%, 16.98%, and 12.70% of the total variance, respectively. PC1 exhibited positive loadings for salinity, pH, Do, and Hg and negative loadings for COD and Chl a, indicating the influence of freshwater discharge. Cu, As, and Zn mainly contributed to PC2, and Pb mainly contributed to PC3.
The results of clustering analysis are illustrated in Figure 5 as a dendrogram. The ten items could be categorized into three clusters: (1) COD and Chl a, (2) As, Cu, and Zn, and (3) Pb, Hg, DO, salinity, and pH. The cluster results were in line with Spearman correlation and PCA analysis to some extent. As, Cu, and Zn may display similar origins. Hg and Pb showed different source patterns compared to As, Cu, and Zn. Hg exhibited a stronger association with terrestrial sources as it clustered together with DO, salinity, and pH. The origin characteristics of Pb differed from those of other elements. Luo found that atmospheric deposition is the main source of Pb in the Pearl River Estuary because of its volatile and ubiquitous character in the atmosphere. The fluxes of As and Zn from submarine groundwater discharge accounted for more than 54% of the total flux [40]. In general, the specific distribution of PTE in different seasons is affected by complex factors. Variations in physicochemical factors tend to influence the transportation, transformation, etc., of PTE [67]. However, the correlations between them were generally weak. The external inputs, including terrestrial sources from river discharge, atmospheric deposition from industries and fuel burning, and sedimentary sources, play a more important role.

4. Conclusions

In this study, the concentrations of five physicochemical factors and five PTE in the coastal water of GD were collected and analyzed in three seasons in 2019. Physicochemical factors showed obvious distribution characteristics that were highly affected by the Pearl River water. Salinity, DO, and pH levels were lower in the central area, while COD and Chl a levels were higher in that area. DO was lower in the summer, whereas COD and Chl a were higher in the summer. In general, the PTE concentrations showed the following decreasing ranking: Zn > As > Cu > Pb > Hg. However, Pb was the most abundant PTE, reaching considerable contamination levels. The concentrations of all measured PTE, except for Pb, were within Grade-II standards. Concentrations of As, Cu, Zn, Hg, and Pb were below the Grade-I limit at 100%, 99%, 98%, 94%, and 77% of all sampling points, respectively. The average pollution indices of Cu, As, and Zn in the east area were generally higher, while those for Hg and Pb were higher in the west area. The majority of sites belonged to uncontaminated water (CWQI ≤ 1). Minor and moderate contaminated water were detected in the west area.
Overall, two hierarchical clusters and PCA analysis revealed the potential source characteristics of PTE: Hg exhibited an association with terrestrial sources as it was grouped in the same cluster and PC along with DO, salinity, and pH. Pb appeared to be more influenced by the adsorption of suspended particles and atmospheric deposition. As, Cu, and Zn may display similar origins. It should be noted that the sources may vary across different locations and seasons. The correlation analysis showed that changes in physicochemical factors may influence the transportation, transformation, etc., of PTE. Although the level of PTE pollution in this region is slightly lower than it was before, the sources of PTE pollution are complex, and there is still a need to strengthen the control and management of PTE pollution.

Supplementary Materials

The following supporting information can be downloaded at: https://www.mdpi.com/article/10.3390/jmse12060896/s1, Figure S1: Spatial and seasonal distribution of physicochemical factors in spring (a), summer (b), and autumn (c); Figure S2: Spatial and seasonal distribution of potentially toxic elements in spring (a), summer (b), and autumn (c); Figure S3: Spatial distribution of the comprehensive water quality index (CWQI) in Guangdong coastal surface water; Table S1: Sea water quality standard (GB3097-1997) (μg/L); Table S2: p-values of Kruskal–Wallis test; Table S3: Concentrations of physicochemical factors and dissolved potentially toxic elements; Table S4: The pollution index of dissolved potentially toxic elements in Guangdong coastal surface.

Author Contributions

Conceptualization, G.K. and Z.Q.; Investigation, G.K., C.H. and F.W.; Methodology, Z.Q.; Writing—original draft, G.K.; Writing—review & editing, H.C. All authors have read and agreed to the published version of the manuscript.

Funding

This research was funded by National Natural Science Foundation of China, grant number 42307597 and Central Commonweal Research Institute Basic R&D Special Foundation of TIWTE, grant number TKS20230103.

Institutional Review Board Statement

Not applicable.

Informed Consent Statement

Not applicable.

Data Availability Statement

Data are unavailable due to privacy restrictions.

Conflicts of Interest

Author Fangzheng Wang was employed by the company Tianjin Water Transportation Engineering Survey and Design Institute Co., Ltd. The remaining authors declare that the research was conducted in the absence of any commercial or financial relationships that could be construed as a potential conflict of interest.

References

  1. Arikibe, J.E.; Prasad, S. Determination and comparison of selected heavy metal concentrations in seawater and sediment samples in the coastal area of Suva, Fiji. Mar. Pollut. Bull. 2020, 157, 111157. [Google Scholar] [CrossRef] [PubMed]
  2. Shen, C.; Shi, H.; Zheng, W.; Ding, D. Spatial heterogeneity of ecosystem health and its sensitivity to pressure in the waters of nearshore archipelago. Ecol. Indic. 2016, 61, 822–832. [Google Scholar] [CrossRef]
  3. Simenstad, C.; Yanagi, T. 1.01—Introduction to Classification of Estuarine and Nearshore Coastal Ecosystems. In Treatise on Estuarine and Coastal Science; Wolanski, E., McLusky, D., Eds.; Academic Press: Waltham, MA, USA, 2011; pp. 1–6. [Google Scholar]
  4. Liu, X.; Yu, S. Anthropogenic metal loads in nearshore sediment along the coast of China mainland interacting with provincial socioeconomics in the period 1980–2020. Sci. Total Environ. 2022, 839, 156286. [Google Scholar] [CrossRef] [PubMed]
  5. Zhang, S.; Pan, S.; Li, G.; Liu, Z. Spatial variation, sources, and potential ecological risk of metals in sediment in the northern South China Sea. Mar. Pollut. Bull. 2022, 181, 113929. [Google Scholar] [CrossRef] [PubMed]
  6. Pradit, S.; Noppradit, P.; Jitkaew, P.; Sengloyluan, K.; Kobkeatthawin, T.; Laerosa, A.; Sirivithayapakorn, S. Heavy Metal Contamination and Ecological Risk Assessment in the Sediment Cores of the Wetlands in Southern Thailand. J. Mar. Sci. Eng. 2022, 10, 1921. [Google Scholar] [CrossRef]
  7. Du, J.Z.; Mu, H.D.; Song, H.Q.; Yan, S.P.; Gu, Y.J.; Zhang, J. 100 years of sediment history of heavy metals in Daya Bay, China. Water Air Soil Pollut. 2008, 190, 343–351. [Google Scholar] [CrossRef]
  8. Shi, J.; Li, X.; He, T.; Wang, J.; Wang, Z.; Li, P.; Lai, Y.; Sanganyado, E.; Liu, W. Integrated assessment of heavy metal pollution using transplanted mussels in eastern Guangdong, China. Environ. Pollut. 2018, 243, 601–609. [Google Scholar] [CrossRef] [PubMed]
  9. Zhang, L.; Shi, Z.; Zhang, J.; Jiang, Z.; Wang, F.; Huang, X. Toxic heavy metals in sediments, seawater, and molluscs in the eastern and western coastal waters of Guangdong Province, South China. Environ. Monit. Assess. 2016, 188. [Google Scholar] [CrossRef] [PubMed]
  10. Wang, L.; Wang, X.; Chen, H.; Wang, Z.; Jia, X. Oyster arsenic, cadmium, copper, mercury, lead and zinc levels in the northern South China Sea: Long-term spatiotemporal distributions, combined effects, and risk assessment to human health. Environ. Sci. Pollut. Res. 2022, 29, 12706–12719. [Google Scholar] [CrossRef]
  11. Zhang, L.; Yan, W.; Xie, Z.; Cai, G.; Mi, W.; Xu, W. Bioaccumulation and changes of trace metals over the last two decades in marine organisms from Guangdong coastal regions, South China. J. Environ. Sci. 2020, 98, 103–108. [Google Scholar] [CrossRef]
  12. Kuang, Z.; Gu, Y.; Rao, Y.; Huang, H. Biological Risk Assessment of Heavy Metals in Sediments and Health Risk Assessment in Marine Organisms from Daya Bay, China. J. Mar. Sci. Eng. 2021, 9, 17. [Google Scholar] [CrossRef]
  13. Akcay, H.; Oguz, A.; Karapire, C. Study of heavy metal pollution and speciation in Buyak Menderes and Gediz river sediments. Water Res. 2003, 37, 813–822. [Google Scholar] [CrossRef] [PubMed]
  14. Morillo, J.; Usero, J.; Gracia, I. Heavy metal distribution in marine sediments from the southwest coast of Spain. Chemosphere 2004, 55, 431–442. [Google Scholar] [CrossRef] [PubMed]
  15. Nicolau, R.; Galera-Cunha, A.; Lucas, Y. Transfer of nutrients and labile metals from the continent to the sea by a small Mediterranean river. Chemosphere 2006, 63, 469–476. [Google Scholar] [CrossRef] [PubMed]
  16. Nouri, J.; Lorestani, B.; Yousefi, N.; Khorasani, N.; Hasani, A.H.; Seif, F.; Cheraghi, M. Phytoremediation potential of native plants grown in the vicinity of Ahangaran lead-zinc mine (Hamedan, Iran). Environ. Earth Sci. 2011, 62, 639–644. [Google Scholar] [CrossRef]
  17. Al-Kahtany, K.; El-Sorogy, A.S.; Alharbi, T.; Giacobbe, S.; Nour, H.E. Health risk assessment and contamination of potentially toxic elements in southwest of the Red Sea coastal sediment. Reg. Stud. Mar. Sci. 2023, 65, 103103. [Google Scholar] [CrossRef]
  18. Park, S.; Choi, M.; Jang, D.; Joe, D.; Park, K. Distribution and Sources of Dissolved and Particulate Heavy Metals (Mn, Co, Ni, Cu, Zn, Cd, Pb) in Masan Bay, Korea. Ocean Sci. J. 2020, 55. [Google Scholar] [CrossRef]
  19. Vardhan, K.H.; Kumar, P.S.; Panda, R.C. A review on heavy metal pollution, toxicity and remedial measures: Current trends and future perspectives. J. Mol. Liq. 2019, 290. [Google Scholar] [CrossRef]
  20. Tao, A. Study on the path of coordinated development between carbon emission reduction and economy in Guangdong Province. Energy Rep. 2022, 8, 477–481. [Google Scholar] [CrossRef]
  21. Yang, Y.; Chen, F.; Zhang, L.; Liu, J.; Wu, S.; Kang, M. Comprehensive assessment of heavy metal contamination in sediment of the Pearl River Estuary and adjacent shelf. Mar. Pollut. Bull. 2012, 64, 1947–1955. [Google Scholar] [CrossRef]
  22. Bi, M.; Xie, G.; Yao, C. Ecological security assessment based on the renewable ecological footprint in the Guangdong-Hong Kong-Macao Greater Bay Area, China. Ecol. Indic. 2020, 116, 106432. [Google Scholar] [CrossRef]
  23. Song, C.; Sun, C.; Xu, J.; Fan, F. Establishing coordinated development index of urbanization based on multi-source data: A case study of Guangdong-Hong Kong-Macao Greater Bay Area, China. Ecol. Indic. 2022, 140, 109030. [Google Scholar] [CrossRef]
  24. Liu, J. Accumulation of Heavy Metals in Multi-Phase Media and Their Transfer and Biomagnification in Food Web of Laizhou Bay; University of Chinese Academy of Sciences: Beijing, China, 2013. [Google Scholar]
  25. Tiwari, A.K.; Singh, P.K.; Mahato, M.K. Assessment of Metal Contamination in the Mine Water of the West Bokaro Coalfield, India. Mine Water Environ. 2017, 36, 532–541. [Google Scholar] [CrossRef]
  26. Islam, M.S.; Ahmed, M.K.; Raknuzzaman, M.; Habibullah-Al-Mamun, M.; Islam, M.K. Heavy metal pollution in surface water and sediment: A preliminary assessment of an urban river in a developing country. Ecol. Indic. 2015, 48, 282–291. [Google Scholar] [CrossRef]
  27. Ma, H.; Zhang, Y.; Liu, Z.; Chen, Y.; Lv, G. Pollution Characteristics of Heavy Metals in Surface Sediments of the Shuimo River in Urumqi, China. Metals 2023, 13, 1578. [Google Scholar] [CrossRef]
  28. Zhou, J. Distribution of Mercury in the Surface Water of the Yellow Sea and Bohai Sea; Ocean University of China: Qingdao, China, 2014. [Google Scholar]
  29. Zhang, X.; Cai, Y.; Chen, Q.; Zhong, M. Analysis of regional characteristics of industrial clusters in Guangdong Province. Product. Res. 2019, 73–81+153. (In Chinese) [Google Scholar] [CrossRef]
  30. Zhao, X.; Ji, X.; Qi, X. Study on Characteristic Pollutants of Wastewater in Major Wastewater Discharge Industries in China. In Proceedings of the Chinese Society of Environmental Sciences 2022 Annual Meeting of Science and Technology, Nanchang, China, 15 July 2022. [Google Scholar]
  31. Zhang, M.; Chen, G.; Luo, Z.; Sun, X.; Xu, J. Spatial distribution, source identification, and risk assessment of heavy metals in seawater and sediments from Meishan Bay, Zhejiang coast, China. Mar. Pollut. Bull. 2020, 156, 111217. [Google Scholar] [CrossRef]
  32. Pan, K.; Wang, W.-X. Trace metal contamination in estuarine and coastal environments in China. Sci. Total Environ. 2012, 421–422, 3–16. [Google Scholar] [CrossRef] [PubMed]
  33. Wang, S.-L.; Xu, X.-R.; Sun, Y.-X.; Liu, J.-L.; Li, H.-B. Heavy metal pollution in coastal areas of South China: A review. Mar. Pollut. Bull. 2013, 76, 7–15. [Google Scholar] [CrossRef]
  34. Wang, X.; Zhang, Y.; Luo, M.; Xiao, K.; Wang, Q.; Tian, Y.; Qiu, W.; Xiong, Y.; Zheng, C.; Li, H. Radium and nitrogen isotopes tracing fluxes and sources of submarine groundwater discharge driven nitrate in an urbanized coastal area. Sci. Total Environ. 2021, 763, 144616. [Google Scholar] [CrossRef]
  35. Feng, J.; Zhu, X.; Wu, H.; Ning, C.; Lin, G. Distribution and ecological risk assessment of heavy metals in surface sediments of a typical restored mangrove-aquaculture wetland in Shenzhen, China. Mar. Pollut. Bull. 2017, 124, 1033–1039. [Google Scholar] [CrossRef] [PubMed]
  36. Gu, Y.G.; Jiang, S.J.; Lin, Q.; Du, F.Y.; Zhang, L.B. Spatial, source, and risk assessment of heavy metals in sediments from the biggest mariculture base of eastern Guangdong coast, China. Fresenius Environ. Bull. 2013, 22, 3210–3216. [Google Scholar]
  37. Zuo, P.; Wang, Y.; Min, F.; Cheng, J. Distribution characteristics of heavy metals in surface sediments and core sediments of the Shenzhen Bay in Guangdong Province, China. Acta Oceanol. Sin. 2009, 28, 53–60. [Google Scholar]
  38. Zhang, D.; Zhang, X.; Tian, L.; Ye, F.; Huang, X.; Zeng, Y.; Fan, M. Seasonal and spatial dynamics of trace elements in water and sediment from Pearl River Estuary, South China. Environ. Earth Sci. 2013, 68, 1053–1063. [Google Scholar] [CrossRef]
  39. Liu, Y.; Kuang, W.; Xu, J.; Chen, J.; Sun, X.; Lin, C.; Lin, H. Distribution, source and risk assessment of heavy metals in the seawater, sediments, and organisms of the Daya Bay, China. Mar. Pollut. Bull. 2022, 174, 113297. [Google Scholar] [CrossRef] [PubMed]
  40. Luo, M.; Zhang, Y.; Li, H.; Hu, W.; Xiao, K.; Yu, S.; Zheng, C.; Wang, X. Pollution assessment and sources of dissolved heavy metals in coastal water of a highly urbanized coastal area: The role of groundwater discharge. Sci. Total Environ. 2022, 807, 151070. [Google Scholar] [CrossRef] [PubMed]
  41. Zhang, L.; Shi, Z.; Zhang, J.; Jiang, Z.; Wang, F.; Huang, X. Spatial and seasonal characteristics of dissolved heavy metals in the east and west Guangdong coastal waters, South China. Mar. Pollut. Bull. 2015, 95, 419–426. [Google Scholar] [CrossRef] [PubMed]
  42. Geng, J.; Wang, Y.; Luo, H. Distribution, sources, and fluxes of heavy metals in the Pearl River Delta, South China. Mar. Pollut. Bull. 2015, 101, 914–921. [Google Scholar] [CrossRef] [PubMed]
  43. GB 17378-2007; The Specification for Marine Monitoring. Standards Press of China: Beijing, China, 2007.
  44. Sun, X.; Li, B.-S.; Liu, X.-L.; Li, C.-X. Spatial Variations and Potential Risks of Heavy Metals in Seawater, Sediments, and Living Organisms in Jiuzhen Bay, China. J. Chem. 2020, 2020, 7971294. [Google Scholar] [CrossRef]
  45. Yan, N.; Liu, W.; Xie, H.; Gao, L.; Han, Y.; Wang, M.; Li, H. Distribution and assessment of heavy metals in the surface sediment of Yellow River, China. J. Environ. Sci. 2015, 39, 45–51. [Google Scholar] [CrossRef]
  46. GB 3097-1997; Sea Water Quality Standard. China Environmental Science Press: Beijing, China, 1997.
  47. Bakri, B.; Sumakin, A.; Widiasari, Y.; Mukrim, M. Distribution pattern of water salinity analysis in Jeneberang river estuary using ArcGIS. IOP Conf. Ser. Earth Environ. Sci. 2020, 419, 012116. [Google Scholar] [CrossRef]
  48. Zheng, Q.; Zhao, H.; Shi, Y.; Duan, M. Distribution Characteristics of Dissolved Oxygen in Spring in the Northern Coastal Beibu Gulf, a Typical Subtropical Bay. Water 2023, 15, 970. [Google Scholar] [CrossRef]
  49. China Meteorological Data Service Centre. Available online: https://data.cma.cn/site/ (accessed on 1 December 2023).
  50. Qiao, L. Reginal Oceanography of China Seas—Physical Oceanography; China Ocean Press: Beijing, China, 2012. [Google Scholar]
  51. Wang, J.; Tsang, L.M.; Dong, Y. Causations of phylogeographic barrier of some rocky shore species along the Chinese coastline. BMC Evol. Biol. 2015, 15, 114. [Google Scholar] [CrossRef]
  52. Song, Y. Research on Evolution of Spatial Distribution of Manufacturing Industry in Guangdong Province; Jilin University: Changchun, China, 2019. [Google Scholar]
  53. Gong, J.C.F.; Zheng, L.; Cao, W.; Li, Q.; Han, B.; Liu, X. The Concentrations and Pollution Assessment of Heavy Metal in Surface Seawater in Honghai Bay. Adv. Mar. Sci. 2021, 38, 11. [Google Scholar]
  54. Lin, H.S.; Li, H.J.; Yang, X.L.; Xu, Z.Z.; Tong, Y.D.; Yu, X.G. Comprehensive Investigation and Assessment of Nutrient and Heavy Metal Contamination in the Surface Water of Coastal Bohai Sea in China. J. Ocean Univ. China 2020, 19, 843–852. [Google Scholar] [CrossRef]
  55. Liu, R.; Jiang, W.; Li, F.; Pan, Y.; Wang, C.; Tian, H. Occurrence, partition, and risk of seven heavy metals in sediments, seawater, and organisms from the eastern sea area of Shandong Peninsula, Yellow Sea, China. J. Environ. Manag. 2021, 279, 111771. [Google Scholar] [CrossRef]
  56. Hu, X.; Shi, X.; Su, R.; Jin, Y.; Ren, S.; Li, X. Spatiotemporal patterns and influencing factors of dissolved heavy metals off the Yangtze River Estuary, East China Sea. Mar. Pollut. Bull. 2022, 182, 113975. [Google Scholar] [CrossRef]
  57. Lao, Q.; Su, Q.; Liu, G.; Shen, Y.; Chen, F.; Lei, X.; Qing, S.; Wei, C.; Zhang, C.; Gao, J. Spatial distribution of and historical changes in heavy metals in the surface seawater and sediments of the Beibu Gulf, China. Mar. Pollut. Bull. 2019, 146, 427–434. [Google Scholar] [CrossRef]
  58. Mohamed, A.E.; Heba, M.E.E.; Ahmed, R.E.; Mahmoud, S.K.; Ghada, Y.Z. Spatial distribution and risk assessment of heavy metals in the coastal waters of the Gulf of Suez, Red Sea, Egypt. Mar. Pollut. Bull. 2023, 193, 115122. [Google Scholar] [CrossRef]
  59. Mookan, V.P.; Machakalai, R.K.; Srinivasan, S.; Sigamani, S.; Kolandhasamy, P.; Gnanamoorthy, P.; Moovendhan, M.; Srinivasan, R.; Hatamleh, A.A.; Ai-Dosary, M.A. Assessment of metal contaminants along the Bay of Bengal — Multivariate pollution indices. Mar. Pollut. Bull. 2023, 192, 115008. [Google Scholar] [CrossRef]
  60. Reyes-Márquez, A.; Aguíñiga-García, S.; Morales-García, S.S.; Sedeño-Díaz, J.E.; López-López, E. Temporal distribution patterns of metals in water, sediment, and components of the trophic structure in a tropical coastal lagoon of the Gulf of Mexico. Environ. Sci. Pollut. Res. 2022, 29, 61643–61661. [Google Scholar] [CrossRef] [PubMed]
  61. Habib, S.B.; Hossain, M.B.; Hossain, M.S.; Jolly, Y.N.; Sarker, S. Ecological risk evaluation in bottom-surface sediments and sub-surface water in the subtropical Meghna estuarine system. Heliyon 2021, 7, e08324. [Google Scholar] [CrossRef] [PubMed]
  62. Jiang, S. Distribution and Behavior of Dissolved Lead in the Antarctic Peninsula and the Northwestern Pacific Ocean; East China Normal University: Shanghai, China, 2021. [Google Scholar]
  63. Zhang, H. Transformation and Environmental Effect of Mercury and Some Heavy Metals in Yangtze River Estuary and Its Adjacent Area; Ocean University of China: Qingdao, China, 2015. [Google Scholar]
  64. Garg, S.; Gauns, M. Chapter 11—Marine environmental chemistry and ecotoxicology of heavy metals. In Metals in Water; Shukla, S.K., Kumar, S., Madhav, S., Mishra, P.K., Eds.; Elsevier: Amsterdam, The Netherlands, 2023; pp. 195–211. [Google Scholar]
  65. Zhang, Y. Heavy Metals’ Process in Water and Pollution Risk Assessment in Surface Sediments of the Yellow River Estuary, Yangtze Estuary and Pearl River Estuary; Third Institute of Oceanography, Ministry of Natural Resources: Xiamen, China, 2013. [Google Scholar]
  66. Cheng, Y. Behavior of Dissolved Arsenic in the Jiaozhou Bay, East China Sea and Part of South China Sea; Ocean University of China: Qingdao, China, 2005. [Google Scholar]
  67. Lu, Y.; Pan, D.; Yang, T.; Wang, C. Distribution characteristics and controlling factors of typical heavy metals in Huanghe River estuary, China. J. Oceanol. Limnol. 2023, 41, 150–165. [Google Scholar] [CrossRef]
Figure 1. Location of study area and sampling sites.
Jmse 12 00896 g001
Figure 2. Box plots of concentrations of physicochemical factors and PTE (The box extends from the first quartile to the third quartile of the data, with a line at the median. The whiskers extend from the box to the farthest data point lying within 1.5× the inter-quartile range from the box. The values outside of the whiskers can be treated as outliers).
Jmse 12 00896 g002
Figure 3. Box plots of PTE pollution indices.
Jmse 12 00896 g003
Figure 4. Heatmap of Pearson correlations between physicochemical factors and PTE (* p < 0.05. ** p < 0.01, *** p < 0.001).
Jmse 12 00896 g004
Figure 5. Dual hierarchical cluster results of physicochemical parameters and PTE.
Jmse 12 00896 g005
Table 1. Concentrations of dissolved heavy metals s in Guangdong coastal surface seawater and comparison with other regions (μg/L).
LocationConcentrationReference
CuPbZnHgAs
West GD (2019)
Central GD (2019)
East GD (2019)
0.61
0.96
1.39
1.05
0.63
0.69
4.22
4.64
4.75
0.024
0.011
0.019
1.52
1.36
2.11
This study
West GD (2006)
East GD (2006)
1.91
2.24
1.81
1.94
11.86
14.05
-1.86
2.48
[41]
Honghai Bay, East GD (2017)1.991.0311.620.0371.03[51]
Daya Bay, Central GD (2020)1.610.6034.080.0231.83[39]
Pearl River Estuary, Central GD (2019)1.141.0824.1-1.24[40]
Luanhekou Estuary (2017)0.890.6613.590.051.72[54]
Bohai Bay (2017)2.241.106.080.021.96
Yellow River Estuary (2017)1.831.3416.180.021.18
Shandong Peninsula (2016)2.461.5117.2-0.98[55]
Yangtze River Estuary (2019)0.3830.0840.330-1.89[56]
Beibu Gulf (2017)3.030.7110.0 0.10 0.74[57]
Tampamachoco, Gulf of Mexico (2019)1.371.92 0.24 [60]
Gulf of Suez, Egypt (2021)0.951.475.44--[58]
Meghna Estuary, Bangladesh (2017)5.25 6.9 4.39[59]
Palk Bay, India0.660.052.66--[61]
Table 2. Principal component analysis results of physicochemical factors and PTE.
ItemPC1PC2PC3
Salinity0.938
COD−0.886
pH0.852
Chl a−0.621 0.401
Do0.548
Hg0.537 0.341
Cu 0.894
As0.3430.681
Zn 0.5760.563
Pb 0.767
Variance %35.95%16.98%12.70%
Cumulative %35.95%52.93%65.63%
Disclaimer/Publisher’s Note: The statements, opinions and data contained in all publications are solely those of the individual author(s) and contributor(s) and not of MDPI and/or the editor(s). MDPI and/or the editor(s) disclaim responsibility for any injury to people or property resulting from any ideas, methods, instructions or products referred to in the content.

