
Design and Analysis of a Buoy-Based Cable Seafloor Observatory System Response under Extreme Weather Conditions

 ,
,
Abstract
1. Introduction
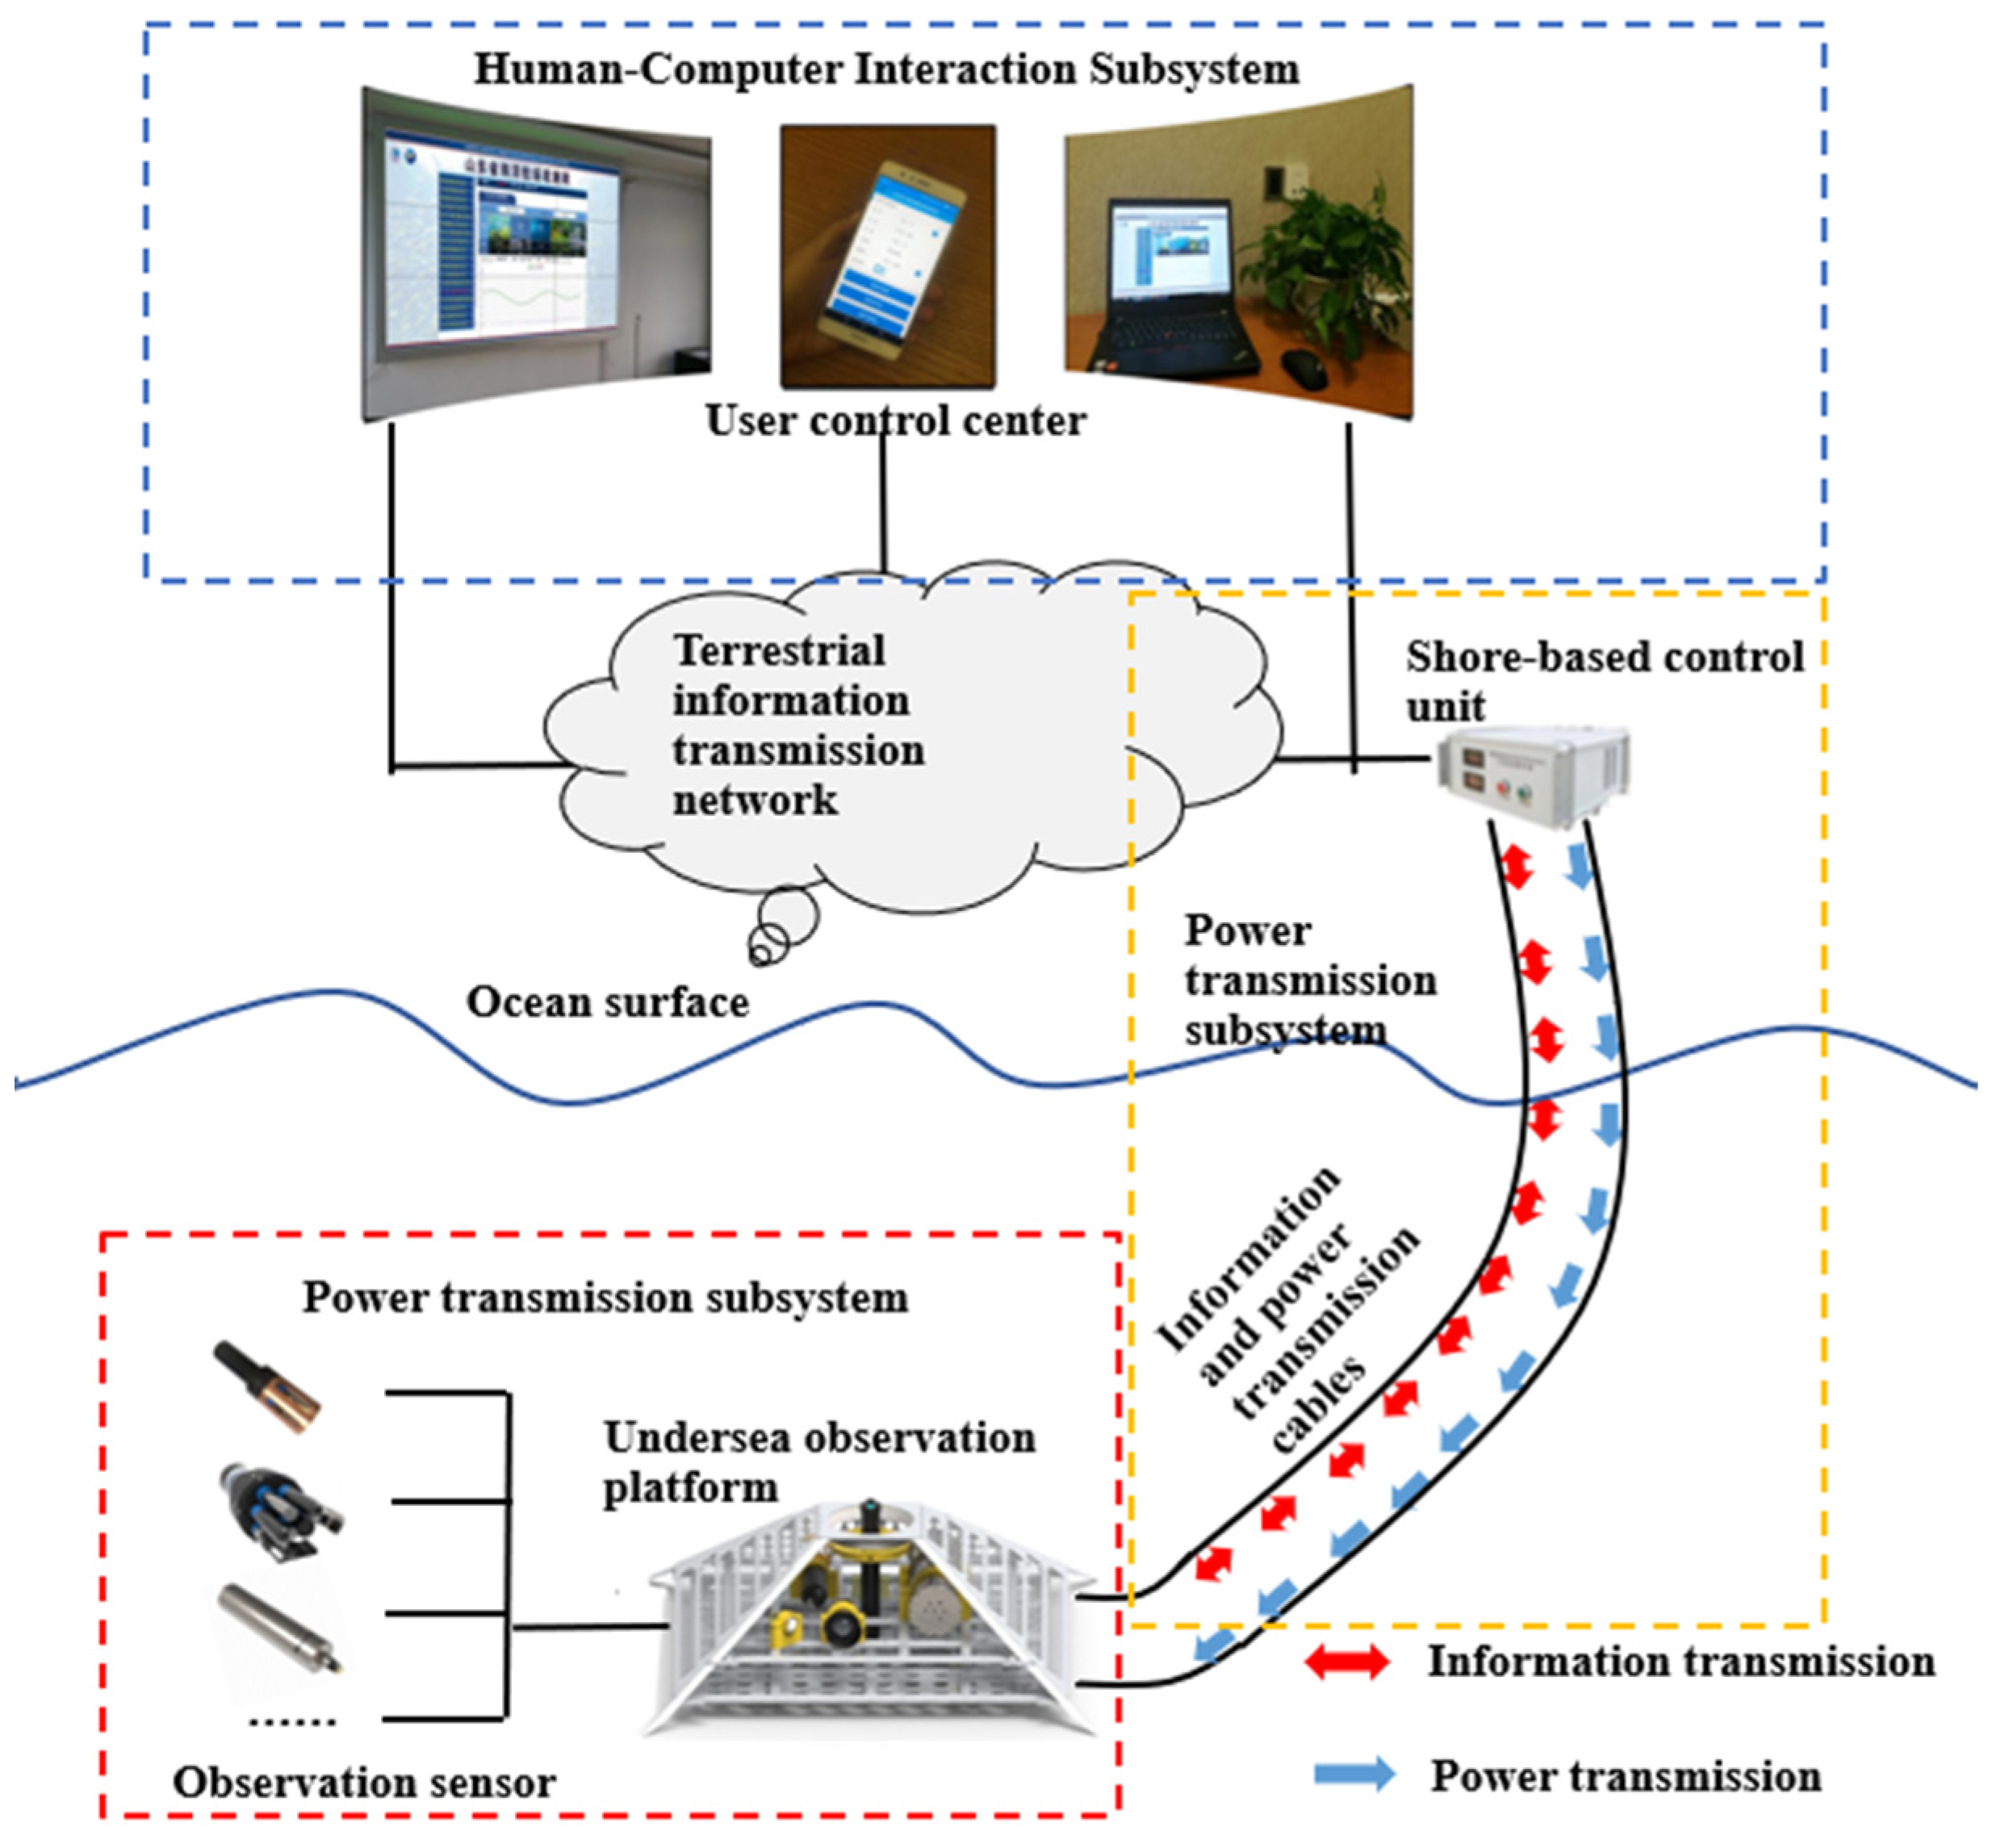
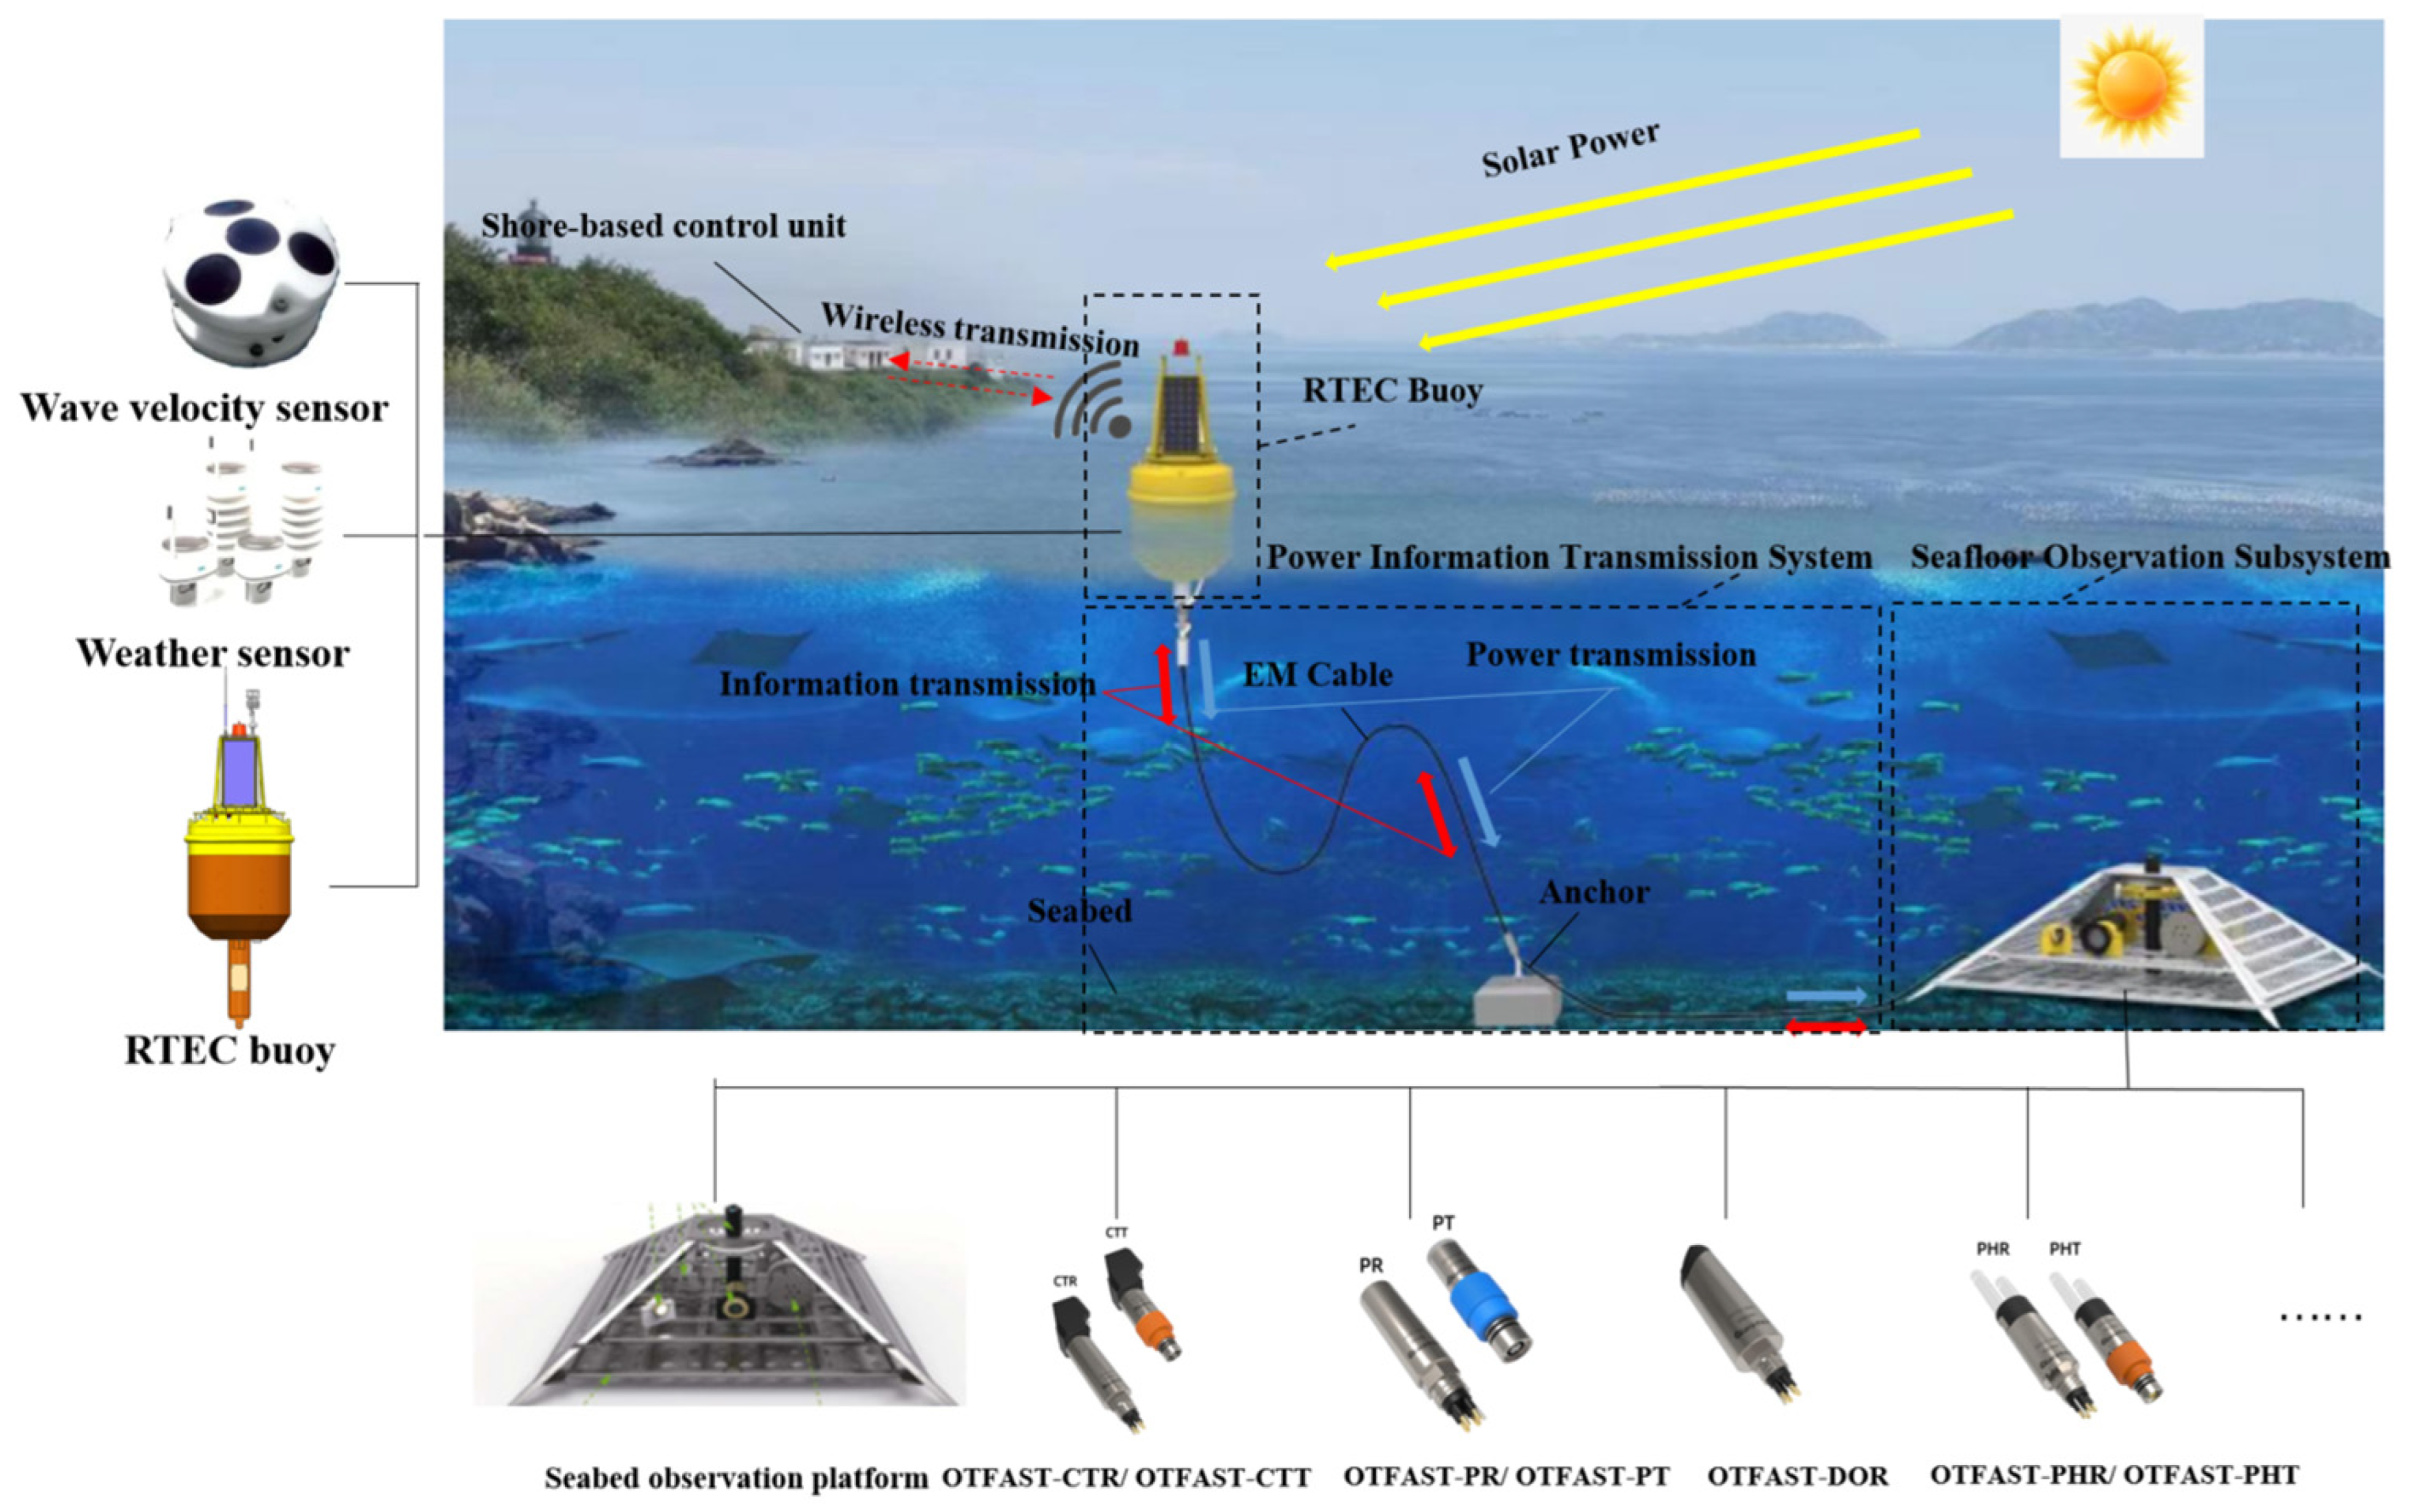
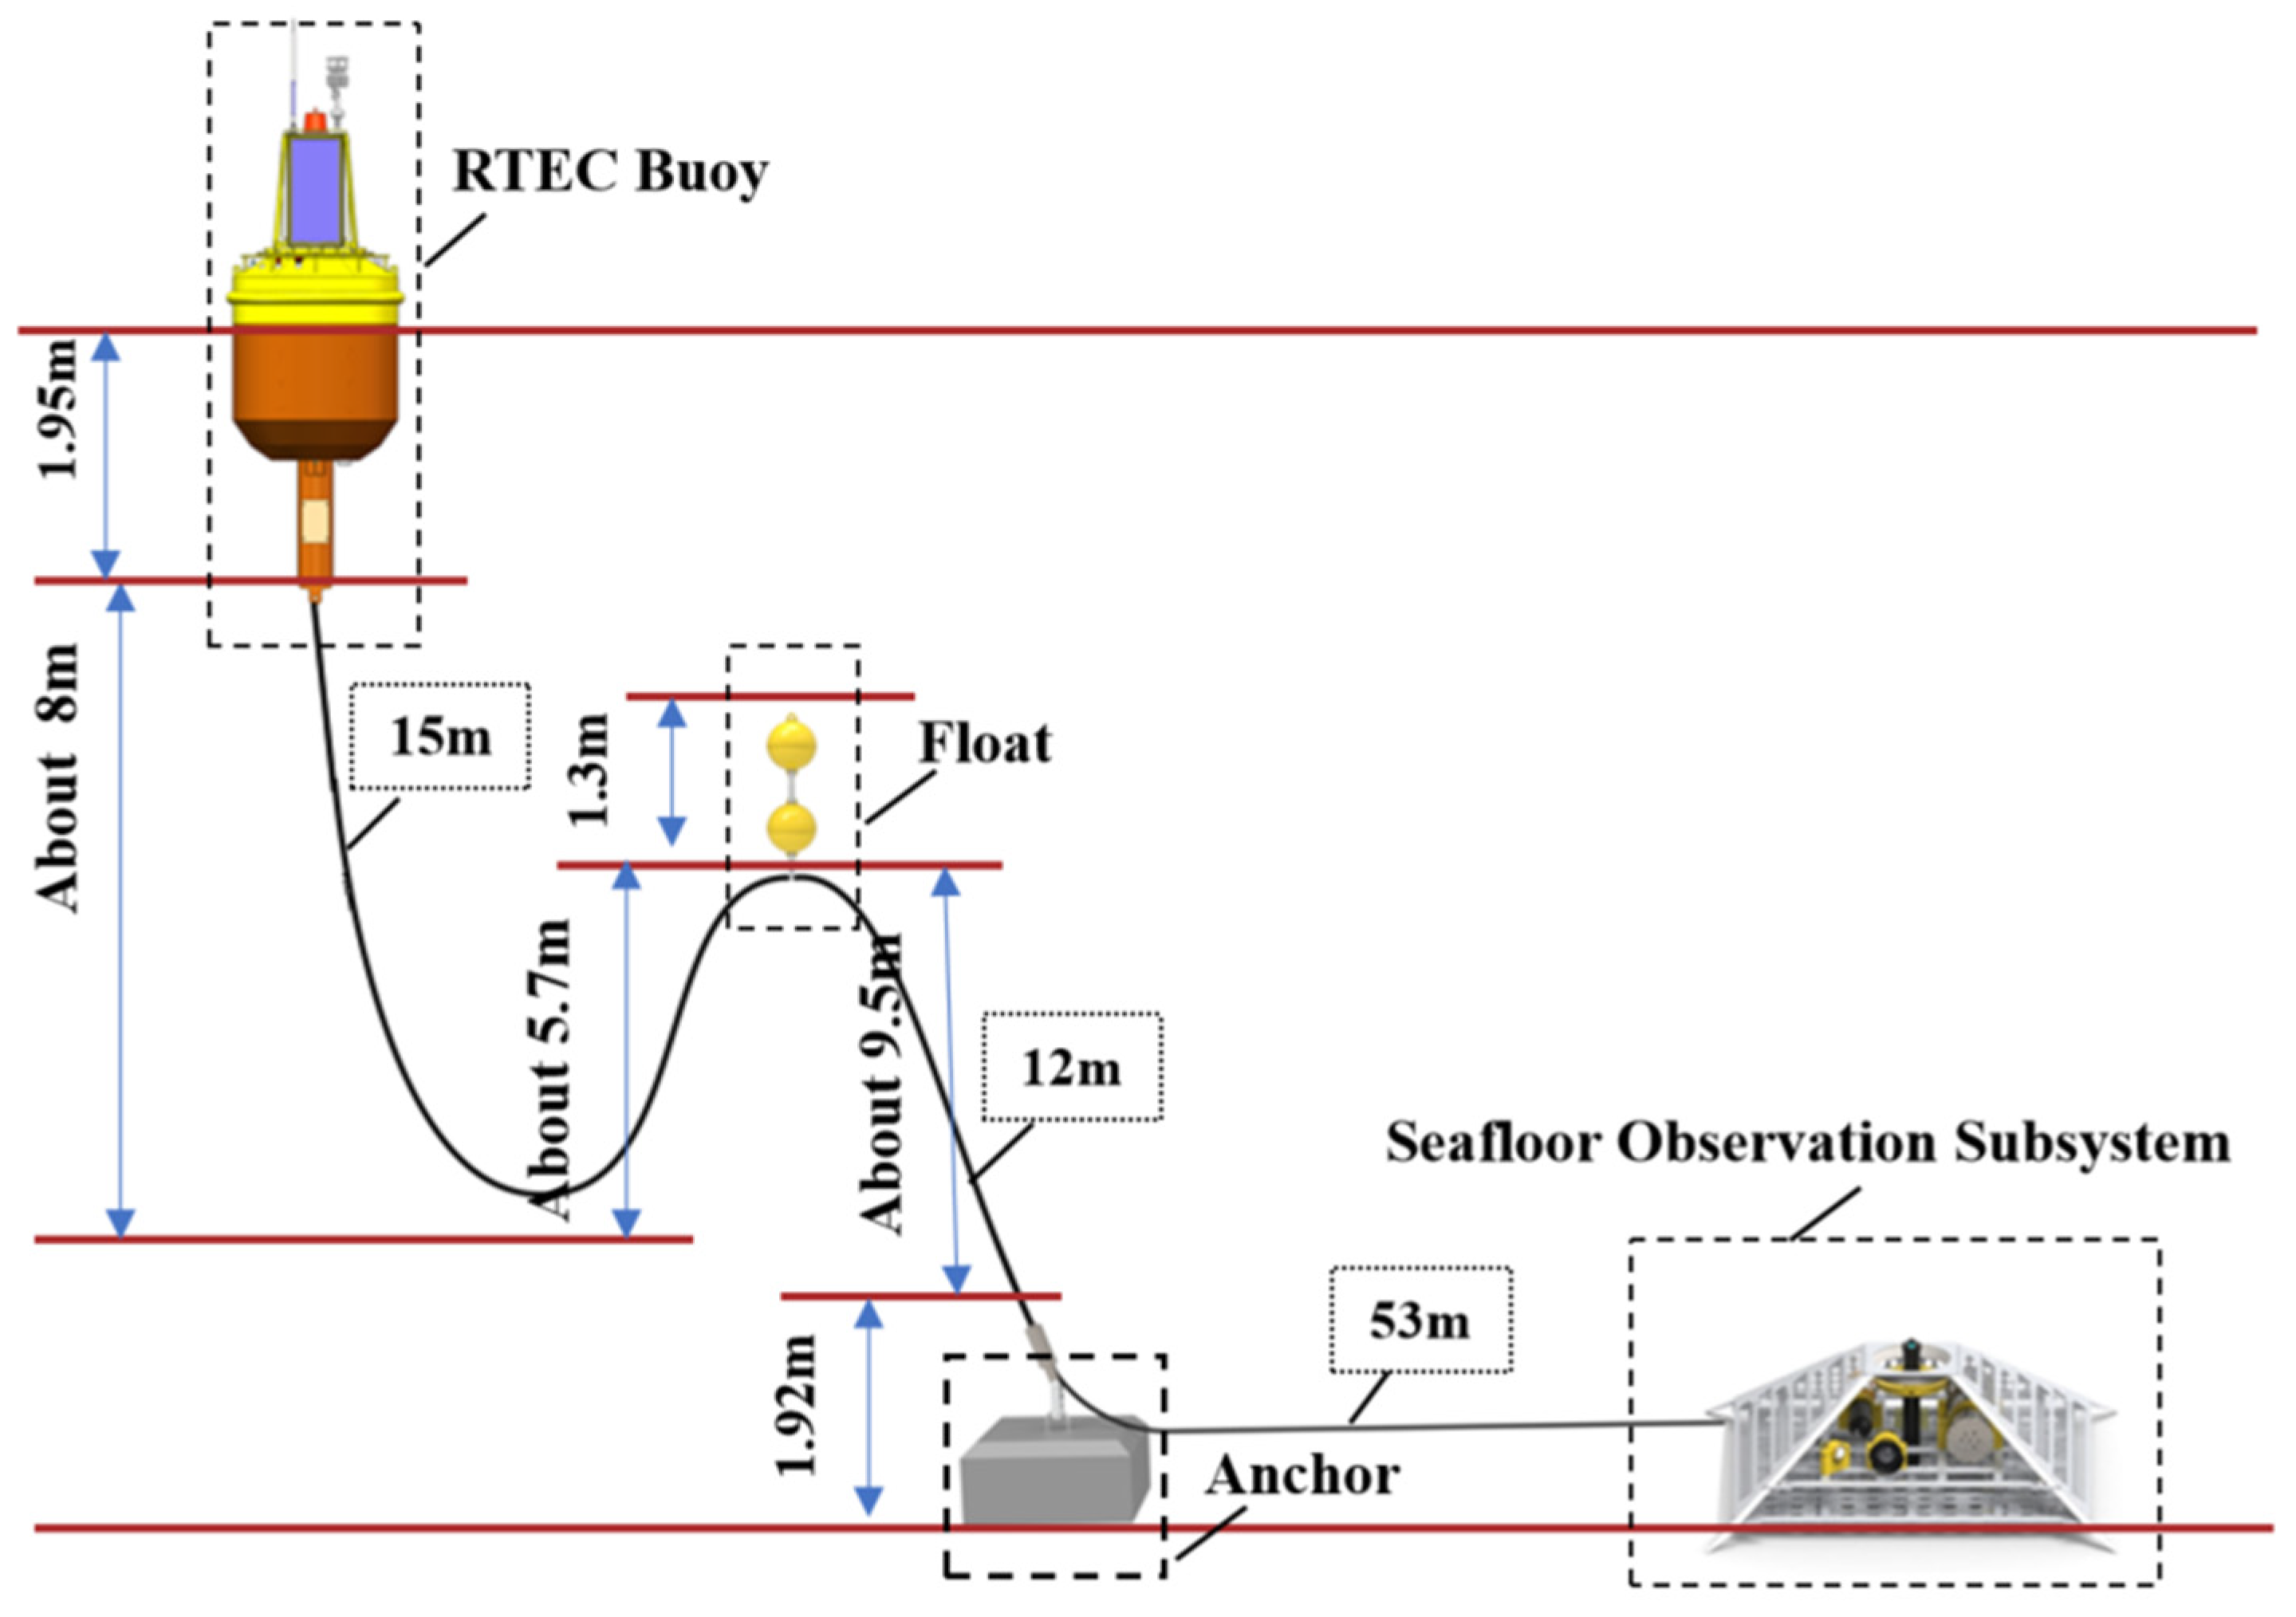
2. System Design
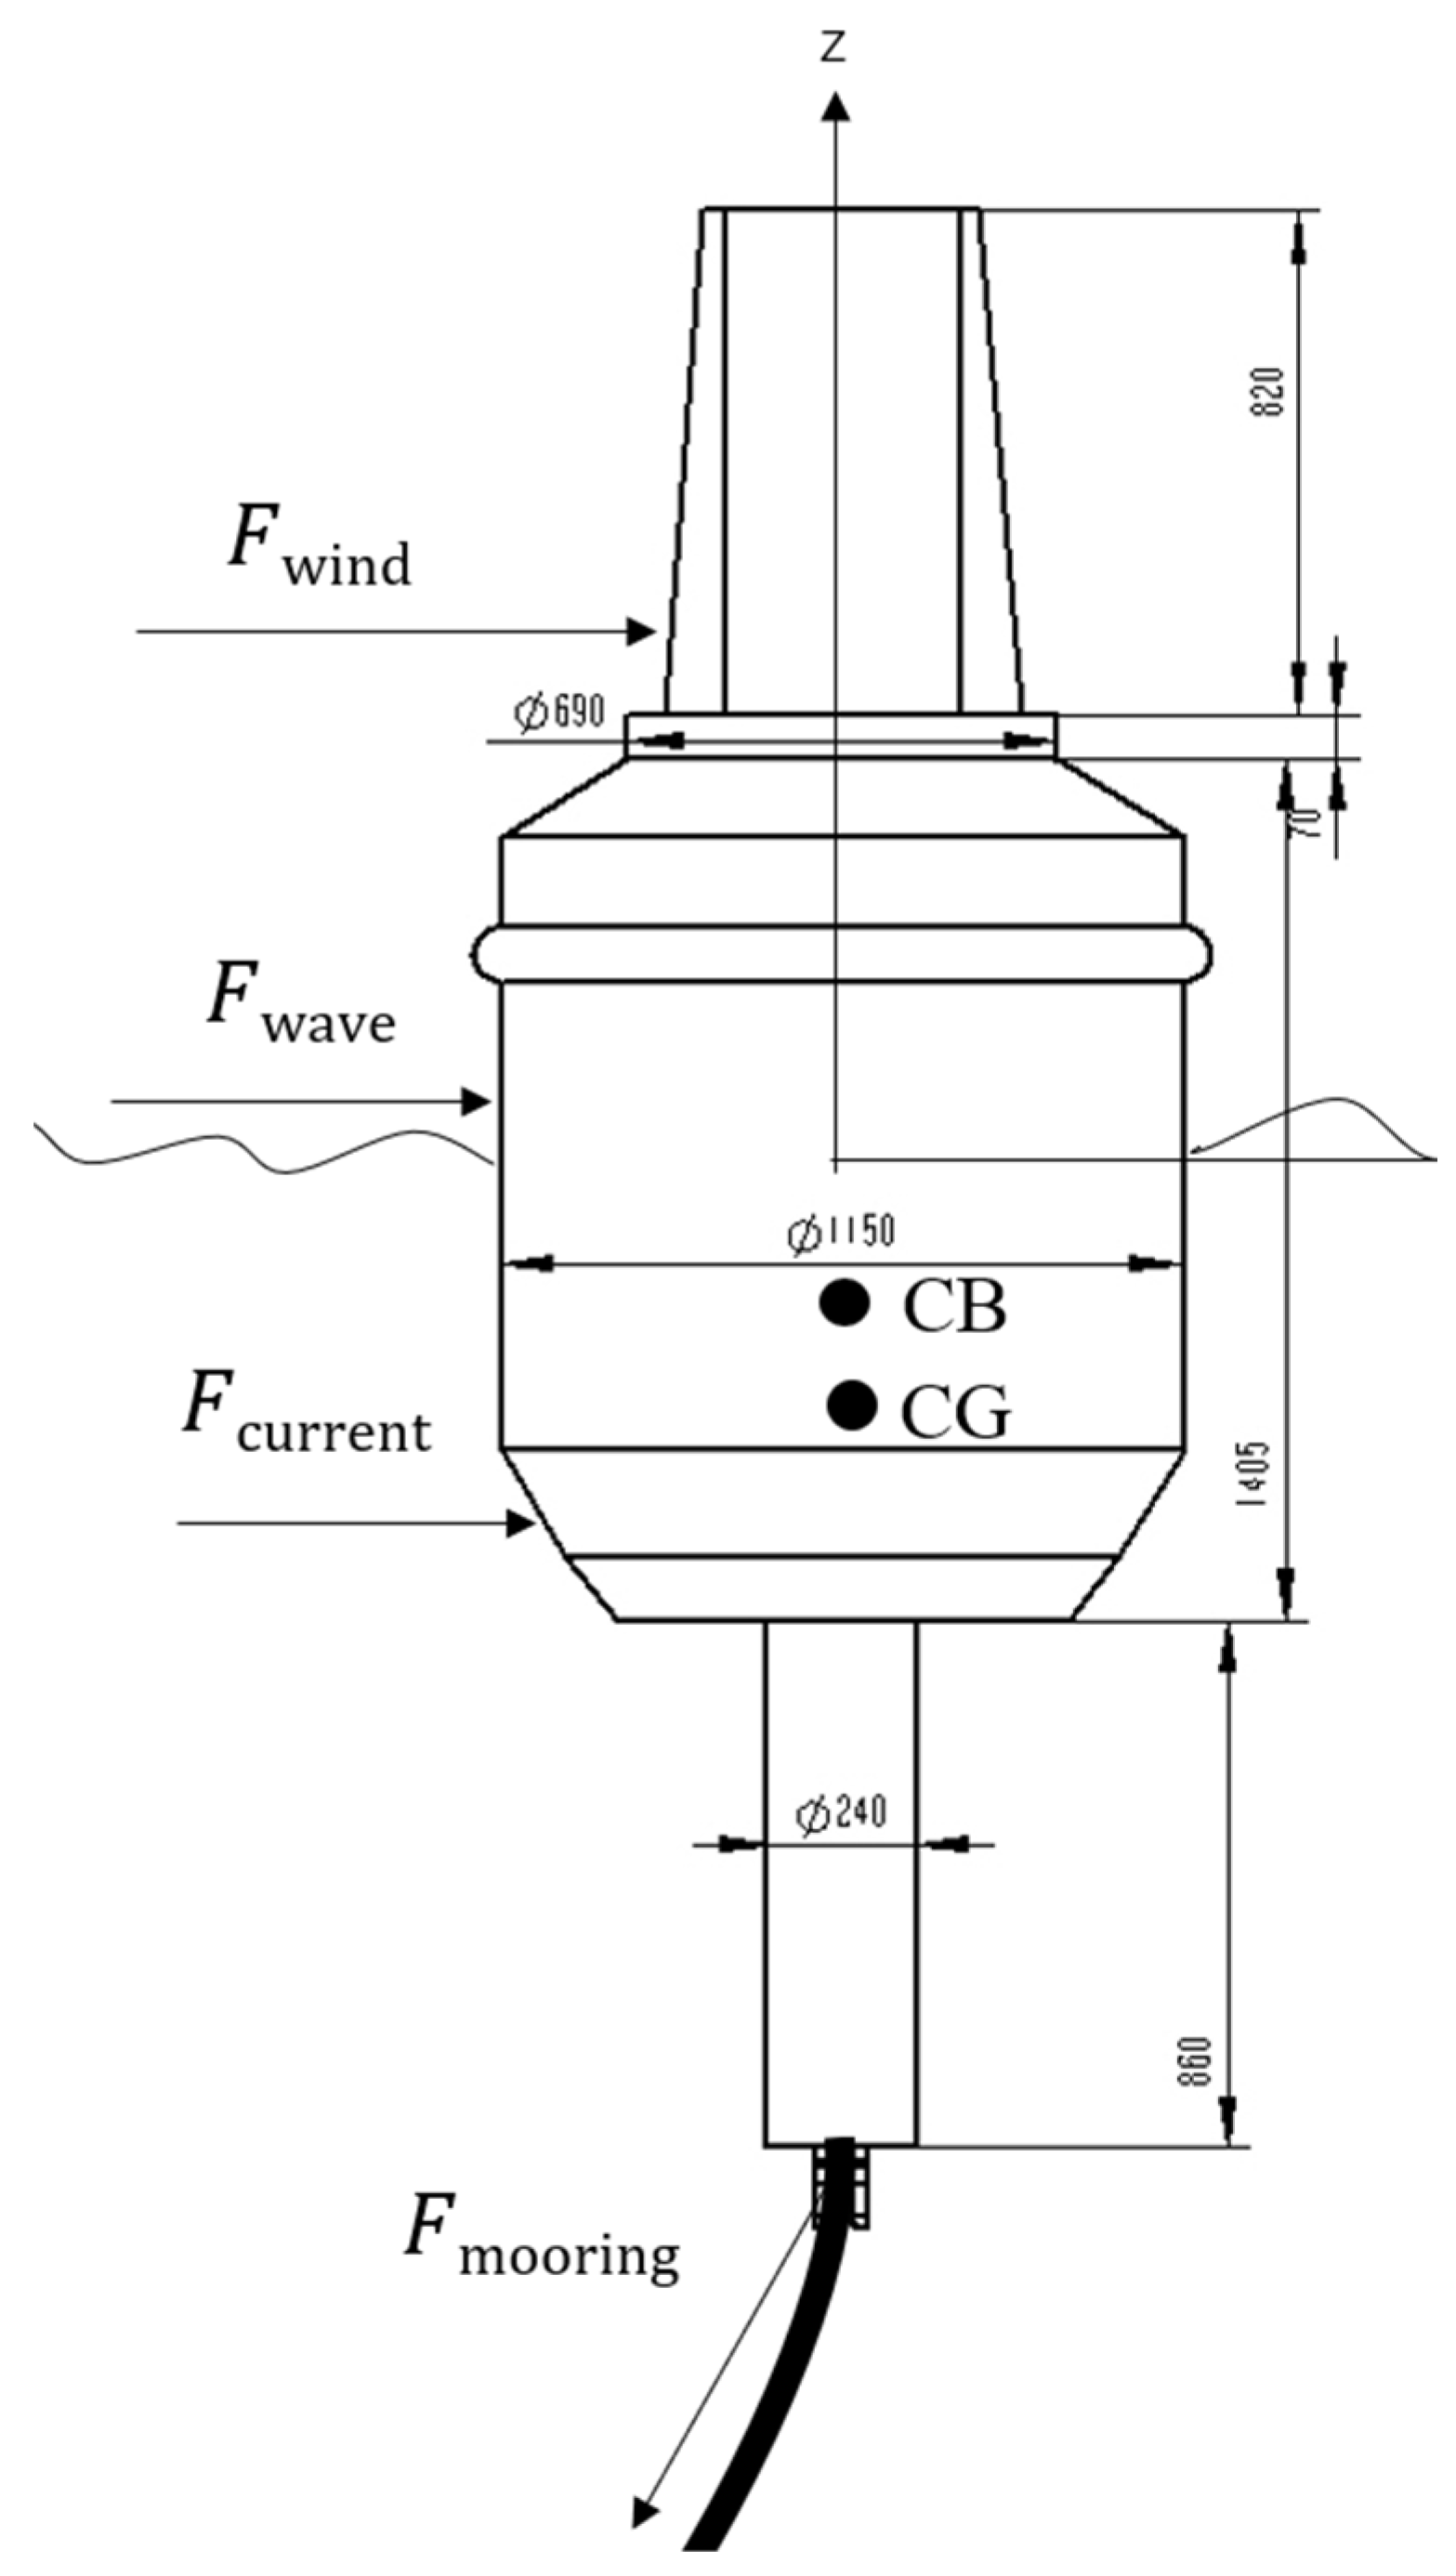
2.1. Real-Time Electric Communication (RTEC) Buoy
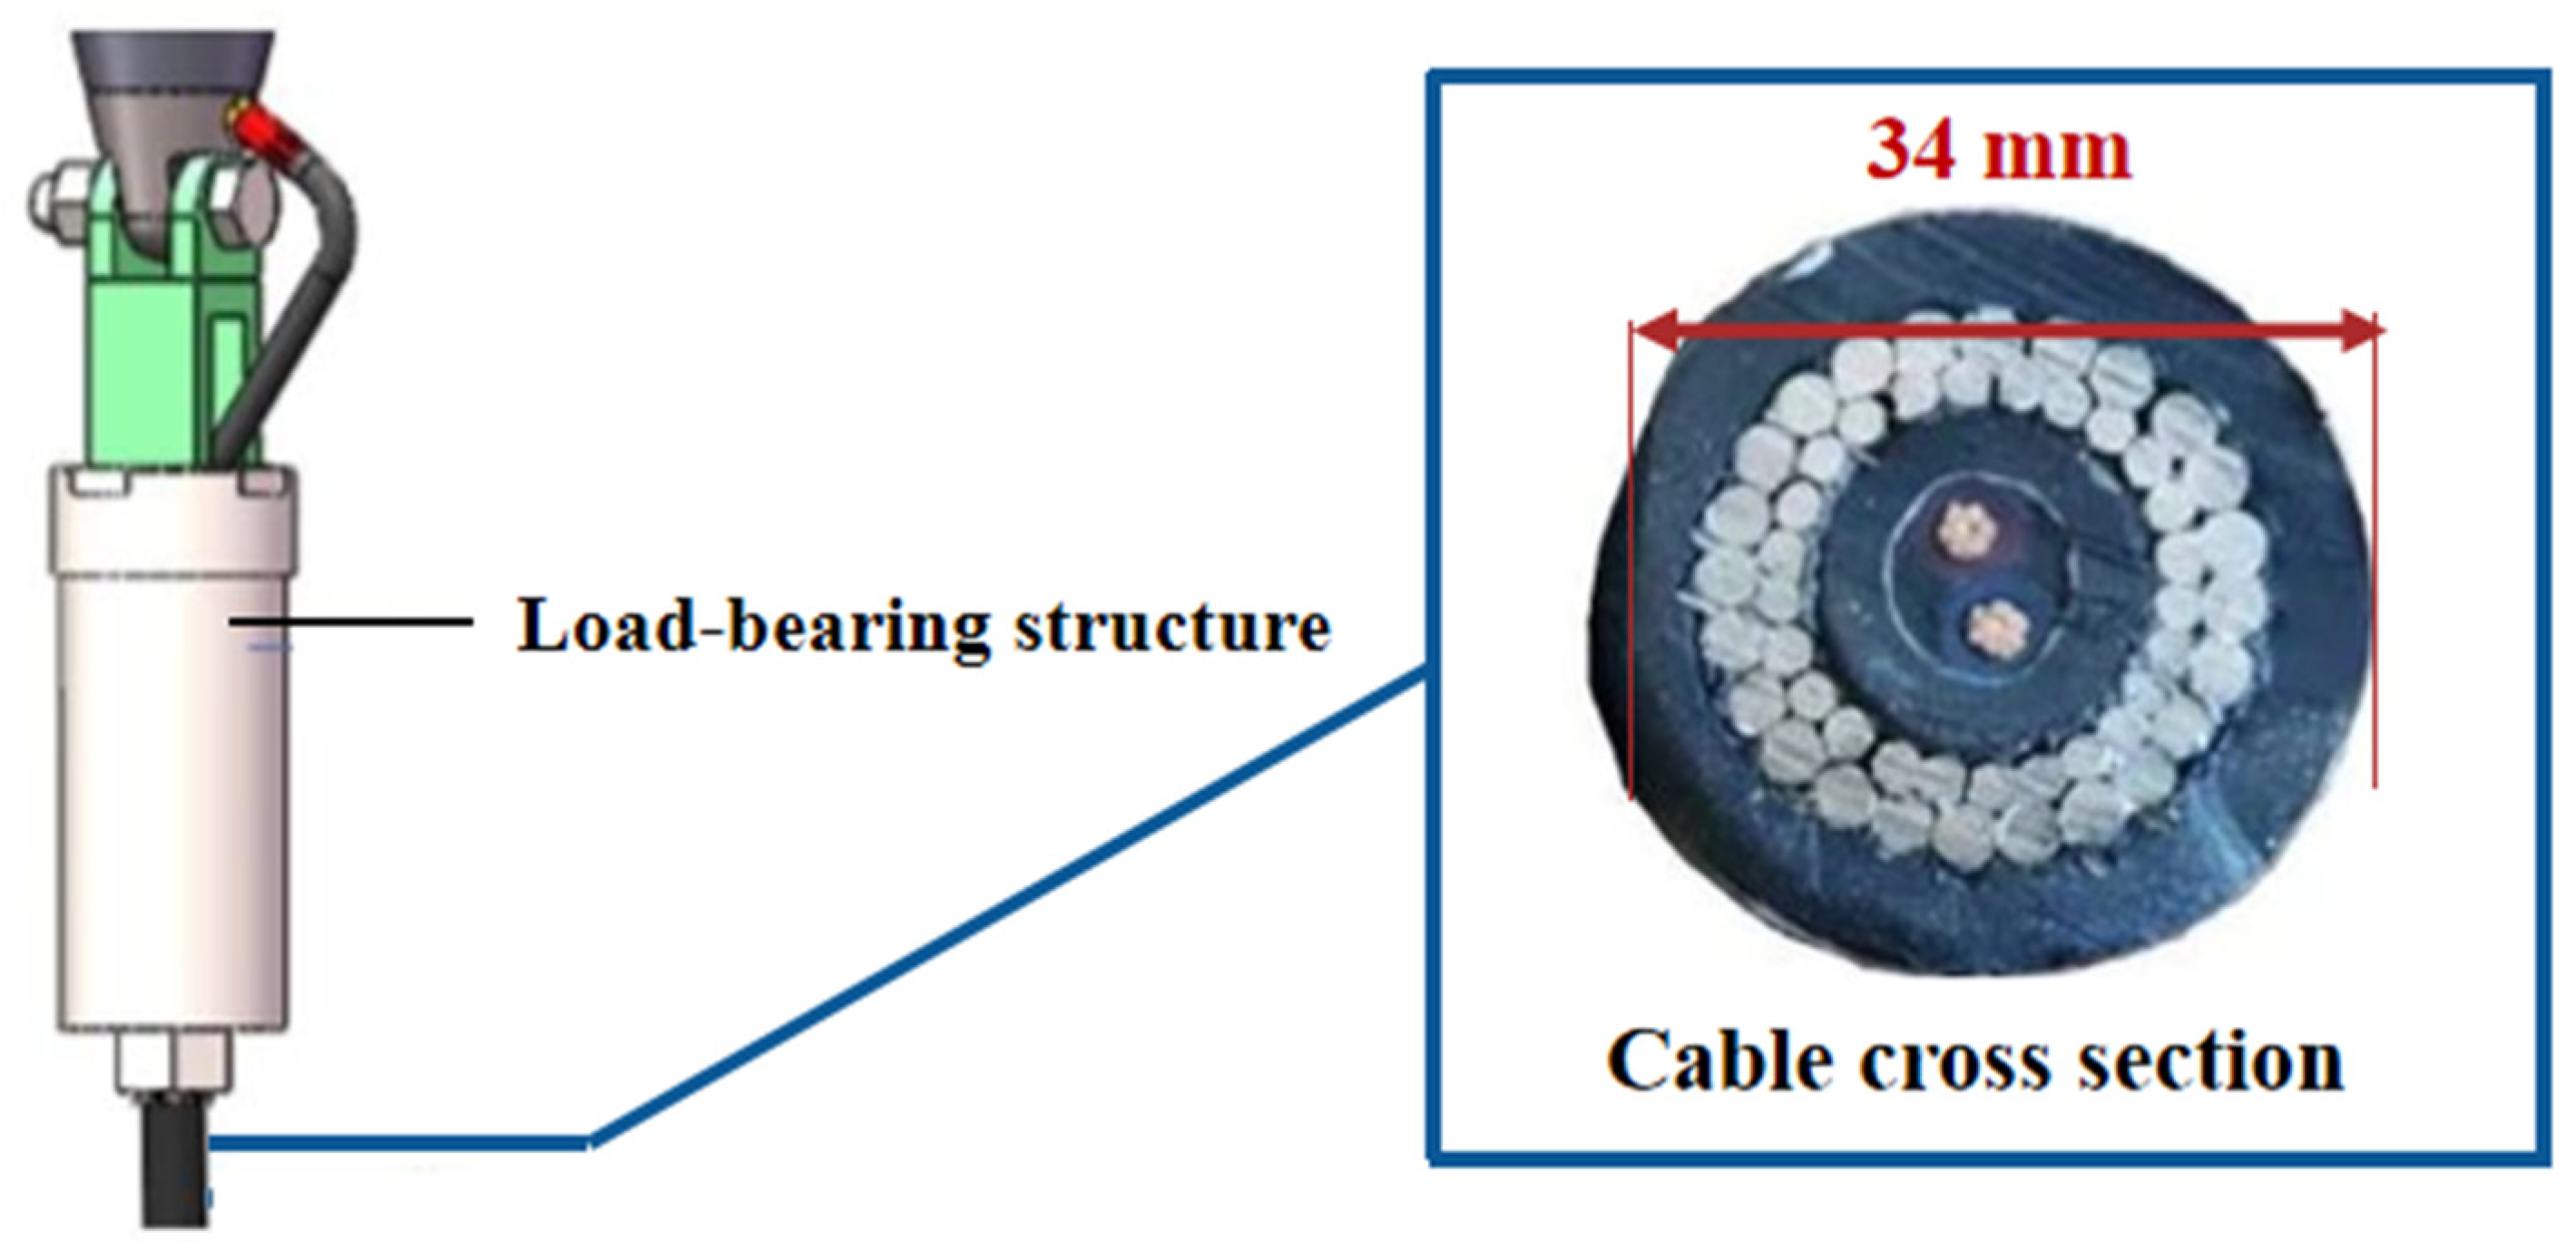
2.2. Power Information Transmission System (PITS)
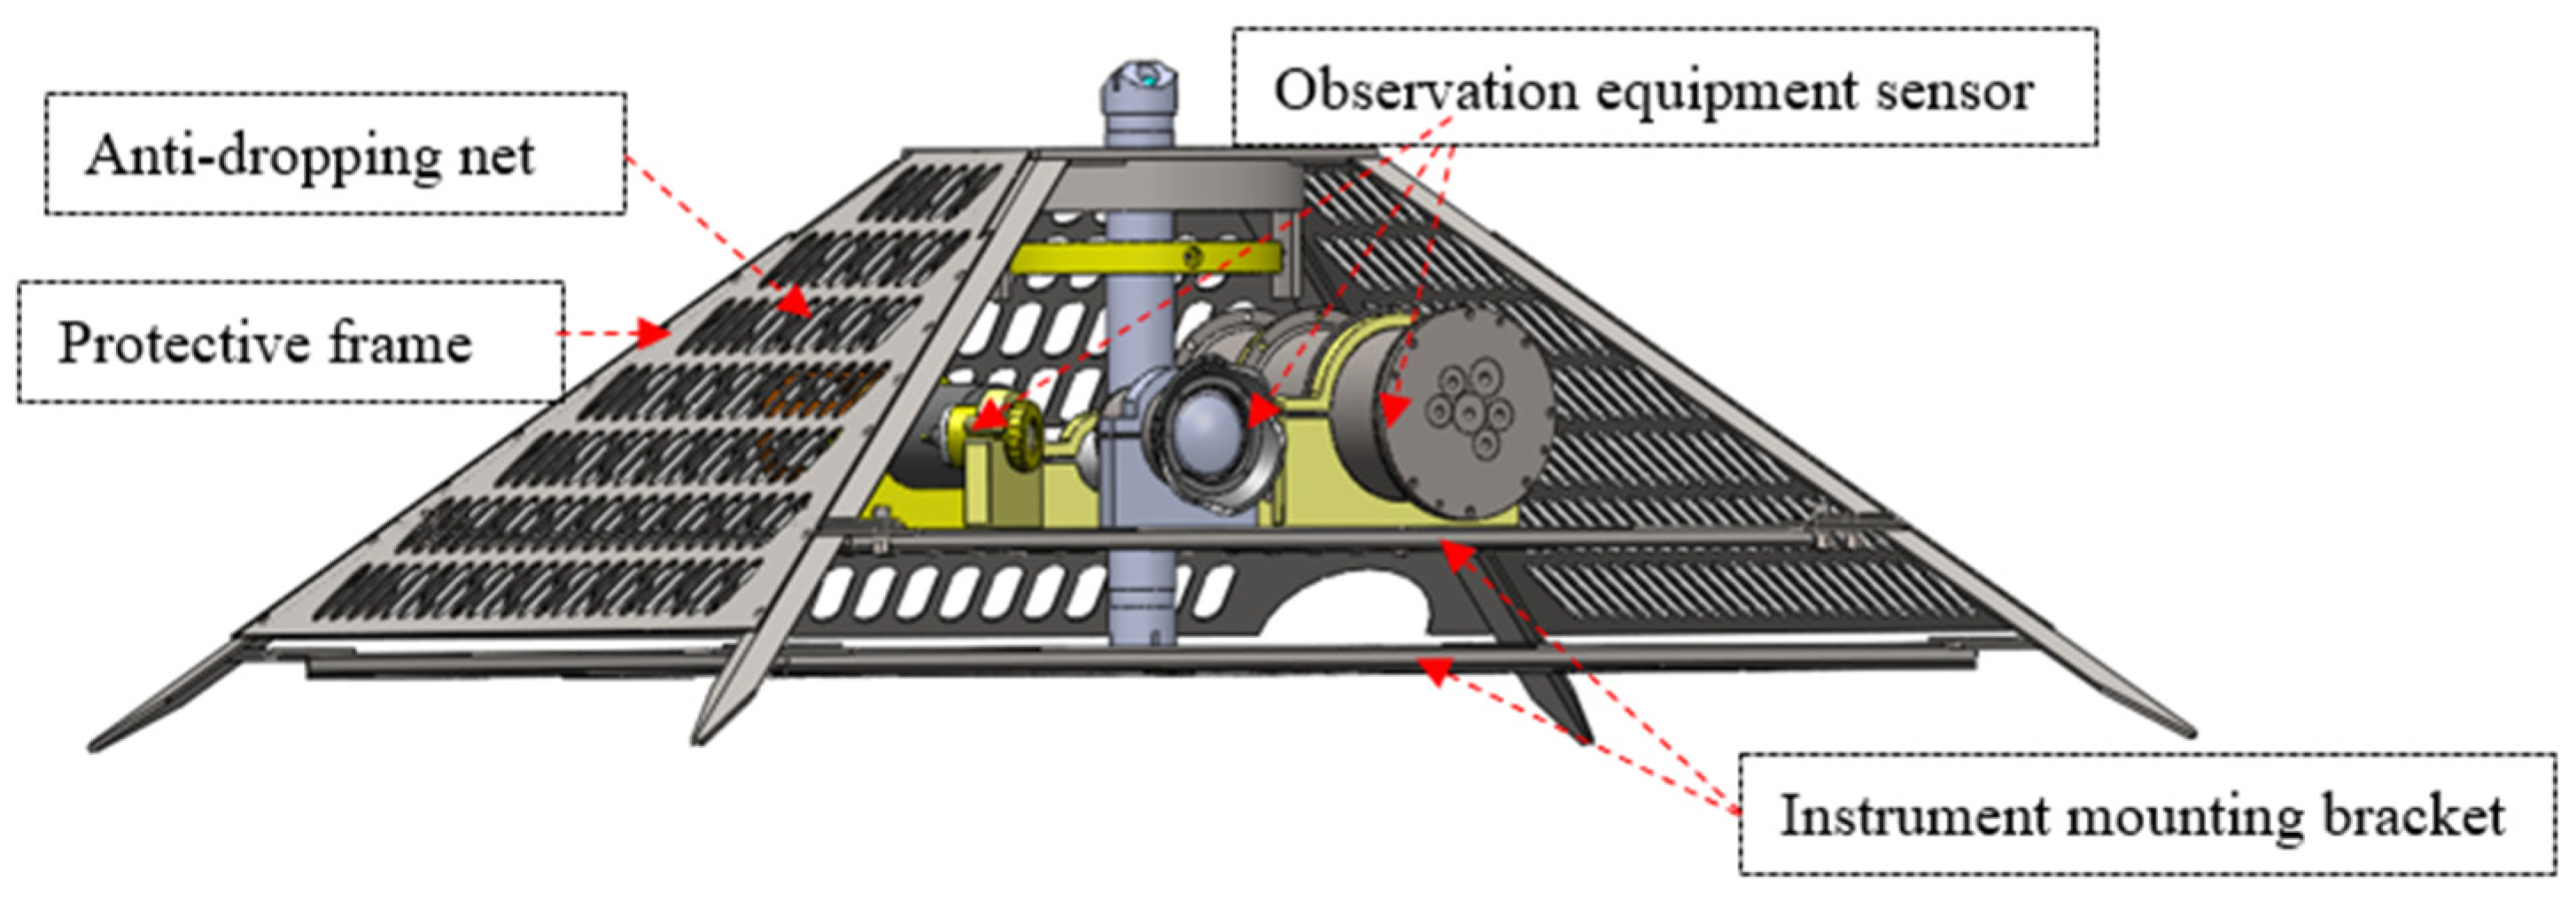
2.3. Seafloor Observation Subsystem (SOS)
2.4. BCSOS Power Consumption
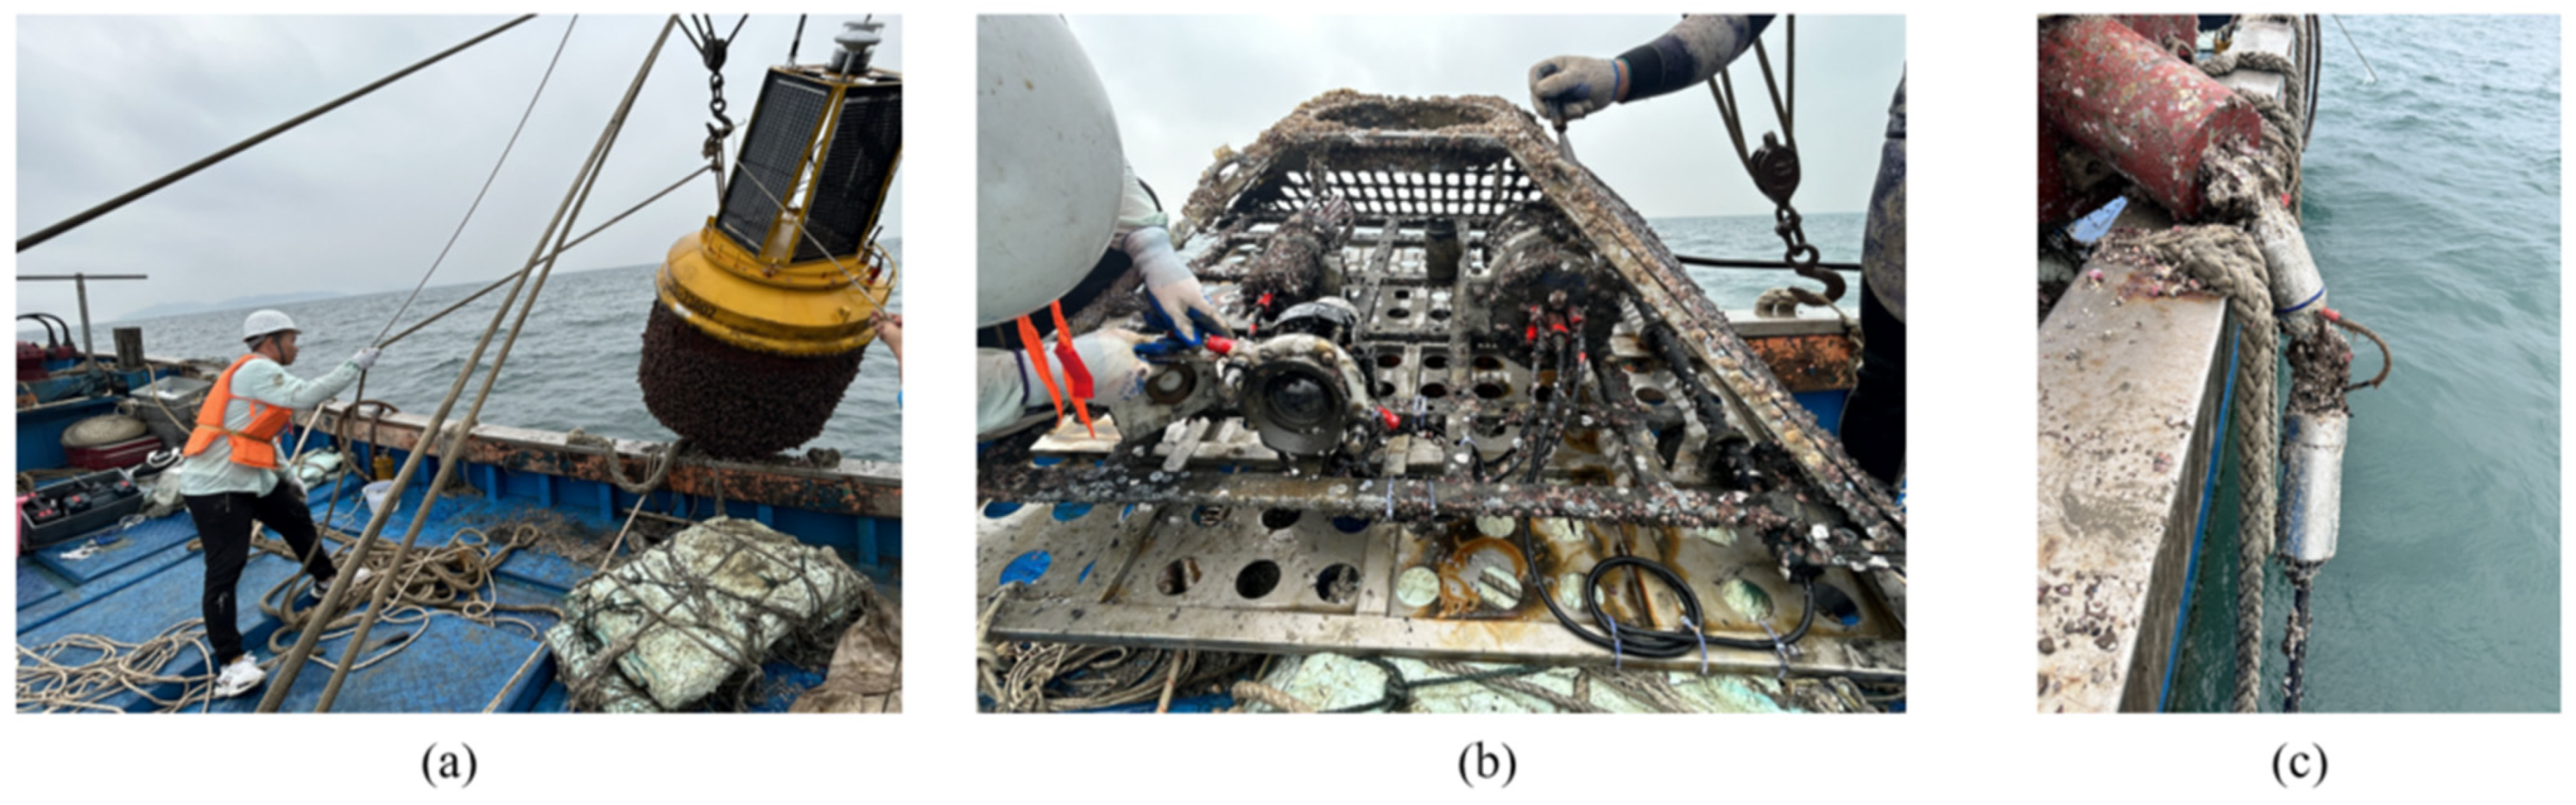
3. Experimental Study
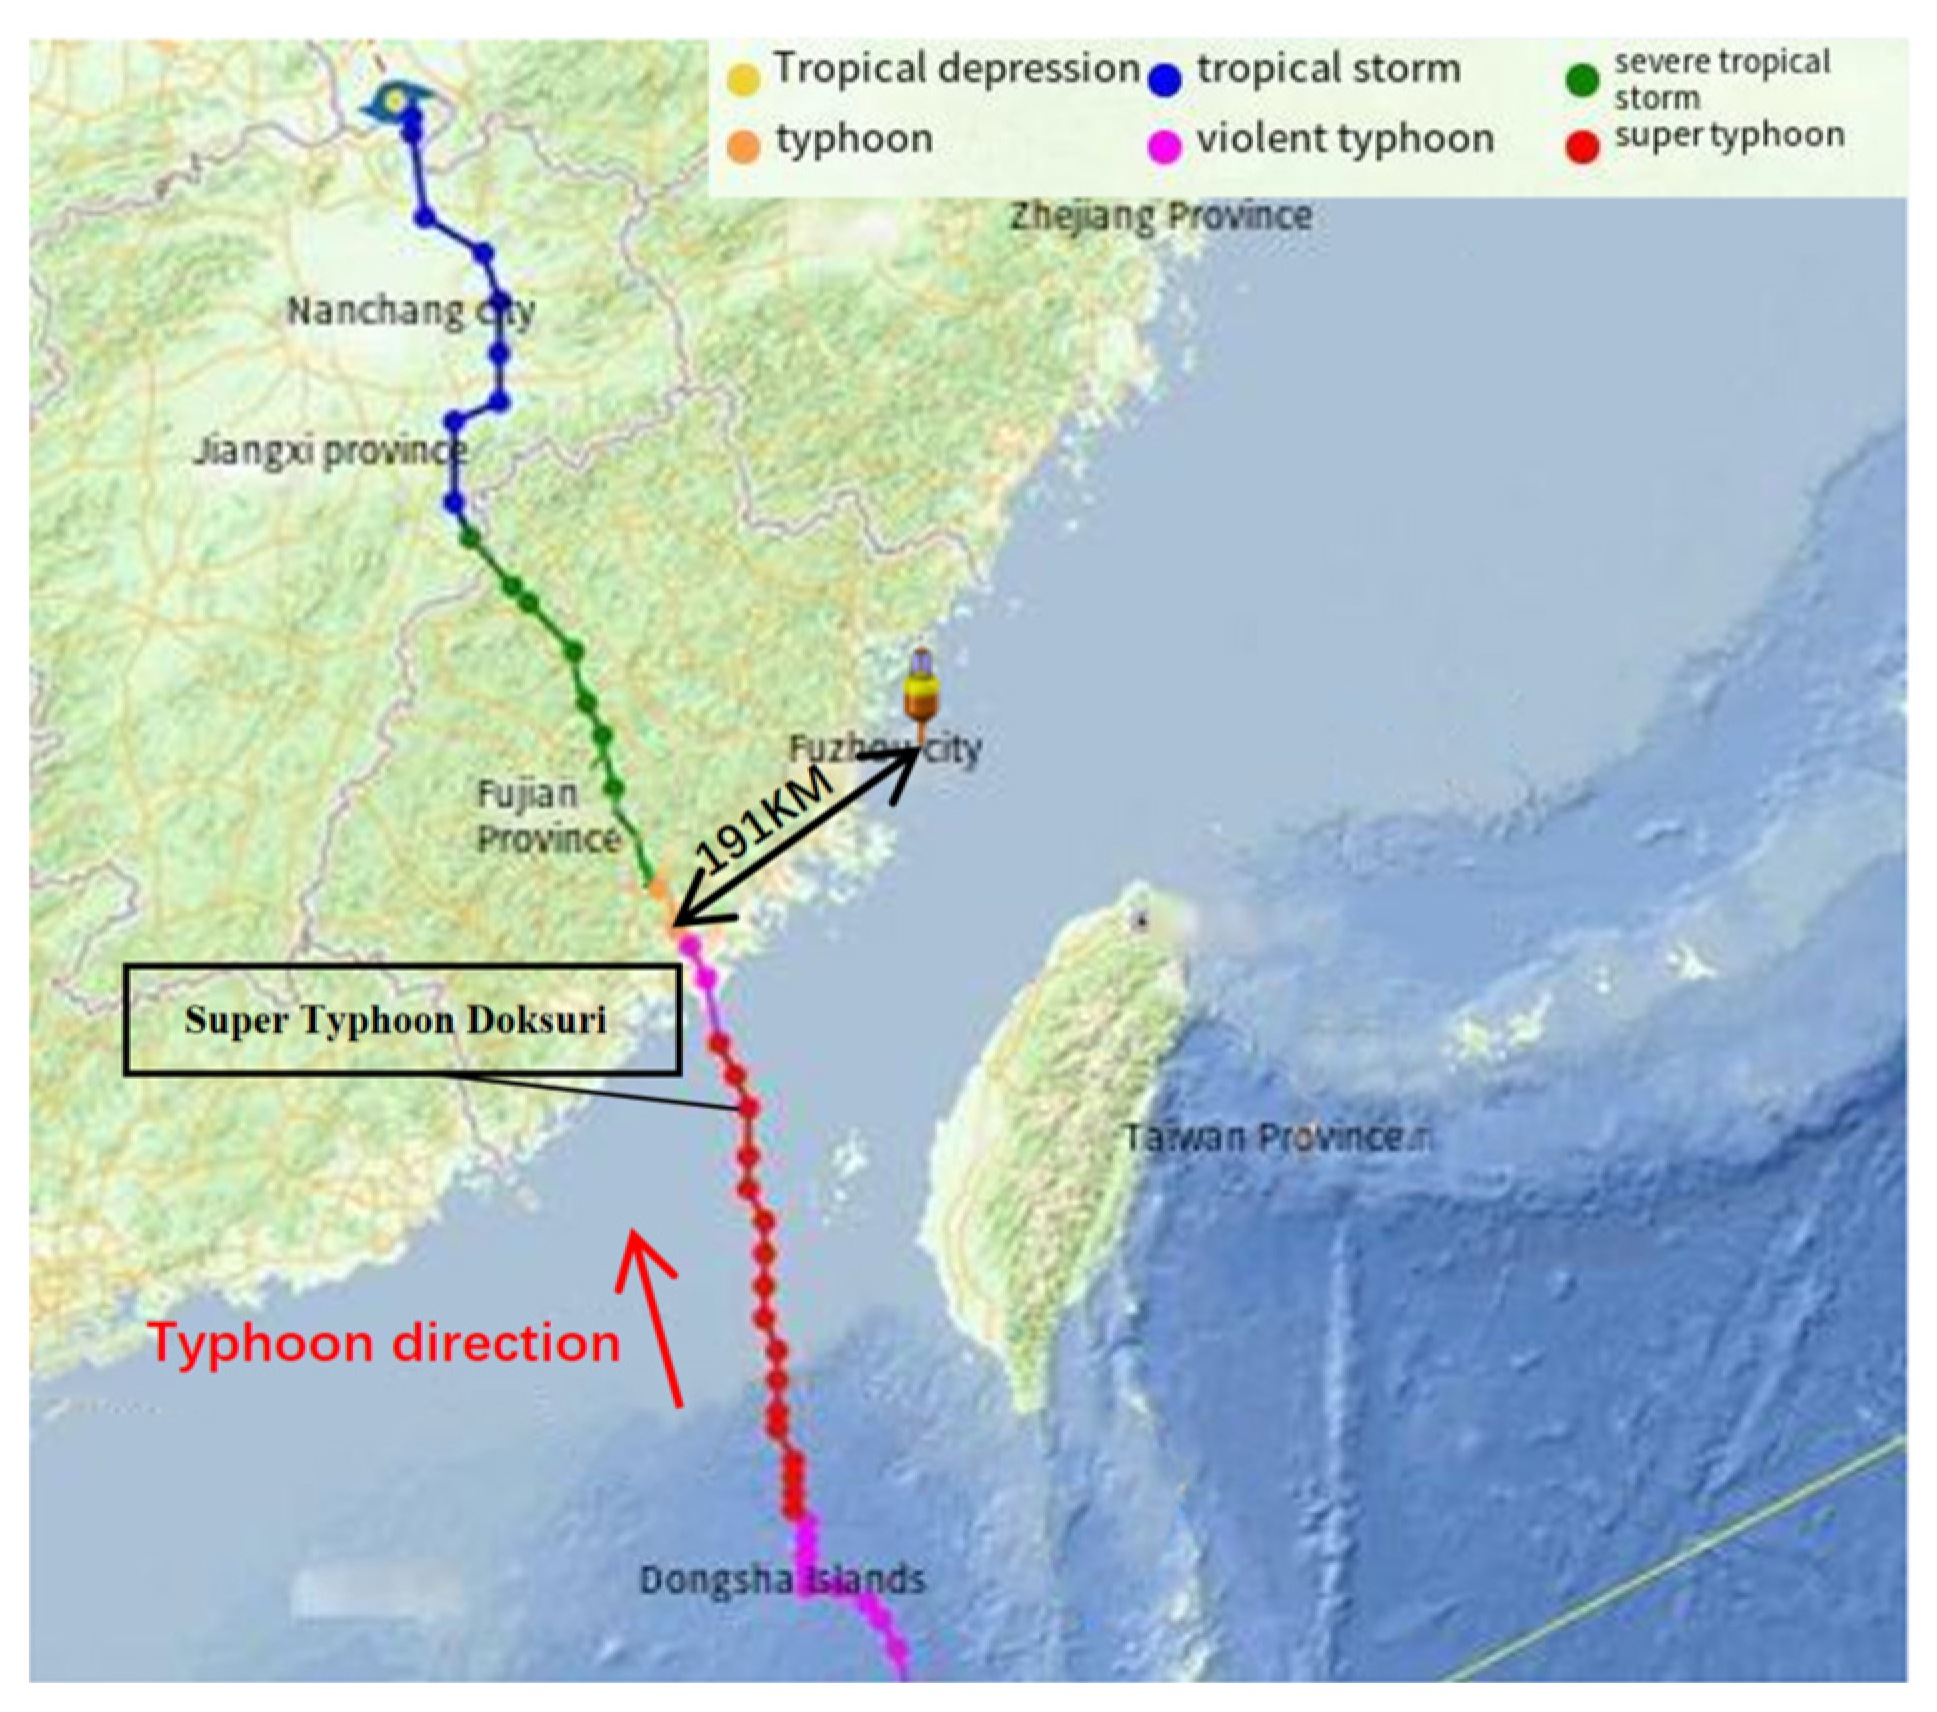
4. Analysis of the BCSOS Behavior at the Typhoon Passage
4.1. Wave Conditions
4.2. Response of Buoy
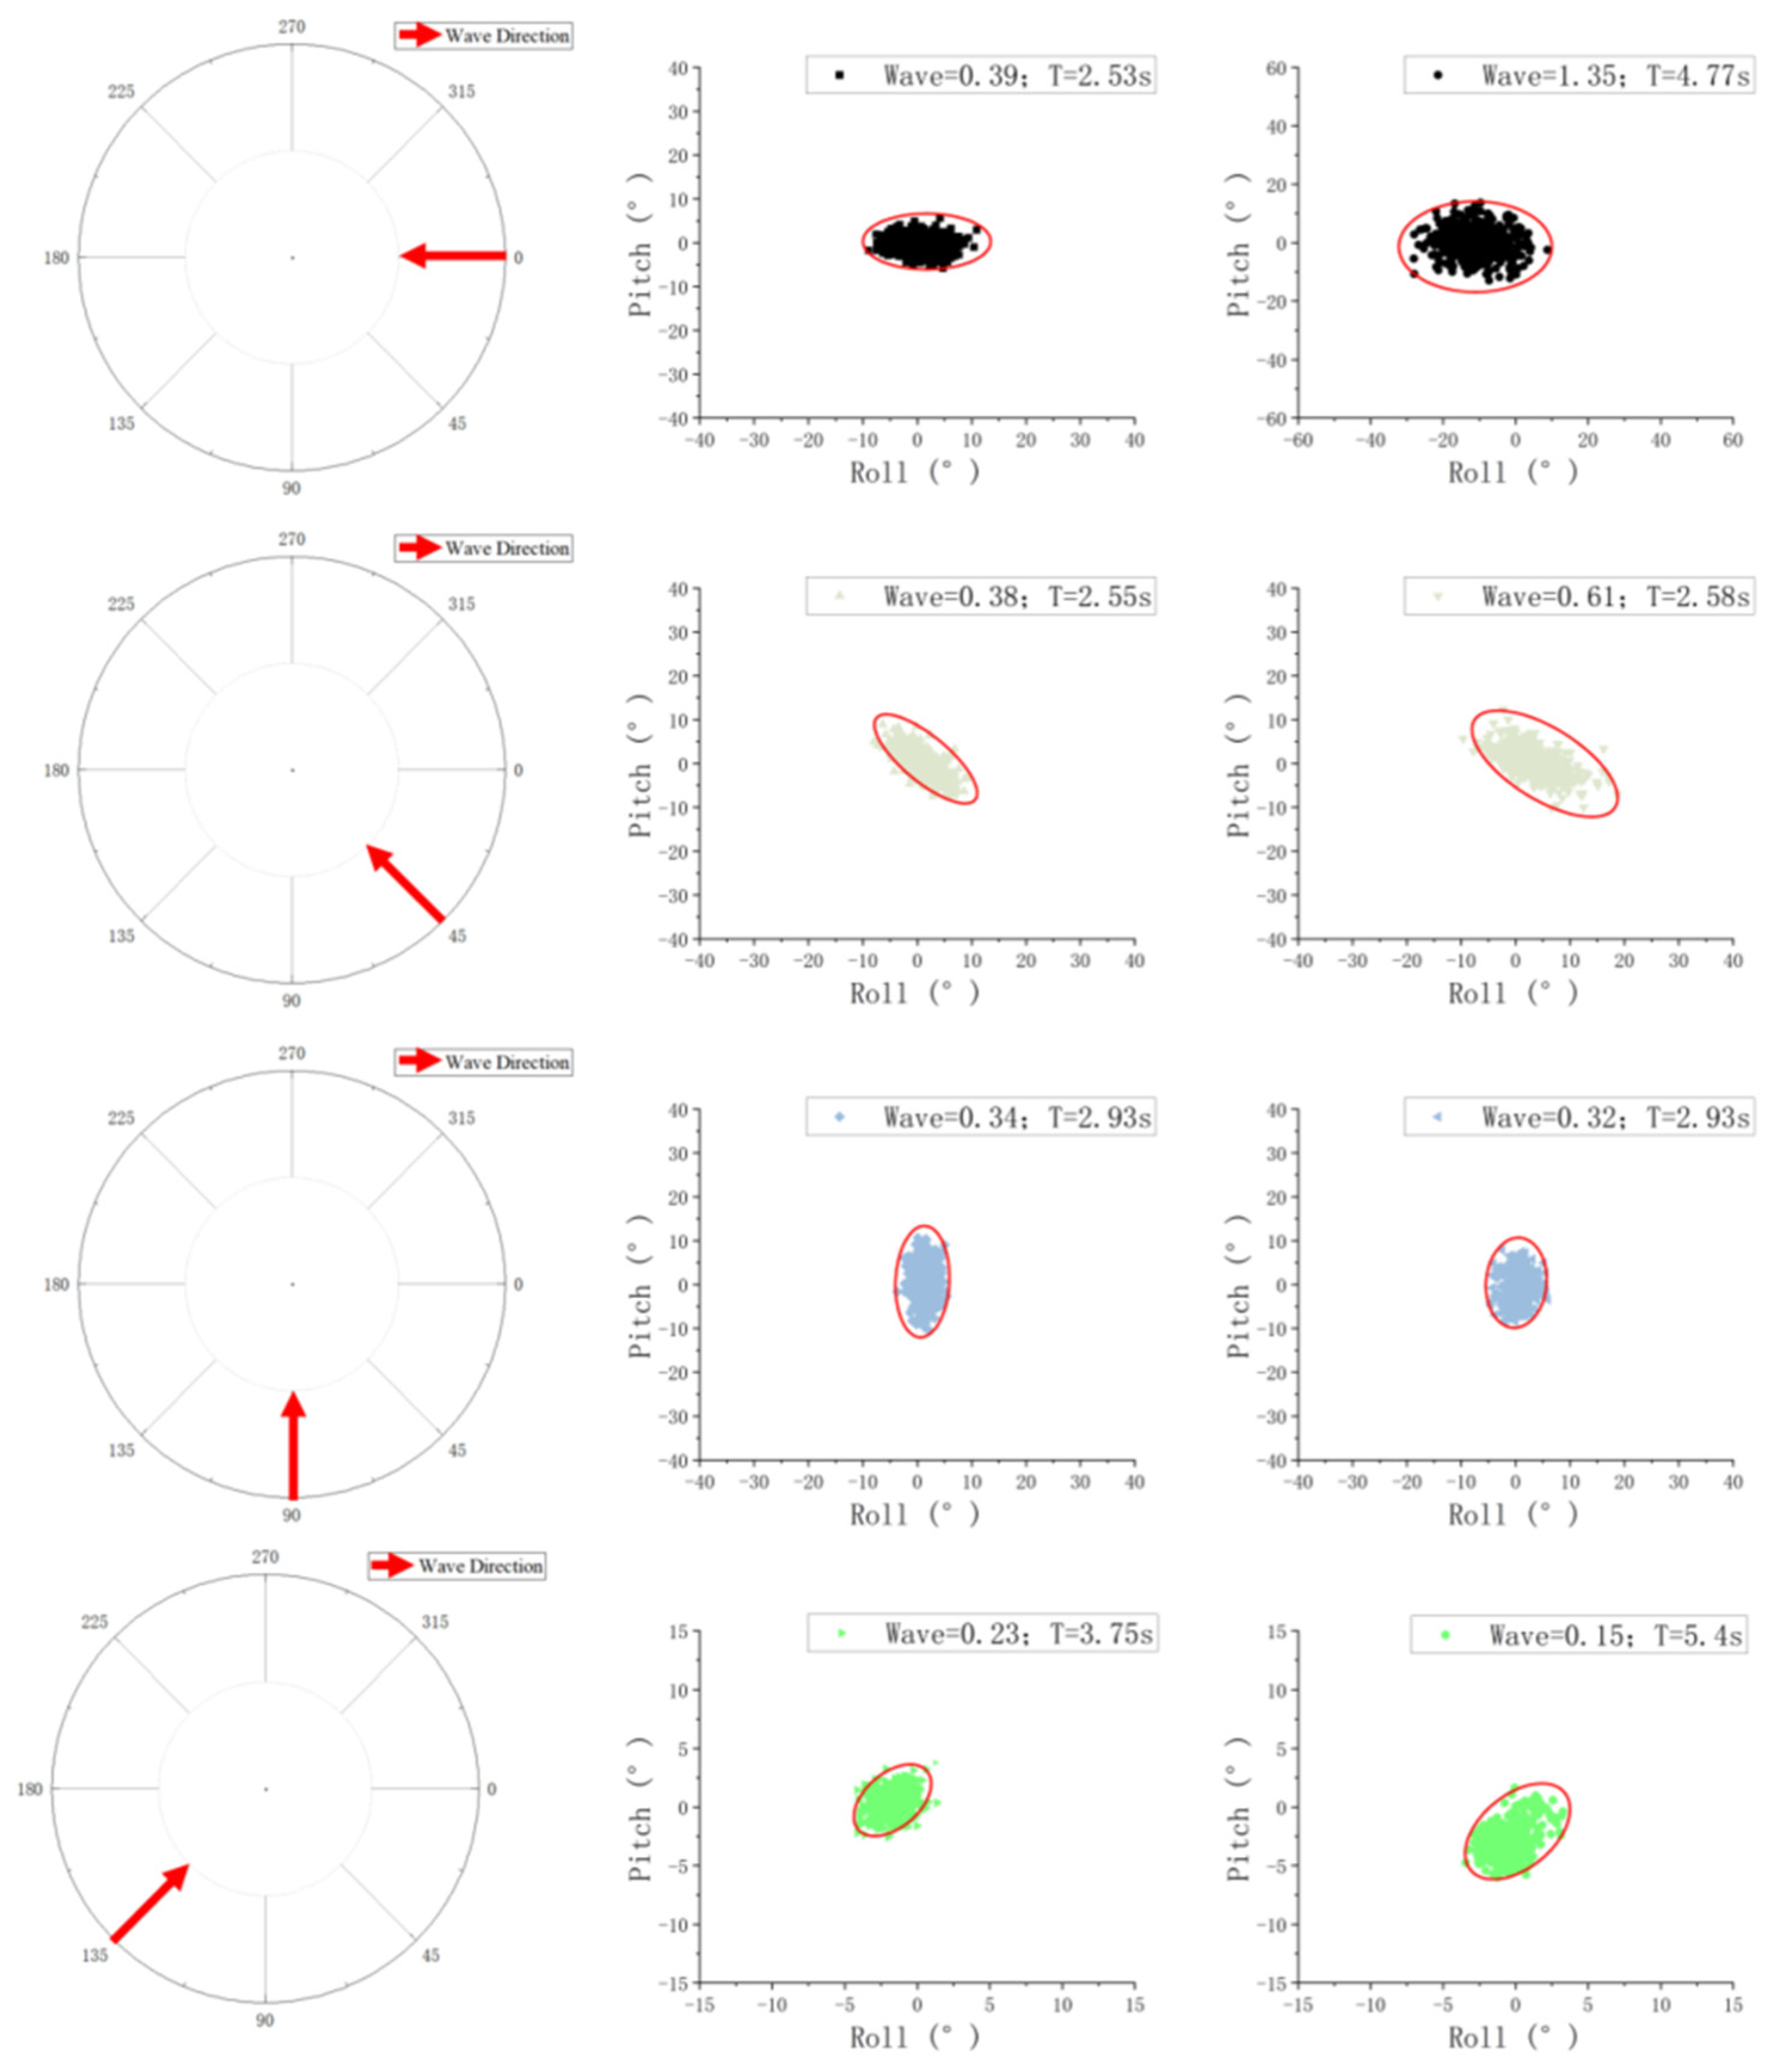
4.3. Impact of Waves on the Distribution of Buoy Response under the Influence of Different Waves
5. Conclusions
Author Contributions
Funding
Institutional Review Board Statement
Informed Consent Statement
Data Availability Statement
Acknowledgments
Conflicts of Interest
References
- Qi, S.; Li, Y. A review of the development and current situation of marine environment observation technology and instruments. Shandong Sci. 2019, 32, 21–30. [Google Scholar] [CrossRef]
- Lin, M.; Yang, C. Ocean Observation Technologies: A Review. Chin. J. Mech. Eng. 2020, 33, 1–18. [Google Scholar] [CrossRef]
- Mao, K.; Gao, F.; Zhang, S.; Liu, C. An Information Spatial-Temporal Extension Algorithm for Shipborne Predictions Based on Deep Neural Networks with Remote Sensing Observations-Part I: Ocean Temperature. Remote Sens. 2022, 14, 1791. [Google Scholar] [CrossRef]
- Wang, J.; Li, Y.; Yang, Y.; Liu, S.; Kong, Q.; Zheng, L. Status quo and trend of research and development in attitude measurement technology of ocean data buoy. Oceanol. Limnol. Sin. 2023, 54, 1239–1247. [Google Scholar] [CrossRef]
- Fang, Z.; Chu, Y.; Feng, J. Application and prospect of unmanned surface vehicle in marine geological survey. Mar. Geol. Lett. 2020, 36, 72–77. [Google Scholar] [CrossRef]
- Claustre, H.; Johnson, K.S.; Takeshita, Y. Observing the Global Ocean with Biogeochemical-Argo. Annu. Rev. Mar. Sci. 2020, 12, 23–48. [Google Scholar] [CrossRef] [PubMed]
- Rudnick, D.L. Ocean Research Enabled by Underwater Gliders. Annu. Rev. Mar. Sci. 2016, 8, 519. [Google Scholar] [CrossRef] [PubMed]
- Zhou, J.; Si, Y.; Chen, Y. A Review of Subsea AUV Technology. J. Mar. Sci. Eng. 2023, 11, 1119. [Google Scholar] [CrossRef]
- Shu, C.; Lyu, F.; Xu, R.; Wang, X.; Wei, W. Technology Review of Cabled Ocean Observatories. J. Mar. Sci. Eng. 2023, 11, 2074. [Google Scholar] [CrossRef]
- Zhai, F.; Li, P.; Gu, Y.; Li, X.; Chen, D.; Li, L.; Sun, L.; Liu, Z.; Jiang, Q.; Wu, W. Review of the research and application of the submarine cable online observation system. Mar. Sci. 2020, 44, 14–28. [Google Scholar]
- Iannaccone, G.; Guardato, S.; Vassallo, M.; Elia, L.; Beranzoli, L. A New Multidisciplinary Marine Monitoring System for the Surveillance of Volcanic and Seismic Areas. Seismol. Res. Lett. 2009, 80, 203–213. [Google Scholar] [CrossRef]
- Paul, W.; Bentley, D.; Chaffey, M.; Frye, D. Electrical and electro-optical mooring links for buoy based ocean observatories. In Proceedings of the 2003 International Conference Physics and Control. Proceedings (Cat. No.03EX708), Tokyo, Japan, 25–27 June 2003; pp. 201–206. [Google Scholar] [CrossRef]
- Chen, J.; Zhang, D.; Wang, X.; Pan, X.; Wang, C.; Zhang, Z.; Ge, H. Research on the State-of-the-Art and Trends of Seafloor Observatory. J. Ocean. Technol. 2019, 38, 95–103. [Google Scholar]
- S-NET. Available online: https://www.bosai.go.jp/inline/seibi/seibi01.html (accessed on 13 April 2024).
- DONET. Available online: https://www.seafloor.bosai.go.jp/DONET/ (accessed on 8 May 2024).
- Ocean Networks Canada. Available online: https://www.oceannetworks.ca/ (accessed on 8 May 2024).
- Monterey Accelerated Research System (MARS) • MBARI. Available online: https://www.mbari.org/technology/monterey-accelerated-research-system-mars/ (accessed on 13 April 2024).
- Ocean Observatories Initiative. Available online: https://oceanobservatories.org/ (accessed on 8 May 2024).
- Home—The U.S. Integrated Ocean Observing System (IOOS). Available online: https://ioos.noaa.gov/ (accessed on 8 May 2024).
- EMSO—Observing the Ocean to Save the Earth. Available online: https://emso.eu/ (accessed on 14 April 2024).
- Introducing IMOS: IMOS.org.au. Available online: https://imos.org.au/ (accessed on 8 May 2024).
- Zhang, S.; Tian, C.; Zhou, F. Design and optimization of buoy mooring with single-point cable for seafloor observatories. Front. Mar. Sci. 2023, 9, 1048048. [Google Scholar] [CrossRef]
- Chen, Y. On the ocean observing methodology. Acta Oceanol. Sin. 2019, 41, 182–188. [Google Scholar] [CrossRef]
- Zhang, S.W.; Tian, C.; Zhou, F.H. Ocean observation system design of mooring buoy and benthic node with electro-optical-mechanical cable. Front. Mar. Sci. 2022, 9, 1018751. [Google Scholar] [CrossRef]
- SMART Cables. Available online: https://www.smartcables.org/ (accessed on 12 April 2024).
- Chaffey, M.; Mellinger, E.; Paul, W. Communications and power to the seafloor: MBARI’s Ocean Observing System mooring concept. In Proceedings of the MTS/IEEE Oceans 2001. An Ocean Odyssey. Conference Proceedings (IEEE Cat. No.01CH37295), Honolulu, HI, USA, 5–8 November 2001; pp. 2473–2481. [Google Scholar] [CrossRef]
- Xi, F.; Pang, Y.; Liu, G.; Wang, S.; Li, W.; Zhang, C.; Wang, Z.L. Self-powered intelligent buoy system by water wave energy for sustainable and autonomous wireless sensing and data transmission. Nano Energy 2019, 61, 1–9. [Google Scholar] [CrossRef]
- Gupta, S.; Gupta, S.; Singh, D.; Singh, D.; Yadav, A.; Yadav, A.; Jain, S.; Jain, S.; Pratap, B.; Pratap, B. A comparative study of 5083 aluminium alloy and 316L stainless steel for shipbuilding material. Mater. Today Proc. 2020, 28, 2358–2363. [Google Scholar] [CrossRef]
- Ferraris, S.; Volpone, L.M. Aluminium alloys in third millennium shipbuilding: Materials, technologies, perspectives. In Proceedings of the Fifth International Forum on Aluminium Ships, Tokyo, Japan, 11–13 October 2005. [Google Scholar]
- Orszaghova, J.; Wolgamot, H.; Draper, S.; Taylor, R.E.; Taylor, P.H.; Rafiee, A. Transverse motion instability of a submerged moored buoy. Proc. R. Soc. A 2019, 475, 20180459. [Google Scholar] [CrossRef]
- Wang, J. Principle and Ocean Data Buoys; China Ocean Press: Beijing, China, 2013; ISBN 9787502787486. [Google Scholar]
- CCS. Classification Specification for Offshore Mobile Platform; China Classification Society, 2023; Volume 56, p. 3. ISBN 1005-7560. Available online: https://www.ccs.org.cn/ccswz/specialDetail?id=202212260456159800 (accessed on 23 January 2024).
- Amaechi, C.V.; Wang, F.; Ye, J. Investigation on hydrodynamic characteristics, wave-current interaction and sensitivity analysis of submarine hoses attached to a CALM buoy. J. Mar. Sci. Eng. 2022, 10, 120. [Google Scholar] [CrossRef]
- Ghafari, H.; Dardel, M. Parametric study of catenary mooring system on the dynamic response of the semi-submersible platform. Ocean Eng. 2018, 153, 319–332. [Google Scholar] [CrossRef]
- Faltinsen, O.M. Sea Loads on Ships and Offshore Structures; Shanghai Jiao Tong University Press: Shanghai, China, 2008; ISBN 9787313049384. [Google Scholar]
- Yu, J.; Zhang, S.; Yang, W.; Xin, Y.; Gao, H. Design and Application of Buoy Single Point Mooring System with Electro-Optical-Mechanical (EOM) Cable. J. Mar. Sci. Eng. 2020, 8, 672. [Google Scholar] [CrossRef]
- CFD Software: Fluid Dynamics Simulation Software. Available online: https://www.ansys.com/products/fluids (accessed on 8 May 2024).
- ANSYS. Aqwa Theory Manual; Release 2023R1; ANSYS Inc.: Canonsburg, PA, USA, 2023. [Google Scholar]
- Hasselmann, K.; Barnett, T.P.; Bouws, E.; Carlson, H.; Cartwright, D.E.; Enke, K.; Ewing, J.A.; Gienapp, H.; Hasselmann, D.E.; Kruseman, P.; et al. Measurements of Wind-Wave Growth and Swell Decay during the Joint North Sea Wave Project (JONSWAP); Ergaenzungsheft Zur Deutschen Hydrographischen Zeitschrift, Reihe A; TU Delft: Delft, The Netherlands, 1973. [Google Scholar]
- Shekar, V.; Caló, A.; Pongrácz, E. Experiences from seasonal Arctic solar photovoltaics (PV) generation-An empirical data analysis from a research infrastructure in Northern Finland. Renew. Energ. 2023, 217, 119162. [Google Scholar] [CrossRef]
- Al-Wreikat, Y.; Serrano, C.; Sodré, J.R. Effects of ambient temperature and trip characteristics on the energy consumption of an electric vehicle. Energy 2022, 238, 122028. [Google Scholar] [CrossRef]
- Amaechi, C.V.; Chesterton, C.; Butler, H.O.; Wang, F.; Ye, J. An Overview on Bonded Marine Hoses for sustainable fluid transfer and (un) loading operations via Floating Offshore Structures (FOS). J. Mar. Sci. Eng. 2021, 9, 1236. [Google Scholar] [CrossRef]
- Liang, X. Eastern China on Alert as Typhoon Doksuri Makes Landfall in Fujian. South China Morning Post 2023. Available online: https://www.scmp.com/news/china/science/article/3229295/eastern-china-alert-typhoon-doksuri-makes-landfall-fujian (accessed on 23 January 2024).


| Material | Young’s Modulus [MPa] | Melting Temperature [°K] | Electrical Resistivity [Ohm cm] | Density (Kg /cm3) | Thermal Conductivity [W/m·°K] |
|---|---|---|---|---|---|
| Aluminum | 72,000 | 823.15–923.15 | 193 | 0.0027 | 235 |
| Stainless Steel | 205,000 | ~1773.15 | 310 | 0.00785 | 79 |
| Parameter | Unit | Value |
|---|---|---|
| Height of the Cover | m | 0.07 |
| Diameter of the Cover | m | 0.69 |
| Height of the Buoy Body | m | 1.405 |
| Height of the Mounting plate | m | 0.79 |
| Diameter of the Buoy Body | m | 1.15 |
| Height of the Counterweight | m | 0.86 |
| Diameter of the Counterweight | m | 0.24 |
| Height of the Buoy | m | 3.265 |
| Total Weight | kg | 940 |
| Cable Properties | Unit | Nominal Value |
|---|---|---|
| Diameter | mm | 34 ± 0.5 |
| Air weight | kg/m | 1.5 ± 0.1 |
| Minimum breaking strength | kN | 240 |
| Maximum working load | kN | 100 |
| Safe working load | kN | 50 |
| Parameters | Value |
|---|---|
| Centre of Gravity (x, y, z) | (0, 0, −0.637 m) |
| Mass (kg) | 940 |
| Area (m2) | 438.49 |
| Volume (m) | 344.98 |
| (Kg·m2) | 107.44 |
| (Kg·m2) | 600.36 |
| (Kg·m2) | 602.58 |
| Parameter | Value |
|---|---|
| Current Speed (Sea Surface) | 3 m/s |
| Wind Speed (NDP) | 32 m/s |
| Significant Wave Height (JONSWAP) | 11.53 m |
| Wave Peak Period | 13 s |
| Gamma (JONSWAP) | 3.3 |
| Parameters | Value |
|---|---|
| Equivalent Diameter (m) | 0.034 |
| Transverse Drag Coefficient | 1.20 |
| Longitudinal Coefficient | 0.025 |
| Mass per unit length (kN/m) | 1.5 |
| Stiffness, EA (kN) | 6476.19 |
| Cable length (m) | 160 |
| Maximum Expected Tension (kN) | 272.2 |
| Type | Hardware/Instrument | Voltage/Average Current | Working Frequency | Power Consumption |
|---|---|---|---|---|
| RTEC Buoy | ARM board | Voltage 12 V, Average current 0.15 A | 24 h | 43.2 Wh |
| Power control panel | Voltage 24 V Average current 0.023 A | 24 h | 13.25 Wh | |
| Switch | Voltage 12 V, Average current 0.167 A | Works for 5 min every 1 h, 2 h per day | 4 Wh | |
| Bridge | Voltage 12 V, Average current 0.35 A | Works for 5 min every 1 h, 2 h per day | 8.4 Wh | |
| Hybrid transmission module | Voltage 24 V, Average current < 0.001 A | - | - | |
| Voltmeter/Ammeter | Voltage 12 V, Average current 0.035 A | 24 h | 20.16 Wh | |
| 4G router | Voltage 12 V, Average current 0.1 A | Works for 5 min every 1 h, 2 h per day | 2.4 Wh | |
| GPS module | Voltage 12 V, Average current 0.035 A | Works for 5 min every 1 h, 2 h per day | 0.6 Wh | |
| Seafloor Observation Subsystem (SOS) | Underwater ARM board | Voltage 5 V, Average current 0.28 A | Works for 5 min every 1 h, 2 h per day | 2.8 Wh |
| Power control panel | Voltage 24 V, Average current 0.01 A | Works for 5 min every 1 h, 2 h per day | 0.48 Wh | |
| Bridge | Voltage 12, Average current 0.35 A | Works for 5 min every 1 h, 2 h per day | 8.4 Wh | |
| Hybrid transmission module | Voltage 24 V, Average current < 0.001 A | - | - | |
| Multiparameter water quality meter | Voltage 12 V, Average current 0.01 A, Peak current 0.9 A | Works for 5 min every 1 h, 2 h per day | 12 Wh | |
| Acoustic Doppler Current Profiler | Voltage 15 V, Average current 0.25 A | Works for 5 min every 1 h, 2 h per day | 7.5 Wh | |
| Underwater camera | Voltage 12 V, Average current 0.5 A | Works for 5 min every 3 h | 4 Wh | |
| Underwater LED lamp | Voltage 24 V, Average current 0.538 A | Works for 5 min every 3 h | 8.61 Wh | |
| UV lamp | Voltage 12 V, Average current 0.072 A | Works for 5 min every 3 h | 0.576 Wh |
| Period | Roll | Pitch |
|---|---|---|
| Normal sea | 1.19° | 1.09° |
| Pre-typhoon | 5.55° | 3.51° |
| During-typhoon | 9.98° | 5.59° |
| After-typhoon | 5.19° | 4.32° |
Disclaimer/Publisher’s Note: The statements, opinions and data contained in all publications are solely those of the individual author(s) and contributor(s) and not of MDPI and/or the editor(s). MDPI and/or the editor(s) disclaim responsibility for any injury to people or property resulting from any ideas, methods, instructions or products referred to in the content. |
© 2024 by the authors. Licensee MDPI, Basel, Switzerland. This article is an open access article distributed under the terms and conditions of the Creative Commons Attribution (CC BY) license (https://creativecommons.org/licenses/by/4.0/).
Share and Cite
Zhou, W.; Li, Y.; Zhang, Y.; Jiang, Q.; Chen, D.; Gu, Y.; Lin, Y. Design and Analysis of a Buoy-Based Cable Seafloor Observatory System Response under Extreme Weather Conditions. J. Mar. Sci. Eng. 2024, 12, 889. https://doi.org/10.3390/jmse12060889
Zhou W, Li Y, Zhang Y, Jiang Q, Chen D, Gu Y, Lin Y. Design and Analysis of a Buoy-Based Cable Seafloor Observatory System Response under Extreme Weather Conditions. Journal of Marine Science and Engineering. 2024; 12(6):889. https://doi.org/10.3390/jmse12060889
Chicago/Turabian StyleZhou, Wenjie, Yanjun Li, Yulu Zhang, Qingyan Jiang, Dong Chen, Yanzhen Gu, and Yuan Lin. 2024. "Design and Analysis of a Buoy-Based Cable Seafloor Observatory System Response under Extreme Weather Conditions" Journal of Marine Science and Engineering 12, no. 6: 889. https://doi.org/10.3390/jmse12060889
APA StyleZhou, W., Li, Y., Zhang, Y., Jiang, Q., Chen, D., Gu, Y., & Lin, Y. (2024). Design and Analysis of a Buoy-Based Cable Seafloor Observatory System Response under Extreme Weather Conditions. Journal of Marine Science and Engineering, 12(6), 889. https://doi.org/10.3390/jmse12060889