Article

Past and Future Impacts of the Relative Sea Level Rise on the Seafront of Ancient Delos (Cyclades, Greece) and Flooding Scenarios by 2150

1
Department of Classics and Archaeology, University of Nottingham, Nottingham NG7 2RD, UK
2
Society for the Study of Ancient Coastlines—AKTES NPO, Chalandri, 15231 Athens, Greece
3
Institute of Historical Research, National Hellenic Research Foundation (IHR/NHRF), 11635 Athens, Greece
*
Author to whom correspondence should be addressed.
J. Mar. Sci. Eng. 2024, 12(6), 870; https://doi.org/10.3390/jmse12060870
Submission received: 30 April 2024 / Revised: 14 May 2024 / Accepted: 21 May 2024 / Published: 24 May 2024
(This article belongs to the Special Issue Sea Level Rise and Related Hazards Assessment)

Abstract

:
Sea level rise due to global warming is a continuing and, disappointingly, accelerating process which has already affected and will further impact coastal lowlands and the social and economic activities in these areas. Delos Island, situated in the middle of the Cyclades in the Aegean Sea, was considered the most sacred of all islands in ancient Greek culture and was a trading hub for the entire eastern Mediterranean. Uninhabited since the 7th century AD, and consistently the focus of research and touristic attention, the island is designated as an archaeological site and inscribed on the UNESCO World Heritage List. Previous studies on the relative sea level (rsl) changes suggest a steadily rising rsl during the last 6300 years, starting from a sea level of −4.80 ± 0.20 m in the Late Neolithic. The seafront of the ancient city of Delos is subject to the effects of rsl rise, which have caused significant coastline retreat and exposure to the northerly winds and waves, whereas parts of the coastal lowland, where the remains of the ancient city lie, are inundated, forming extended wetlands. The future impacts of rsl rise on the seafront of ancient Delos are illustrated on very-high-resolution digital surface models, evaluating both the flooding risk under different climatic projections, as provided by the IPCC AR6 report, and the ongoing land subsidence, as recorded by GNSS data. An rsl rise ranging from 87 cm (SSP1-2.6 scenario) to 148 cm (SSP5-8.5 scenario) is anticipated by 2150, requiring both resilience strategies and adaptation solutions as well as mitigation policies to cope with the effects of climate change.

Graphical Abstract

1. Introduction

Rising sea levels due to global warming constitute one of the most crucial impacts of climate change, one which will dramatically affect the coastal lowlands, causing future flooding of their social, economic, cultural, and touristic infrastructures. The insularity of its territory makes Greece one of the Mediterranean countries that will be strongly burdened by the future sea level rise. Although some studies have established the Greek coastal areas that will, in general, be subject to flooding up to 2100 and 2150 due to sea level rise [1,2], only one has focused on the Cycladic archipelago [3], where a large number of islands are to be found (
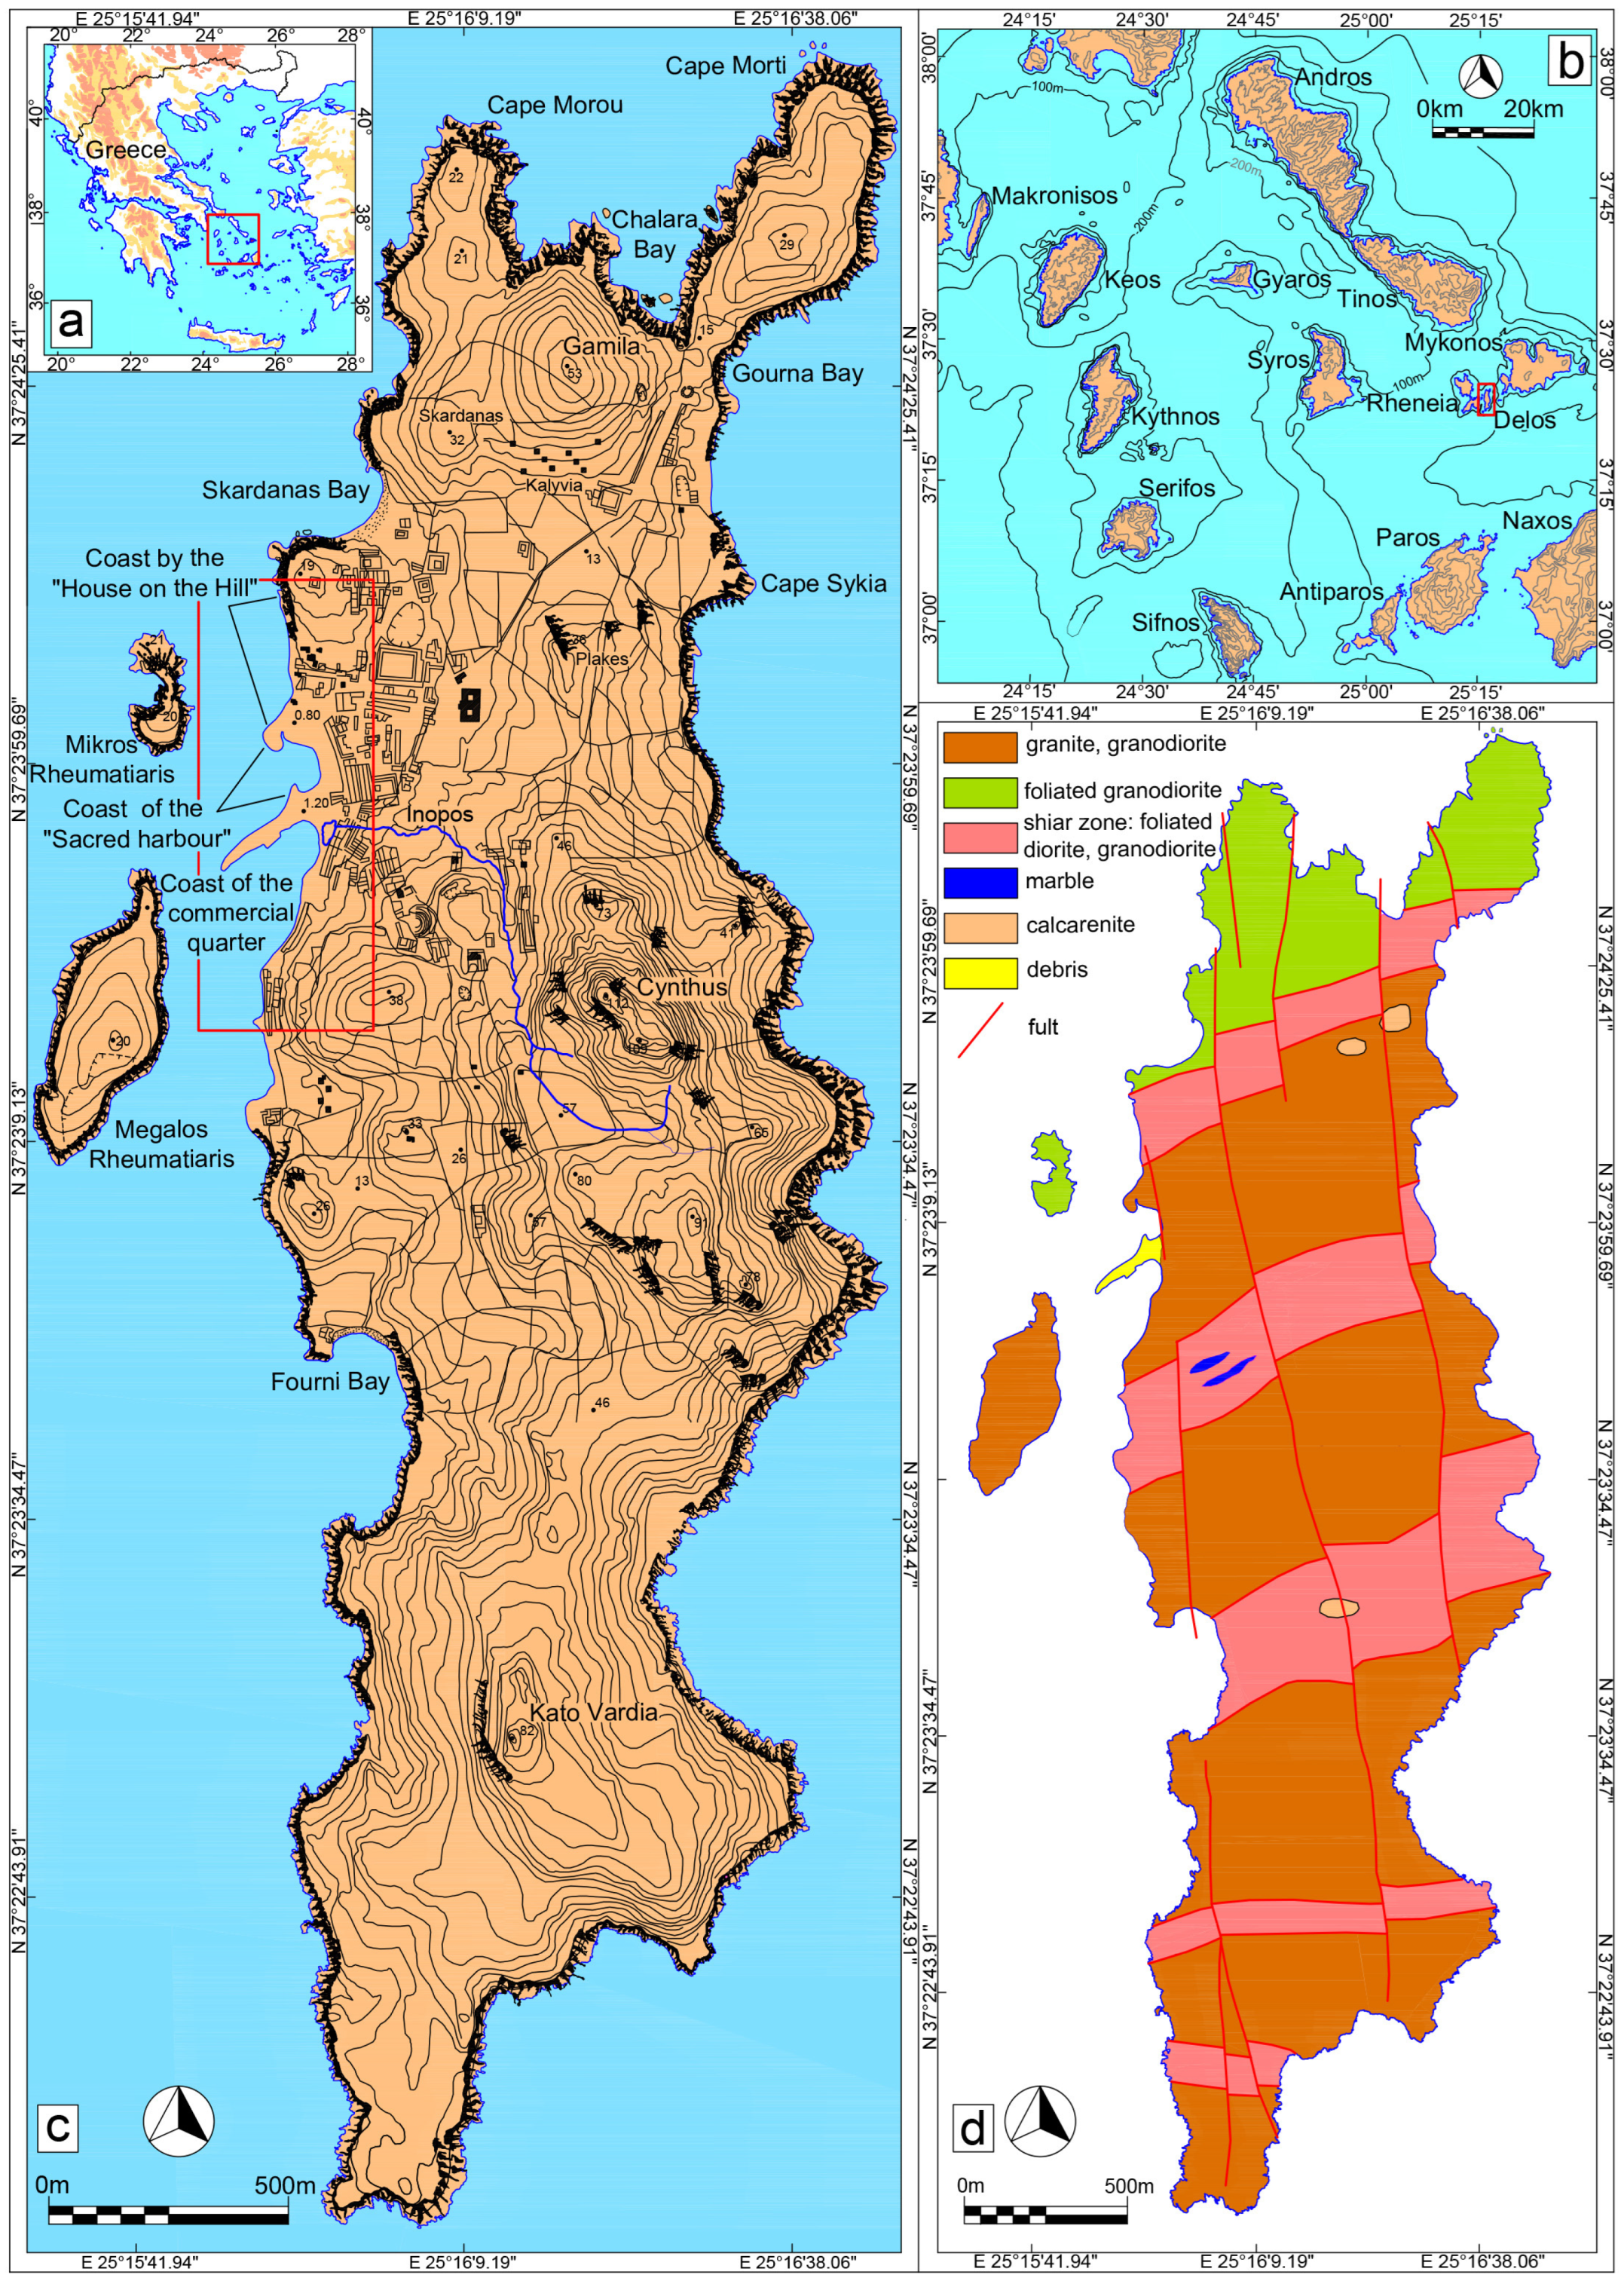
Figure 1a). This paper is centred on Delos Island, not only due to its geographic position in the middle of the Cyclades in the Aegean Sea (Figure 1b), but also, indeed mainly, because of its universal archaeological value, as it was considered the most sacred of all islands (Callimachus, To Delos, 3rd c. BC) in ancient Greek culture, and has been inscribed on the UNESCO World Heritage List since 1990 [4].
Delos is situated between Mykonos and Rheneia Islands, separated from the latter by the Delos Strait, a narrow channel < 1 km wide, and two rocky islets: Mikros (Little) Rheumatiaris to the north and Megalos (Great) Rheumatiaris to the south (Figure 1c).
Delos has an irregular oblong shape, measuring 5 km N–S by an average of 1.30 km E–W, with a total area of 6.85 km2 (Figure 1c). It has 14.20 km of coastline, some narrow gravelly beaches, and mostly rocky steep shores, with the exception of the coastal lowland on the western side, where the ancient city is located. Narrow peninsulas have formed on the northern and southern edges of the island, as have small bays on the NE (Gourna Bay), NW (Skardanas Bay), and SW (Fourni Bay) sides. Delos is mostly characterised by a rocky, hilly landscape, disrupted by small valleys. Mount Cynthus (+112 m) dominates the middle of the island, and Gamila Hill (+53 m) and Kato Vardia (+82 m) dominate the northern and southern parts, respectively. The Inopos River originated from a basin southwest of Mount Cynthus, initially flowed in a northerly direction and then turned westward to end in the lowland where the ancient city was situated. Around 400 BC, a dam was constructed at the river bend to create a public reservoir for water collection [6].
The northern part of Delos Island consists of Miocene granitoid rocks, psammitic schist, marble, and amphibolite, which are part of the Miocene plutonic assemblage of the Cyclades [5,7]. The main rock in the central part of the island is megacrystic granodiorite, while in the southern part, medium-grained granodiorite and granite, with abundant enclaves, are the prevailing rock types. These are separated by three main shear zones: Skardanas to the north, dipping steeply to the south, Cynthus in the central part, and Fourni to the south, dipping northward at lower angles. The shear zones are hundreds of metres wide and consist of thin screens of metasedimentary rocks and parallel sheets of strained plutonic rocks striking ENE [5] (Figure 1d).
The island was first inhabited in the 3rd millennium BC on the summit of Mount Cynthus, while in the late 15th century BC the Mycenaeans settled in the valley on the western shore of the island (Figure 1c). The cult of Apollo on Delos was established by about the 9th century BC and reached a peak in the Archaic and Classical periods, when Delos became a famous religious centre. In 478 BC, the Delian League of Greek cities was formed on Delos. By the end of the 3rd century BC, magnificent buildings and many sanctuaries of most of the Greek Gods and many foreign deities were constructed on Delos. In late Hellenistic times (after 166 BC), the Romans proclaimed Delos a tax-free port, which resulted in an increase in population, urban growth toward the sea, and extensive construction and commercial activity, rendering Delos the biggest hub of transit trade in the Aegean, serving all of the eastern Mediterranean. Delos was sacked twice, first by Mithridates in 88 BC and a little later in 69 BC by the pirates of Athenodorus. The port became unsafe and the city fell into decline and was gradually abandoned. In the first few centuries AD, there was a Christian community there, but after the 7th century AD, Delos was completely deserted [8,9]. The coastal structures (sea defences and buildings) all along the seafront of the ancient city were gradually submerged due to the rising relative sea level (henceforth referred to as rsl) since the period they were initially constructed and used, as first reported by Négris in the early 20th century [10] and later studied in detail by relevant scholars (e.g., [11,12,13]).
On the one hand, this paper aims to illustrate on very high-resolution digital surface models those areas on the seafront of ancient Delos at risk of flooding, evaluating both the—mainly anthropogenic—sea level rise under different climatic projections by 2150 and the ongoing land subsidence. On the other hand, through correlation of the determined rsl changes during the last 6300 years with ancient sea defences on the seafront of ancient Delos, a verification of future flooding scenarios is attempted, while also demonstrating the efforts of ancient societies to adapt to natural phenomena by making their structures resilient, and consequently conveying a message of effective sustainability when facing the challenges of modern climate change.

2. Materials and Methods

Rsl rise projections and flooding scenarios constitute a demanding multidisciplinary project that necessarily follow specific steps (e.g., [14]). To achieve this goal for Delos Island, which despite its local scale is certainly of particular value, we conducted the following activities: aerial photogrammetry to produce a digital surface model (DSM) of the survey area; the acquisition and processing of GNSS data to estimate the Vertical Land Motion (VLM); and the incorporation of geospatial and geodetic data into the updated regional sea level projections up to 2150, as provided by the Intergovernmental Panel on Climate Change’s Sixth Assessment Report (IPCC AR6). At the same time, previous results on the former sea level changes were reassessed and the ancient sea defences were interpreted anew. The methodology followed for each specific step is described below.

2.1. Geospatial Surveying

Photogrammetry is based on the principles of triangulation and stereovision. Triangulation is the process of determining the position of a point by measuring angles to it from known points at either end of a fixed baseline. Stereovision, on the other hand, is the process of creating a 3D representation of an object by combining multiple 2D images taken from different angles. Today, drones equipped with cameras able to tag the images taken with GNSS coordinates have opened up new opportunities in several scientific fields, such as surveying, mapping, engineering, archaeology, etc.
Drone digital photogrammetry was applied to produce very-high-resolution digital surface models (DSM) for the survey area. The aerial surveys were conducted on 10 November 2023, using a DJI Mavic 3E with global shutter camera (FOV 84°, 24 mm lens equivalent, 20MPixel, ¾ sensor size), owned by GeoSense. Image geotags were marked utilizing the post-processing kinematic (PPK) correction methodology, which resolved errors after all the geotagged located data had been collected, as RTK correction was not available.
All surveys were conducted under extremely calm wind conditions (<1 bf) in order to achieve the best shoreline reconstruction and avoid any distortion in the coastline position created by sea waves and water refraction.
Side overlap was set at 70%, frontal overlap was set at 80%, and flight speed at 9 m/s. Furthermore, and despite the fact that the drone used is capable of collecting images at an even higher speed, we decided to switch to safer speeds, thus minimizing motion blur and providing crisper and more detailed images. Two successive 38 min flights were conducted.
The relative height of the flights was 80 m with terrain-following adjustments. At this flight level, the resulting ground sample distance (GSD) was 2.2 cm/pixel, providing a very detailed and crisp orthomosaic. The geometrical accuracy of the missions was calculated according to the following formulas: Horizontal accuracy = ±(GSD × 2), Vertical accuracy = ±(GSD × 3). A total of 1013 images were collected, with the surveyed area amounting to 630,000 m2.
The photogrammetry software used for the image processing was PIX4Dmatic. WGS84/UTM zone 34N was selected as a generic coordinate system compatible with any other third-party source of data (e.g., Google Earth/Map, OpenStreetMap), but with the flexibility to transform to local coordinate systems such as GGRS87 and HTRS08. The heights were adjusted from geometric to orthometric by applying Geoid model EGM08.
The deliverables from the processing process were as follows: (a) a dense 3D point cloud, colorised, in LAS/LAZ format; (b) a 2.5D GeoTIFF DSM with a final resolution of 0.024 m; and (c) an orthomosaic (Figure 2).
In the absence of the official coastline position on a scale matching the needs of this study, and to precisely reconstruct the contemporary coastline position so as to apply the rsl rise projections, we carried out topogeodetic measurements with tidal correction at the time of the survey. This enabled us to define the zero-elevation position and therefore adjust the contour lines generated from DSM.
The above methodological approach ensures the accuracy of geospatial data, thus achieving high reliability in applying the flooding scenarios to estimate the areas that will be potentially inundated by 2150 due to rsl rise.

2.2. Geodetic Data (VLM Rate)

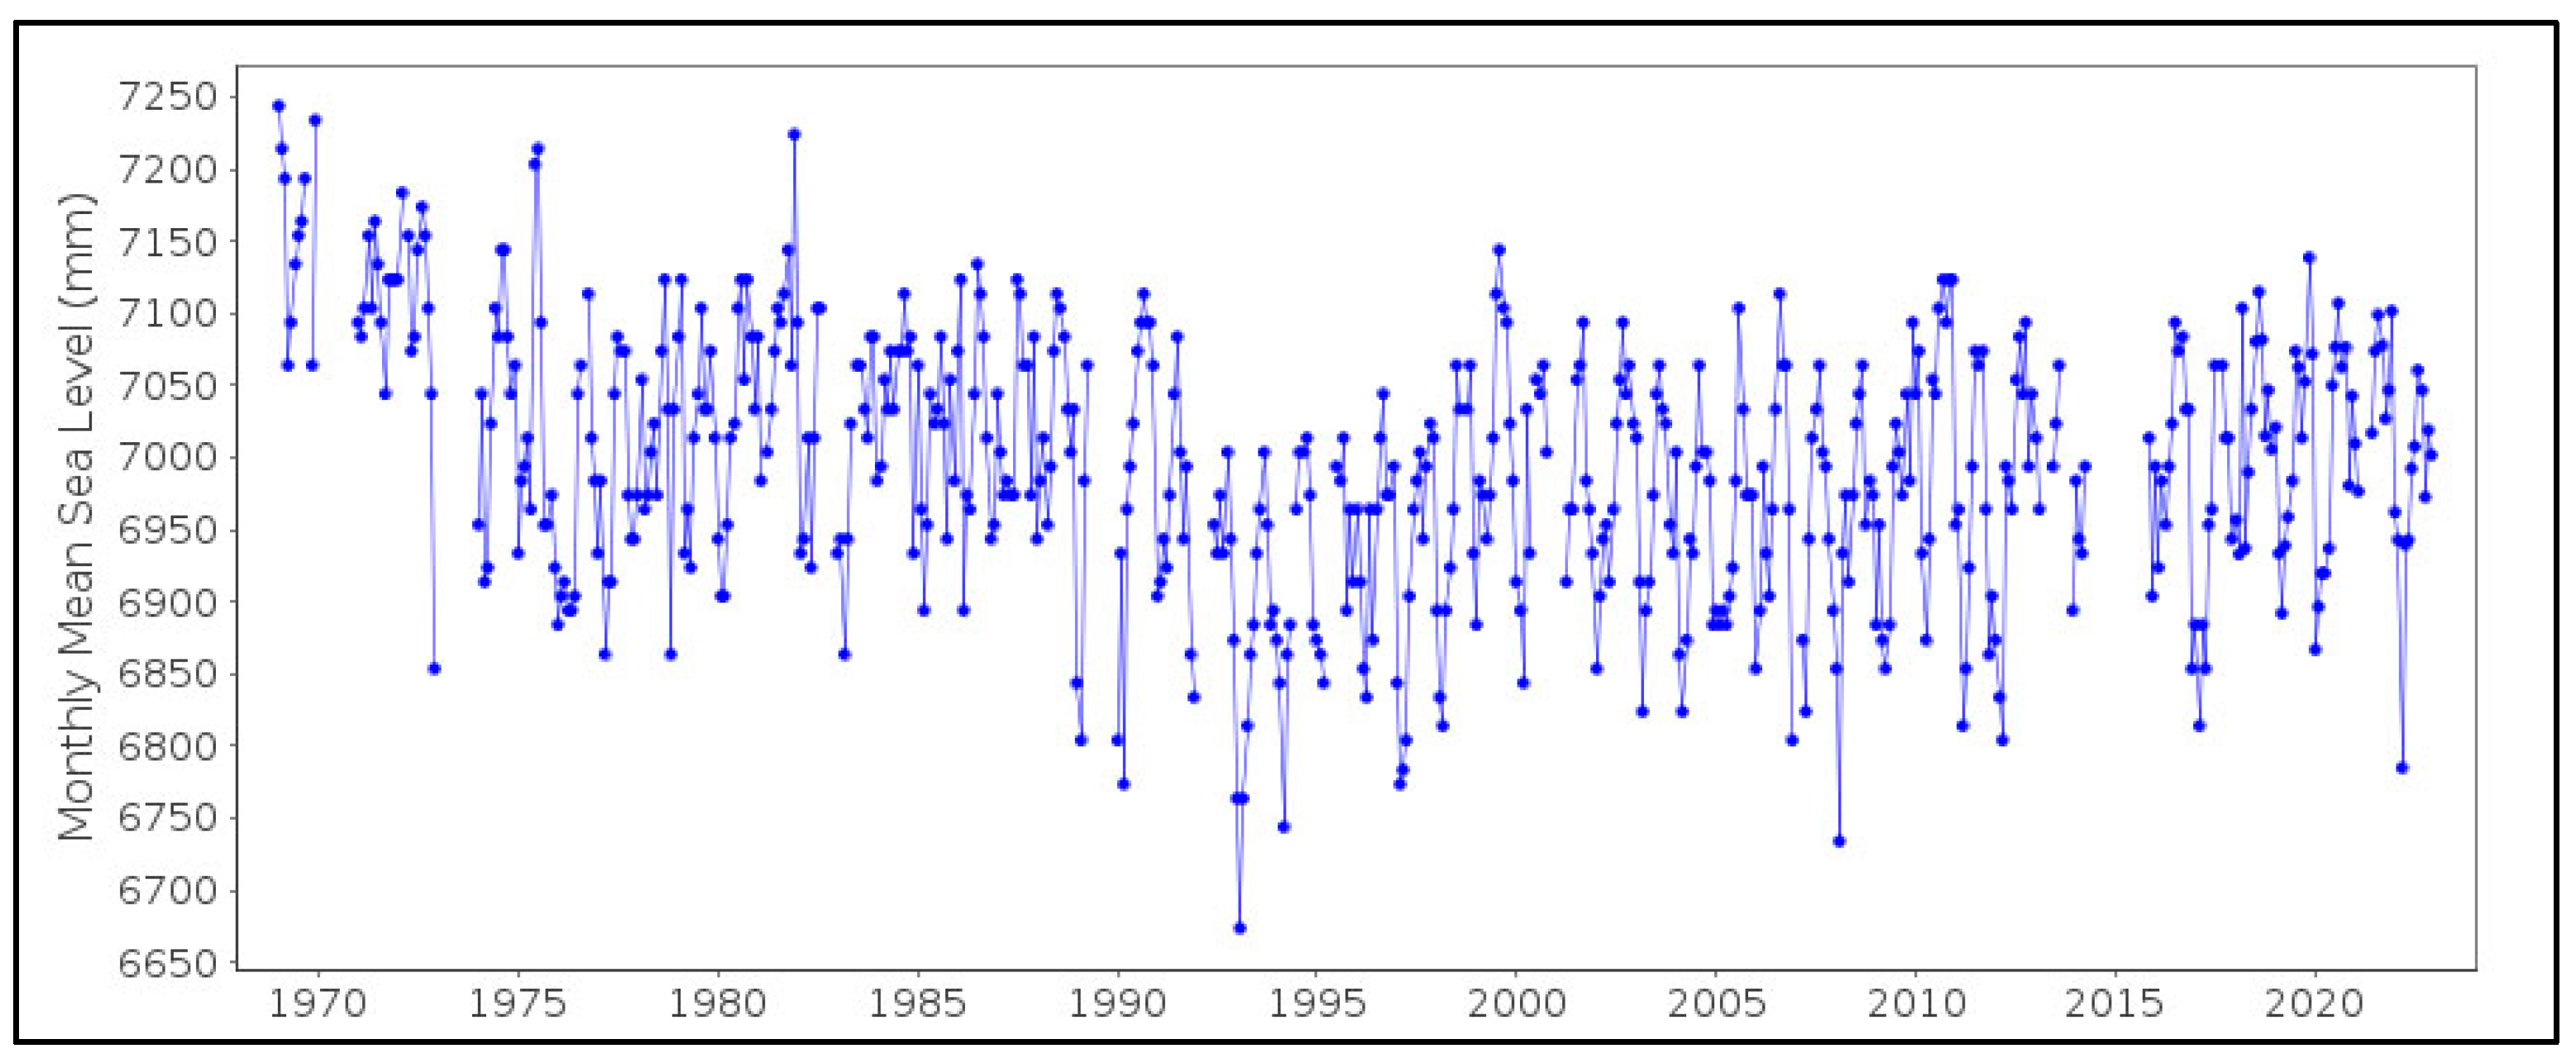
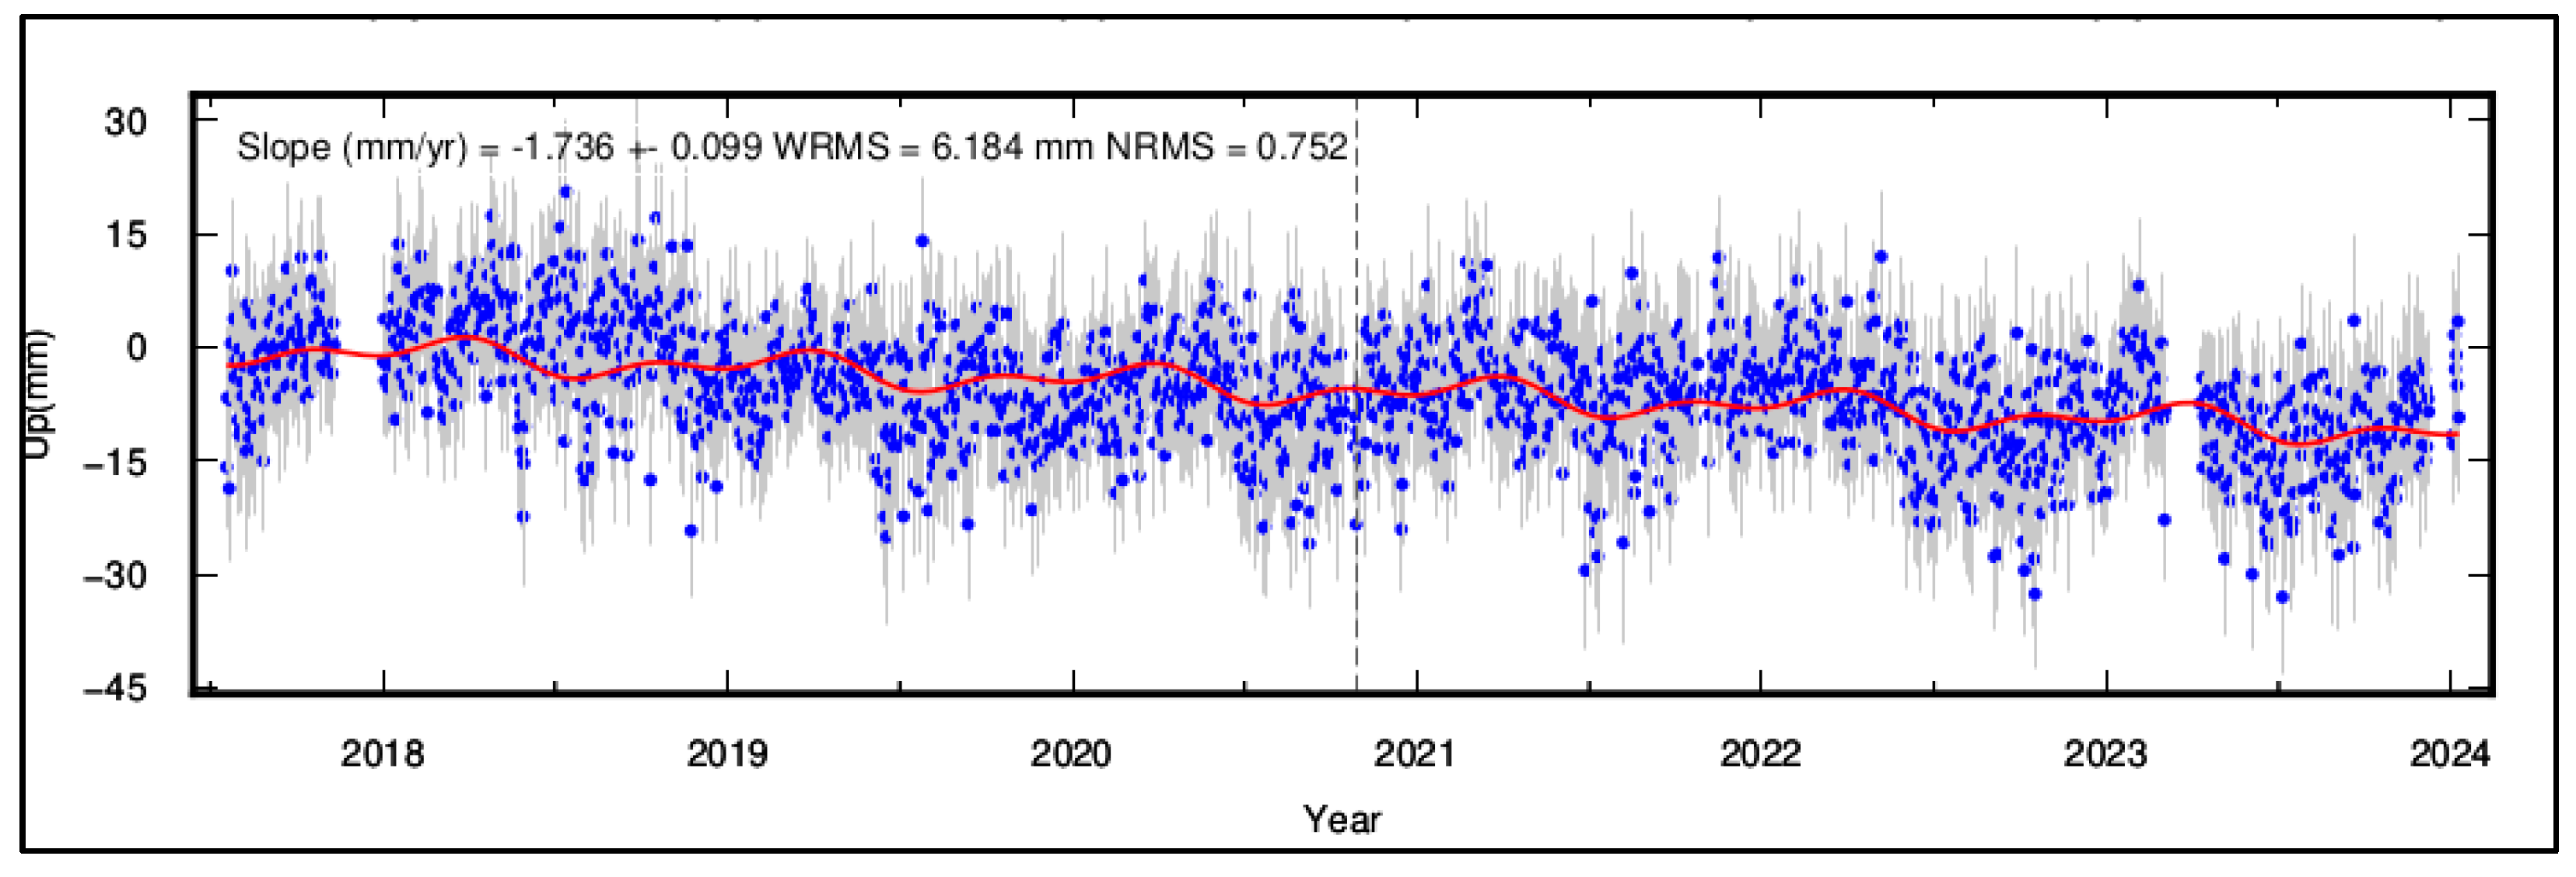
The current rate of VLM was estimated using the closest GNSS station operated by METRICA on the neighbouring island of Mykonos, located in Chora of Mykonos. The station details (code, coordinates) and time interval for the data provided by METRICA are given in Table 1. Data covering the period were computed for the purposes of this study by GAMIT software at the INGV (Rome, Italy) Geodetic Analysis Data Centre following the methodology described in [14] (p.6 and relevant references therein). According to this, from the vertical velocity for the time interval 2018–2024 (Table 1), a subsidence rate of −1.736 ± 0.752 mm y−1 was inferred (Figure A1, Appendix A). An analogous rate at −1.8 ± 1.1 mm y−1 was reported by [15] (Table S1), calculating GPS data for the time interval 20016-2020 from the MYKN station.

2.3. Rsl Rise Projections and Flooding Scenarios by 2150

The updated regional sea level projections up to 2150 were provided by the Intergovernmental Panel on Climate Change’s Sixth Assessment Report (IPCC AR6) [16,17,18] and were accessed through the ‘NASA/IPCC Sea Level Projections Tool’ [19]. According to this, only projections with at least medium confidence relative to the period of 1995–2014 were considered for five future shared socioeconomic pathway (SSP) scenarios (SSP1-1.9, SSP1-2.6, SSP2-4.5, SSP3-7.0, SSP5-8.5) and five different future global mean surface temperatures (1.5 °C, 2 °C, 3 °C, 4 °C and 5 °C). The IPCC AR6 sea level projections resulted from the consideration of several geophysical processes, including both the Antarctic and Greenland Ice Sheets, glaciers, land water storage, ocean thermal expansion, and long-term VLM inferred by the longest time series of sea level. More importantly, the IPCC AR6 clearly communicates the projection uncertainty and ambiguity of future sea level assessment [20].
Into the regional sea level projections (Mykonos and Delos Islands, Aegean Sea), we inserted the estimated current VLM rate, as computed by the time series ground displacement data obtained from the continuously operating GNSS station on Mykonos (see Section 2.2), on the proviso that the subsidence trend continues linearly until 2150 at the same rate as today, without being disrupted by any paroxysmal tectonic event. Our assumption is further supported by the aseismic character of the Cycladic metamorphic central core, with scarce and scattered seismicity [13,21,22,23]. The ‘aseismically deformed’ area of the northern and central Cyclades is probably the result of the existence of a very closely spaced geometric fracture framework within the metamorphic rocks, preventing strain accumulation. Thus, energy release manifests itself in continuous deformations creeping along the fracture planes [23] (p. 24).
Finally, the rsl rise projections were calculated for all SSP scenarios, and subsequently the areas that will potentially be at risk of flooding by 2150 were established.

2.4. Past Rsl Changes in Delos Island

The systematic recording, mapping, and measurement of the contemporary depth of submerged geomorphological features related to former sea levels and their dating based on archaeological sea level indicators and radiocarbon ages, throughout the coasts of the island group of Mykonos, Delos, and Rheneia, were used by [13] for the determination of five former sea levels during the Late Holocene and consequently the periods of relative sea level stability, which are consistent with the inferred former sea level stands for the northern and central Cyclades [13,23]. The rsl curve for the island group of Mykonos, Delos, and Rheneia constituted the outcome of this geoarchaeological project (Figure 3). In summary, the sea level was at −4.80 ± 0.10 m between 4300 BC and 14C cal. age 1972 BC; at −3.70 ± 0.20 m between 1972 BC and 130 BC; at −2.40 ± 0.25 m between 130 BC and 14C cal. age AD 1272; at −1.55 ± 0.25 m between AD 1272 and 1650 and, finally, at 0.80 ± 0.10 m between AD 1650 and AD 1891 [13]. The sea level stands refer to depths below mean sea level (henceforth referred to as bmsl).

2.5. Mapping of the Submerged Ancient Remains and Interpretation of Ancient Adaptation Measures

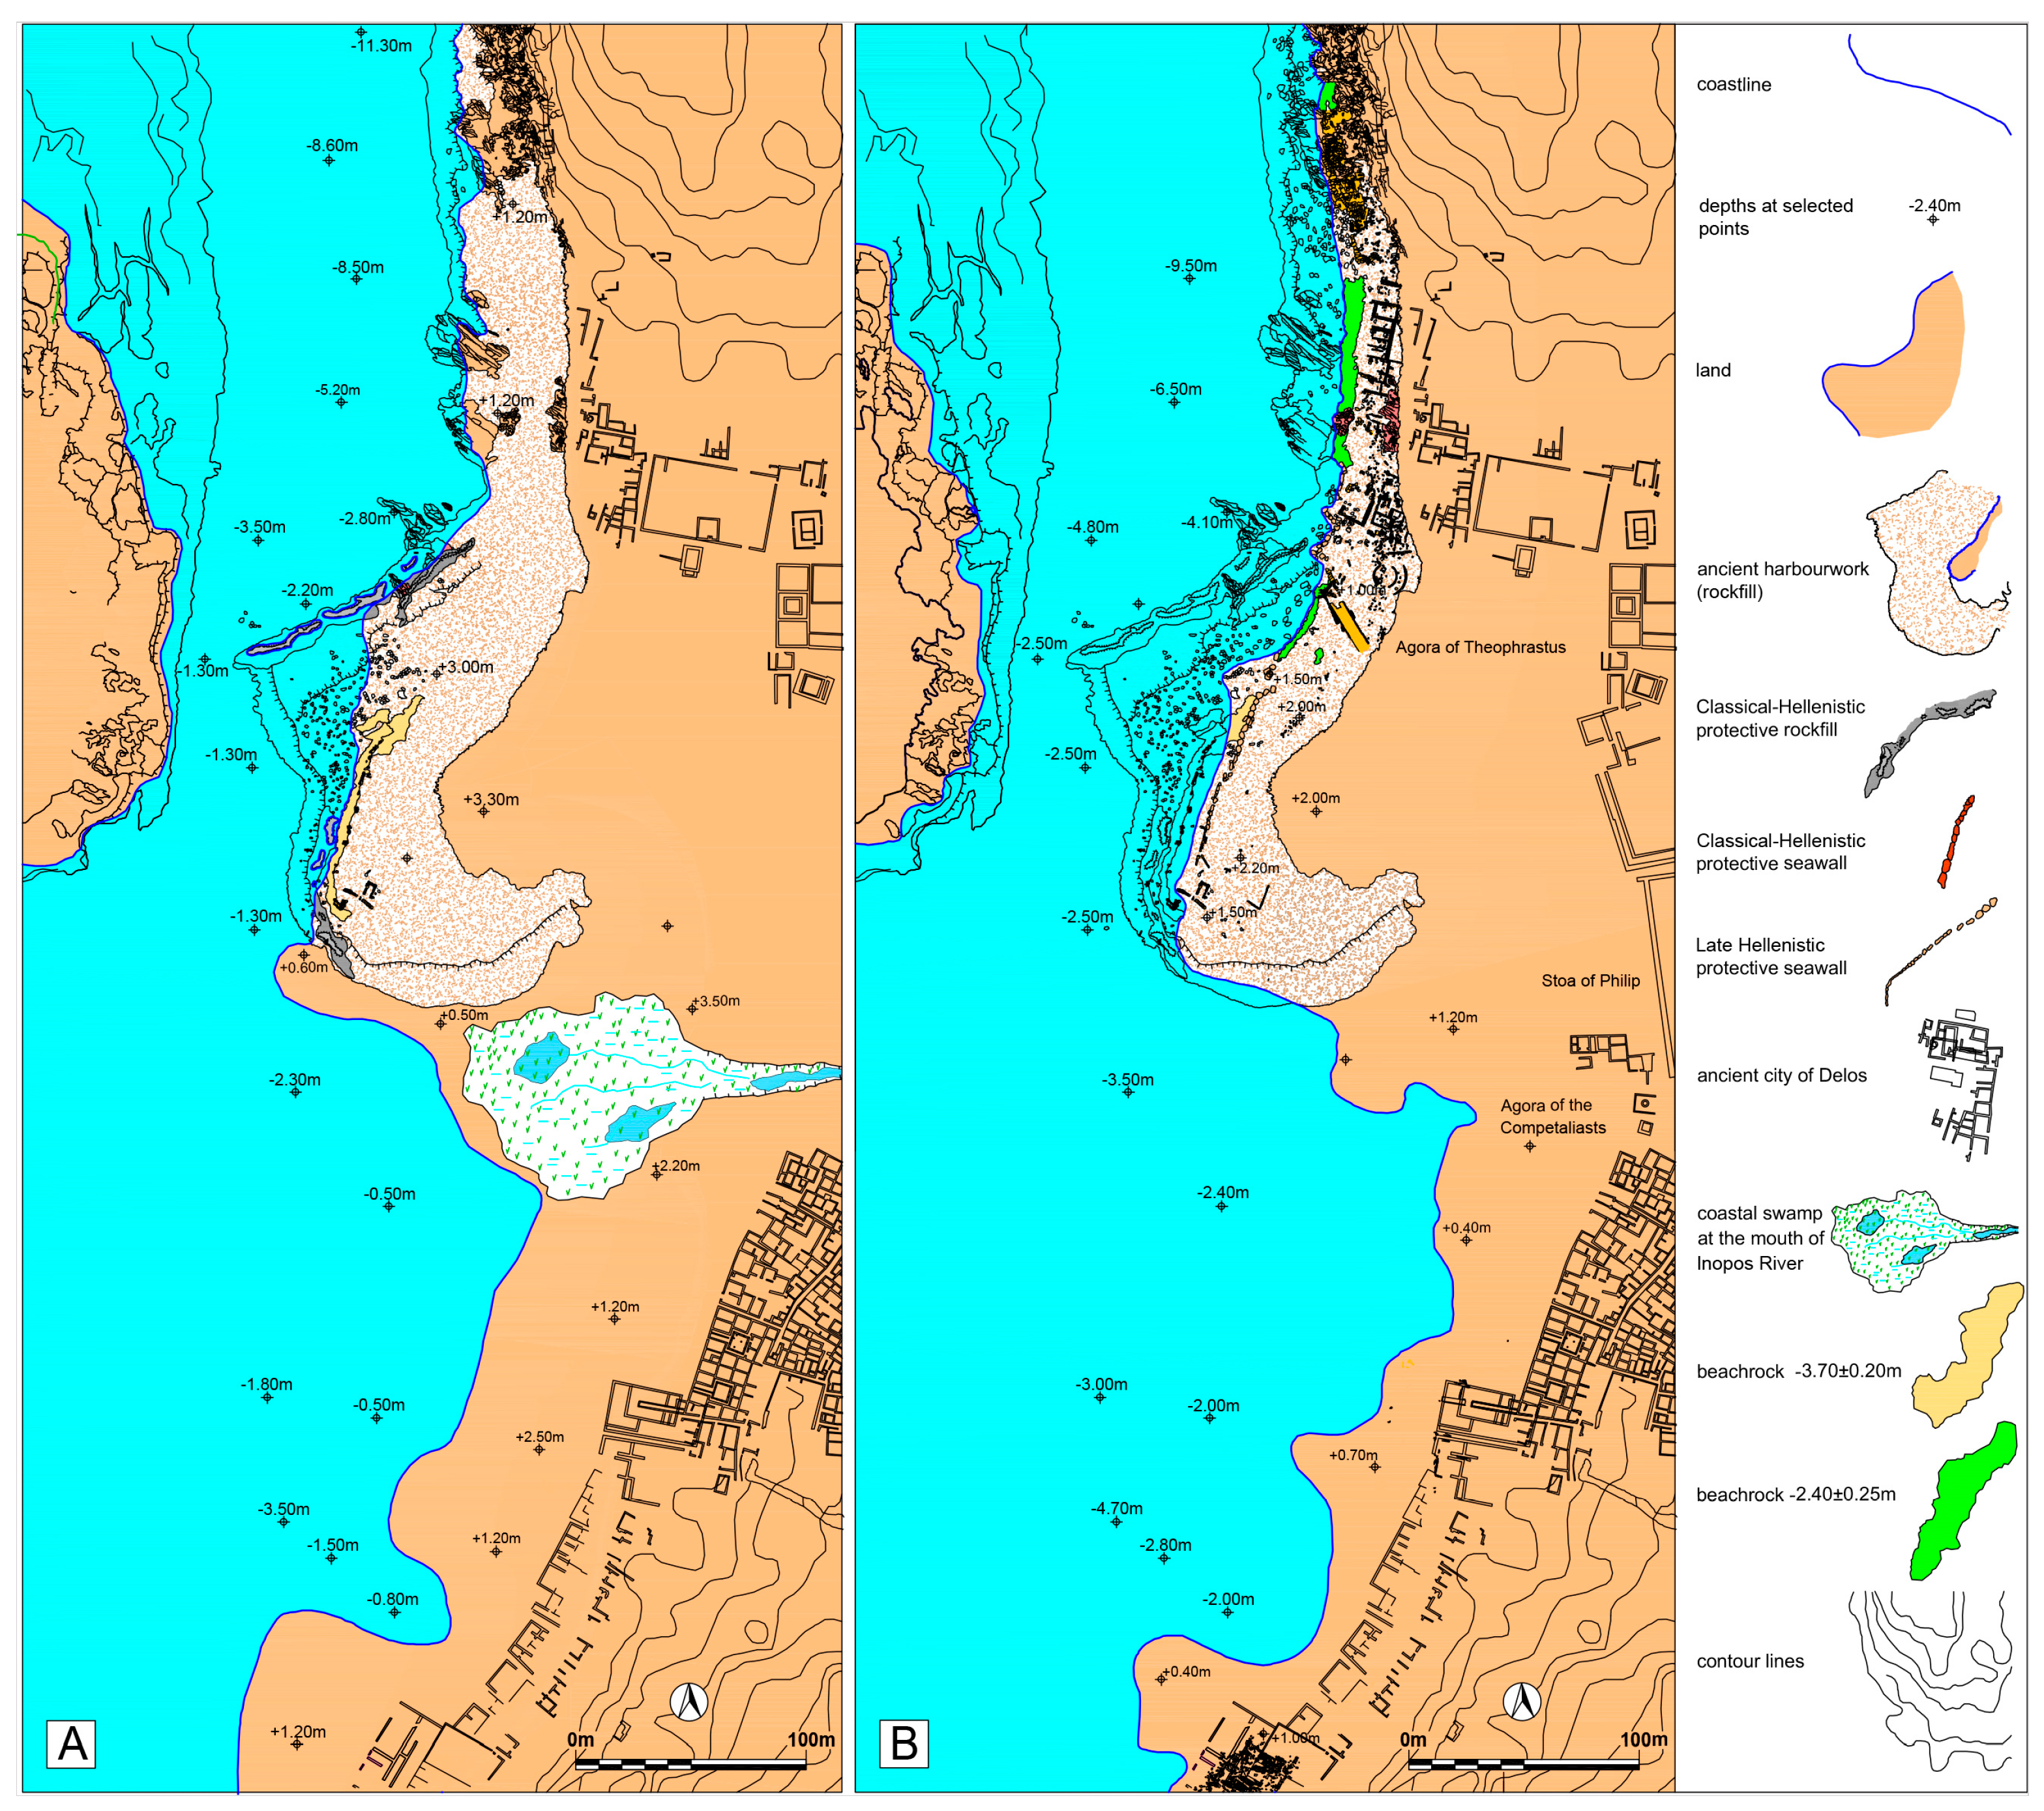
The orthomosaic generated from the geospatial survey was used to demarcate the boundaries of the near-shore zone where remains of ancient structures are now submerged (Figure 2). Furthermore, previously published depths at selected points all along this zone and the functional elevations of ancient harbourworks [12,13] were taken into consideration in order to produce a detailed plan of the seafront of the ancient city of Delos and interpret the sea defences that ancient people made in order to protect the seafront of the ancient city against rising sea levels, in combination with the former sea level stands, as briefly presented in Section 2.4.

3. Results

3.1. Rsl Changes on the Seafront of Ancient Delos and Sea Defences during the Classical and Hellenistic Periods (5th to 1st Century BC)

The mapping of the near-shore zone, according to the methodology presented in Section 2.5, enabled us to produce a detailed plan of the seafront of the ancient city of Delos and distinguish the geomorphological sea level indicators (beachrock generations) and submerged ancient remains (harbourworks, seawalls, protective rockfills, building remains) that are presented in Figure 4 and described below.
Along the seafront of the ancient city of Delos, north of the Main Harbour (or the so-called Sacred Harbour) and up to the southern cliff of the small Skardanas Bay, important harbourworks were undertaken, possibly during Classical Antiquity (4th to 3rd century BC) (Figure 1c and Figure 4). These consist of a rubble mound construction, an extended rockfill, stretching for 430 m parallel to the shoreline and at its southernmost end curving as it enters the Main Harbour. It has a maximum width of 115 m, a maximum thickness of 4 m, and an estimated volume of 100,000 m3. It consists of granite boulders ranging in size from 0.60 × 0.30 m to 1.80 × 2 m, resting on the rocky granite bedrock. It seems to have been built to protect the coast from waves and erosion while at the same time gaining vital space.
On top of the rubble mound harbourwork, four distinct beachrock generations were formed, today submerged at −3.70 ± 0.20 m, −2.40 ± 0.25 m, −1.55 ± 0.25 m, and −0.80 ± 0.10 m bmsl (Figure 4), with the seaward end of each defining the shoreline position during the periods when each was cemented [12,13,24].
In the southern part of the harbourwork, the deepest beachrock generation (−3.70 ± 0.20 m bmsl) has incorporated a wall made of rough stones bound together with mortar; this appears to have served as a seawall to protect the busy coast of the time from coastal flooding and erosion. In front of it, at a distance of 3 m toward the open sea, a rockfill was placed parallel to the coastline to reduce the wave action and protect the ancient coast. This rockfill is 80 m long and 40 m wide, with its axis slightly curved and its surface at a depth of −3.60 m bmsl. Two almost parallel rockfills were also placed in the central part of the harbourwork: the deepest, 100 m long and 11 m wide, and, less that one meter away, the shallowest, 50 m long and 5 m wide. The tops of the rockfills are at a depth of 3.90 m bmsl and 3.30 m bmsl, respectively, with the deepest coastline passing in between (Figure 4).
Another line of coastal protection is observed at a higher elevation toward the coast, along a shoreline, defined by the beachrock generation at 2.40 ± 0.25 m bmsl (Figure 4). It is a seawall integrated into the beachrock, 40 m long and 1.30 m wide, made of rough stones bound together with mortar. The seawall is 0.60 m high, with its top surface at a depth of 1 m bmsl. A total of 16 blocks, 3 × 2 m in size, were placed in front of the seawall at a distance of 4 m to 7 m seaward, clearly for the purpose of reducing wave energy. A 6.30 m wide road, now submerged and visible for 30 m, seems to have ended there (Figure 4). To the south of the seawall, the protective works consist of large boulders, measuring 3.50 × 2 m, aligned for a length of 47 m in contact each other, followed by a wall made of stone blocks 0.50 × 1 m in size that stretches for a length of 53 m. To the north of the seawall, 18 protective boulders, measuring 2.50 × 2 m, were placed along the then shoreline. Further north, although a large number of submerged Hellenistic buildings have been recorded [25,26], extending to a distance of approximately 10 m off the then shoreline, there seems to have been no provision made for sea defences/coastal protection. At the northernmost end, however, a submerged paved area approximating 900 m2, demarcated by the then shoreline and resembling a dock, appears to have been protected by 25 boulders, measuring 2.50 × 2 m, randomly placed about 10 m in front of it facing seaward (Figure 4). All of the submerged building remains that have been integrated into the beachrock generation at 2.40 ± 0.25 m bmsl date back to the Hellenistic period of Delos [25,26]. The two younger beachrock generations at 1.55 ± 0.25 m and 0.80 ± 0.10 m bmsl (Figure 4) incorporate, along with the coarse beach deposits, ruins and architectural members of the Hellenistic buildings, thus postdating their formation to subsequent periods of rsl stability [13].

3.2. Rsl Rise Projections and Flooding Scenarios by 2150

The relative sea level rise projections that combine IPCC AR6 data for all the SSP scenarios (SSP1-1.9, SSP1-2.6, SSP2-4.5, SSP3-7.0, SSP5-8.5) and the inferred VLM rate for the years 2030, 2050, 2070, 2100, and 2150 were computed (as explained in Section 2.2 and Section 2.3) and are presented in Table A1 (Appendix A) and Figure 5. The projected sea levels for each year and SSP scenario were applied to the DSM generated from geospatial surveying (as detailed in Section 2.1) and the areas potentially at risk of flooding were calculated and are also presented in Table A1 (Appendix A). The last dataset in Table A1 (labelled: observation) represents the rsl rise projections by 2150 deduced from the rsl curve for Delos (Figure 3, Section 2.4) based on the assumption that, despite the accelerating increase in global temperature, the sea level will rise linearly during the coming decades at the same rate as that of the period between the Second Industrial Revolution (late 19th—early 20th century) and 2018, for which observational data substantiate an rsl rise of 0.80 ± 0.10 m, including the actual magnitude and direction of VLMs whenever they occurred during that period.
A recent analysis of the tide gauge data from the station operated by the Hellenic Navy Hydrographic Service (HNHS) in the port of Syros (central Cyclades, Aegean Sea) (Figure A2, Appendix A), performed for a time series ranging from 1969 to 2019 with data completeness reaching 86%, despite revealing a negative linear trend (slope: −7.5 mm yr−1) for the time span 1969–1995, confirmed a positive trend for the time span 1995–2019 at a rate of 3.1 mm yr−1/year [27]. This decreasing trend is mainly attributed to cooling up until the North Atlantic Oscillation (NAO) index shift that induced the Eastern Mediterranean Transient (EMT) phenomenon and an increase in salinity in the Aegean. The increasing trend observed afterwards can most probably be linked with increasing sea surface temperatures [27].

4. Discussion

The continuous shoreline retreat caused by the gradual sea level rise during the late Holocene has drastically changed the coastal landscape through the ages, thus affecting human coastal activity and compelling ancient societies to adopt protective measures against rising sea level, waves, and erosion [12].
The sea level during the 5th century BC was 3.70 ± 0.20 m lower than at present [13]. At that time, sea defence works were constructed along the shoreline. During this period of rsl stability, when the deepest beachrock generation that is now submerged at −3.70 ± 0.20 m bmsl was forming, the seawall and a few ruins of that period were integrated into it. The cove formed by the then shoreline in front of the Agora of the Competaliasts, where there was a coastal swamp at the mouth of the Inopos River (Figure 4 and Figure A3, Appendix A), allowed ships to approach, disembark visitors heading to the sanctuaries, and unload goods [13,28]. The suggestion that the so-called Sacred Harbour was the Main Harbour of ancient Delos should be reassessed, as the major part of the small bay was occupied by the ancient protective harbourwork (rockfill), leaving no space for ships to approach. With a sea level at −3.70 ± 0.20 m bmsl, the coast of the Sacred (Main) Harbour would have been 200 m wider than the current coastal zone, while the cove currently being created there would have been land [13].
The recent borehole findings [29], which show that the sedimentary floor of the Sacred (Main) Harbour dated back to the end of the Hellenistic period (212-92 BC), was found at a depth of -2.25 m bmsl, that is to say about 1.50 m higher than the sea level of the Classical and Early Hellenistic period (−3.70 ± 0.20 m bmsl), and at approximately the same level of the Late Hellenistic period onward (−2.40 ± 0.25 m), with the rsl change between the two stands having occurred at some time between 180 and 130 BC [13] (Figure 3 and Figure 4).
Evidence of an rsl change by 1.30 m that shifted the sea level to −2.40 ± 0.25 m bmsl before the end of the Hellenistic period (at some time between 180 BC and 130 BC) [13] justifies the new sea defences constructed along the coast of that time (Figure 4 and Figure A3, Appendix A). This is further substantiated by epigraphic evidence, reporting that the Athenian Theophrastus, superintendent of Delos in 126/125 BC, constructed the homonymous Agora and surrounded the harbour with backfilling (“κατασκευάσαντα τὴν ἀγορὰν καὶ τὰ χώματα περιβαλόντα τῶι λιμένι”, ID 1645, as referred to in [6]). This sea level seems to have remained relatively stable even after the successive devastations of Delos in 88 BC and 69 BC. The Hellenistic ruins integrated into the beachrock generation today submerged at 2.40 ± 0.25 m bmsl prove that this beachrock was cemented after the destruction of Delos. The once busy coastal zone of the thriving ancient city is now deserted, left to the mercy of marine transgression and erosion. The sea level continued to rise gradually with three intermediate short periods of rsl stability between the 13th and 20th centuries AD before it reached its current stand (Figure 3). There was no longer any need for sea defences in the later periods as the ancient city was abandoned until the late 18th century, when an archaeological dig brought it to light again.
In the early 20th century, the debris (~60,000 m3) from the extensive archaeological excavations carried out by the French School were dumped into the Sacred Harbour and a jetty, 280 m long and max 28 m wide, was constructed there at an angle of approx. 45° to the coast, which serves the small ships coming from the old port of Mykonos (Figure 4). This human intervention dramatically altered the coastal configuration, shaping two new coves to the north and south, and causing silting in the south cove at least.
The seafloor of the near-shore zone on the western coast of Delos, where the remains of the ancient harbourworks and sea defences lie in shallow water (depths up to 4 m), slopes seaward at low gradients, 3°–4° north of the Sacred Harbour and up to 2° to the south. The lack of fine beach deposits and sandy beaches along this coastal zone, where coarse deposits, rubble, and debris prevail, mostly fosters the shoreline retreat and inland inundation to a greater extent. The Sanctuary of Apollo, temples, public spaces (agora), porticos, and other important public buildings, commercial shops, workshops, houses, etc.—generally speaking, the entire city and the port—were extensively developed along the low-lying coastal valley from the 2nd century BC. Their ruins are located on the main route visited by the thousands of tourists who flock to this sacred island every year.
The island, due to its metamorphic geological structure, lacks natural water sources. In the fragmented granitic bedrock, a shallow groundwater horizon has formed, feeding the wells that have been there since antiquity for the provision of fresh water. To collect rainwater, a dam with a reservoir was constructed uphill on Mount Cynthus across the Inopos River. Irrigation channels would direct the water flow to the low-lying valley where the city and the harbour were located. Rainwater gathering at lower elevations created the famous Sacred Lake, also favouring the growth of aquatic plants [6,8]. As a result of the rsl rise, the ground water horizon is elevated, thus shaping extended wetlands, now permanently or temporarily inundated by the brackish water, over an area estimated at approx. 1.8 ha (18,000 m2) (Figure 2). The ongoing rsl rise poses a threat to the coastal lowland, inducing extended inundation inland and creation of larger wetlands in the coming decades. To mitigate further inundation and flood damage to the archaeological site, a protection dyke was constructed by the competent Hellenic Ministry of Culture, mainly along the coast of the Sacred (Main) Harbour (Figure 2), which also serves as a dirt road connecting the modern jetty with the path used to visit the archaeological site. Additionally, some low-lying areas, mainly in front of the portico of Philip V, have been filled with rubble.
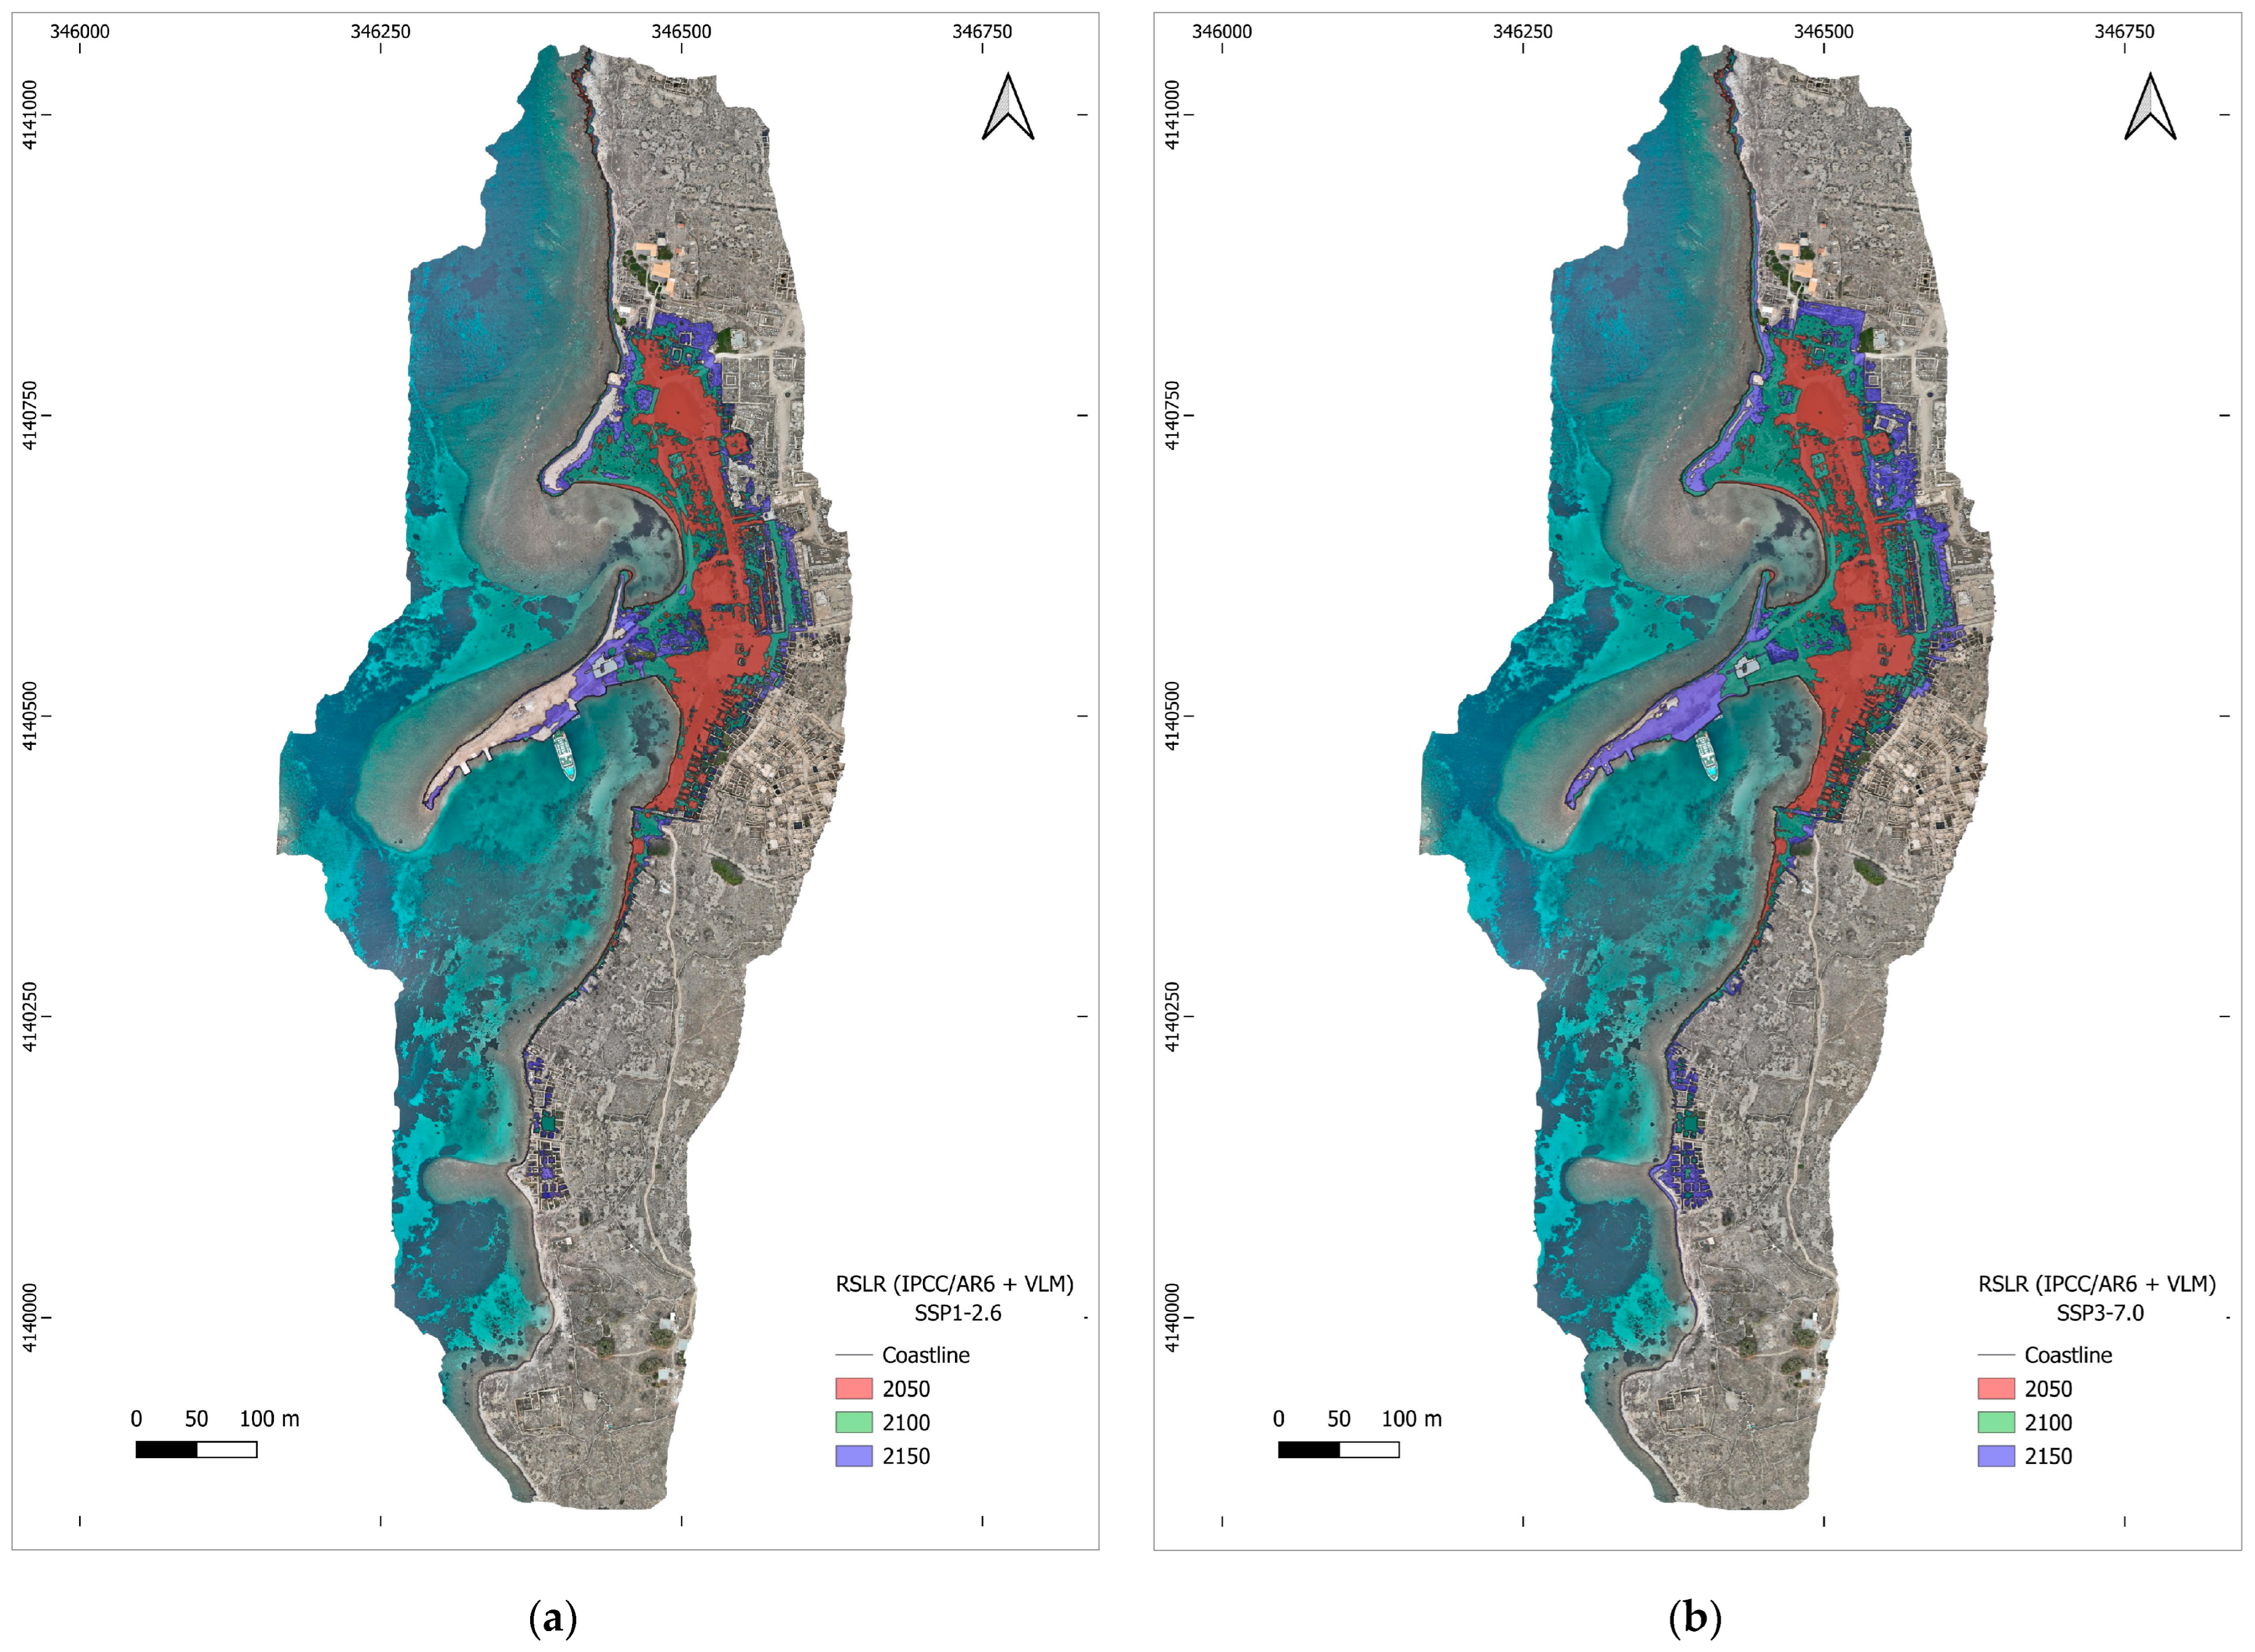
In summary, the seafront of the ancient city of Delos is subject to the effects of the rising sea level, which have caused significant coastline retreat, exposure to the northerly winds and waves, erosion, further submersion of the ancient coastal structures, and inland inundation, and is expected to be further affected by the rsl rise over the coming decades. The rsl projections are, sadly, premonitory, and large areas will be at potential risk of flooding, while the modern harbour infrastructure will become non-functional. For a better understanding of the future impacts, the potential flooding areas for IPCC AR6 scenarios SSP1-2.6, SSP3-7.0, and SSP5-8.5 corrected for the VLM rate for the years 2050, 2100, and 2150 are illustrated on the orthomosaics produced and on cross-sections drawn at selected positions (Figure 6a,b, Figure 7a and Figure 8).
Indicatively, with the favourable SSP1-2.6 climatic scenario corrected for VLM, the predicted rsl rise is 0.24 m by 2050, 0.57 m by 2100, and 0.87 m by 2150 (with respect to 2020). A total area of 1.17 ha by 2050, 3.13 ha by 2100, and 4.15 ha by 2150 will have been inundated due to the rsl rise. The coastline will retreat by 190 m inland until 2150. Accordingly, the SSP3-7.0 climatic scenario provides an rsl rise of 0.26 m by 2050, 0.78 m by 2100, and 1.33 m by 2150, while the areas at risk of flooding are estimated at 1.77 ha by 2050, 3.84 ha by 2100, and 5.21 ha by 2150. The coastline will shift 210 m inland by 2150. Finally, the most unfavourable, and certainly undesired, climatic scenario SSP5-8.5 gives an rsl rise of 0.28 m by 2050, 0.87 m by 2100, and 1.48 m by 2150, while the areas at risk of flooding are estimated at 1.85 ha by 2050, 4.15 ha by 2100, and 5.45 by 2150. The coastline will shift 220 m inland by 2150 (Figure 6a,b and Figure 7a). In all cases, at least 50% of the potentially flooded areas are spread across the low-lying plain where the ruins of the ancient city are located.
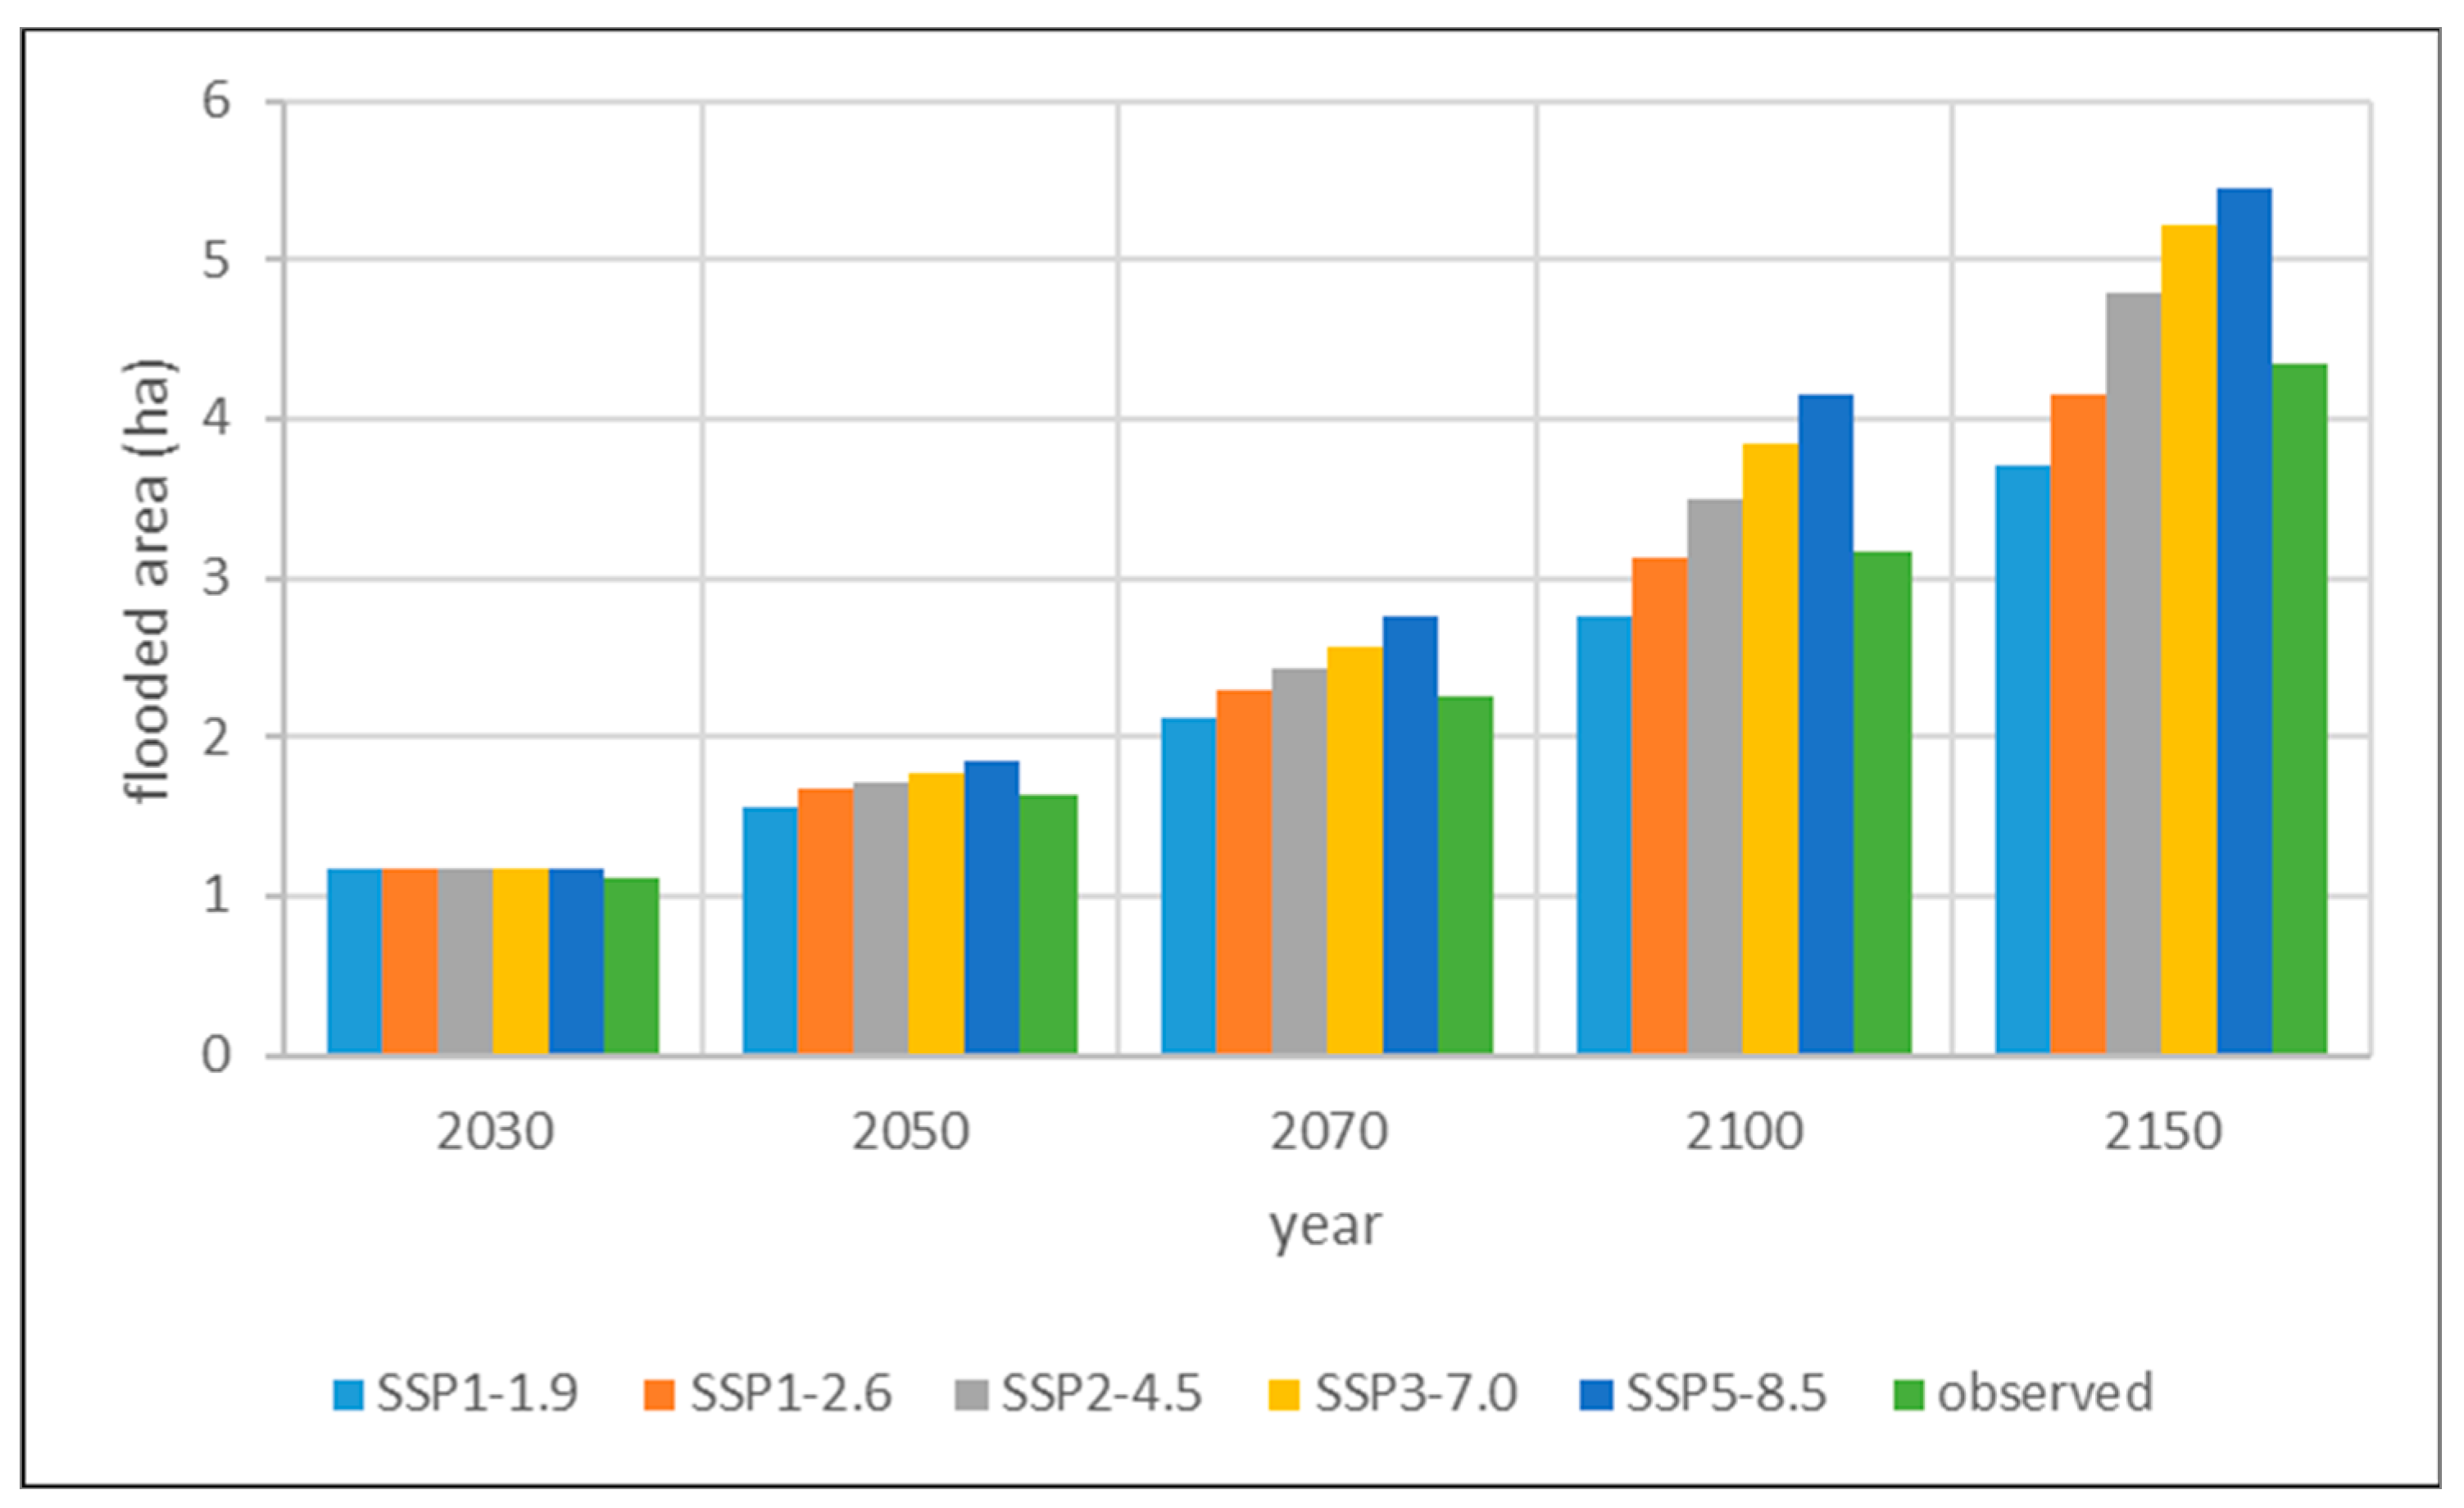
What is of particular importance for validating the rsl projections and climatic scenarios are the results yielded by applying the actual rate of rsl rise that occurred in the last century, which represents the sum of the glacio-hydro-isostatic, eustatic, and tectonic components (Figure 3, Table A1) and is based on field observations and interpretation of all available geomorphological and archaeological sea level indicators [13]. The projected rsl rise is 0.23 m by 2050, 0.58 m by 2100, and 0.93 m by 2150, while the areas that will be at risk of flooding are estimated at 1.64 ha by 2050, 3.17 ha by 2100, and 4.34 ha by 2150 (Figure 7b). Comparison with the corresponding values deduced from the SSP scenarios corrected for VLM indicates that, even if none of these scenarios were to happen, the sea level would rise and its effects would impact on almost as many areas as in the moderate SSP2-4.5 scenario (Figure 9).
Regarding the modern jetty, which is the main harbour infrastructure of Delos with a maximum elevation of 1.35 m, it seems that by 2100 it will be non-functional under the scenarios SSP2-4.5, SSP3-7.0, and SSP5-8.5, albeit less affected under the more favourable scenarios.
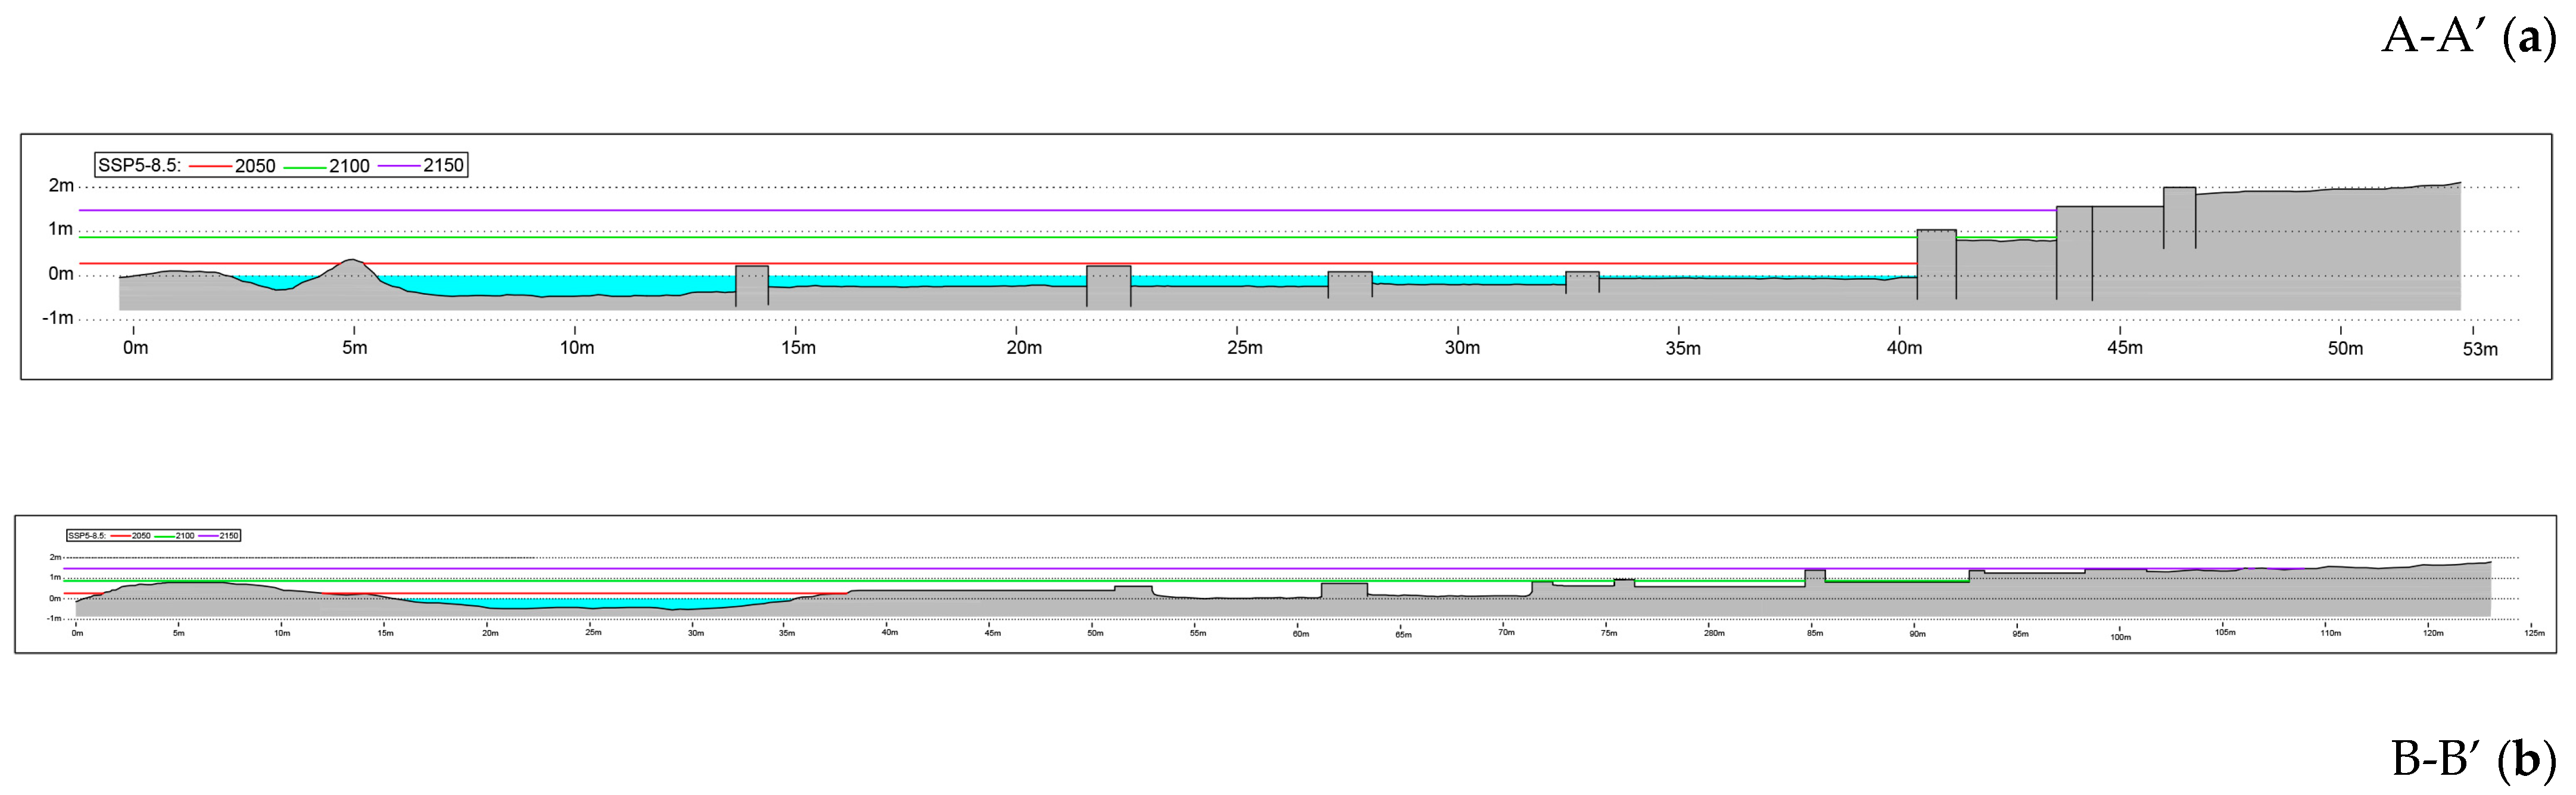
The two cross-sections (Figure 8), A-A’ (from the shoreline ENE toward the Sanctuary of Apollo) and B-B’ (from the shoreline toward the commercial district SSW landward) clearly show that, in the worst-case climatic scenario, SSP5-8.5, corrected for VLM and without taking any protection/adaptation measures, both areas will be seriously flooded due to rsl rise even earlier than the end of the 21st century, with the archaeological remains being harshly affected.
Analysis of all the data shows, beyond doubt, that the planning and implementation of protection measures for the seafront of the ancient city of Delos and adaptation solutions to the effects of the future rsl rise are now imperative. Furthermore, we should cogitate the consequences of storm surge events, which, although not considered in this study, could temporarily increase the reported values of rsl rise and the areas of potential flooding. Moreover, the impacts of storms and tsunamis will be intensified in sea level rise conditions, causing permanent and temporary flooding that will dramatically affect the coastal area. Additionally, increasing wave energy and wave run-up onto the western coast of Delos due to extreme storm surge events will accelerate coastal erosion and retreat [14].
Coastal areas worldwide and regionally are, undeniably, vulnerable to risk of flooding due to rising sea levels accelerated by global warming, with serious potential effects on society and the environment. Recent surveys carried out on a national scale in Greece pointed out that the awareness of Greek citizens is very low in terms of the rsl rise and consequently its potential threat is not recognised [30,31]. The results reveal a gap in the dissemination of information and knowledge among citizens, state and scientists, mainly due to the lack of centrally organised and locally implemented large-scale information and awareness-raising campaigns. It is important for scientists and journalists to be properly trained in the comprehensive communication of the complex aspects of the climate crisis. Scientific results concerning the potential risks of rsl rise should be seriously considered by stakeholders and policy-makers in planning future infrastructure and imposing protection measures, resilience strategies, and adaptation solutions, along with mitigation state-policies. Digitised data and visualisation tools (apps, maps, videos, etc.), exclusively based on reliable research data will surely enhance our ability to comprehend straightforwardly why and how the climate is changing, why rising sea levels are a potential risk, why actions for a sustainable planet can no longer be delayed, and why local and collective decisions and interventions on natural resources and extreme phenomena are more necessary than ever in our era [32].

5. Conclusions

Knowledge of the rsl history of a specific area is essential for a deeper understanding of, on the one hand, the regional geological and seismotectonic setting and the extreme climatic events, and, on the other hand, the interaction between humans and their coastal environment. It also contributes to the identification, interpretation and protection of the underwater traces of human existence, ensuring the preservation of cultural heritage and ecotouristic promotion of the natural seascape. Moreover, it is crucial in predicting the regional sea level rise and verifying climate modelling and flooding scenarios.
In this study, special emphasis is given to the methodology and the use of new scientific tools and techniques, which, in combination with climatic models and sea level studies, can amplify our perception of the extent of the past and future marine transgression and coastline retreat induced by the former and ongoing rsl rise all along the seafront of the ancient city of Delos. This approach is crucial for the monitoring and future management of the flooding risk of one of the most prominent monumental sites of our cultural heritage, one which has been seriously affected and will be further impacted by rising sea levels. Beyond methodological and scientific aspects, the results of this study will be decisive in the design of early response systems to coastal retreat, future coastal and harbour infrastructure, and civil protection and adaptation measures, mitigating the catastrophic effects of floods and preserving both our cultural heritage and ecosystems.

Author Contributions

Conceptualisation, methodology, software, validation, investigation, writing—original draft preparation, N.M. and E.K.; resources, formal analysis, data curation, writing—review and editing, E.K.; visualisation, supervision, N.M.; project administration, funding acquisition, E.K. All authors have read and agreed to the published version of the manuscript.

Funding

The study of the future impacts of the relative sea level rise on the seafront of ancient Delos was part of a research project on the flooding scenarios by 2150 for Andros, Mykonos, and Delos Islands (Cyclades, Greece), which was implemented with a donation from the Athina I. Martinou Foundation, in the framework of “Points of Support”, a programme co-funded by 10 public benefit foundations.

Institutional Review Board Statement

Not applicable.

Informed Consent Statement

Informed consent was obtained from all subjects involved in this study.

Data Availability Statement

Geospatial data were collected and processed by the authors in collaboration with GEOSENSE IKE [https://www.geosense.gr/en/ (accessed on 15 May 2024)]. GNSS data were provided by Metrica SA [HxGN SmartNet, https://www.metrica.gr (accessed on 15 May 2024)] and processed by the INGV Geodetic Analysis Data Center. Tidal data for correction at the time of the geodetic surveys were acquired by the Hellenic Navy Hydrographic Service (HNHS) from the closest tide gauge station in the port of Syros. The monthly and annual mean sea level from the HNHS Syros tide gauge station is available at: https://psmsl.org/data/ (accessed on 15 December 2023). The sea level projections of the IPCC-AR6 are available at: https://zenodo.org/record/6382554 (accessed on 15 December 2023).

Acknowledgments

We would like to thank GeoSense IKE, for their technical support in the aerial UAV survey and processing and elaboration of DSM and orthomosaics, and in particular V. Polychronos, CTO, for his insightful comments throughout this part of the research; C. Tsaprouni for her assistance in drone photogrammetry; and S. Loupidis for his support in the processing of images. We are grateful to M. Anzidei, Senior Scientist, Istituto Nazionale di Geofisica e Vulcanologia (INGV), National Earthquake Center (Rome, Italy), for his invaluable assistance in processing the VLM data and sea level projections. We would like to thank Metrica SA for providing the geodetic data from their GNSS station on Mykonos Island. Thanks are due to the Ephorate of Antiquities of the Cyclades, and especially D. Athanasoulis, Director, and Th. Vakoulis, Head of Archaeologists in Delos, for the permission to conduct the geospatial survey in Delos. Two anonymous referees made contributions to an earlier draft of this paper. Finally, we would like to thank S. J. Taylor (TES) for editing the English text.

Conflicts of Interest

The authors declare no conflicts of interest. The funders had no role in the design of the study; in the collection, analyses, or interpretation of data; in the writing of the manuscript; or in the decision to publish the results.

Appendix A

Appendix A contains supplementary data, as follows:
(a) Figure A1, supplemental to Section 2.2: Geodetic data (VLM).
Figure A1. The VLM resulting from GNSS time series from METRICA station on Mykonos Island (see details in Table 1).
Jmse 12 00870 g0a1
(b) Table A1 and Figure A2, supplemental to Section 3.1: Rsl rise projections and flooding scenarios up to 2150.
Table A1. Relative sea level rise projections (IPCC AR6 and VLM, observation) and areas at risk of flooding on the seafront of the ancient city of Delos for the period from 2030 to 2150 (as explained in Section 2.3 and Section 3.1).
YearRelative Sea Level Rise
(IPCC AR6 + VLM)
Potential Flooding Areas
Climatic
Scenario
RSLR
(mm)
σ RSLR
(mm)
(m2)(ha)
2030SSP1-1.911012711,7481.17
205021012915,5261.55
207034013121,2522.13
210048013427,5712.76
215074013837,0213.70
2030SSP1-2.611013211,7481.17
205024013416,7911.68
207038013623,0452.30
210057013931,3133.13
215087014341,5264.15
2030SSP2-4.511012111,7481.17
205025012317,2371.72
207041012524,4082.44
210068012834,8783.49
2150111013247,9584.80
2030SSP3-7.011016411,7481.17
205026016617,6801.77
207044016825,7272.57
210078017138,4223.84
2150133017552,1385.21
2030SSP5-8.511018011,7481.17
205028018218,5061.85
207048018427,5292.75
210087018741,5264.15
2150148019154,5225.45
2030observation9010011,0931.11
205023016,3601.64
207037022,5732.26
210058031,6693.17
215093043,4164.34
Figure A2. Monthly mean sea level for the period 1969 to 2023 from the tide gauge station operated by the Hellenic Navy Hydrographic Service (HNHS) in the port of Syros [central Cyclades, Aegean Sea available at: https://psmsl.org/data/ (accessed on 15 December 2023)].
Jmse 12 00870 g0a2
(c) Figure A3, supplemental to Section 4: Discussion.
Figure A3. Palaeogeographic reconstruction of the seafront of the ancient city of Delos during (A) the Classical and Early Hellenistic periods with the sea level at −3.70 ± 0.20 m bmsl; (B) the Late Hellenistic period with the sea level at −2.40 ± 0.25 m bmsl.
Jmse 12 00870 g0a3

References

  1. SAVEMEDCOASTS. Sea Level Rise Scenario along the Mediterranean Coasts, Layman’s Report (Agreement Number: ECHO/SUB/2016/742473/ PREV16). Available online: https://www.savemedcoasts.eu/ (accessed on 28 February 2024).
  2. Vecchio, A.; Anzidei, M.; Serpelloni, E. Sea level rise projections up to 2150 in the northern Mediterranean coasts. Environ. Res. Lett. 2024, 19, 014050. [Google Scholar] [CrossRef]
  3. Kolaiti, E.; Anzidei, M.; Scicchitano, G.; Vecchio, A.; Mourtzas, N. Flooding scenarios for 2050 and 2100 for Paroikia Bay, Paros island (Cyclades): A preliminary report. In Paros V: Paros through the Ages from Prehistoric Times to the 16th Century AD; Katsonopoulou, D., Ed.; The Institute for Archaeology of Paros and the Cyclades: Athens, Greece, 2021; pp. 611–619. [Google Scholar]
  4. UNESCO Word Heritage Convention. Delos. Available online: https://whc.unesco.org/en/list/530/ (accessed on 14 April 2024).
  5. Pe-Piper, G.; Piper, W.J.D.; Matarangas, D. Regional implications of geochemistry and style of emplacement of Miocene I-type diorite and granite, Delos, Cyclades, Greece. Lithos 2002, 60, 47–66. [Google Scholar] [CrossRef]
  6. Moretti, J.-C. Delos, Cyclades, 2022. Available online: https://www.archaiologia.gr/blog/archaeological_site/%ce%b4%ce%ae%ce%bb%ce%bf%cf%82/ (accessed on 5 March 2024).
  7. Altherr, R.; Kreuzer, H.; Wendt, I.; Lenz, H.; Wagner, G.A.; Keller, J.; Harre, W.; Hohndorf, A. A late Oligocene/early Miocene high temperature belt in the Attic-Cycladic crystalline Complex (S.E. Pelagonian, Greece). Geol. Jahrb. Reihe E Geophys. 1982, 23, 97–164. [Google Scholar]
  8. Hadjidakis, P.J. Delos; Eurobank/Latsis Group/Editions OLKOS: Athens, Greece, 2003; pp. 32–41+95–96. [Google Scholar]
  9. Efa. Délos—Histoire de Délos. Available online: https://www.efa.gr/ (accessed on 14 February 2024).
  10. Négris, P. Vestiges antiques submergés. Mitteilungen Archäologischen Inst. Athenische Abt. 1904, 29, 340–363. [Google Scholar]
  11. Dalongeville, P.; Desruelles, S.; Fouache, É.; Hasenohr, C.; Pavlopoulos, K. Hausse relative du niveau marin à Délos (Cyclades, Grèce): Rythme et effets sur les paysages littoraux de la ville hellénistique. Méditerranée 2007, 108, 17–28. [Google Scholar] [CrossRef]
  12. Mourtzas, N.D. A palaeogeographic reconstruction of the seafront of the ancient city of Delos in relation to Upper Holocene sea level changes in the central Cyclades. Quatern. Int. 2012, 250, 3–18. [Google Scholar] [CrossRef]
  13. Kolaiti, E.; Mourtzas, N. Late Holocene relative sea-level changes and coastal landscape readings in the island group of Mykonos, Delos, and Rheneia (Cyclades, Greece). Med. Geosc. Rev. 2023, 5, 99–128. [Google Scholar] [CrossRef]
  14. Anzidei, M.; Trippanera, D.; Bosman, A.; Martin, F.F.; Doumaz, F.; Vecchio, A.; Serpelloni, E.; Alberti, T.; Rende, S.F.; Greco, M. Relative Sea-Level Rise Projections and Flooding Scenarios for 2150 CE for the Island of Ustica (Southern Tyrrhenian Sea, Italy). J. Mar. Sci. Eng. 2023, 11, 2013. [Google Scholar] [CrossRef]
  15. Briole, P.; Ganas, A.; Elias, P.; Dimitrov, D. The GPS velocity field of the Aegean. New observations, contribution of the earthquakes, crustal blocks model. Geophys. J. Int. 2021, 226, 468–492. [Google Scholar] [CrossRef]
  16. Fox-Kemper, B.; Hewitt, H.T.; Xiao, C.; Aðalgeirsdóttir, G.; Drijfhout, S.S.; Edwards, T.L.; Golledge, N.R.; Hemer, M.; Kopp, R.E.; Krinner, G.; et al. Intergovernmental Panel on Climate Change (IPCC). Ocean, Cryosphere and Sea Level Change. In Climate Change 2021: The Physical Science Basis. Contribution of Working Group I to the Sixth Assessment Report of the Intergovernmental Panel on Climate Change; Masson-Delmotte, V., Zhai, P., Pirani, A., Connors, C., Péan, S., Berger, N., Caud, Y., Chen, L., Goldfarb, M.I., Gomis, M., et al., Eds.; Cambridge University Press: Cambridge, UK; New York, NY, USA, 2021; pp. 1211–1362. [Google Scholar] [CrossRef]
  17. Kopp, R.E.; Garner, G.G.; Hermans, T.H.J.; Jha, S.; Kumar, P.; Reedy, A.; Slangen, A.B.A.; Turilli, M.; Edwards, T.L.; Gregory, J.M.; et al. The Framework for Assessing Changes to Sea-Level (FACTS) v1.0: A platform for characterizing parametric and structural uncertainty in future global, relative, and extreme sea-level change. Geosci. Model Dev. 2023, 16, 7461–7489. [Google Scholar] [CrossRef]
  18. Garner, G.G.; Hermans, T.; Kopp, R.E.; Slangen, A.B.A.; Edwards, T.L.; Levermann, A.; Nowicki, S.; Palmer, M.D.; Smith, C.; Fox-Kemper, B.; et al. IPCC AR6 Sea Level Projections (Version 20210809). 2021. Available online: https://zenodo.org/records/6382554 (accessed on 15 January 2024).
  19. NASA/IPCC. Sea Level Projections Tool. Available online: https://sealevel.nasa.gov/ipcc-ar6-sea-level-projection-tool (accessed on 15 January 2024).
  20. Kopp, R.; Oppenheimer, M.; O’Reilly, J.L.; Drijfhout, S.S.; Edwards, T.L.; Fox-Kemper, B.; Garner, G.G.; Golledge, N.R.; Hermans, T.H.J.; Hewitt, H.T.; et al. Communicating projection uncertainty and ambiguity in sea-level assessment. Nat. Clim. Chang. 2023, 13, 648–660. [Google Scholar] [CrossRef]
  21. Bohnhoff, M.; Rische, M.; Meier, T.; Becker, D.; Stavrakakis, G.; Harjes, H.-P. Microseismic activity in the Hellenic Volcanic Arc, Greece, with emphasis on the seismotectonic setting in the Santorini-Amorgos zone. Tectonophysics 2006, 423, 17–33. [Google Scholar] [CrossRef]
  22. Engdahl, E.; Van der Hilst, R.; Buland, R. Global teleseismic earthquake relocation with improved travel times and procedures for depth determination. Bull. Seismol. Soc. Am. 1998, 88, 722–743. [Google Scholar] [CrossRef]
  23. Kolaiti, E.; Mourtzas, N. New insights on the relative sea level changes during the Late Holocene along the coast of Paros Island and the northern Cyclades (Greece). Ann. Geophys. 2020, 63, OC669. [Google Scholar] [CrossRef]
  24. Bernier, P.; Dalongeville, R. Incidence de l’activité biologique sur la cimentation des sédiments littoraux actuels. L’exemple des îles de Délos et de Rhénée (Cyclades, Greece). C. R. Acad. Sci. 1988, 307, 1901–1907. [Google Scholar]
  25. Dûchene, H.; Fraisse, P. Le paysage portuaire de la Délos Antique: Recherches sur les installations maritimes, commerciales et urbaines du littoral délien; Exploration Archéologique de Délos, fasc. 39; Ecole Française d’Athènes: Athens, Greece, 2001; 192p. [Google Scholar]
  26. Zarmakoupi, M. Hellenistic & Roman Delos: The city & its emporion. Archaeol. Rep. 2015, 61, 115–132. [Google Scholar] [CrossRef]
  27. Senduran, C.; Kabdasli, M.S. Aegean Sea-Level Variability in the Past Half-Century Based on Tide Gauge Data. Int. J. Environ. Geo. IJEGEO 2022, 9, 162–169. [Google Scholar] [CrossRef]
  28. Moretti, J.-C. Archaeological site: Delos. Archaeol. Arts 2021, 135, 114–144. Available online: https://www.archaiologia.gr/ (accessed on 19 March 2024).
  29. Desruelles, S.; Chabrol, A.; Hasenohr, C.; Pavlopoulos, K.; Apostolopoulos, G.; Kapsimalis, V.; Triantaphyllou, M.; Koukousioura, O.; Mathe, V.; Chapoulie, R.; et al. Palaeogeographic reconstruction of the Main Harbour of the ancient city of Delos (Greece). J. Archaeol. Sci. 2023, 160, 105857. [Google Scholar] [CrossRef]
  30. Eurobarometer. Climate Change. Available online: https://europa.eu/eurobarometer/surveys/detail/2954 (accessed on 10 April 2024).
  31. Dianeosis.org. National Survey on the Climate Change. Available online: https://www.dianeosis.org/wp-content/uploads/2022/06/climatechange_survey.pdf (accessed on 20 December 2023).
  32. Green European Journal. Facing Greece’s Climate Reality. Available online: https://www.greeneuropeanjournal.eu/ (accessed on 20 April 2024).
Figure 1. Location maps of (a) the northern Cyclades (red square) in the Aegean Sea, Greece; (b) Delos Island (red square) in the northern Cyclades; and (c) Delos Island. Names of localities and areas of archaeological interest are shown. The red rectangle indicates the survey area. (d) Simplified geological map of Delos (modified from [5]).
Jmse 12 00870 g001
Figure 2. The seafront of ancient Delos as it is now stands (DSM and orthomosaic image produced for this research). The contemporary coastline is indicated by the blue line. Areas with ancient remains now submerged are shown in yellow. The cyan hatch mark indicates the low-lying wetlands within the ancient city.
Jmse 12 00870 g002
Figure 3. The rsl change curve for the island group of Mykonos, Delos, and Rheneia (after [13]).
Jmse 12 00870 g003
Figure 4. Detailed plan of the seafront of the ancient city of Delos and ancient sea defences.
Jmse 12 00870 g004
Figure 5. Sea level rise projections for Delos Island up to 2150: (a) according to the five future regional SSP climatic scenarios provided by IPCC AR6; (b) combination of SSP regional scenarios (IPCC AR6) with the local VLM rate estimated in this study. Coloured lines correspond to sea level projections for each SSP climatic scenario, while coloured areas represent a 90% confidence interval.
Jmse 12 00870 g005
Figure 6. Orthomosaics of the seafront of the ancient city of Delos illustrating the areas of potential flooding by 2150 deduced from the regional sea level rise projections deduced from three IPCC AR6 SSP climatic scenarios corrected for the VLM rate (Table A1, Figure 5): (a) SSP1-2.6 climatic scenario; (b) SSP3-7.0 climatic scenario.
Jmse 12 00870 g006
Figure 7. Orthomosaics of the seafront of the ancient city of Delos illustrating the areas at risk of potential flooding by 2150: (a) as deduced from the regional sea level rise projections provided by IPCC AR6 SSP5-8.5 climatic scenario corrected for the VLM rate (Table A1, Figure 5); (b) by applying the observed rate of rsl rise (Table A1, Figure 3).
Jmse 12 00870 g007
Figure 8. Cross-sections illustrating the projected rsl rise for the IPCC AR6 SSP5-8.5 climatic scenarios by 2150 corrected for VLM rate by 2050 (red line), 2100 (green line), and 2150 (purple line): (a) cross-section A-A’; (b) cross-section B-B’. The position of the cross-sections is shown in Figure 7b.
Jmse 12 00870 g008
Figure 9. Comparison between the areas of potential flooding by 2150 on the seafront of ancient Delos, deduced from the regional rsl rise projections of the IPCC AR6 SSP scenarios corrected for VLM and those (green bars) inferred by the observed rate of rsl rise.
Jmse 12 00870 g009
Table 1. Rates and uncertainties of vertical land motion (VLM) for Delos and Mykonos Islands and details of the GNSS Station on Mykonos Island.
GNSS Station
(Code-Owner)
Coordinates
(Long, Lat.)
Time SeriesVLM
IntervalVu
(mm yr−1)
σ
(mm yr−1)
Comment
MYKN-Metrica25.3291, 37.441615 May 2018 to 29 January 2024−1.7360.752(a)
24 May 2016 to 23 February 2020−1.8001.100(b)
(a) as computed by the INGV Geodetic Analysis Data Centre for the purposes of this study. (b) as reported by [15] (Table S1).
Disclaimer/Publisher’s Note: The statements, opinions and data contained in all publications are solely those of the individual author(s) and contributor(s) and not of MDPI and/or the editor(s). MDPI and/or the editor(s) disclaim responsibility for any injury to people or property resulting from any ideas, methods, instructions or products referred to in the content.

