Article

Semicircular Coastal Defence Structures: Impact of Gap Spacing on Shoreline Dynamics during Storm Events

by
Bárbara F. V. Vieira
1,
José L. S. Pinho
1,* and
Joaquim A. O. Barros
2
1
Department of Civil Engineering, School of Engineering, University of Minho, Campus of Gualtar, 4710-057 Braga, Portugal
2
Department of Civil Engineering, School of Engineering, University of Minho, Campus of Azurém, 4800-058 Guimarães, Portugal
*
Author to whom correspondence should be addressed.
J. Mar. Sci. Eng. 2024, 12(6), 850; https://doi.org/10.3390/jmse12060850
Submission received: 19 April 2024 / Revised: 14 May 2024 / Accepted: 18 May 2024 / Published: 21 May 2024

Abstract

:
Coastal erosion poses significant challenges to shoreline management, exacerbated by rising sea levels and changing climate patterns. This study investigates the influence of gap spacing between semicircular coastal defence structures on shoreline dynamics during storm events. The innovative design of these structures aims to induce a drift reversal of prevalent sediment transport while avoiding interruption of alongshore sediment drift, thus protecting the beach. Three different gap spacings, ranging from 152 m to 304 m, were analysed using the XBeach numerical model, focusing on storm morphodynamic behaviour. Methodologically, hydrodynamic and morphodynamic analyses were conducted to understand variations in significant wave heights adjacent to the structures, in accretion and erosion volumes, and changes in bed level under storm conditions. The study aims to elucidate the complex interaction between engineered coastal protection solutions and natural coastal processes, providing practical insights for coastal management practices. Results indicate that installing semicircular coastal defence structures influences sediment dynamics during storm events, effectively protecting stretches of the coast at risk. Optimal gap spacing between structures is crucial to mitigating coastal erosion and enhancing sediment accumulation, offering a sustainable shoreline protection approach. The findings underscore the importance of balanced location selection to optimize protection benefits while minimizing adverse morphological effects. Overall, this research contributes to advancing knowledge of hydro-morphological phenomena essential for effective coastal engineering and informs the design and implementation of more sustainable coastal protection strategies in the face of increasing coastal erosion and sea level rise challenges.

1. Introduction

Coastal erosion poses a paramount challenge for coastal communities globally. Besides being valuable natural resources and recreational areas, beaches play a crucial role in protecting against extreme events, maintaining biodiversity, and supporting various economic activities such as tourism and fishing. However, coastal erosion continually threatens these areas, resulting in significant land, infrastructure, and habitat losses [1,2].
While traditional structures like seawalls, groins, and breakwaters may protect specific stretches, they often exacerbate erosion by disrupting natural sediment transport processes, leading to negative impacts elsewhere [3,4]. Despite ongoing efforts to mitigate the effects of coastal erosion, these approaches often prove insufficient in the face of growing pressures from climate change, sea level rise, and human activities. On the other hand, these structures, especially groins, significantly influence longshore sediment transport dynamics, often leading to morphological changes along coastlines. A common consequence of interrupting natural sand transport is the accretion of beaches updrift and erosion downdrift, exacerbating shoreline recession and threatening coastal communities and ecosystems at those locations [5,6].
This downdrift erosion, a focal point of coastal degradation, poses challenges for effective erosion management strategies, highlighting the urgency to comprehend its processes and magnitudes.
Existing studies, including those by Pelnard-Considère (cited in [7]) and Bruun [7], have conceptualized the evolution of downdrift erosional shorelines, emphasizing their nonlinear expansion and characteristic “S” shape. However, predicting the spatial and temporal behaviours of downdrift erosion remains challenging.
When considering the complex interactions between waves, sediment transport, and coastal morphology, it becomes evident that a nuanced understanding of these processes is crucial for effective coastal management. For medium- to long-term studies, one-dimensional numerical models, commonly referred to as one-line models, offer a complementary perspective to empirical and detailed numerical approaches. These models provide valuable insights by simplifying the representation of coastal dynamics along either the alongshore or cross-shore direction. They focus on key processes such as wave propagation, sediment transport, and morphological changes within a computationally efficient framework [8,9,10,11].
Globally, current management strategies tend to compartmentalize sand beach usage, often failing to integrate tourism and conservation effectively, especially in high-energetic coastlines [1]. Conflicts of interest arise, particularly in regions where diverse activities coexist within limited coastal spaces. Historically, beach management has prioritized recreational aspects over ecological preservation. However, recent approaches signify a paradigm shift towards more comprehensive beach management frameworks [12]. In this regard, artificial sand bypass solutions have been employed globally, aiming to restore natural sediment transport patterns and mitigate the negative impacts of coastal structures [3,6].
Despite lacking specific policies in some regions, integrated coastal management is gaining affiliates as a viable approach to bridge the gap between recreational demands and ecological conservation. Previous studies have delineated management strategies into protection, regulation, and restoration categories, with an increasing emphasis on the latter, particularly through beach nourishment initiatives [13]. Climate change has exacerbated existing challenges, influencing shoreline dynamics through erosion, flooding, and long-term shifts in weather patterns [14,15,16,17]. As such, research endeavours to refine beach management strategies by incorporating a Threat Index (TI), which integrates erosion rates and shoreline recession due to sea level rise, alongside physical, environmental, and socio-economic factors [1].
Moreover, innovative solutions, such as artificial structures designed to induce longshore drift reversal, are being explored, mimicking natural sediment accumulation processes. These structures aim to mitigate erosion and enhance coastal stability while considering hydrodynamic and morphodynamic implications [4].
Achieving sustainable solutions for coastal management necessitates a proactive approach that anticipates local morphodynamics, especially in the vicinity of coastal defence structures, under storm conditions as a primary driver of beach morphodynamics.
This study comprehensively analyses coastal erosion issues during storm events around an innovative semicircular coastal defence structure using the XBeach model [18]. The effectiveness in reversing sediment drift is evaluated, which is a promising method to strategically accumulate sediments downdrift of these structures to stabilize beaches and reduce erosion. Furthermore, this study explores how the gap spacing between these structures affects coastal dynamics, particularly in relation to sediment accumulation and erosion rates along specific coastline sections. This analysis considers sedimentary factors and the complex interactions between waves and their breaking patterns. These are essential for understanding beach behaviour and proposing proper design rules for sustainable coastal engineering practices.
The sedimentation and erosion dynamics analysed for the gap spacing of semicircular structures shed light on critical factors that have significant implications for both scientific understanding and practical applications by elucidating the relationships between structure gap spacing and sedimentation/erosion rates in different sections of the beach.
The observed trends highlight the importance of considering spatial configurations of structures in coastal management initiatives. Specifically, the findings underscore the need for a nuanced approach that accounts for the varying responses of different coastal sections to alterations in structure gap spacing. Such insights are invaluable for optimizing the design and implementation of coastal restoration projects, ensuring their effectiveness in mitigating sedimentation and erosion while preserving ecological integrity.
Furthermore, this study underscores the dynamic nature of coastal systems and the importance of adaptive management strategies to prevent undesirable outcomes during storm events.
By investigating these aspects, this study seeks to advance scientific knowledge and develop more efficient and sustainable options for managing coastal erosion, with the ultimate goal of preserving vital ecosystems and protecting communities dependent on them. This study aims to inform future coastal management practices and sustainable shoreline management through proposing and analysing a new set of coastal defence structures with the aid of comprehensive simulation.

2. Materials and Methods

This study applied the XBeach model to analyse the influence of gap spacing between semicircular structures on significant wave height, Hs, wave direction, wave energy dissipation, sediment volume variation, and final bed configuration. This model allowed for a comprehensive analysis, considering general behaviour and specific sections, establishing relationships among the scenarios under study.

2.1. Validation of the Model

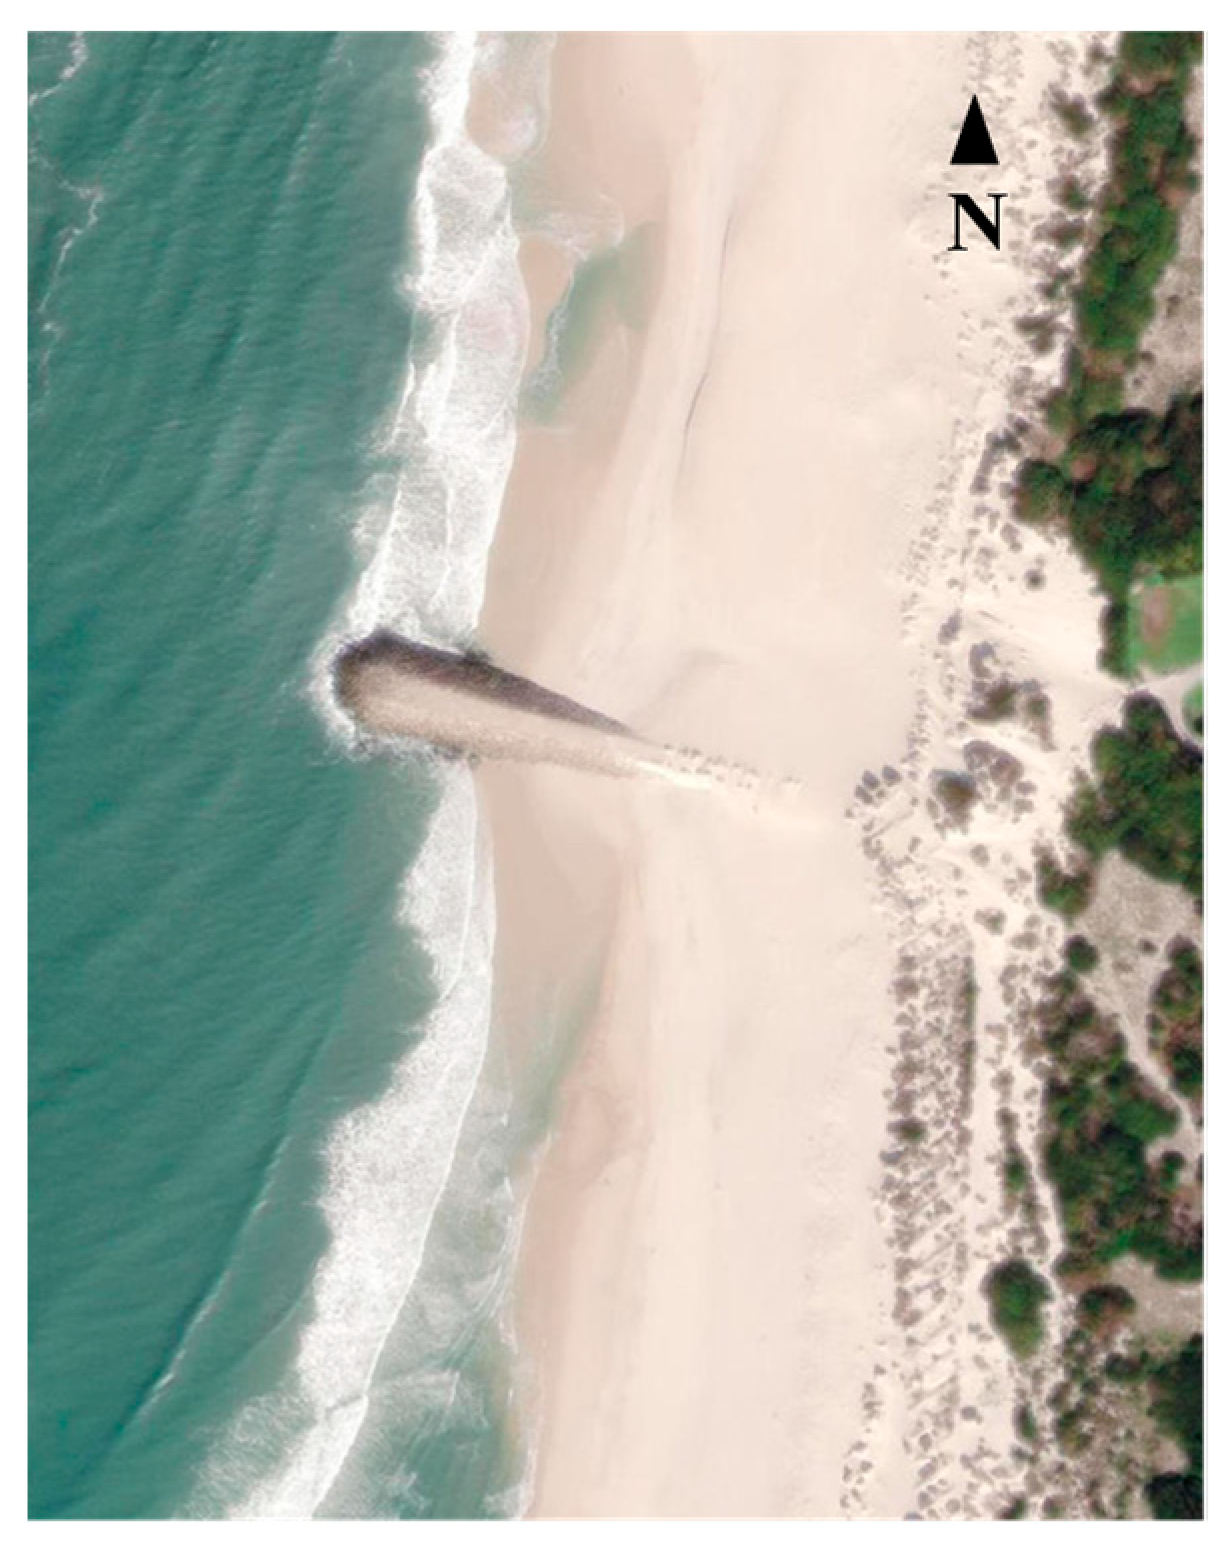
The validation of the model aimed to assess its qualitative performance, particularly as the proposed semicircular structure had only undergone numerical testing. As the primary objective was to assess the impact of the new shape within a generic bathymetric context, the validation of the groins employed this generic bathymetry, focusing specifically on sedimentation/erosion patterns. Measured morphodynamic data sources were incorporated into the validation process to ensure that the model accurately reflected real-world conditions. This included measured bathymetric data at a coastal stretch influenced by a coastal defence structure and consistent local wave patterns, allowing for a sound assessment of the coastal domain’s morphology and wave climate. Real-world data from a groin (Figure 1) located at Castelo de Trancoso beach in Gafanha da Encarnação, Aveiro, Portugal, was compared with a modelled groin with similar characteristics.
The bathymetric data, obtained through topo-hydrographic surveys provided by the COSMO Programme [19], supplied essential information instrumental in validating the model. Although the available data spanned one year for the Castelo de Trancoso beach groin, a continuous 48 h storm simulation was chosen due to the significant computational demands of more extended periods. The wave climate parameters (Hs, peak wave period, Tp, and dominant wave direction) were based on data from a previous study conducted by the authors that characterized local wave patterns along the western coast of the Iberian Peninsula. This approach ensured both consistency and reliability in the model’s representation of wave conditions [20]. The reliability and strength of sediment dynamics simulations in this study were bolstered by the thorough validation of the model in analogous coastal research works [21,22,23,24,25].
After calibrating the flow parameters, the validation process involved qualitatively comparing bathymetric variations over their respective time frames. Bathymetric changes for the real groin were assessed using ArcGIS [
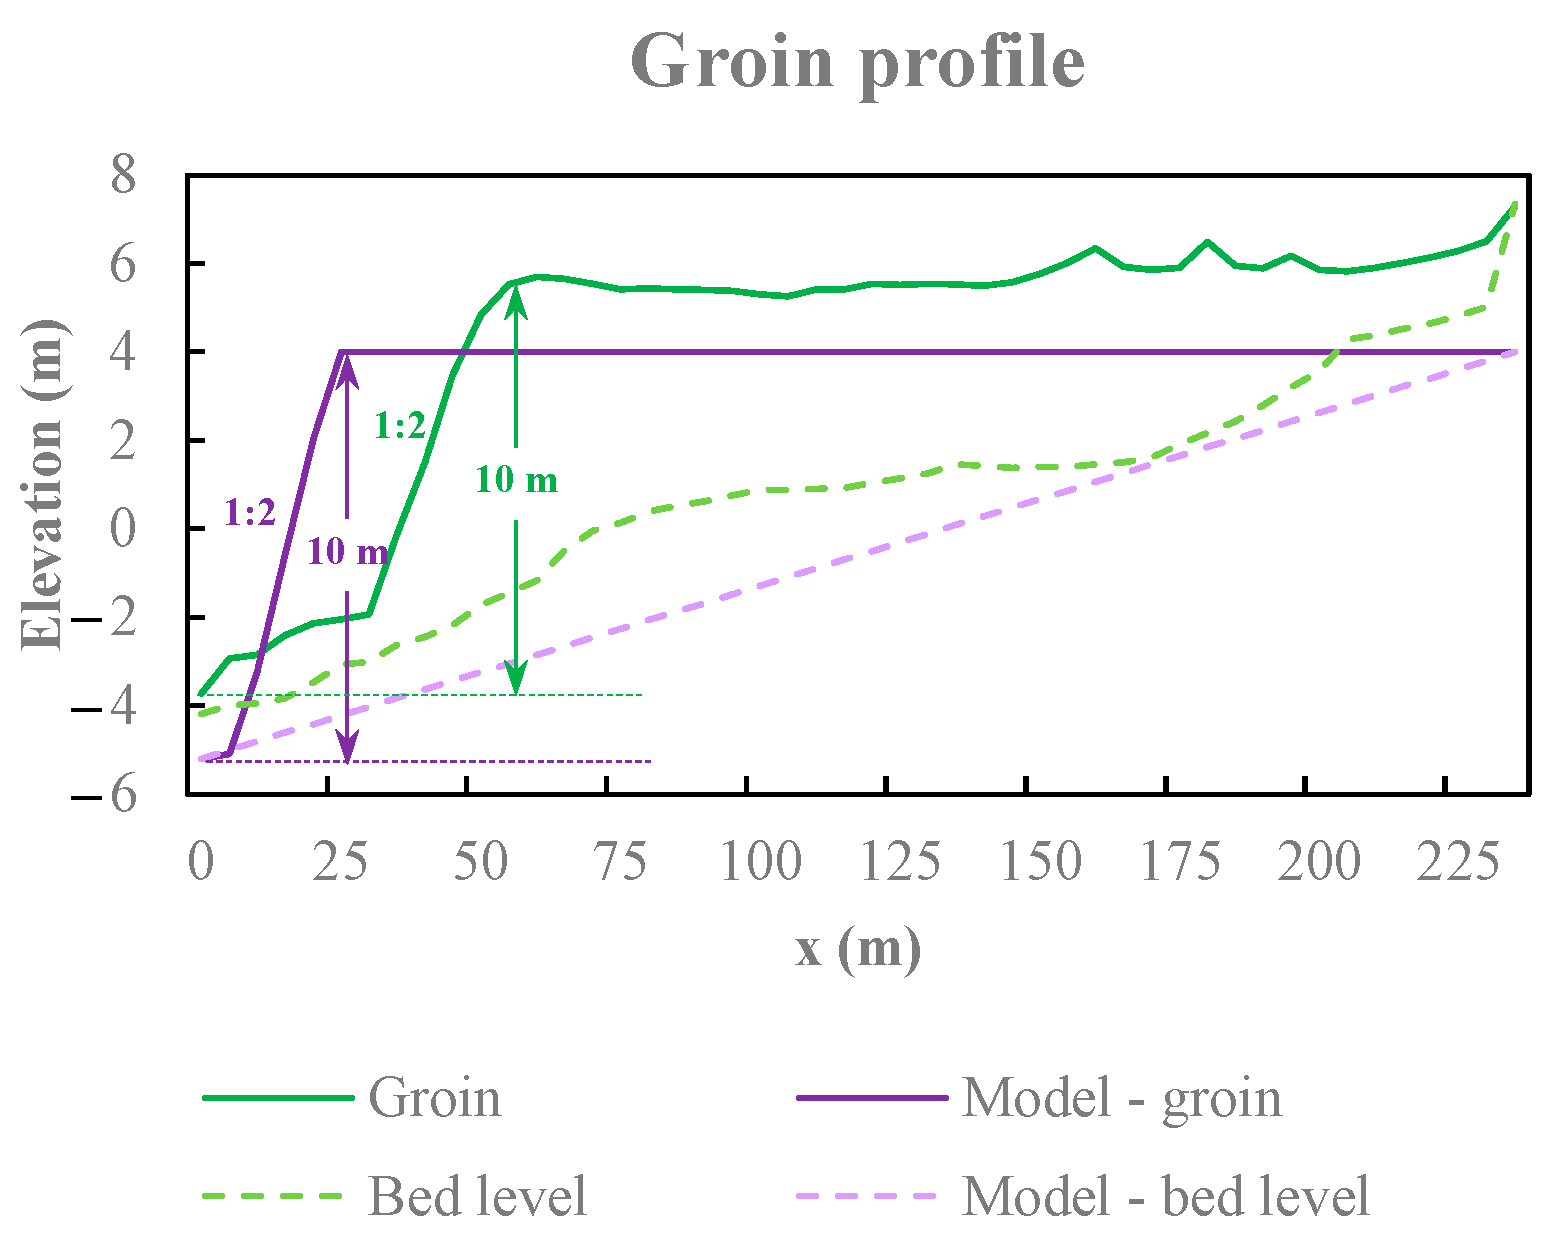
26] software, and then qualitatively compared with the simulation results. The bathymetric variations included the sedimentation and erosion trends surrounding a groin. The modelled groin presented height, length, slope, beach bathymetry, and topography similar to the real groin (Figure 2). Adopting consistent parameters in XBeach between the real groin and the innovative structure facilitated model validation.

2.2. Semicircular Innovative Coastal Defence Structure

The innovative structure geometry (Table 1) made out of armour units had previously been presented and tested [
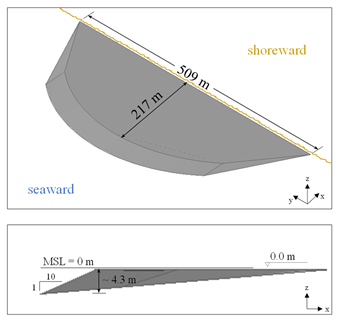
4], exploring how its shape and dimensions influence the reversal of littoral drift, facilitating greater sediment accumulation downdrift. This structure is connected to the shoreline and features a rounded ledge with a slope of 1:10 and a crest level of 0 m, which offers the potential for safeguarding urban areas along the coast by attenuating or inducing a reversal of the longitudinal drift that is responsible for erosion in many coastal stretches. The adopted length (509 m) and width (217 m) dimensions have been specifically chosen and adjusted to ensure the drift reversal effect. Additionally, this geometry aids in sediment accumulation near the shoreline, and the low crest level contributes to mitigating environmental visual impact concerns since the structure will only be visible along the low tide period. The 1:10 slope aids in reducing the abruptness of wave breaking compared to other slopes (wall and 1:2). While the sedimentary distribution of this structure is generally satisfactory, some scouring may occur at its extremities. However, stability can be ensured by placing the foundation deeper than a safer scour depth.
While this structure has some limitations, it offers notable improvements in sediment accumulation, particularly when compared to groins. Unlike groins, which hinder sediment transport from up- to downdrift, causing sediment buildup only at a considerable distance downdrift, the proposed structure facilitates sediment accumulation both up- and downdrift. This feature stands out as its primary advantage.
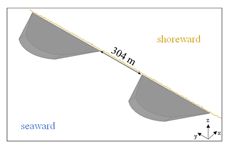
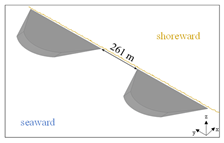
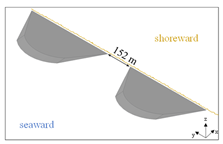
In this study, the varying gap spacings between a pair of these structures are analysed to assess their influence on sediment transport near the shoreline. Gap spacing between structures is determined according to DEFRA [27] guidelines, ensuring a consistent and reliable setup.
Although these guidelines are specifically recommended for the design of detached breakwaters, they can also provide a framework for sizing the current structures. These gaps are calculated based on the allowable maximum shoreline erosion, which can be derived from existing design curves [28]. Equation (1) represents the maximum permissible shoreline erosion.
maximum   shoreline   erosion = G / X
In this equation, G represents the gap spacing between the structures, and X is the distance from the beach to the centreline of the structure. Considering these structures’ large size and asymmetry along the Y-axis (unlike typical detached breakwaters), it has been determined that X should be measured from the beach to the edge of the structure. The value of X is calculated by adding the width of the structure to the distance from the structure to the shoreline (217 m in the present case).
Selecting appropriate gap spacing is crucial to prevent extensive erosion zones. Table 2 outlines the chosen values for each maximum shoreline erosion under conditions of certain erosion, no erosion, and possible erosion. The gap spacings for the selected scenarios are also presented. Additional information regarding the calculations supporting these estimations can be found in another source [4].

2.3. XBeach Model and Numerical Model Conditions

XBeach is an open-source numerical model with a process-driven morphodynamic numerical model, specialized for nearshore and coastal dynamics. Initially designed to replicate hydrodynamic and morphological processes during storm waves on sandy island systems, its application has been expanded to include the interaction between moderate wave conditions and coastal structures. Widely recognized for its effectiveness, XBeach has been successfully used in numerous studies across sandy coastlines [4,21,22,23,24,25].
The input conditions for the model (Table 3), comprising mean values of Hs, Tp, dominant wave direction and storm duration, were based on a previous study regarding local wave patterns that characterize the NW Portuguese coast [20]. The parameters associated with flow (roughness and viscosity), tide, wave spectrum, sediment density, and morphology updating (avalanching and bottom friction) were predetermined based on previous simulations conducted by the authors [4,21]. These parameters are further detailed in the manuals provided by the respective model developers [18]. A morphological acceleration factor (morfac) of 10 was selected to expedite calculations, allowing for assessing a prolonged storm lasting 24 h. A zero sediment layer thickness was specified at the structure’s location, indicating non-erodibility, corresponding to using artificial concrete armour blocks.
The coastal domain must possess dimensions that mimic real-world scenarios accurately. However, since the primary focus was to examine a generic coastal segment for implementing a coastal protection solution rather than analysing a specific location’s bathymetry, this study focused on a simplified bathymetry known as reference bathymetry (S0). The chosen dimensions for the domain (Table 3) prevented computational boundary instabilities that could have impacted the areas where the structures are located. The selected grid cell size was previously validated as suitable for similar numerical simulations [4,21]. The reference bathymetry domain featured a maximum offshore depth of −31.4 m and a maximum coastal elevation of +2.0 m, considering the reference vertical datum coincident with the mean sea level. This elevation of +2.0 m enabled a thorough examination of the beach’s hydro- and morphodynamic impacts, especially since the tidal level was fixed at 0 m for all the presented scenarios.
The sediment composition of the seabed (Table 3) was characterized by fine sand, with particle sizes (D50 = 0.2 mm and D90 = 0.3 mm) conforming to the Unified Soils Classification of Sediments [29]. Boundary conditions were set to ensure stability: the Neumann boundary maintained elevation and velocity, ensuring continuity without instabilities near the north and south boundaries. An absorbing condition was applied to the east boundary to minimize reflections, while the west boundary remained open to simulate wave entry into the domain.
Table 3 summarises the main numerical model conditions selected for this study.
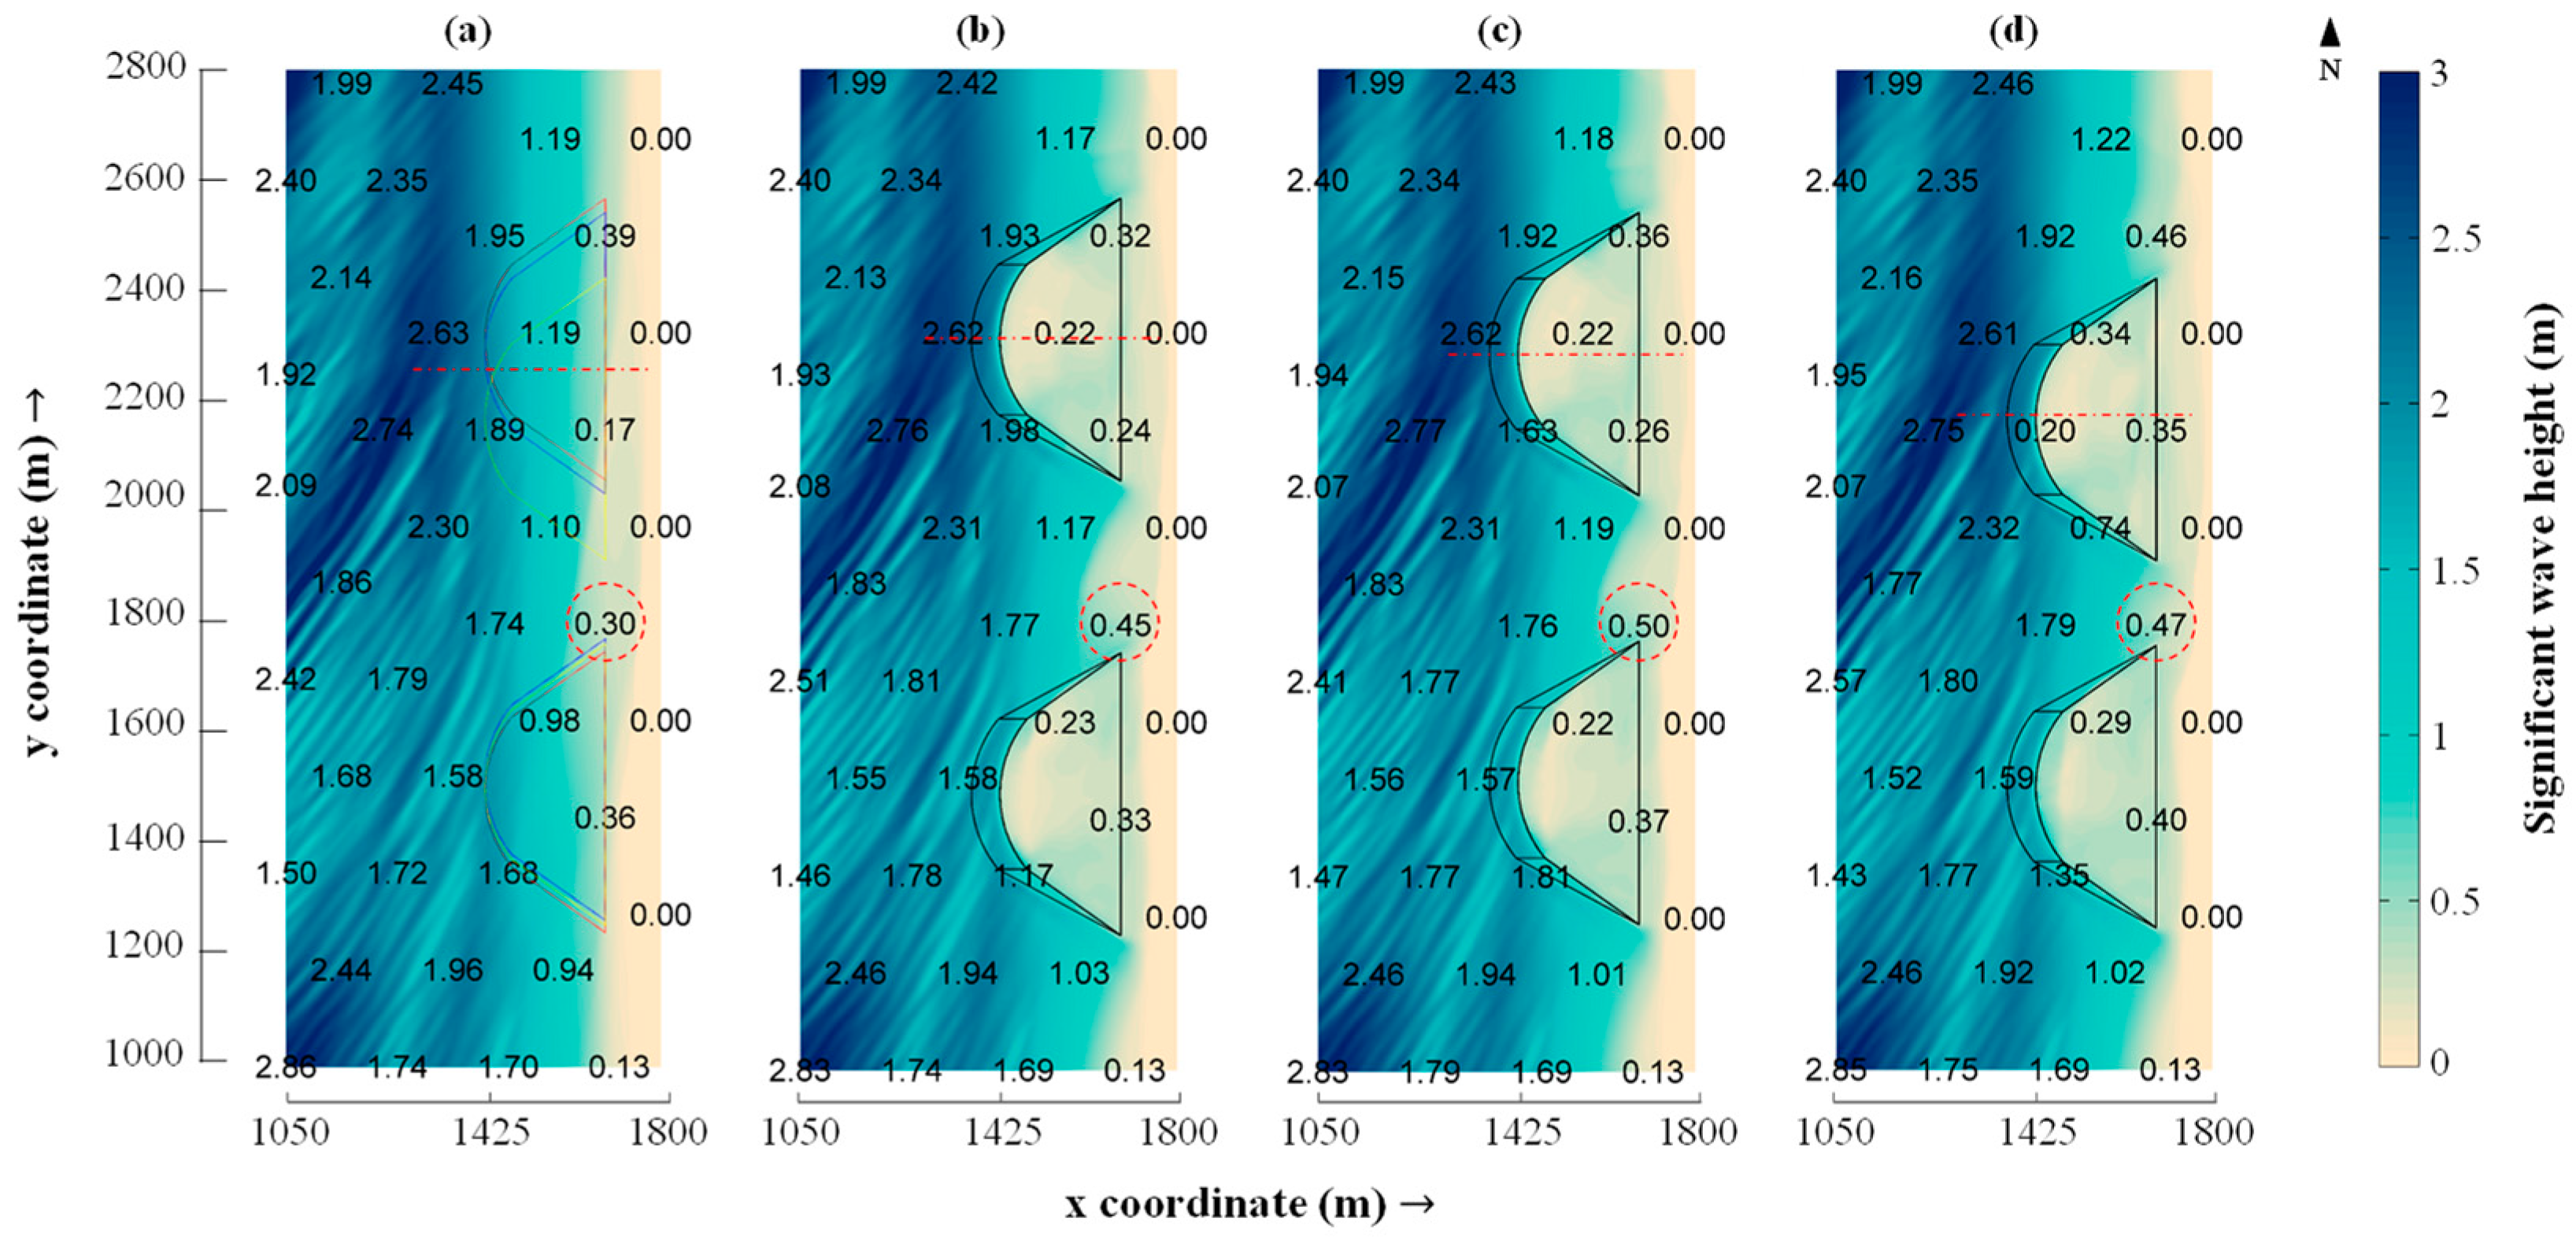
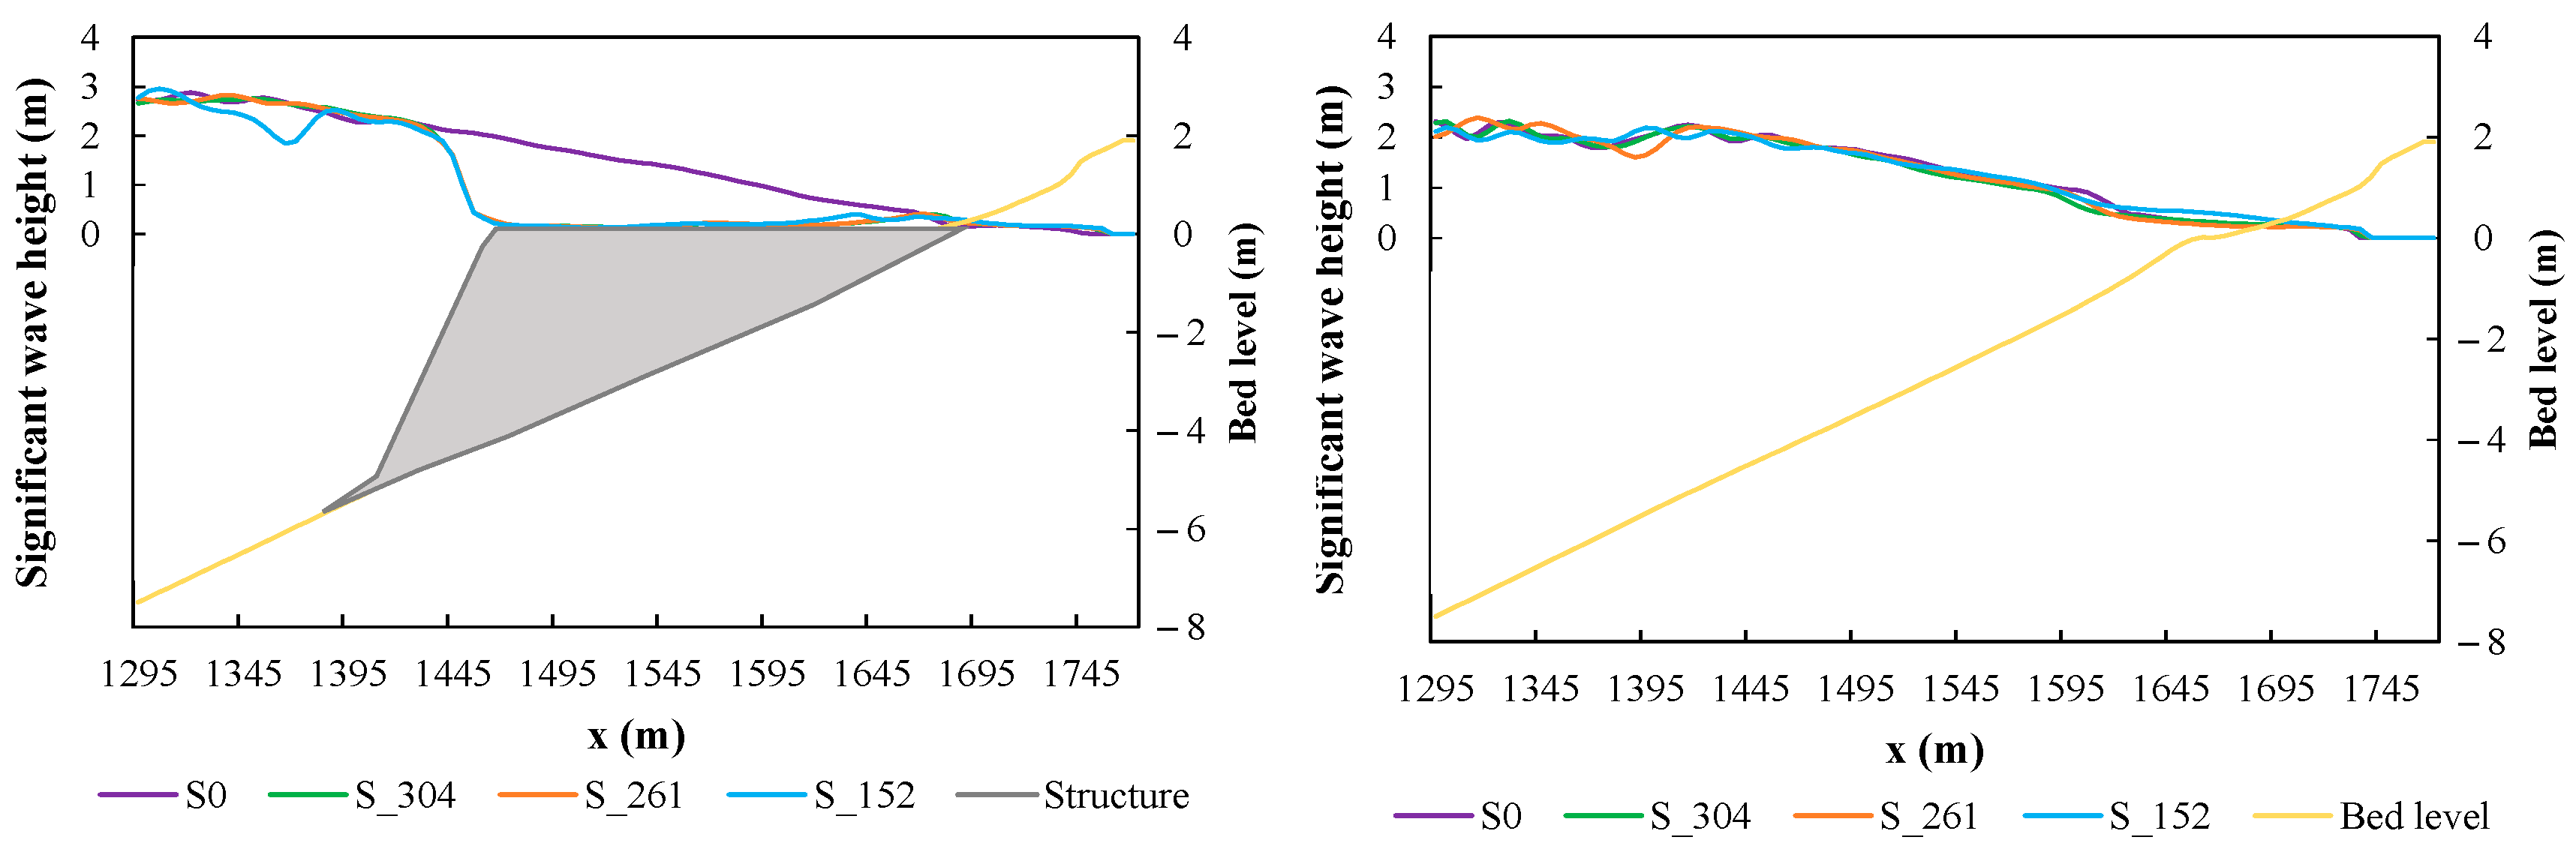
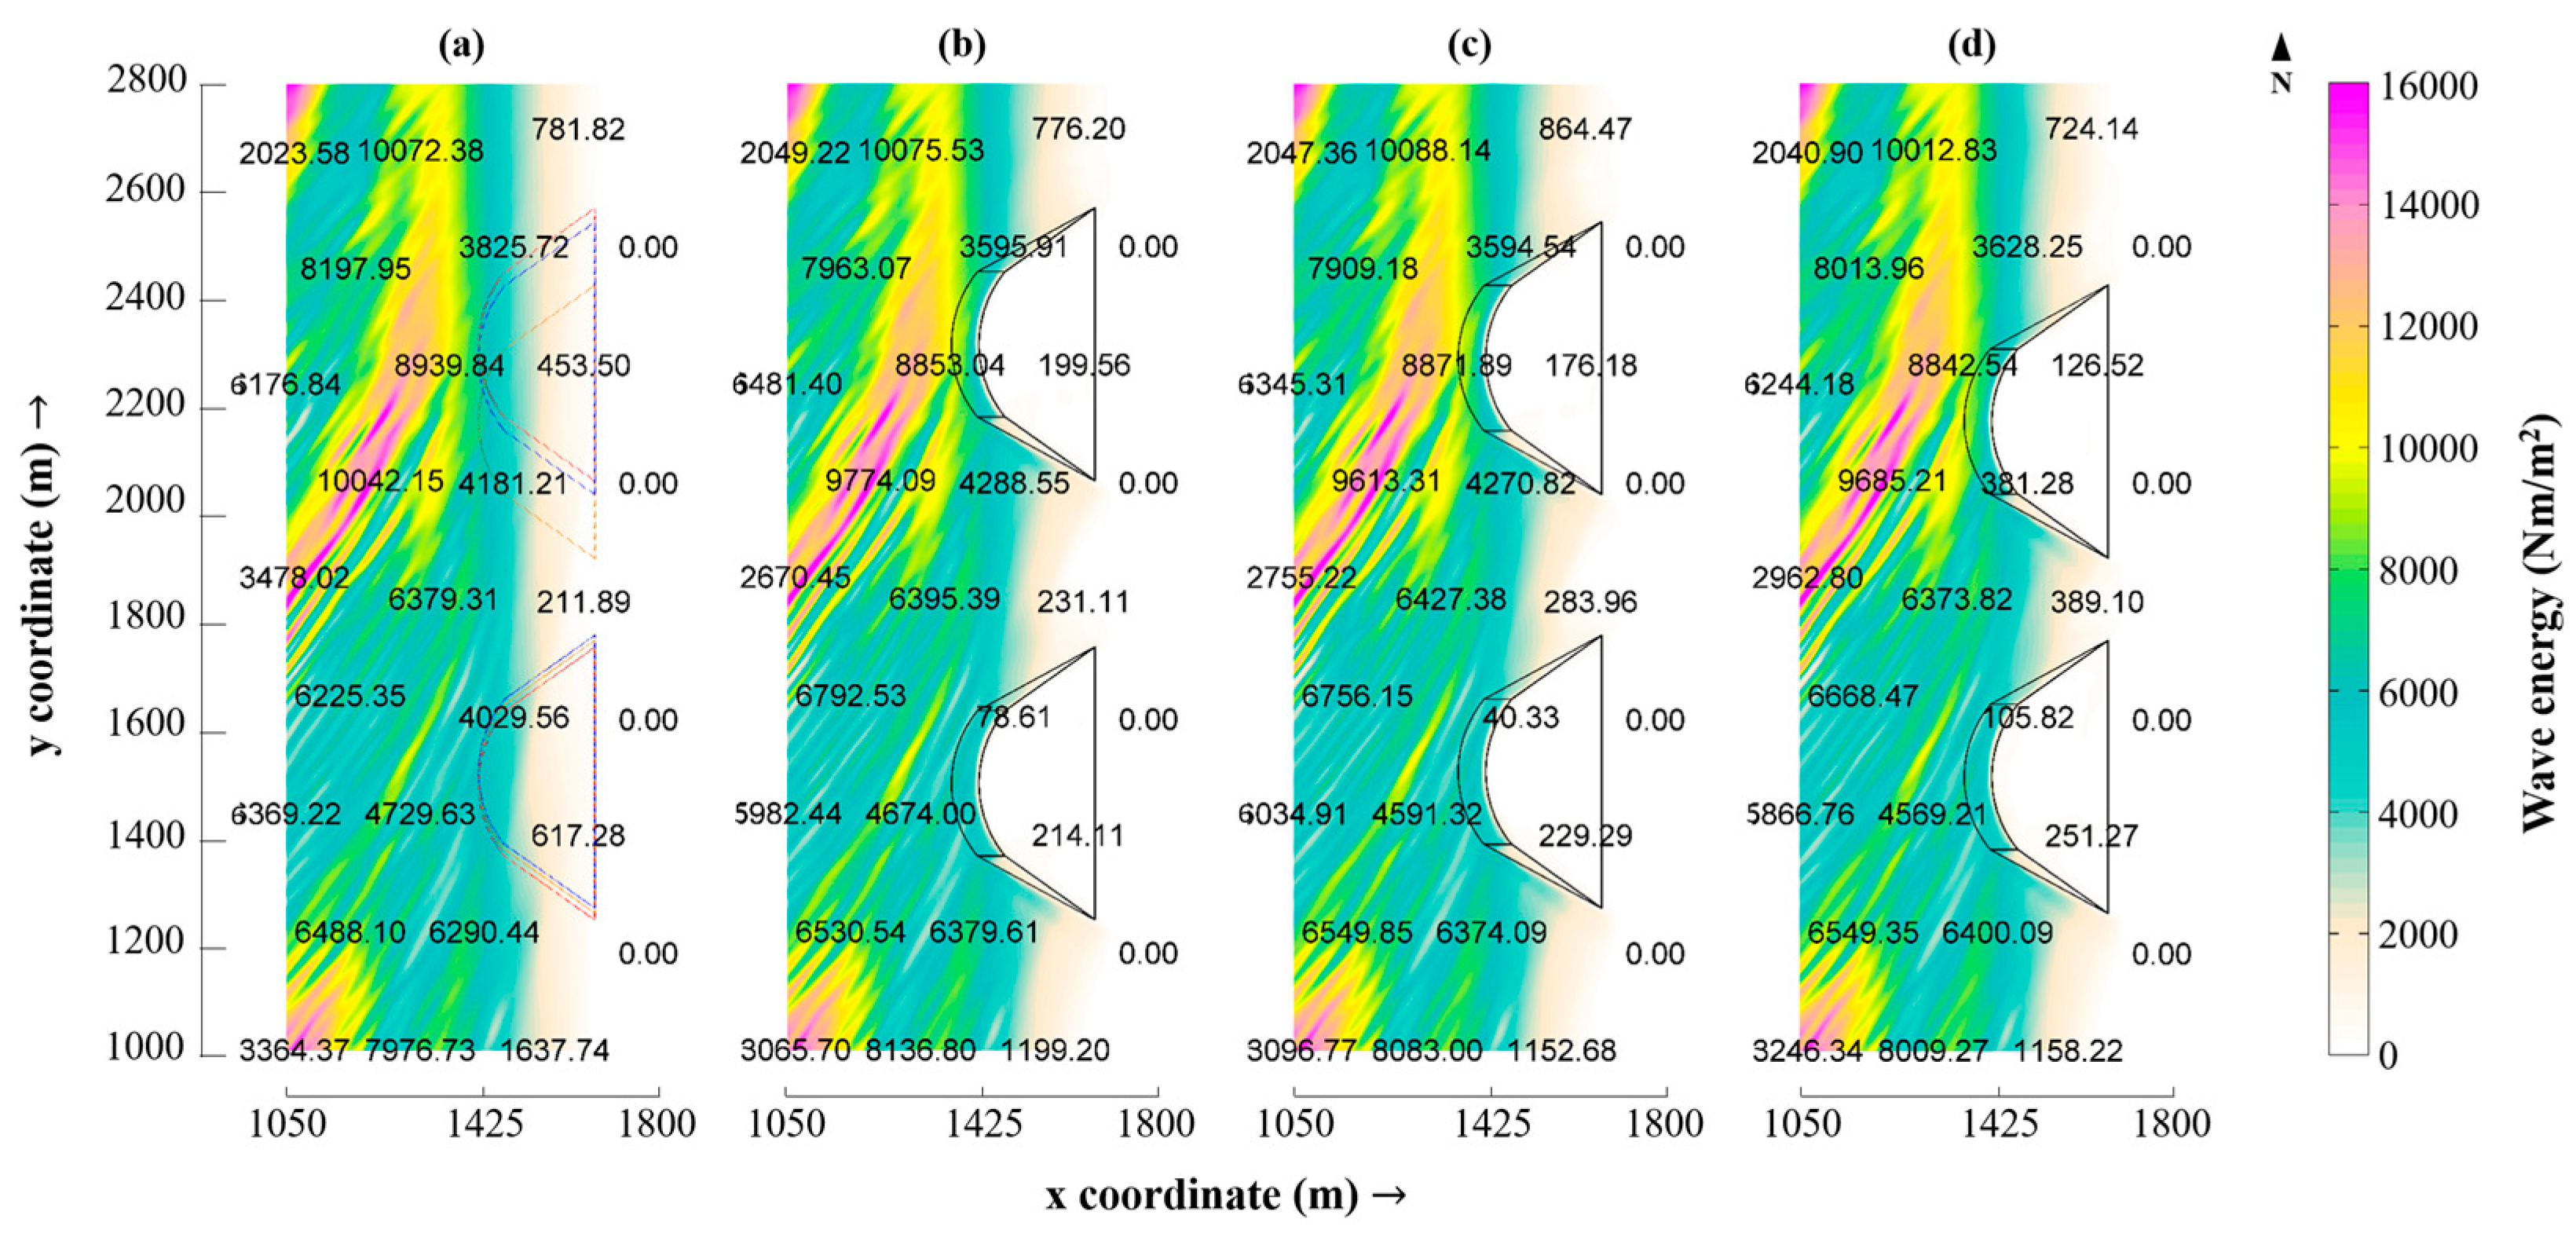
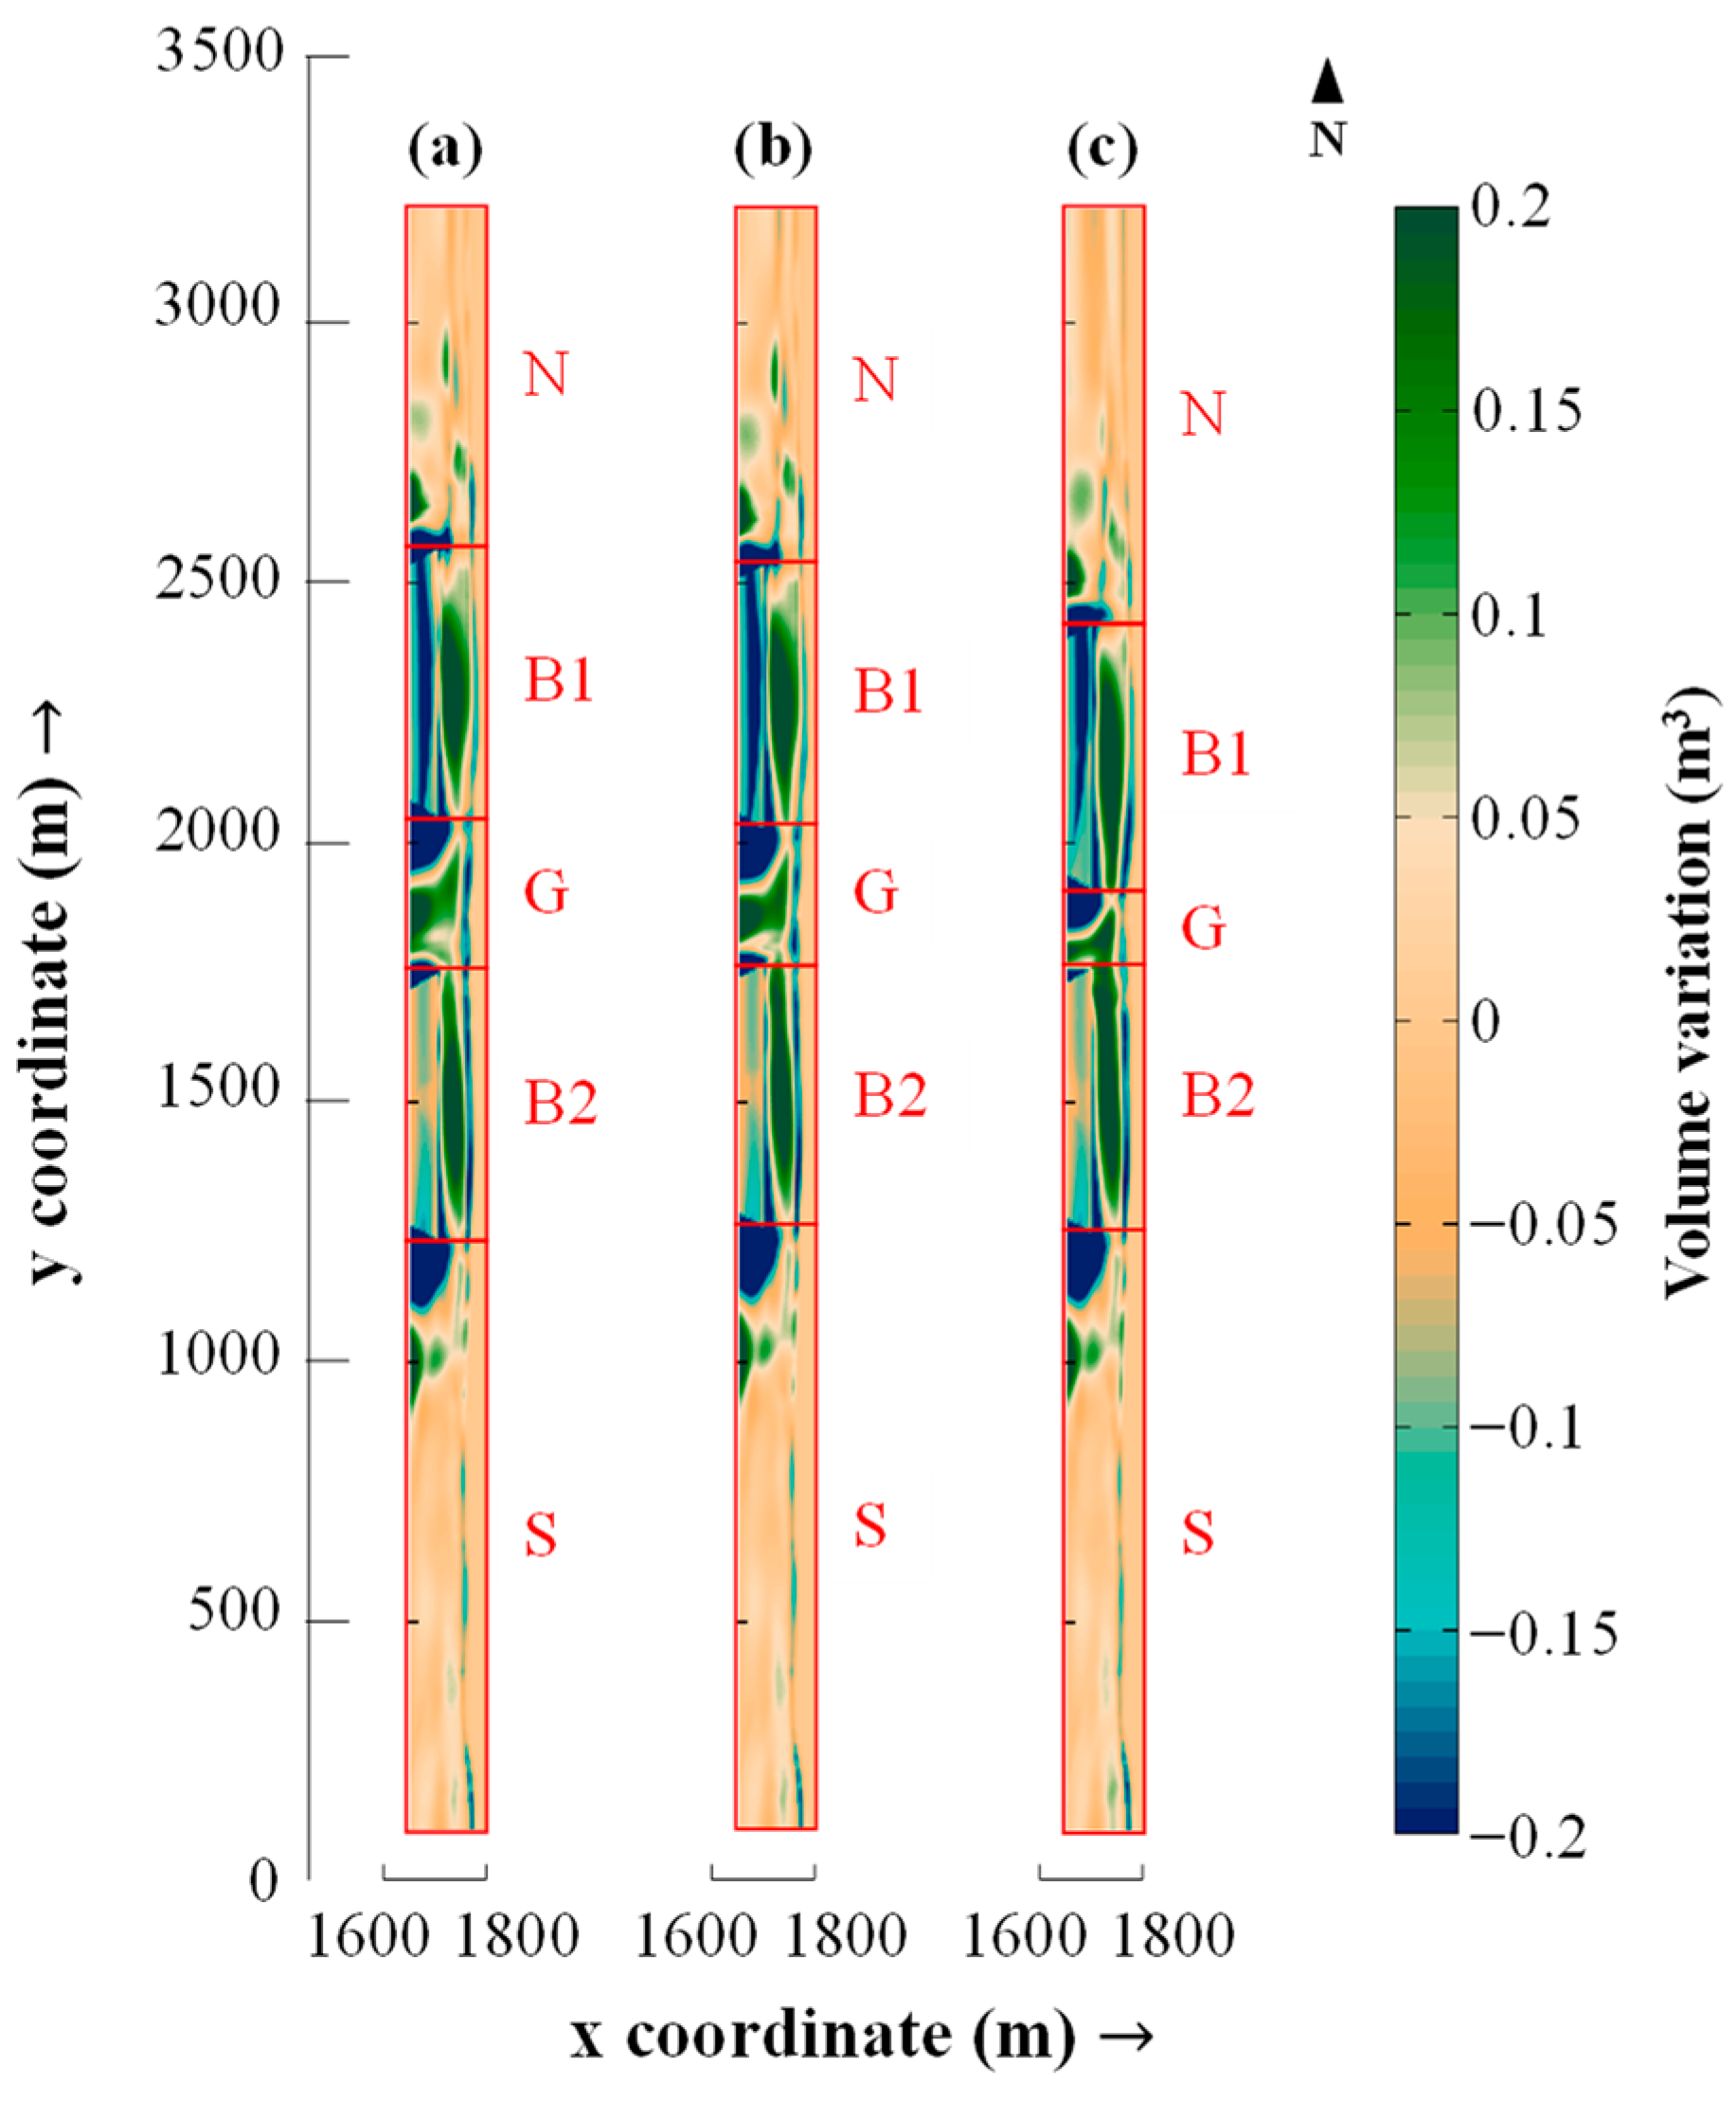
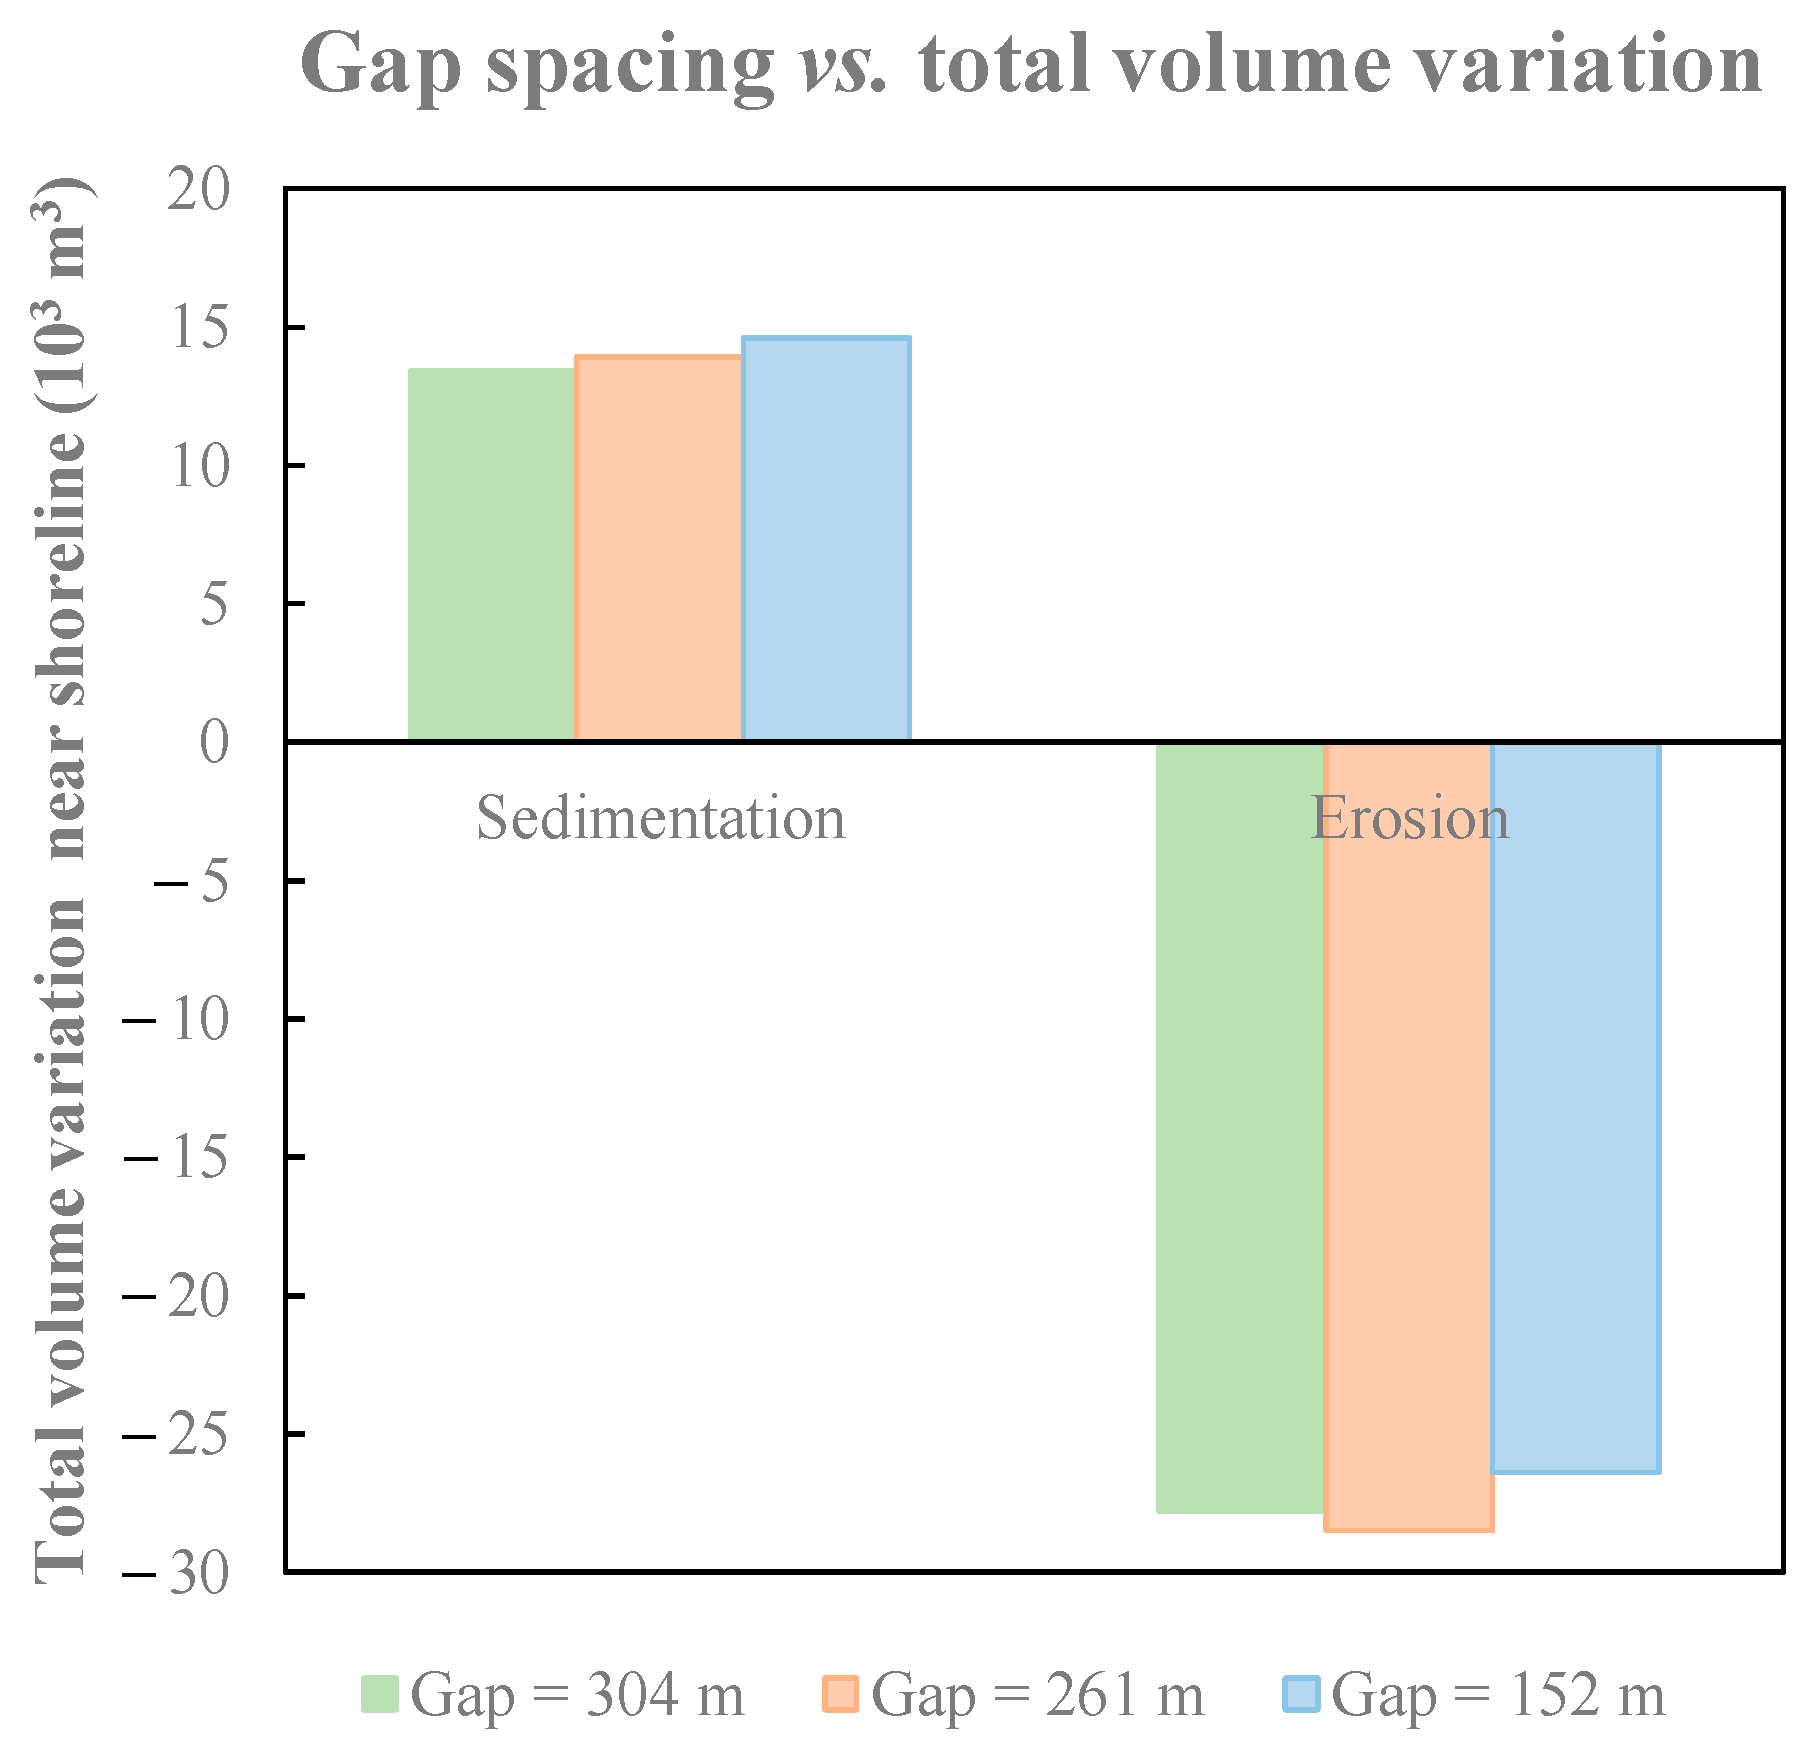
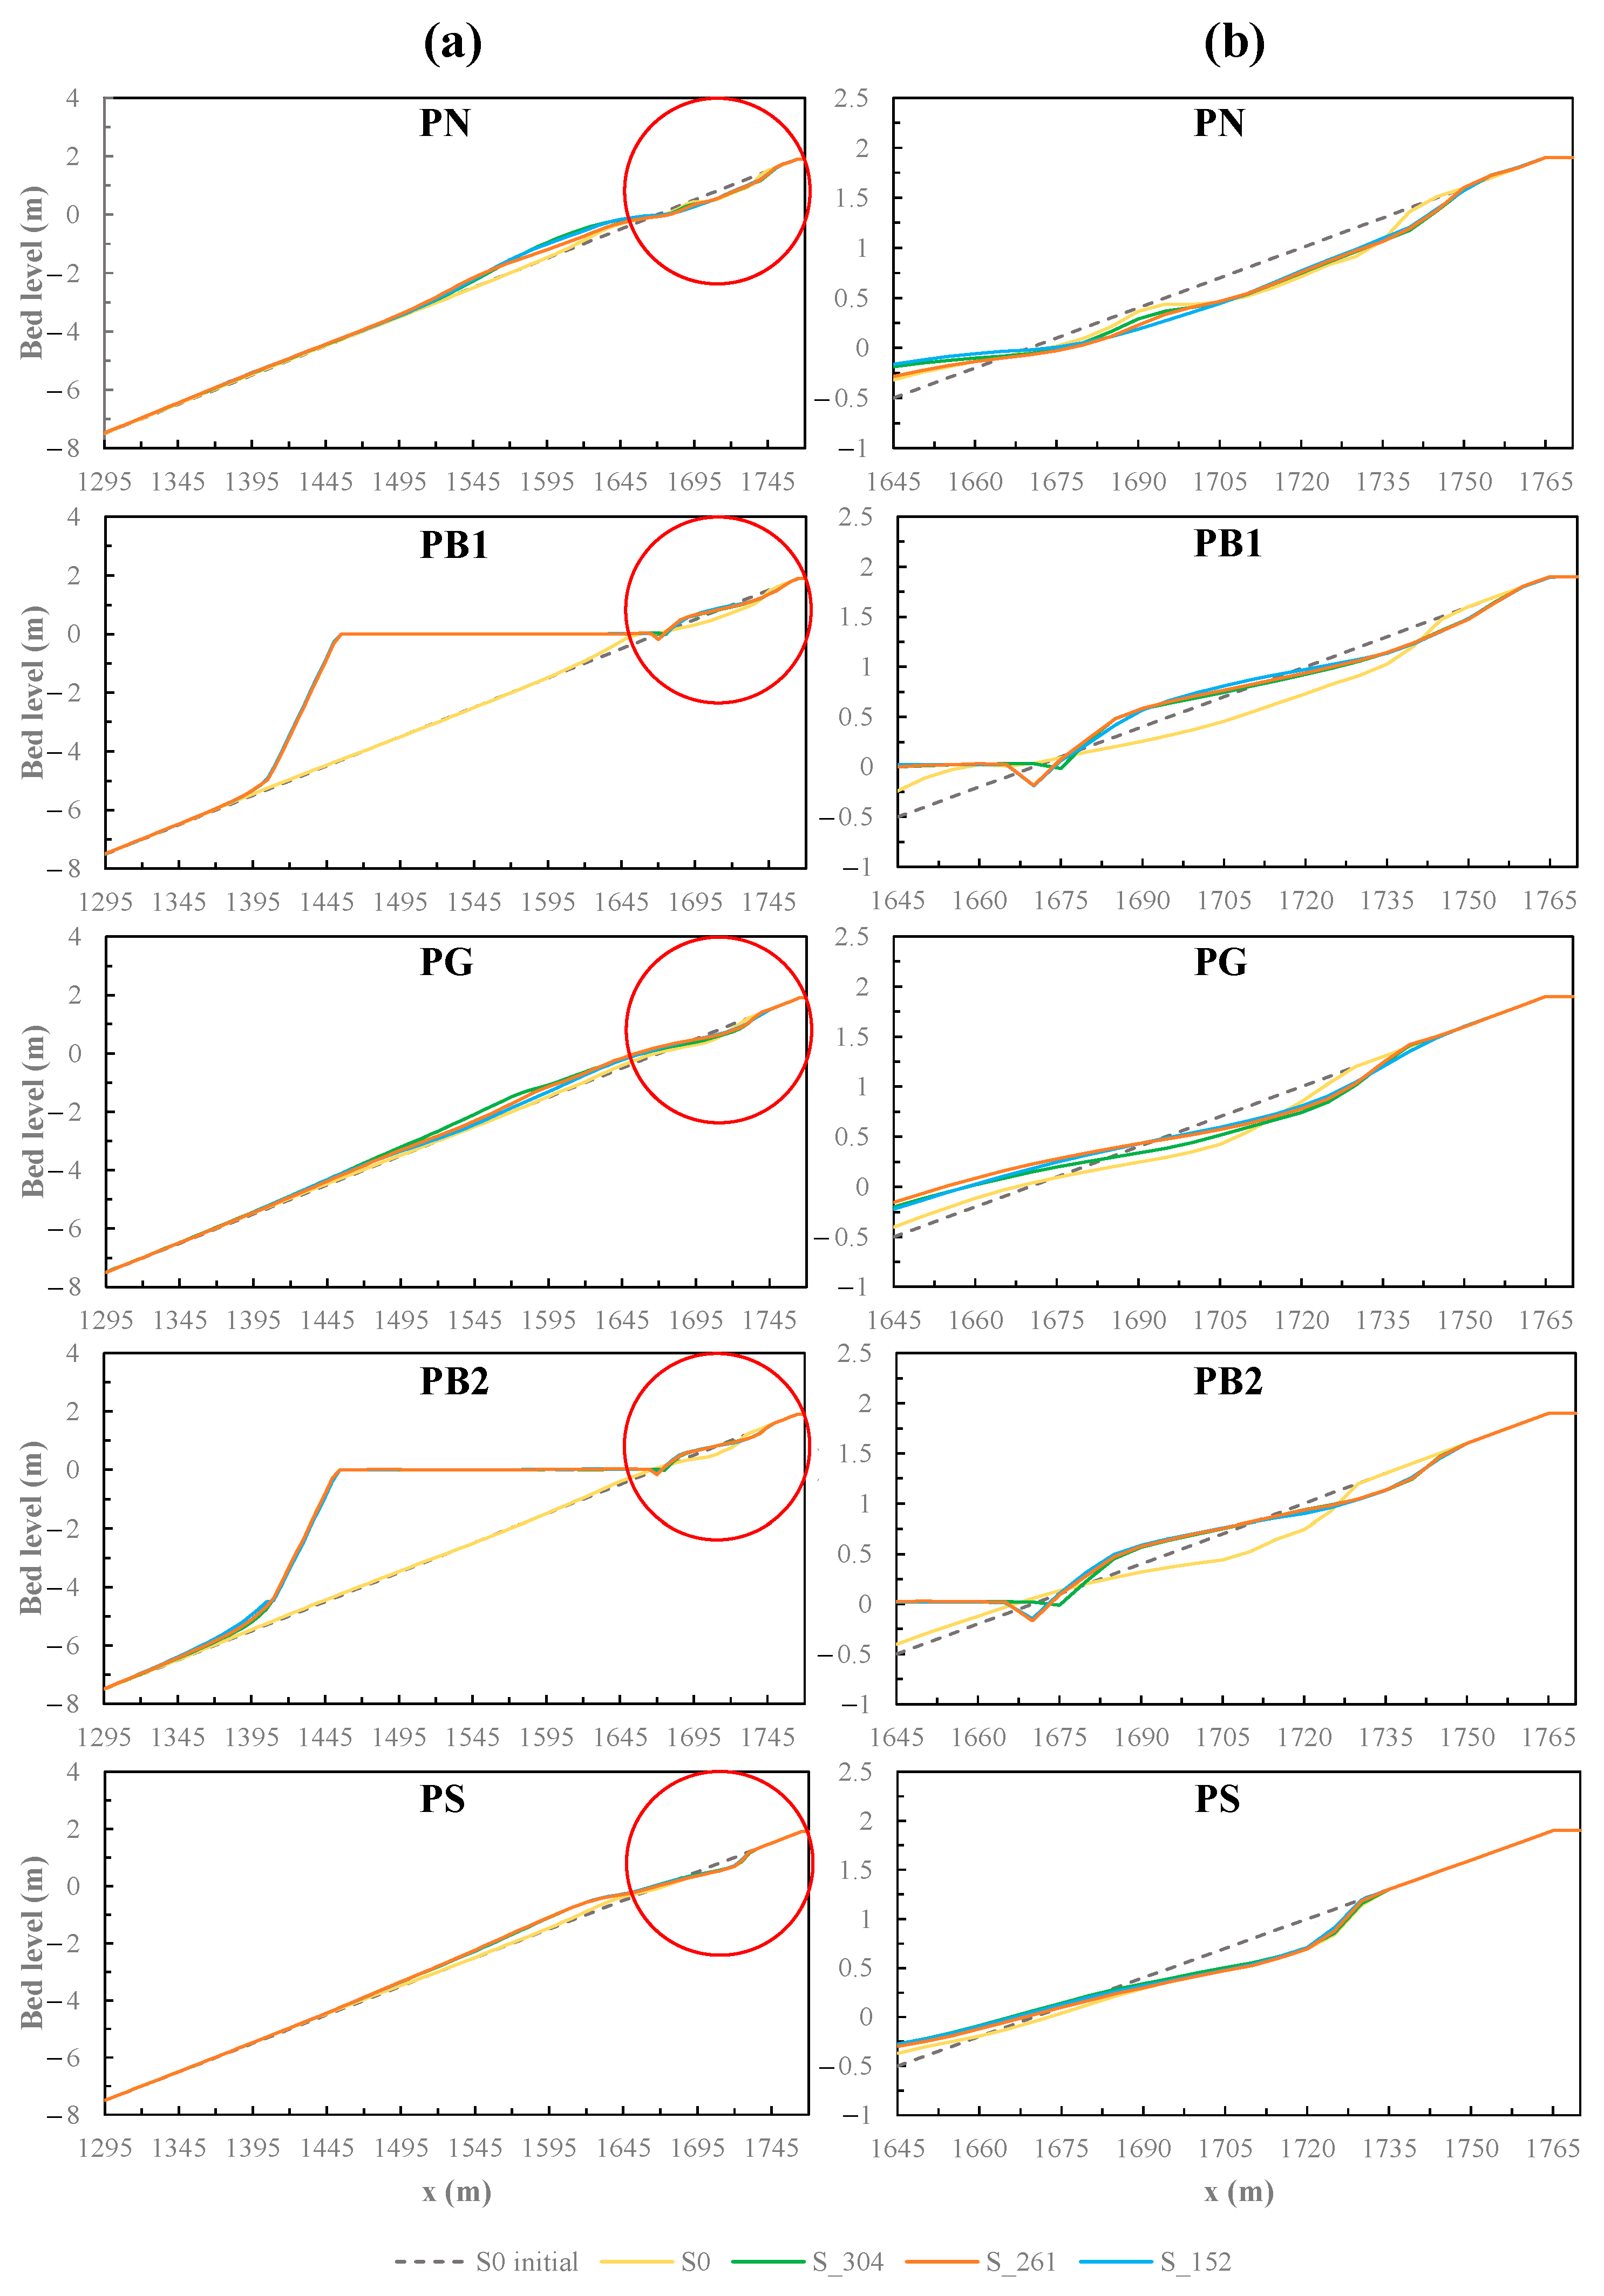
The morphodynamic analysis focused on the volume variations of the sedimentation/erosion outcomes for the entire nearshore domain and targeted areas for a 24 h storm. This aspect held significant importance for analysing the influence of gap spacing of 304 m, 261 m, and 152 m, particularly in understanding the formation of erosion and accretion patterns near the shoreline. The variation in the bed level for selected profiles was also analysed.
The hydrodynamics analysed the location of wave breaking and demonstrated how the structure aids in dissipating wave energy across different gap spacings.

3. Results

This section analyses the results obtained for model validation, significant wave height, wave energy dissipation, sediment volume, and bed level variations of semicircular structures with different gap spacings during storm conditions.

3.1. Hydrodynamics

In this section, four scenarios are studied: one reference scenario without structures (S0), and three with pairs of semicircular structures featuring gap widths of 304 m (S_304), 261 m (S_261), and 152 m (S_152) (Figure 3). The significant wave height results across these scenarios provided valuable insights into the behaviour of wave dynamics in the presence of semicircular structures, with a particular focus on the gap effects between these structures. The significant wave height labels in Figure 3 correspond to the results centred within the grid cell.
The presence of structures significantly altered the wave breaking process. Moreover, structures caused wave refraction, diffraction, and reflection, resulting in complex wave patterns. Across all scenarios incorporating structures, there was a notable reduction in the wave energy near the coast, attributed primarily to the wave breaking at the slopes of the structures when waves reached the exposed slope. At this point, the energy of the waves was dissipated mainly by breaking. This phenomenon was crucial for understanding the process. In fact, this effect demonstrated the structures’ effectiveness in dissipating wave energy before it reached the shoreline, thereby providing enhanced coastal protection. Conversely, wave breaking occurs primarily due to the decrease in water depth in locations with no structures that influence natural wave propagation. This process is often characterized by a more gradual and dispersed breaking pattern, with the wave energy spreading out more evenly along the coastline. The profiles shown in Figure 4 show a notable reduction in significant wave height as it approached the structure’s slope, abruptly diminishing from 2 m to 0 m near the beach (left), while at the gap, the wave breaking process was more natural and gradual (right).
Analysing the gap region between structures in Figure 3 reveals that when diffracted waves from opposite structures met within the gap and propagated into it, they were able to align so that their peaks coincided. This alignment led to significantly higher waves than S0 (0.30 m, as indicated in Figure 3), owing to the convergence of wave energies from both ends. Waves may also have been partially reflected by the structures, re-entering the gap and interacting with incoming or diffracted waves. This complex interaction can further enhance wave heights within the gap. In fact, the scenario with the widest gap spacing, S_304, exhibited the lowest wave heights in the gap area (0.45 m). This reduction can be attributed to decreased wave interference, as the wider gap spacing allowed more space for wave energy dissipation before the waves could converge and amplify. The slightly higher significant wave heights (0.50 m) observed in the scenario with a 261 m gap spacing, S_261, compared to the scenario with a 152 m gap spacing, S_152 (0.47 m), may have been influenced by factors other than simply the width of the gap, such as overall wave dynamics within the gap and bathymetry, as sediment accumulation could have contributed to this seemingly contradictory behaviour in significant wave heights. Narrower gap spacings could have led to more sediment accumulation, altering bathymetry and causing waves to break earlier. This premature breaking in S_152 could have resulted in slightly lower wave heights compared to S_261.
The wave energy results corroborated the wave height findings, as they indicated that the wave breaking zone was situated at the slope of the structures (Figure 5). Wave energy in XBeach is primarily quantified through significant wave height, peak period, and the specific kinetic energy of waves, offering a comprehensive representation of wave behaviour in a given coastal environment. The analysis indicated that the qualitative outcomes were identical between all scenarios. The wave energy labels in Figure 5 correspond to the results centred within the grid cell.

3.2. Validation of the Model

The validation of the model approach allowed for a robust analysis of sediment variation and a more precise assessment of the model’s performance under realistic conditions. Figure 6 presents the assessment of bathymetric changes for the real groin, conducted using ArcGIS, and their subsequent qualitative comparison with the simulations.
Upon analysing coastal sediment dynamics, significant patterns emerged in both the monitored data and the modelled scenario, underscoring notable sedimentation and erosion trends surrounding the groins. It is important to acknowledge there were differences between the two datasets, given the distinct temporal scales and environmental conditions under which they were collected and simulated. The monitored data reflected sedimentation and erosion patterns accumulated over a year, influenced by the cumulative effects of multiple storms of various durations. In contrast, the modelled data simulated these processes over a 48 h period during a typical storm event for the region. However, despite these disparities, the main patterns observed in both cases remained consistent. The model captured the dominant sedimentation and erosion trends evident in the monitored data, thereby lending credibility to its validity. While the magnitude and the absolute values may have differed due to the temporal scaling, the dominant trends provide valuable insights into coastal sediment dynamics and demonstrate the model’s predictive capabilities.
In the real scenario (Figure 6a), there was noticeable sediment accumulation updrift at the base of the groin near the beach, extending along the structure towards the seaward end, and near the groin’s head (1). Additionally, sediment accumulation downdrift occurred, but at a greater distance from the groin (1). However, data insufficiency near the groin’s head (2) prevented a definitive conclusion regarding erosion or further sedimentation in that particular area. Erosion was observed updrift along the beach’s length adjacent to the groin, and significantly downdrift (3).
Conversely, the modelled results (Figure 6b) mirrored the overall trends and patterns observed in the real scenario, but with some variations. Sediment accumulation was noted updrift from the base of the groin along the beach, continuing towards the seaward end, and downdrift (1). Erosive processes were evident updrift along the beach near the groin and at the head of the structure, with a developing pattern of typical groin-associated erosion observed downdrift (3).
Despite their temporal and scale differences, there was a notable degree of consistency in the correlation of sedimentation and erosion patterns between the real and modelled data. This consistency supports the model’s effectiveness in replicating real-world phenomena under controlled, simulated conditions. As observed in real-world data, the model’s ability to reproduce similar sedimentation and erosion patterns around the groin provided a robust foundation for its validation.

3.3. Morphodynamics

3.3.1. Sedimentation and Erosion Volume Variation

Multiple sections were delineated across the nearshore domain for each scenario to facilitate a more detailed comparison of outcomes for different gap spacings, particularly in shoreline regions. These sections depicted variations in sediment volume between each scenario and S0. They were strategically positioned based on areas of significant sediment accumulation or erosion adjacent to structures and/or the shoreline. The results from each section were then compared with each other. The northern and southern extremes sections were labelled N and S, respectively. The sections behind the structures were sequentially named in ascending order, B1 and B2, from the northern to the southern boundaries (B1 for structure 1. and B2 for structure 2). The section at the gap of each pair of structures was named G.
Figure 7 presents the results of sediment volume variation relative to gap spacing in specific stretches, which provides valuable insights into sedimentation and erosion dynamics near the semicircular structures. These insights are crucial for understanding the effectiveness of the structures in conditioning sediment transport processes.
The analysis based on the sedimentation trends revealed varied sedimentation responses depending on the gap spacing. In the scenario comparing S_304 to S_152 (Figure 8), a consistent decrease in sedimentation rates was observed across multiple stretches: N (26%), B1 (11%), B2 (21%), and S (10%). This suggests that wider gap spacings, as seen in S_304, supported reduced sedimentation rates. Conversely, stretch G exhibited an increase in sedimentation by 84% when comparing S_304 to S_152 (Figure 8), indicating a scenario-specific response influenced by local hydrodynamic conditions, such as wave energy dissipation. Further analysis comparing S_304 to S_261 (Figure 9) also indicated a general trend of reduced sedimentation with increased gap spacing, with decreases observed in stretches N (8%), B1 (5%), B2 (6%), and S (5%). However, comparisons between S_152 and S_261 (Figure 9) provided contrasting results, showing an increase in sedimentation in several stretches, such as N (25%), B1 (6%), B2 (18%), and S (6%). This demonstrated a nonlinear relationship between sediment deposition and gap spacing, suggesting that factors beyond gap spacing alone, such as local sediment transport dynamics, wave energy dissipation, and bathymetry, significantly influenced sedimentation patterns along the coastline.
The erosion trends also showcased dependency on gap spacings. Comparing S_304 to S_152 (Figure 8), erosion decreased in stretches N (23%), B1 (8%), and S (2%), while it increased notably in stretch G by 87%. These results suggest that wider gap spacings may generally reduce erosion rates, though the exception in stretch G highlights a potential for localized increases under certain conditions. Similarly, when analysing erosion between S_304 and S_261 (Figure 9), decreases were observed across most stretches, with N showing a 13% reduction, and B1 and B2 a modest 2% reduction. The comparison between S_152 and S_261 (Figure 9) further confirmed the complex nature of erosion dynamics, with stretch G seeing a marked decrease in erosion by 45%, contrasting with increases in other areas like stretch N (13%) and B1 (6%).
Figure 10 illustrates the total volume variation results near the shoreline for different gap spacing scenarios, relative to S0.
The configuration for the scenario with the widest gap spacing, S_304, exhibited the lowest total sedimentation volume variation near the shoreline (13,400 m3) and an intermediate total erosion volume variation (27,800 m3) when compared to the other two scenarios. This indicated a state with minimal sedimentation and intermediate erosion. This configuration suggests that the gap spacing of 304 m effectively allowed maintenance of the prevailing natural sediment transport processes, preventing excessive buildup while also mitigating erosive trends. The presence of two semicircular structures at this gap spacing likely provides sufficient shelter from direct wave impact, reducing erosive potential while enabling sediment transport along the coast.
Conversely, the scenario with the narrowest gap spacing, S_152, presented the highest total sedimentation volume variation near the shoreline (14,600 m3) and the lowest total erosion volume (26,400 m3). This phenomenon, attributed to the narrow gap spacing, confined sediment transport along the coast, leading to sediment accumulation near the structures, which minimized erosion.
Lastly, the scenario with the 261 m gap spacing, S_261, displayed intermediate total sedimentation volume variation near the shoreline (13,900 m3) compared to the other two scenarios and the highest total erosion volume variation (28,500 m3). This suggests that while S_261 allowed for better sediment transport compared to S_304, it also exposed the shoreline to increased erosive forces. The presence of two semicircular structures at this intermediate gap spacing of 261 m is likely to moderate sediment transport, although in a slightly more erosive environment.

3.3.2. Bed Level

Following the volume variation analysis, multiple profiles, denoted as P, were traced across the domain for each scenario, strategically located based on areas of significant bed level changes. Figure 11 compares the bed level between the initial state (t = 0 h, purple line) and the end of the simulation (t = 24 h, black line).
In the analysis of bed level evolution, results across all scenarios demonstrated fluctuations both in regions adjacent to the structures and within the gap spacings between them. These findings indicate a dynamic interaction between the semicircular structures and the sedimentary environment, evident from the observed bed level alterations. For a detailed analysis of nearshore dynamics, Figure 12 shows these changes. Each profile’s results are compared with those of the S0 initial (t = 0 h) and S0 (t = 24 h) scenarios. The profiles are labelled following the same methodology as previously outlined.
In PN, at a stretch from 1645 m to 1670 m, scenarios S_152 and S_304 showed higher bed levels than S0 and S0 initial. This indicates an accumulation trend of sediment near the structures. From 1670 m to 1750 m, a reduction in bed level below S0 was observed across S_304, S_261, and S_152. Notably, the bed level was higher for S_304 and lower for S_152, suggesting that narrower gaps might have contributed to reduced deposition rates in this location. Additionally, all profiles were below S0 initial from 1670 m to 1750 m, indicating net erosion post-installation irrespective of the scenario.
PB1 showed a distinct lowering in bed level adjacent to the structure in S_261, suggesting more intense local scour compared to S_304 and S_152, where the reduction was more moderate, yet qualitatively similar. Interestingly, all scenarios with structures exhibited higher bed levels than S0 behind the structure, pointing to effective sediment trapping. This effect was slightly more pronounced in S_152. Between 1720 m and 1760 m, there was a slight decrease in bed level compared to S0 initial, while a minor lowering was noted from 1745 m to 1760 m relative to S0.
In PG, S_261 demonstrated slightly higher bed levels between 1645 m and 1700 m, favouring it over other scenarios in terms of sediment accumulation. In addition, between 1645 m and 1715 m, all scenarios with structures had higher bed levels than S0. Between 1700 m and 1740 m, all scenarios had bed levels below S0 initial. Post-1715 m, all scenarios with structure showed a decrease in bed levels until 1745 m relative to S0. This suggests a switch in sediment deposition patterns, possibly due to altered hydrodynamics between the structures.
The trends observed in PB2 were analogous to those in PB1, but with minimal differences among the scenarios with structures. This suggests a uniform response across different gap spacings in this particular area, possibly due to similar flow disturbances induced by the structures.
For PS, from 1645 m to 1690 m, scenarios S_152 and S_304 were nearly identical and, along with S_261, showed higher bed levels than S0. Beyond 1690 m, no significant differences were noted among the scenarios with structures relative to S0. However, from 1690 m to 1735 m, all scenarios registered below the bed levels of S0 initial, indicating overall erosion in this section.

4. Discussion

4.1. Significance of the Results

The study underscored the pivotal role of structural design and gap spacing of semicircular structures in mitigating coastal wave impacts during storm events using XBeach. While coastal structures generally diminish wave energy, the gap spacing between them critically influences localized wave height changes due to diffracted and reflected waves. Hence, achieving optimal gap spacing is vital to maximize protective benefits while minimizing adverse effects within protected zones.
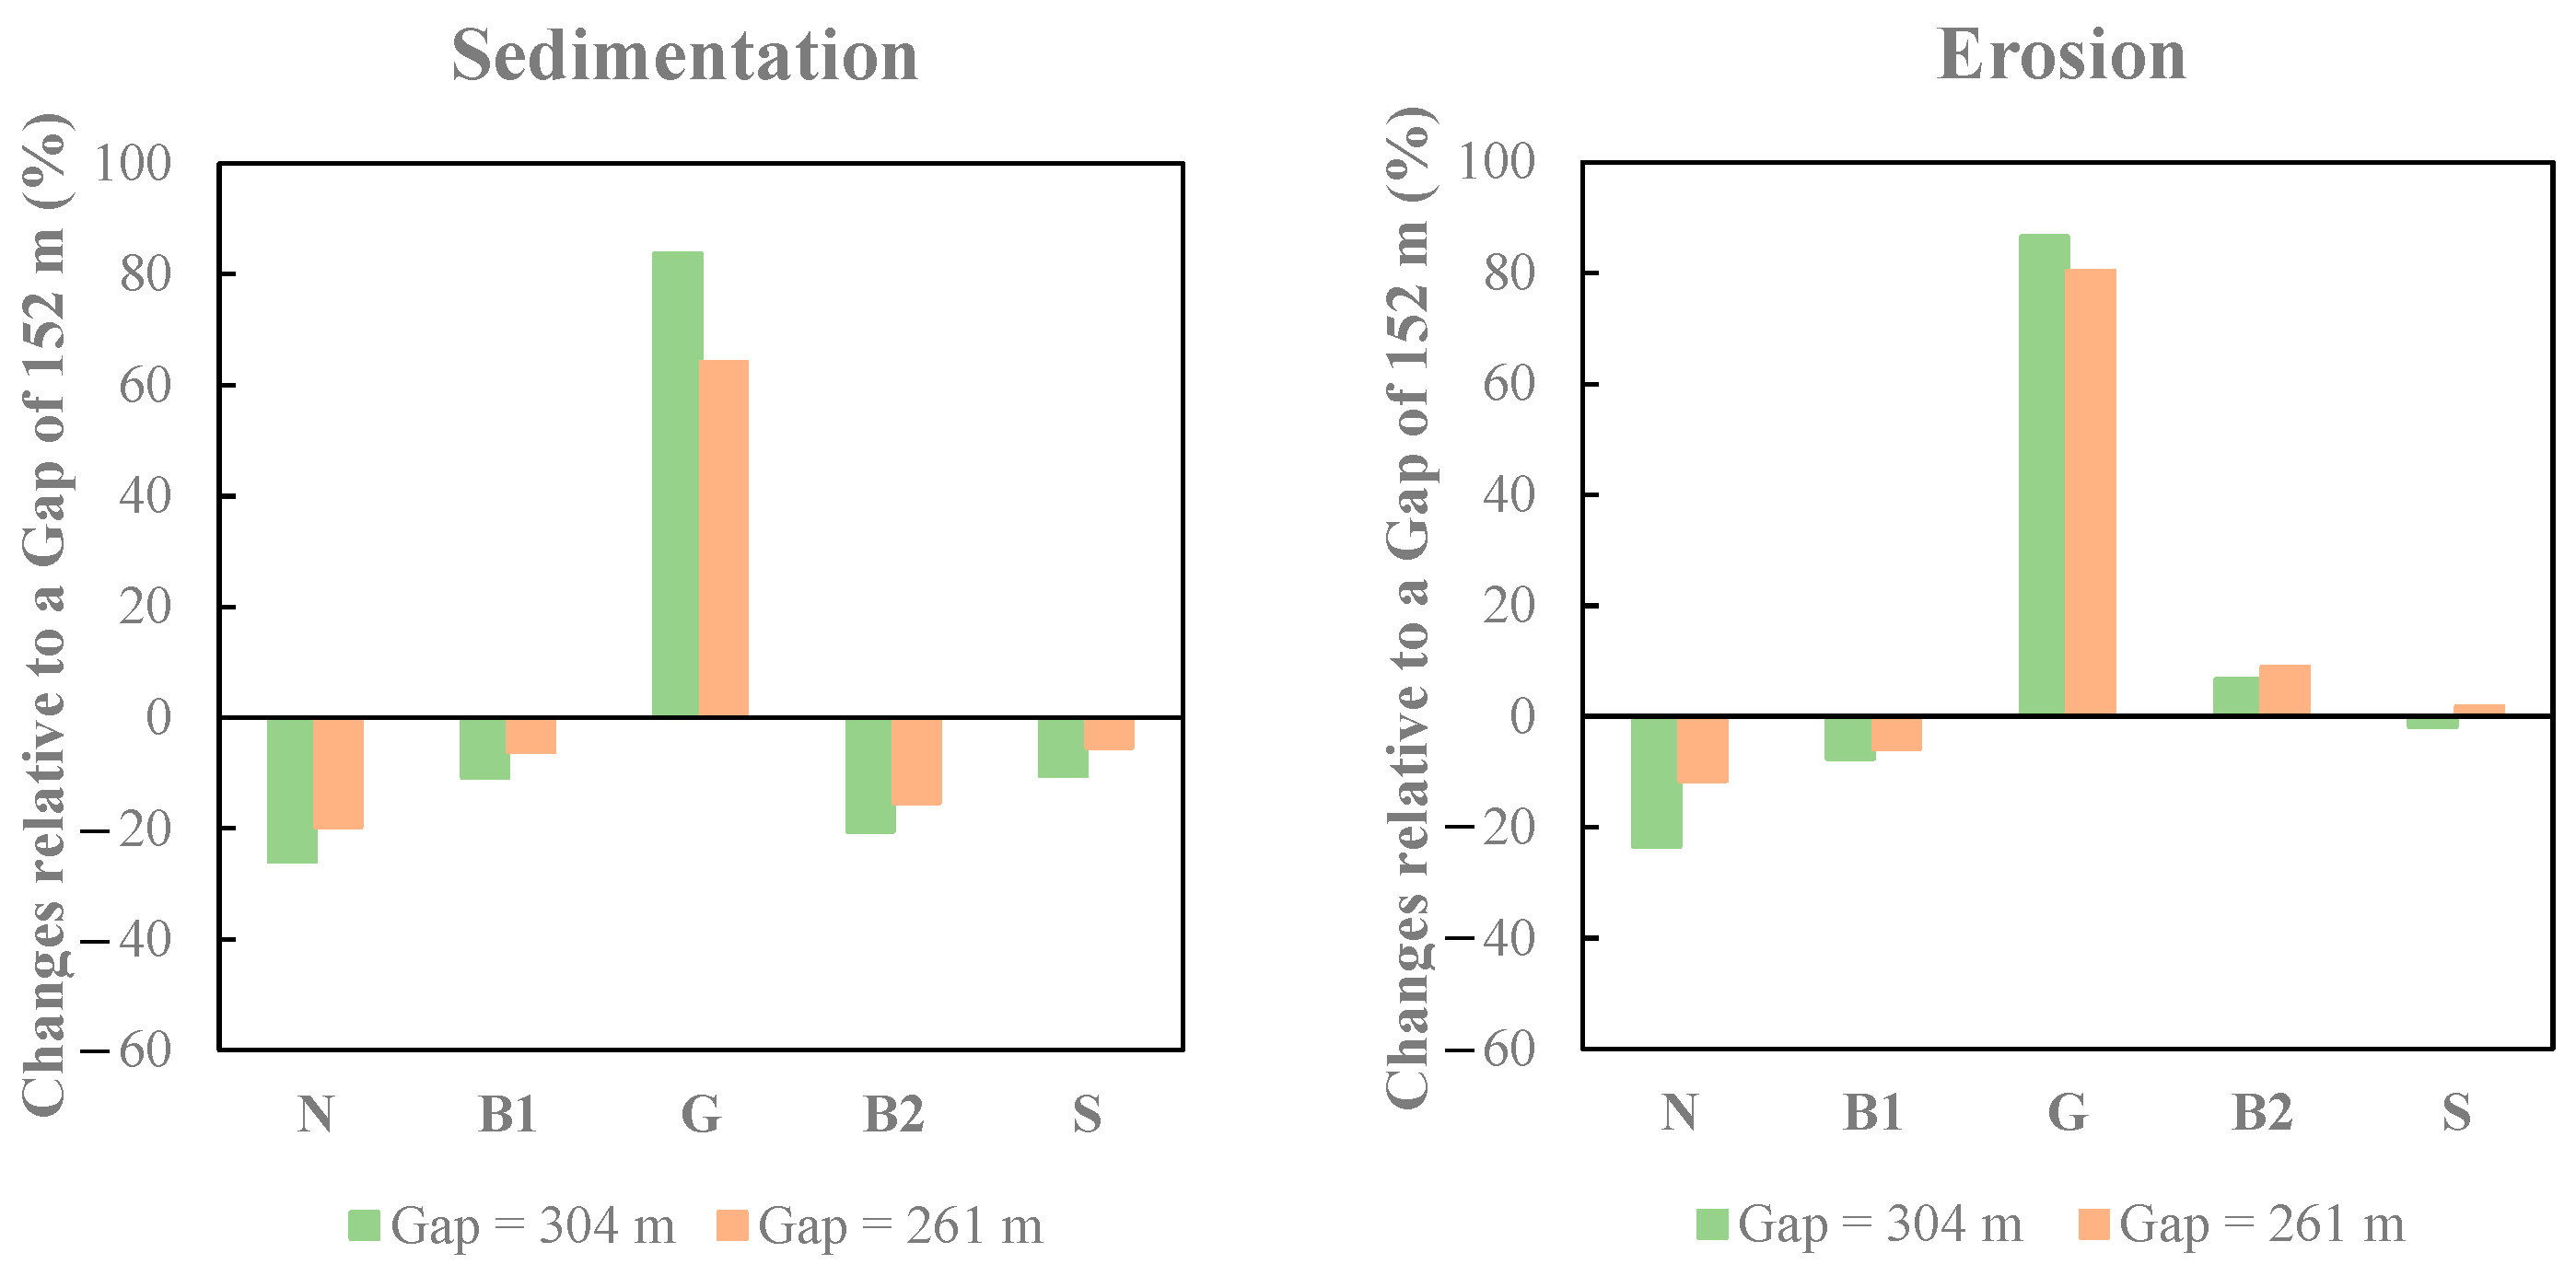
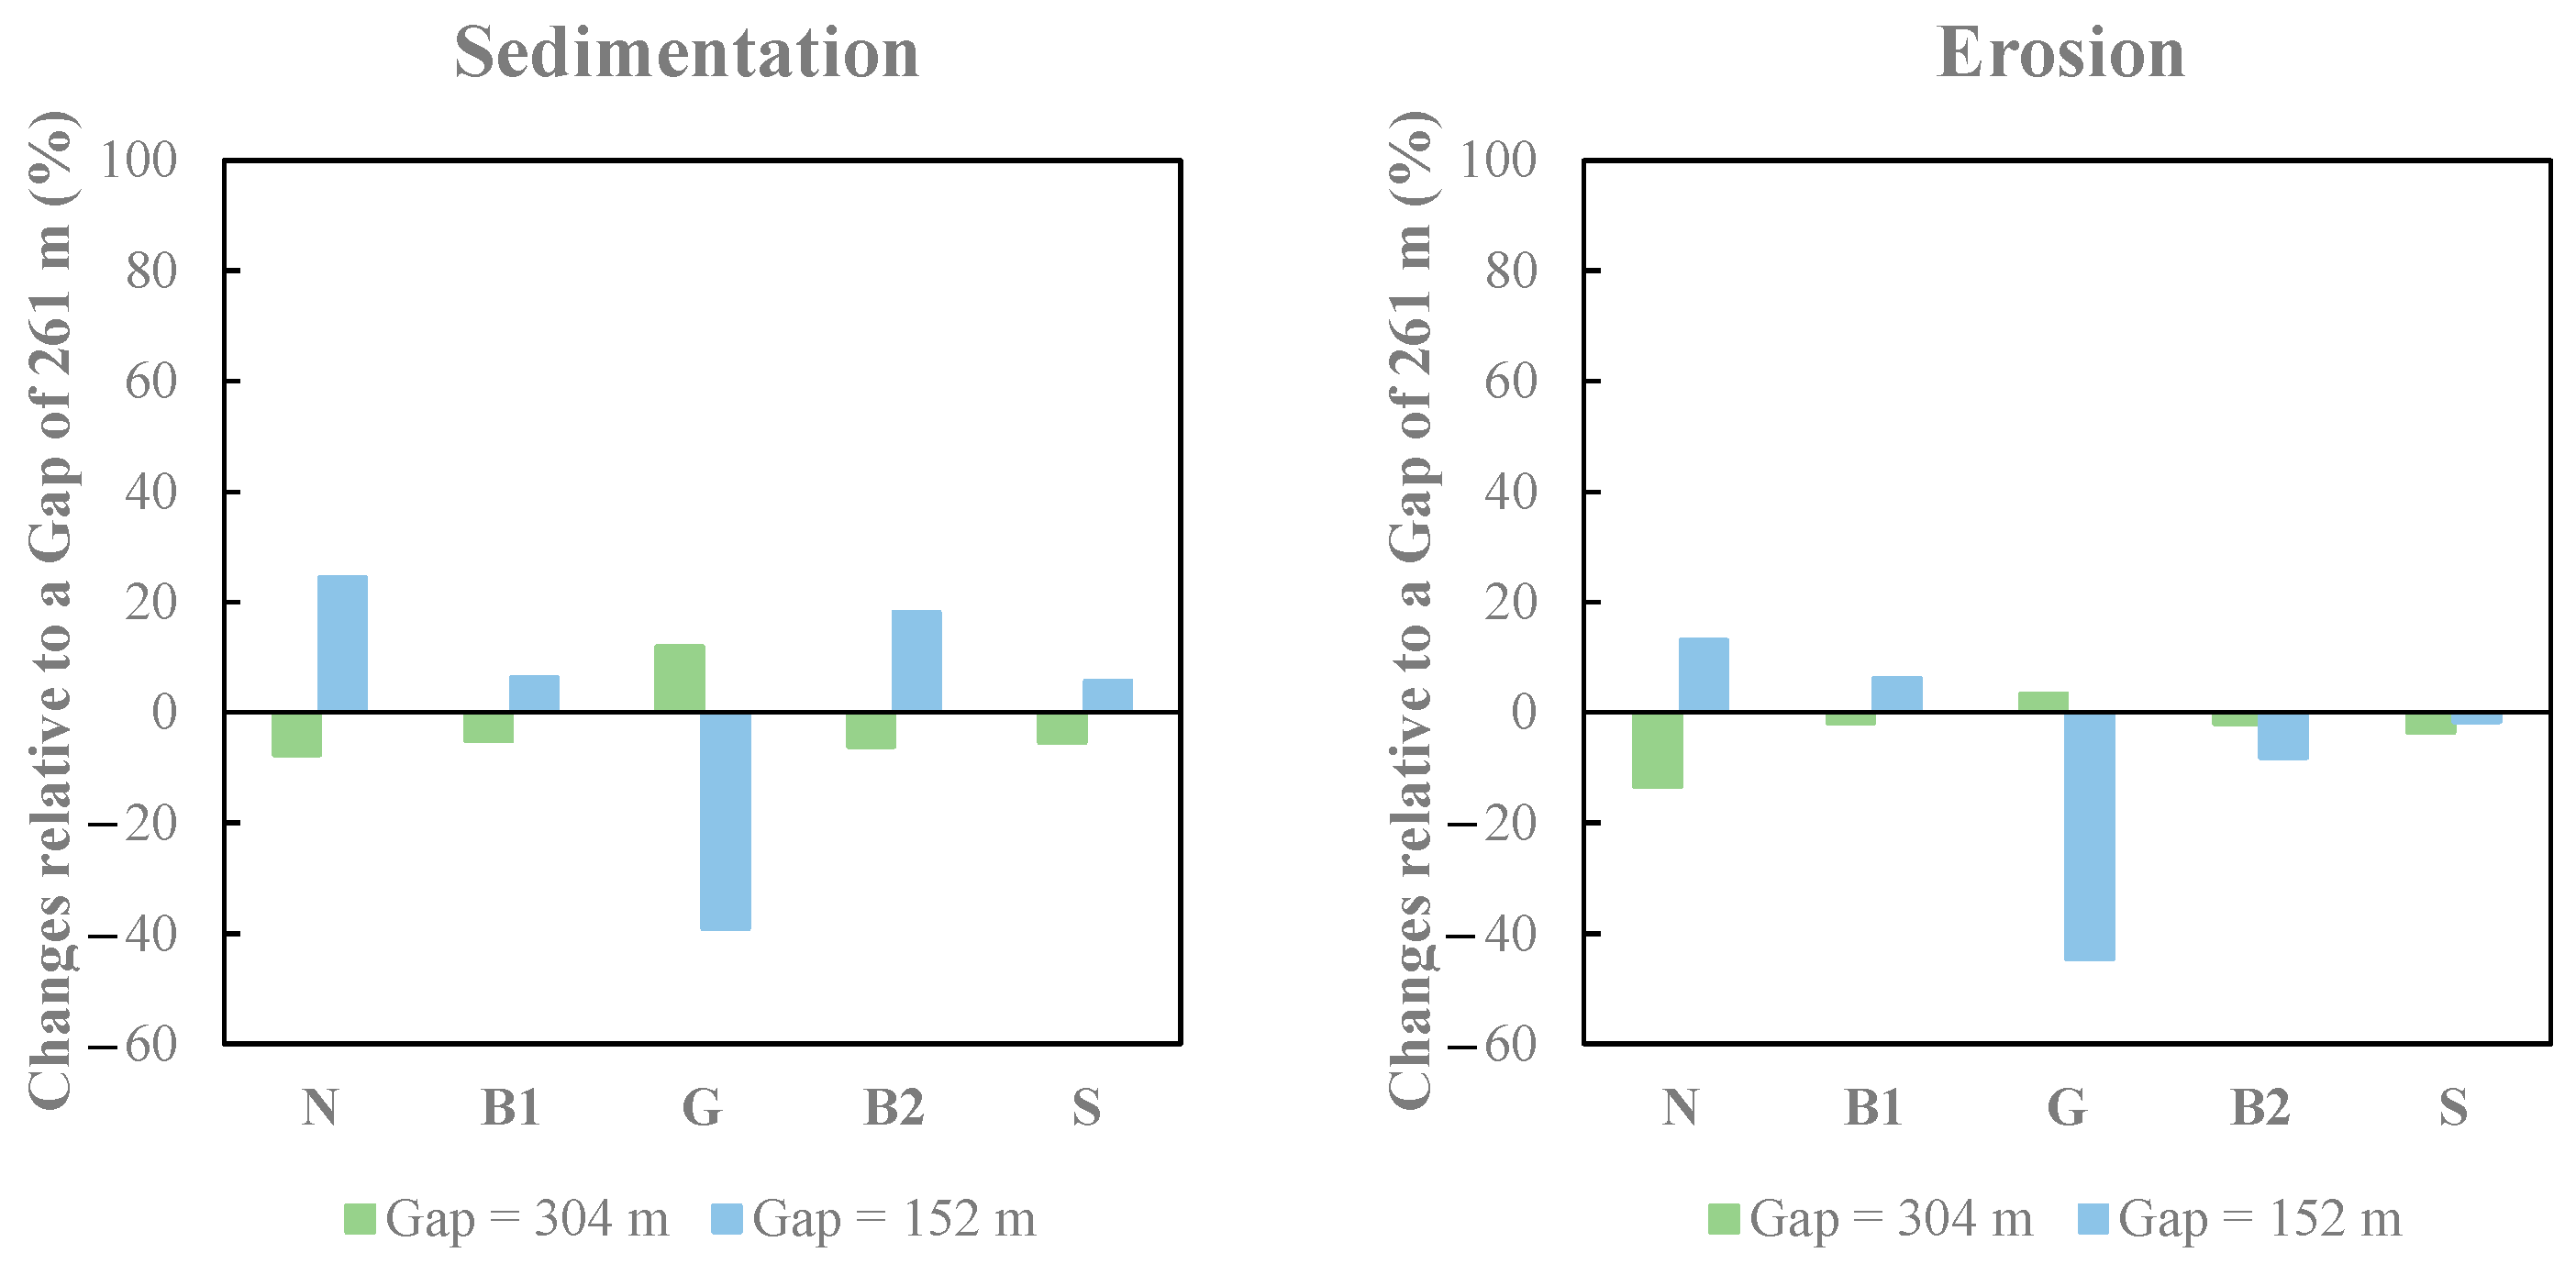
The observed sediment volume variations revealed the intricate interplay between gap spacing in coastal protection structures and sedimentation-erosion dynamics. Optimal gap spacing of 304 m struck a balance between sedimentation and erosion, supporting natural coastal sediment transport processes. However, site-specific factors such as wave climate, sediment characteristics, and coastal morphology must also be considered in designing effective coastal protection strategies.
Data analysis indicated that the gap spacing between semicircular structures significantly influences sedimentation and erosion. Wider gaps generally reduce sedimentation and erosion by altering wave dynamics around the structures. However, exceptions in certain stretches may suggest the influence of local topography and hydrodynamic conditions.
Firstly, it was observed that as the gap spacing between structures decreased, sedimentation increased significantly in sections N, B1, B2, and S. This phenomenon can be attributed to reduced wave energies caused by the closer proximity of structures, which allows the conditions for sediment deposition.
Conversely, a contrasting trend was noted in the stretch between structures, G, where sedimentation increased with wider gap spacing between structures. This observation suggests that in wider inter-structure spaces, there is a greater opportunity for sediment to accumulate due to decreased flow disturbance and enhanced settling conditions.
Moreover, the findings revealed a notable inverse relationship between structure gap spacing and erosion rates in sections N and B1. It was found that despite lower sedimentation levels, wider gap spacing between structures correlates with reduced erosion at these locations. This can be explained by the increased wave energy dissipation resulting from wider spacing, which promotes a reduced erosive force acting on the coastline, and a reduced wave reflection and refraction towards the coastline.
On the contrary, wider gap spacing between structures corresponded to higher erosion rates in section G. This observation was consistent with the increased wave energy and reduced obstruction to sediment transport associated with wider spacing, which exacerbates erosive processes.
Remarkably, sections B2 and S exhibited amplified erosion with a specific gap spacing of 261 m between structures. This indicates a threshold effect potentially due to wave hydrodynamic changes and channel morphology feedback.
The analysis demonstrates that gap spacing between semicircular structures profoundly affects sediment deposition and erosion patterns. Narrower gap spacings tend to induce more sediment accumulation behind the structures, likely due to wave energy dissipation. Conversely, wider gap spacings facilitate sediment transport, leading to reduced deposition immediately behind the structures, but lower erosion further away. Consistent erosion across all profiles relative to initial conditions suggests an overall destabilizing effect of the structures on bed level, highlighting the complexity of predicting structural impacts.

4.2. Limitations and Future Research

This study delves into optimizing the gap spacing of semicircular structures based on conditions favouring longitudinal drift reversal, using a generic bathymetry as a basis. Future scientific endeavours could complement this investigation by conducting specific fieldwork to gather historical data on bathymetry and sediment characteristics along a designated coastal stretch. Such efforts would yield a more comprehensive and site-specific evaluation of the optimized semicircular structure. Additionally, exploring variations in wave parameters through time series analysis of local wave climate regimes could provide valuable insights for comparison with the findings of this study.
To further elucidate these findings, future research could involve comparing the outcomes of this study with the impact of artificial sediment nourishment deposition in coastal segments, conducting a similar methodological approach. Such comparative analyses would broaden the understanding of diverse methodologies for mitigating erosive processes.
Also, it could be worthwhile to investigate the implementation of a porous structure constructed from blocks with strategically positioned apertures, forming pathways for sediment transfer from the accretion zone to erosion-prone areas. Furthermore, the impact of energy dissipation could be examined by introducing channels with significant geometric irregularity.
Additionally, exploring complementary aspects related to the economic sustainability of the semicircular structures could be a focal point for future research. Such investigations would offer valuable insights for decision-makers and stakeholders engaged in coastal protection projects by considering alternative innovative solutions for coastal defence in addition to the traditional ones.

5. Conclusions

The study underscores the critical role of semicircular structure design and gap spacing in effectively managing coastal wave impacts during storm events using the XBeach model. These structures are instrumental in attenuating wave energy, but their spacing significantly influences localized wave height changes, thus impacting sedimentation and erosion dynamics within protected zones.
This research provides valuable insights into coastal engineering design, particularly emphasizing wave-dissipating structures’ strategic placement and gap spacing. It highlights the necessity for ongoing research and adaptive management practices to safeguard coastal ecosystems against evolving environmental challenges. These findings are pivotal for managing erosion and sedimentation, stressing the importance of carefully considering structure gap spacing to achieve a balance in sediment transport and deposition in coastal engineering projects. However, it is important to note that the results and conclusions of this study are tied to the specific analysed scenarios, which are linked with the local beach profile, sediment size, structure dimensions, and limited tide and wave action conditions. The main findings should be further analysed for other hydro- and morphodynamic scenarios in future work.
Optimizing gap spacing is, therefore, paramount to maximize protective benefits while minimizing adverse effects. The analysis highlights that an optimal gap spacing of 304 m balances sedimentation and erosion, supporting natural coastal sediment transport processes. However, site-specific factors such as wave climate, sediment characteristics, and coastal morphology must be carefully considered when designing effective coastal protection strategies.
The significant influence of gap spacing between semicircular structures on sedimentation and erosion patterns shows that while narrower gap spacings induce more sediment accumulation behind the structures due to wave energy dissipation, wider gaps facilitate sediment transport, leading to reduced deposition immediately behind the structures, but lower erosion further away.
Notably, the analysis reveals complex interactions between gap spacing and sediment dynamics. Narrower gap spacings tend to exacerbate sediment accumulation in the gap section, while wider spacings promote sediment transport, affecting local and downdrift erosion patterns. The observed consistent sedimentation across all profiles relative to the reference bathymetry conditions suggests an overall stabilizing effect behind and at the gap section of the structures on bed level, highlighting a positive influence in predicting structural impacts.
In conclusion, achieving an optimal balance in gap spacing between coastal structures is essential for effective coastal protection strategies. This requires a comprehensive understanding of the intricate interplay between structural design, hydrodynamics, and sediment transport processes, ensuring sustainable coastal management practices in dynamic coastal environments.

Author Contributions

Conceptualization, B.F.V.V. and J.L.S.P.; methodology, B.F.V.V. and J.L.S.P.; validation, B.F.V.V. and J.L.S.P.; formal analysis, B.F.V.V. and J.L.S.P.; investigation, B.F.V.V. and J.L.S.P.; resources, B.F.V.V. and J.L.S.P.; writing—original draft preparation, B.F.V.V.; writing—review and editing, B.F.V.V., J.L.S.P. and J.A.O.B.; visualization, B.F.V.V., J.L.S.P. and J.A.O.B.; supervision, J.L.S.P. and J.A.O.B. All authors have read and agreed to the published version of the manuscript.

Funding

This research was partially funded by the Portuguese Foundation for Science and Technology (FCT) through the PhD grant number SFRH/BD/141381/2018, as well as in the framework of the “Base Funding of CTAC Unit” with reference number UIDB/04047/2020.

Institutional Review Board Statement

Not applicable.

Informed Consent Statement

Not applicable.

Data Availability Statement

The original contributions presented in the study are included in the article, further inquiries can be directed to the corresponding author.

Acknowledgments

The authors acknowledge the data provided by the Portuguese Environment Agency under the Coastal Monitoring Program of Continental Portugal (COSMO), which is co-financed by the Operational Program for Sustainability and Resource Efficiency (POSEUR). These data, accessed on 13 February 2024, were invaluable to our research and can be accessed at https://cosmo.apambiente.pt. The authors also acknowledge the financial support provided by the FCT.

Conflicts of Interest

The authors declare no conflicts of interest.

References

  1. Ritphring, S.; Nidhinarangkoon, P.; Udo, K. Beach Conditions for Guiding the Sandy Beach Management in Phuket, Thailand. J. Mar. Sci. Eng. 2023, 11, 1457. [Google Scholar] [CrossRef]
  2. Micallef, A.; Williams, A. Beach Management: Principles and Practice; Earthscan: London, UK, 2009; pp. 1–445. [Google Scholar] [CrossRef]
  3. Klein, A.H.; Da Silva, G.; Taborda, R.; Da Silva, A.P.; Short, A. Headland Bypassing and Overpassing: Form, Processes and Applications; Elsevier: London, UK, 2020; pp. 557–591. ISBN 978-0-08-102927-5. [Google Scholar]
  4. Vieira, B.F.V. Engineering with Nature: An Innovative Solution for Coastal Erosion Protection. Ph.D. Thesis, University of Minho, Guimarães, Portugal, 2022. Available online: https://hdl.handle.net/1822/79723 (accessed on 1 February 2024).
  5. Wang, Y.-H.; Wang, Y.-H.; Deng, A.-J.; Feng, H.-C.; Wang, D.-W.; Guo, C.-S. Emerging Downdrift Erosion by Twin Long-Range Jetties on an Open Mesotidal Muddy Coast, China. J. Mar. Sci. Eng. 2022, 10, 570. [Google Scholar] [CrossRef]
  6. Lima, M.; Ferreira, A.M.; Coelho, C. A Cost–Benefit Approach to Assess the Physical and Economic Feasibility of Sand Bypassing Systems. J. Mar. Sci. Eng. 2023, 11, 1829. [Google Scholar] [CrossRef]
  7. Bruun, P. The Development of Downdrift Erosion. J. Coast. Res. 1995, 11, 1242–1257. [Google Scholar]
  8. Hanson, H. Genesis: A Generalized Shoreline Change Numerical Model. J. Coast. Res. 1989, 5, 1–27. [Google Scholar]
  9. Hamza, W.; Tomasicchio, G.R.; Ligorio, F.; Lusito, L.; Francone, A. A Nourishment Performance Index for Beach Erosion/Accretion at Saadiyat Island in Abu Dhabi. J. Mar. Sci. Eng. 2019, 7, 173. [Google Scholar] [CrossRef]
  10. Hanson, H.; Kraus, N. Long-Term Evolution of a Long-Term Evolution Model. J. Coast. Res. 2011, 59, 118–129. [Google Scholar]
  11. Francone, A.; Simmonds, D.J. Assessing the Reliability of a New One-Line Model for Predicting Shoreline Evolution with Impoundment Field Experiment Data. J. Mar. Sci. Eng. 2023, 11, 1037. [Google Scholar] [CrossRef]
  12. Ariza, E.; Jimenez, J.A.; Sarda, R.; Villares, M.; Pinto, J.; Fraguell, R.; Roca, E.; Marti, C.; Valdemoro, H.; Ballester, R.; et al. Proposal for an Integral Quality Index for Urban and Urbanized Beaches. Environ. Manag. 2010, 45, 998–1013. [Google Scholar] [CrossRef]
  13. Pinto, C.A.; Silveira, T.; Teixeira, S. Beach Nourishment Practice in Mainland Portugal (1950–2017): Overview and Retrospective. Ocean Coast. Manag. 2020, 192, 105211. [Google Scholar] [CrossRef]
  14. Woodruff, J.D.; Irish, J.L.; Camargo, S.J. Coastal Flooding by Tropical Cyclones and Sea-Level Rise. Nature 2013, 504, 44–52. [Google Scholar] [CrossRef] [PubMed]
  15. Cooper, J.A.G.; Masselink, G.; Coco, G.; Short, A.D.; Castelle, B.; Rogers, K.; Anthony, E.; Green, A.N.; Kelley, J.T.; Pilkey, O.H.; et al. Sandy Beaches Can Survive Sea-Level Rise. Nat. Clim. Chang. 2020, 10, 993–995. [Google Scholar] [CrossRef]
  16. Barnard, P.L.; Short, A.D.; Harley, M.D.; Splinter, K.D.; Vitousek, S.; Turner, I.L.; Allan, J.; Banno, M.; Bryan, K.R.; Doria, A.; et al. Coastal Vulnerability across the Pacific Dominated by El Niño/Southern Oscillation. Nat. Geosci. 2015, 8, 801–807. [Google Scholar] [CrossRef]
  17. Reguero, B.G.; Losada, I.J.; Méndez, F.J. A Recent Increase in Global Wave Power as a Consequence of Oceanic Warming. Nat. Commun. 2019, 10, 205. [Google Scholar] [CrossRef]
  18. Deltares about XBeach. Available online: https://www.deltares.nl/en/software-and-data/products/xbeach (accessed on 14 June 2023).
  19. APA COSMO Programme. Available online: https://cosmo.apambiente.pt (accessed on 13 February 2024).
  20. Vieira, B.F.V.; Pinho, J.L.S.; Barros, J.A.O. Extreme Wave Value Analysis under Uncertainty of Climate Change Scenarios off Iberian Peninsula Coast. Ocean Eng. 2021, 229, 109018. [Google Scholar] [CrossRef]
  21. Vieira, B.F.V.; Pinho, J.L.S.; Barros, J.A.O.; Antunes do Carmo, J.S. Hydrodynamics and Morphodynamics Performance Assessment of Three Coastal Protection Structures. J. Mar. Sci. Eng. 2020, 8, 175. [Google Scholar] [CrossRef]
  22. Cohn, N.; Ruggiero, P.; García-Medina, G.; Anderson, D.; Serafin, K.A.; Biel, R. Environmental and Morphologic Controls on Wave-Induced Dune Response. Geomorphology 2019, 329, 108–128. [Google Scholar] [CrossRef]
  23. Elsayed, S.M.; Oumeraci, H. Modelling and Mitigation of Storm-Induced Saltwater Intrusion: Improvement of the Resilience of Coastal Aquifers against Marine Floods by Subsurface Drainage. Environ. Model. Softw. 2018, 100, 252–277. [Google Scholar] [CrossRef]
  24. Jamous, M.; Marsooli, R.; Ayyad, M. Global Sensitivity and Uncertainty Analysis of a Coastal Morphodynamic Model Using Polynomial Chaos Expansions. Environ. Model. Softw. 2023, 160, 105611. [Google Scholar] [CrossRef]
  25. Simmons, J.A.; Splinter, K.D. A Multi-Model Ensemble Approach to Coastal Storm Erosion Prediction. Environ. Model. Softw. 2022, 150, 105356. [Google Scholar] [CrossRef]
  26. ESRI ArcGIS. Available online: https://www.esri.com/en-us/arcgis/about-arcgis/overview (accessed on 13 February 2024).
  27. DEFRA. Department for Environment Food and Rural Affairs—Guidance for Outline Design of Nearshore Detached Breakwaters on Sandy Macro-Tidal Coasts; Environment Agency: Bristol, UK, 2010. [Google Scholar]
  28. Vieira, B.F.V. Wave Hydrodynamics in Coastal Stretches Influenced by Detached Breakwaters. Master’s Thesis, University of Minho, Guimarães, Portugal, 2014. Available online: http://hdl.handle.net/1822/36113 (accessed on 1 February 2024).
  29. Bosboom, J.; Stive, M.J.F. Coastal Dynamics; TU Delft Open: Delft, The Netherlands, 2022; ISBN 978-94-6366-371-7. [Google Scholar]
Figure 1. Groin located at Castelo de Trancoso beach in Gafanha da Encarnação, Aveiro, Portugal.
Jmse 12 00850 g001
Figure 2. Comparative profile of the groins along with the respective bathymetries.
Jmse 12 00850 g002
Figure 3. Significant wave height results for: (a) S0; (b) S_304; (c) S_261; and (d) S_152.
Jmse 12 00850 g003
Figure 4. Variation in significant wave heights and wave breaking along the slope of the semicircular north structure (left) and at the gap (right) for all scenarios.
Jmse 12 00850 g004
Figure 5. Wave energy results for: (a) S0; (b) S_304; (c) S_261; and (d) S_152.
Jmse 12 00850 g005
Figure 6. Bathymetric variations: cumulative sedimentation (green) and erosion (blue) for the real (a) and modelled (b) groins. Numerals denote sedimentation areas (1), areas with no available data (2), and erosion areas (3).
Jmse 12 00850 g006
Figure 7. Volume variation near shoreline for: (a) S_304; (b) S_261; and (c) S_152.
Jmse 12 00850 g007
Figure 8. Volume changes relative to a 152 m gap spacing.
Jmse 12 00850 g008
Figure 9. Volume changes relative to a 261 m gap spacing.
Jmse 12 00850 g009
Figure 10. Total volume variation near shoreline for all scenarios.
Jmse 12 00850 g010
Figure 11. Bed level evolution for: (a) S0; (b) S_304; (c) S_261; and (d) S_152.
Jmse 12 00850 g011
Figure 12. Comparison of the bed level profiles for all scenarios nearshore (a), and detailed view (b).
Jmse 12 00850 g012
Table 1. Semicircular innovative coastal defence structure details and characteristics.
Semicircular Innovative Coastal Defence Structure
Jmse 12 00850 i001Length: 509 m
Width: 217 m
Slope: 1:10
Max. height: 4.34 m
Crest level: 0 m
Gap spacing: 304 m; 261 m; 152 m
Distance to shoreline: 0 m
Gap spacing: 304 mGap spacing: 261 mGap spacing: 152 m
Jmse 12 00850 i002Jmse 12 00850 i003Jmse 12 00850 i004
Table 2. Gap spacing for varying shoreline erosion conditions.
Possible Shoreline Erosion in the Gaps between Nearshore Structures:Maximum Shoreline ErosionGap Spacing
Certain erosion1.4304 m
Possible erosion1.2261 m
No erosion0.7152 m
Table 3. XBeach numerical model conditions.
Parameters
Tidal level (m)0.0
Wave climate conditionHs = 4.0 m
Tp = 15.0 s
Direction = 315° (Northwest)
Wave type conditionJONSWAP spectrum
Boundary conditionsFront and back: abs_2d
Left and right: Neumann
Sediments dimension (mm)D50 = 0.2
D90 = 0.3
Morphological acceleration factor (morfac)10
Simulation time (hours)2.4
Computational domain (m) 1670   ×   3120   (cross-shore × longshore)
Grid spatial resolution (m)dx = dy = 5
Computational grid 334   × 624
Disclaimer/Publisher’s Note: The statements, opinions and data contained in all publications are solely those of the individual author(s) and contributor(s) and not of MDPI and/or the editor(s). MDPI and/or the editor(s) disclaim responsibility for any injury to people or property resulting from any ideas, methods, instructions or products referred to in the content.

