
Multidecadal Phase Changes in the Thermodynamic State of the System: Ocean–Atmosphere–Continent


Abstract
1. Introduction
2. Materials and Methods
- The results of diagnostic predictions of climate changes in the thermohaline structure of the PO northwestern region as one of the WO key areas, including the Kuroshio system [27];
- The materials from instrumental observations carried out in large-scale hydrophysical experiments “Megapolygon-87” (Pacific Ocean, 1987) [22] and “Atlantex-90” (Atlantic, 1990) [23]. One of the authors (Byshev, V.I.) directly participated as deputy head of the expedition on the research vessel (RV) “Akademik Kurchatov” (“Megapolygon-87”) and on the RV “Vityaz” (“Atlantex-90”). Some of the observational results in these experiments, for example, the negative (!) heat balance at the ocean surface in the test site area in the warm half of the year (June–September), turned out unexpected and not understood. Currently, after establishing the temporal phase variability of the contemporary climate [28], the previously obtained results became obvious: the experiment was carried out for the phase (1975–1999) of the WO thermal discharge [5]. Establishing signs of the MOHO [5] in the main thermocline layer [4] made it possible to use the features of the WO dynamics as a new approach. Since the main thermocline layer is characterized by the main current systems of the WO, a joint consideration of the two most important of them—the Kuroshio and the Gulf Stream—is of natural interest. Of particular interest were direct instrumental observations obtained during the two large hydrophysical experiments: “Megapolygon” (Kuroshio system, 1987) and “Atlantex-90” (Gulf Stream system, 1990). Both current systems were, as noted below, in the climatic regime of WO thermal discharge.
3. Results
- 1.
- In the near-surface ocean layer, a quasi-homogeneous layer is well defined from 50 to 100 m in the north to 200 m in the south. A seasonal thermocline is formed at its lower boundary.
- 2.
- Deeper than the seasonal thermocline, in a layer of 200–600 m, there is a main thermocline, which, when displaced from the south (frame 32–34° N) to the north (frame 42–44° N), rises to the surface while forming a frontal interface between the subarctic and central water structures.
- 3.
- The presence and location of the frontal section are determined by significant meridional changes in the water temperature of the upper 200 m layer, which is observed by moving from frame 42–44° N to frame 40–42° N and from the latter to the next one (38–40° N).
- 4.
- Temporal changes in the temperature field make it possible to draw attention to the disturbances on interannual (in the upper quasi-homogeneous layer) and multidecadal (in the main thermocline layer) scales.
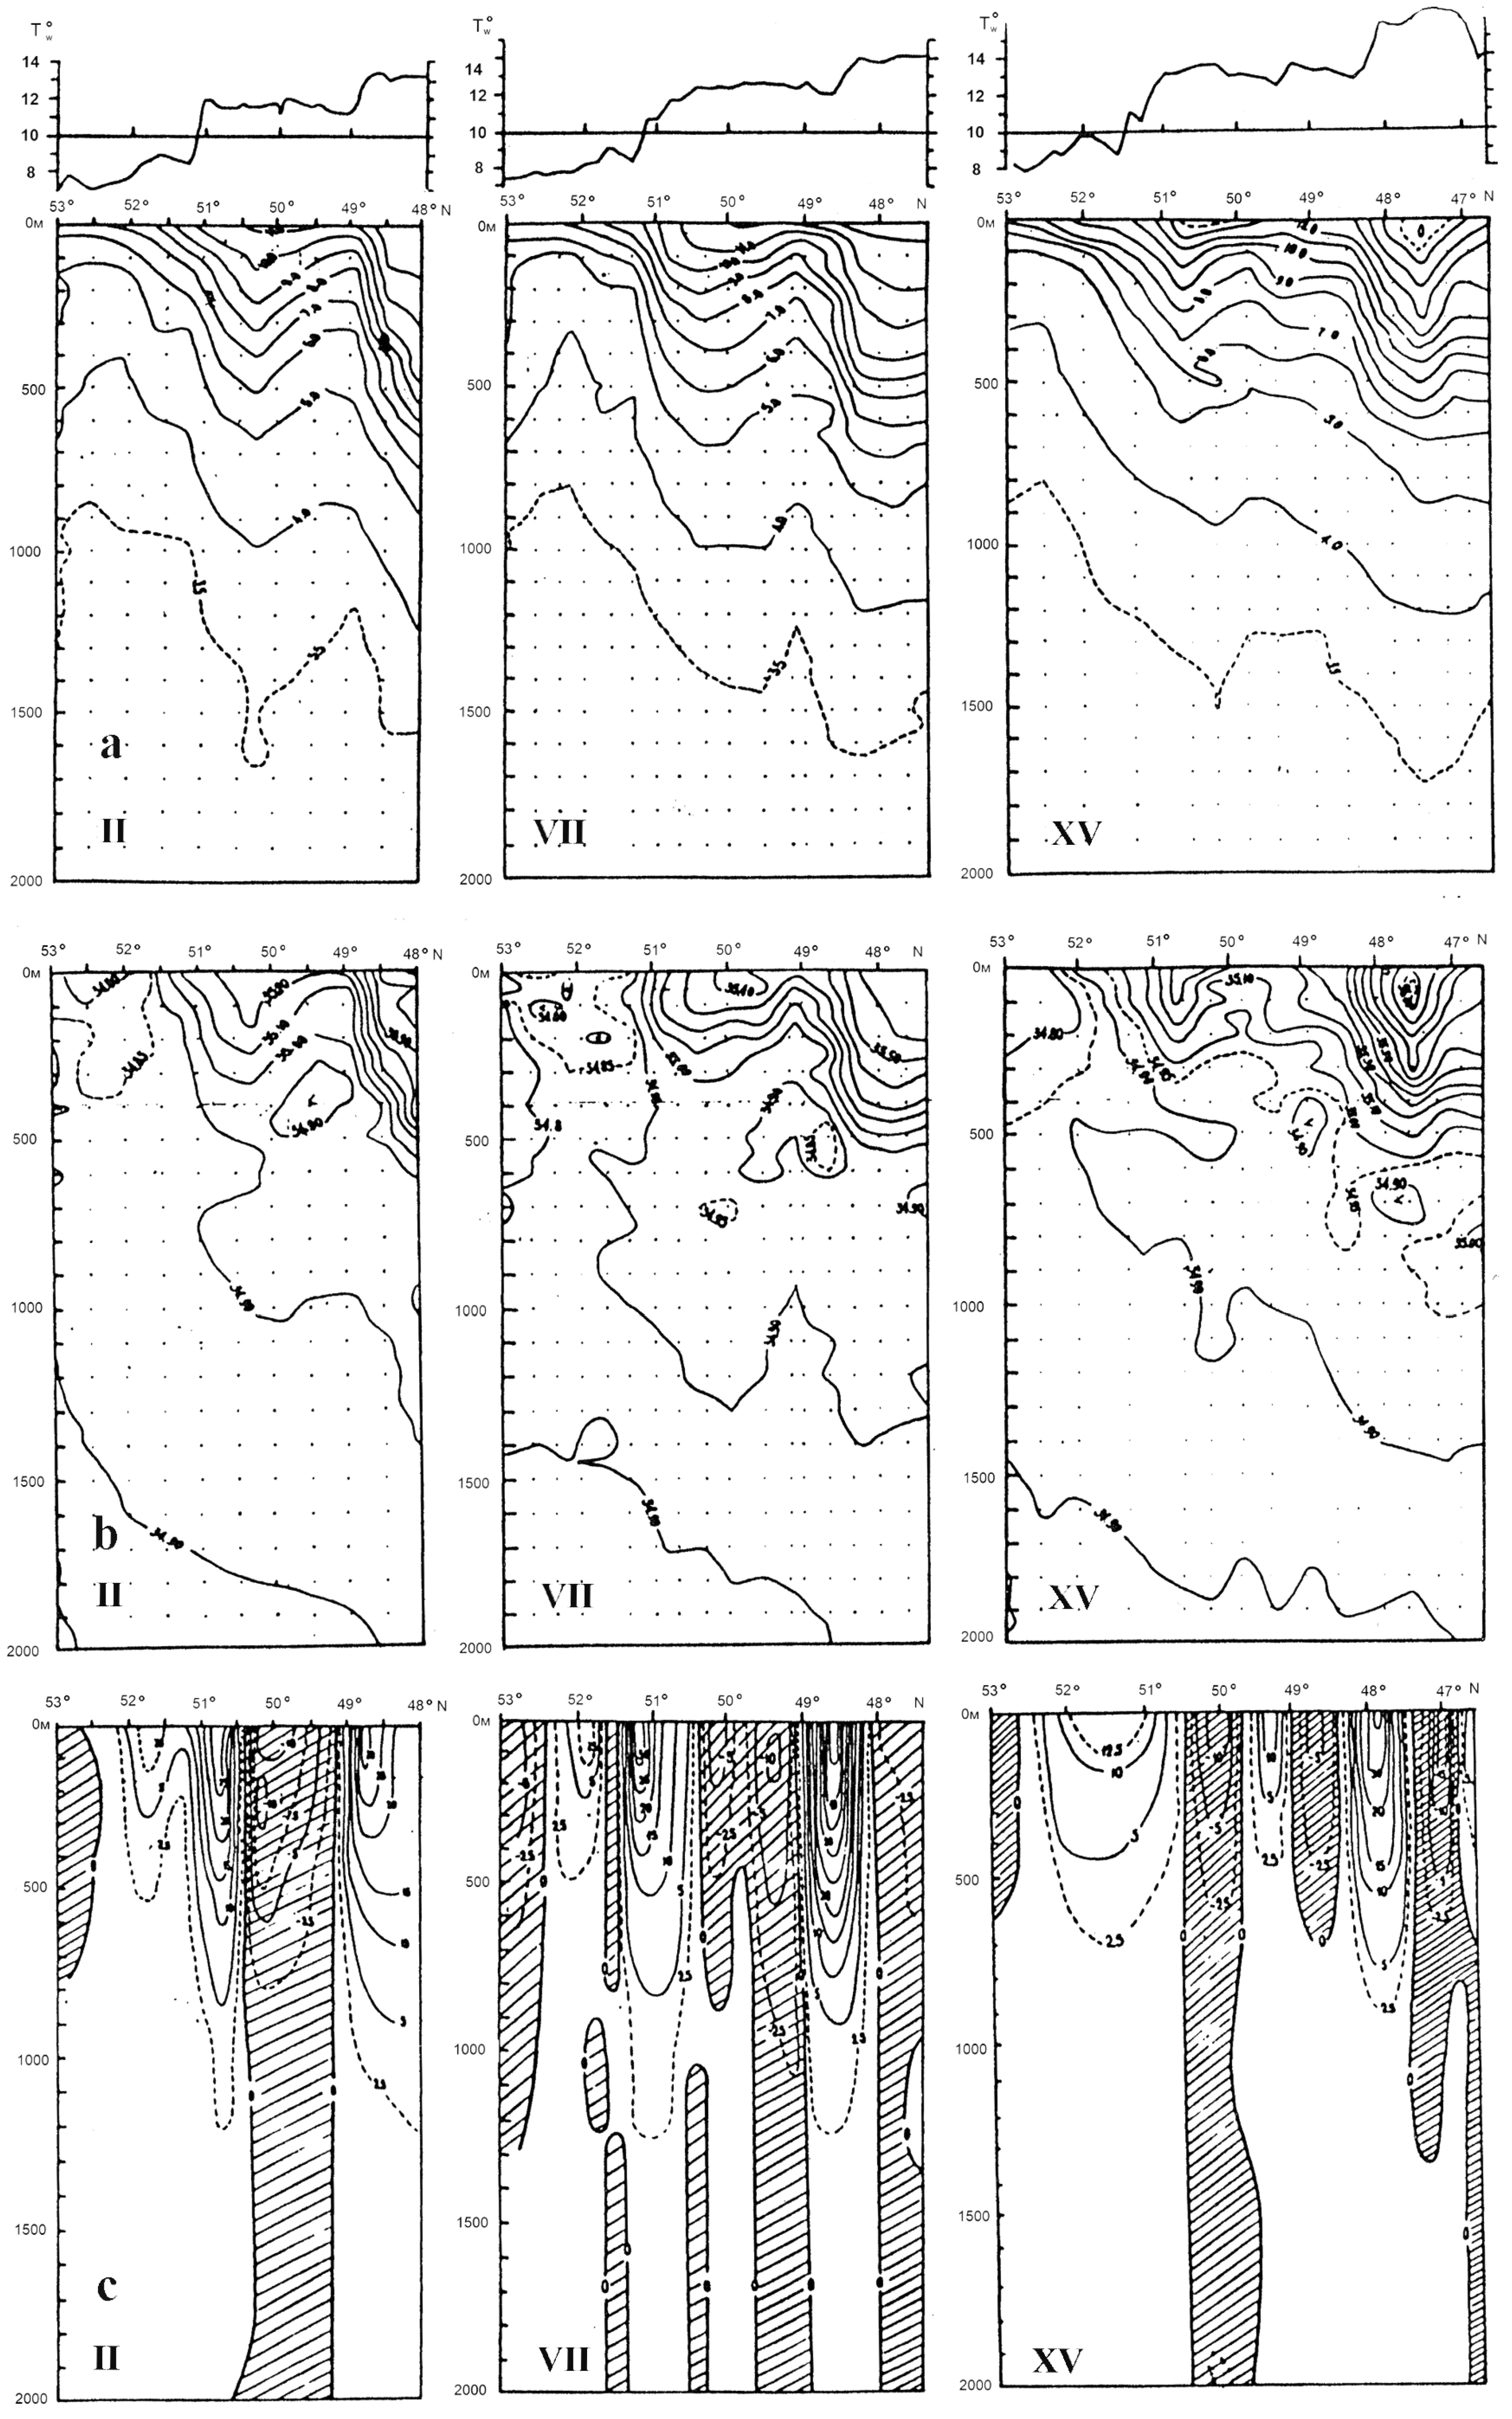
- 1.
- In the near-surface 100 m layer, there is a quasi-homogeneous layer with a seasonal thermocline at its lower boundary.
- 2.
- In the 100–800 m layer, there is a main thermocline, which rises to the ocean surface with increasing latitude (from 42° N to 50° N), forming an interface between the subarctic and central water structures. It manifests itself most expressively in the near-surface layer: in frames 48–50° N and 50–52° N (Figure 2).
- 3.
- In the area under consideration, the warm subsurface (100–300 m) layer is well expressed.
- 4.
- Temporal variability of the AUL thermal structure experiences interannual and multidecadal perturbations.
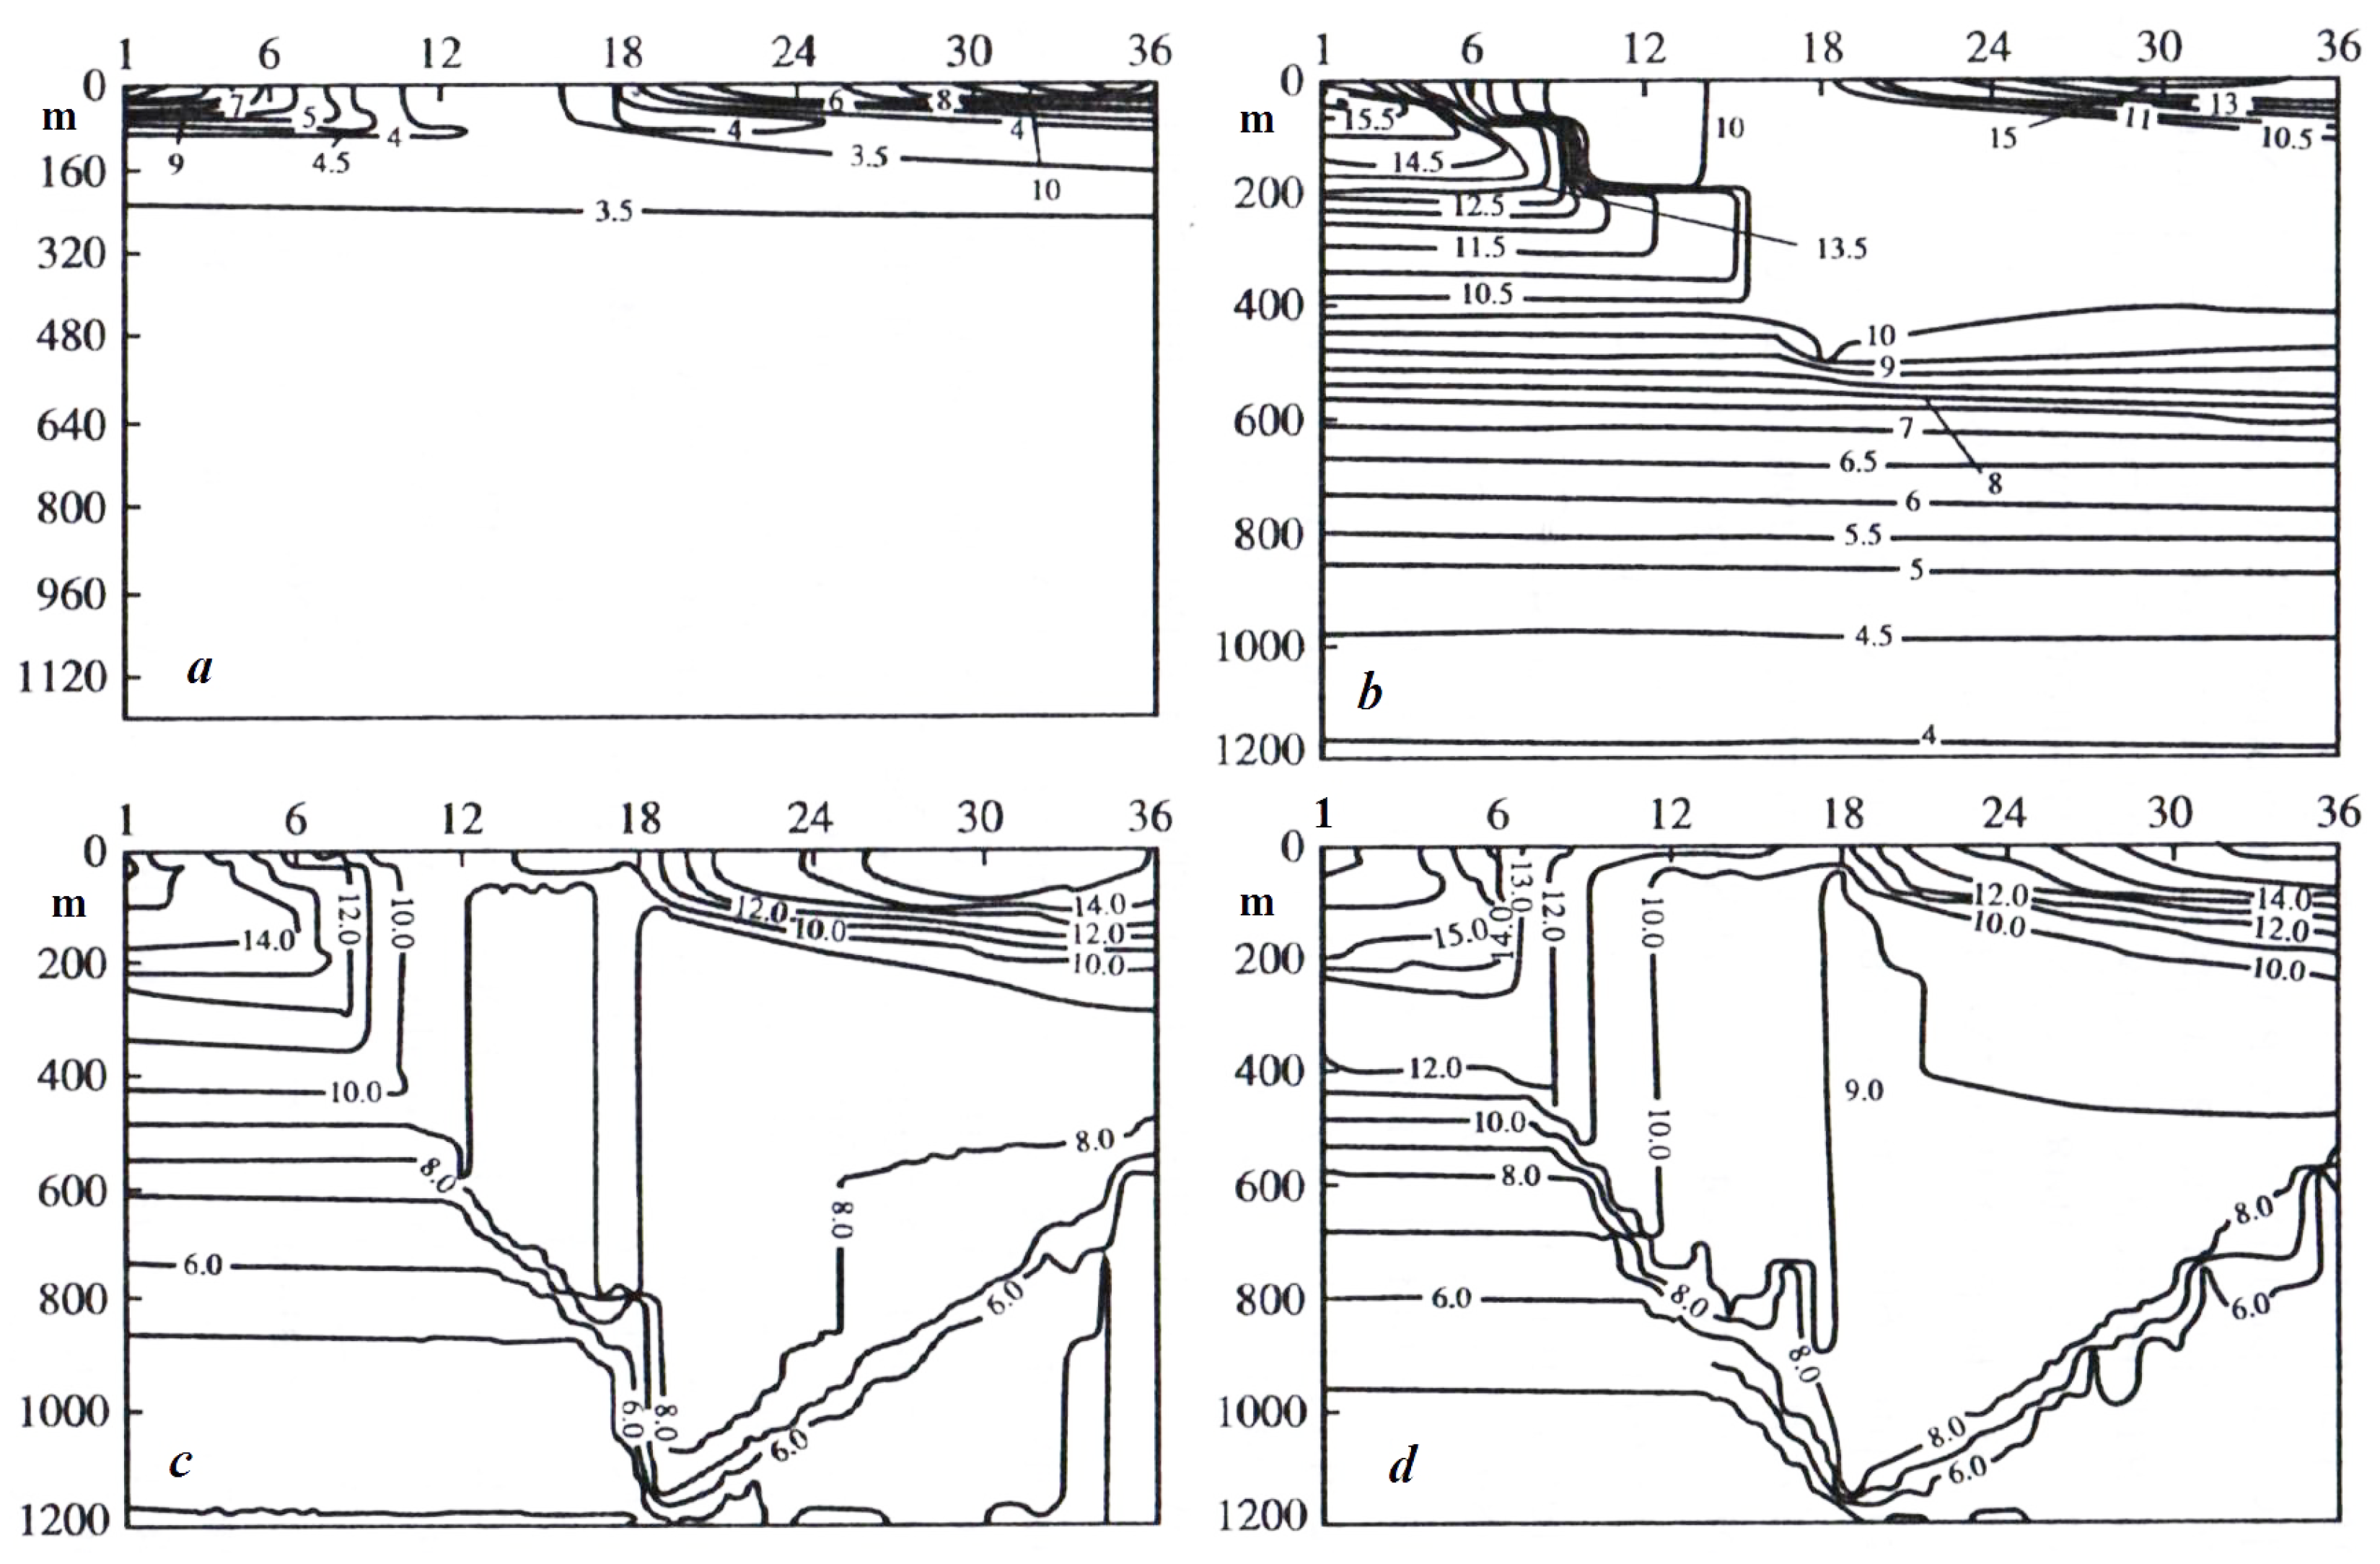
3.1. The Experiment “Megapolygon-87”
- 1.
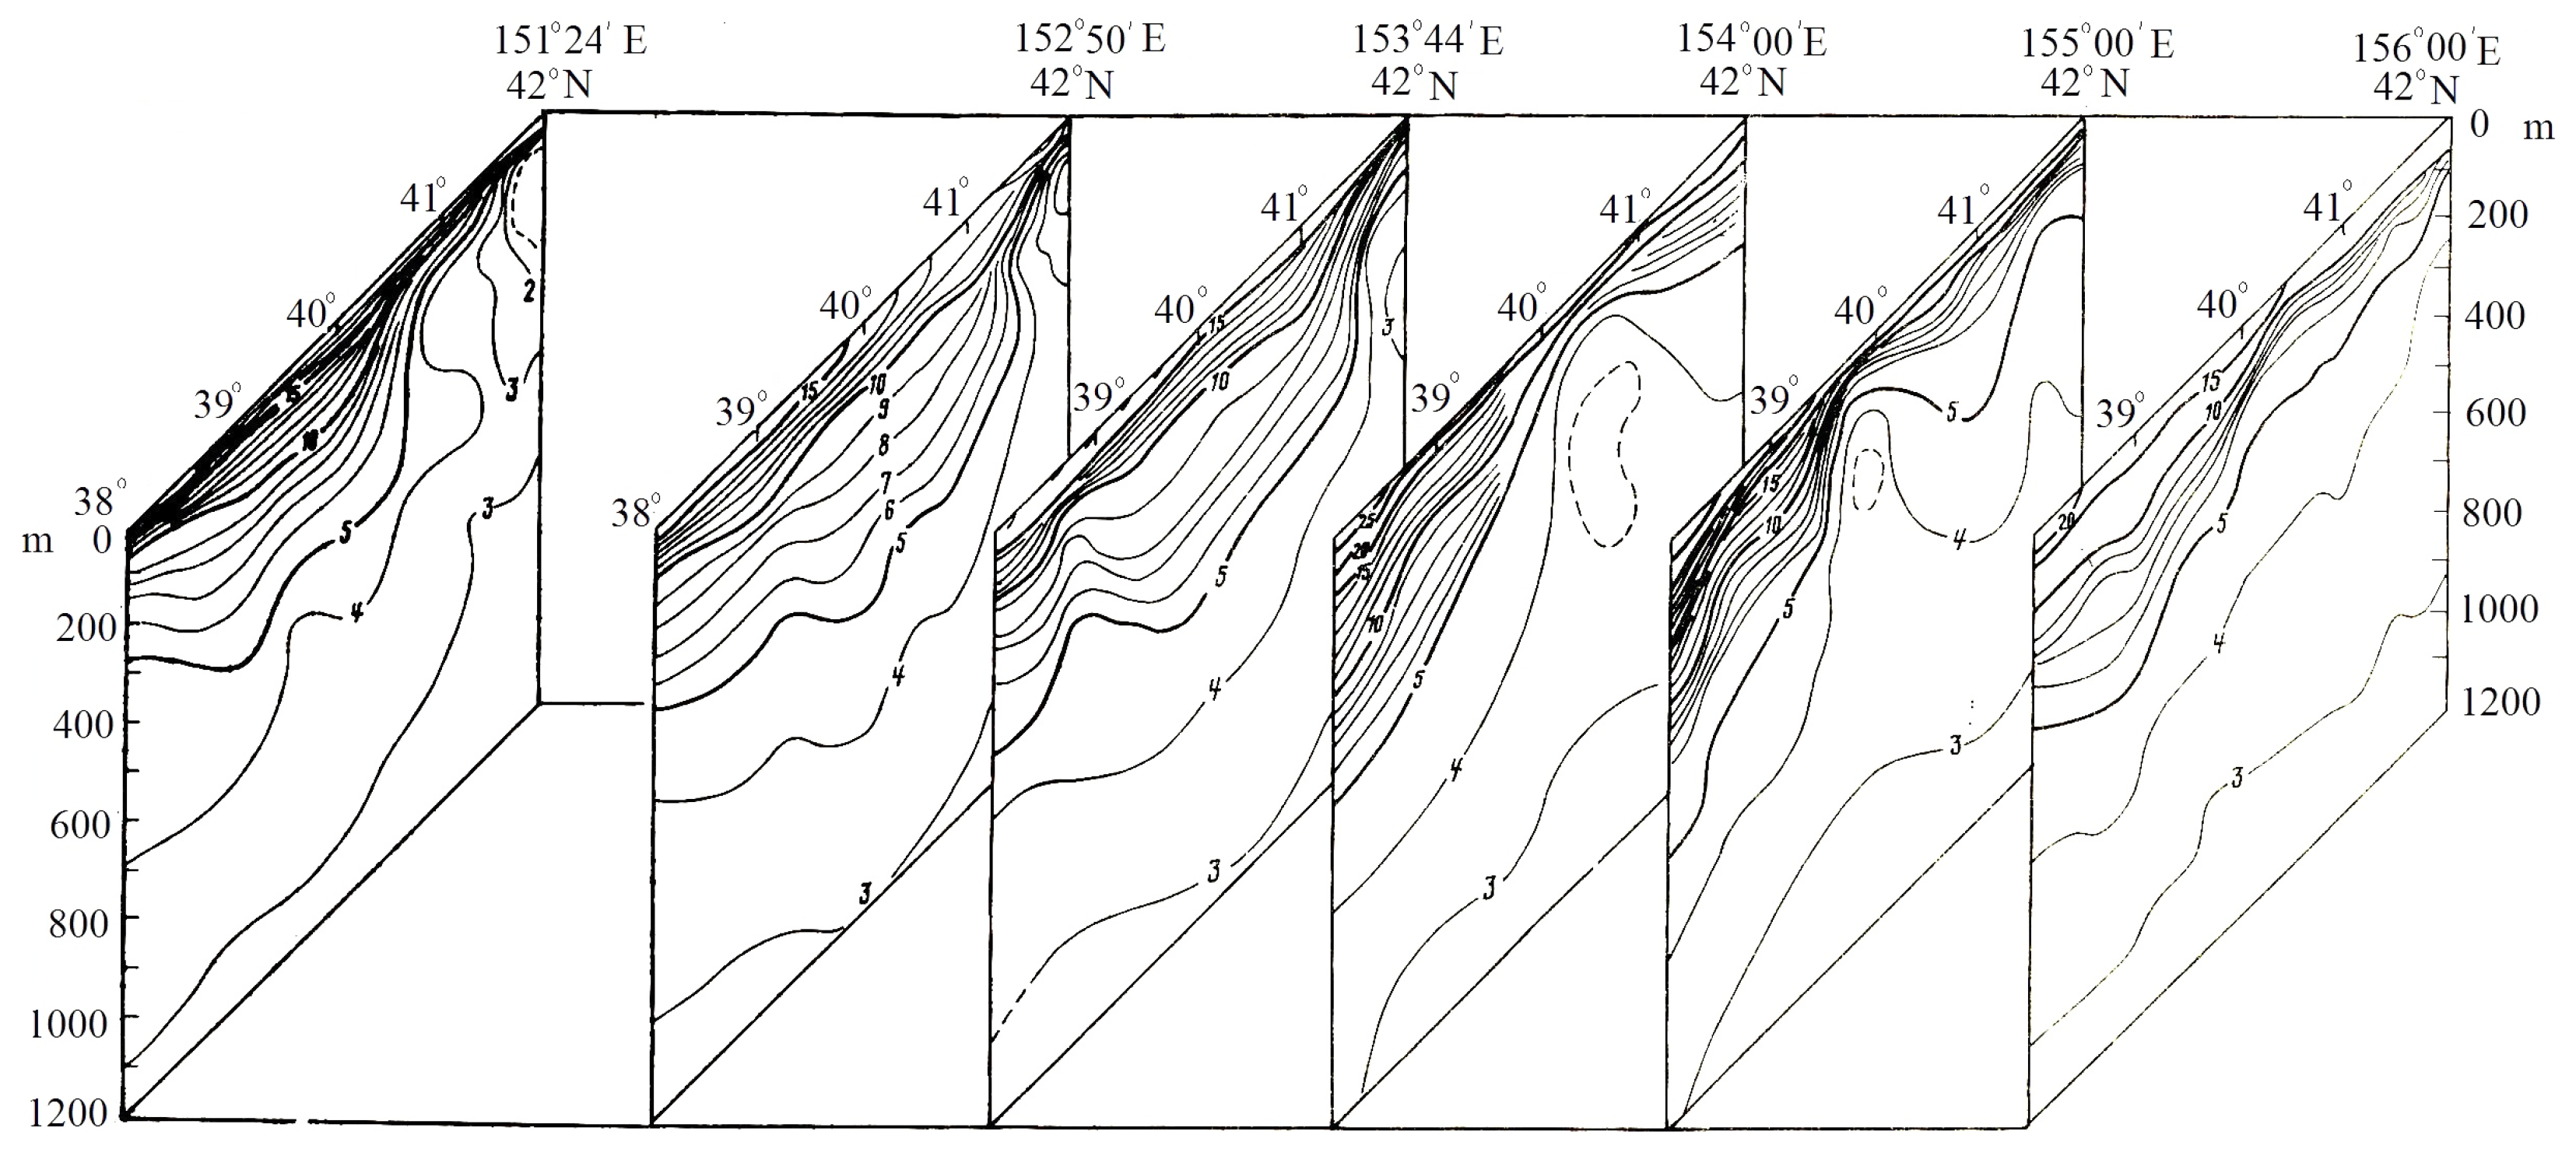
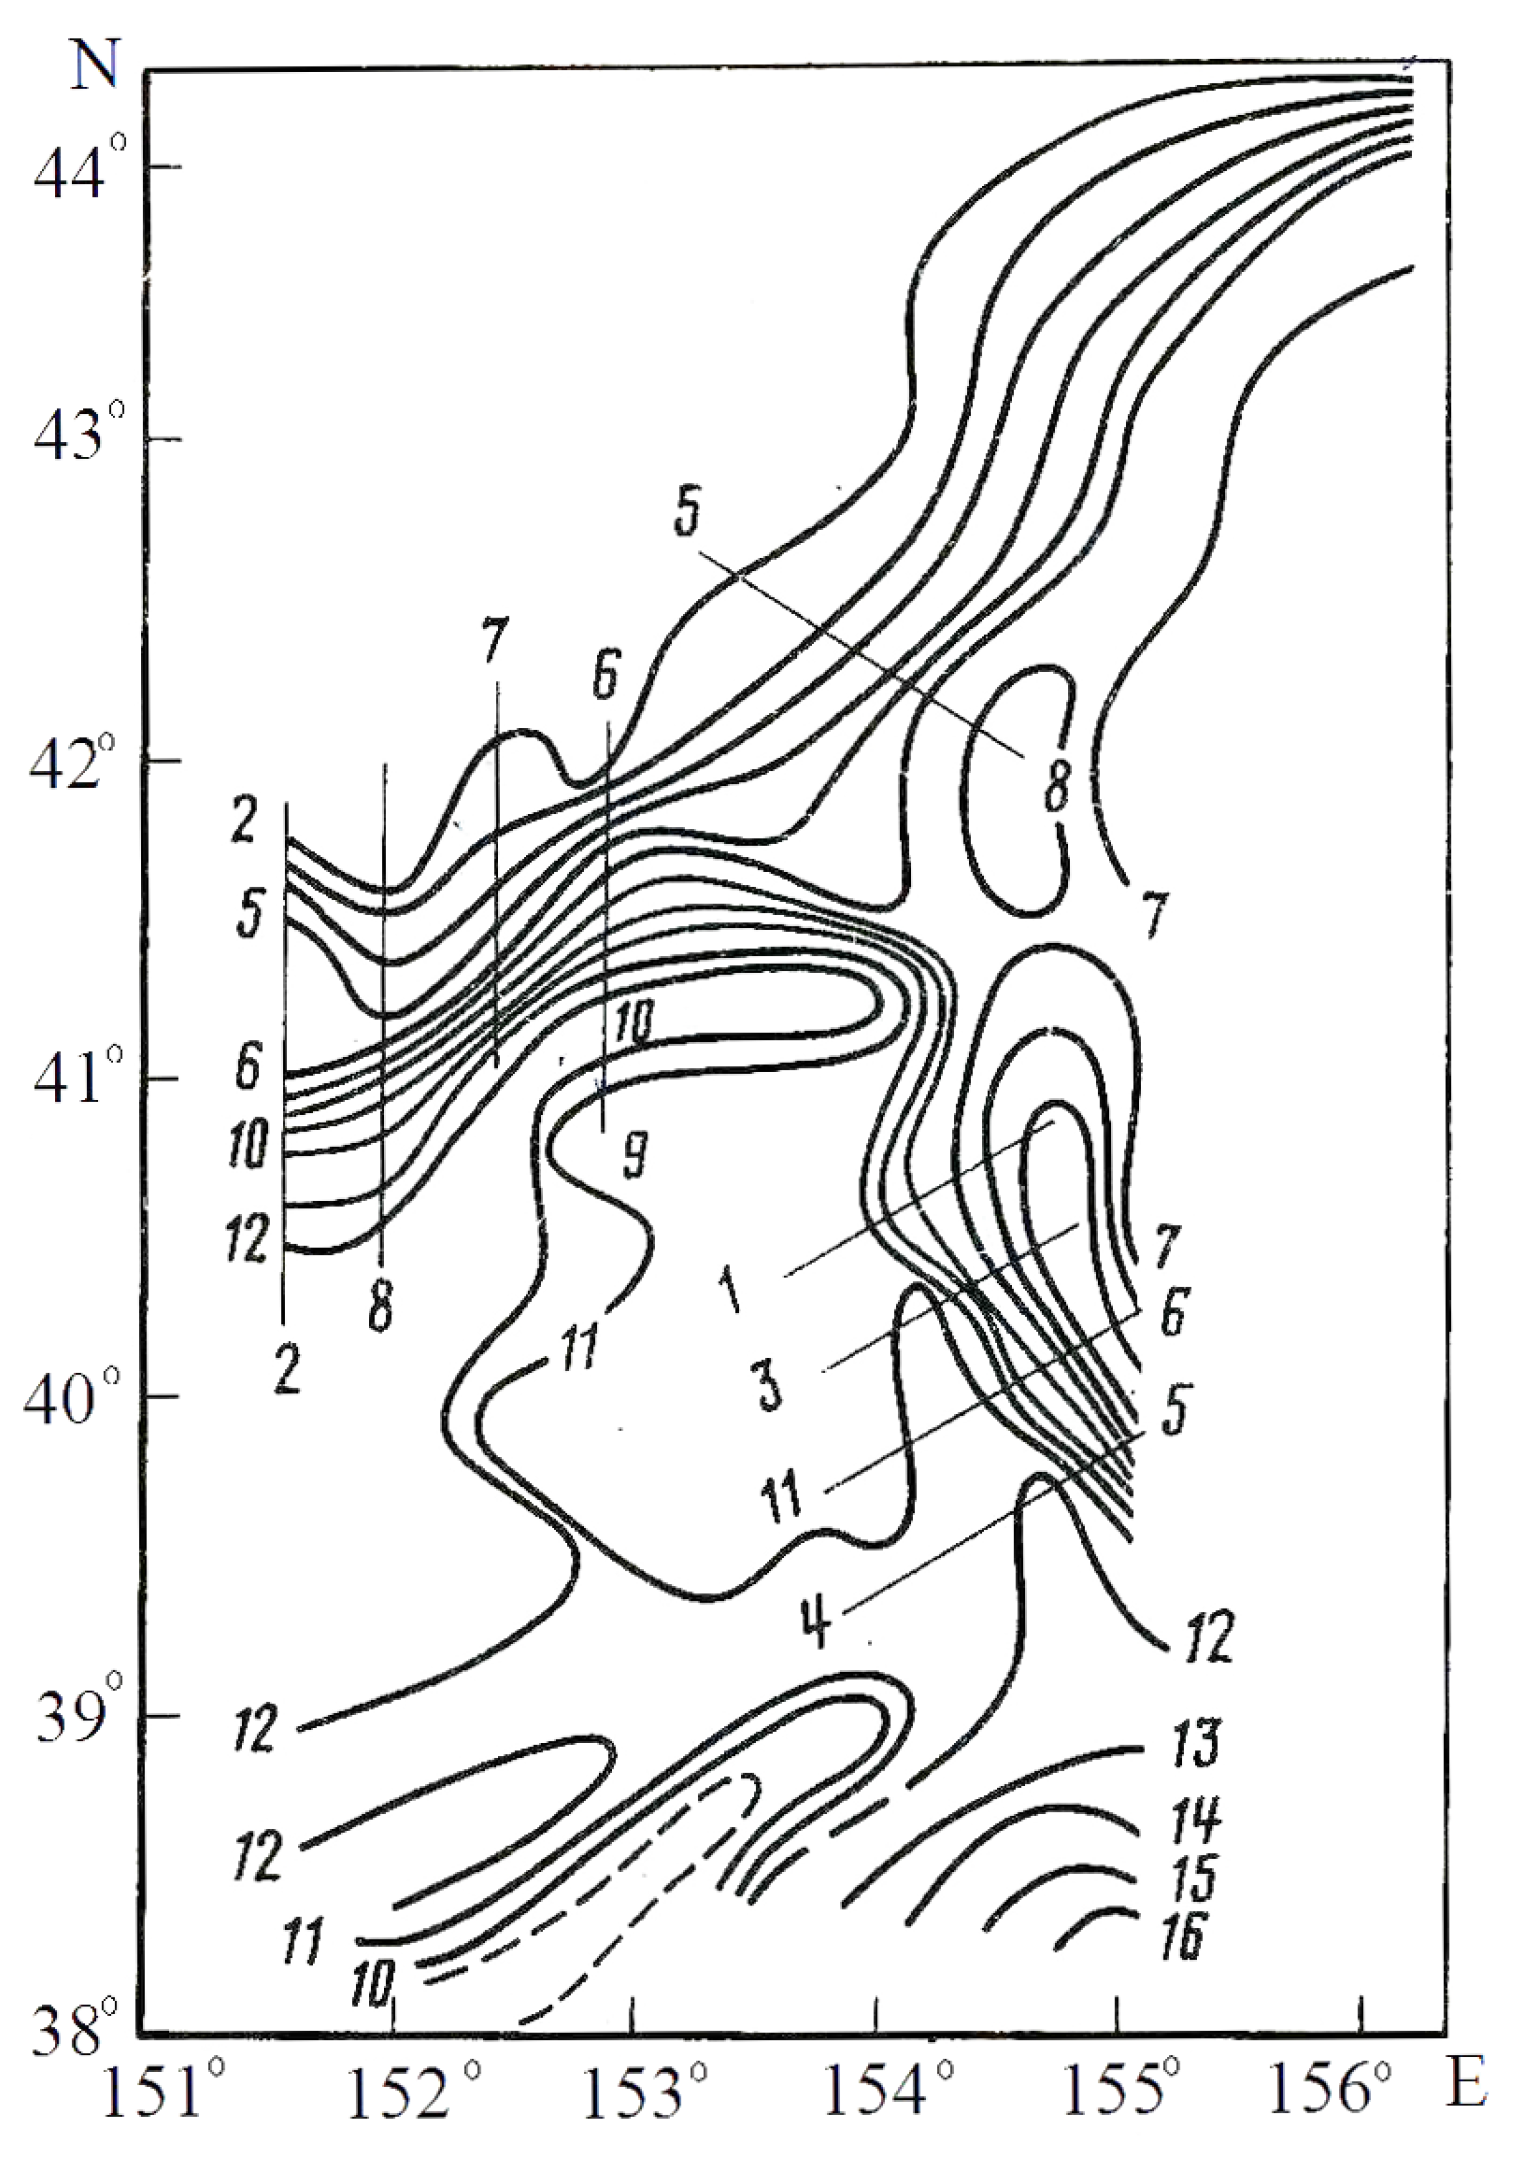
- The presence of subarctic waters (isotherm 2 °C) located in the northwestern sector of the test site. These waters enter here with the Kuril (Subarctic) Current propagating from west to east, forming a cyclonic vorticity.
- 2.
- The presence of relatively warm transformed waters of the main meander of the northern Kuroshio jet, the lower boundary of which (isotherm 5 °C) penetrates to a depth of 400–600 m. These waters constitute the main water mass of the upper 500 m layer between the 1st (151°24′ E) and 4th (154°00′ E) meridional sections, and its central part is located between the 2nd (152°50′ E) and 3rd (153°44′ E) sections. The dynamics of these waters have an anticyclonic vorticity: their northern boundary from the first to the second section shifts to the north, and then, from the third to the fourth sections, it shifts to the south.
- 3.
- The result of the interaction between the cold Kuril (Subarctic) Current and the transformed waters of the northern Kuroshio jet is a hydrological front that has a two-level structure, one of which lies within the upper 200 m layer and is formed by the southern border of the Kuril (Subarctic) Current, while the second one, deepening to 300–400 m, is formed by the northern boundary of the northern Kuroshio jet transformed waters.
- 4.
- Meridional sections 4 (154°00′ E) and 5 (155°00′ E) cross a cold cyclonic formation that moves eastward and transports a subarctic water structure.
- 5.
- In the southern part of the test site (between 38 and 39° N), waters are found whose surface temperature is 24–25 °C and higher. Their appearance is obviously due to the meandering of the main Kuroshio jet.
- 6.
- The upper quasi-homogeneous layer, below which the seasonal thermocline is located, is quite thin and ranges between 10 and 15 m in the north to 30 m or more in the south.
- 7.
- The main thermocline lies in a layer of 150–400 m between 35 and 40° N and, in the northward direction, it rises to the surface of 41–42° N (sections 151°24′ E, 152°50′ E, 153°44′ E) and merges with the seasonal thermocline.
- 1.
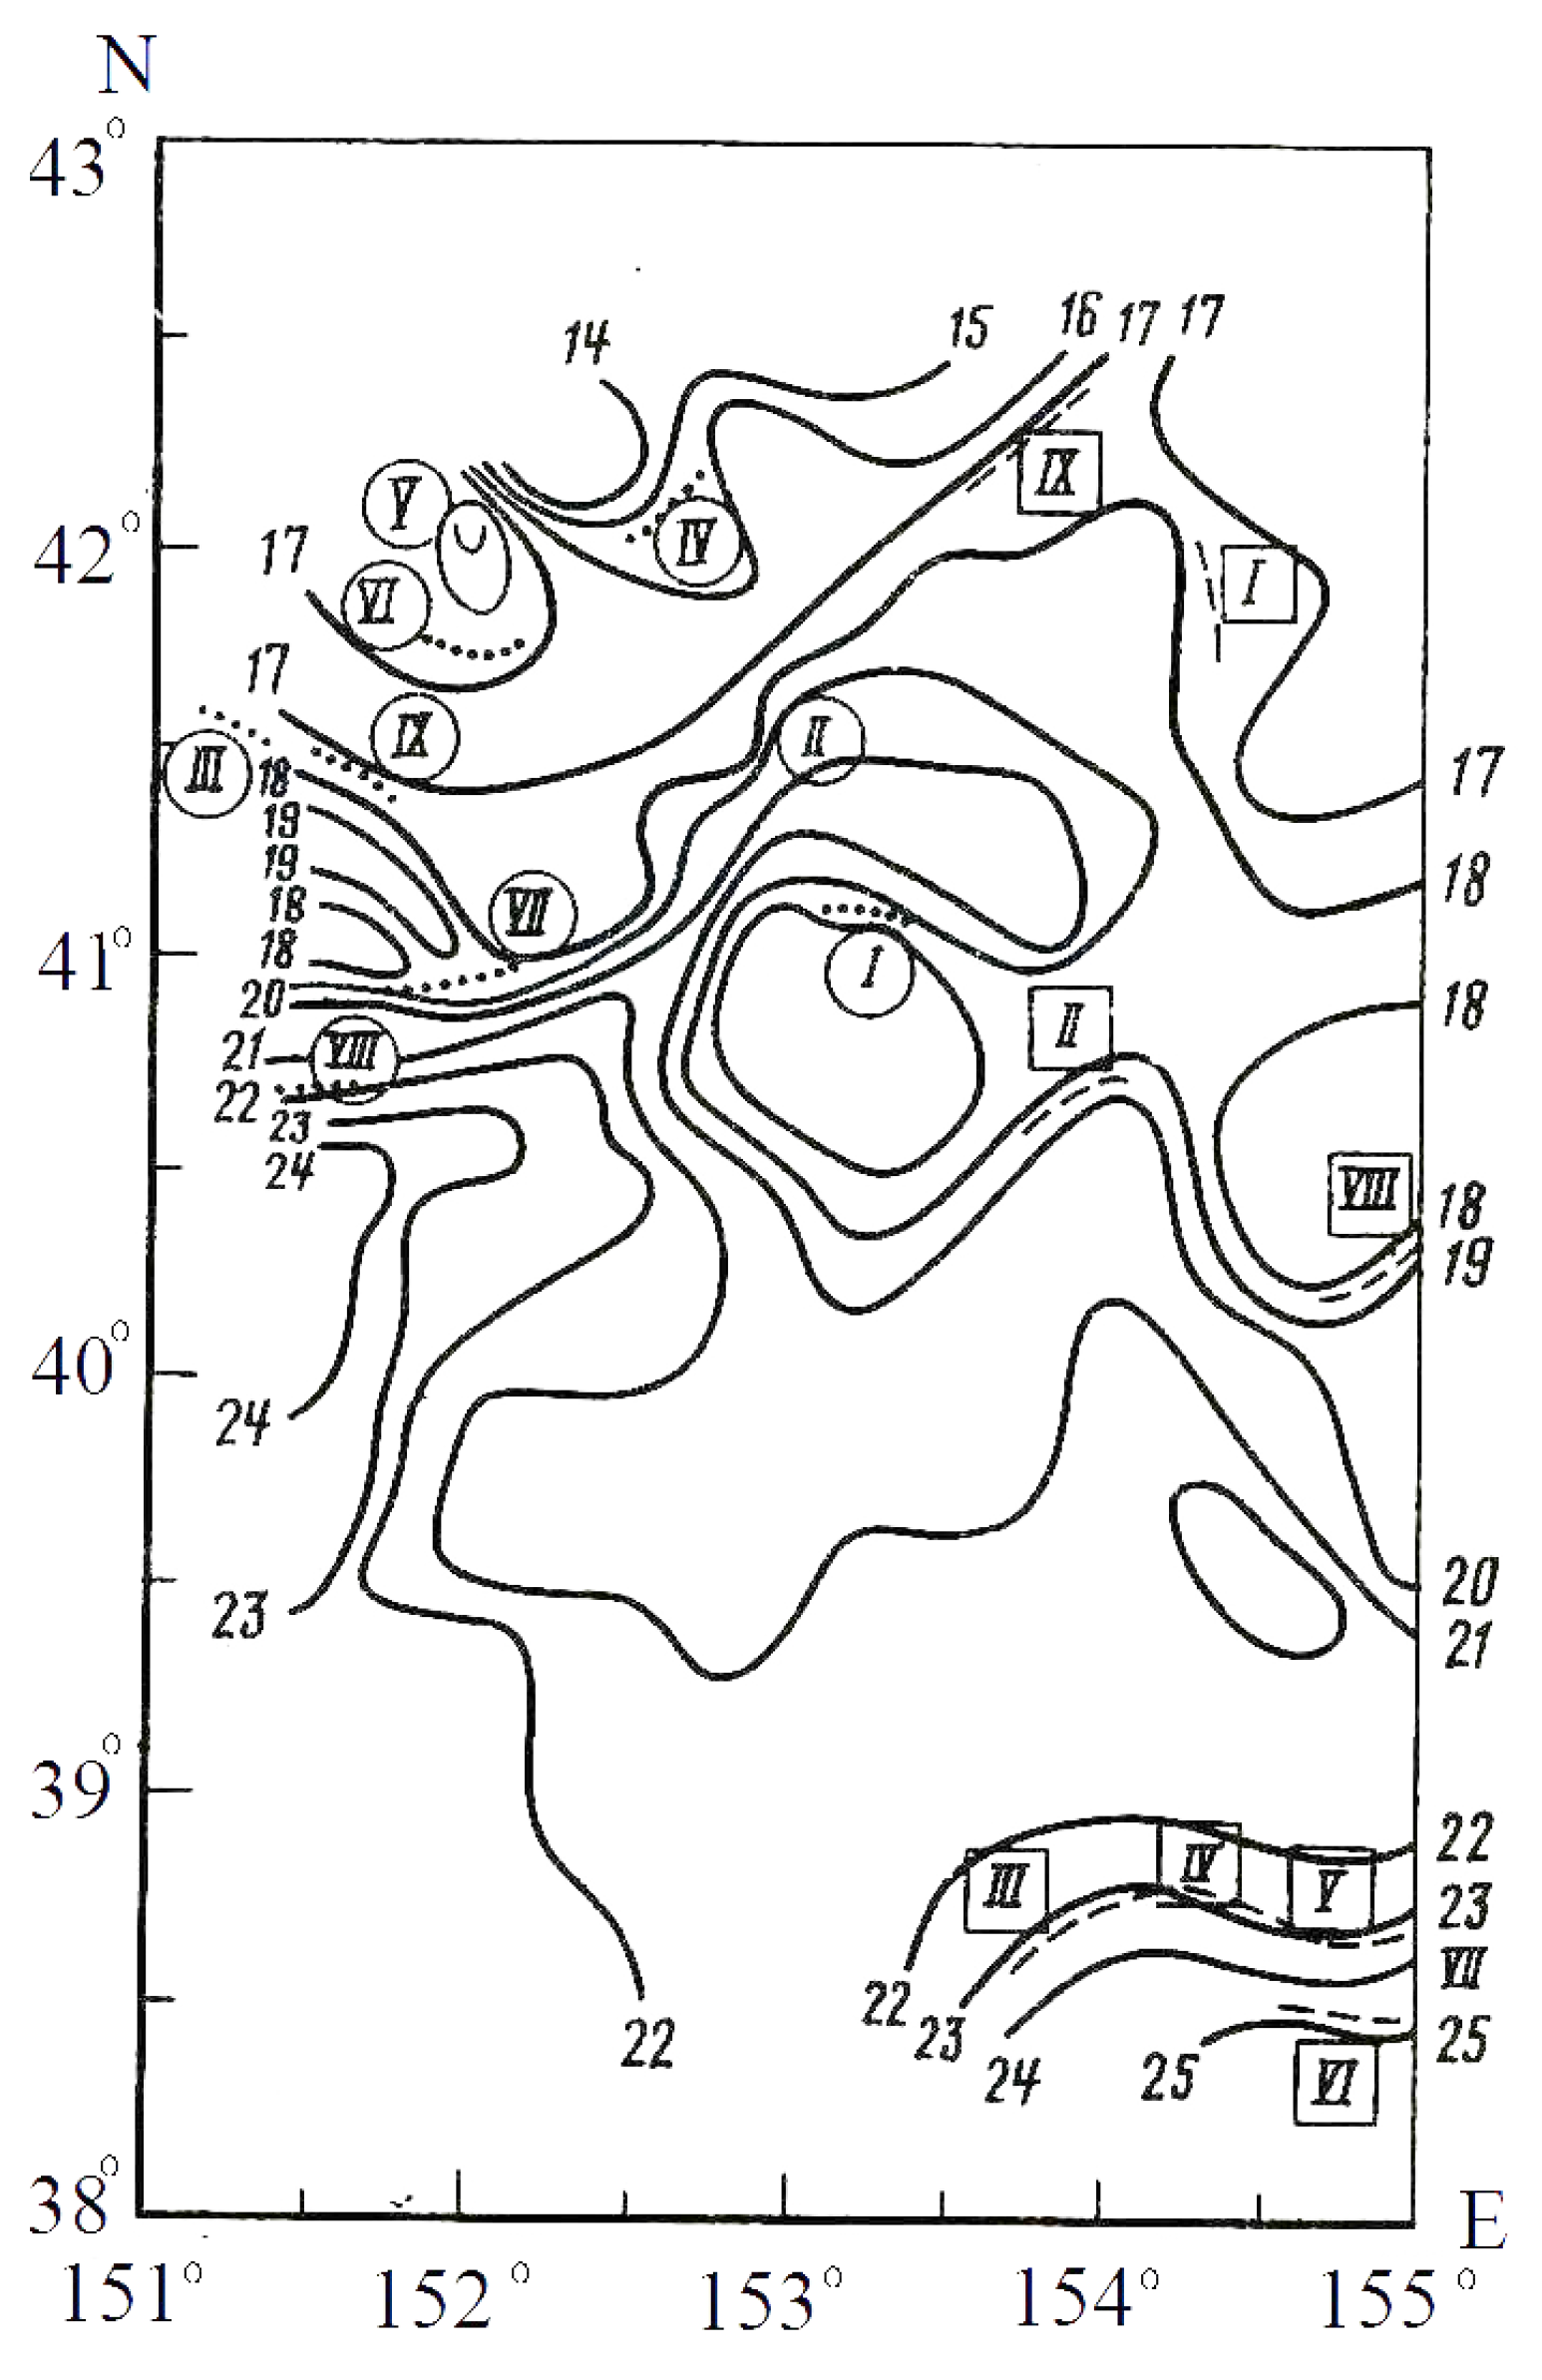
- The temporal variability of 20 °C isotherm is significant even over 3 days.
- 2.
- There are areas on the frontal line where its transverse disturbances range from one to several degrees of latitude.
- 3.
- Nodal points are identified on the frontal line at which the lateral variability is insignificant (less than 20 min of latitude).
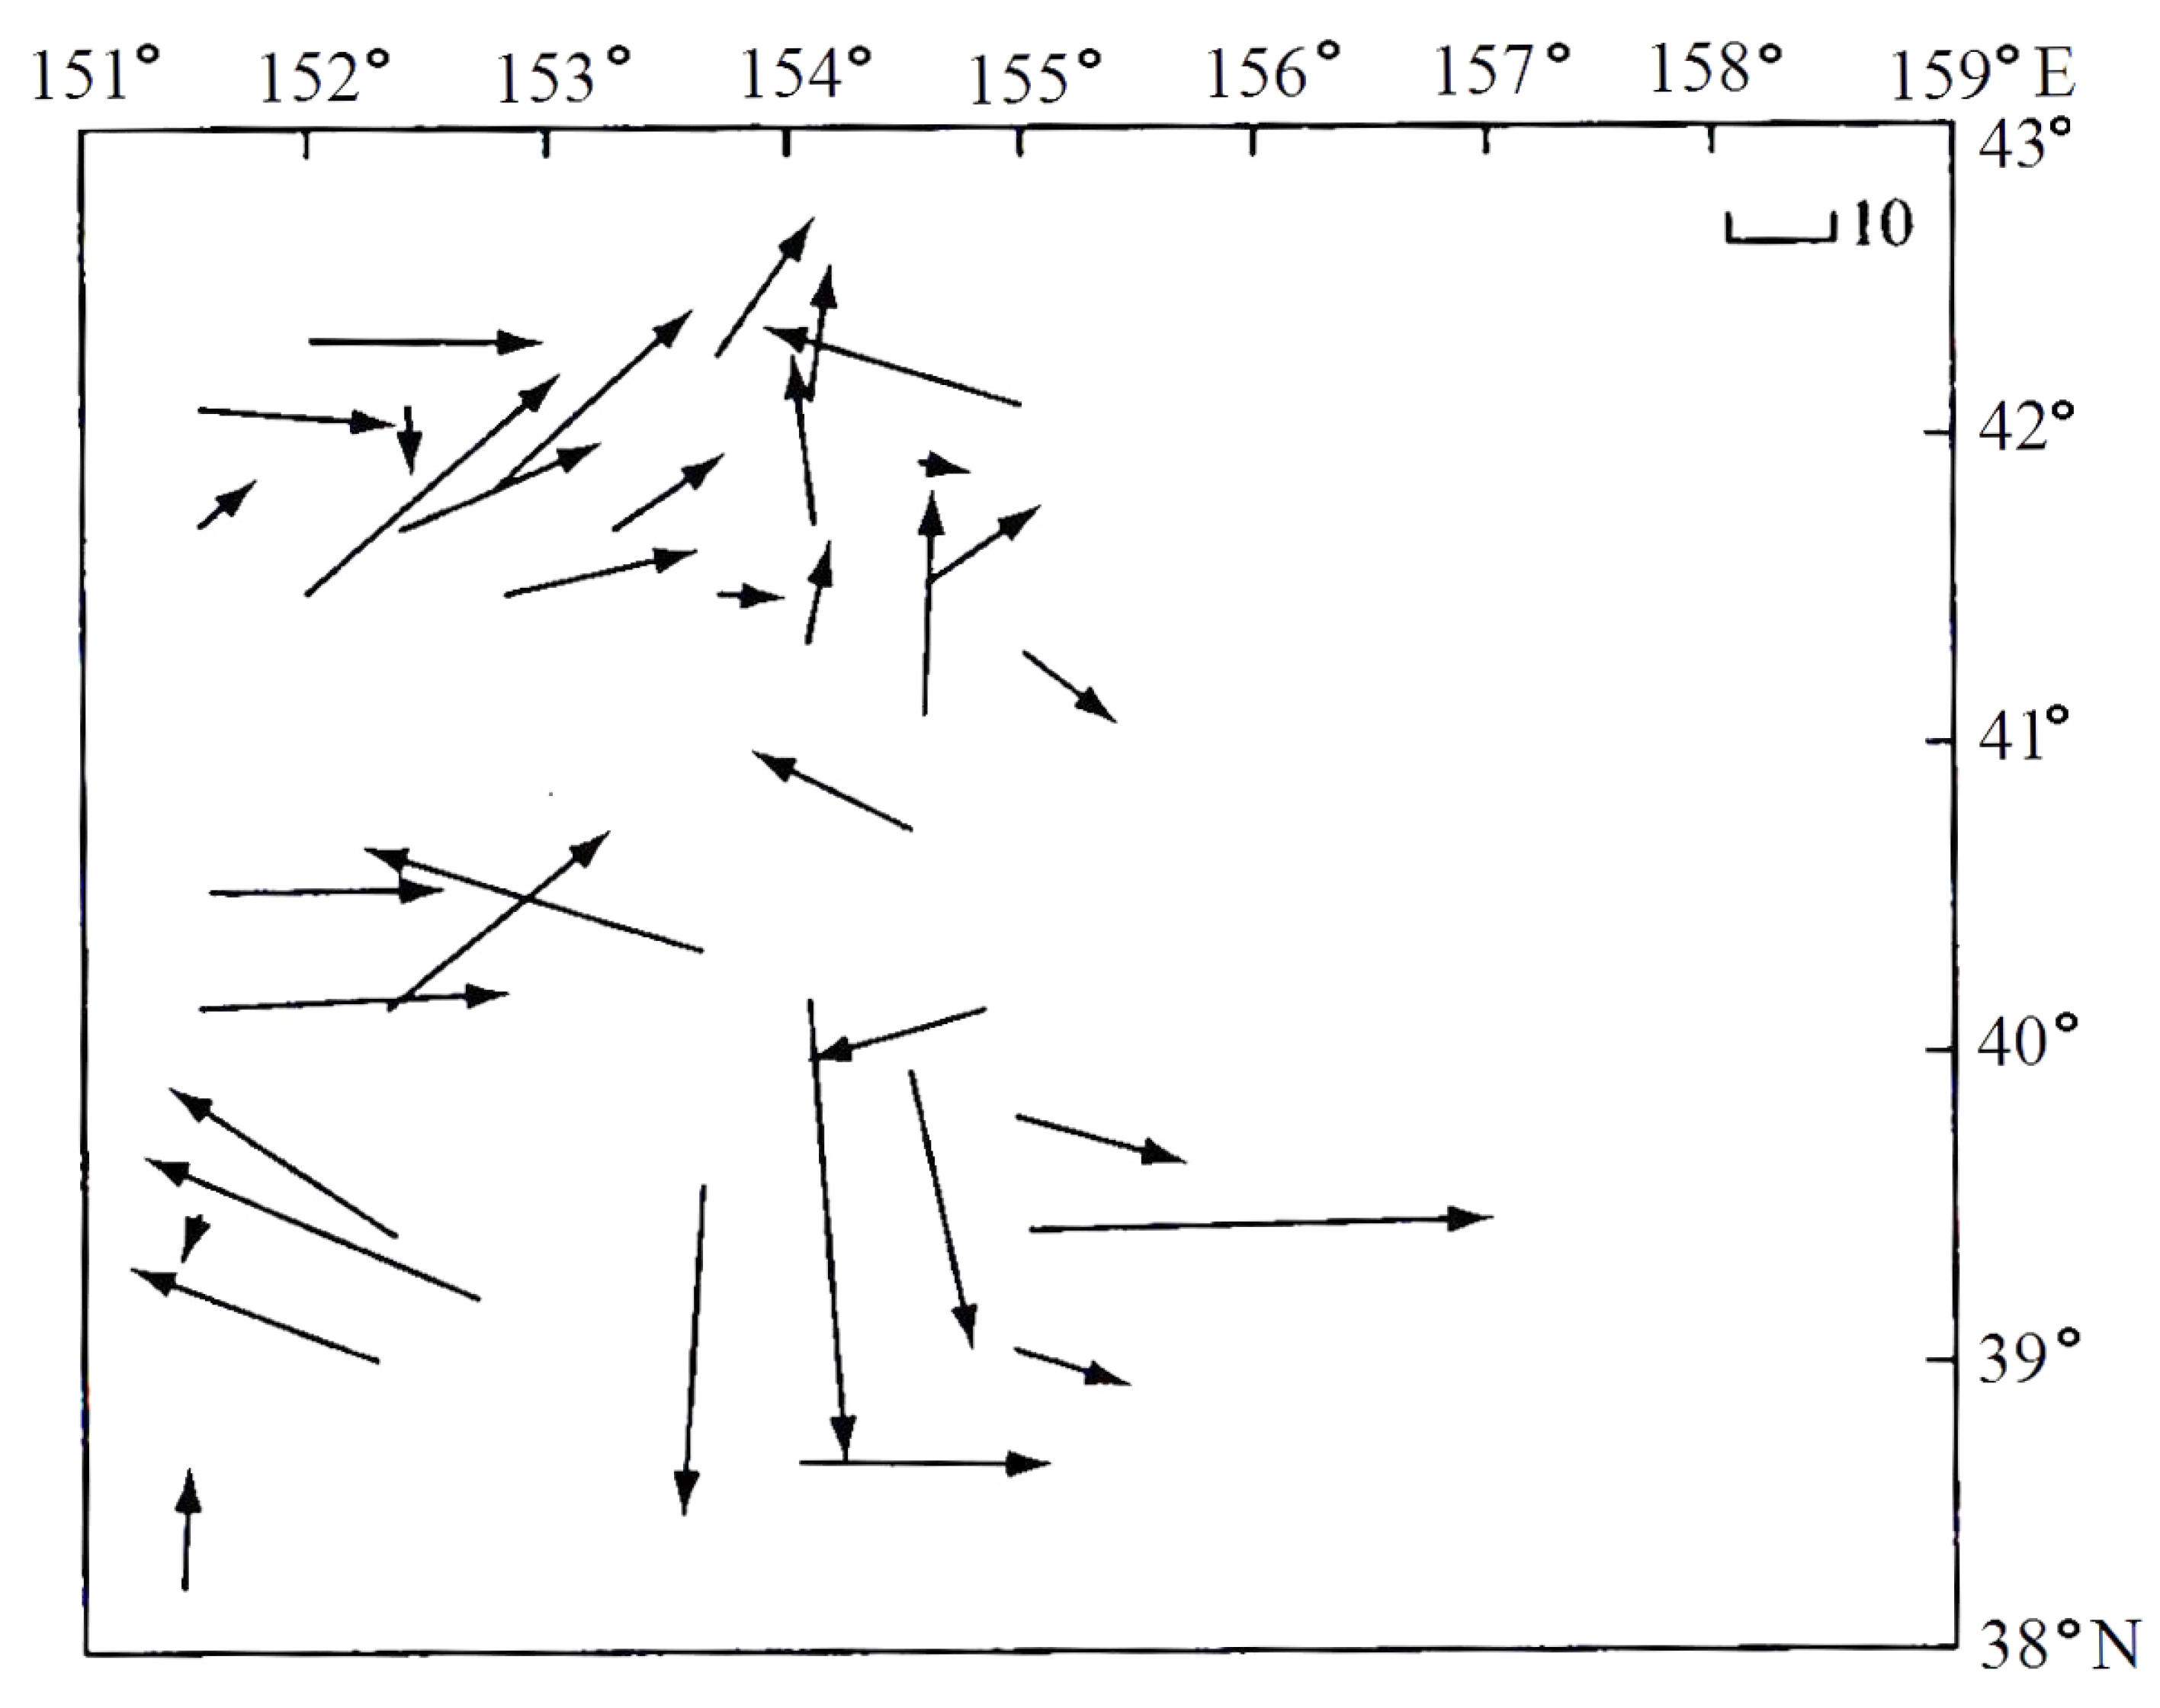
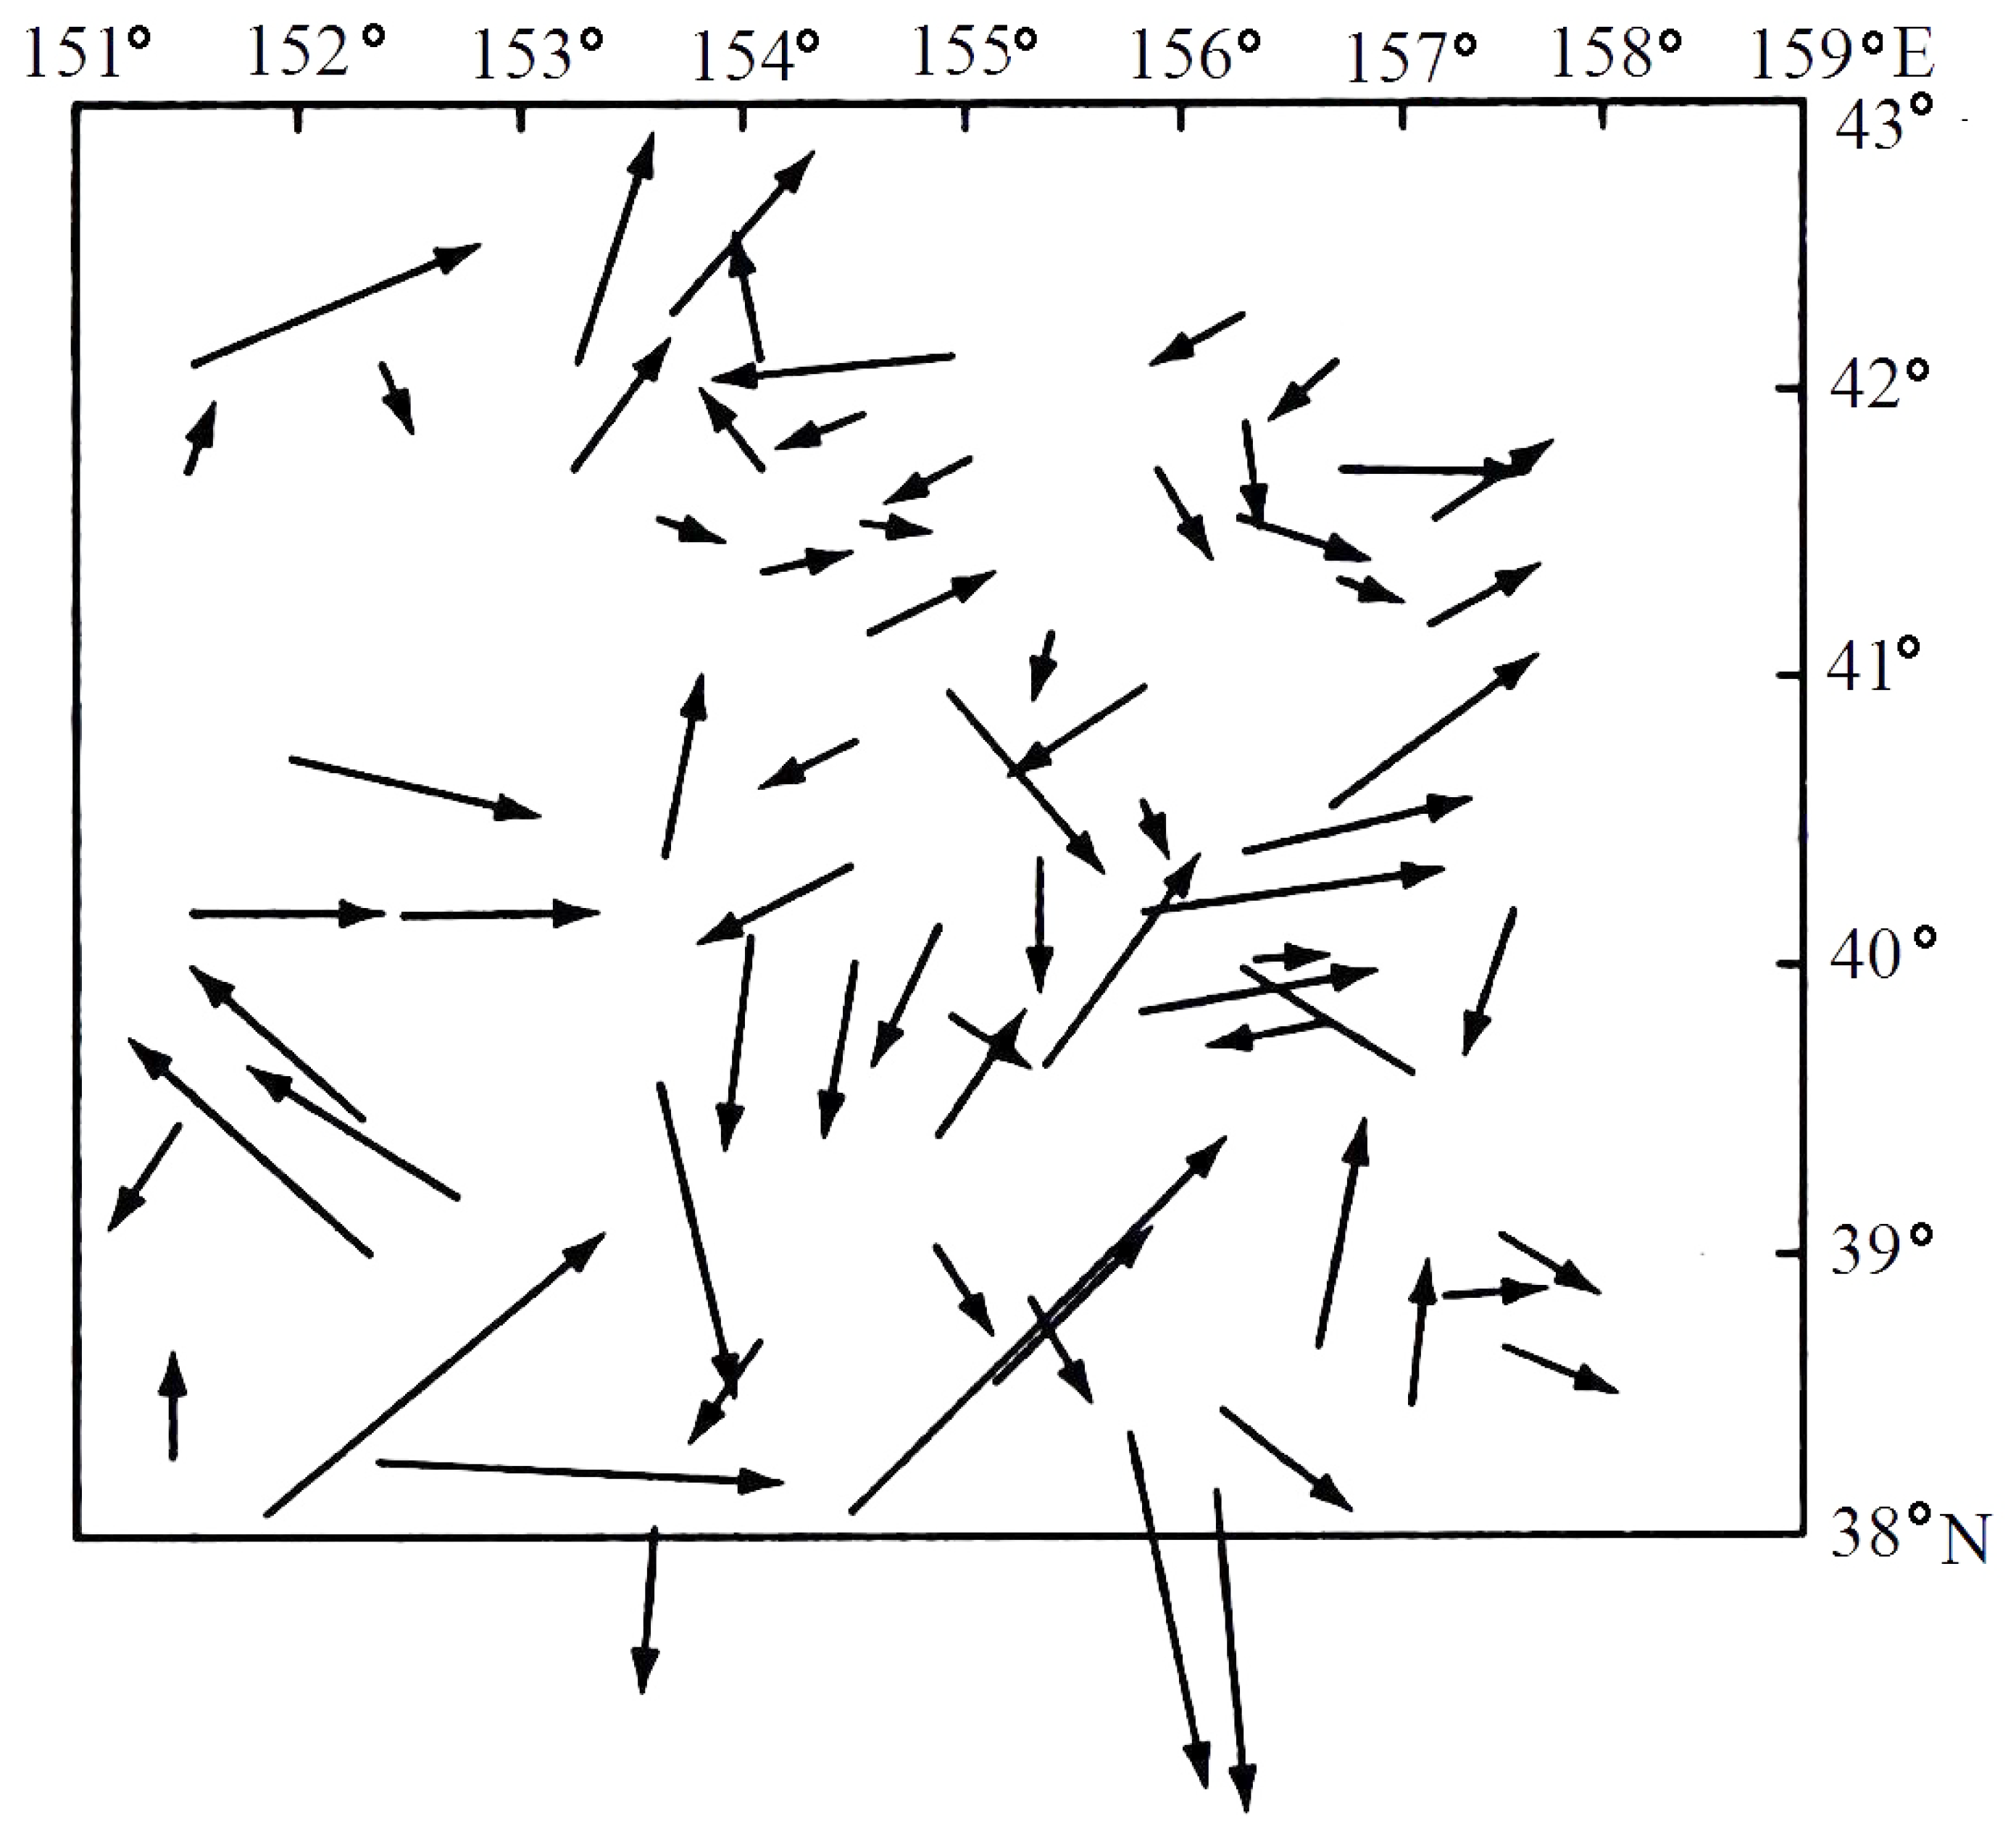
- 1.
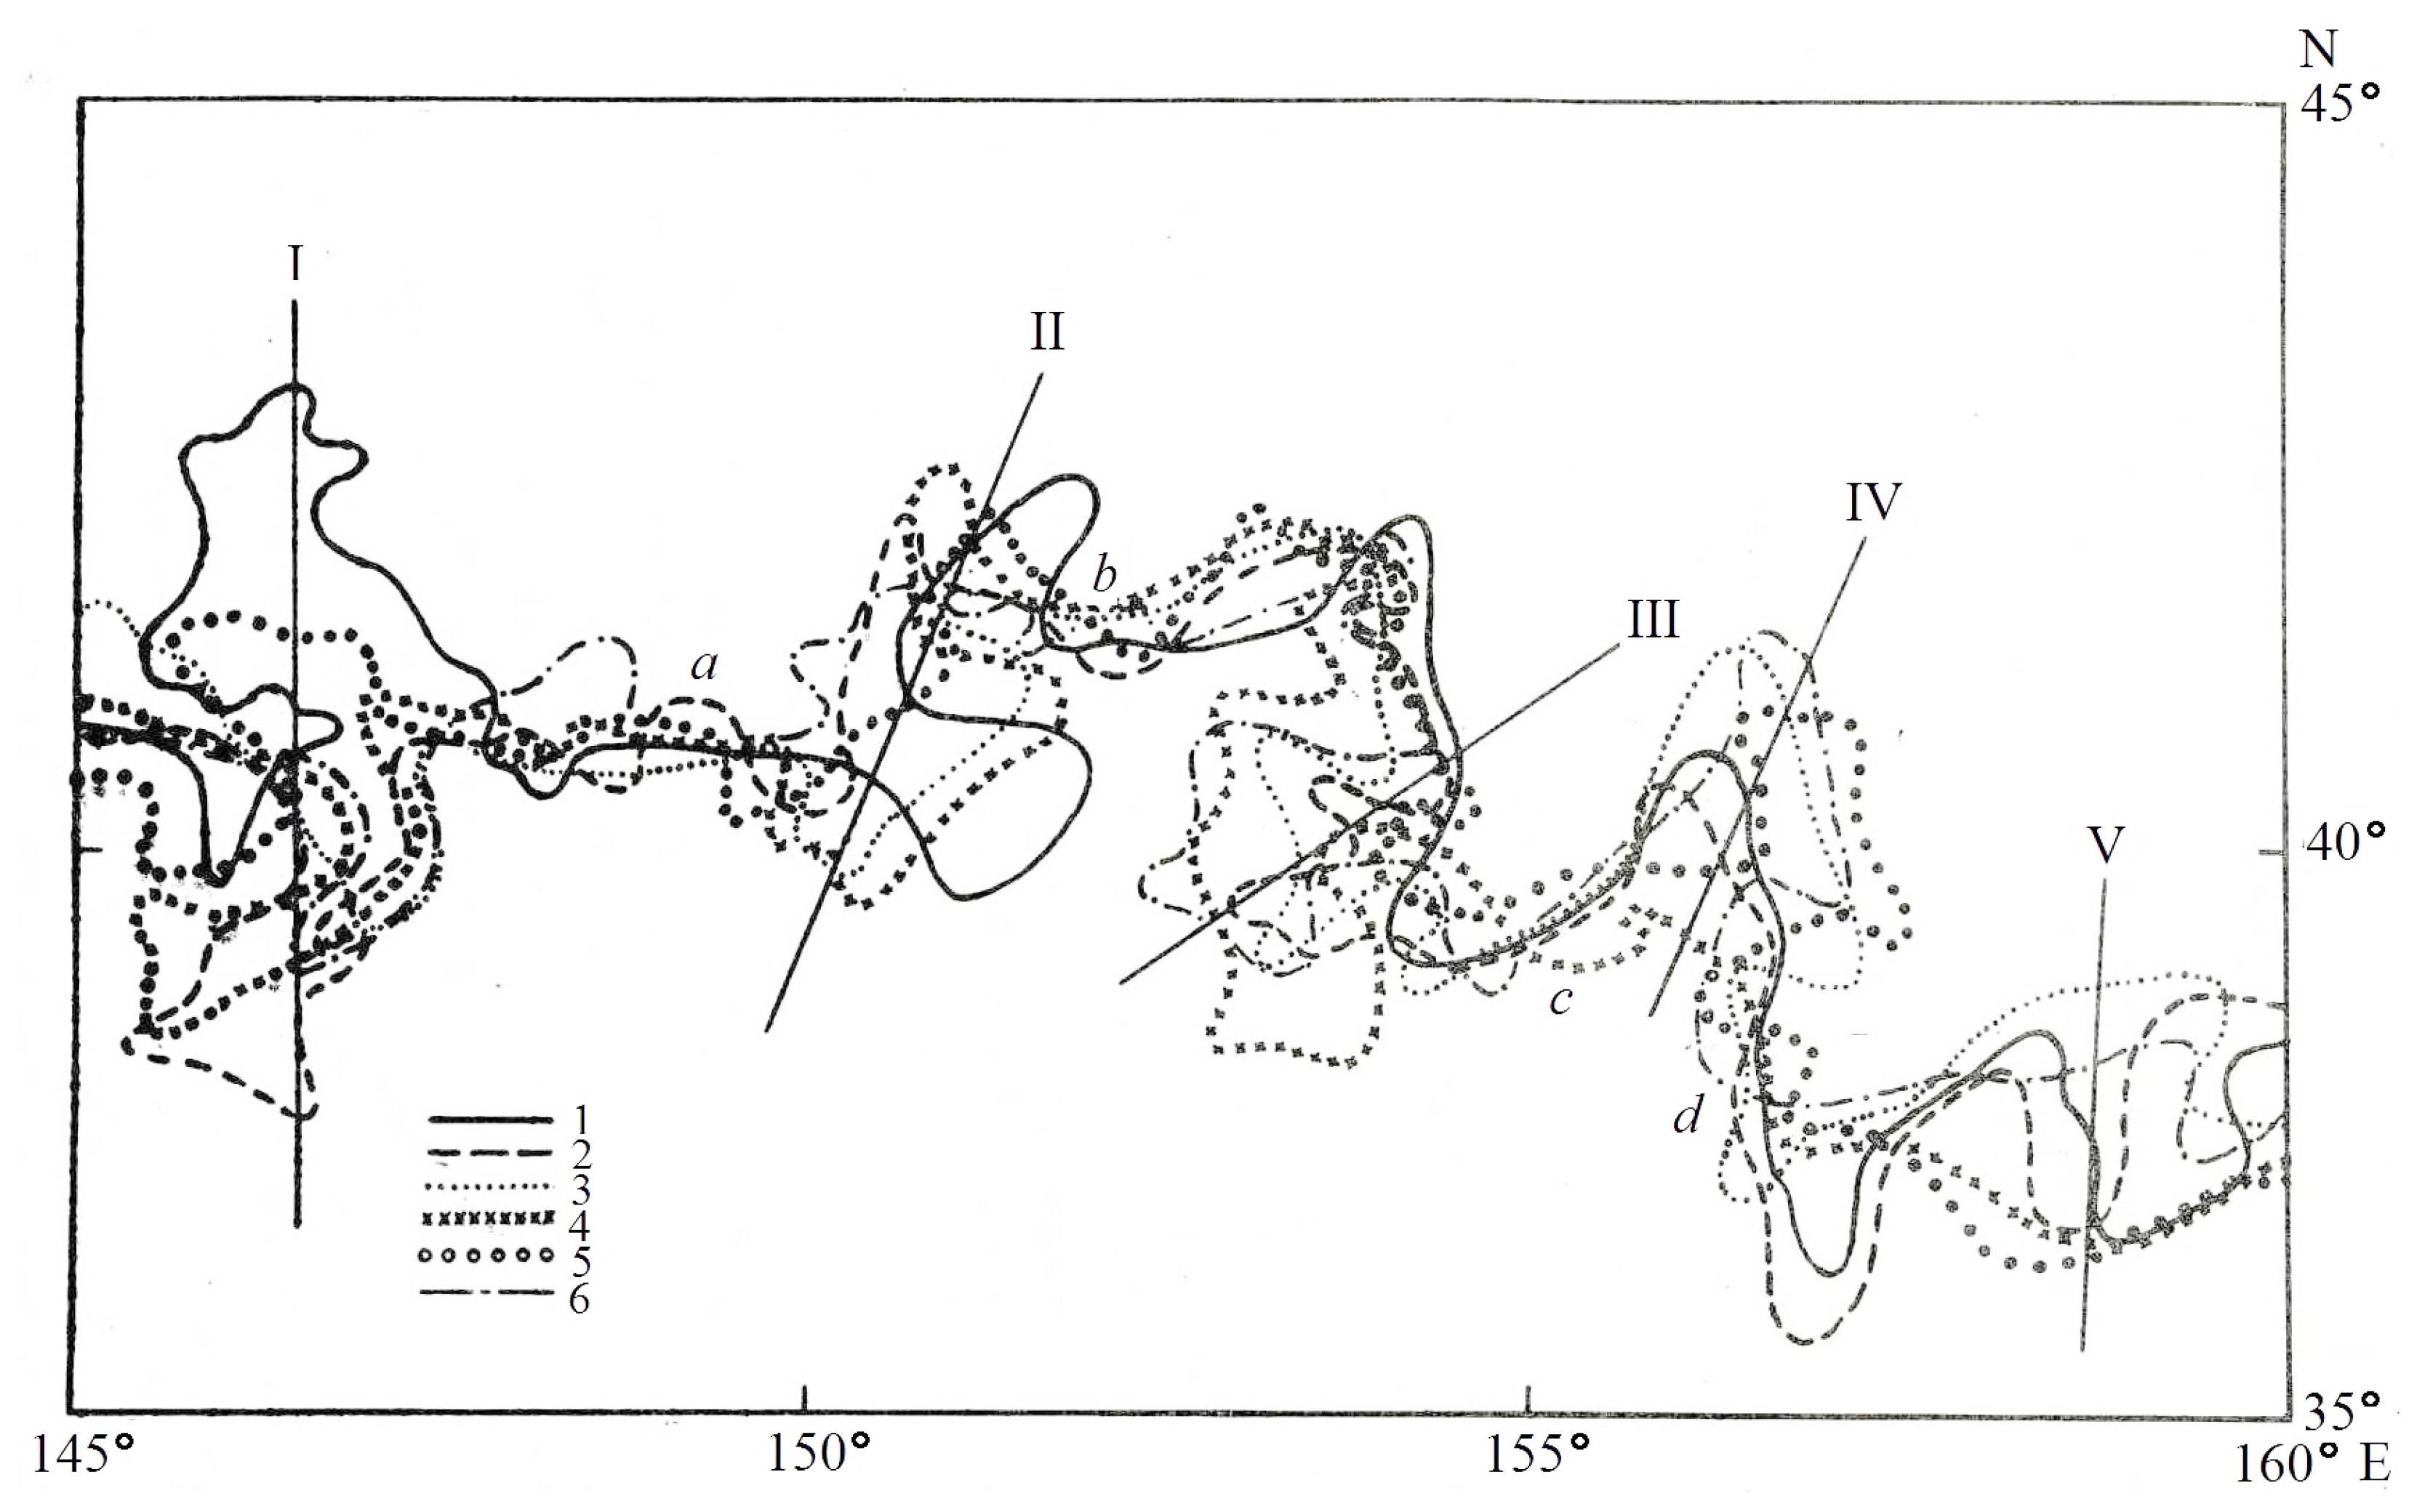
- The largest-scale elements of the currents, including the deep anticyclonic meander of the Subarctic Current (SAC) (Figure 4, 153–155° E), cyclonically vorticed currents of subarctic water to the west and east of this meander, and the three large anticyclonic Kuroshio rings of different ages in the southern half of the test site were very stable and observed throughout the entire observation time.
- 2.
- Temporal variability of the large-scale current pattern was associated with the deepening and weakening of the SAC anticyclonic meander, movements of its axis, movements of the Kuroshio anticyclonic rings, and displacements of individual jets.
- 3.
- The spontaneous intensification of individual SAC jets was accompanied by meandering and the separation of individual meanders and their transformation into cyclonic and anticyclonic eddies of synoptic scale.
- 4.
- A process is presently driven by the mesoscale exchange of water, heat and salt between eddies and the surrounding ocean. It is this process that leads to the final heat and salt exchange between the subarctic and interfrontal water masses across the subarctic front (SAF) associated with the generation of eddies.
- 5.
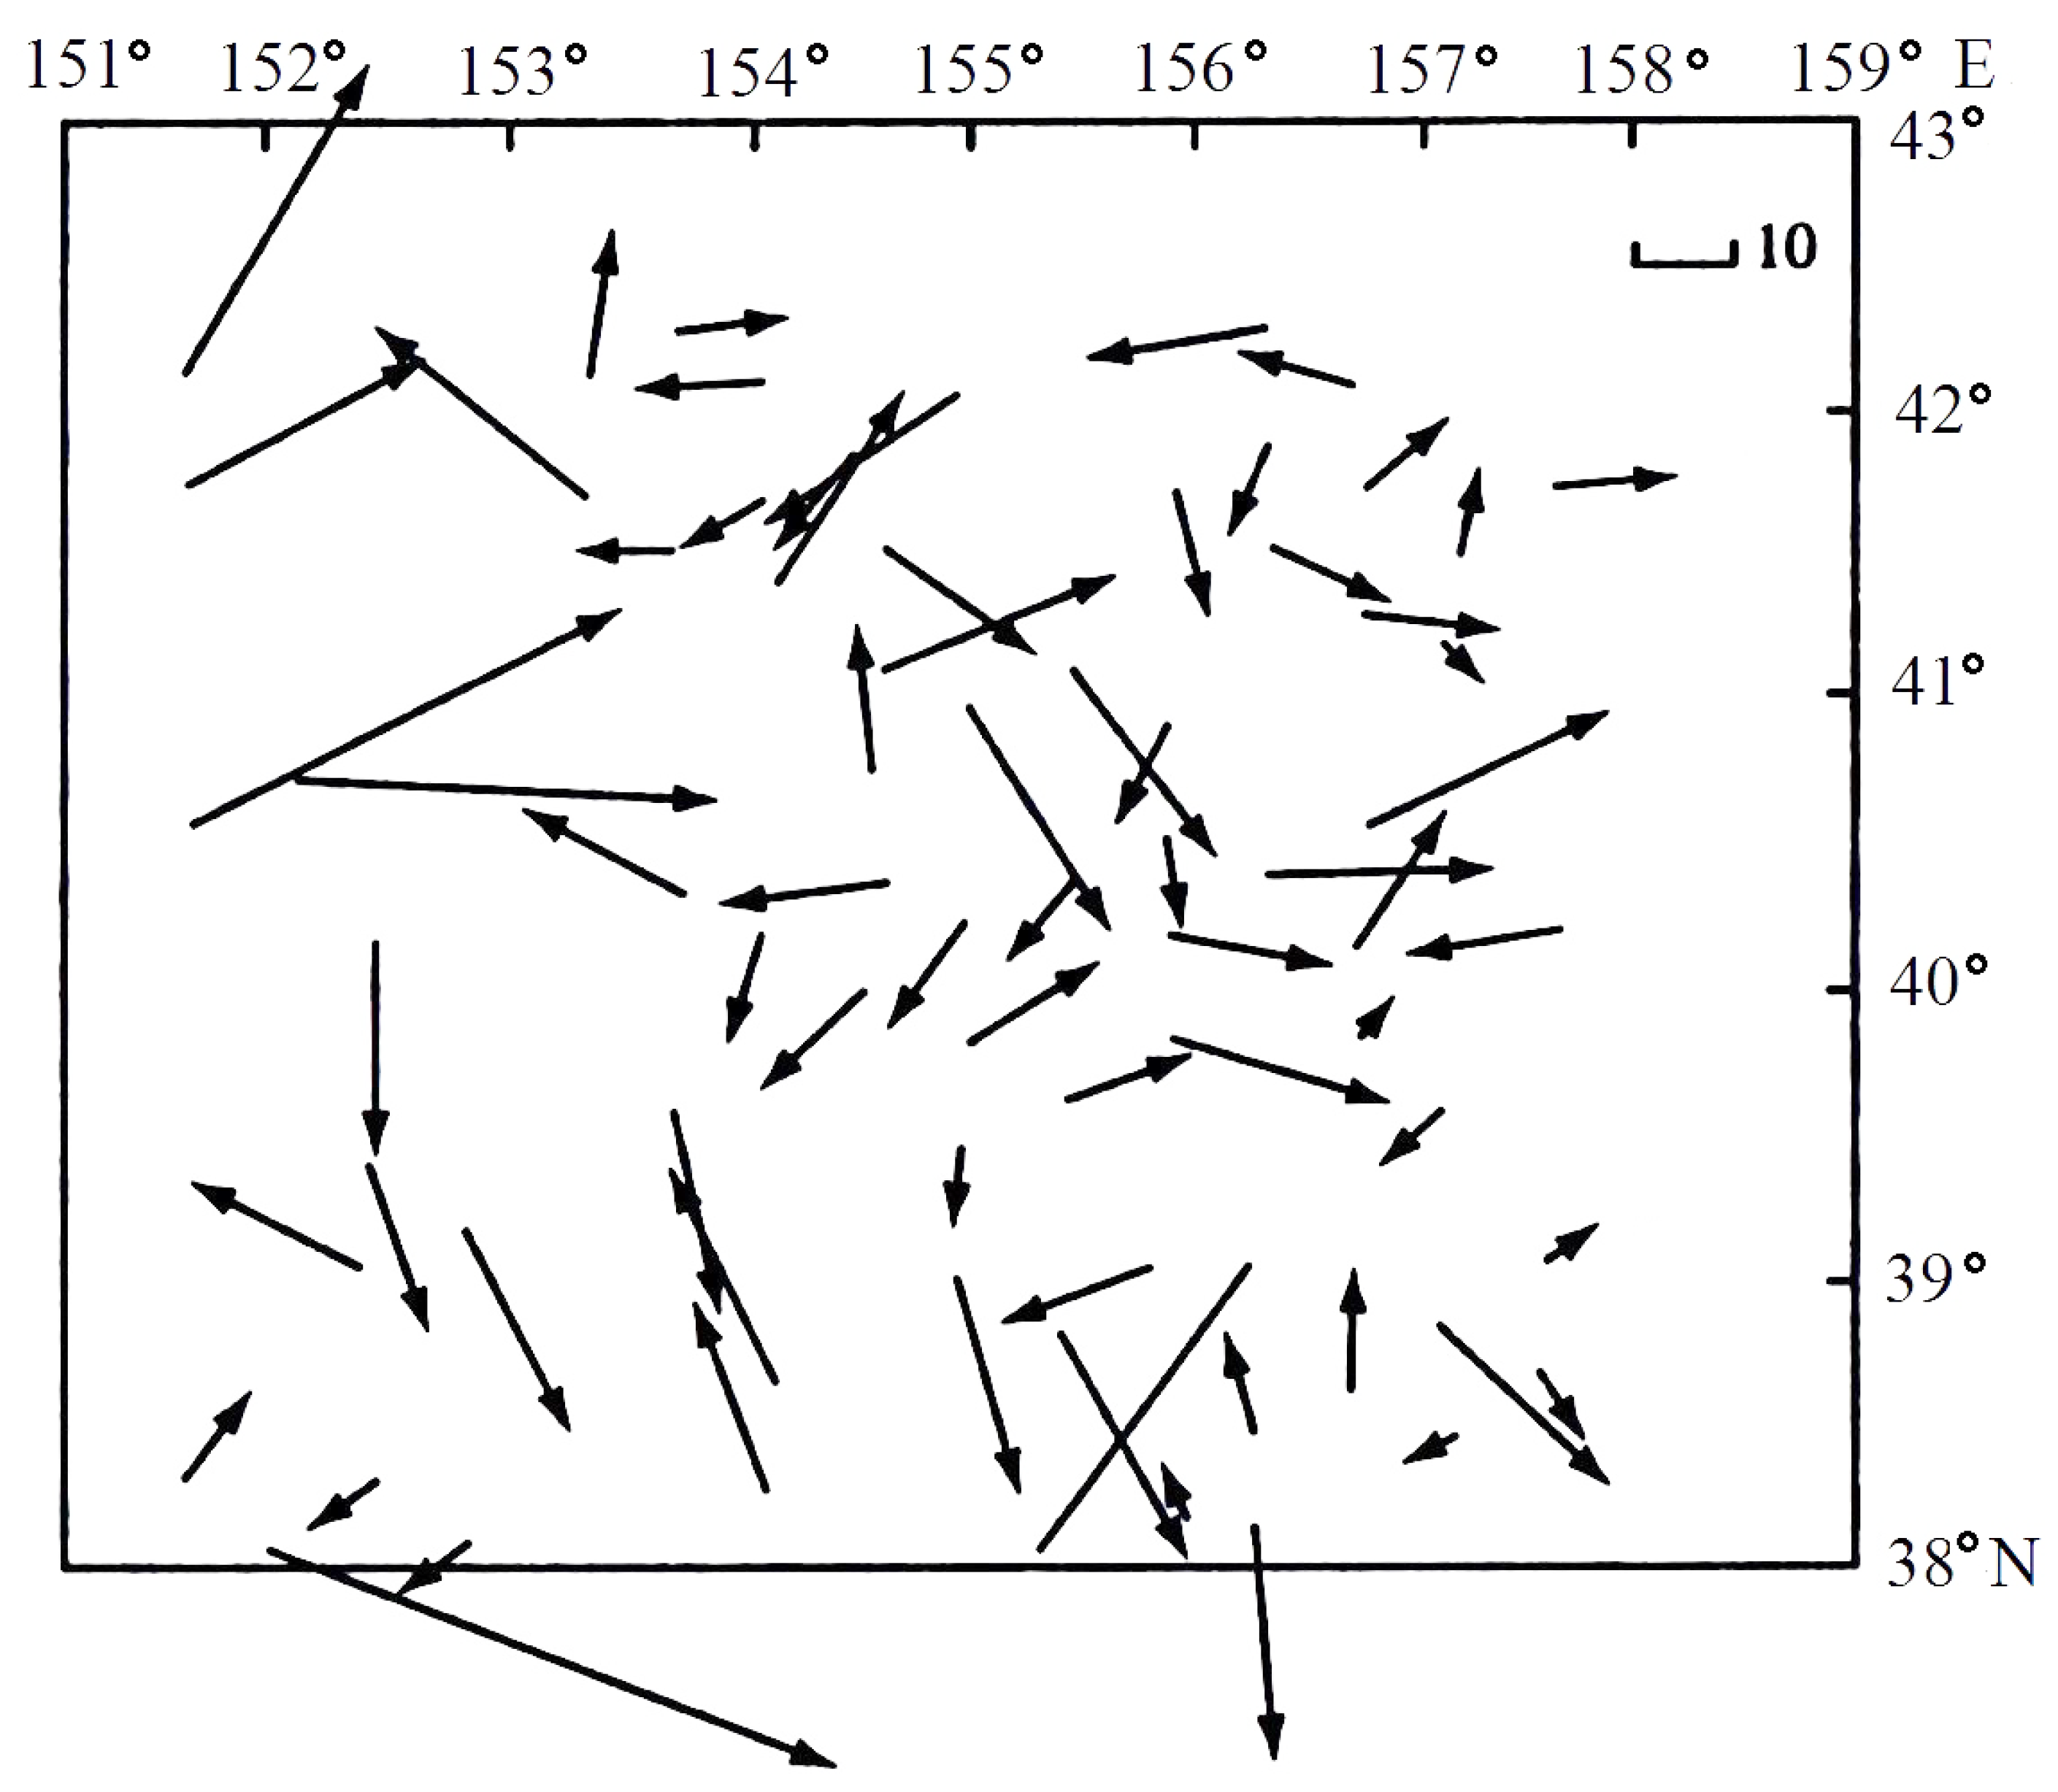
- Formation of the two types of eddies—rings and open ocean vortices—is caused by the same mechanism, which is baroclinic instability of large-scale currents.
- 6.
- The effect of a latitudinal change in the Coriolis parameter manifested in the movement of vortex disturbances in a westerly direction, was observed only for relatively weak and large eddy formations.
- 1.
- The eastern SAC is not visible in the deep layer. Maps of currents at 120 m show the predominance of westerly currents. We can speak with fairly high confidence on the presence of a large-scale countercurrent under the SAC with an interface between these currents at a depth of about 1000 m.
- 2.
- All the largest synoptic disturbances of the currents in the thermocline [22] can be observed on maps for the level of 1200 m.
- 3.
- The small eddy formations observed in the thermocline (70–80 km) are not visible in the deep layer. At the same time, large non-stationary structural elements of circulation are observed in the deep ocean but are not present at the level of 1200 m. These include anticyclonic and cyclonic jets of currents with a width of 60–70 km. A powerful vortex formation with meridional and zonal dimensions of about 150 and 240 km, respectively, with an orbital movement of water of 20 cm/s at a level 1200 m, which appeared in October 1987, demonstrated a westward displacement with a speed of about 7 km/day.
- 4.
- The observation results made it possible to confirm the assumption of the presence of a western deep countercurrent under the SAC, which increases its speed with depth: it was higher at the 4500 m level than at the level of 1200 m
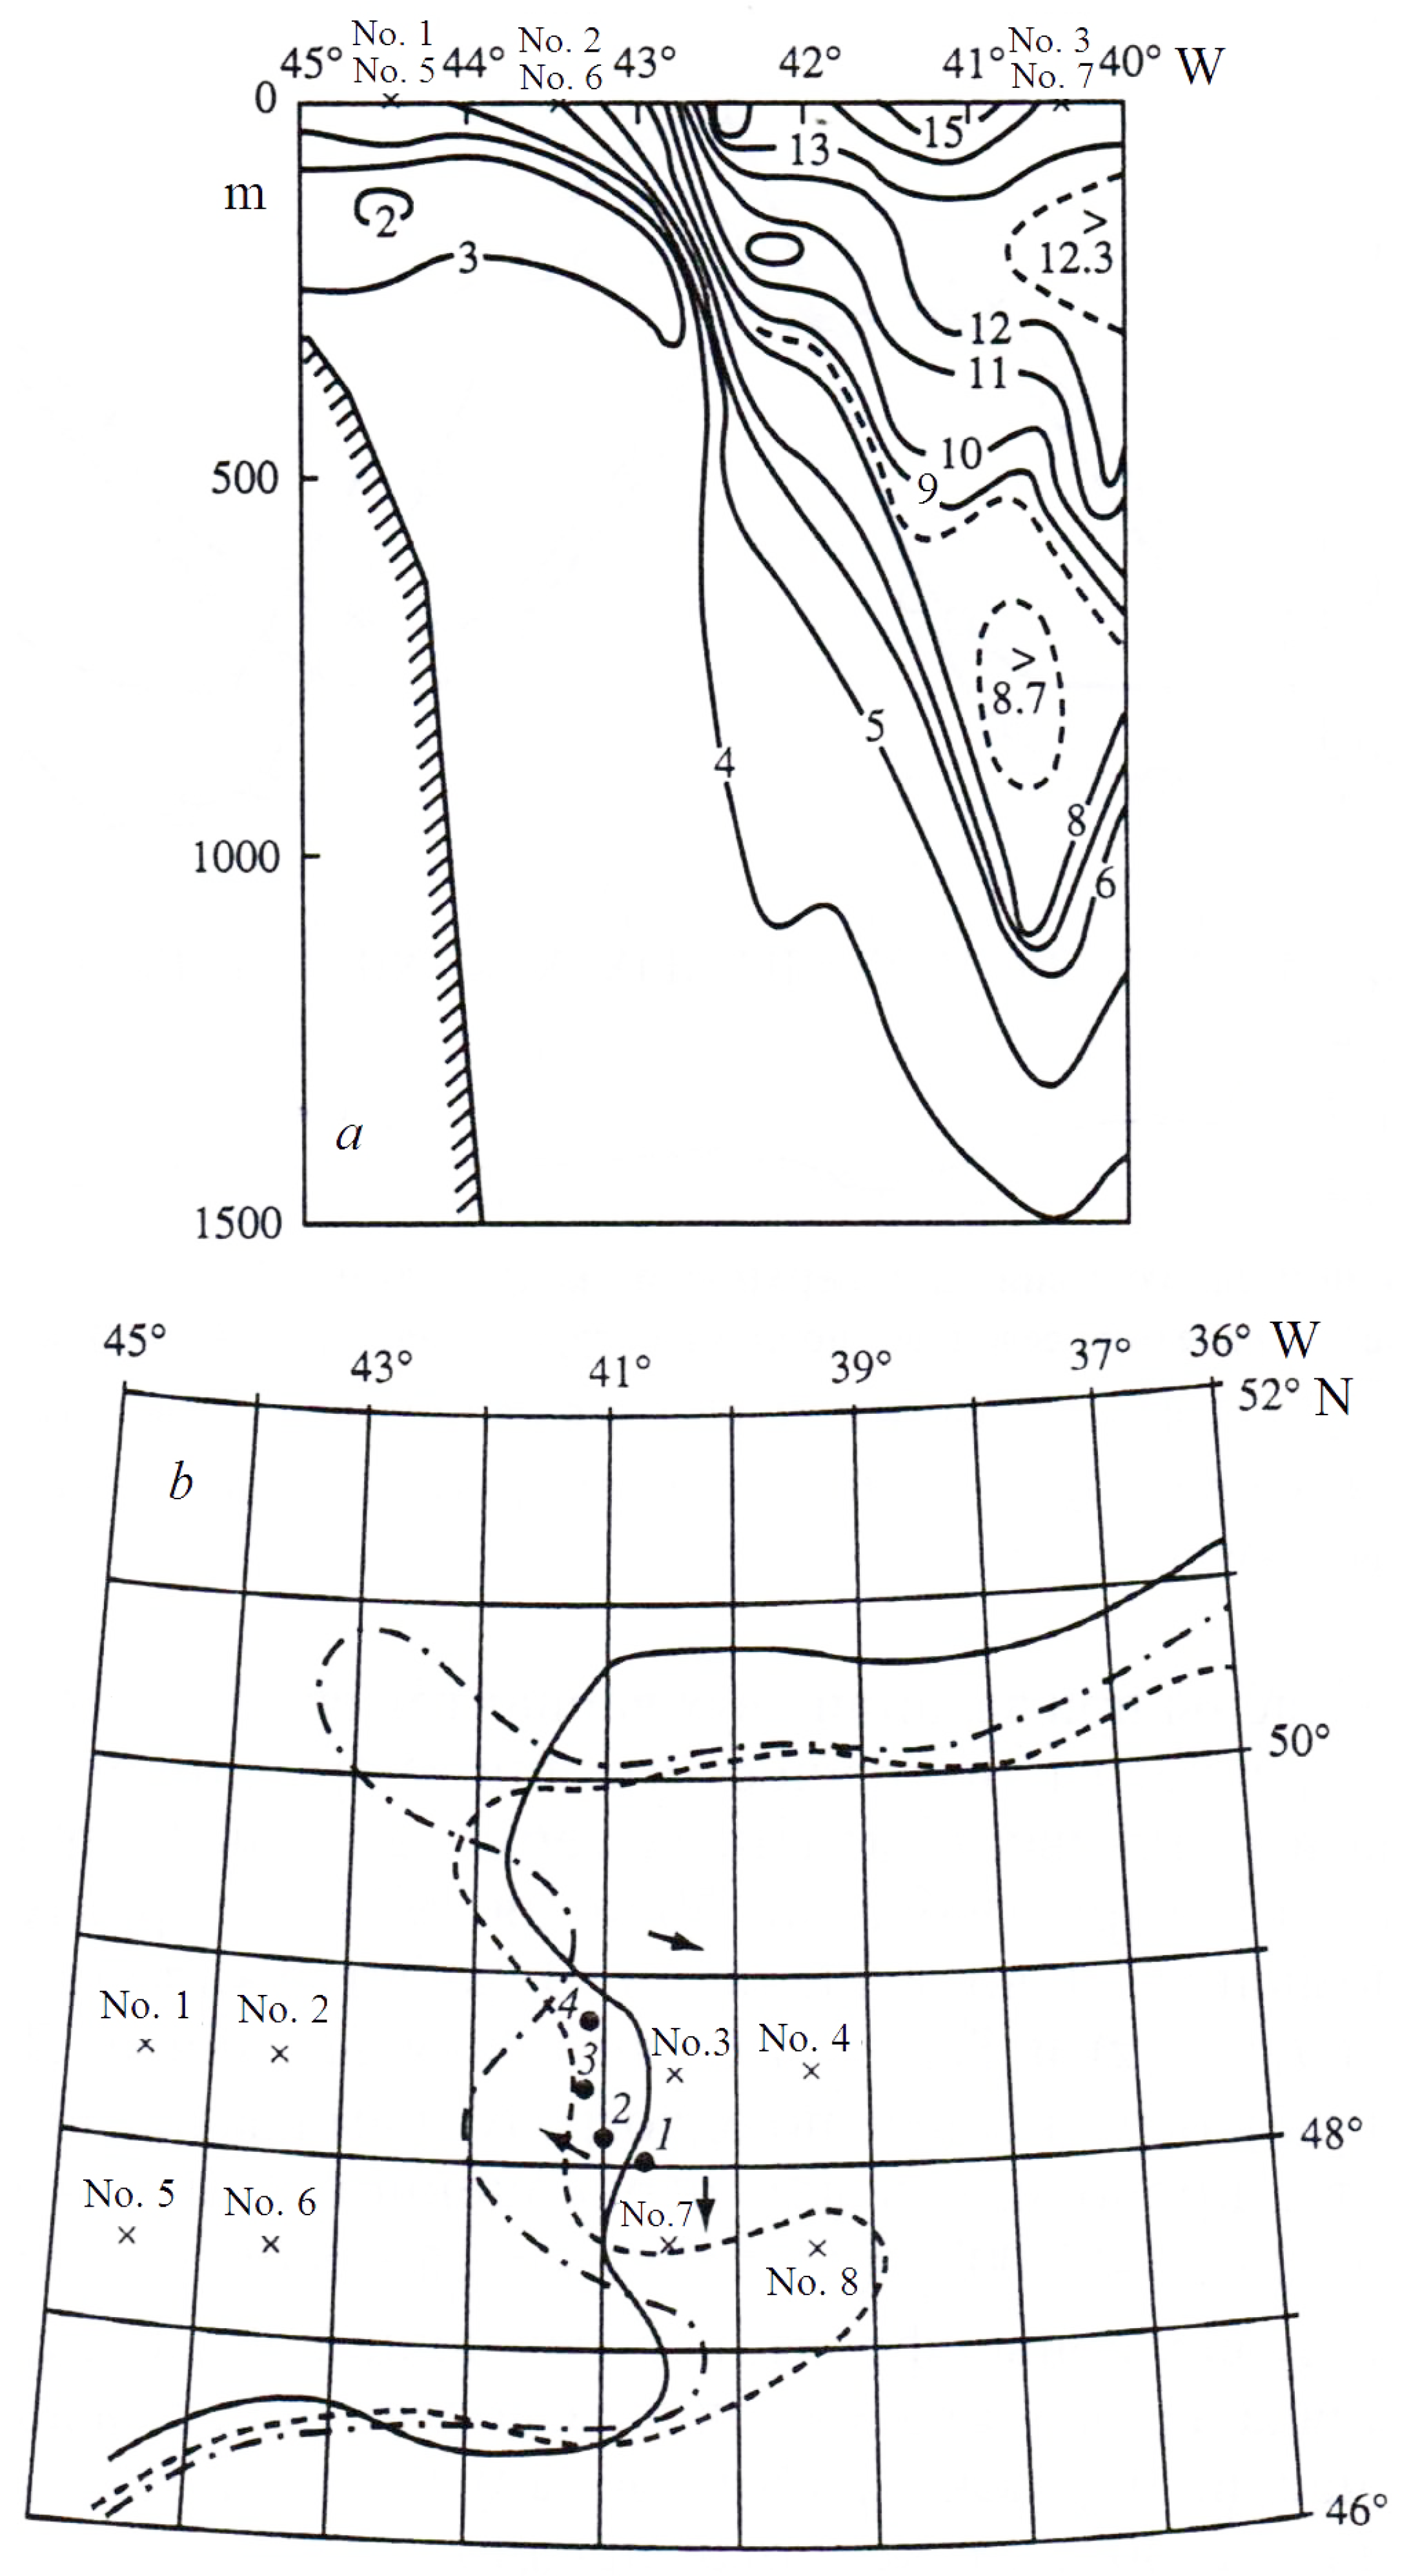
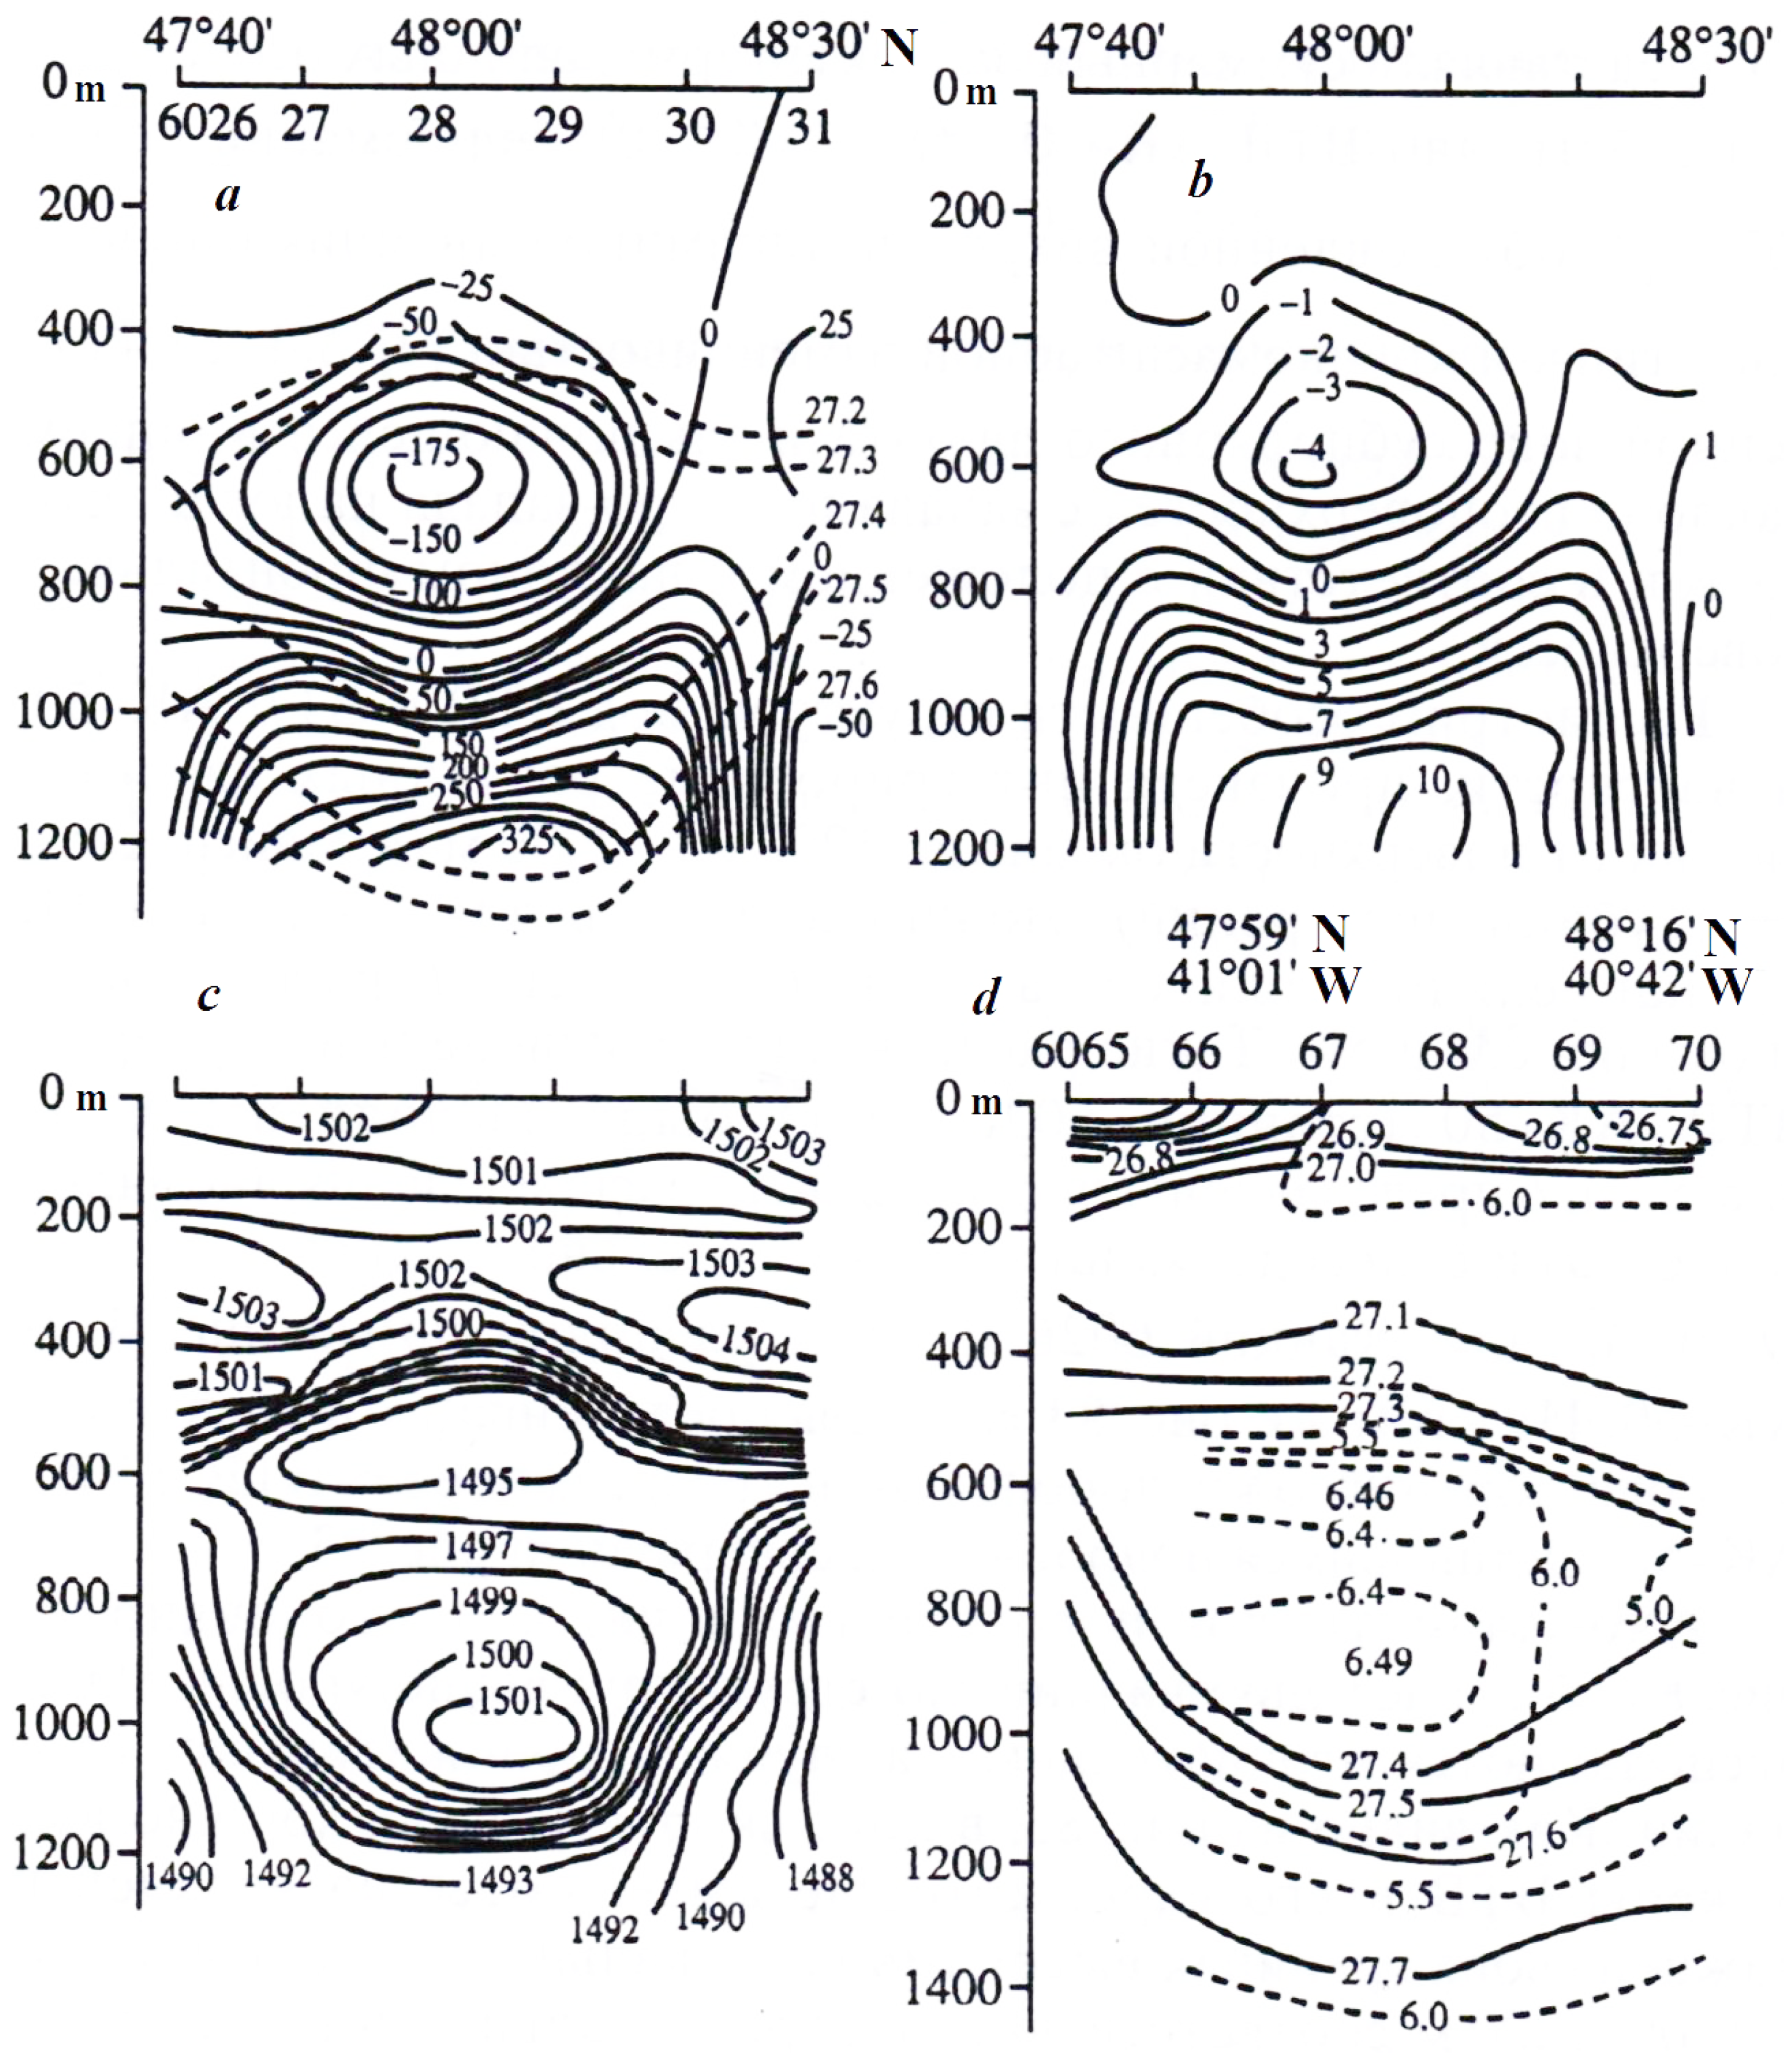
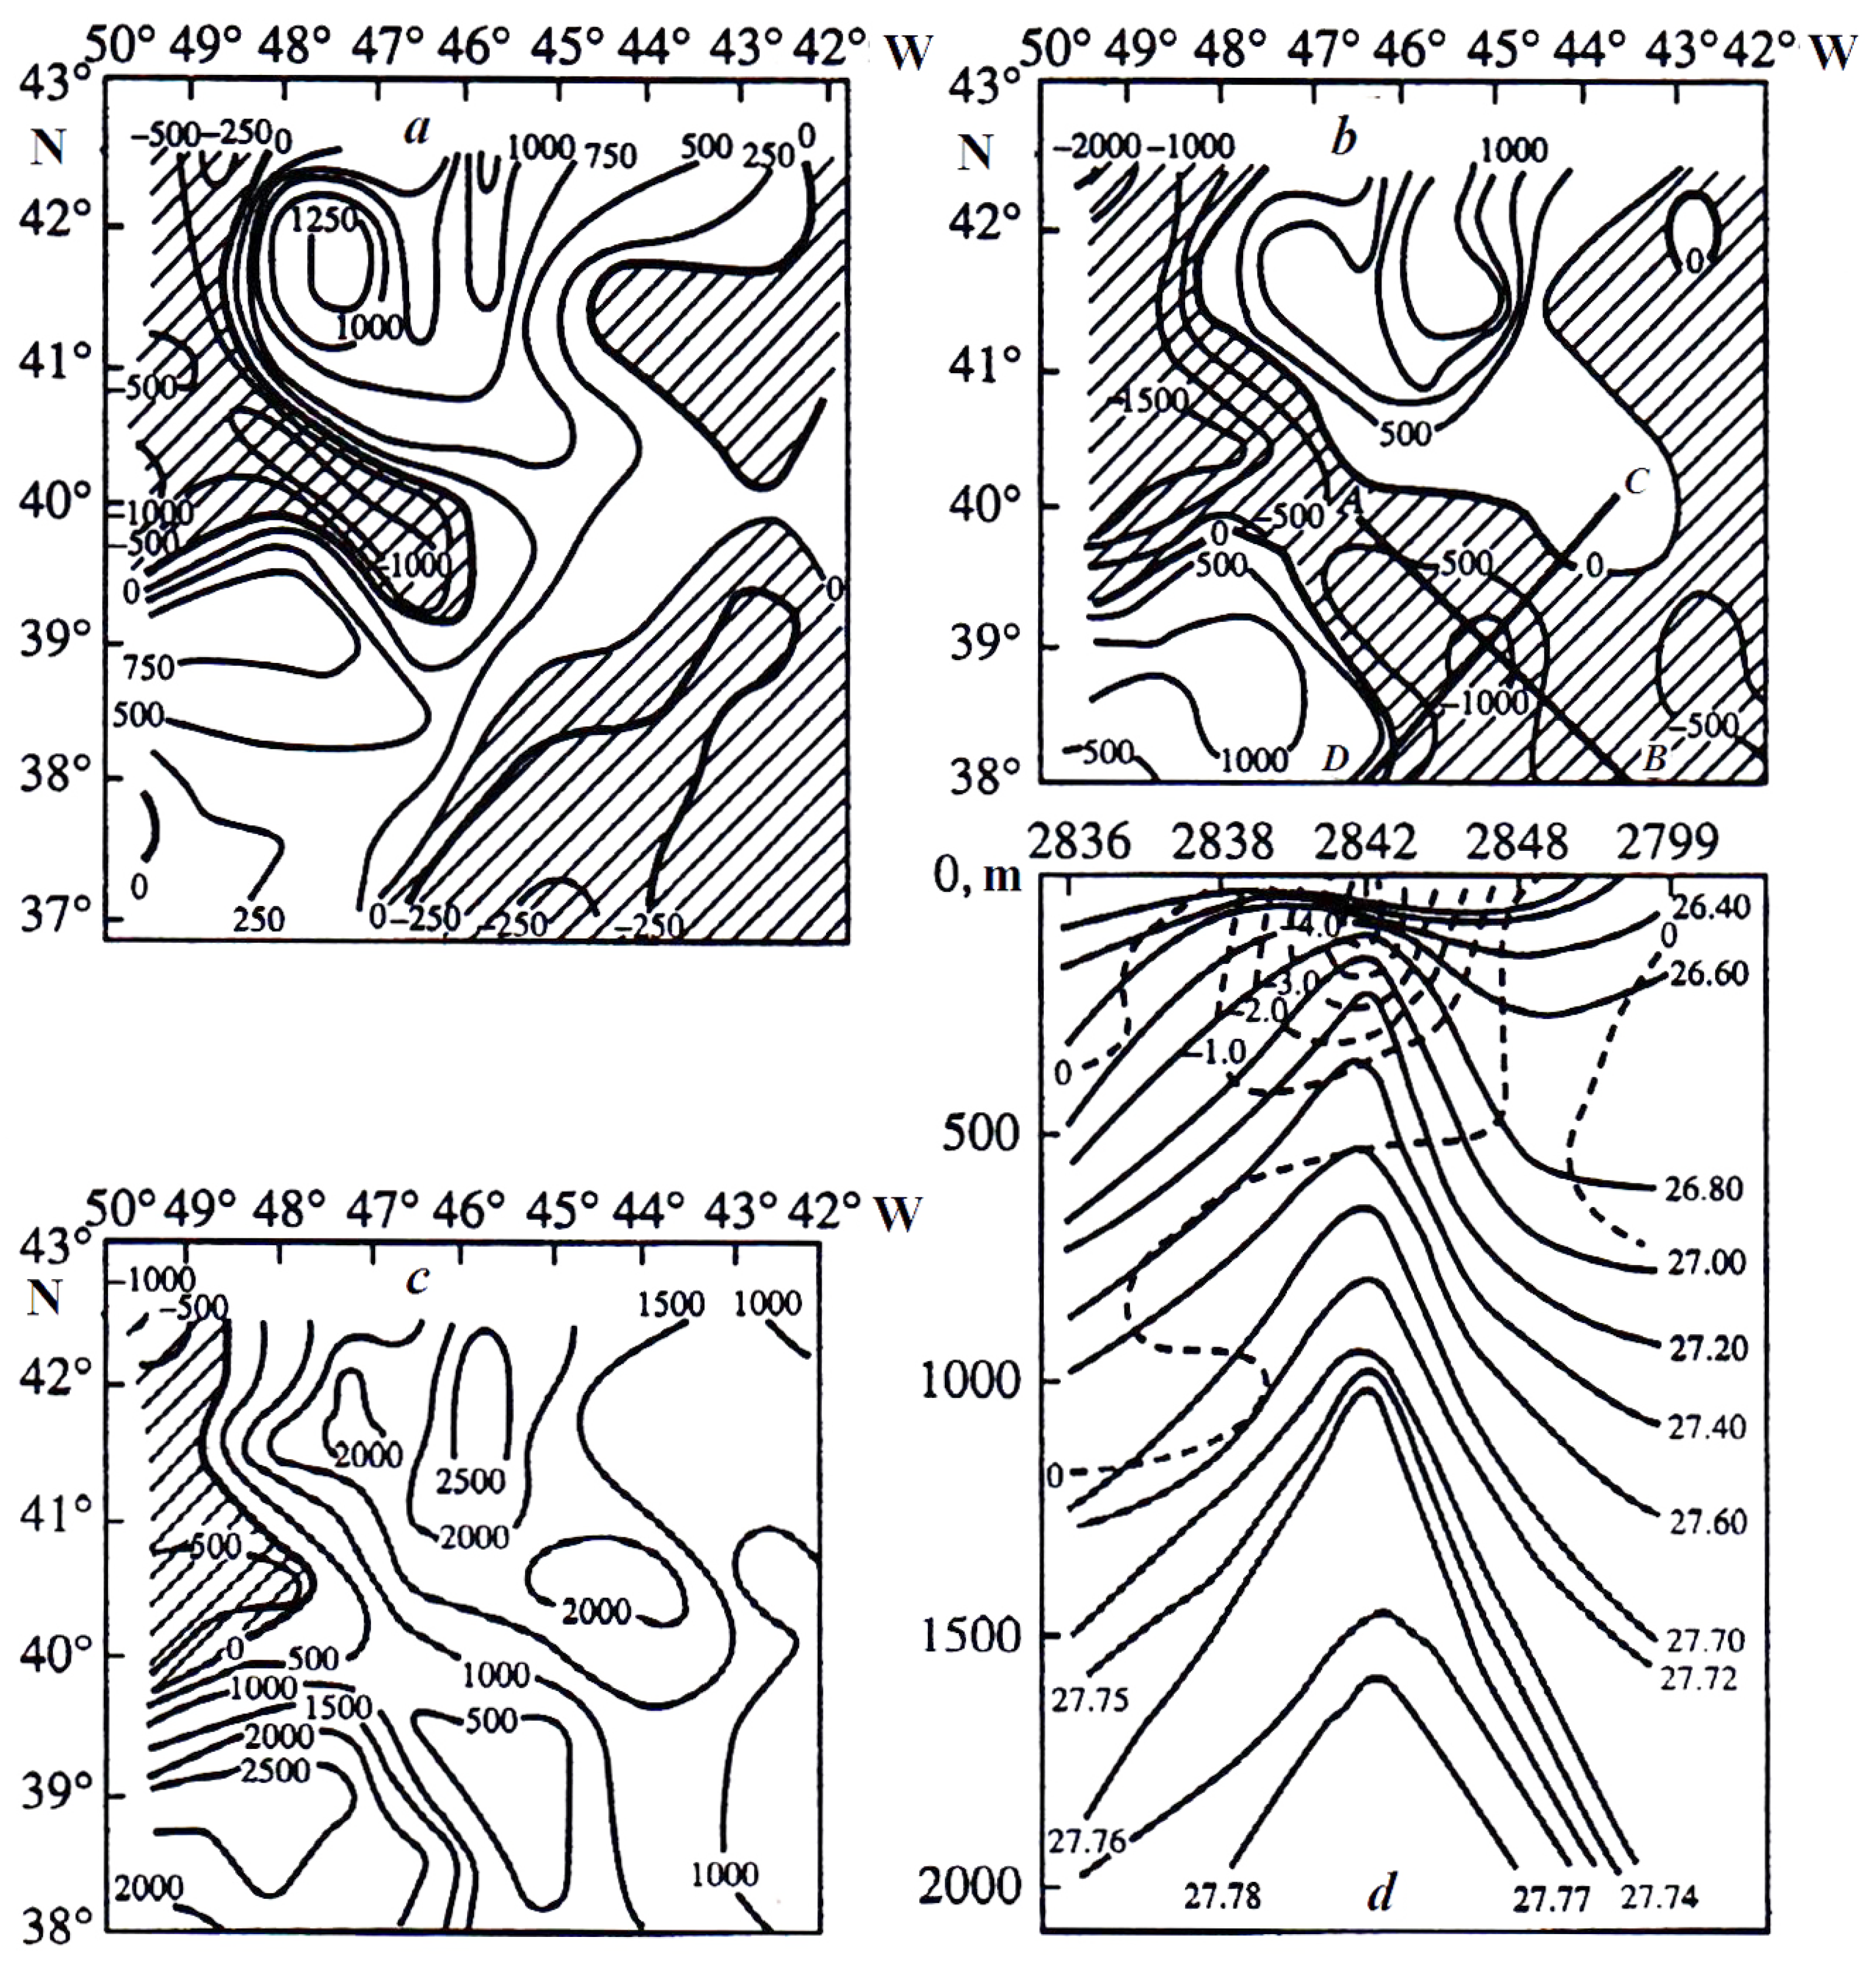
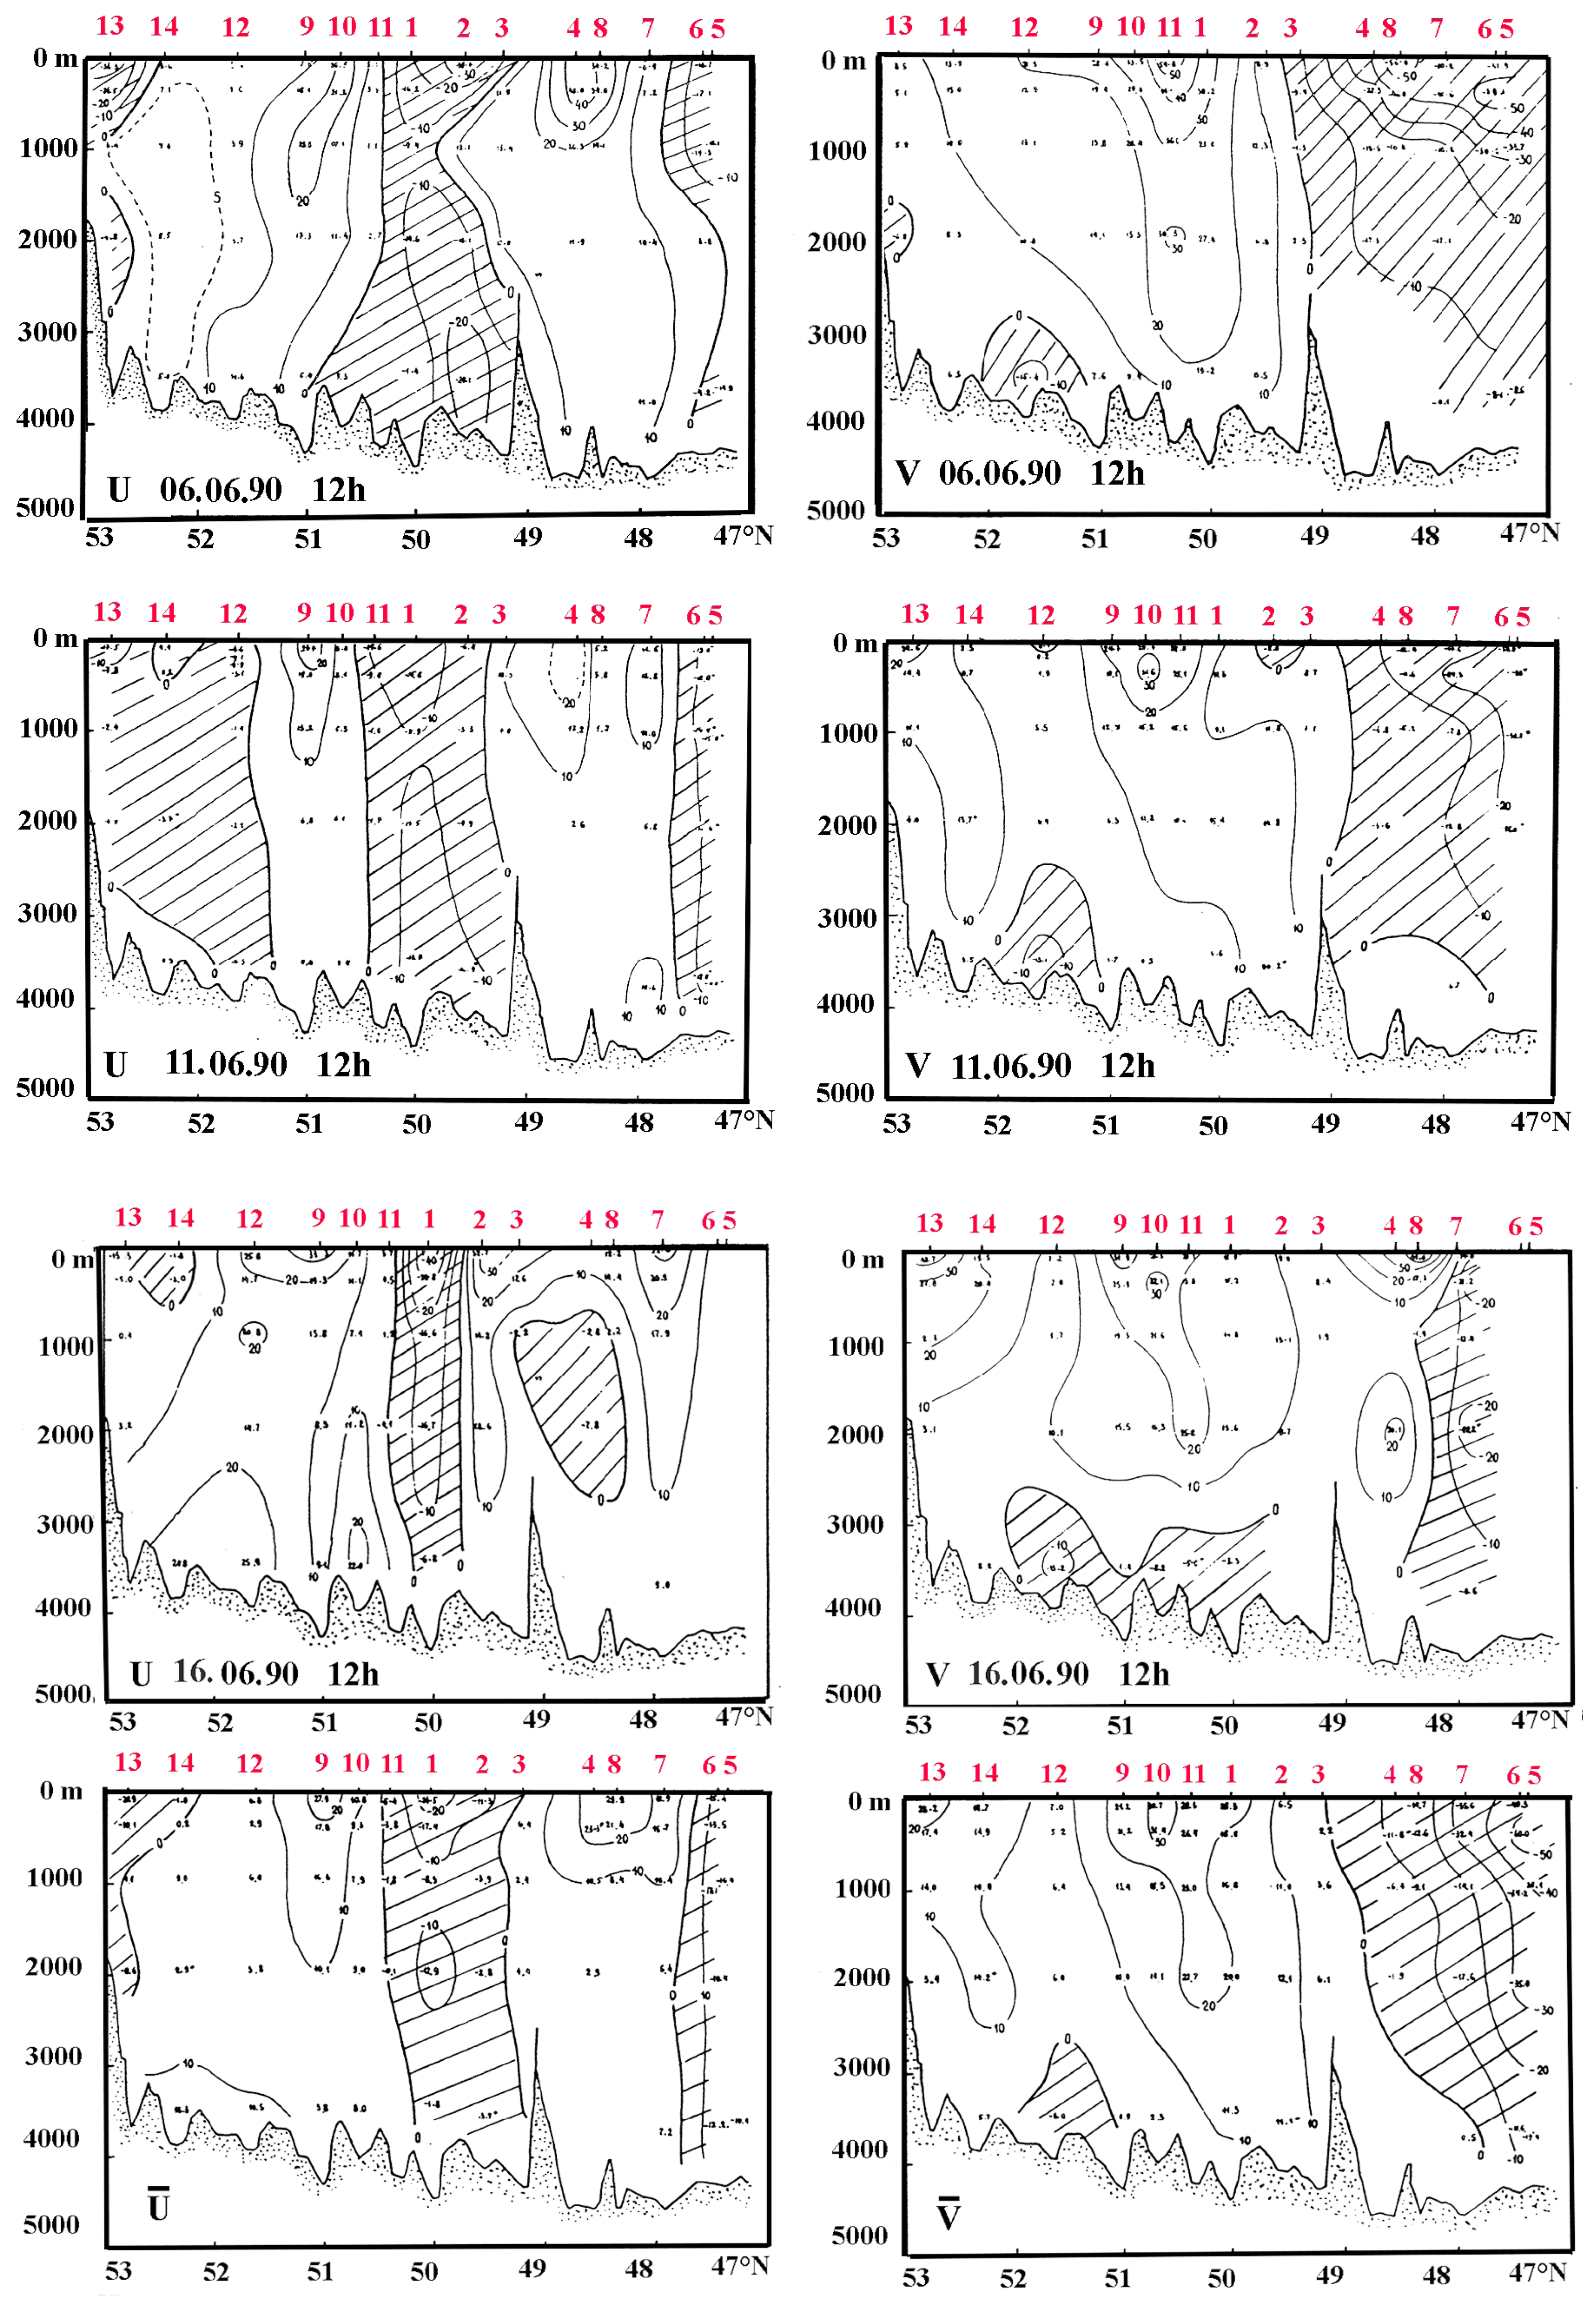
3.2. The Experiment “Atlantex-90”
4. Discussion
- 1.
- 2.
- Signs of extreme volume transport in the Labrador Current (based on the anomalously low water temperature in its core, −1.2 °C) and the NA Current on the meridional section at 36° W (up to 100 Sv) were identified [43].
- 3.
- 4.
- 5.
5. Conclusions
- 1.
- Increased sensible and latent heat fluxes from the ocean to the atmosphere were observed.
- 2.
- The transfrontal exchange of subpolar and subtropical waters was intensified.
- 3.
- Deep density convection took place.
- 4.
- Eddy activity in each of the regions was high.
Author Contributions
Funding
Institutional Review Board Statement
Informed Consent Statement
Data Availability Statement
Conflicts of Interest
Abbreviations
| ABS | Autonomous Buoy Station |
| AO | Atlantic Ocean |
| AUL | Active Upper Layer |
| CMIP | Coupled Model Intercomparison Project |
| CORE | Coordinated Ocean–Ice Reference Experiment |
| CTD | Conductivity, Temperature and Depth measuring device |
| GAO | Global Atmospheric Oscillation |
| INMOM | Institute of Numerical Mathematics Ocean Model |
| IPCC | Intergovernmental Panel on Climate Change |
| ITL | IntraThermocline Lense |
| ITV | IntraThermocline Vortex |
| MOHO | Multidecadal Oscillation of the Heat content in the Ocean |
| NA | North Atlantic |
| NH | Northern Hemisphere |
| OGCM | Ocean General Circulation Model |
| OMIP | Ocean Model Intercomparison Project |
| PO | Pacific Ocean |
| RV | Research Vessel |
| SAC | SubArctic Current |
| SAF | SubArctic Front |
| SRT | Ship-based Remote Thermometer |
| SST | Sea Surface Temperature |
| WBC | Western Boundary Currents |
| WO | World Ocean |
References
- Bond, N.; Overland, J.; Spillane, M.; Stabeno, P. Recent shifts in the state of the North Pacific. Geophys. Res. Lett. 2003, 30, 2183. [Google Scholar] [CrossRef]
- Byshev, V.; Neiman, V.; Romanov, Y.; Serykh, I. Phase variability of some characteristics of the present-day climate in the northern atlantic region. Dokl. Earth Sci. 2011, 438, 887–892. [Google Scholar] [CrossRef]
- Henley, B.; Gergis, J.; Karoly, D.; Power, S.; Kennedy, J.; Folland, C. A Tripole Index for the Interdecadal Pacific Oscillation. Clim. Dyn. 2015, 45, 3077–3090. [Google Scholar] [CrossRef]
- Byshev, V.; Gusev, A.; Neiman, V.; Sidorova, A. Interdecadal Oscillation of the Ocean Heat Content as a Contribution to Understanding of Physical Aspects of the Present-Day Climate. J. Mar. Sci. Eng. 2022, 10, 1064. [Google Scholar] [CrossRef]
- Byshev, V.; Neiman, V.; Anisimov, M.; Gusev, A.; Serykh, I.; Sidorova, A.; Figurkin, A.; Anisimov, I. Multi-Decadal Oscillations of the Ocean Active Upper-Layer Heat Content. Pure Appl. Geophys. 2017, 174, 2863–2878. [Google Scholar] [CrossRef]
- Byshev, V.; Neiman, V.; Romanov, Y.; Serykh, I.; Sonechkin, D. Statistical significance and climatic role of the Global Atmospheric Oscillation. J. Oceanol. 2016, 56, 165–171. [Google Scholar] [CrossRef]
- Kamenkovich, V.; Monin, A. (Eds.) Ocean Physics (in 2 Volumes), Vol.1: Ocean Hydrophysics; Nauka: Moscow, Soviet Union, 1978; 455p. [Google Scholar]
- Gill, A. Atmosphere-Ocean Dynamics; International Geophysics Series; Academic Press: Orlando, FL, USA, 1982; Volume 30, 680p. [Google Scholar]
- Kwon, Y.O.; Alexander, M.; Bond, N.; Frankignoul, C.; Nakamura, H.; Qiu, B.; Thompson, L. Role of the Gulf Stream and Kuroshio–Oyashio Systems in Large-Scale Atmosphere–Ocean Interaction: A Review. J. Clim. 2010, 23, 3249–3281. [Google Scholar] [CrossRef]
- Wallace, J.; Hobbs, P. Atmospheric Science: An Introductory Survey; Academic Press/Elsevier: Burlington, MA, USA, 2006; 483p. [Google Scholar]
- Lappo, S.; Gulev, S.; Rozhdestvensky, A. Large-Scale Thermal Interaction in the Ocean-Atmosphere System and Energy-Active Regions of the World Ocean; Hydrometeoizdat: Leningrad, Soviet Union, 1990; 336p. (In Russian) [Google Scholar]
- Griffies, S.; Biastoch, A.; Böning, C.; Bryan, F.; Danabasoglu, G.; Chassignet, E.; England, M.; Gerdes, R.; Haak, H.; Hallberg, R.; et al. Coordinated Ocean-ice Reference Experiments (COREs). Ocean Model. 2009, 26, 1–46. [Google Scholar] [CrossRef]
- Danabasoglu, G.; Yeager, S.; Bailey, D.; Behrens, E.; Bentsen, M.; Bi, D.; Biastoch, A.; Böning, C.; Bozec, A.; Canuto, V.; et al. North Atlantic simulations in Coordinated Ocean-ice Reference Experiments phase II (CORE-II). Part I: Mean states. Ocean Model. 2014, 73, 76–107. [Google Scholar] [CrossRef]
- Danabasoglu, G.; Yeager, S.; Kim, W.; Behrens, E.; Bentsen, M.; Bi, D.; Biastoch, A.; Bleck, R.; Böning, C.; Bozec, A.; et al. North Atlantic simulations in Coordinated Ocean-ice Reference Experiments phase {II} (CORE-II). Part II: Inter-annual to decadal variability. Ocean Model. 2016, 97, 65–90. [Google Scholar] [CrossRef]
- Downes, S.; Farneti, R.; Uotila, P.; Griffies, S.; Marsland, S.; Bailey, D.; Behrens, E.; Bentsen, M.; Bi, D.; Biastoch, A.; et al. An assessment of Southern Ocean water masses and sea ice during 1988–2007 in a suite of interannual CORE-II simulations. Ocean Model. 2015, 94, 67–94. [Google Scholar] [CrossRef]
- Farneti, R.; Downes, S.; Griffies, S.; Marsland, S.; Behrens, E.; Bentsen, M.; Bi, D.; Biastoch, A.; Böning, C.; Bozec, A.; et al. An assessment of Antarctic Circumpolar Current and Southern Ocean meridional overturning circulation during 1958–2007 in a suite of interannual CORE-II simulations. Ocean Model. 2015, 93, 84–120. [Google Scholar] [CrossRef]
- Griffies, S.; Danabasoglu, G.; Durack, P.; Adcroft, A.; Balaji, V.; Böning, C.; Chassignet, E.; Curchitser, E.; Deshayes, J.; Drange, H.; et al. OMIP contribution to CMIP6: Experimental and diagnostic protocol for the physical component of the Ocean Model Intercomparison Project. Geosci. Model Dev. 2016, 9, 3231–3296. [Google Scholar] [CrossRef]
- Tsujino, H.; Urakawa, L.; Griffies, S.; Danabasoglu, G.; Adcroft, A.; Amaral, A.; Arsouze, T.; Bentsen, M.; Bernardello, R.; Böning, C.; et al. Evaluation of global ocean–sea-ice model simulations based on the experimental protocols of the Ocean Model Intercomparison Project phase 2 (OMIP-2). Geosci. Model Dev. 2020, 13, 3643–3708. [Google Scholar] [CrossRef]
- Solomon, S.; Qin, D.; Manning, M.; Chen, Z.; Marquis, M.; Averyt, K.; Tignor, M.; Miller, H. (Eds.) Climate Change 2007: The Physical Science Basis. Contribution of Working Group I to the Fourth Assessment Report of the Intergovernmental Panel on Climate Change; Cambridge University Press: Cambridge, UK; New York, NY, USA, 2007. [Google Scholar]
- Stocker, T.; Qin, D.; Plattner, G.K.; Tignor, M.; Allen, S.; Boschung, J.; Nauels, A.; Xia, Y.; Bex, V.; Midgley, P. (Eds.) Climate Change 2013: The Physical Science Basis. Contribution of Working Group I to the Fifth Assessment Report of the Intergovernmental Panel on Climate Change; Cambridge University Press: Cambridge, UK; New York, NY, USA, 2013. [Google Scholar]
- Masson-Delmotte, V.; Zhai, P.; Pirani, A.; Connors, S.; Pán, C.; Berger, S.; Caud, N.; Chen, Y.; Goldfarb, L.; Gomis, M.; et al. (Eds.) Climate Change 2021: The Physical Science Basis. Contribution of Working Group I to the Sixth Assessment Report of the Intergovernmental Panel on Climate Change; Cambridge University Press: Cambridge, UK; New York, NY, USA, 2023. [Google Scholar] [CrossRef]
- Koshlyakov, M.; Panteleev, G.; Sazhina, T.G.; Yaremchuk, M. Structure and variability of the current field in the thermocline according to “Megapolygon-87” data. In The Experiment “Megapolygon”; Nauka: Moscow, Russia, 1992; pp. 242–250. (In Russian) [Google Scholar]
- Gulev, S.; Ivanov, Y.; Kolinko, A.; Lappo, S.; Morozov, E. The experiment “Atlantex-90”. Russ. Meteorol. Hydrol. 1992, 5, 51–61. (In Russian) [Google Scholar]
- Gusev, A.; Diansky, N. Numerical simulation of the world ocean circulation and its climatic variability for 1948–2007 using the INMOM. Izv. Atmos. Ocean. Phys. 2014, 50, 1–12. [Google Scholar] [CrossRef]
- Zalesny, V.; Marchuk, G.; Agoshkov, V.; Bagno, A.; Gusev, A.; Diansky, N.; Moshonkin, S.; Tamsalu, R.; Volodin, E. Numerical simulation of large-scale ocean circulation based on the multicomponent splitting method. Russ. J. Num. Anal. Math. Model. 2010, 25, 581–609. [Google Scholar] [CrossRef]
- Moshonkin, S.; Zalesny, V.; Gusev, A. Simulation of the Arctic—North Atlantic Ocean circulation with a two-equation k-omega turbulence parameterization. J. Mar. Sci. Eng. 2018, 6, 95. [Google Scholar] [CrossRef]
- Byshev, V.; Figurkin, A.; Anisimov, I. Interdecadal variability in thermal structure of water in the upper active layer in the northwestern Pacific Ocean. Dokl. Earth Sci. 2017, 477, 1343–1347. [Google Scholar] [CrossRef]
- Byshev, V.; Neiman, V.; Romanov, Y.; Serykh, I. Global atmospheric oscillations in dynamic of the recent climate. Curr. Probl. Remote Sens. Earth Space 2014, 11, 62–71. (In Russian) [Google Scholar]
- Cheng, L.; Abraham, J.; Trenberth, K.; Fasullo, J.; Boyer, T.; Mann, M.; Zhu, J.; Wang, F.; Locarnini, R.; Li, Y.; et al. Another Year of Record Heat for the Oceans. Adv. Atm. Sci. 2023, 40, 963–974. [Google Scholar] [CrossRef] [PubMed]
- Ivanov, Y.; Koshlyakov, M.; Monin, A. The hydrophysical Experiment “Megapolygon”. In The Experiment “Megapolygon”; Nauka: Moscow, Russia, 1992; pp. 3–11. (In Russian) [Google Scholar]
- Byshev, V. On interconnection between currents and temperature in the zone of subarctic front of the Pacific Ocean (measured in the scope of “Megapolygon-87”). In The Experiment “Megapolygon”; Nauka: Moscow, Russia, 1992; pp. 272–290. (In Russian) [Google Scholar]
- Byshev, V. Synoptical and Large-Scale Variability of Ocean and the Atmosphere; Nauka: Moscow, Russia, 2003; 343p. [Google Scholar]
- Koshlyakov, M.; Maksimenko, N.; Panteleev, G.; Sazhina, T.G.; Yaremchuk, M. Structure and variability of the current field in the depths of the ocean according to direct measurements of currents at the “Megapolygon”. In The Experiment “Megapolygon”; Nauka: Moscow, Russia, 1992; pp. 251–259. (In Russian) [Google Scholar]
- Byshev, V.; Snopkov, V. On the formation of the sea surface temperature in the energy active zone of the northwestern part of the Pacific Ocean by the example of the test site “MEGAPOLYGON”. Russ. Meteorol. Hydrol. 1990, 11, 70–77. [Google Scholar]
- Ivanov, Y.; Morozov, E. Water transport in the Gulf Stream delta. Dokl. Earth Sci. 1991, 319, 487–490. (In Russian) [Google Scholar]
- Bubnov, V.; Byshev, V.; Volostnykh, B.; Golenko, N.; Egorikhin, V.; Zubin, A.; Paka, V. Frontal intrathermocline lens. Dokl. Earth Sci. 1991, 317, 453–458. (In Russian) [Google Scholar]
- Orlov, V. Approbation of a differential-parametric model of the ocean upper layer. Oceanol. Res. 1990, 43, 83–91. (In Russian) [Google Scholar]
- Byshev, V.; Orlov, V. On the nature of the intrathermoclinic lens on the subpolar front in the North Atlantic. J. Oceanol. 1993, 33, 340–346. (In Russian) [Google Scholar]
- Ivanov, Y.; Byshev, V.; Romanov, Y.; Sidorova, A. On the structure of the North Atlantic current in May–June 1990. J. Oceanol. Res. 2019, 47, 33–63. [Google Scholar] [CrossRef] [PubMed]
- Baranov, E. Structure and Dynamics of the Gulf Stream System Waters; Hydrometeoizdat: Moscow, Russia, 1988; 252p. (In Russian) [Google Scholar]
- Byshev, V.; Snopkov, V. Comparison of sea surface temperature (SST) at the MEGAPOLYGON based on hydrological survey data and Japanese maps and analysis of SST variability. In The Experiment “Megapolygon”; Nauka: Moscow, Russia, 1992; pp. 151–159. (In Russian) [Google Scholar]
- Byshev, V.; Koprova, L.; Romanov, Y. Formation of ocean surface temperature anomalies in the Newfoundland energy active zone in May–June 1990. Russ. Meteorol. Hydrol. 1996, 1, 57–65. [Google Scholar]
- Byshev, V.; Egorikhin, V.; Maksimenko, N.; Sobol, V. Structure and synoptical variability of the North Atlantic Current on the meridional section along 36° W in summer 1990. Dokl. Earth Sci. 1997, 355, 397–400. (In Russian) [Google Scholar]
- Byshev, V.; Usychenko, I. Temperature structure of Gulf Stream delta waters in May and June 1990. Dokl. Earth Sci. 1996, 345 A, 133–136. [Google Scholar]
- Byshev, V.; Koprova, L.; Navrotskaya, S.; Pozdnyakova, T.; Romanov, Y. Anomalous state of the Newfoundland energy active zone in 1990. Dokl. Earth Sci. 1993, 331, 735–738. (In Russian) [Google Scholar]
- De Verdière, A.; Merchier, H.; Arhan, M. Mesoscale Variability Transition from the Western to the Eastern Atlantic along 48° N. J. Phys. Oceanogr. 1989, 19, 1149–1170. [Google Scholar] [CrossRef]
- Katz, E. Diffusion of the core of Mediterranean Water above the Mid-Atlantic Ridge crest. Deep Sea Res. Oceanogr. Abstr. 1970, 17, 611–625. [Google Scholar] [CrossRef]
- Dzerdzeyevskii, B. Circulation Mechanisms in the Atmosphere of the Northern Hemisphere in 20th Century; Institute of Geography: Moscow, Soviet Union, 1968; 240p. (In Russian) [Google Scholar]
- Calendar of successive changes of the elementary circulation mechanisms over an 87-year period (1899–1985). In Proceedings of the Meteorological Researches; Interdepartmental Geophysical Committee of the AS of the Soviet Union: Moscow, Soviet Union, 1987; Chapter 13; pp. 29–116. (In Russian)
- Kononova, N. Classification of Circulation Mechanisms of the Northern Hemisphere According to L.B. Dzerdzeevskii; Voentekhinizdat: Moscow, Russia, 2009; 371p. (In Russian) [Google Scholar]
- Palmén, E.; Newton, C. (Eds.) Atmospheric Circulation Systems. Their Structure and Physical Iterpretation; International Geophysics; Academic Press: New York, NY, USA, 1969; 603p. [Google Scholar]


Disclaimer/Publisher’s Note: The statements, opinions and data contained in all publications are solely those of the individual author(s) and contributor(s) and not of MDPI and/or the editor(s). MDPI and/or the editor(s) disclaim responsibility for any injury to people or property resulting from any ideas, methods, instructions or products referred to in the content. |
© 2024 by the authors. Licensee MDPI, Basel, Switzerland. This article is an open access article distributed under the terms and conditions of the Creative Commons Attribution (CC BY) license (https://creativecommons.org/licenses/by/4.0/).
Share and Cite
Byshev, V.; Gusev, A.; Sidorova, A. Multidecadal Phase Changes in the Thermodynamic State of the System: Ocean–Atmosphere–Continent. J. Mar. Sci. Eng. 2024, 12, 758. https://doi.org/10.3390/jmse12050758
Byshev V, Gusev A, Sidorova A. Multidecadal Phase Changes in the Thermodynamic State of the System: Ocean–Atmosphere–Continent. Journal of Marine Science and Engineering. 2024; 12(5):758. https://doi.org/10.3390/jmse12050758
Chicago/Turabian StyleByshev, Vladimir, Anatoly Gusev, and Alexandra Sidorova. 2024. "Multidecadal Phase Changes in the Thermodynamic State of the System: Ocean–Atmosphere–Continent" Journal of Marine Science and Engineering 12, no. 5: 758. https://doi.org/10.3390/jmse12050758
APA StyleByshev, V., Gusev, A., & Sidorova, A. (2024). Multidecadal Phase Changes in the Thermodynamic State of the System: Ocean–Atmosphere–Continent. Journal of Marine Science and Engineering, 12(5), 758. https://doi.org/10.3390/jmse12050758