
Hurricane Ian Damage Assessment Using Aerial Imagery and LiDAR: A Case Study of Estero Island, Florida

Abstract
1. Introduction
2. Methods
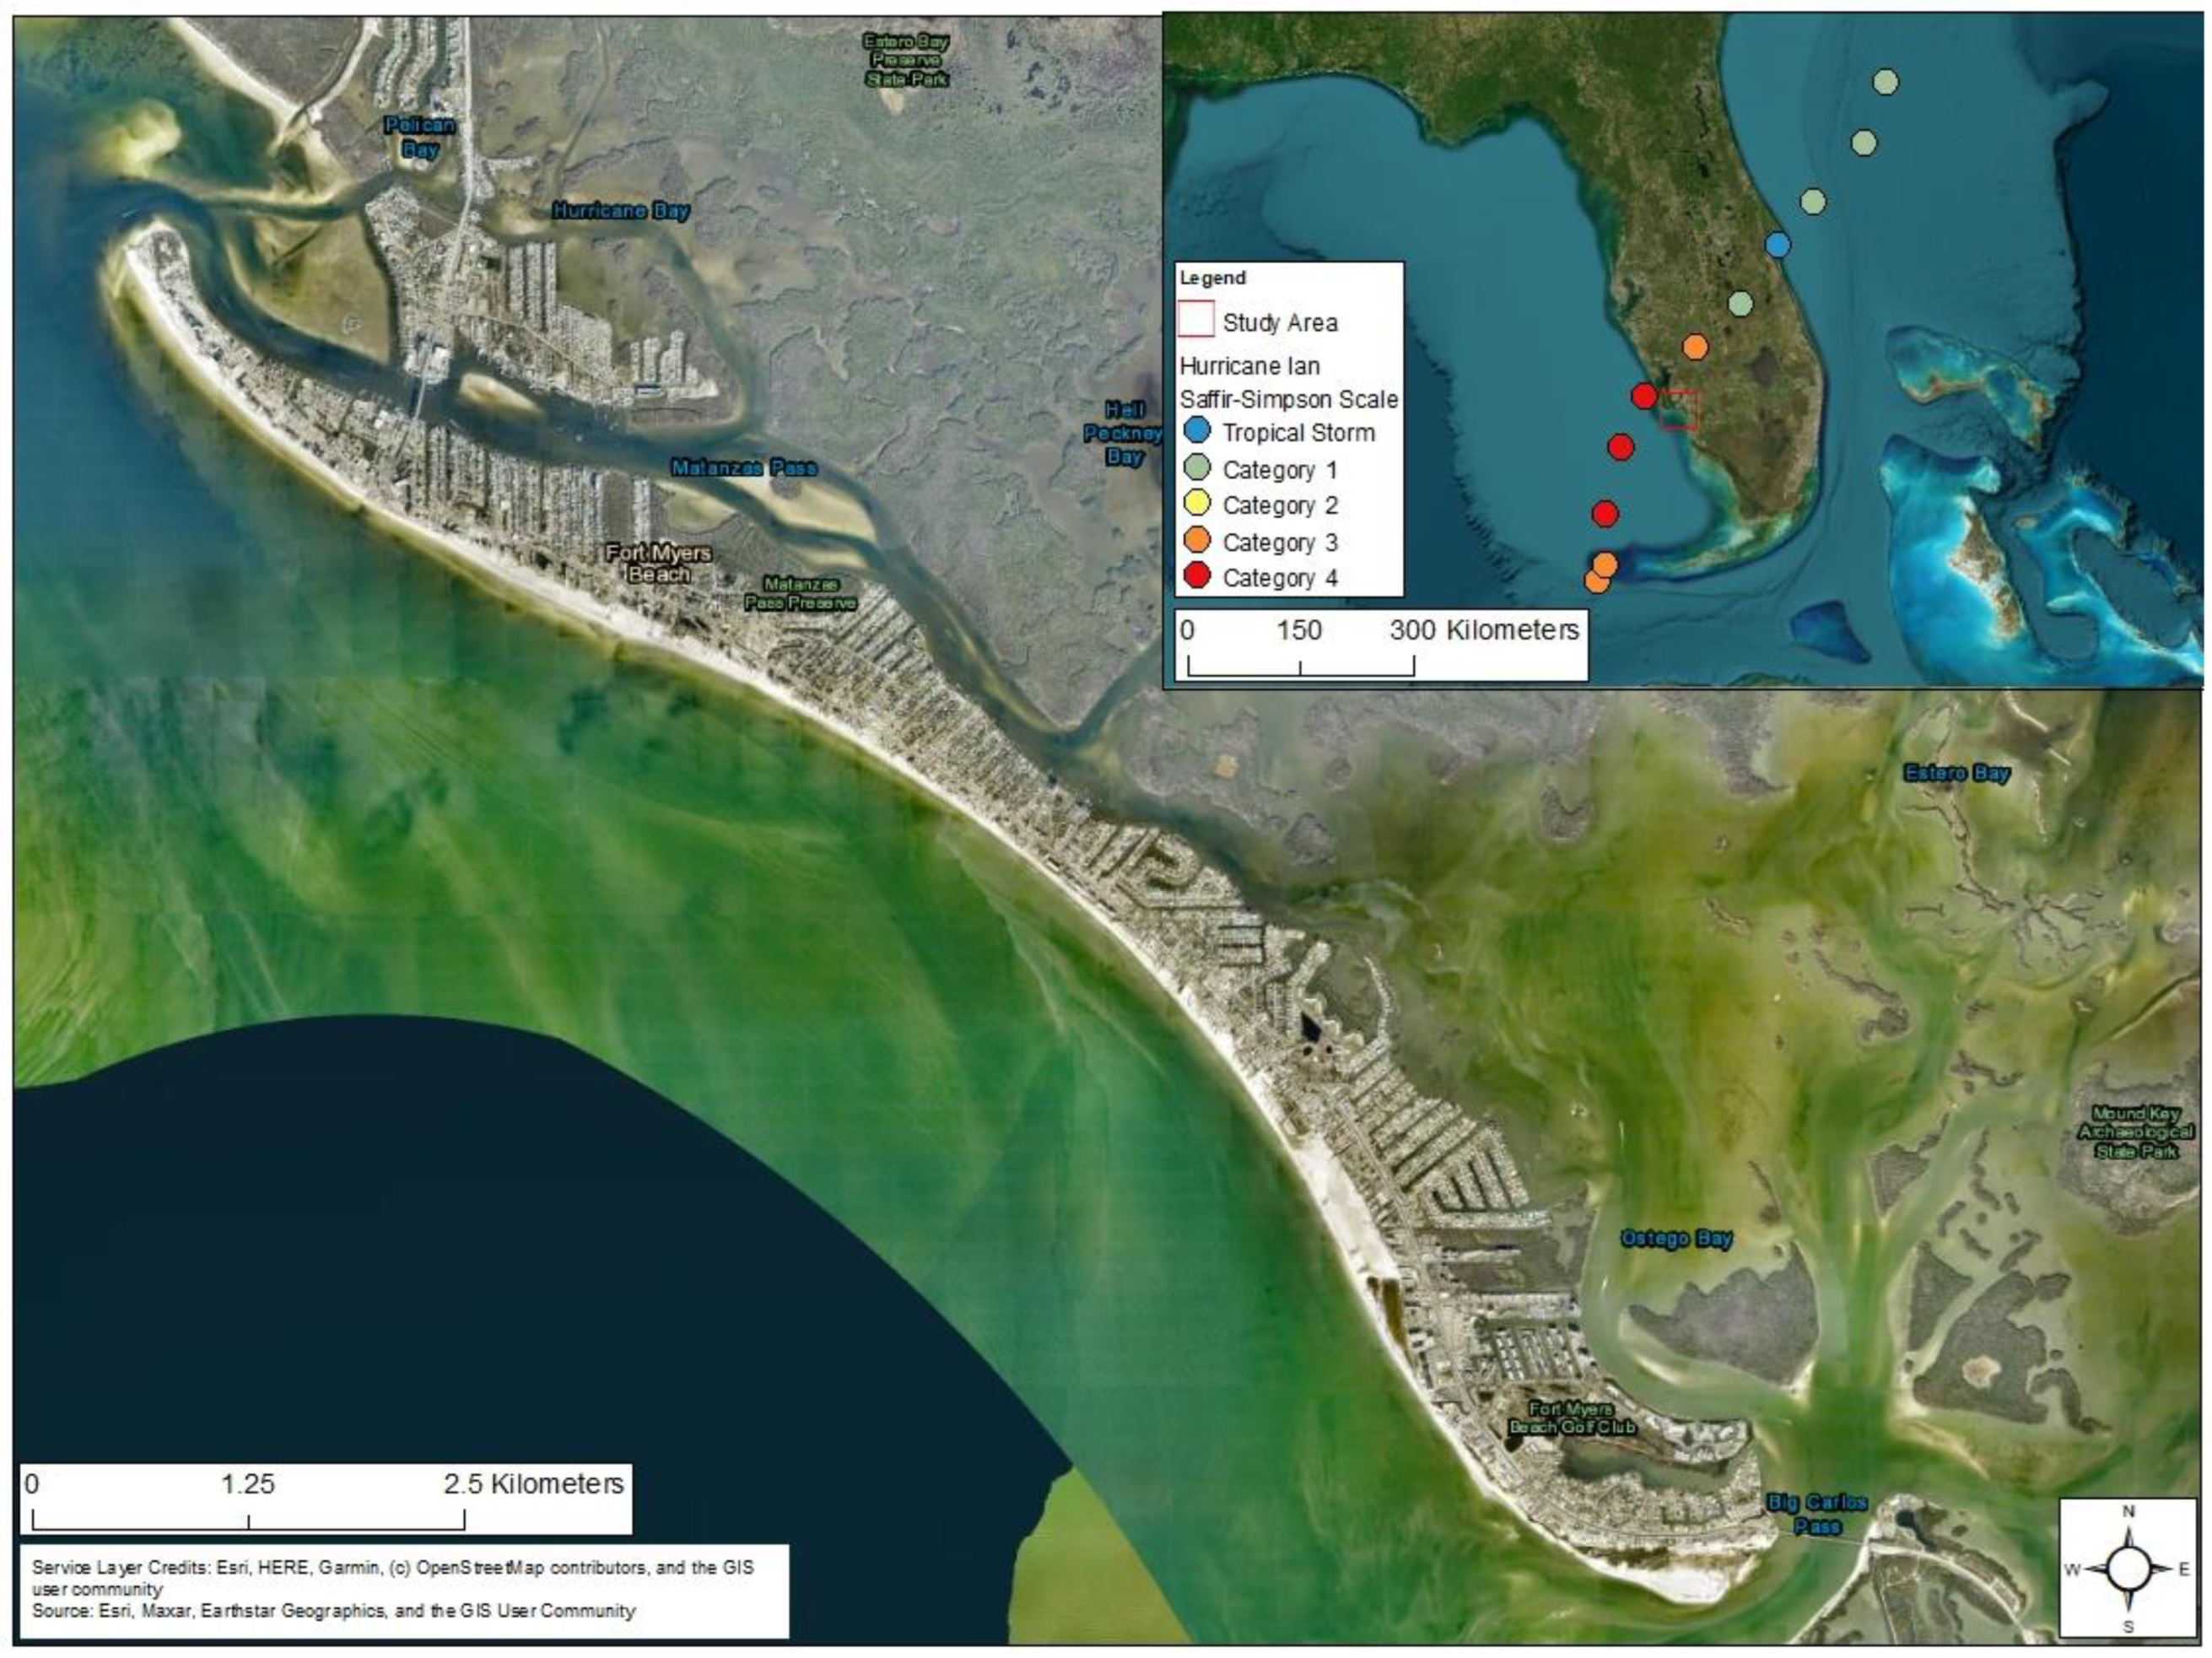
2.1. Study Area
2.2. Data Processing
2.3. Data Analysis
3. Results
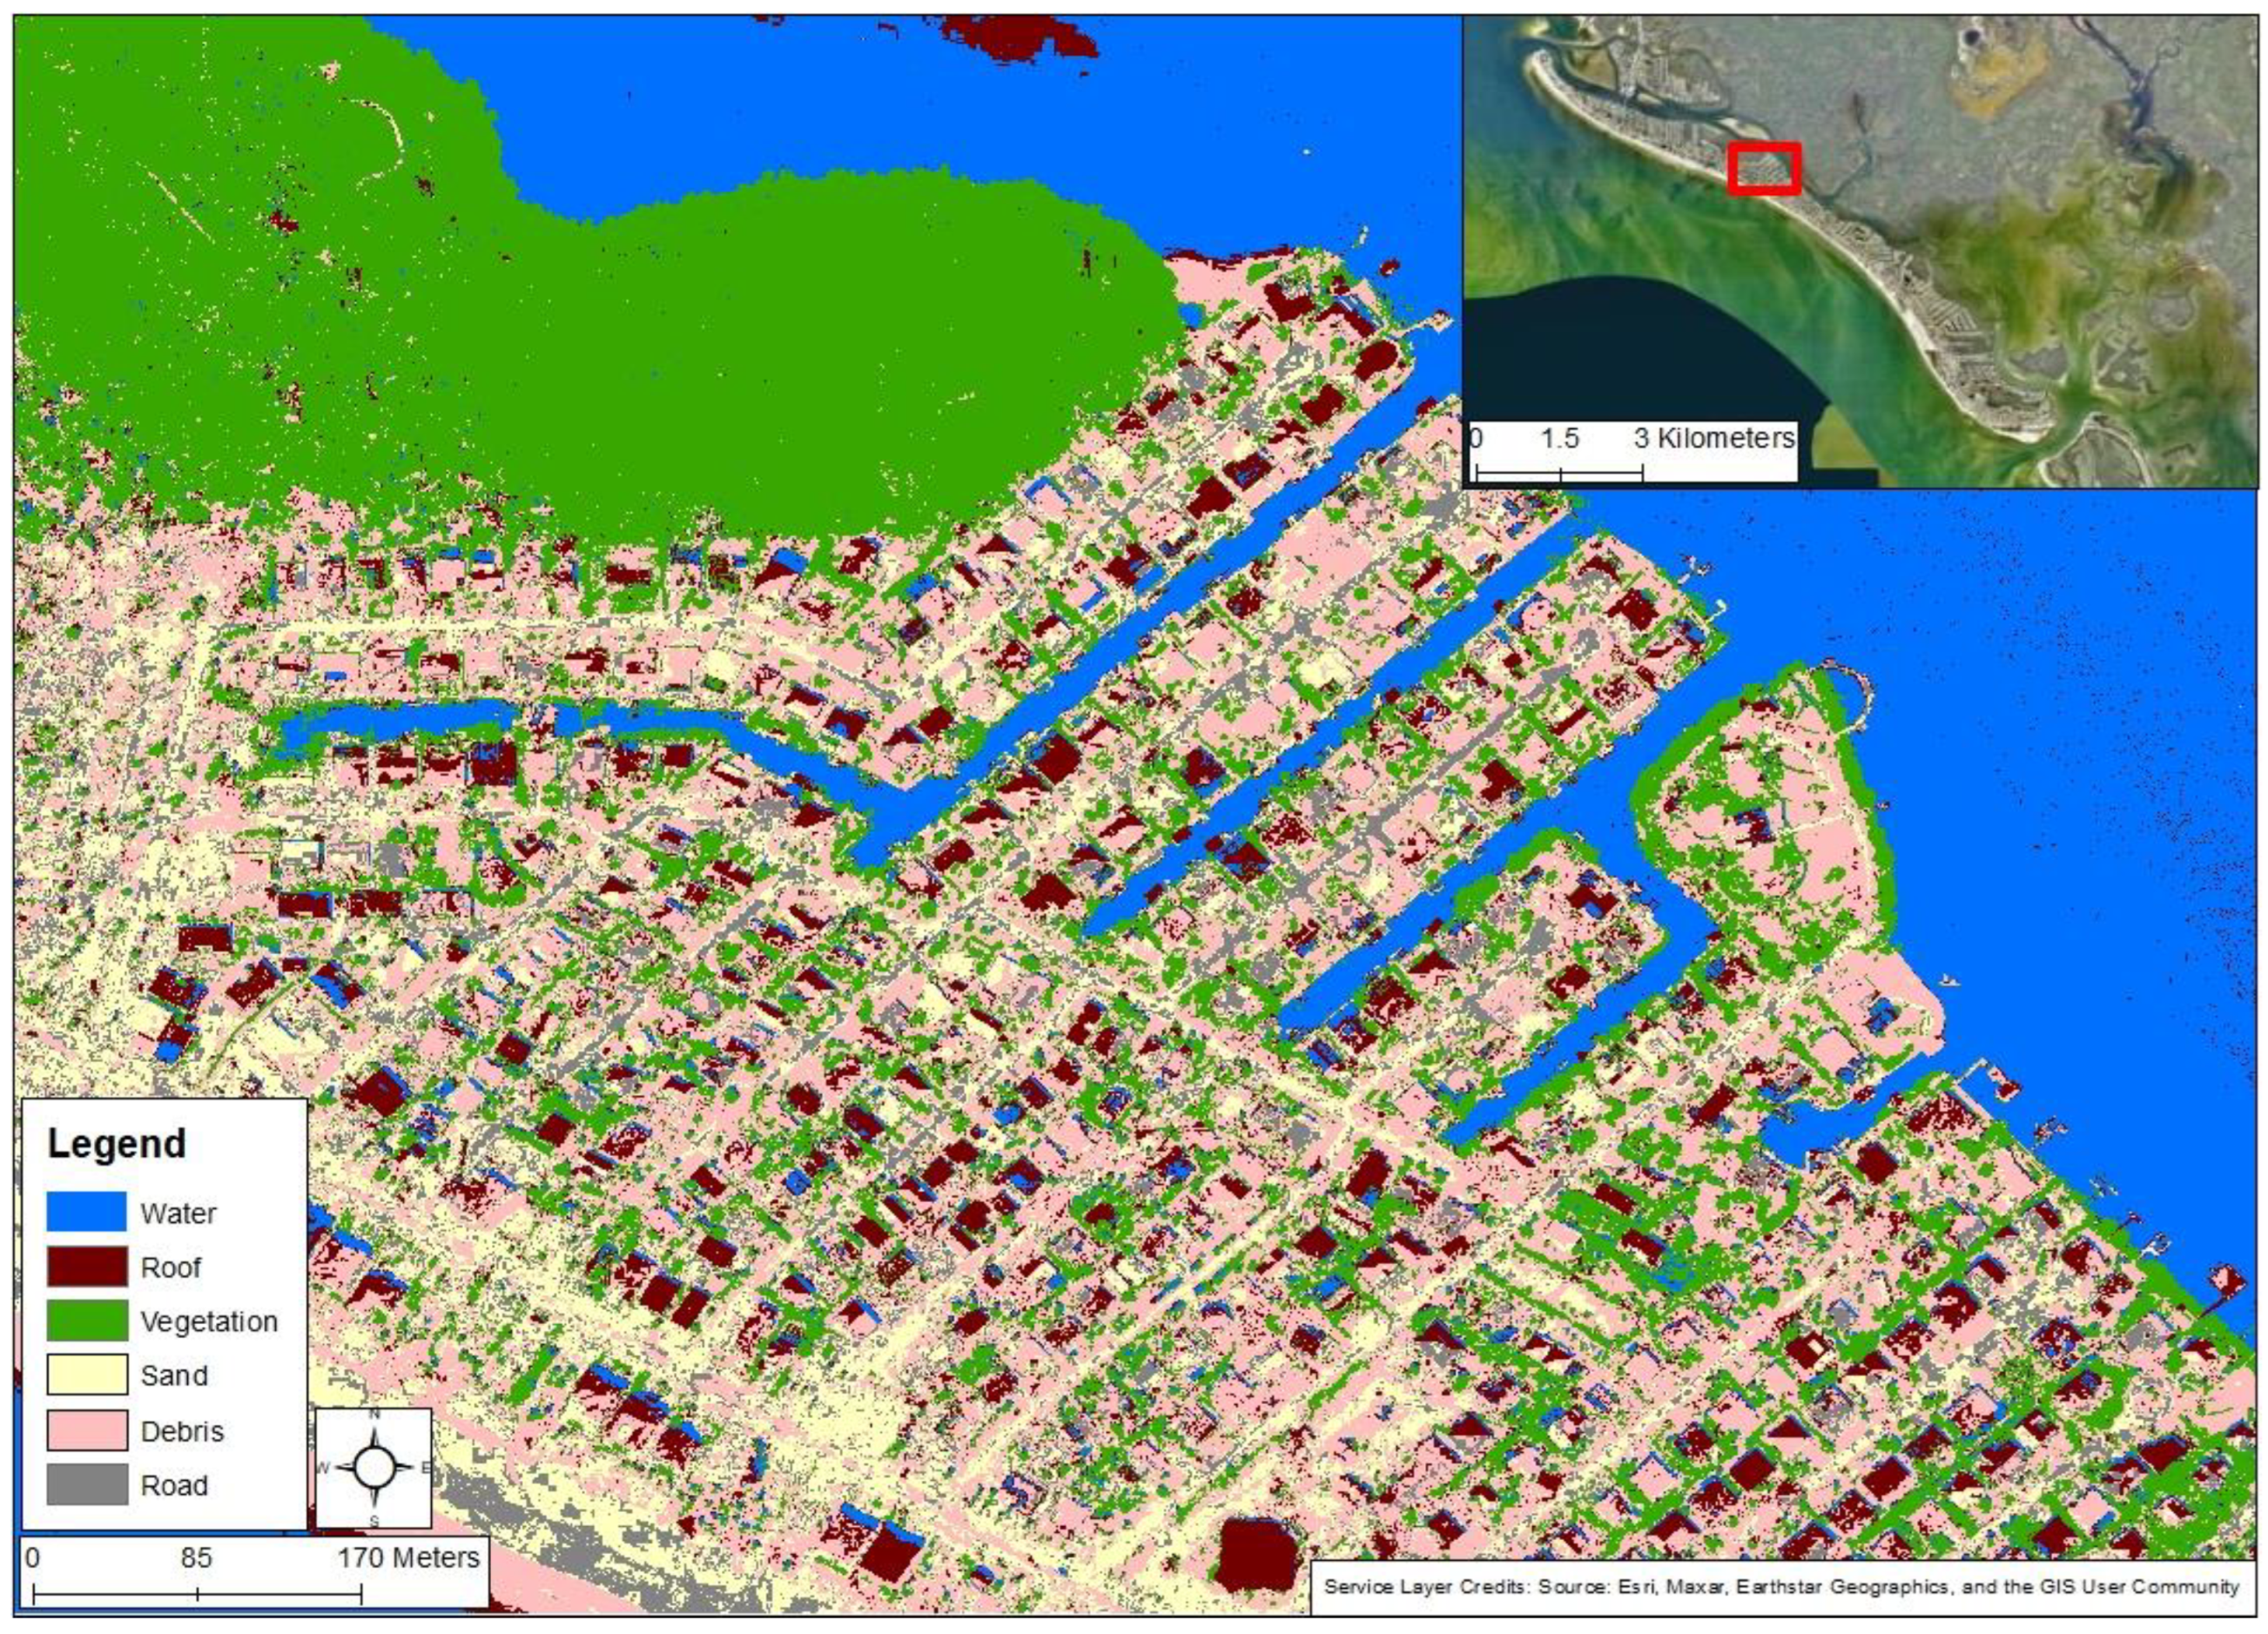
3.1. Rapid Assessment through Image Classification
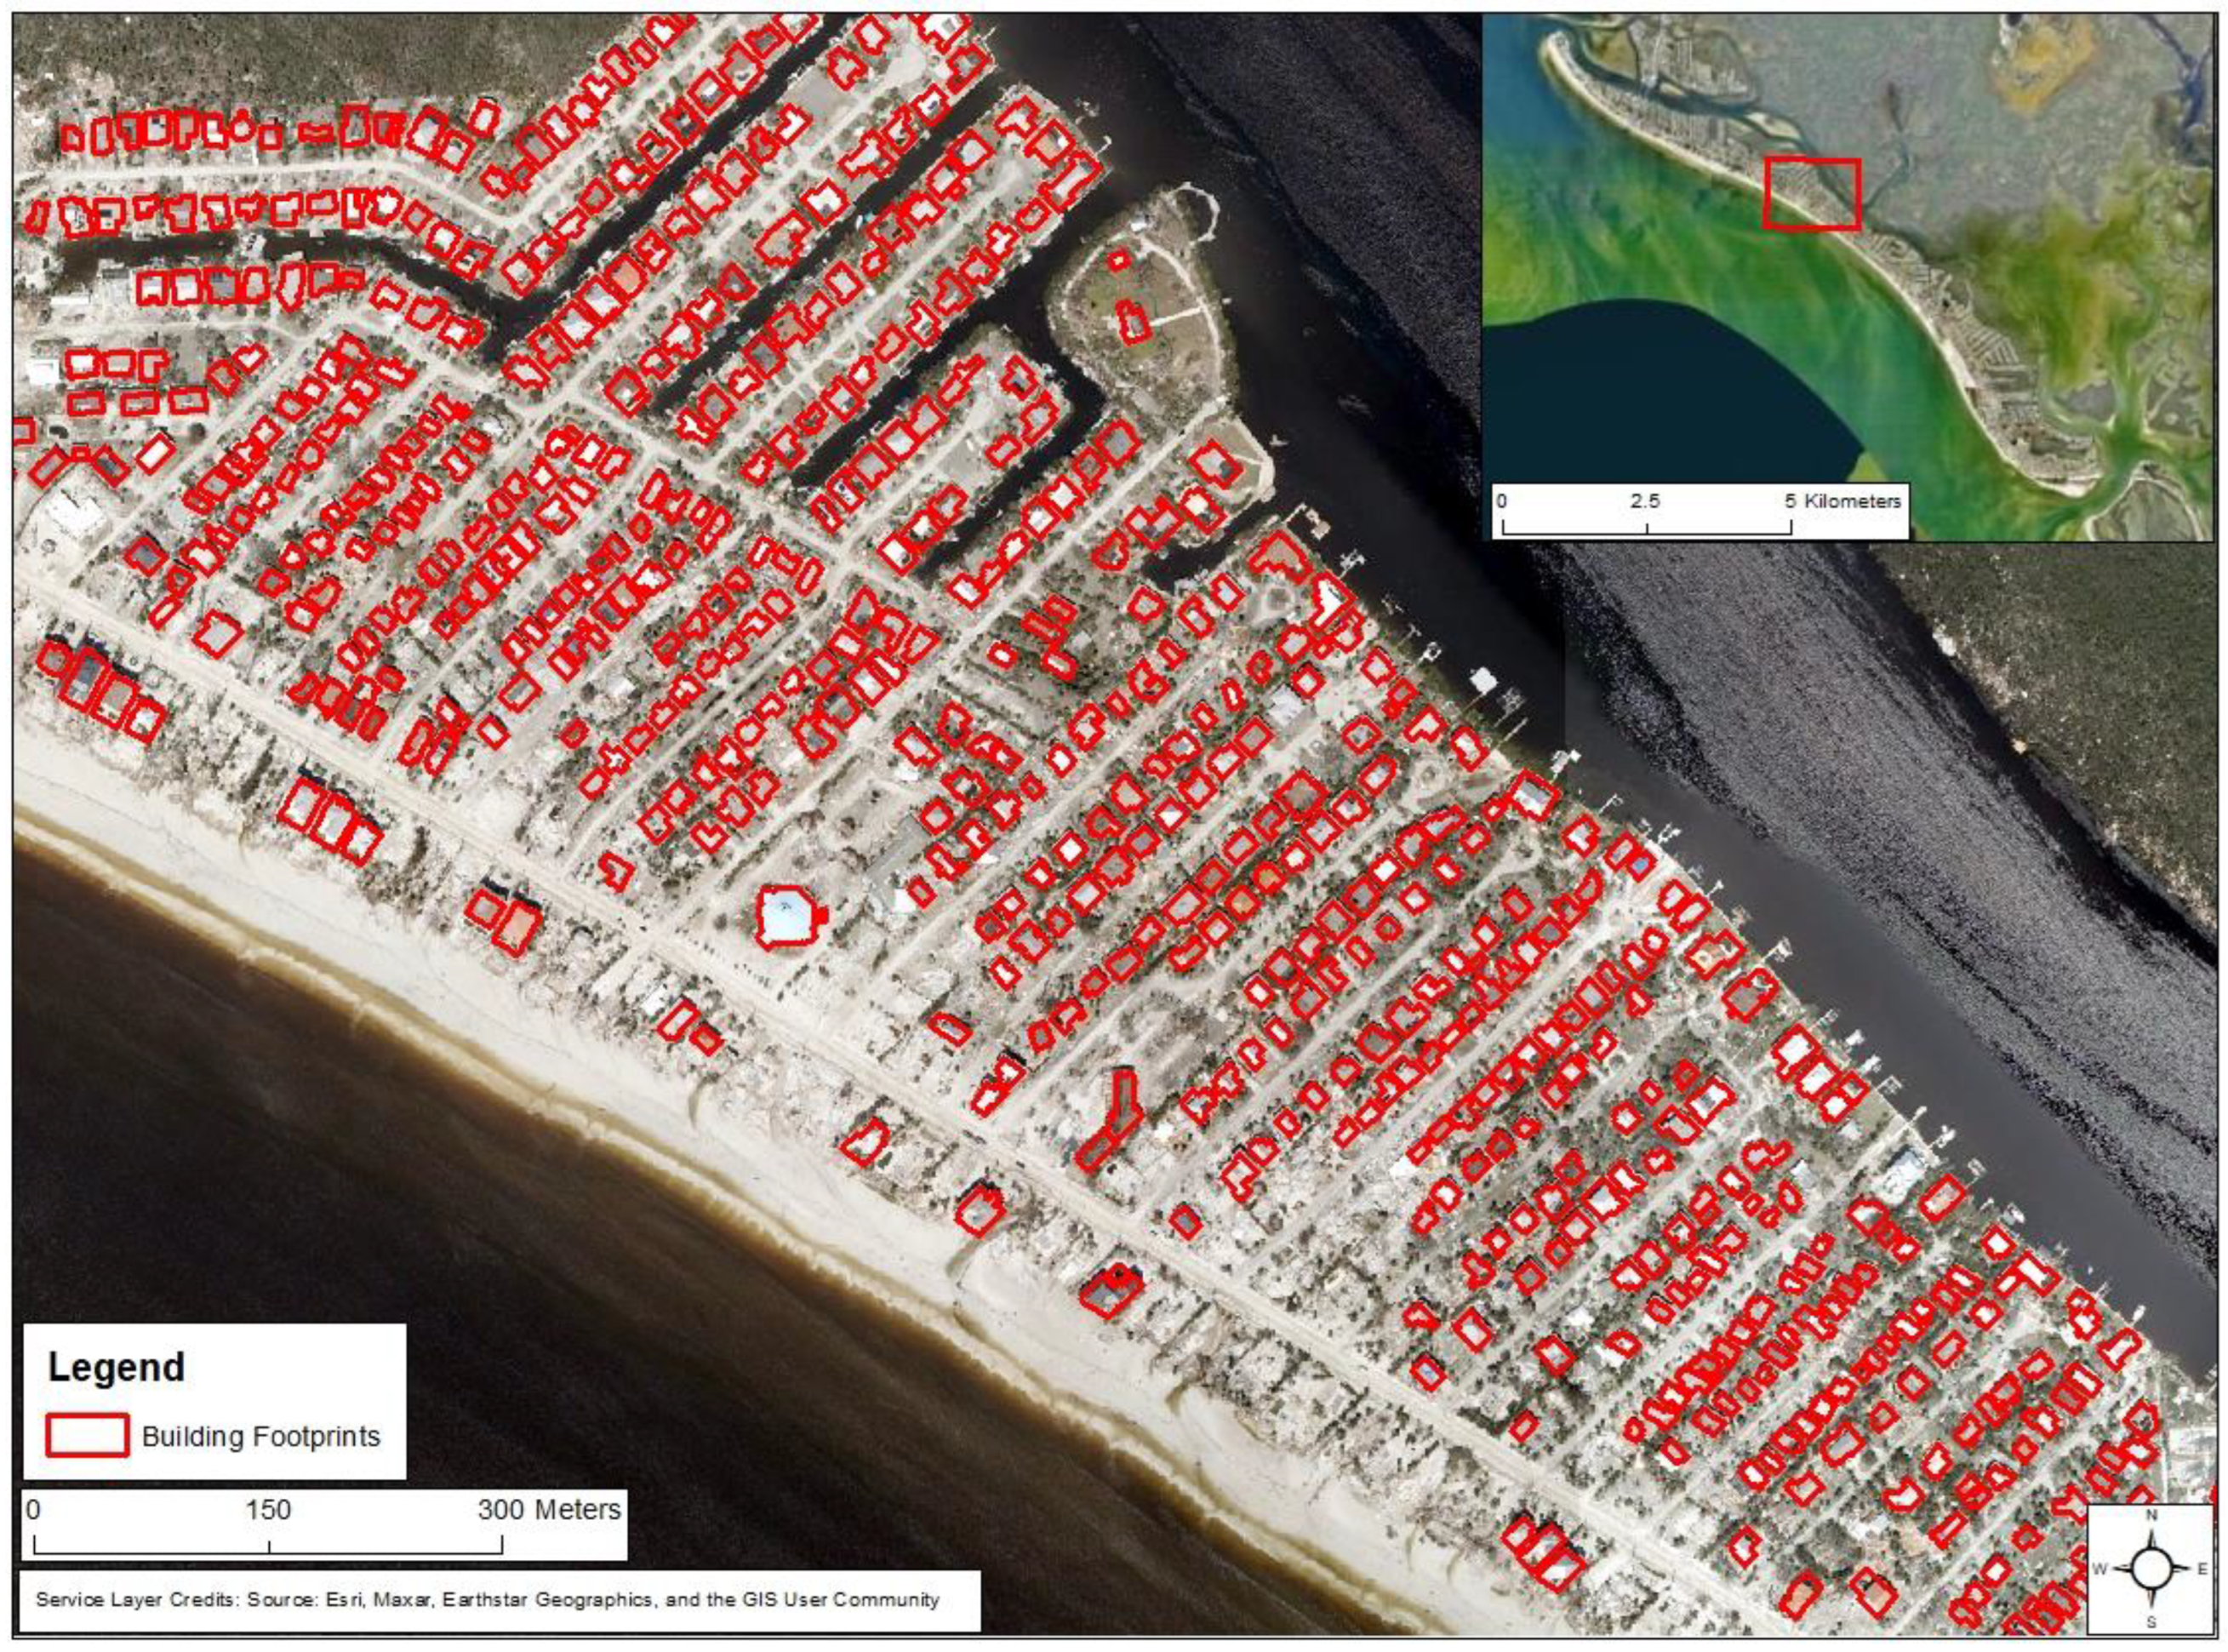
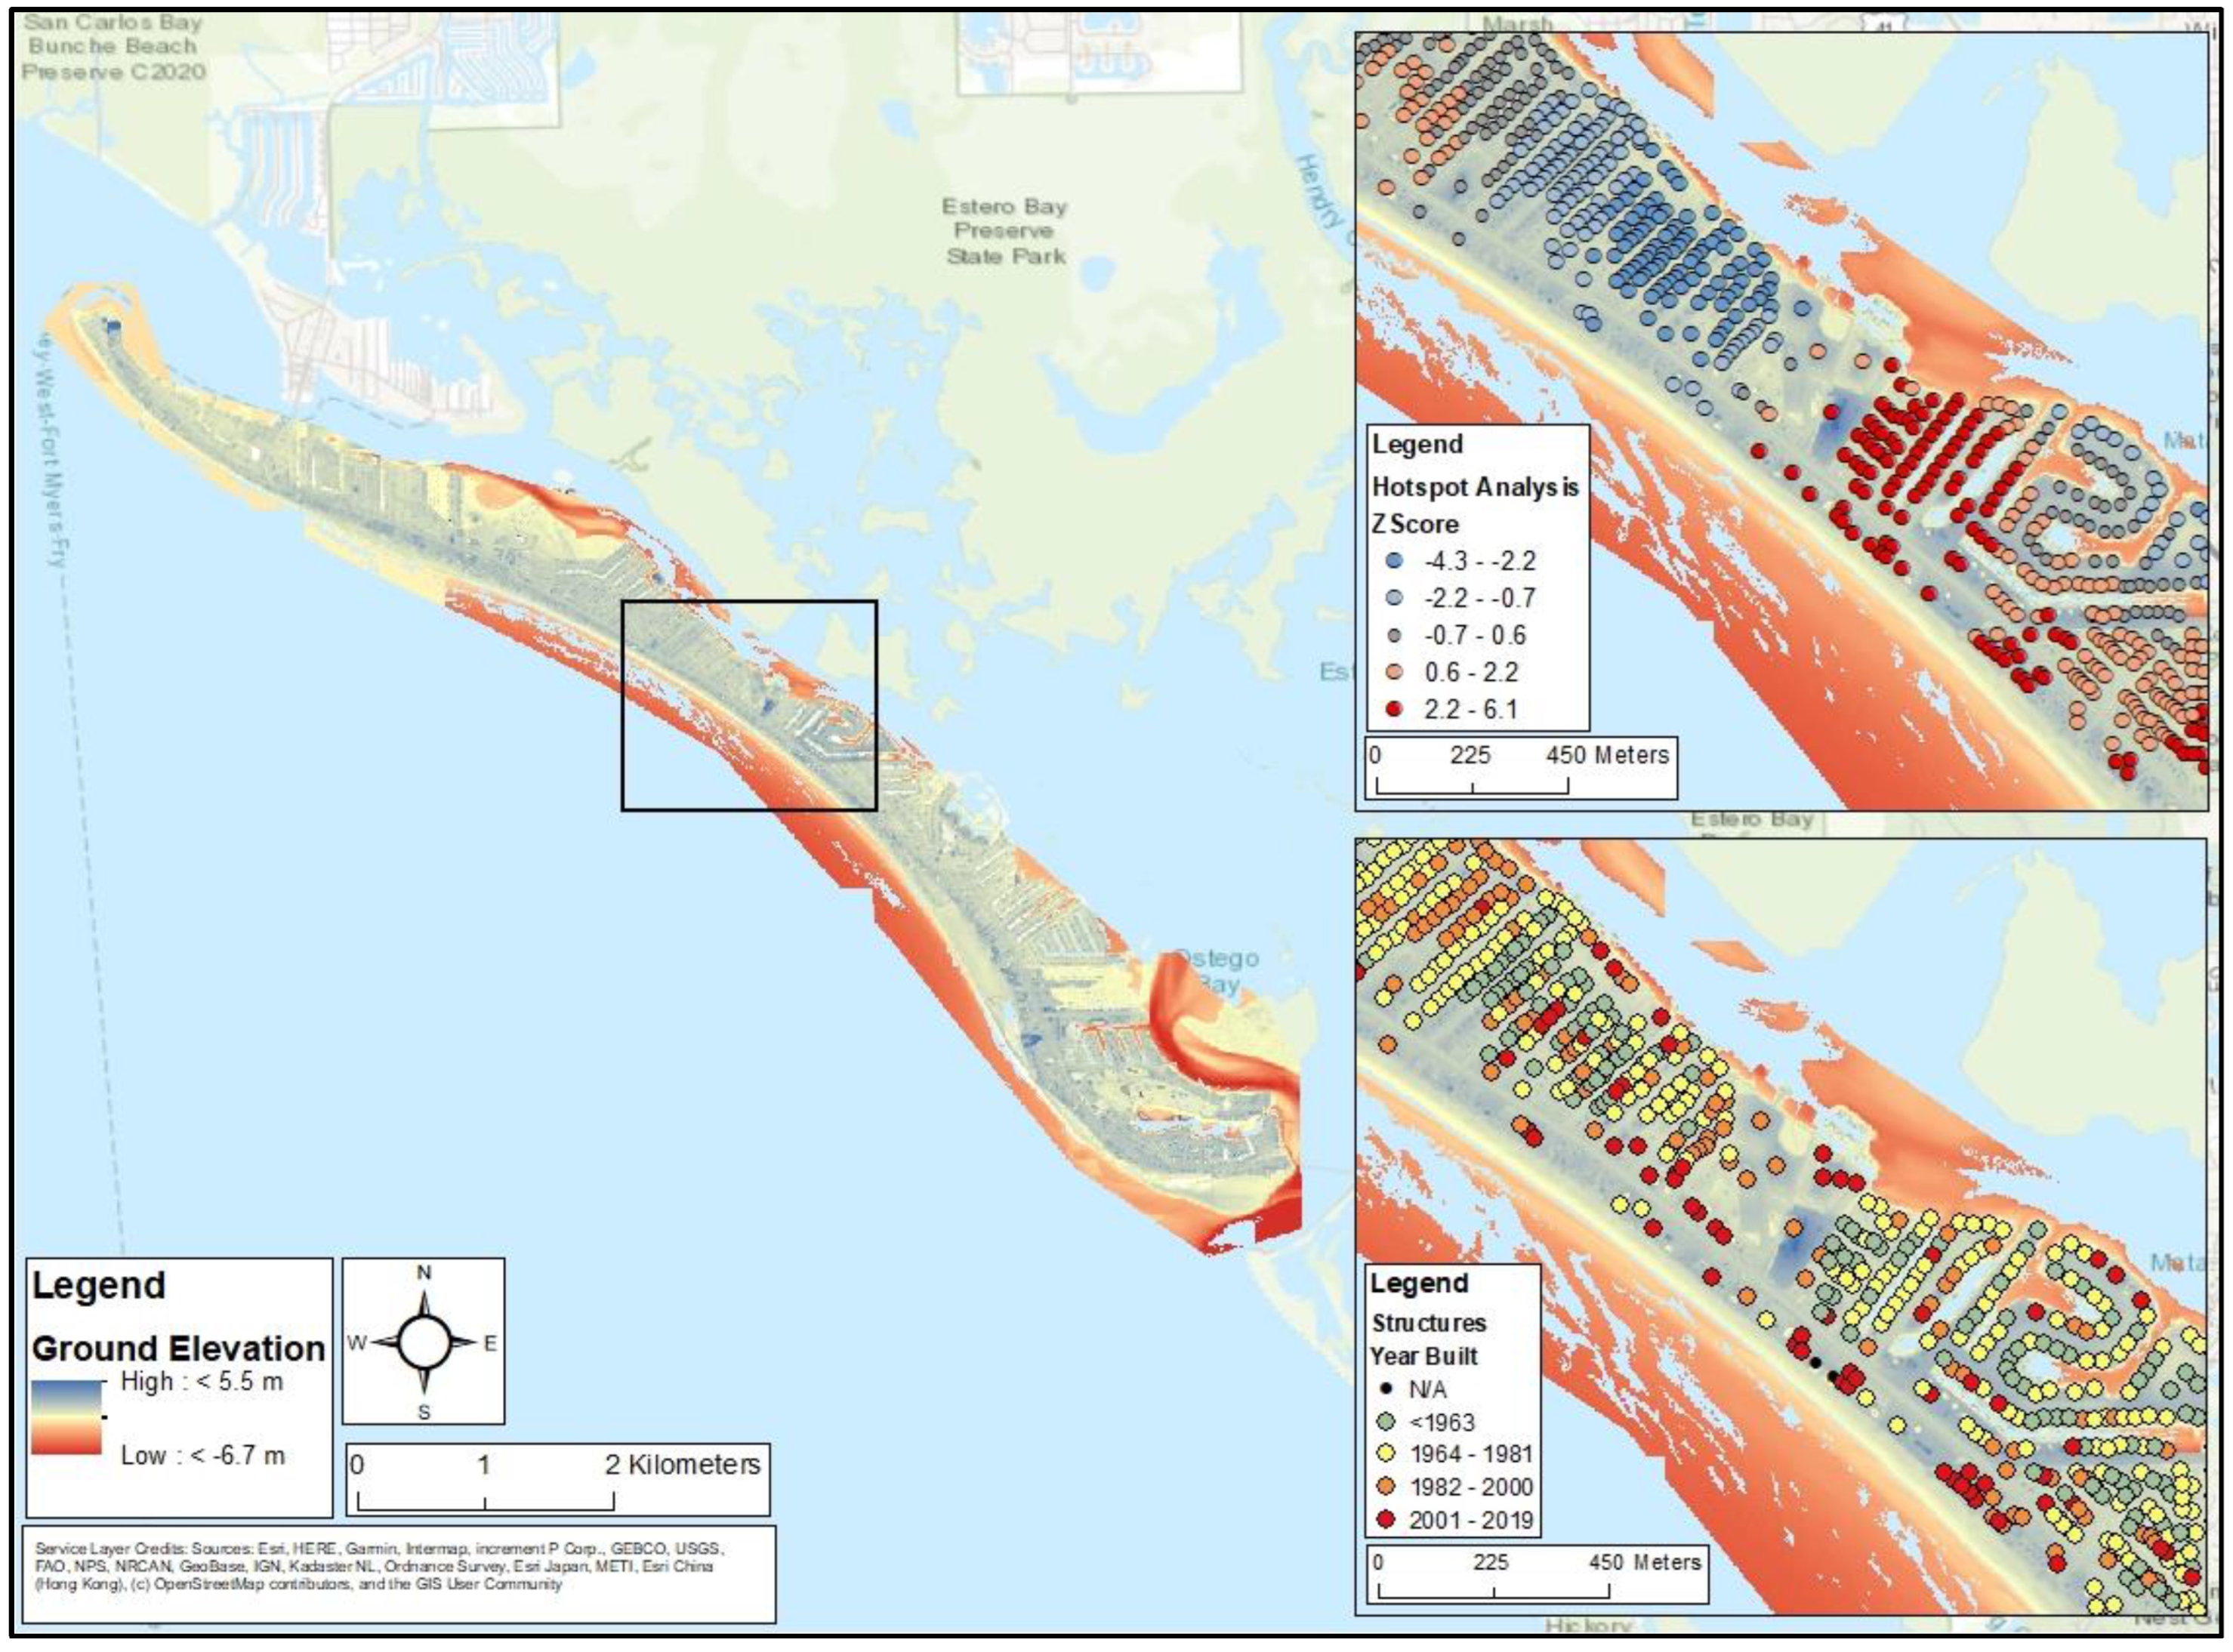
3.2. Housing Damage Assessment
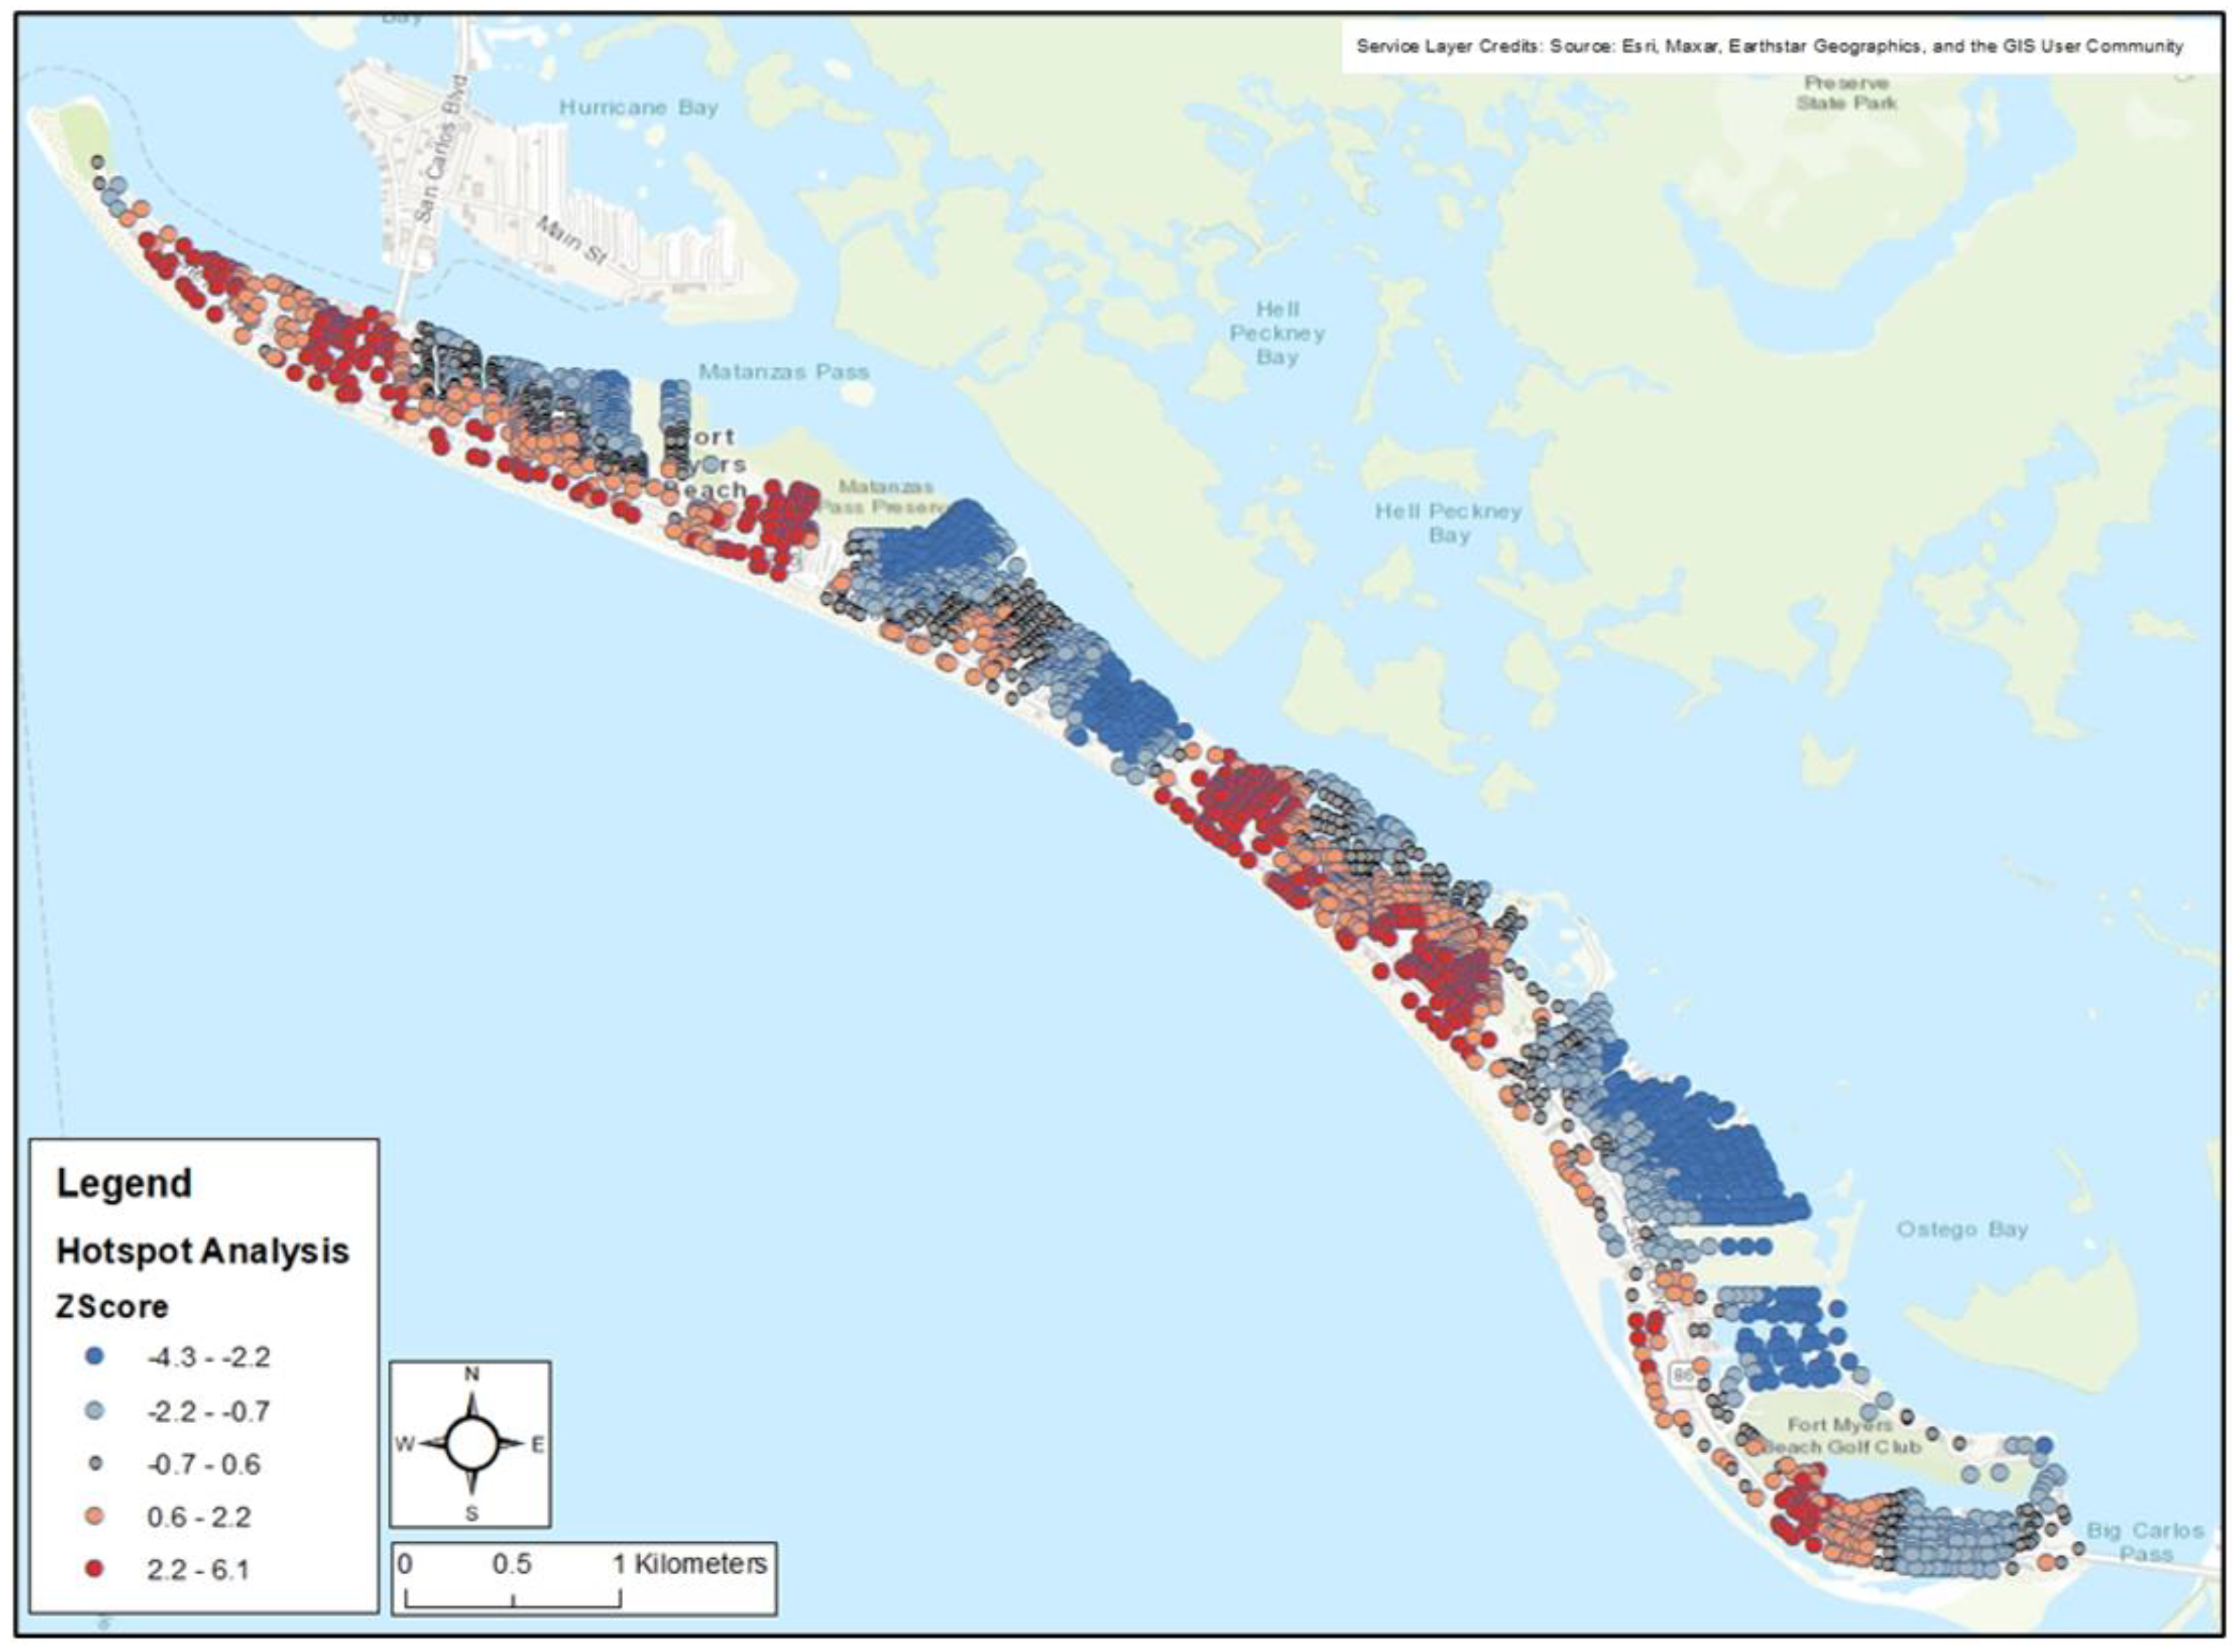
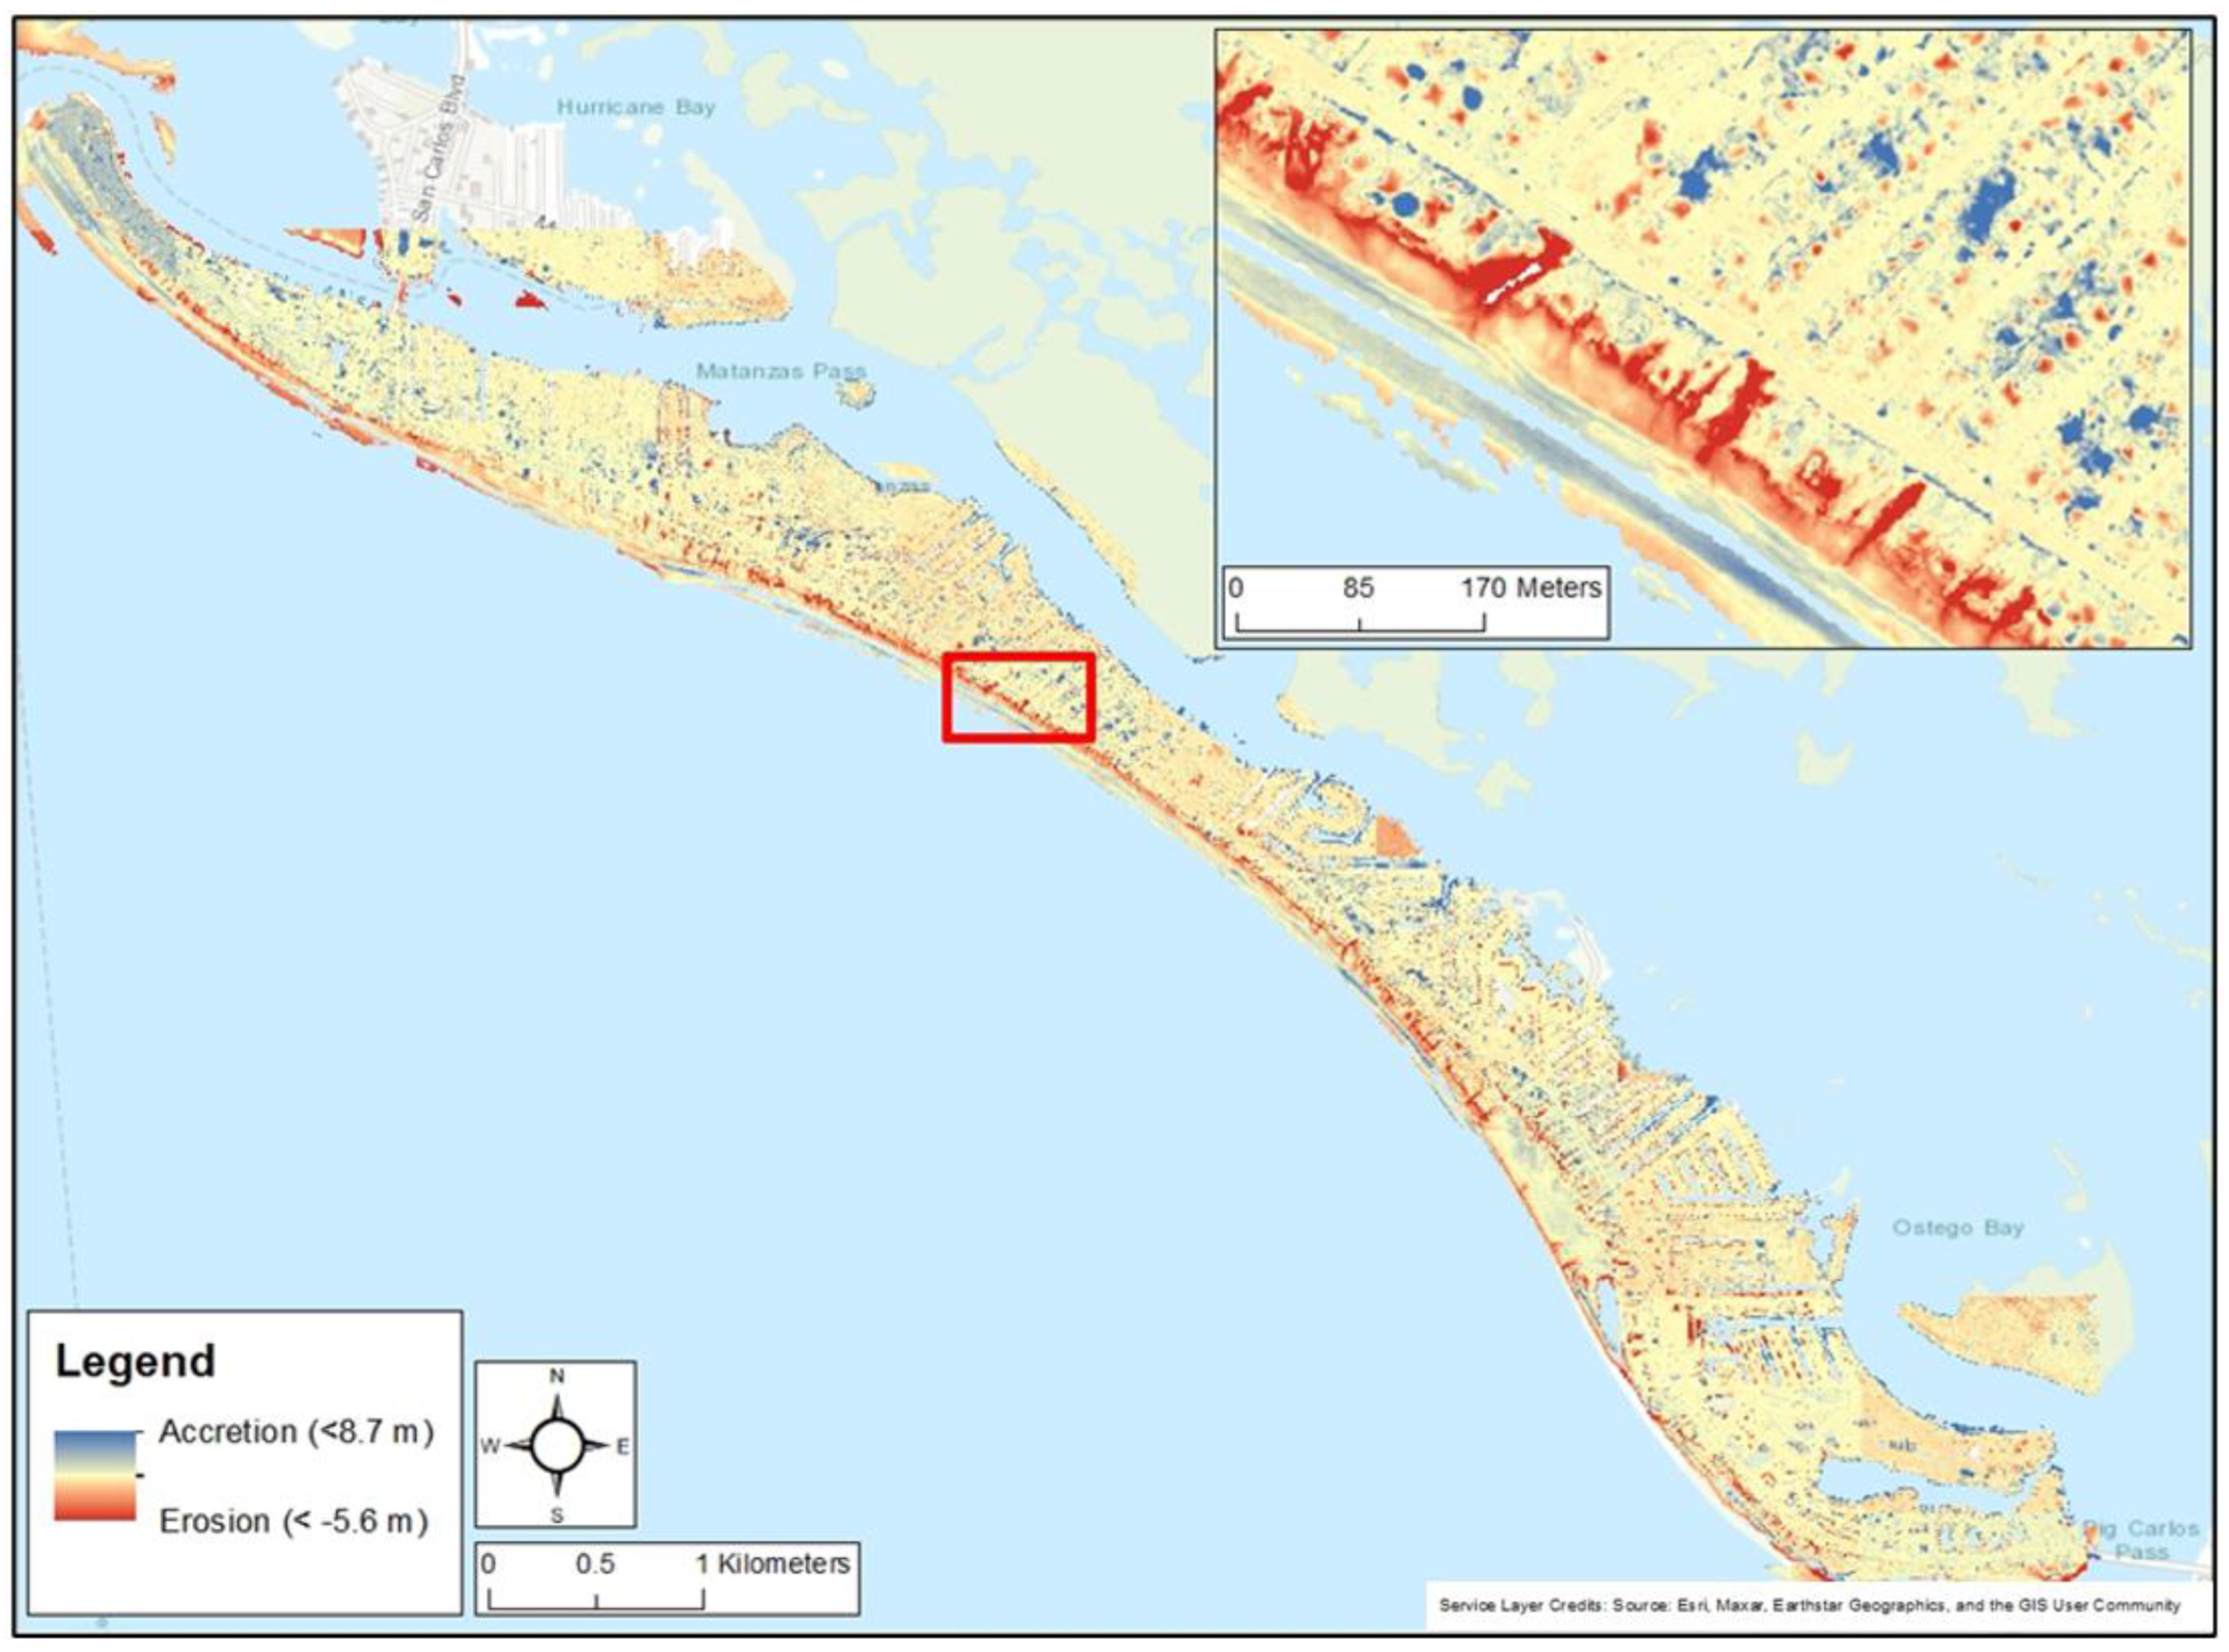
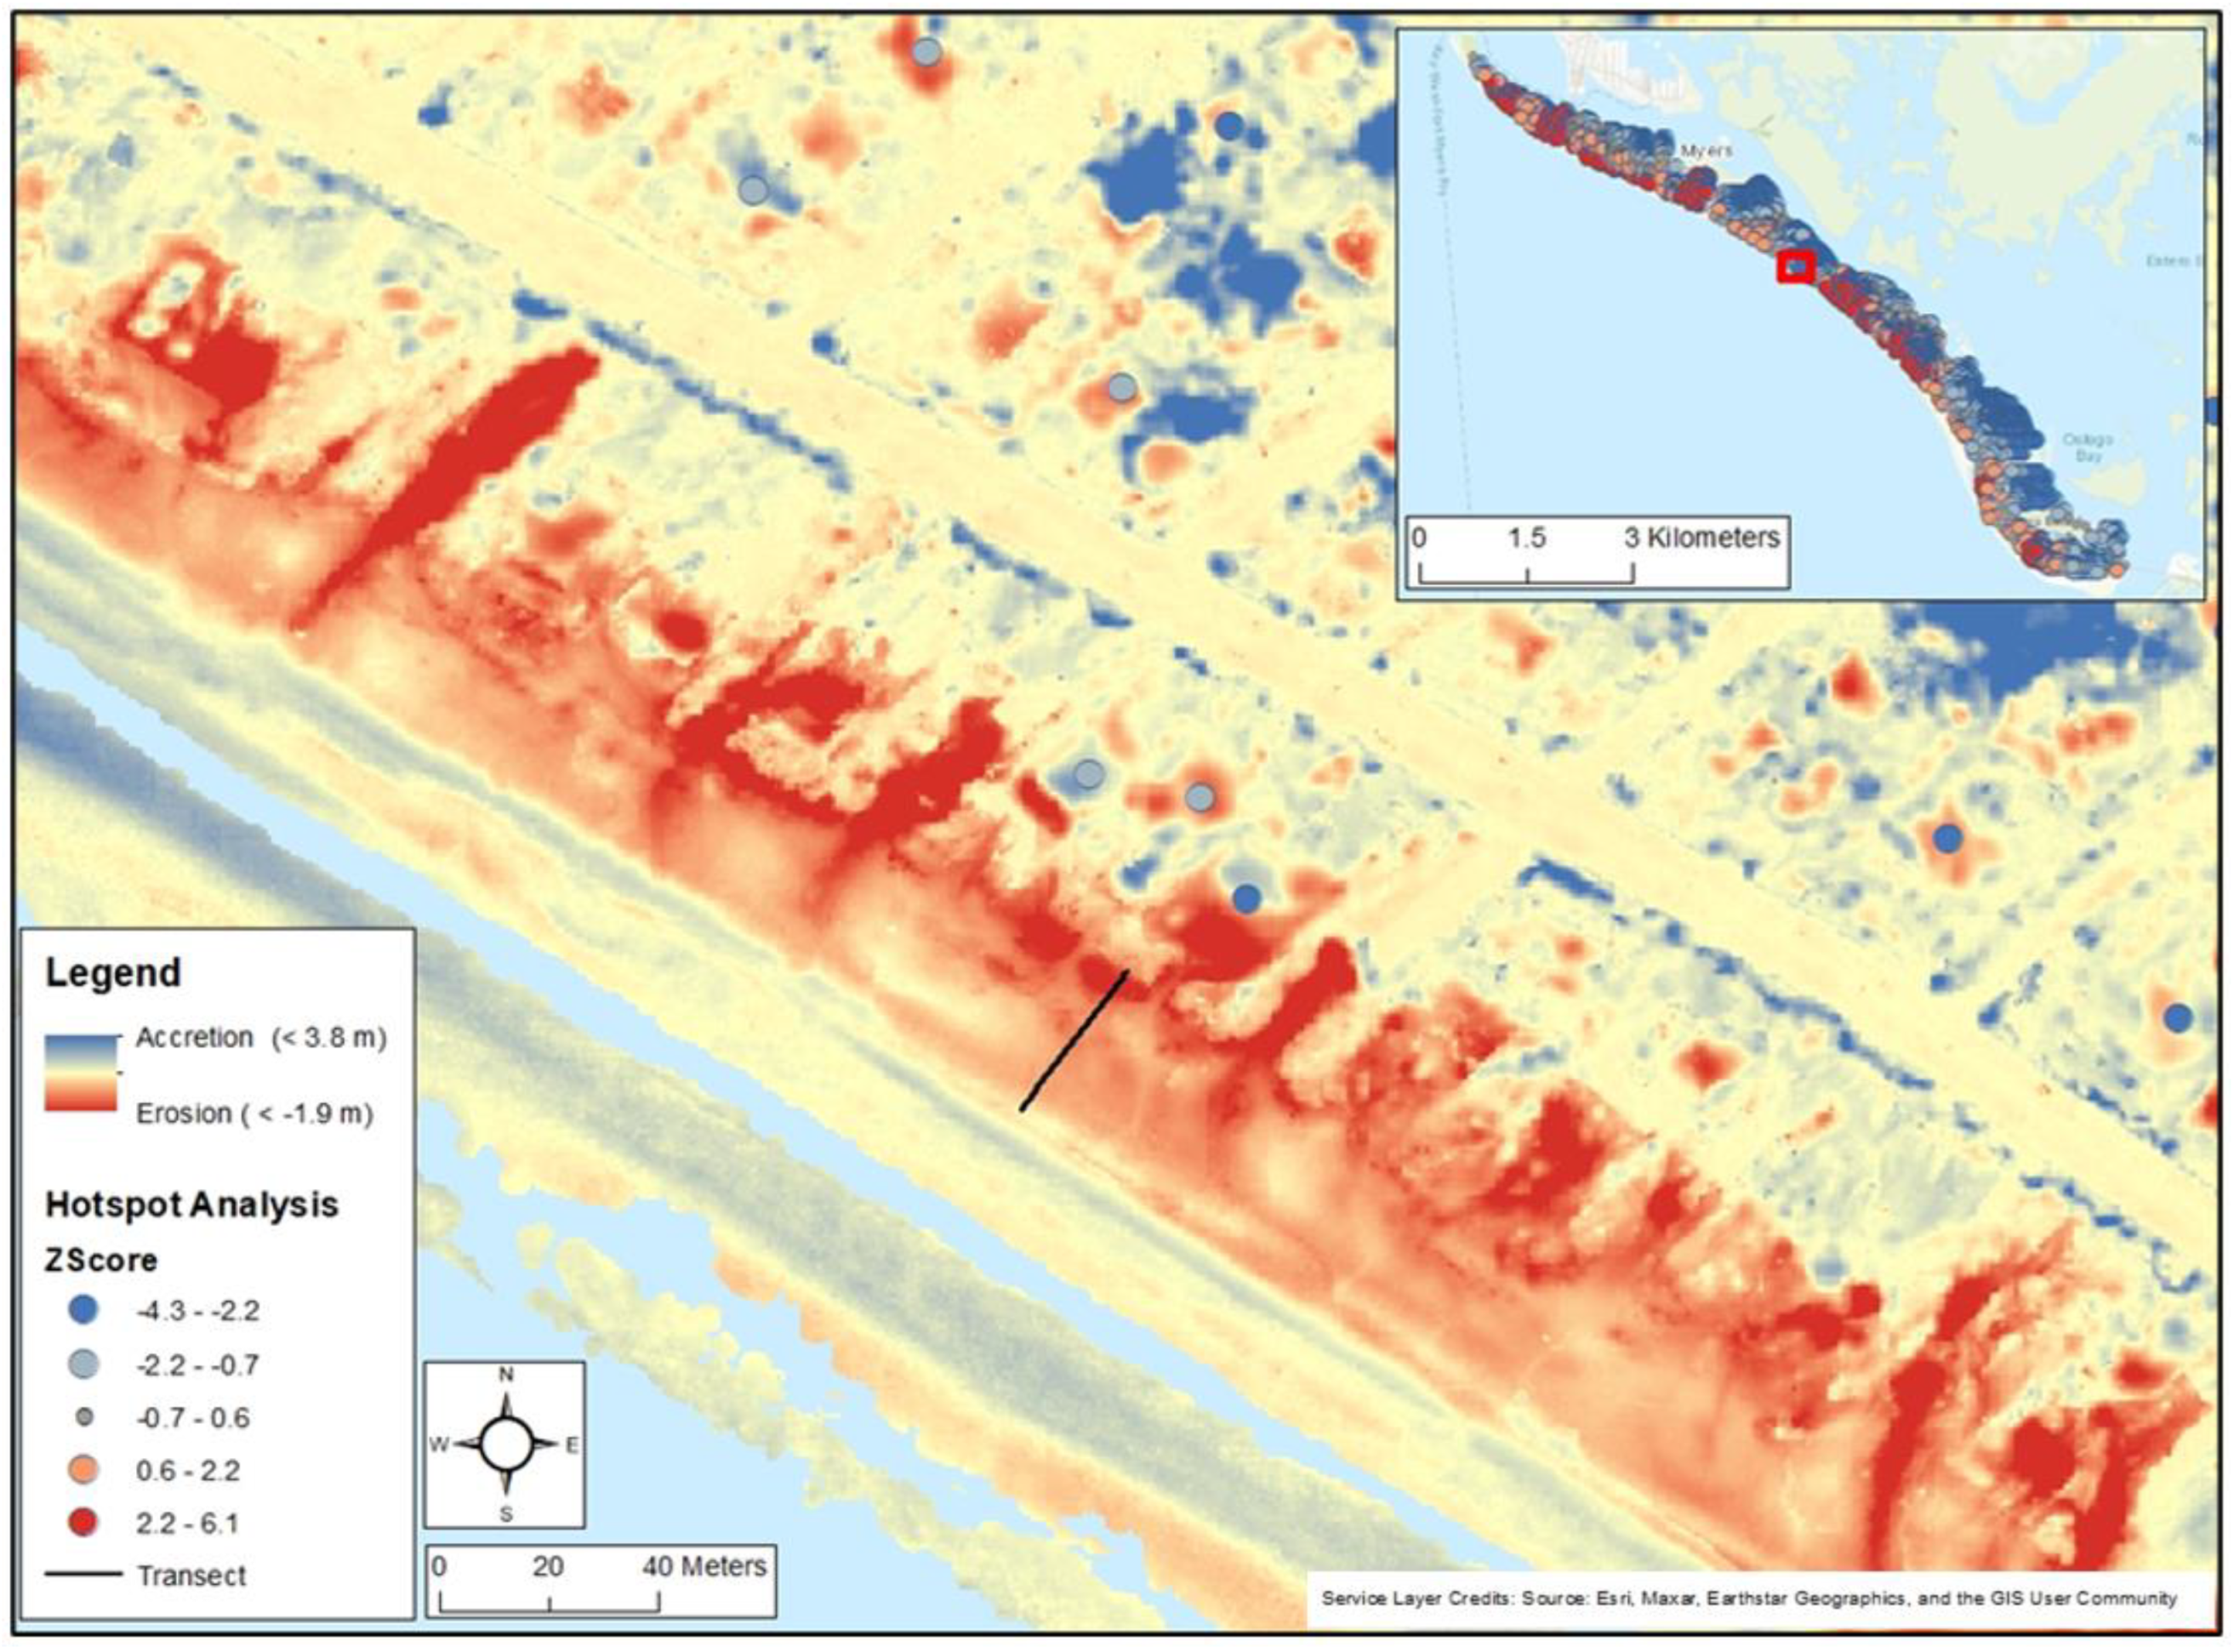
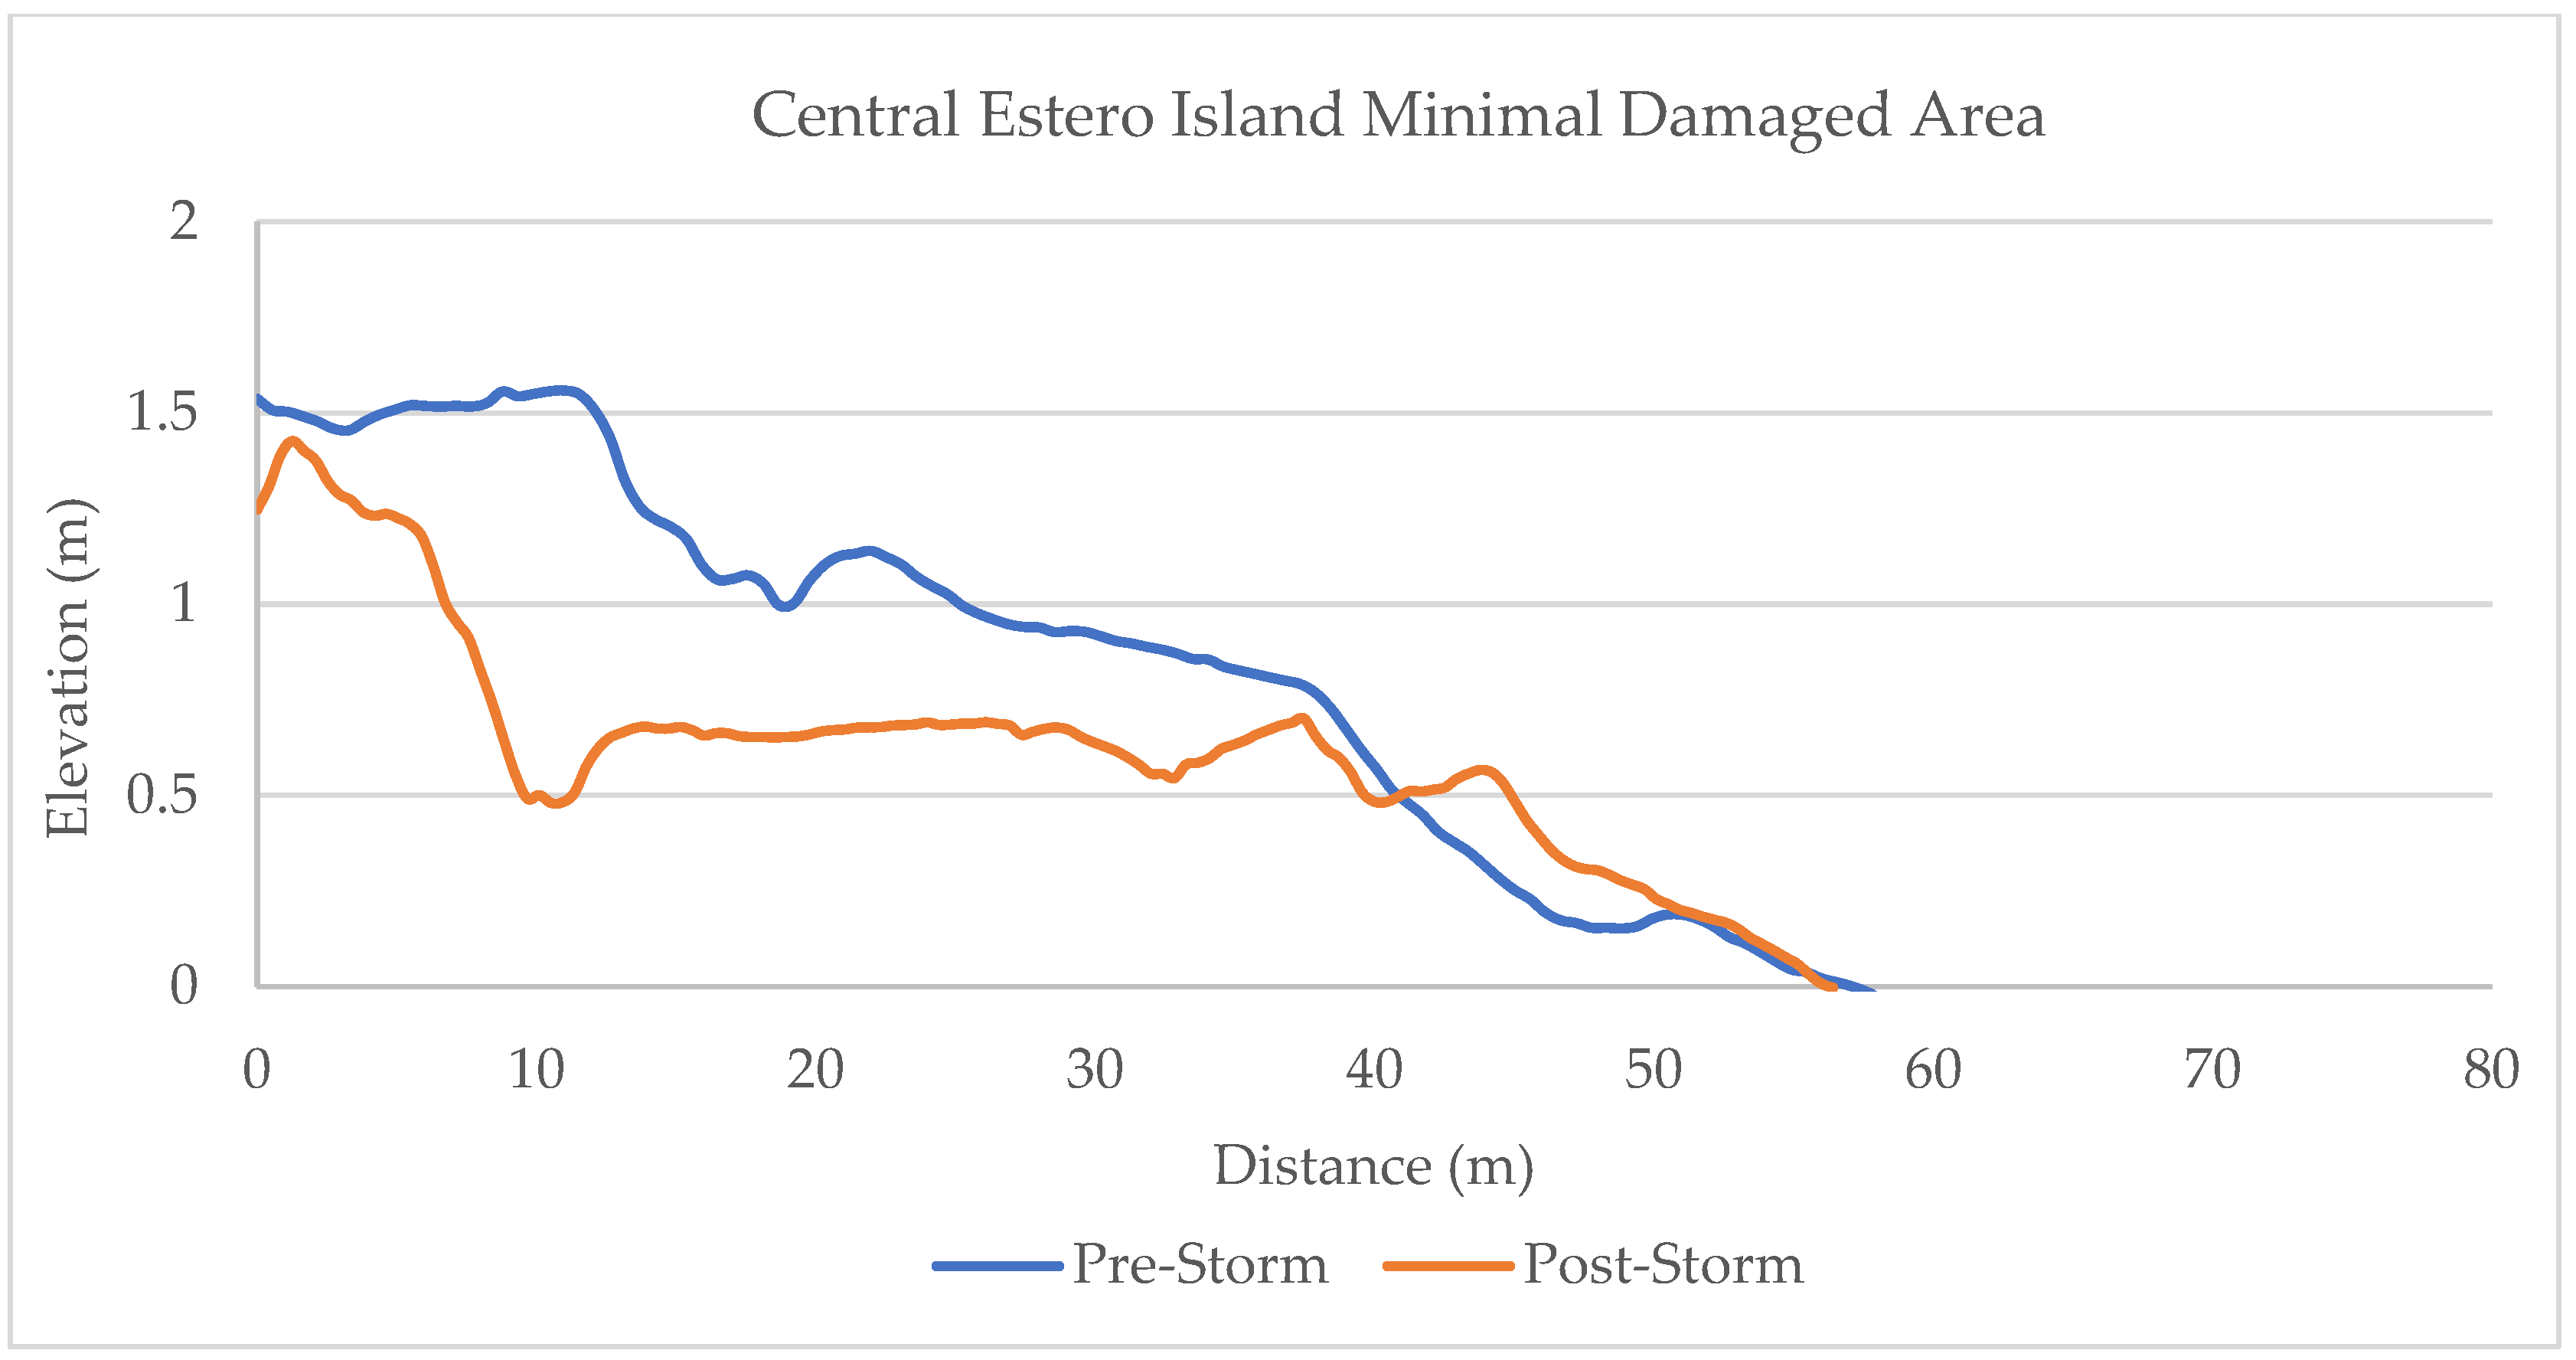
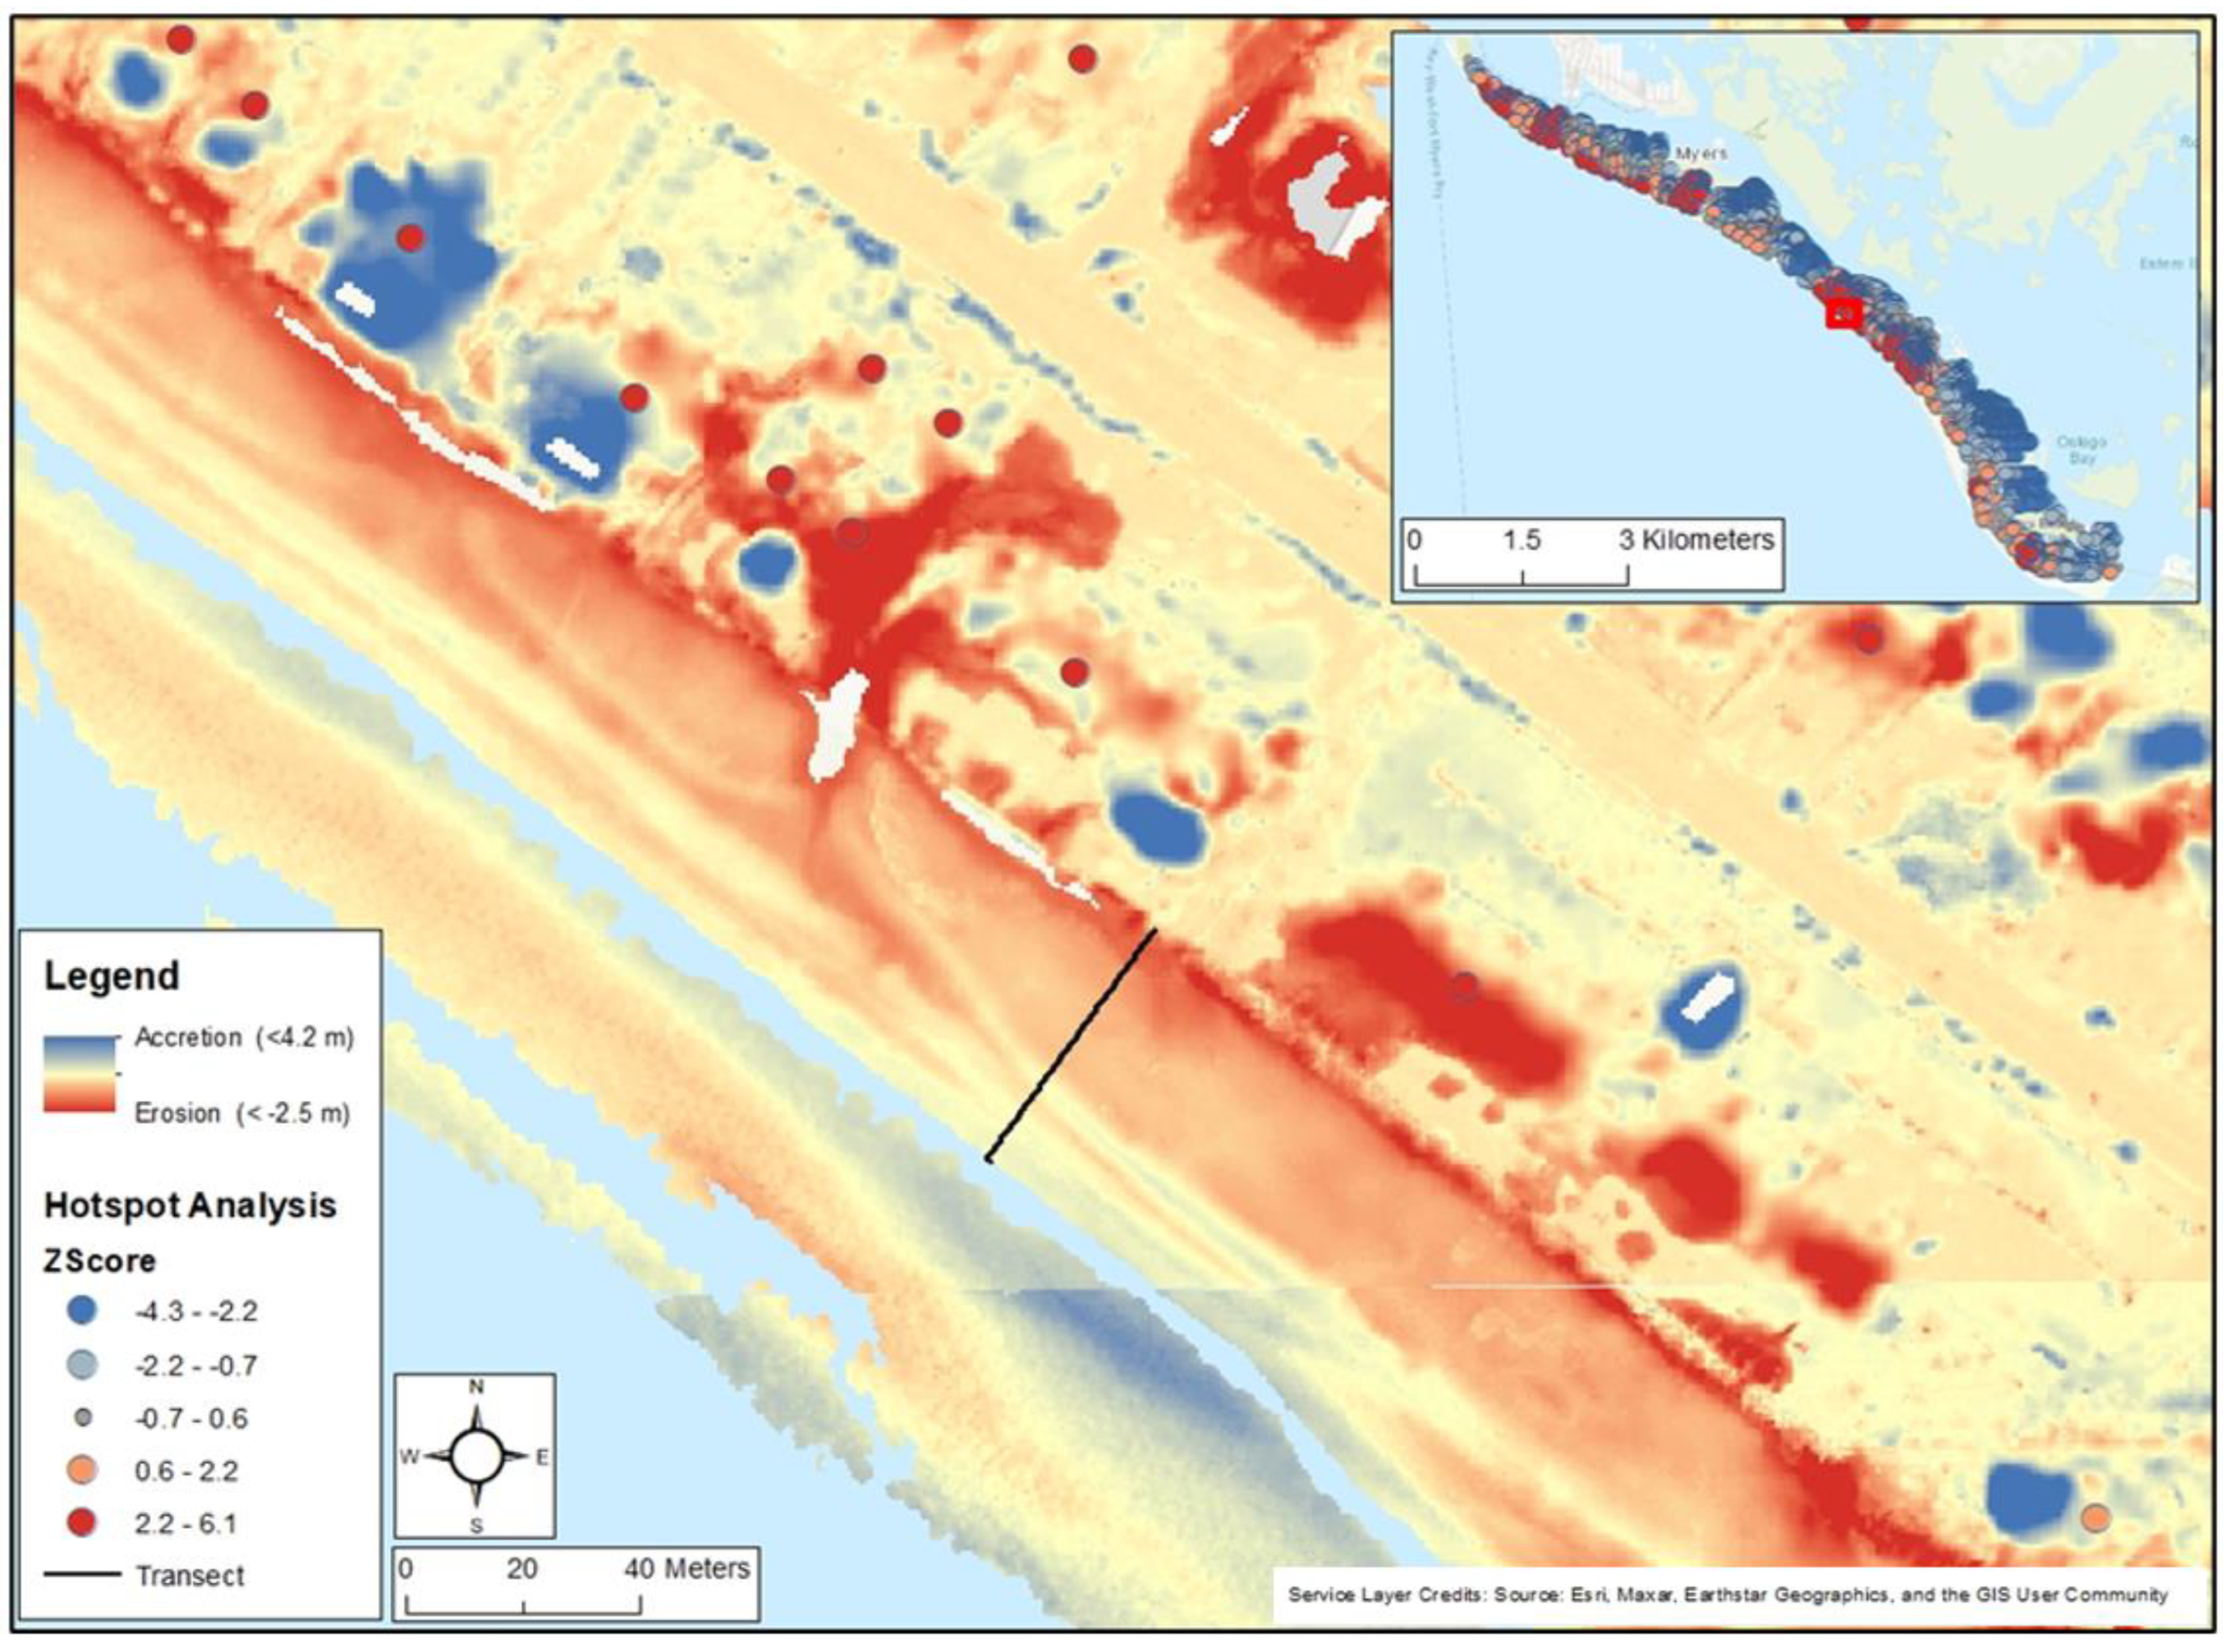
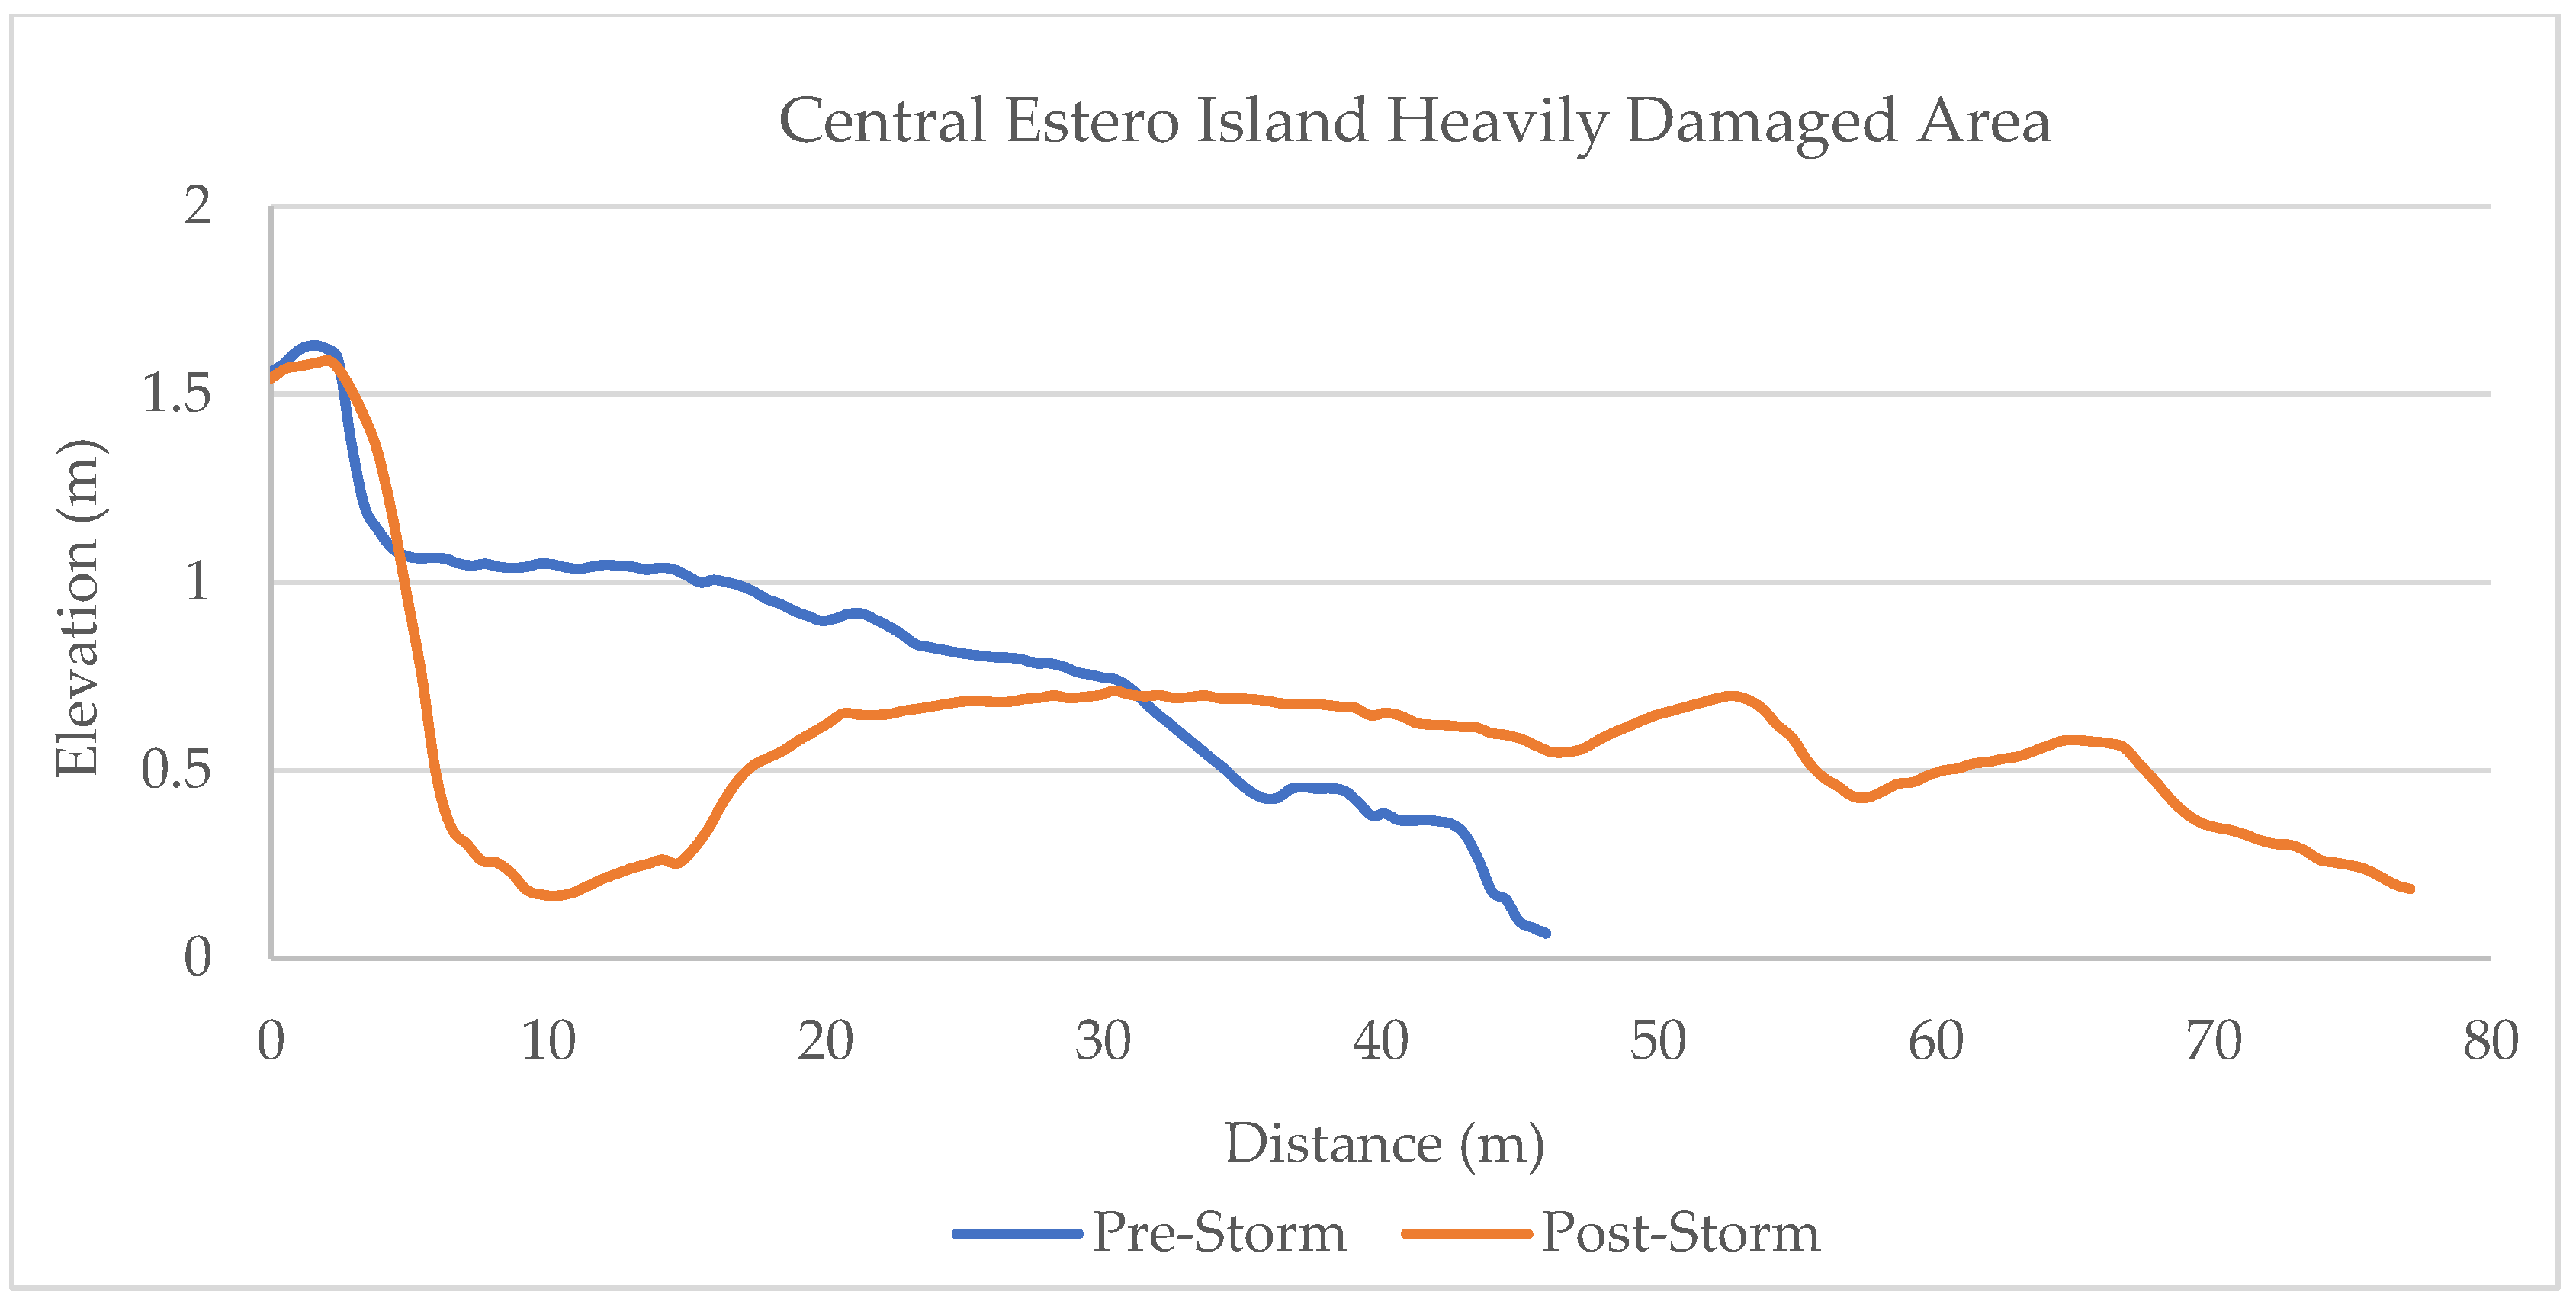
3.3. Beach Morphology Assessment
4. Discussion
5. Conclusions
Author Contributions
Funding
Institutional Review Board Statement
Informed Consent Statement
Data Availability Statement
Conflicts of Interest
References
- NOAA. Monthly National Climate Report for September. Available online: https://www.ncei.noaa.gov/access/monitoring/monthly-report/national/202209#:~:text=The%20contiguous%20U.S.%20average%20maximum,parts%20of%20the%20East%20Coast (accessed on 15 December 2023).
- USGS. Hurricane Ian’s Scientific Silver Lining. Coastal and Marine Hazards and Resources Program. 2023. Available online: https://www.usgs.gov/programs/cmhrp/news/hurricane-ians-scientific-silver-lining#:~:text=%E2%80%9CWhile%20Hurricane%20Ian%20was%20undoubtedly,better%20prepared%20for%20future%20disasters.%E2%80%9D (accessed on 15 September 2023).
- Lee County. Ian Progress Report. Available online: https://ianprogress.leegov.com/ (accessed on 15 September 2023).
- Ball, M.M.; Shinn, E.A.; Stockman, K.W. The geological effect of hurricane Danna in Southern Florida. J. Geol. 1967, 75, 583–597. [Google Scholar] [CrossRef]
- Zhou, Z.; Gong, J.; Guo, M. Image-Based 3D Reconstruction for Post-hurricane Residential Building Damage Assessment. J. Comput. Civ. Eng. 2016, 30, 04015015. [Google Scholar] [CrossRef]
- Martin, T.; Muller, J. The geologic record of Hurricane Irma in a Southwest Florida back-barrier lagoon. Mar. Geol. 2021, 441, 106635. [Google Scholar] [CrossRef]
- Davis, J.; Mitsova, D.; Briggs, T.C.; Briggs, T.R. Post-hurricane Michael damage assessment using ADCIRC storm surge hindcast, image classification, and LiDAR. Shore Beach 2019, 87, 3–14. [Google Scholar] [CrossRef] [PubMed]
- Wang, W.; Qu, J.J.; Hao, X.; Liu, Y.; Stanturf, J.A. Post-hurricane forest damage assessment using satellite remote sensing. Agric. For. Meteorol. 2010, 150, 122–132. [Google Scholar] [CrossRef]
- Karaer, A.; Chen, M.; Gazzea, M.; Ghorbanzadeh, M.; Abichou, T.; Arghandeh, R.; Ozguven, E.E. Remote sensing-based comparative damage assessment of historical storms and hurricanes in Northwestern Florida. Int. J. Disaster Risk Reduct. 2022, 72, 102857. [Google Scholar] [CrossRef]
- Elberink, S.O.; Shoko, M.; Fathi, S.A.; Rutzinger, M. Detection of collapsed buildings by classifying segmented airborne laser scanner data. Int. Arch. Photogramm. Remote Sens. Spat. Inf. Sci. 2011, 38, 307–312. [Google Scholar] [CrossRef]
- Berezina, P.; Liu, D. Hurricane damage assessment using coupled convolutional neural networks: A case study of hurricane Michael. Geomat. Nat. Hazards Risk 2022, 13, 414–431. [Google Scholar] [CrossRef]
- Bhatt, D.; Savarese, M.; Hewitt, N.S.; Gross, A.M.; Wilder, J. Revealing the geomorphological impacts of Hurricane Ian in Southwest Florida using Geospatial Technology. Int. Arch. Photogramm. Remote Sens. Spat. Inf. Sci. 2023, 48, 43–48. [Google Scholar] [CrossRef]
- Roberston, W.V.; Zhang, K.; Whitman, D. Hurricane-induced beach change derived from airborne laser measurements near Panama City, Florida. Mar. Geol. 2007, 237, 191–205. [Google Scholar]
- Gong, J.; Maher, A. Use of mobile lidar data to assess hurricane damage and visualize community vulnerability. J. Transp. Res. Board 2014, 2459, 119–126. [Google Scholar] [CrossRef]
- Zhou, Z.; Gong, J.; Hu, X. Community-scale multi-level post-hurricane damage assessment of residential buildings using multi-temporal airborne LiDAR data. Autom. Constr. 2019, 98, 30–45. [Google Scholar] [CrossRef]
- Battersby, S.E.; Hodgson, M.E.; Wang, J.Y. Spatial resolution imagery requirements for identifying structure damage in a hurricane disaster: A cognitive approach. Photogramm. Eng. Remote Sens. 2012, 78, 625–635. [Google Scholar] [CrossRef]
- Xian, S.; Feng, K.; Lin, N.; Marsooli, R.; Chavas, D.; Chen, J.; Hatzikyriakou, A. Brief communication: Rapid assessment of damaged residential buildings in the Florida Keys after Hurricane Irma. Nat. Hazards Earth Syst. Sci. 2018, 18, 2041–2045. [Google Scholar] [CrossRef]
- Luettich, R.; Westerink, J. Formulation and Numerical Implementation of the 2D/3D ADCIRC Finite Element Model Version 44.XX; ADCIRC: Chapel Hill, NC, USA, 2004; pp. 1–74. [Google Scholar]
- Mousavi, M.E.; Irish, J.L.; Frey, A.E.; Olivera, F.; Edge, B.L. Global warming and hurricanes: The potential impact of hurricane intensification and sea level rise on coastal flooding. Clim. Chang. 2011, 104, 575–597. [Google Scholar] [CrossRef]
- Hetteren, V. Barrier Systems. In Coastal Environments & Global Change; Masselink, G., Gehrels, R., Eds.; Wiley & American Geophysical Union: New York, NY, USA, 2014; pp. 194–226. [Google Scholar]
- Woodruff, J.D.; Irish, J.L.; Camargo, S.J. Coastal flooding by tropical cyclones and sea-level rise. Nature 2013, 504, 44–52. [Google Scholar] [CrossRef] [PubMed]
- Nagarajan, S.; Khamaru, S.; De Witt, P. UAS based 3D shoreline change detection of Jupiter Inlet Lighthouse ONA after Hurricane Irma. Int. J. Remote Sens. 2019, 40, 9140–9158. [Google Scholar] [CrossRef]
- Dean, R.G.; Malakar, S.B. Projected Flood Hazard Zones in Florida. J. Coast. Res. 1999, 28, 85–94. [Google Scholar]
- Wohlpart, S.L.; Savarese, M.; Surge, D. The Development of Estuarine Systems in Southwest Florida: A Perspective from the Late Holocene History of Oyster Reef Development. In Proceedings of the Geological Society of America Annual Meeting Exposition, Denver, CO, USA, 29 October 2007. [Google Scholar]
- Sambrook Smith, G.H.; Best, J.L.; Ashworth, P.J.; Fielding, C.R.; Goodbred, S.L.; Prokocki, E.W. Fluvial form in modern continental sedimentary basins: Distributive fluvial systems: Comment. Geology 2010, 38, 230–231. [Google Scholar] [CrossRef]
- Brutsché, K.E. First Year Sedimentological Characteristics and Morphological Evolution of an Artificial Berm at Fort Myers Beach, Florida. Master’s Thesis, University of South Florida, Tampa, FL, USA, 2011. [Google Scholar]
- NOAA, National Data Buoy Center. Available online: https://www.ndbc.noaa.gov/station_page.php?station=bgcf1 (accessed on 23 August 2023).
- Coastal Engineering Consultants Inc. Estero Island Restoration, 2020 Annual Monitoring Report; Lee County Board of County Commissioners: Fort Myers, FL, USA, 2020; CEC File No. 20.079. [Google Scholar]
- Houston, J. The value of beach nourishment on a complex shoreline. Shore Beach 2022, 90, 3–15. [Google Scholar] [CrossRef]
- U.S. Census Bureau: American Community Survey 5-Year Estimates. Available online: https://www.census.gov/data/developers/data-sets/acs-5year.html (accessed on 10 December 2023).
- Bucci, L.; Alaka, L.; Hagen, A.; Delgado, S.; Beven, J. National Hurricane Center Tropical Cyclone Report. Hurricane Ian (AL092022); National Hurricane Center: Miami, FL, USA, 2022; pp. 1–72.
- Lee County Parks & Beaches: Ian Progress Report. Available online: https://ianprogress.leegov.com/pages/parks-beaches (accessed on 23 August 2023).
- National Geodetic Survey, 2022: NOAA NGS Emergency Response Imagery: Hurricane Ian, 23 September 2022 to 30 September 2022. NOAA National Centers for Environmental Information. Available online: https://storms.ngs.noaa.gov/storms/ian/index.html#9/26.42/-81.97 (accessed on 14 December 2022).
- Sylvester, C.; Wozencraft, J.; Robertson, Q.; Dong, Z.; Dunkin, L. JALBTCX rapid-response aerial survey reconnaissance missions. Shore Beach 2023, 91, 39–45. [Google Scholar] [CrossRef]
- ARCGIS Pro: Performing the Classification. Available online: https://pro.arcgis.com/en/pro-app/latest/tool-reference/spatial-analyst/performing-the-classification.htm (accessed on 10 January 2023).
- FEMA. 2021 Preliminary Damage Assessment Guide; FEMA: Hyattsville, MD, USA, 2020; pp. 1–127.
- Lee County Property Appraiser. Available online: https://www.leepa.org/FAQ/FAQForm.aspx#MarketValue (accessed on 12 April 2024).
- International Code Council (ICC). 2020 Florida Building Code. In ICC Digital Codes, 7th ed.; International Code Council (ICC): Washington, DC, USA, 2020. [Google Scholar]
- Ylipelkonen, R. Building Risk Categories. Available online: https://www.floridaroof.com/building-risk-categories (accessed on 10 December 2023).
- Sallenger, A.H. Storm Impact Scale for Barrier Islands. J. Coast. Res. 2000, 16, 890–895. [Google Scholar]
- Wang, P.; Roberts Briggs, T.M. Storm-Induced Morphology Changes along Barrier Islands and Post-storm Recovery. In Coastal and Marine Hazards, Risks, and Disasters; Ellis, J.T., Sherman, D.J., Eds.; Elsevier Inc.: Amsterdam, The Netherlands, 2015; pp. 271–306. [Google Scholar]
- Orescanin, M.; Raubenheimer, B.; Elgar, S. Observations of wave effects on inlet circulation. Cont. Shelf Res. 2014, 82, 37–42. [Google Scholar] [CrossRef]
- Sherman, D.J.; Hales, B.U.; Potts, M.K.; Ellis, J.T.; Liu, H.; Houser, C. Impacts of Hurricane Ike on the beaches of the Bolivar Peninsula, TX, USA. Geomorphology 2013, 199, 62–81. [Google Scholar] [CrossRef]
- Robertson, I.N.; Riggs, H.R.; Solomon, Y.; Young, Y.L. Lessons from Hurricane Katrina Storm Surge on Bridges and Buildings. J. Waterw. Port Coast. Ocean. Eng. 2007, 133, 463–483. [Google Scholar] [CrossRef]

| Value | Damage State | Example |
|---|---|---|
| 0 | Not Affected | Roof intact, no damage to landscape or attached structures |
| 1 | Affected | Roof intact with slight damage (0–30%), damage to landscape, property habitable |
| 2 | Major | Major repairs to roof over essential living space (30–50%), property habitable |
| 3 | Severe | Failure or partial failure of roof or structure, major damage to infrastructure (50–100%), property not habitable |
| 4 | Destroyed | Destruction (100%), only foundation remains, foundation completely shifted, property not habitable |
| Use Description | Total Number of Structures | Not Affected | Affected | Major | Severe | Destroyed | Cumulative Just Value of Major-Destroyed Structures |
|---|---|---|---|---|---|---|---|
| Churches | 11 | 0 | 2 | 6 | 3 | 0 | 31,711,838 |
| Commercial | 5 | 0 | 4 | 0 | 1 | 0 | |
| Commercial—Vacant | 3 | 0 | 1 | 2 | 0 | 0 | |
| Condominiums | 79 | 0 | 59 | 15 | 5 | 0 | 22,167,099 |
| Condominium—High Rise (>8 Floors) | 38 | 0 | 24 | 13 | 1 | 0 | |
| Condominium—Mid Rise (4–7 Floors) | 73 | 0 | 44 | 24 | 5 | 0 | |
| Condominium—Low Rise (<3 Floors) | 48 | 0 | 17 | 26 | 5 | 0 | |
| Co-Operative (Mobile Home/Manufractured Home) | 13 | 0 | 4 | 1 | 7 | 1 | 690,389 |
| County Owned—Offices, Library, Government Buildings | 6 | 0 | 3 | 3 | 0 | 0 | |
| Financial Institutions | 3 | 0 | 1 | 1 | 1 | 0 | 2,775,650 |
| Government Owned—Park/Recreation Area | 2 | 0 | 1 | 0 | 1 | 0 | 17,069,367 |
| Marinas | 7 | 0 | 6 | 0 | 1 | 0 | 7,912,253 |
| Medical Office Buildings | 1 | 0 | 0 | 1 | 0 | 0 | |
| Motels | 15 | 0 | 4 | 9 | 1 | 1 | 31,723,058 |
| Multi-Family (>10 Units) | 1 | 0 | 0 | 1 | 0 | 0 | |
| Multi-Family (<10 Units) | 333 | 0 | 197 | 112 | 21 | 3 | 13,786,451 |
| Municipally Owned—Offices, Library, Government Buildings | 2 | 0 | 1 | 1 | 0 | 0 | |
| Office Buildings—Multi-story | 2 | 0 | 1 | 0 | 1 | 0 | 2,013,485 |
| Office Buildings—One-story | 7 | 0 | 4 | 0 | 3 | 0 | 2,998,838 |
| Recreational Areas | 4 | 0 | 3 | 0 | 1 | 0 | |
| Restaurants | 8 | 0 | 1 | 5 | 0 | 2 | 6,997,605 |
| Schools | 1 | 0 | 0 | 1 | 0 | 0 | |
| Shopping Centers | 7 | 0 | 1 | 5 | 1 | 0 | 656,849 |
| Single Family Residential | 1719 | 0 | 1125 | 495 | 95 | 4 | 75,530,843 |
| Store, Office, Residential Combination | 6 | 0 | 2 | 3 | 1 | 0 | 332,176 |
| Stores (1 Floor) | 14 | 1 | 5 | 5 | 3 | 0 | 1,164,892 |
| Theatres | 1 | 0 | 1 | 0 | 0 | 0 | |
| Utilities | 2 | 0 | 2 | 0 | 0 | 0 | |
| Residential—Vacant | 15 | 0 | 9 | 5 | 1 | 0 | 576,553 |
| Industrial | 1 | 0 | 1 | 0 | 0 | 0 | |
| TOTAL | 2427 | 1 | 1523 | 734 | 158 | 11 | 218,107,346 |
Disclaimer/Publisher’s Note: The statements, opinions and data contained in all publications are solely those of the individual author(s) and contributor(s) and not of MDPI and/or the editor(s). MDPI and/or the editor(s) disclaim responsibility for any injury to people or property resulting from any ideas, methods, instructions or products referred to in the content. |
© 2024 by the authors. Licensee MDPI, Basel, Switzerland. This article is an open access article distributed under the terms and conditions of the Creative Commons Attribution (CC BY) license (https://creativecommons.org/licenses/by/4.0/).
Share and Cite
Hauptman, L.; Mitsova, D.; Briggs, T.R. Hurricane Ian Damage Assessment Using Aerial Imagery and LiDAR: A Case Study of Estero Island, Florida. J. Mar. Sci. Eng. 2024, 12, 668. https://doi.org/10.3390/jmse12040668
Hauptman L, Mitsova D, Briggs TR. Hurricane Ian Damage Assessment Using Aerial Imagery and LiDAR: A Case Study of Estero Island, Florida. Journal of Marine Science and Engineering. 2024; 12(4):668. https://doi.org/10.3390/jmse12040668
Chicago/Turabian StyleHauptman, Leanne, Diana Mitsova, and Tiffany Roberts Briggs. 2024. "Hurricane Ian Damage Assessment Using Aerial Imagery and LiDAR: A Case Study of Estero Island, Florida" Journal of Marine Science and Engineering 12, no. 4: 668. https://doi.org/10.3390/jmse12040668
APA StyleHauptman, L., Mitsova, D., & Briggs, T. R. (2024). Hurricane Ian Damage Assessment Using Aerial Imagery and LiDAR: A Case Study of Estero Island, Florida. Journal of Marine Science and Engineering, 12(4), 668. https://doi.org/10.3390/jmse12040668